Review Article Prevalence of Cardiovascular Disease...
24
Review Article Prevalence of Cardiovascular Disease and Associated Risk Factors among Adult Population in the Gulf Region: A Systematic Review Najlaa Aljefree and Faruk Ahmed Public Health, School of Medicine and Griffith Health Institute, Griffith University, Gold Coast Campus, QLD 4222, Australia Correspondence should be addressed to Najlaa Aljefree; najlaa.aljefree@griffithuni.edu.au Received 30 June 2014; Accepted 23 December 2014 Academic Editor: John Godleski Copyright © 2015 N. Aljefree and F. Ahmed. is is an open access article distributed under the Creative Commons Attribution License, which permits unrestricted use, distribution, and reproduction in any medium, provided the original work is properly cited. Background. CVD is a principal cause of mortality and disability globally. Objective. To analyse the epidemiological data on CHD, strokes, and the associated risk factors among adult population in the Gulf countries. Methods. A systematic review of published articles between 1990 and 2014 was conducted. Results. e analysis included 62 relevant studies. e prevalence of CHD was reported to be 5.5% in Saudi Arabia. e annual incidence of strokes ranged from 27.6 to 57 per 100 000 in the Gulf countries with ischaemic stroke being the most common subtype and hypertension and diabetes being the most common risk factors among stroke and ACS patients. e prevalence of overweight and obesity ranged from 31.2% to 43.3% and 22% to 34.1% in males and from 28% to 34.3% and 26.1% to 44% in females, respectively. In males, the prevalence of hypertension and diabetes ranged from 26.0% to 50.7% and 9.3% to 46.8%, respectively; in females these ranged from 20.9% to 57.2% and 6% to 53.2%, respectively. e prevalence of inactivity was from 24.3% to 93.9% and 56.7% to 98.1% in males and females, respectively. Relatively more males (13.4% to 37.4%) than females (0.5% to 20.7%) were current smokers. Available data indicate poor dietary habits with high consumption of snacks, fatty foods, sugar, and fast food. Conclusion. Effective preventative strategies and education programs are crucial in the Gulf region to reduce the risk of CVD mortality and morbidity in the coming years. 1. Introduction Cardiovascular disease (CVD) is now recognized as the leading cause of death and disability worldwide [1]. e World Health Organization (WHO) estimated that in 2008, out of 17.3 million CVD deaths globally, heart attacks (myo- cardial infarction) and strokes were responsible for 7.3 and 6.2 million deaths, respectively [1]. According to the INTER- HEART and INTERSTROKE studies, hypertension, diabetes, dyslipidaemia, obesity, smoking, physical activity, poor diet, and alcohol consumption are the most common risk factors for myocardial infarction (heart attack) and strokes world- wide [2, 3]. e Gulf Cooperation Council (GCC) is cooperation between Saudi Arabia, Bahrain, Oman, Qatar, the United Arab Emirates, and Kuwait. In 1981, the GCC was created to encourage investment and to adopt free trade between member states. is agreement also contributed to several fields including: education, culture, tourism, social opportu- nities, and health among the GCC members. e discovery of oil and other natural resources such as gas in the GCC countries including Saudi Arabia led to rapid development and economic growth [4]. Along with the rapid socioe- conomic growth in the Gulf countries, there has been a change in lifestyle such as an increased consumption of poor quality foods and the adoption of a sedentary lifestyle [5], and as a consequence the rates of CVD and associated risk factors among the Gulf population have also increased; the rates sometimes exceed that of developed countries [5]. Furthermore, the number of deaths resulting from ischemic heart disease and hypertensive heart disease in the Middle East and North Africa region (including the GCC countries) was 294/100,000 and 115/100,000 respectively. Also, the num- ber of disability-adjusted life years (DALYs) resulting from Hindawi Publishing Corporation Advances in Public Health Volume 2015, Article ID 235101, 23 pages http://dx.doi.org/10.1155/2015/235101
Transcript of Review Article Prevalence of Cardiovascular Disease...

Review ArticlePrevalence of Cardiovascular Disease andAssociated Risk Factors among Adult Population inthe Gulf Region: A Systematic Review
Najlaa Aljefree and Faruk Ahmed
Public Health, School of Medicine and Griffith Health Institute, Griffith University, Gold Coast Campus, QLD 4222, Australia
Correspondence should be addressed to Najlaa Aljefree; [email protected]
Received 30 June 2014; Accepted 23 December 2014
Academic Editor: John Godleski
Copyright © 2015 N. Aljefree and F. Ahmed. This is an open access article distributed under the Creative Commons AttributionLicense, which permits unrestricted use, distribution, and reproduction in any medium, provided the original work is properlycited.
Background. CVD is a principal cause of mortality and disability globally. Objective. To analyse the epidemiological data on CHD,strokes, and the associated risk factors among adult population in the Gulf countries. Methods. A systematic review of publishedarticles between 1990 and 2014 was conducted. Results. The analysis included 62 relevant studies. The prevalence of CHD wasreported to be 5.5% in Saudi Arabia. The annual incidence of strokes ranged from 27.6 to 57 per 100 000 in the Gulf countries withischaemic stroke being themost common subtype and hypertension and diabetes being themost common risk factors among strokeand ACS patients. The prevalence of overweight and obesity ranged from 31.2% to 43.3% and 22% to 34.1% in males and from 28%to 34.3% and 26.1% to 44% in females, respectively. In males, the prevalence of hypertension and diabetes ranged from 26.0% to50.7% and 9.3% to 46.8%, respectively; in females these ranged from 20.9% to 57.2% and 6% to 53.2%, respectively. The prevalenceof inactivity was from 24.3% to 93.9% and 56.7% to 98.1% inmales and females, respectively. Relatively moremales (13.4% to 37.4%)than females (0.5% to 20.7%) were current smokers. Available data indicate poor dietary habits with high consumption of snacks,fatty foods, sugar, and fast food. Conclusion. Effective preventative strategies and education programs are crucial in the Gulf regionto reduce the risk of CVD mortality and morbidity in the coming years.
1. Introduction
Cardiovascular disease (CVD) is now recognized as theleading cause of death and disability worldwide [1]. TheWorld Health Organization (WHO) estimated that in 2008,out of 17.3 million CVD deaths globally, heart attacks (myo-cardial infarction) and strokes were responsible for 7.3 and6.2 million deaths, respectively [1]. According to the INTER-HEART and INTERSTROKE studies, hypertension, diabetes,dyslipidaemia, obesity, smoking, physical activity, poor diet,and alcohol consumption are the most common risk factorsfor myocardial infarction (heart attack) and strokes world-wide [2, 3].
The Gulf Cooperation Council (GCC) is cooperationbetween Saudi Arabia, Bahrain, Oman, Qatar, the UnitedArab Emirates, and Kuwait. In 1981, the GCC was createdto encourage investment and to adopt free trade between
member states. This agreement also contributed to severalfields including: education, culture, tourism, social opportu-nities, and health among the GCC members. The discoveryof oil and other natural resources such as gas in the GCCcountries including Saudi Arabia led to rapid developmentand economic growth [4]. Along with the rapid socioe-conomic growth in the Gulf countries, there has been achange in lifestyle such as an increased consumption ofpoor quality foods and the adoption of a sedentary lifestyle[5], and as a consequence the rates of CVD and associatedrisk factors among the Gulf population have also increased;the rates sometimes exceed that of developed countries [5].Furthermore, the number of deaths resulting from ischemicheart disease and hypertensive heart disease in the MiddleEast and North Africa region (including the GCC countries)was 294/100,000 and 115/100,000 respectively. Also, the num-ber of disability-adjusted life years (DALYs) resulting from
Hindawi Publishing CorporationAdvances in Public HealthVolume 2015, Article ID 235101, 23 pageshttp://dx.doi.org/10.1155/2015/235101

2 Advances in Public Health
Cardiovascular disease(1) “Cardiovascular disease” OR “epidemiology of cardiovascular disease” OR
“coronary heart disease” OR “epidemiology of coronary heart disease”Strokes
(2) “stroke” OR “epidemiology of stroke” OR “incidence of stroke”Associated risk factors
(3) “Cardiovascular risk factors” OR “coronary heart disease risk factors” OR“stroke risk factors” OR “diabetes mellitus” OR “epidemiology of diabetesmellitus” OR “NIDDM” OR “dyslipidaemia” OR “epidemiology ofdyslipidaemia” OR “hypercholesterolemia” OR “high cholesterol” OR“smoking” OR “tobacco use” OR “epidemiology of smoking” OR“hypertension” OR “high blood pressure” OR “epidemiology ofhypertension” OR “obesity” OR “overweight” OR “BMI” OR “epidemiologyof obesity” OR “physical activity” OR “exercise” OR “epidemiology ofphysical activity” OR “Food consumption patterns” OR “eating habits” OR“dietary patterns” OR “food”
TheGulf region(4) “Gulf region” OR “Arab countries” OR “GCC” OR “Saudi Arabia” OR
“Kuwait” OR “Oman” OR “Bahrain” OR “Qatar” OR “United Arab Emirates”(5) #1 AND #4(6) #2 AND #4(7) #3 AND #4(8) #1 AND #3 AND #4(9) #2 AND #3 AND #4
Box 1: Selected search terms.
ischemic and hypertensive heart disease is 3702/100,000 and1389/100,000, respectively, in the same region [6]. TheWHOestimated the total number of noncommunicable diseasesresulting in death in the GCC states in 2008. CVD wasestimated to account almost half of the deaths in Oman andKuwait, 49% and 46%, respectively. The rate of CVD deathswas also high in Saudi Arabia, the UAE, Bahrain, and Qatar42%, 38%, 32%, and 23%, respectively [7]. Although somesystematic reviews on the prevalence of CVD and/or CVDrisk factors in the Middle East region have been published[8, 9], these reviews were limited to either CVD risk factorsonly [8], or specific gender [9]. To our knowledge, this is thefirst systematic review that provides a comprehensive analysison the prevalence of CHD, strokes, and associated risk factorsin the Arabic Gulf countries. The aim of this paper was toreview the epidemiology of CHD, strokes, and the related riskfactors among the adult population in the GCC.
2. Methods
2.1. Data Sources. An extensive literature search was con-ducted on the prevalence of CHD and incidence of strokesand the burden of associated risk factors to identify articlesor reports published between 1990 and 2014 using Pro-Quest Public Health, MEDLINE, PubMed, Google Scholar,and World Health Organization (WHO) website. A manualsearch of reference lists of original studies was searched. Inaddition, checking the review articles, contacting authors,the official website of the Gulf Heart Association were alsosearched http://www.gulfheart.org/ and the section labelled
“GHA studies” was specifically scanned. The search termsused were shown in Box 1.
2.2. Study Selection. A total of 7800 articles were identified ininitial search.The titles and abstracts of all articles of potentialinterest were reviewed for inclusion and exclusion of studies.The criteria for selected studies aimed to include studies thatindicated the prevalence of CHD and/or stroke and/or atleast one of the associated risk factors: diabetes, hypertension,obesity, dyslipidaemia, dietary habits, smoking, and physicalactivity. All the included studies were required to only includeindividuals over 18. The CHD and stroke studies were notrestricted by sample size due to the limited numbers of thesestudies in the GCC countries. However, all the includedstudies that examined the burden of the risk factors wererestricted with a sample size that exceeded 500 except fordiet studies. All selected studies were required to relate to atleast one of the GCC populations. Only studies published inEnglish and where full manuscripts were included. Studieswere published in abstract form and those on congenitalheart disease or other CVDs were excluded. A total of 190full-text papers were identified and further reviewed. Finally,62 articles including two articles by contacting authorsdirectly were included in this review. Figure 1 summarizes theselection process of the reviewed studies.
2.3. Data Abstraction andQuality Assessment. Data extractedfor each study included first author and publication year,sample size, demographic characteristics, the country ofstudy, place of study, study objectives, year(s) of survey,response rate, study methods, the definition of CHD and/or

Advances in Public Health 3
Potentially relevant titles and abstracts identified
Abstracts primarily excluded forno related data to the subjects
Reasons for exclusion:
The final number of reviewed
n = 7800)
n = 7610)
Contacting authors n = 2
Studies retrieved for full-text evaluation (n = 190)
Studies met the inclusion criteria (n = 60)
studies (n = 62)
∙ Studies among different populations∙ Studies examined different age groups
related risk factors∙ Not reporting the prevalence of CHD or stroke or
∙ Data presented in other articles
from database search (
of the study (
Full-text articles excluded (n = 130)
Figure 1: Study selection process.
stroke and/or associated risk factors, and the prevalence ofCHDand/or stroke and/or associated risk factors.The qualityof selected studies was assessed according to the Centre forReviews and Dissemination guidelines [10]. Since there arefew papers that addressed the study questions, no studieswere excluded for their qualities. The quality assessmentchecklist of the included studies in the systematic review isshown in the far-right column of Tables 1 and 2.
2.4. Data Synthesis. A narrative synthesis was performedto identify the study questions. It included describing allthe included papers, summarising the findings of the dataextracted from each study, and exploring the relationshipsbetween the results of the different studies.
3. Results
Of the 62 articles that are reviewed in the present study, 13were published in the 1990s, another 40 in the 2000s, and 9 inthe last four years. Of the included studies, 4 reported data onCHD, 12 on stroke, and 46 on the prevalence of the associatedrisk factors. Further, of these 62 selected studies, 22 werecarried out among Saudi, 8 in Bahraini, 10 in Kuwaiti, 5 inOmani, 6 in Qatari, and 8 in the UAE populations, and 3 werecarried out in multiple GCC countries. Regarding the studydesign; 48 studies were cross-sectional, 7 were retrospective,and 7 were prospective observational studies. Seven studieslooked at employees, 4 at university and college students,
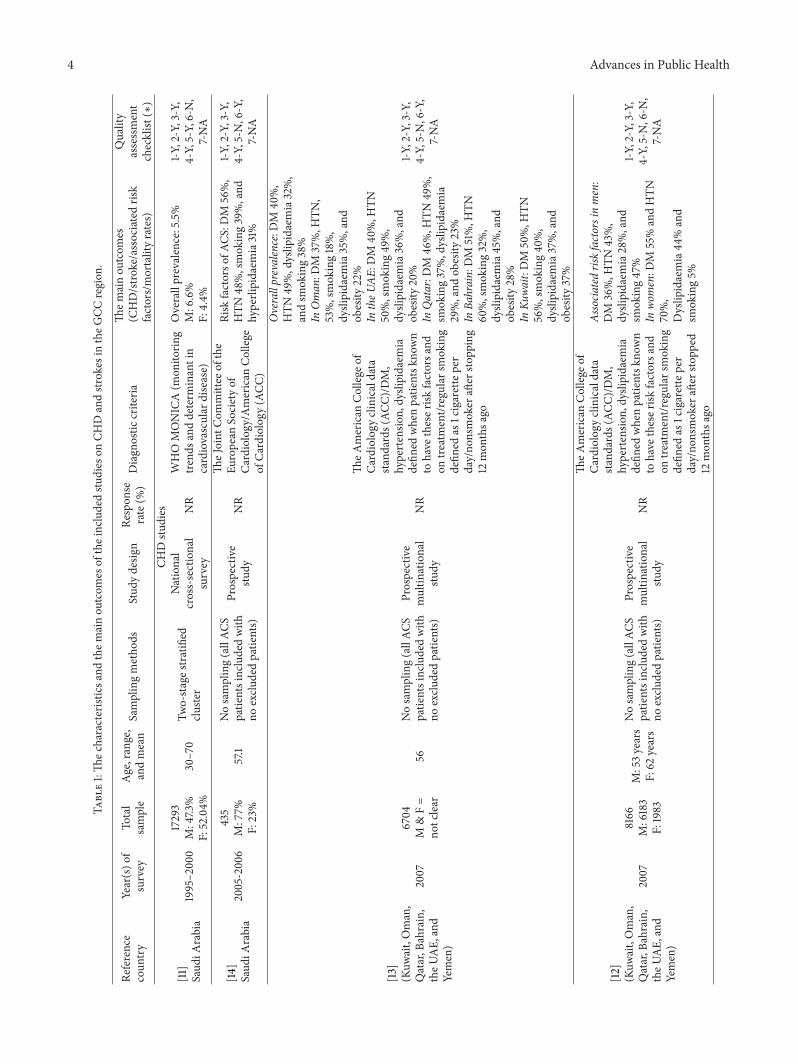
8 at primary health care attendants, 14 at CHD and strokepatients, and 29 at the general population.The sample size inCHD and stroke studies ranged from 62 to 23,227 and in theburden of risk factors studies it ranged from 227 to 195,874.Response rates ranged from 59% to 99.8%. The summary ofthe included articles on CHD and strokes is shown in Table 1,whereas the summary of included articles on the burden ofassociated risk factors is shown in Table 2.
3.1. CHD and Strokes in the GCC Region. Overall, there isa lack of information on CHD and strokes in Arabic Gulfcountries.Theonly nationally representative study conductedin Saudi Arabia reported the crude prevalence of CHD of5.5% among the Saudi population [11]. This survey reporteda higher prevalence of CHD in males (6.6%) compared tofemales (4.4%) and in urban Saudis (6.2%) than rural Saudis(4.0%). Further, the prevalence of CHD increased with agefrom 3.9% in 30–39-year olds to 9.3% in the 60–70-year olds[11].
The Gulf Registry of Acute Coronary Events (GulfRACE), a project of Gulf Heart Association aimed to describethe characteristics, in-hospital outcomes, and associated riskfactors of the acute coronary syndrome patients (ACS) andrecruited patients from64 hospitals in Bahrain, Oman,Qatar,Kuwait, the UAE, and Yemen [12, 13]. The Gulf RACE studyreported ACS was more prevalent in male (74%) than female(24%) patients [12]. It also reported a high prevalence ofdiabetes (40%), hypertension (49%), dyslipidaemia (32%),smoking (38%), and obesity (27%) among ACS patients inthe five Gulf countries [13]. The highest rates of the riskfactors were in Bahrain and Kuwait, except for smoking,which has the highest rates in the UAE and Kuwait [13]. Theprevalence of CVD risk factors was higher in females thanmales, including diabetes (55% versus 36%), hypertension(70% versus 43%), and dyslipidaemia (44% versus 28%),respectively [12]. Significantlymoremales (47%) than females(5%) were current smokers [13].
Similarly, the Saudi Project for Assessment of CoronaryEvents (SPACE) registry reported the characteristics andprevalence of risk factors among ACS patients in SaudiArabia [14]. The SPACE registry reported that ACS was morefrequent in males (77%) than females (23%) [14]. Ischemicheart disease was present in 32% of the study population.The study also reported diabetes to be the most common riskfactor for CHD (56%) followed by hypertension (48%), beinga current smoker (39%), and hyperlipidaemia (31%) [14].
The available data on strokes and the associated riskfactors in the GCC were derived mostly from retrospectivehospital-based studies but no population-based studies. Thedata on strokes and associated risk factors was reported in12 studies: 4 in Saudi Arabia [15–18], 1 in Bahrain [19], 3 inKuwait [20–22], 3 in Qatar [23–25], and 1 frommultiple GCCcountries [26].
Five studies reported the incidence of stroke in SaudiArabia, Kuwait, Qatar and Bahrain [15, 17, 19, 20, 25]. Theincidence of stroke ranged from 27.6 per 100 000 in Kuwaitto 57 per 100 000 in Bahrain [15, 17, 19, 20, 25]. Further,the most common type of stroke in the region was ischemic
4 Advances in Public Health
Table1:Th
echaracteristicsa
ndthem
ainou
tcom
esof
theincludedstu
dies
onCH
Dandstr
okes
intheG
CCregion
.
Reference
coun
try
Year(s)o
fsurvey
Total
sample
Age,range,
andmean
Samplingmetho
dsStud
ydesig
nRe
spon
serate(%
)Diagn
ostic
criteria
Them
ainou
tcom
es(C
HD/stro
ke/associatedris
kfactors/mortalityrates)
Quality
assessment
checklist
(∗)
CHDstu
dies
[11]
Saud
iArabia
1995–200
017293
M:47.3
%F:52.04%
30–70
Two-stages
tratified
cluste
r
National
cross-sectional
survey
NR
WHOMONICA(m
onito
ring
trend
sand
determ
inantin
cardiovascular
disease)
Overallprevalence:5.5%
M:6.6%
F:4.4%
1-Y,2-Y,3-Y,
4-Y,5-Y,6-N,
7-NA
[14]
Saud
iArabia
2005-2006
435
M:77%
F:23%
57.1
Nosampling(allAC
Spatie
ntsincludedwith
noexclu
dedpatie
nts)
Prospective
study
NR
TheJoint
Com
mittee
ofthe
European
Societyof
Cardiology/A
merican
College
ofCa
rdiology
(ACC
)
Risk
factorso
fACS
:DM
56%,
HTN
48%,smok
ing39%,and
hyperlipidaem
ia31%
1-Y,2-Y,3-Y,
4-Y,5-N,6-Y,
7-NA
[13]
(Kuw
ait,Oman,
Qatar,B
ahrain,
theU
AE,
and
Yemen)
2007
6704
M&F=
notclear
56Nosampling(allAC
Spatie
ntsincludedwith
noexclu
dedpatie
nts)
Prospective
multin
ational
study
NR
TheA
merican
College
ofCa
rdiology
clinicald
ata
standards(AC
C)/D
M,
hypertensio
n,dyslipidaem
iadefin
edwhenpatie
ntsk
nown
tohave
theser
iskfactorsa
ndon
treatment/regular
smok
ing
defin
edas
1cigaretteper
day/no
nsmoker
after
stopp
ing
12mon
thsa
go
Overallprevalence:D
M40
%,
HTN
49%,dyslip
idaemia32%,
andsm
oking38%
InOman
:DM
37%,H
TN,
53%,smok
ing18%,
dyslipidaem
ia35%,and
obesity
22%
IntheU
AE:D
M40
%,H
TN50%,smok
ing49%,
dyslipidaem
ia36%,and
obesity
20%
InQatar:D
M46
%,H
TN49%,
smok
ing37%,dyslip
idaemia
29%,and
obesity
23%
InBa
hrain:DM
51%,H
TN60%,smok
ing32%,
dyslipidaem
ia45%,and
obesity
28%
InKu
wait:
DM
50%,H
TN56%,smok
ing40
%,
dyslipidaem
ia37%,and
obesity
37%
1-Y,2-Y,3-Y,
4-Y,5-N,6-Y,
7-NA
[12]
(Kuw
ait,Oman,
Qatar,B
ahrain,
theU
AE,
and
Yemen)
2007
8166
M:6183
F:1983
M:53years
F:62
years
Nosampling(allAC
Spatie
ntsincludedwith
noexclu
dedpatie
nts)
Prospective
multin
ational
study
NR
TheA
merican
College
ofCa
rdiology
clinicald
ata
standards(AC
C)/D
M,
hypertensio
n,dyslipidaem
iadefin
edwhenpatie
ntsk
nown
tohave
theser
iskfactorsa
ndon
treatment/regular
smok
ing
defin
edas
1cigaretteper
day/no
nsmoker
after
stopp
ed12
mon
thsa
go
Associa
tedriskfactorsinmen:
DM
36%,H
TN43%,
dyslipidaem
ia28%,and
smok
ing47%
Inwo
men:D
M55%andHTN
70%,
Dyslip
idaemia44
%and
smok
ing5%
1-Y,2-Y,3-Y,
4-Y,5-N,6-N
,7-NA

Advances in Public Health 5
Table1:Con
tinued.
Reference
coun
try
Year(s)o
fsurvey
Total
sample
Age,range,
andmean
Samplingmetho
dsStud
ydesig
nRe
spon
serate(%
)Diagn
ostic
criteria
Them
ainou
tcom
es(C
HD/stro
ke/associatedris
kfactors/mortalityrates)
Quality
assessment
checklist
(∗)
Strokesstudies
[15]
Saud
iArabia
1982–1992
500
M:342
F:158
M:65.2
years
F:62.2years
Non
rand
omsampling
(500
medicalrecords
ofstr
okep
atients)
Retro
spectiv
estu
dyNR
NA
Incid
ence
ofstroke:
43.8per100,000
30-day
mortality:12%
Stroke
types:isc
hemicstrokes
(76.2%
)Risk
factors:HTN
56%,D
M42%,and
smoking6%
1-Y,2-Y,3-Y,
4-Not
well
describ
ed,5-N
,6-N,7-N
A
[20]
Kuwait
1989,1992
and1993
Not
clear
60.6years
Non
rand
om(all
patie
ntsw
ithfirst-
ever
stroke,
patie
ntsw
ithprevious
stroke
weree
xcluded)
Prospective
study
NR
WHOdefin
ition
for
diagno
singstr
oke/HCdefin
edas
morethan
5.78
mmol/L/smokingas
any
currentu
seof
cigarette
/hypertensionand
DM
weren
otcle
ar
Annu
alincid
ence:27.6
per
100,00
0Th
eage-adjustedannu
alcrud
eincid
ence:145.6per100,000
30-day
mortality:10%
Stroke
types:Carotid-te
rrito
rylargeinfarction(46.5%
),Risk
factors:
HTN
53%/D
M42%/H
C61%/smok
ing23%
1-Y,2-Y,3-Y,
4-Y,5-Y,6-N,
7-NA
[22]
Kuwait
2008
151
M:96
F:55
60.5years
Non
rand
om(all
ischemicstroke
patie
nts,therew
asan
inclu
sioncriterio
n)
Retro
spectiv
estu
dyNR
Stroke
defin
edaccordingto
WHO/stro
kesubtypes
was
defin
edaccordingto
theT
rial
ofOrg
10172in
AcuteS
troke
Treatm
ent(TO
AST
)criteria
Stroke
types:Ischem
icstroke
(90.1%
)Risk
factors:
DM
56.3%/dyslip
idaemia
57%/H
TN68.9%/smok
ing
40%
1-Y,2-Y,3-Y,
4-N,5-N
,6-Y,
7-NA
[21]
Kuwait
1995–1999
62M:30
F:32
64.1years
Norand
om(all
ischemicstroke
patie
ntsincluded)
Retro
spectiv
estu
dyNR
Stroke
defin
edaccordingto
WHOcriteria
Risk
factors:
HTN
72.5%/D
M69.4%,
dyslipidaem
ia30.6%/smok
ing
1.6%
30-day
mortality:12.9%
1-Y,2-Y,3-Y,
4-Y,5-N,6-N
,7-NA
[23]
Qatar
2005–2008
116M:85%
F:15%
53years
Non
rand
om(all
patie
ntsd
iagn
osed
with
PCSstr
oke,there
was
aninclu
sion
criterio
n)
Prospective
study
NR
Stroke
defin
edaccordingto
Kidw
elland
Warach/DM
asfastingbloo
dglucose
>140m
g/dL
orin
medication/hypertensio
nas
>140/90
mmHgor
onmedication/dyslipidaem
iaas
TC>5m
mol/L/smokersa
scurrently
smokerso
rduring
thelast12mon
ths/ob
esity
asBM
I≥30
Risk
factors:
HTN
61%,D
M44
%,obesity
66%,smok
ing20%,and
dyslipidaem
ia12%
30-day
mortalityr
ate:10%
1-Y,2-Y,3-Y,
4-Y,5-Y,
6-Partly,
7-NA

6 Advances in Public Health
Table1:Con
tinued.
Reference
coun
try
Year(s)o
fsurvey
Total
sample
Age,range,
andmean
Samplingmetho
dsStud
ydesig
nRe
spon
serate(%
)Diagn
ostic
criteria
Them
ainou
tcom
es(C
HD/stro
ke/associatedris
kfactors/mortalityrates)
Quality
assessment
checklist
(∗)
[17]
Saud
iArabia
1989-1990
and
1991–1993
488
M:314
F:174
All
Non
rand
om(allSaud
ipatie
ntsw
ithfirst
stroke
wereincluded,
andtherew
asexclu
dedpatie
nts)
Prospective
registe
rNR
TheW
HOmultic
entre
Stroke
Registe
r/hypertensio
ndefin
edas
BP>160/90
mmHg/DM
defin
edas
fastingbloo
dsugar
above6
.6mmol/L
Incid
ence
ofstroke:
29.8per100,000
Age-adjustm
entincidence:
125.8per100
000
Stroke
types:isc
hemicstroke
69%
Risk
factors:
HTN
38.1%
/DM
37.1%
/smok
ing19.3%
1-Y,2-Y,3-Y,
4-Y,5-Y,6-N,
7-NA
[18]
Saud
iArabia
1997–200
071
M:55
F:16
63years
Non
rand
om(all
strokep
atients
inclu
ded,no
exclu
ded
patie
nts)
Retro
spectiv
estu
dyNR
NR
Stroke
types:cerebral
infarctio
n80%
Risk
factors:DM
27%/H
TN61%/smok
ing
28%/dyslip
idaemia
4%/Is
chem
icheartd
isease
8.5%
30-day
mortality:31%
1-Y,2-Y,3-Y,
4-Y,5-N,6-N
,7-NA
[25]
Qatar
1997
217
M:72.4%
F:27.6%
57years
Non
rand
om(all
strokep
atients
recordsw
ere
review
ed,and
only
first-
ever
strokec
ases
wereincluded)
Retro
spectiv
estu
dyNR
Stroke
defin
edaccordingto
theW
HOcriteria
Incid
ence
ofstroke:41
per
100,00
0Stroke
types:isc
hemicstroke
(80%
)Risk
factors:
HTN
63%/D
M42%/Is
chem
icheartd
isease17%
30-day
mortalityr
ate:16%
1-Y,2-Y,3-Y,
4-Y,5-N,6-Y,
7-NA
[19]
Bahrain
1995
144
M&F=
notclear
≥20
Non
rand
om(all
strokec
ases
were
review
ed)
Retro
spectiv
estu
dyNR
Stroke
defin
edaccordingto
theW
HOcriteria
Incid
ence
ofstroke:57
per
100,00
0Stroke
types:cerebral
infarctio
n60%
Risk
factors:HTN
52%/D
M20%/dyslip
idaemia
29%/smok
ing29%/Is
chem
icheartd
isease5
0%
1-Y,2-Y,3-Y
,4-N,5-N
,6-N
,7-NA

Advances in Public Health 7
Table1:Con
tinued.
Reference
coun
try
Year(s)o
fsurvey
Total
sample
Age,range,
andmean
Samplingmetho
dsStud
ydesig
nRe
spon
serate(%
)Diagn
ostic
criteria
Them
ainou
tcom
es(C
HD/stro
ke/associatedris
kfactors/mortalityrates)
Quality
assessment
checklist
(∗)
[24]
Qatar
2001
303
M:72%
F:28%
61.2years
Non
rand
om(th
edata
ofallstro
kepatie
nts
were
review
ed,and
therew
ereinclusio
ncriteria
)
Retro
spectiv
estu
dyNR
Stroke:W
HOcriteria
HTN
:BP>140/90
mmHgor
onmedication/DM:past
histo
ryor
FPG(>7m
mol/L)
oron
medication/dyslipidaem
ia:
TC>5.2m
mol/L
orTG>2.0m
mol/L
orHDL<0.9m
mol/L
LDL>3.4m
mol/L/BMI
≥30
kg/m2/smokers:regular
smok
ingw
ithin
thelast5
years
Risk
factors:HTN
69%/D
M51%/dyslip
idaemia
57%/obesity30%/smok
ing
26%/CAD23%
1-Y,2-Y,3-Y,
4-Y,5-N,6-Y,
7-NA
[26]
(Kuw
ait,Oman,
Qatar,and
the
UAE)
2006-2007
780
M:63.7%
F:36.3%
58.9years
Nosampling(all
ischemicstroke
patie
ntsw
ere
inclu
ded,andthere
wereinclusio
ncriteria
)
Prospective
registr
yNR
HTN
:BP>160/90
mmHgor
onmedication/DM:past
histo
ryor
elevatedA1cor
onmedication/dyslipidaem
ia:
TC>5.2m
mol/L
orTG>1.7
mmol/L
orHDL>1.0
mmol/L
LDL<3.4m
mol/L/BMI
≥30
kg/m2/smokers:regular
smok
ingw
ithin
thelast5
years
Risk
factors:HTN
66.4%/D
M55.3%/current
smokers
19.6%/dyslip
idaemia30.1%
90-day
mortality:2.1%
1-Y,2-Y,3-Y,
4-Y,5-Y,6-Y,
7-NA
[16]
Saud
iArabia
1993
23,227
M:49.8
%F:50.2%
NR
Nosampling(all
Saud
ilivingin
the
Thuq
baharea
were
screened)
Com
mun
ity-
based
cross-sectional
survey
NR
Stroke
defin
ed“sud
denor
rapidon
seto
ffocalor
glob
albraindysfu
nctio
nof
vascular
origin
lastingform
orethan
24hor
leadingto
death
especiallyifdiagno
sedby
physicians”
Theo
verallprevalence
ofstroke
survivors:
186per100
000
1-Y,2-Y,3-Y,
4-N,5-Y,6-N
,7-NA
M,m
ale;F,female;U,
urban;
R,rural;DM,diabetes;IFG,impaire
dfasting
glucose;HC,
hypercho
leste
rolemia;T
G,trig
lycerid
e;TC
,totalcholesterol;HDL,high
-densitylip
oprotein;LDL,low-densitylip
oprotein;
HTN
,hypertension;
SBP,systo
licbloo
dpressure;D
BP,d
iasto
licbloo
dpressure;N
R,no
treported;
ACS,acutecoronary
synd
rome;BM
I,bo
dymassind
ex;Y
,yes;N
,no;
andNA,n
otapplicable.
(∗)the
quality
assessmentchecklistassessedaccordingto
theC
entre
forR
eviewsa
ndDiss
eminationguidelines
(CRD
)for
nonrando
mized
studies:1-W
asthea
imof
thes
tudy
statedcle
arly?2
-Was
them
etho
dology
stated?
And
was
itapprop
riate?3
-Wereapprop
riatemetho
dsused
ford
atacollectionandanalysis?
4-Was
thedata
analysissufficiently
rigorou
s?5-
Werepreventiv
este
pstakento
minim
izebias?6
-Werelim
itatio
nsof
the
study
discussed?
7-In
syste
maticreview
,was
search
strategyadequateandapprop
riate?

8 Advances in Public Health
Table2:Ch
aracteris
ticsa
ndprevalence
dataof
theincludedstu
dies
ontheb
urdenof
CVDris
kfactorsintheG
CCregion
.
Reference
coun
try
Year(s)o
fsurvey
Total
sample
Age,m
ean,
andmin
tomax
Samplingmetho
dsStud
ydesig
nRe
spon
serate(%
)Diagn
ostic
criteria
and/or
dietaryassessmentm
etho
dsTh
emainfin
ding
sand
prevalence
data
Quality
assessment
checklist
(∗)
[27]
Saud
iArabia
1996-1997
1,649
M:1,17
5F:474≥40
Rand
omstratifi
edsampling
Cross-sectional
study
76.6
HC:
TC>6.2m
mol/L/overw
eightB
MI
form
en≥27.2wom
en≥26.9/H
TN:SBP≥140m
mHg
orDBP≥95
oron
medication
Overw
eight
49.8%/H
TN19.9%/current
smoking18.8%,
HC:
overall10.1%
M:10.3%
F:9.7
%
1-Y,2-Y,3-Y,
4-Y,5-Y,6-N,
7-NA
[28]
Saud
iArabia
1990–1993
10,651
M:50.8%
F:49.2%≥20
Multistage
stratifi
edclu
ster
sampling
National
epidem
iological
cross-sectional
survey
69Overw
eightand
obesity
defin
edaccordingtheW
HO
criteria
Overw
eight:overall31.2%
M33.1%
,F29.4%,U
33.6%,R
28.3%
Obesity:overall22.1%
,M
17.8%
,F26.6%,U
25.6%,
andR17.6%
1-Y,2-Y,3-Y,
4-Y,5-Y,6-N,
7-NA
[29]
Saud
iArabia
1995–200
016917
M:8002
F:8804
30–70
Two-sta
gestratifi
edclu
ster
sampling
National
epidem
iological
cross-sectional
survey
98.2
DM
was
defin
edaccordingto
theW
HO
DM:overall23.7%,
M26.2%,F
21.5%,U
25.5%,
andR19.5%
Thep
revalen
ceofIFGoverall
14.1%
M14.4%,and
F13.9%
1-Y,2-Y,3-Y,
4-Y,5-Y,6-N,
7-NA
[30]
Saud
iArabia
1996
647
M:383
F:264
18–26
Rand
omsampling
Cross-sectional
study
91Cu
rrentsmokers:currently
smok
ingatleast1
cigarette
per
day
Currentsmoking
overall29%
,M
20%,F
9%
1-Y,2-Y,3-Y,
4-Y,5-Y,6-N,
7-NA
[31]
Saud
iArabia
1990–1993
2049
M:1033
F:1016
30–6
4Multistage
stratifi
edclu
ster
sampling
National
Cross-sectional
survey
92
DM:the
rand
omserum
glucosea
ccording
tothe
WHOcriteria
orself-repo
rted/H
C:mild
(5.2–6
.2mmol/L)severe
(>6.2m
mol/L)/HDL:
<0.9m
mol/L/BMI:WHO
criteria
Overw
eight:M
38%,F
34%
Obesity:M
23%,F
34%
DM:M
16.4%,F
20%
Smoking:M
21%,F
1%ModerateH
C:M
&F=21.5%
SevereHC:
M&F=9%
LDL:M
6.6%
,F10.3%
HDL:M
55%,F
47%
1-Y,2-Y,3-Y,
4-Y,5-Y,6-N,
7-NA
[32]
Saud
iArabia
1995–200
017,232
M:8215
F:9008
30–70
Two-sta
gestratifi
edclu
ster
sampling
National
epidem
iological
cross-sectional
survey
NR
Overw
eightand
obesity
defin
edaccordingto
the
WHO
Overw
eight:
Overall36.9%,
M42.4%,F
31.8%,U
36.9%,R
36.9%
Obesity:
Overall35.6%,
M26.4%,F
44%
U39.7%,R
27%
1-Y,2-Y,3-Y,
4-Y,5-Y,6-N,
7-NA
[33]
Saud
iArabia
2001
1114
M:442
F:672
35–85
Clustersam
pling
Cross-sectional
study
NR
HTN
:BP≥140m
mHgsysto
licand90
mmHgdiastolic
orself-repo
rted
with
medication
orbo
th
HTN
:Overall30%
M33%,F
29%,U
29%,R
32%
1-Y,2-Y,3-Y,
4-Y,5-Y,6-N,
7-NA

Advances in Public Health 9
Table2:Con
tinued.
Reference
coun
try
Year(s)o
fsurvey
Total
sample
Age,m
ean,
andmin
tomax
Samplingmetho
dsStud
ydesig
nRe
spon
serate(%
)Diagn
ostic
criteria
and/or
dietaryassessmentm
etho
dsTh
emainfin
ding
sand
prevalence
data
Quality
assessment
checklist
(∗)
[34]
Saud
iArabia
1996
1333
M:100%≥19
Rand
omsampling
Cross-sectional
study
75Re
gulara
ctive:ph
ysically
activ
efor
30or
morem
inutes,
2or
mored
aysa
week
Physica
llyinactiv
e53%
,irregularlyactive2
7.5%,and
physica
llyactiv
eonaregular
basis
19%
1-Y,2-Y,3-Y,
4-Y,5-N,6-N
,7-NA
[35]
Saud
iArabia
1995–200
017,230
M:47.7
%F:52.3%
30–70
Two-sta
gestratifi
edclu
ster
sampling
National
epidem
iological
cross-sectional
survey
NR
HTN
:SBP≥140m
mHgor
DBP≥90
mmHg
HTN
:Overall26.1%
M28.6%,F
23.9%,U
27.9%,R
22.4%
1-Y,2-Y,3-Y,
4-Y,5-Y,6-N,
7-NA
[36]
Saud
iArabia
1995–200
017,39
5M:8297
F:9098
30–70
Two-sta
gestratifi
edclu
ster
sampling
National
epidem
iological
cross-sectional
survey
NR
Physicallyactiv
e:30
minutes
ormoreo
fatleast
mod
erate-intensity
activ
ityfor
threeo
rmoretim
esper
week/ph
ysicalinactiv
ity:
participantswho
didno
tmeet
thep
hysic
allyactiv
ecriteria
Physica
lina
ctivity
:Overall96.1%
M93.9%,F
98.1%
1-Y,2-Y,3-Y,
4-Y,5-Y,6-Y,
7-NA
[37]
Saud
iArabia
1995–200
016.819
M:47.6
%F:52.4%
30–70
Two-sta
gestratifi
edclu
ster
sampling
National
epidem
iological
cross-sectional
survey
97HC:
TC≥5.2m
mol/L/TG:
≥1.6
9mmol/L
HC:
overall54%
M54.9%,F
53.2%,U
53.4%,R
55.3%
HG:
Overall40
.3%
M47.6%,F
33.7%
1-Y,2-Y,3-Y,
4-Y,5-Y,6-Y,
7-NA
[38]
Saud
iArabia
1999-200
01752
M&F=
notclear
35.5
Rand
omsampling
Cross-sectional
study
70
Currentsmokers:thosew
horegu
larly
oroccasio
nally
smokeo
nad
aily,
weekly,or
mon
thlybasis/non
smokers:
thosew
honeversmoked.
Currentsmokers52.3%
U55.9%,R
44.1%
1-Y,2-Y,3-Y,
4-Y,5-Y,6-Y,
7-NA
[39]
Saud
iArabia
2004-2005
195,874
M:99,9
46F:95,905≥30
Non
rand
om(all
Saud
isaged
30and
abovew
holived
inthee
astern
region
inSA
wereinvited
toparticipatein
thes
creening
programme)
Cross-sectional
survey
99.1
Overw
eightand
obesity
defin
edaccordingto
the
WHO
Overw
eight:overall35.1%
M40
.3%,F
29.7%
Obesity:overall43.8%
M36.1%
,F51.8%
1-Y,2-Y,3-Y,
4-Y,5-Y,6-Y,
7-NA

10 Advances in Public HealthTa
ble2:Con
tinued.
Reference
coun
try
Year(s)o
fsurvey
Total
sample
Age,m
ean,
andmin
tomax
Samplingmetho
dsStud
ydesig
nRe
spon
serate(%
)Diagn
ostic
criteria
and/or
dietaryassessmentm
etho
dsTh
emainfin
ding
sand
prevalence
data
Quality
assessment
checklist
(∗)
[40]
Saud
iArabia
1993–1998
F:1764
30–70years
Multistage
stratifi
edclu
ster
sampling
CSS
NR
NR/Structured
questio
nnaire
(i)Th
econ
sumptionof
black
teaw
as87.2%.
(ii)F
emales
who
daily
consum
ed>6cups
oftea
(>480m
L)weres
ignificantly
morelikely
tohave
lower
rates
ofdyslipidaem
iainclu
ding
,high
(TC)
(OR=0.63,95%
CI:
0.41–0
.97),highTG
(OR=
0.56,95%
CI:0.35–0.86),high
(LDL)
(OR=0.70,95%
CI:
0.45–1.07),and
high
(VLD
L)(O
R=0.61,95%
CI:
0.39–0
.93).
1-Y,2-Y,3-Y,
4-Y,5-Y,6-Y,
7-NA
[41]
Saud
iArabia
2008-2009
312
M:132
&F:180
21.1years
Rand
omselection
CSS
NR
BMIa
ccording
totheN
ational
Instituteof
Health
.HTN
accordingto
theF
ourth
Repo
rton
theD
iagn
osis,
Evaluatio
n,andTreatm
ento
fHighBloo
dPressure/Self-reported
questio
nnaire
(11items)
(i)Th
e%of
totalenergyfro
mcarboh
ydratesa
ndfatswas
(38%
versus
39%)a
nd(46.1%
versus
46.8%)inbo
thM
and
F. (ii)U
nhealth
yfood
habits
were
high
consum
ptionof
snacks
(42.5%
),alow
consum
ptionof
vegetables
(30%
),ah
ighconsum
ptionof
fatty
food
s(36%in
F;44
%in
M),ah
ighconsum
ptionof
salty
food
s(36%in
F;43%in
M),andah
ighconsum
ption
ofsugar(41%in
F;38%in
M).
(iii)Asig
nificantassociatio
nbetweentheh
ighintakeso
fenergy
deriv
edfro
mfatty
food
sand
BMIand
HTN
inbo
thgend
ers.
(iv)A
significantassociatio
nwas
foun
dbetweentheh
igh
consum
ptionof
salty
food
sandHTN
.(v)A
negativ
eassociatio
nwas
foun
dbetweenthe
consum
ptionof
vegetables,
grains,and
beansa
ndBM
IandHTN
inbo
thgend
ers.
1-Y,2-Y,3-Y,
4-Y,5-Y,6-N,
7-NA

Advances in Public Health 11Ta
ble2:Con
tinued.
Reference
coun
try
Year(s)o
fsurvey
Total
sample
Age,m
ean,
andmin
tomax
Samplingmetho
dsStud
ydesig
nRe
spon
serate(%
)Diagn
ostic
criteria
and/or
dietaryassessmentm
etho
dsTh
emainfin
ding
sand
prevalence
data
Quality
assessment
checklist
(∗)
[42]
Saud
iArabia
2009
2789
M:1806
F:981
30–70years
Rand
omselection
CSS
NR
NR/Questionn
aire
and24
hrecall
(i)Th
emostp
opular
food
was
kabsa(
80%in
Mand65%in
F),fresh
fruits(63%
inM
and
45%in
F),vegetables(62%in
Mand47%in
F)anddates
(45%
)inbo
thgend
ersa
ndsoft
drinks
(21%
inM
and25%in
F).
1-Y,2-Y,3-Y,
4-Y,5-N,6-Y,
7-NA
[43]
TheU
AE
2008–2010
50138
M:43%
F:57%
18–75
Non
rand
om(all
UAEnatio
nals
resid
ingaged
18to
75who
wereliving
inAb
uDhabicity
were
enrolledin
theC
VDscreening
program)
Cross-sectional
natio
nalsurvey
Measured
data(98.7–
99.9),
self-
repo
rted
data
(86.1–99.8)
Obesityandoverweight:
accordingto
WHO/D
M:past
histo
ryandon
medicationor
HbA
1c≥6.5%
orrand
omglucose11.1
mmol/L/H
TN:
self-repo
rted
andon
medicationor
SBP
≥140m
mHgor
DBP
≥90
mmHg/dyslipidaem
ia:
self-repo
rted
onmedicationor
LDL4.1m
mol/L
orHDL
1.0mmol/L/current
smokers:1
cigarette
perd
aydu
ringthe
last12
mon
thso
r1water
pipe
perm
onth
durin
gthelast3
mon
ths
Obesity:overall35.4%
M31.6%,and
F38.3%
Overw
eight:overall31.9%
M36.1%
,and
F28.8%
Dyslipidaemia:overall44
.2%
M57.7%,and
F33.9%
HTN
:overall23.1%
M26%,and
F20.9%
Smoking:overall11.6
%M
25.8%,and
F0.8%
DM:overall17.6%
M17.3%
,and
F17.9%
1-Y,2-Y,3-Y,
4-Y,5-Y,6-Y,
7-NA
[44]
TheU
AE
1997
3150
M:1516
F:1634
18–75
Stratifi
edrand
omsampling
Cross-sectional
study
NR
HTN
:SBP>140m
mHgand/or
DBP>90
mmHgand/or
self-repo
rted
with
medication
HTN
:overall31.6
%M
47%,F
53%
1-Y,2-Y,3-Y,
4-N,5-Y,6-N
,7-NA
[45]
TheU
AE
1999-200
05844
M:2499
F:3345≥20
Stratifi
edmultistage
cluste
rsampling
National
epidem
iological
cross-sectional
study
89DM:fastin
gbloo
dglucose
≥7.0
mmol/L
ortaking
insulin
ororalhypo
glycem
icagents
DM:overall20%
M21.5%,F
19.2%
IFG:
overall6.5%
M4.5%
,F8%
1-Y,2-Y,3-Y,
4-Y,5-Y,6-N,
7-NA
[46]
TheU
AE
2000-2001
535
F:100%>19
Stratifi
edrand
omsampling
Cross-sectional
survey
95Overw
eightand
obesity
were
defin
edaccordingto
WHO
criteria
Overw
eight
27%
Obesity3
5%
1-Y,2-Y,3-Y,
4-Y,5-Y,6-Y,
7-NA
[47]
TheU
AE
2002-2003
1104
M:72%
F:28%
18–6
9Multistage
cluste
rrand
omsample
Large
cross-sectional
survey
94.9
Physicalinactiv
ity:the
person
didno
tmeetthe
following
criteria
:3or
mored
ayso
fvario
usactiv
ities
durin
gthe
lastwe
ekof
atleast20minutes
perd
ayor
5or
mored
ayso
fmod
erate-intensity
activ
ityor
walking
durin
gthelastw
eek
ofatleast30minutes
perd
ay
Physica
lina
ctivity
Overall39.5%
M37.9%,F
56.7%
1-Y,2-Y,3-Y,
4-Y,5-Y,6-Y,
7-NA
12 Advances in Public Health
Table2:Con
tinued.
Reference
coun
try
Year(s)o
fsurvey
Total
sample
Age,m
ean,
andmin
tomax
Samplingmetho
dsStud
ydesig
nRe
spon
serate(%
)Diagn
ostic
criteria
and/or
dietaryassessmentm
etho
dsTh
emainfin
ding
sand
prevalence
data
Quality
assessment
checklist
(∗)
[48]
TheU
AE
2010
227
M:74
F:153
18–50
years
Con
venience
sampling
CCS
NR
MetSaccordingto
ATP
III/24
hrecall
(i)Ahigh
intake
oftotal
energy,carbo
hydrate,fat,and
proteinin
MandF,(20971
versus
17180kjou
les/d
ay),
(627.3versus
549.7
g/day),
(207.5versus
150.1g/day),and
(175.5versus
151.5
g/day),
respectiv
ely.
(ii)Th
emeanintake
oftotal
sugara
ndfib
rewas
high
(224.4versus
202g
/day)a
nd(44.4versus
33.3g/day),
respectiv
ely.
1-Y,2-Y,3-Y,
4-Y,5-Y,6-Y,
7-NA
[49]
TheU
AE
2001-2002
F:40
018–25years
Con
venience
sampling
CSS
NR
BMIa
ccording
toWHO/self-adm
inistrated
questio
nnaire
(i)Th
eprevalenceo
foverweightand
obesity
was
19.4%and6.7%
,respectively
.(ii)F
oodhabitsinclu
deno
thaving
breakfastin44
.8%,fast
food
consum
ptionon
cead
ayin
34.9%,and
having
only1o
r2meals/dayin
52.3%.
(iii)Alowconsum
ptionof
cereals,vegetables
andfruits
by54.4%,51.5
%,and
49.5%,
respectiv
ely.A
high
intake
offatin46
.7%.
(iv)A
significantassociatio
nbetweenob
esity
andlow
consum
ptionof
cerealsa
ndfruits.
1-Y,2-Y,3-Y,
4-Y,5-N,6-N
,7-NA
[50]
TheU
AE
1993
2212
M:1122
F:1090≥20
Rand
omselection
CSS
NR
NA/preteste
dstructured
questio
nnaire
(i)Alowconsum
ptionof
fruits,
vegetables,and
milk
inthes
tudy
popu
latio
n.(ii)E
lderlyadults(≥50)w
ere
morelikely
toconsum
efruits,
vegetables,fish,m
ilk,and
yoghurtthanoldera
dults.
(iii)Yo
ungadultfem
ales
were
morelikely
toconsum
efruits,
vegetables,and
fishthan
youn
gadultm
ales.
1-Y,2-Y,3-Y,
4-Y,5-Y,6-N,
7-NA

Advances in Public Health 13
Table2:Con
tinued.
Reference
coun
try
Year(s)o
fsurvey
Total
sample
Age,m
ean,
andmin
tomax
Samplingmetho
dsStud
ydesig
nRe
spon
serate(%
)Diagn
ostic
criteria
and/or
dietaryassessmentm
etho
dsTh
emainfin
ding
sand
prevalence
data
Quality
assessment
checklist
(∗)
[51]
Kuwait
1995-1996
3003
M:1105
F:1898≥20
Con
venience
sampling(all
Kuwaiti+2
0in
the
survey
area
invited
toparticipate)
Cross-sectional
study
NR
DM
accordingto
theW
HO
diagno
sticcriteria
for
abno
rmalglucosetolerance
DM:
overall14.8%
M14.7%,F
14.8%
1-Y,2-Y,3-Y,
4-Y,5-N,6-N
,7-NA
[52]
Kuwait
1996
3859
M:1798
F:2061
33.2
Athree-sta
gestratifi
edclu
ster
sampling
Cross-sectional
natio
nalstudy
96.5
Currentsmokers:ifthey
were
smok
ingatthetim
eofthe
survey
andhadsm
oked
more
than
100cigarette
intheir
lifetim
e,form
ersm
okers:if
they
hadsm
oked
morethan
100cigarette
intheirlife
but
nolonger
smok
ing,andnever
smokers:whenthey
hadnever
smoked
orsm
oked
lessthan
100cigarette
sintheirlife
Thep
revalen
ceofsm
oking:
Overall17%
M34.4%,F
1.9%
1-Y,2-Y,3-Y,
4-Y,5-Y,6-Y,
7-NA
[53]
Kuwait
1998–200
932,811
M:15,110
F:17,701
20–6
9
Con
venience
sampling
(Kuw
aitis
inhealth
exam
inationfor
Gov.and
Hajj
health
check-up
sandPH
CCs)
National
cross-sectional
survey
NR
HC:
mod
erate(5.2–6.22
TCmmol/L)severe(>6.23
TCmmol/L)
HCprevalence
increasedfro
m1998
to1999
(M35%;F
31%)
until
2006-2007(M
56%;F
53.6%)a
ndthen
declinedin
2008-200
9(M
33.7%;F
30.6%)
1-Y,2-Y,3-Y,
4-Y,5-N,6-Y,
7-NA
[54]
Kuwait
2006
2280
M:918
F:1362
20–6
5Syste
maticrand
omsampling
National
cross-sectional
survey
77.6
Overw
eightand
obesity
were
defin
edaccordingto
the
WHOcriteria
Combinedoverwe
ight
and
obesity
:80.4%
Obesity:
M39.2%,F
53%
1-Y,2-Y,3-Y,
4-Y,5-Y,
6-N,7-NA
[55]
Kuwait
1998–200
938,611
M:17,4
91F:21,12
020–6
9
convenience
sampling(Kuw
aitis
inhealth
exam
inationfor
Gov.and
Hajj
health
check-up
sandPH
CCs)
National
cross-sectional
survey
NR
Overw
eightand
obesity
defin
edaccordingto
the
WHOcriteria
Obesityincreased
from
1998
to1999
(M22.8%;F
28.4%)u
ntil
2008-200
9(M
34.1%
;F43%)
Overw
eight
increasedfro
m1998
to1999
(M36.5%;F
33.4%)u
ntil2008-200
9(M
43.3%;F
34.3%)
1-Y,2-Y,3-Y,
4-Y,5-N,6-Y,
7-NA

14 Advances in Public Health
Table2:Con
tinued.
Reference
coun
try
Year(s)o
fsurvey
Total
sample
Age,m
ean,
andmin
tomax
Samplingmetho
dsStud
ydesig
nRe
spon
serate(%
)Diagn
ostic
criteria
and/or
dietaryassessmentm
etho
dsTh
emainfin
ding
sand
prevalence
data
Quality
assessment
checklist
(∗)
[56]
Kuwait
2002–2009
6356
M:2745
F:3611
20–6
9
Con
venience
sampling(Kuw
aitis
inhealth
exam
inationfor
Gov.and
Hajj
health
check-up
sandPH
CCs)
National
cross-sectional
survey
NR
Diabetesd
efinedaccordingto
theW
HOcriteria
IFGdecreasedfro
m2002
to2009
by(M
:7.4%,F:6.8%)and
DM
decreasedin
thes
ame
perio
dby
(M9.8
%,F
8.9%
)Th
eprevalencein2008-200
9:IFG(M
6%,F
5.3%
)DM
(M9.3
%,F
6%)
Physica
lactivity
(M42.1%
,F19.2%)
1-Y,2-Y,3-Y,
4-Y,5-N,6-Y,
7-NA
[57]
Kuwait
2006
761
M:261
F:500
M:21y
ears
F:20.8yearsRa
ndom
sampling
Cross-sectional
study
84.5
Water-pipes
mokers:ap
erson
who
smoked
sheeshaa
ndhad
smoked
sheeshafor
atleast
onem
onth,peoplew
hohad
notsmoked
sheeshaw
ere
classified
assheesha
nonsmokers
Water-pipesmoking:
M24.6%,F
5.5%
Cigarette
smoking:
M38.8%,F
7.9%
1-Y,2-Y,3-Y,
4-Y,5-N,6-N
,7-NA
[58]
Qatar
2003
1208
M:508
F:700
25–6
5Amultistage
stratifi
edclu
ster
sampling
Cross-sectional
study
80.5
BPaccordingto
theW
HO
criteria
HTN
:32.1%
M32.6%,F
31.7%
1-Y,2-Y,3-Y,
4-Y,5-Y,6-N,
7-NA
[59]
Qatar
2007-2008
1117
M:571
F:546>20
Amultistage
stratifi
edclu
ster
sampling
Cross-sectional
study
77.9
DM
was
defin
edaccordingto
theW
HOexpertgrou
pDM:16.7%
M15.2%,F
18.1%
1-Y,2-Y,3-Y,
4-Y,5-Y,6-Y,
7-NA
[60]
Qatar
1992
603
F:100%
18–6
7Con
venient
sampling
Cross-sectional
survey
NR
Obesityandoverweight
accordingto
theW
HO
defin
ition
/self-r
eportedof
pasthisto
ryof
DM
andHTN
HTN
:12.3%
,DM:12.9%
Smoking:3.2%
,overw
eight:
30%,obesity:33.6%,regular
exercise:16%
1-Y,2-partly,
3-no
tentire
lyapprop
riate,4-Y,
5-N,6-N
,7-N
A
[61]
Oman
2000
7011
M:50%
F:50%≥20
Amultistage
stratifi
edprob
ability-
sampling
Cross-sectional
natio
nalsurvey
83–9
1.5
Currentsmokers:peop
lewho
weres
mok
ingatthetim
eof
thes
urveyandhadsm
oked
morethan100cigarette
intheirlife/fo
rmer
smokers:if
they
hadsm
oked
morethan
100cigarette
intheirlife
but
nolong
ersm
oking/never
smokers:ifthey
hadnever
smoked
orhadsm
oked
less
than
100cigarette
intheirlife
Currentsmoking:7%
M13.4%,F
0.5%
Form
ersm
okers:2.3%
Neversmokers:90.7%
1-Y,2-Y,3-Y,
4-Y,5-Y,6-N,
7-NA
Advances in Public Health 15
Table2:Con
tinued.
Reference
coun
try
Year(s)o
fsurvey
Total
sample
Age,m
ean,
andmin
tomax
Samplingmetho
dsStud
ydesig
nRe
spon
serate(%
)Diagn
ostic
criteria
and/or
dietaryassessmentm
etho
dsTh
emainfin
ding
sand
prevalence
data
Quality
assessment
checklist
(∗)
[62]
Oman
2000
7179
M:50%
F:50%≥20
Amultistage
stratifi
edprob
ability-
sampling
desig
n
Cross-sectional
natio
nalsurvey
96Th
eWHOcriteria
forg
lucose
intoler
ance,H
C,andHTN
DM:overall11.6%
M11.8%,F
11.3%,U
17.7%
,R10.5%
HTN
:overall21.5%
M32.5%,F
22.7%,U
26.4%,R
20.2%
HC:
overall50.6%
M50.8%,F
50.4%,U
50%,R
50.7%
1-Y,2-Y,3-Y,
4-Y,5-Y,6-Y,
7-NA
[63]
Oman
1991
and
5086
M:2128
F:2958≥20
Con
venient
sampling
Cross-sectional
surveys
92Overw
eightand
obesity
were
defin
edaccordingto
the
WHOcriteria
Overw
eight:in1991
(M28.8%,
F29.5%)in2000
(M32.1%
,F27.3%)
Obesity:in
1991
(M10.5%,F
25.1%
)in2000
(M16.7%,
23.8%)
1-Y,2-Y,3-Y,
4-Y,5-N,6-N
,7-NA
2000
6400
M:3069
F:3331
Amultistage
stratifi
edprob
ability-
sampling
desig
n
911-Y
,2-Y,3-Y,
4-Y,5-Y,6-N,
7-NA
[64]
Oman
2001
1421
M:49%
F:51%≥20
Aprob
abilistic
rand
omsampling
Com
mun
itybased
cross-sectional
study
75.5
DM:FPG≥5.6m
mol/L
or2hG≥11.1m
mol/L
oron
medication/HTN
:SBP
≥130m
mHgand/or
DBP
≥85
mmHgor
onmedication/TC
:≥5.2m
mol/L/TG:
≥1.6
9mmol/L/H
DL:
<1.0
3mmol/L
oron
medicationfor
dyslipidaem
ia/current
smokers:peop
lewho
smoking
atthetim
eofthe
survey/physic
alactiv
ityat
leisu
retim
eand
/ora
twork
HTN
(M24.7%,F
13.8%)
DM
(M12.9%,F
11.9%)
HC(M
34.5%,F
34.5%)
TG(M
24.4%,F
13%)
HDL(M
75.9%,F
71.6%)
Inactiv
ity(M
24.3%,F
69.3%)
Smoking(M
9.6%,F
0)
1-Y,2-Y,3-Y,
4-Y,5-Y,6-Y,
7-NA

16 Advances in Public Health
Table2:Con
tinued.
Reference
coun
try
Year(s)o
fsurvey
Total
sample
Age,m
ean,
andmin
tomax
Samplingmetho
dsStud
ydesig
nRe
spon
serate(%
)Diagn
ostic
criteria
and/or
dietaryassessmentm
etho
dsTh
emainfin
ding
sand
prevalence
data
Quality
assessment
checklist
(∗)
[65]
Oman
2008
40,17
9M:52%
F:48%≥18
Amultistage
stratifi
edclu
ster
samplingdesig
n
Com
mun
ity-
basednatio
nal
cross-sectional
survey
93.5
TheW
HOcriteria
for
diagno
sisHTN
,HC,
BMI,and
DM
wereu
sed
Overw
eight:overall29.5%
M31.2%,F
28%
Obesity:overall24.1%
M22%,F
26.1%
HTN
:overall40
.3%
M50.7%,F
31%
DM:overall12.3%
M12.4%,F
12.1%
HC:
overall33.6%
M33.1%
,F33.9%
HDL:overall35.2%
M26.3%,F
42.7%
LDL:overall32%
M33%,F
31.2%
TG:overall18%
M21.6%,F
14.9%
1-Y,2-Y,3-Y,
4-Y,5-Y,6-Y,
7-NA
[66]
Bahrain
1995-1996
2013
M:1168
F:845
40–6
9Stratifi
edsampling
desig
nCr
oss-sectional
natio
nalsurvey
70
Overw
eightand
obesity
:WHOcriteria
.Ph
ysicalactiv
itywas
assessed
bywalking
andcycling
inform
ation:
walkk
m=5×
walkw
k(w
alking
/day
inaveragew
eek)
+walkk
m(w
alking
inweekend
).Cy
clekm
=5×cycle
wk
(cyclin
g/dayin
averagew
eek)
+cycle
we(
cycling
inweekend
)
Age-adjuste
dprevalence
ofoverwe
ight:
M39.9%,F
32.7%
Age-adjuste
dprevalence
ofobesity
:M
25.3%,F
33.2%
Physica
lactivity
:21%of
men
and6%
ofwom
enaged
50–59walked1–3k
mper
dayand68%of
men
and93%
ofwom
enaged
50–59walked
lessthan
1km
perd
ay
1-Y,2-Y,3-Y,
4-Y,5-Y,6-N,
7-NA
[67]
Bahrain
2002
514
M:298
F:216
30–79
Prob
abilityclu
ster
samplingdesig
n
Cross-sectional
commun
ity-
based
survey
NR
DM
was
defin
edby
self-repo
rted
pasthisto
ryof
diabetes
DM:9%
M41.3%,F
58.7%
1-Y,2-Y,3-not
entirely
approp
riate,4-Y,
5-N,6-Y,7-N
A
[68]
Bahrain
2001
514
M:298
F:216
30–79
Prob
abilityclu
ster
samplingdesig
n
Cross-sectional
commun
ity-
based
survey
NR
Overw
eightand
obesity
were
defin
edaccordingto
the
WHOcriteria
Overw
eight:
Overall31%
M35.2%,F
31%
Obesity:
Overall48.7%
M21.2%,F
48.7%
1-Y,2-Y,3-Y,
4-Y,5-Y,6-N,
7-NA

Advances in Public Health 17
Table2:Con
tinued.
Reference
coun
try
Year(s)o
fsurvey
Total
sample
Age,m
ean,
andmin
tomax
Samplingmetho
dsStud
ydesig
nRe
spon
serate(%
)Diagn
ostic
criteria
and/or
dietaryassessmentm
etho
dsTh
emainfin
ding
sand
prevalence
data
Quality
assessment
checklist
(∗)
[69]
Bahrain
1995-1996
2090
M:1192
F:834
40–6
9Stratifi
edsampling
desig
nCr
oss-sectional
natio
nalsurvey
62HTN
:SBP≥160m
mHg,DBP
≥95
mmHgor
onantih
ypertensive
HTN
:M:21%
in40
–49years,29%in
50–59years
F:33%in
50–59years,43%in
60–6
9years
1-Y,2-Y,3-Y,
4-Y,5-Y,6-N,
7-NA
[70]
Bahrain
1995-1996
2029
M&F=
notclear
40–6
9Stratifi
edsampling
desig
n
Cross-sectional
natio
nal
epidem
iological
59–70
DM
was
defin
edaccordingto
WHOcriteria
DM:
M:23%
in40
–49years,29%in
50–59years
F:36%in
ageg
roup
s50–
59and37%60–6
9years
1-Y,2-Y,3-Y,
4-Y,5-Y,6-N,
7-NA
[71]
Bahrain
2000
516
M:299
F:217
30–79
Rand
omclu
ster-sampling
desig
n
Cross-sectional
study
NR
Currentsmokers:ap
erson
smok
ingatleast1
cigarette
per
dayregu
larly
/ex-sm
okers:
person
who
gave
upsm
oking
atleast6
mon
ths
previously/non
smoker:person
who
hadneversmoked
regu
larly
Overallcig
arettesm
oking:
(M27.1%
,F3.2%
)Overallsheeshasm
oking:
(M5%
,F17.5%
)Overalltotalsmoking:
M32.1%
,F20.7%
1-Y,2-Y,3-Y,
4-Y,5-Y,6-N,
7-NA
[72]
Bahrain
1996
498
M:174
F:324≥20
Rand
omselection
from
health
care
centresa
ttend
ances
Cross-sectional
study
86.9
DM
was
defin
edaccordingto
WHOcriteria
ORifthe
person
hadap
reviou
shistory
ofDM
Thep
revalen
ceofknow
ndiabetessubjects:
M:18.4%
/F:16.7%
Thep
revalen
ceofun
know
ndiabetes:
M:8%/F:8.3%
Theo
verallprevalence
ofdiabetes:25.5%
M:26.4%
/F:25%
1-Y,2-Y,3-Y,
4-Y,5-N,6-Y,
7-NA
M,m
ale;F,female;U,
urban;
R,rural;DM,diabetes;IFG,impaire
dfasting
glucose;HC,
hypercho
leste
rolemia;T
G,trig
lycerid
e;TC
,totalcholesterol;HDL,high
-densitylip
oprotein;LDL,low-densitylip
oprotein;
HTN
,hypertension;
SBP,systo
licbloo
dpressure;D
BP,diasto
licbloo
dpressure;N
R,no
treported;AC
S,acutec
oron
arysynd
rome;BM
I,bo
dymassind
ex;Y,yes;N
,no;andNA,not
applicable.
(∗)the
quality
assessmentchecklistassessedaccordingtotheC
entre
forR
eviewsand
Diss
eminationguidelines(C
RD)for
nonrando
mized
studies:1-W
asthea
imofthestudy
statedcle
arly?2
-Wasthem
etho
dology
stated?
And
wasitapprop
riate?3
-Werea
ppropriatemetho
dsused
ford
atac
ollectionandanalysis?
4-Wasthed
ataa
nalysis
sufficiently
rigorou
s?5-Werep
reventivesteps
takentominim
izeb
ias?6-
Werelim
itatio
nsof
thes
tudy
discussed?
7-In
syste
maticreview
,was
search
strategyadequateandapprop
riate?
18 Advances in Public Health
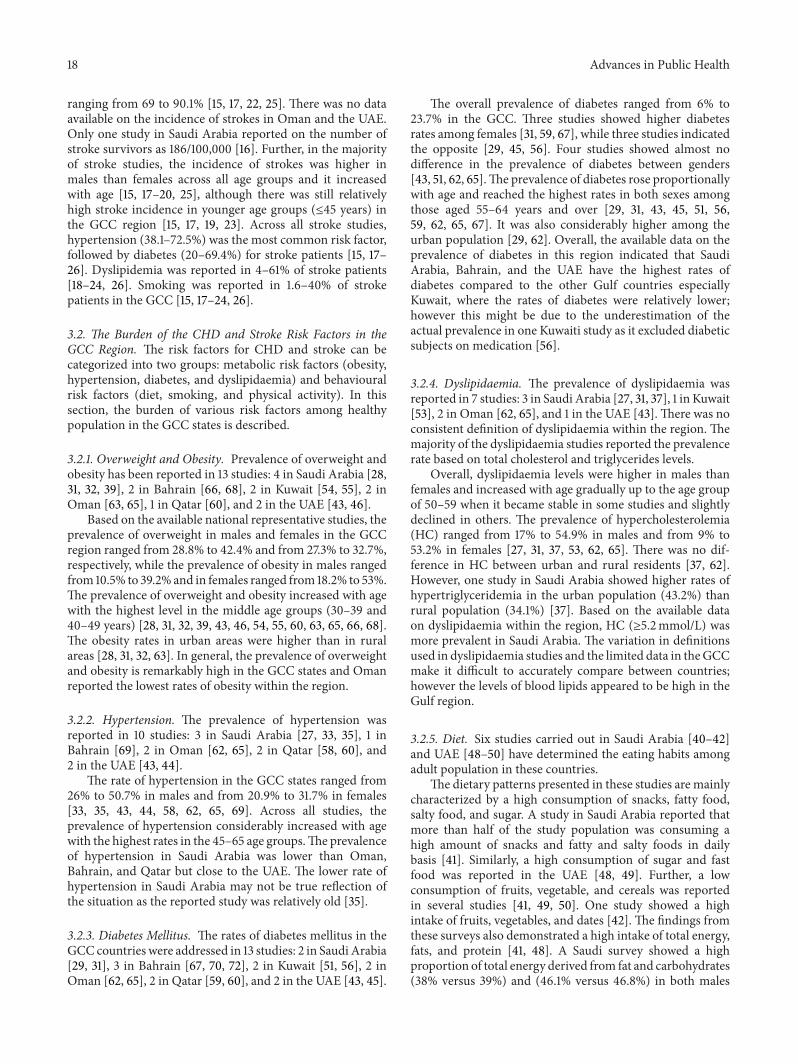
ranging from 69 to 90.1% [15, 17, 22, 25]. There was no dataavailable on the incidence of strokes in Oman and the UAE.Only one study in Saudi Arabia reported on the number ofstroke survivors as 186/100,000 [16]. Further, in the majorityof stroke studies, the incidence of strokes was higher inmales than females across all age groups and it increasedwith age [15, 17–20, 25], although there was still relativelyhigh stroke incidence in younger age groups (≤45 years) inthe GCC region [15, 17, 19, 23]. Across all stroke studies,hypertension (38.1–72.5%) was the most common risk factor,followed by diabetes (20–69.4%) for stroke patients [15, 17–26]. Dyslipidemia was reported in 4–61% of stroke patients[18–24, 26]. Smoking was reported in 1.6–40% of strokepatients in the GCC [15, 17–24, 26].
3.2. The Burden of the CHD and Stroke Risk Factors in theGCC Region. The risk factors for CHD and stroke can becategorized into two groups: metabolic risk factors (obesity,hypertension, diabetes, and dyslipidaemia) and behaviouralrisk factors (diet, smoking, and physical activity). In thissection, the burden of various risk factors among healthypopulation in the GCC states is described.
3.2.1. Overweight and Obesity. Prevalence of overweight andobesity has been reported in 13 studies: 4 in Saudi Arabia [28,31, 32, 39], 2 in Bahrain [66, 68], 2 in Kuwait [54, 55], 2 inOman [63, 65], 1 in Qatar [60], and 2 in the UAE [43, 46].
Based on the available national representative studies, theprevalence of overweight in males and females in the GCCregion ranged from 28.8% to 42.4% and from 27.3% to 32.7%,respectively, while the prevalence of obesity in males rangedfrom 10.5% to 39.2% and in females ranged from 18.2% to 53%.The prevalence of overweight and obesity increased with agewith the highest level in the middle age groups (30–39 and40–49 years) [28, 31, 32, 39, 43, 46, 54, 55, 60, 63, 65, 66, 68].The obesity rates in urban areas were higher than in ruralareas [28, 31, 32, 63]. In general, the prevalence of overweightand obesity is remarkably high in the GCC states and Omanreported the lowest rates of obesity within the region.
3.2.2. Hypertension. The prevalence of hypertension wasreported in 10 studies: 3 in Saudi Arabia [27, 33, 35], 1 inBahrain [69], 2 in Oman [62, 65], 2 in Qatar [58, 60], and2 in the UAE [43, 44].
The rate of hypertension in the GCC states ranged from26% to 50.7% in males and from 20.9% to 31.7% in females[33, 35, 43, 44, 58, 62, 65, 69]. Across all studies, theprevalence of hypertension considerably increased with agewith the highest rates in the 45–65 age groups.The prevalenceof hypertension in Saudi Arabia was lower than Oman,Bahrain, and Qatar but close to the UAE. The lower rate ofhypertension in Saudi Arabia may not be true reflection ofthe situation as the reported study was relatively old [35].
3.2.3. Diabetes Mellitus. The rates of diabetes mellitus in theGCC countries were addressed in 13 studies: 2 in Saudi Arabia[29, 31], 3 in Bahrain [67, 70, 72], 2 in Kuwait [51, 56], 2 inOman [62, 65], 2 in Qatar [59, 60], and 2 in the UAE [43, 45].
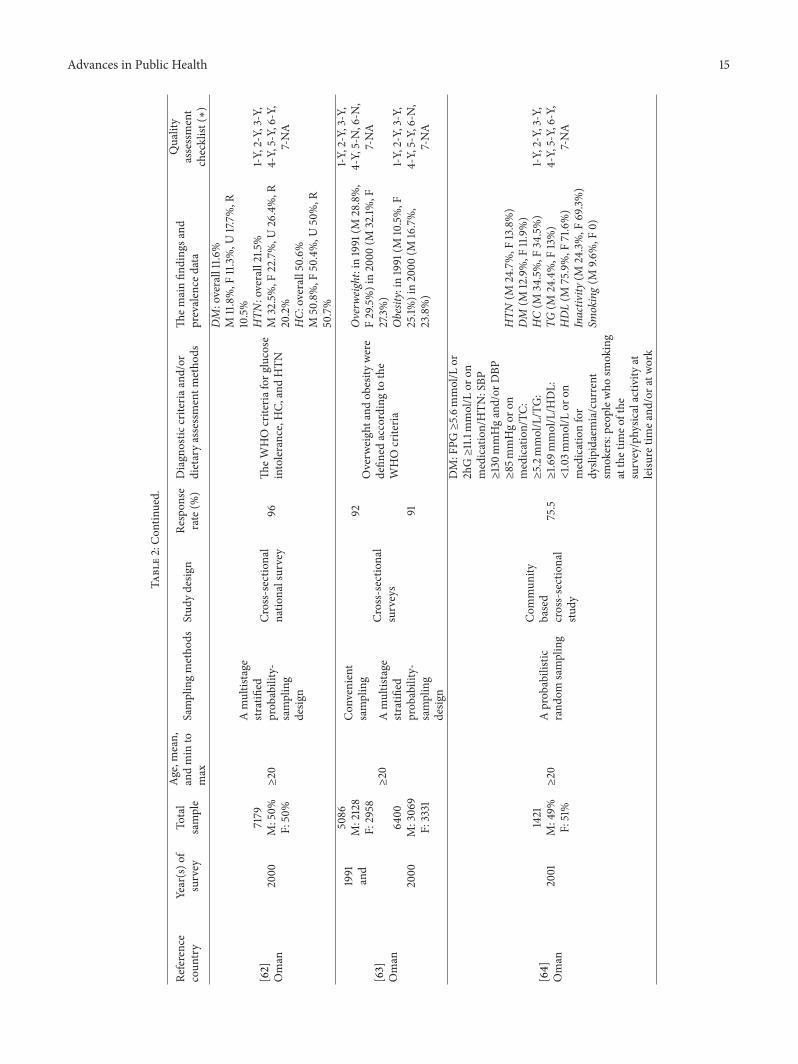
The overall prevalence of diabetes ranged from 6% to23.7% in the GCC. Three studies showed higher diabetesrates among females [31, 59, 67], while three studies indicatedthe opposite [29, 45, 56]. Four studies showed almost nodifference in the prevalence of diabetes between genders[43, 51, 62, 65].The prevalence of diabetes rose proportionallywith age and reached the highest rates in both sexes amongthose aged 55–64 years and over [29, 31, 43, 45, 51, 56,59, 62, 65, 67]. It was also considerably higher among theurban population [29, 62]. Overall, the available data on theprevalence of diabetes in this region indicated that SaudiArabia, Bahrain, and the UAE have the highest rates ofdiabetes compared to the other Gulf countries especiallyKuwait, where the rates of diabetes were relatively lower;however this might be due to the underestimation of theactual prevalence in one Kuwaiti study as it excluded diabeticsubjects on medication [56].
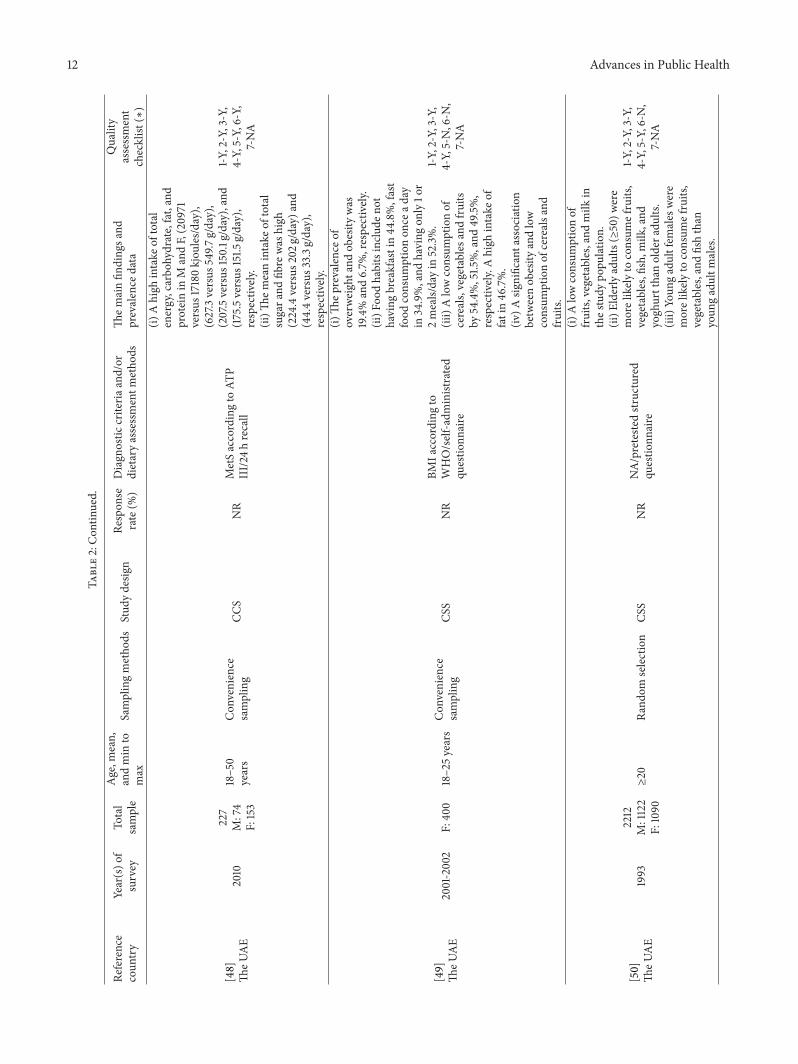
3.2.4. Dyslipidaemia. The prevalence of dyslipidaemia wasreported in 7 studies: 3 in Saudi Arabia [27, 31, 37], 1 in Kuwait[53], 2 in Oman [62, 65], and 1 in the UAE [43]. There was noconsistent definition of dyslipidaemia within the region. Themajority of the dyslipidaemia studies reported the prevalencerate based on total cholesterol and triglycerides levels.
Overall, dyslipidaemia levels were higher in males thanfemales and increased with age gradually up to the age groupof 50–59 when it became stable in some studies and slightlydeclined in others. The prevalence of hypercholesterolemia(HC) ranged from 17% to 54.9% in males and from 9% to53.2% in females [27, 31, 37, 53, 62, 65]. There was no dif-ference in HC between urban and rural residents [37, 62].However, one study in Saudi Arabia showed higher rates ofhypertriglyceridemia in the urban population (43.2%) thanrural population (34.1%) [37]. Based on the available dataon dyslipidaemia within the region, HC (≥5.2mmol/L) wasmore prevalent in Saudi Arabia. The variation in definitionsused in dyslipidaemia studies and the limited data in theGCCmake it difficult to accurately compare between countries;however the levels of blood lipids appeared to be high in theGulf region.
3.2.5. Diet. Six studies carried out in Saudi Arabia [40–42]and UAE [48–50] have determined the eating habits amongadult population in these countries.
The dietary patterns presented in these studies are mainlycharacterized by a high consumption of snacks, fatty food,salty food, and sugar. A study in Saudi Arabia reported thatmore than half of the study population was consuming ahigh amount of snacks and fatty and salty foods in dailybasis [41]. Similarly, a high consumption of sugar and fastfood was reported in the UAE [48, 49]. Further, a lowconsumption of fruits, vegetable, and cereals was reportedin several studies [41, 49, 50]. One study showed a highintake of fruits, vegetables, and dates [42]. The findings fromthese surveys also demonstrated a high intake of total energy,fats, and protein [41, 48]. A Saudi survey showed a highproportion of total energy derived from fat and carbohydrates(38% versus 39%) and (46.1% versus 46.8%) in both males

Advances in Public Health 19
and females, respectively [41]. Some of the popular unhealthyfood habits reported were not having breakfast, consumingless than two meals per day, and a high consumption of fastfood meals [41, 49]. A number of studies have examinedthe association between some food items and CVD riskfactors [40, 41, 49]. One study showed an inverse associationbetween consumption of black tea and serum lipids [40],while another study reported a significant association of highintake of energy derived from fatty foods with BMI andhypertension in both genders [41]. Further, low consumptionof cereals and fruits was found to be associated with obesity[49].
3.2.6. Smoking. Theprevalence of smoking in the Gulf regionwas addressed in 9 studies: 3 in Saudi Arabia [27, 30, 38], 1 inBahrain [71], 2 in Kuwait [52, 57], 1 in Oman [61], 1 in Qatar[60], and 1 in the UAE [43].
The rates of cigarette smoking in the GCC ranged from13.4% to 37.4% in males and from 0.5% to 20.7% in females.Furthermore, the prevalence of smoking fluctuated from agegroup to age group. It was more common inmales at youngerages (18–25 years); however some studies reported a highprevalence in the older age group (40–59 years). In females,the highest rates of smoking were in the older age group (40–49 years) [30, 43, 52, 57, 61, 71]. One study in Saudi Arabiareported higher rates of cigarette smoking in urban than ruralsubjects [38]. Overall, the prevalence of smoking was higherin SaudiArabia, Kuwait, theUAE, andBahrain in comparisonto Oman.
3.2.7. Physical Activity. The prevalence of physical activity inthe GCC countries was presented in 7 studies: 2 in SaudiArabia [34, 36], 1 in Bahrain [66], 1 in Kuwait [56], 1 in Oman[64], 1 in Qatar [60], and 1 in the UAE [47].
The prevalence of inactivity was found to be significantlyhigher among the younger population in the region, andacross all age groups physical inactivity was higher in femalesthan males. The rates of inactivity ranged from 24.3% to93.9% inmales and from 50% to 98.1% in females in the GCC[36, 47, 60, 64, 66]. In general, the rates of physical inactivitywere considerably high in the GCC region especially SaudiArabia.
4. Discussion
This review revealed that, in the GCC region, there is a lack ofinformation on the prevalence of CHD with only exceptionin Saudi Arabia where one national survey reported 5.5%prevalence of CHD [11], which is lower than the prevalencerate reported in Egypt 8.3% [73], while it is higher than inIndia (3%), China (2%), and Europe (5%) [74, 75]. However,it is important to note that the Saudi report is relatively oldand may not reflect the current situation. The rates of ACSand associated risk factors appeared to be very similar inSaudi Arabia (SPACE report) and other Gulf states (GulfRACE report) except for diabetes, which is more prevalentin Saudi Arabia. However, the SPACE registry results came
from phase 1 (pilot study) and thus based on smaller samplesize compared to that of Gulf RACE [13, 14].
In contrast to other ACS registries around the world, theprevalence rates of diabetes and current smoking are higherin the Gulf region, while a higher prevalence of hypertensionand dyslipidaemia is observed in the Euro heart of the acutecoronary syndrome survey andCanadianACS registry [13, 14,76, 77]. The rates of diabetes are ranged from 23.3% to 25.1%in the Euro heart survey, Canadian ACS registry, and theGlobal Registry of Acute Cardiac Events (GRACE) [76, 77],while the prevalence of diabetes is much higher among theACS patients in the Gulf States especially in Saudi Arabia(56%) [13, 14]. One possible explanation for this high rateof diabetes could be due the high prevalence of obesity andphysical inactivity in the GCC region, especially in SaudiArabia. Furthermore, the mean age of presentation in theSPACE and Gulf RACE cohort is about ten years youngerthan that reported in the Euro heart survey and the GRACEcohort [13, 14, 78, 79]. This might be due to the high rates ofuncontrolled risk factors in the Gulf region as well as the highpercentage of younger populations in these countries.
The crude annual incidence of stroke in theGulf countrieswas generally lower than the reported incidence in someArabic countries, for example, Libya (63/100,000) [80] andNorthern Palestine (51.4/100,000) [81]. The incidence is evenmuch lower than that which is observed in some of thedeveloped countries such as Scotland (280/100,000) [82] andthe East Coast of Australia (206/100,000) [83]. The low ratesof strokes in the GCC countries could be explained by therelatively younger age of patients in these countries. Further,the majority of stroke studies in the region had no record onthe number of patients who died before reaching hospital,thus underestimating the actual incidence rate.
Several studies in the Gulf States have reported a highincidence of stroke at a younger age. Of the stroke patients,9.8% to 25% were less than 45 years old [17, 23, 25]. Thehigher proportion of undiagnosed hypertension and diabetesmight be a reason for younger stroke patients. One study inSaudi Arabia showed that only half of the hypertensive strokepatients were actually on medication [17]. Further, lack ofawareness about stroke in the Gulf countries might have ledto an increase in the incidence of strokes as well as the ratesof associated risk factors [84].
When looking at the burden of risk factors among healthysubjects in the GCC region, the prevalence of obesity in adultfemales is one of the highest amongst females worldwide.This review found that almost half of the females in Kuwaitand Bahrain and around 35% of females in Saudi Arabia,the UAE, and Qatar were obese. The overall prevalence ofoverweight and obesity in the GCC is higher than that whichwas reported in other Middle Eastern countries such asLebanon andTurkey [85, 86].The prevalence was even higherthan in many developed countries such as the USA and indeveloping countries such as India [87, 88].The food customsin the Gulf region, such as weddings and religious events,might be an important contributory factor for such a highrate of obesity as they serve food that is rich in fat, usually“Kabsa,” which includes meat (from sheep or small camel)

20 Advances in Public Health
with rice. Even socialising with friends and family is usuallyaround eating meals and snacks.
Likewise,more than half of theGCCpopulation are phys-ically inactive, with only a small proportion of people beingactive on a regular basis. Furthermore, the rate of inactivityappeared to be remarkably higher in Saudi Arabia than inother Gulf countries.The reviewed studies also indicated thatmales are more likely to be physically active than females, afinding similar to that was reported in Turkey and Pakistan[47].Theunique social, cultural, and environmental factors ofthe GCC states, such as hot climate, lack of outdoor facilities,the limited number of health clubs, high cost of attendingsuch clubs especially for females, high level of employment ofdomestic helpers, and the high dependency on automobilesare blamed on the increased levels of physical inactivity inboth genders but more noticeably in females. Also, femaleshave more social barriers that make it difficult for them toexercise outside the home without a family member [5, 89].
In the Gulf region, males start smoking cigarettes at anearly age (before 18 years), while females generally start after30s. Cigarette smoking by younger and unmarried females isviewed as culturally unacceptable and can potentially destroytheir reputation. However, the case is different when smokingsheesha (water-pipe) as Arabic societies in general acceptsheesha smoking by females irrespective of their age and/orsocial status.
Hypertension and diabetes are the two major risk factorsassociated with CHD and stroke patients in all studies inthe Gulf region; this might be related to the high ratesof undiagnosed hypertensive and diabetic patients withinthe region. In Saudi Arabia, about 70% of the hypertensivepeople were unaware of their disease [35]. A similar situationwas reported in Oman, the UAE, and Bahrain [44, 65, 69].Likewise, a large number of diabetic subjects in Saudi Arabia(28%) and the UAE (41%) were unaware of their disease[29, 45]. The high rates of uncontrolled diseases such ashypertension and diabetes could be a reason for the relativelyyoung age of CHD and stroke patients in the Gulf region.
The prevalence of dyslipidaemia in general is high in theGCC countries. The available national surveys indicated thathalf the Saudi population have high level of total cholesteroland almost half of the males and one-third of Saudi femaleshave high level of hypertriglyceridemia [37]. The rates of HCin Saudi Arabia are similar to that reported in USA (53.2%)[90]. Dyslipidaemia is a major risk factor for CHD and playsa central role in the development of atherosclerosis. The highrates of dyslipidaemia in theGCC countriesmay be due to thehigh prevalence of physical inactivity, obesity, and diabetesamong the Gulf populations. Also, as mentioned before, foodcustoms and the consumption of high fatty foods might becontributing factors.
This review has a number of limitations. First, there wasa lack of recent nationally representative reports in the GCCcountries, and thus it is difficult to compare the data betweenGCC countries. Second, there was significant heterogeneitybetween studies with respect to definitions of the risk factors,design, and population characteristics.Third, only a few stud-ies reported stroke incidence and the majority of them werehospital-based studies with an absence of data on Oman and
the UAE. Fourth, there were only a few studies focusing onhypertension, dyslipidaemia, and physical activity. Moreover,the number of included studies relating to the prevalence ofrisk factors in Qatar and Bahrain were also relatively low.However, the strength of this review was that the literaturesearch was conducted on multiple databases including per-sonal contact of the authors to capture all relevant documents.
5. Conclusion
The present review revealed lower incidence of strokes inthe GCC countries than in developed countries and thatthose affected were younger than in some developing anddeveloped countries. Although there was lack of nationallyrepresentative data on the prevalence of CHD in the region,high prevalence of key risk factors was observed. Further,the patterns of risk factors were very similar between theGulf countries; this may be due to the similarity in culture,religion, cuisine, lifestyle, and environmental factors betweenthese countries. With the rapid urbanization in the Gulfregion and the relatively young population, the prevalenceof CHD and strokes is expected to increase in the next fewdecades, which in turn will raise the rate of CVD mortalityand morbidity in the region. Well-designed population-based nationally representative surveys focusing on CVDand its associated risk factors are crucial in the Gulf States.Furthermore, there is a need to increase the awareness of thehigh prevalence of CVD and associated risk factors amongthe public along with education programs on nutrition andhealthier lifestyles including increase in physical activitylevels in both men and women. In addition, there is also aneed for preventative strategies, especially for type 2 diabetes,to be used in the region and the cooperation in managementstrategies, especially in obesity and diabetes is also crucialacross the region. Moreover, addressing some of the culturaland social barriers that were mentioned previously is alsoimportant for reducing the risk of CVD and related riskfactors among the GCC population.
Conflict of Interests
The authors declare that they have no competing interests.
Authors’ Contribution
Najlaa Aljefree designed the concept of study and preparedthe paper draft. Faruk Ahmed has provided guidance on thestudy design and critically reviewed the paper. All authorsread and approved the final paper.
Acknowledgments
Mrs. Najlaa Aljefree is supported by a scholarship from KingAbdul Aziz University for Nutrition and Dietetics. The KingAbdul Aziz University had no role in the design, analysis, orwriting of this paper.

Advances in Public Health 21
References
[1] S. Mendis, P. Puska, and B. Norrving, Global Atlas on Cardio-vascular Disease Prevention and Control, World Health Organi-zation, 2011.
[2] M. J. O’Donnell, X. Denis, L. Liu et al., “Risk factors for ischae-mic and intracerebral haemorrhagic stroke in 22 countries (theINTERSTROKE Study): a case-control study,” The Lancet, vol.376, no. 9735, pp. 112–123, 2010.
[3] S. Yusuf, S.Hawken, S. Ounpuu et al., “Effect of potentiallymod-ifiable risk factors associated with myocardial infarction in 52countries (the INTERHEART study): case-control study,” TheLancet, vol. 364, no. 9438, pp. 937–952, 2004.
[4] The Cooperation Council for the Arab States of the Gulf, http://www.gcc-sg.org/.
[5] R. M. Mabry, M. M. Reeves, E. G. Eakin, and N. Owen, “Evi-dence of physical activity participation amongmen and womenin the countries of the gulf cooperation council: a review,”Obesity Reviews, vol. 11, no. 6, pp. 457–464, 2010.
[6] C. M. Lawes, S. V. Hoorn, and A. Rodgers, “Global burden ofblood-pressure-related disease, 2001,” The Lancet, vol. 371, no.9623, pp. 1513–1518, 2008.
[7] WHO,Noncommunicable Diseases Country Profiles 2011, WorldHealth Organization, Geneva, Switzerland, 2011.
[8] B. Motlagh, M. O’Donnell, and S. Yusuf, “Prevalence of cardio-vascular risk factors in the middle east: a systematic review,”European Journal of Cardiovascular Prevention and Rehabilita-tion, vol. 16, no. 3, pp. 268–280, 2009.
[9] N. M. Shara, “Cardiovascular disease in Middle Easternwomen,’ ’ Nutrition, Metabolism and Cardiovascular Diseases,vol. 20, no. 6, pp. 412–418, 2010.
[10] Systematic Reviews: CRD’s Guidance for Undertaking Reviewsin Health Care, University of York, Centre for Reviews andDissemination, York, UK, 2009.
[11] M. M. Al-Nozha, M. R. Arafah, Y. Y. Al-Mazrou et al., “Coro-nary artery disease in Saudia Arabia,” Saudi Medical Journal,vol. 25, no. 9, pp. 1165–1171, 2004.
[12] A. El-Menyar, M. Zubaid, W. Rashed et al., “Comparison ofmen and women with acute coronary syndrome in six MiddleEastern countries,”TheAmerican Journal of Cardiology, vol. 104,no. 8, pp. 1018–1022, 2009.
[13] A. El-Menyar, M. Zubaid, A. Shehab et al., “Prevalence andimpact of cardiovascular risk factors among patients presentingwith acute coronary syndrome in the Middle East,” ClinicalCardiology, vol. 34, no. 1, pp. 51–58, 2011.
[14] K. F. AlHabib, A. Hersi, H. AlFaleh et al., “The Saudi Project forAssessment of Coronary Events (SPACE) registry: design andresults of a phase I pilot study,” Canadian Journal of Cardiology,vol. 25, no. 7, pp. e255–e258, 2009.
[15] S. Al Rajeh, A. Awada, G. Niazi, and E. Larbi, “Stroke in aSaudi Arabian National Guard community: analysis of 500consecutive cases froma population-based hospital,” Stroke, vol.24, no. 11, pp. 1635–1639, 1993.
[16] S. Al Rajeh, O. Bademosi, H. Ismail et al., “A community surveyof neurological disorders in Saudi Arabia: the Thugbah study,”Neuroepidemiology, vol. 12, no. 3, pp. 164–178, 1993.
[17] S. Al-Rajeh, E. B. Larbi, O. Bademosi et al., “Stroke register:experience from the eastern province of Saudi Arabia,” Cere-brovascular Diseases, vol. 8, no. 2, pp. 86–89, 1998.
[18] F. A. Qari, “Profile of stroke in a teaching university hospital inthe western region,” Saudi Medical Journal, vol. 21, no. 11, pp.1030–1033, 2000.
[19] A. Al-Jishi and P. Mohan, “Profile of stroke in Bahrain,” Neu-rosciences, vol. 5, no. 1, pp. 30–34, 2000.
[20] N. U. A. M. A. Abdul-Ghaffar, M. R. El-Sonbaty, M. S. El-Din Abdul-Baky, A. A. Marafie, and A. M. Al-Said, “Stroke inKuwait: a three-year prospective study,”Neuroepidemiology, vol.16, no. 1, pp. 40–47, 1997.
[21] S. Al-Shammri, Z. Shahid, A. Ghali et al., “Risk factors, subtypesand outcome of ischaemic stroke in Kuwait—a hospital-basedstudy,” Medical Principles and Practice, vol. 12, no. 4, pp. 218–223, 2003.
[22] A. Ashkanani, K. A. Hassan, and S. Lamdhade, “Risk factorsof stroke patients admitted to a general hospital in Kuwait,”International Journal of Neuroscience, vol. 123, no. 2, pp. 89–92,2013.
[23] N.Akhtar, S. I. Kamran,D.Deleu et al., “Ischaemic posterior cir-culation stroke in State ofQatar,”European Journal of Neurology,vol. 16, no. 9, pp. 1004–1009, 2009.
[24] D. Deleu, A. A. Hamad, S. Kamram, A. El Siddig, H. Al Hail,and S. M. K. Hamdy, “Ethnic variations in risk factor profile,pattern and recurrence of non-cardioembolic ischemic stroke,”Archives of Medical Research, vol. 37, no. 5, pp. 655–662, 2006.
[25] A. Hamad, T. E. O. Sokrab, S. Momeni, B. Mesraoua, and A.Lingren, “Stroke in Qatar: a one-year, hospital-based study,”Journal of Stroke and Cerebrovascular Diseases, vol. 10, no. 5, pp.236–241, 2001.
[26] D. Deleu, J. Inshasi, N. Akhtar et al., “Risk factors, managementand outcome of subtypes of ischemic stroke: a stroke registryfrom the Arabian Gulf,” Journal of the Neurological Sciences, vol.300, no. 1-2, pp. 142–147, 2011.
[27] B. A. Abalkhail, S. Shawky, T. M. Ghabrah, and W. A. Milaat,“Hypercholesterolemia and 5-year risk of development of coro-nary heart disease among university and school workers in Jed-dah, Saudi Arabia,” Preventive Medicine, vol. 31, no. 4, pp. 390–395, 2000.
[28] A. A. Al-Nuaim, E. A. Bamgboye, K. A. Al-Rubeaan, and Y. Al-Mazrou, “Overweight and obesity in Saudi Arabian adult pop-ulation, role of sociodemographic variables,” Journal of Com-munity Health, vol. 22, no. 3, pp. 211–223, 1997.
[29] M. M. Al-Nozha, M. A. Al-Maatouq, Y. Y. Al-Mazrou et al.,“Diabetes mellitus in Saudi Arabia,” Saudi Medical Journal, vol.25, no. 11, pp. 1603–1610, 2004.
[30] T. J. Hashim, “Smoking habits of students in College of AppliedMedical Science, Saudi Arabia,” Saudi Medical Journal, vol. 21,no. 1, pp. 76–80, 2000.
[31] A. Rahman Al-Nuaim, “High prevalence of metabolic riskfactors for cardiovascular diseases among Saudi population,aged 30–64 years,” International Journal of Cardiology, vol. 62,no. 3, pp. 227–235, 1997.
[32] M. M. Al-Nozha, Y. Y. Al-Mazrou, M. A. Al-Maatouq et al.,“Obesity in Saudi Arabia,” Saudi Medical Journal, vol. 26, no.5, pp. 824–829, 2005.
[33] K. A. Kalantan, A. G. Mohamed, A. A. Al-Taweel, and H.M. Abdul Ghani, “Hypertension among attendants of primaryhealth care centers in Al-Qassim region, Saudi Arabia,” SaudiMedical Journal, vol. 22, no. 11, pp. 960–963, 2001.
[34] S. A. Al-Refaee and H. M. Al-Hazzaa, “Physical activity profileof adult males in Riyadh City,” Saudi Medical Journal, vol. 22,no. 9, pp. 784–789, 2001.
[35] M. M. Al-Nozha, M. Abdullah, M. R. Arafah et al., “Hyperten-sion in Saudi Arabia,” Saudi Medical Journal, vol. 28, no. 1, pp.77–84, 2007.

22 Advances in Public Health
[36] M. M. Al-Nozha, H. M. Al-Hazzaa, M. R. Arafah et al., “Prev-alence of physical activity and inactivity among Saudis aged30–70 years: a population-based cross-sectional study,” SaudiMedical Journal, vol. 28, no. 4, pp. 559–568, 2007.
[37] M. M. Al-Nozha, M. R. Arafah, M. A. Al-Maatouq et al.,“Hyperlipidemia in Saudi Arabia,” Saudi Medical Journal, vol.29, no. 2, pp. 282–287, 2008.
[38] N. S. Al-Haddad, T. A. Al-Habeeb, M. H. Abdelgadir, Y. S. Al-Ghamdy, andN. A.Qureshi, “Smoking patterns among primaryhealth care attendees, Al-Qassim region, Saudi Arabia,” EasternMediterranean Health Journal, vol. 9, no. 5-6, pp. 911–922, 2003.
[39] N. A. Al-Baghli, A. J. Al-Ghamdi, K. A. Al-Turki, A. G. El-Zubaier, M. Al-Ameer, and F. A. Al-Baghli, “Overweight andobesity in the eastern province of Saudi Arabia,” Saudi MedicalJournal, vol. 29, no. 9, pp. 1319–1325, 2008.
[40] I. A. Hakim, M. A. Alsaif, A. Aloud et al., “Black tea consump-tion and serum lipid profiles in Saudi women: a cross-sectionalstudy in Saudi Arabia,” Nutrition Research, vol. 23, no. 11, pp.1515–1526, 2003.
[41] F. Y. Abdel-Megeid, H. M. Abdelkarem, and A. M. El-Fetouh,“Unhealthy nutritional habits in university students are a riskfactor for cardiovascular diseases,” Saudi Medical Journal, vol.32, no. 6, pp. 621–627, 2011.
[42] F. Midhet, A. R. Al Mohaimeed, and F. Sharaf, “Dietary prac-tices, physical activity and health education in qassim region ofSaudi Arabia,” International Journal Of Health Sciences, vol. 4,no. 1, pp. 3–10, 2010.
[43] C. Hajat, O. Harrison, and Z. Al Siksek, “Weqaya: A population-wide cardiovascular screening program in Abu Dhabi, UnitedArab Emirates,”The American Journal of Public Health, vol. 102,no. 5, pp. 909–914, 2012.
[44] Y. El-Shahat, S. Z. Bakir, N. Farjou et al., “Hypertension inUAE citizens-preliminary results of a prospective study,” SaudiJournal of KidneyDiseases and Transplantation, vol. 10, no. 3, pp.376–381, 1999.
[45] M. Malik, A. Bakir, B. Abi Saab, G. Roglic, and H. King, “Glu-cose intolerance and associated factors in the multi-ethnicpopulation of the United Arab Emirates: results of a nationalsurvey,” Diabetes Research and Clinical Practice, vol. 69, no. 2,pp. 188–195, 2005.
[46] A. O. Carter, H. F. Saadi, R. L. Reed, and E. V. Dunn, “Assess-ment of obesity, lifestyle, and reproductive health needs offemale citizens of Al Ain, United Arab Emirates,” Journal ofHealth, Population and Nutrition, vol. 22, no. 1, pp. 75–83, 2004.
[47] R. Guthold, T. Ono, K. L. Strong, S. Chatterji, and A. Morabia,“Worldwide variability in physical inactivity: a 51-Country Sur-vey,”TheAmerican Journal of PreventiveMedicine, vol. 34, no. 6,pp. 486–494, 2008.
[48] T. Al-Sarraj, H. Saadi, J. S. Volek, and M. L. Fernandez, “Met-abolic syndrome prevalence, dietary intake, and cardiovascularrisk profile among overweight and obese adults 18–50 years oldfrom the united arab emirates,”Metabolic Syndrome and RelatedDisorders, vol. 8, no. 1, pp. 39–46, 2010.
[49] A. Kerkadi, “Evaluation of nutritional status of united arabemirates university female students,” Emirates Journal of Foodand Agriculture, vol. 15, no. 2, pp. 42–50, 2003.
[50] A. O. Musaiger and N. M. Abuirmeileh, “Food consumptionpatterns of adults in the United Arab Emirates,” The Journal ofThe Royal Society for the Promotion of Health, vol. 118, no. 3, pp.146–150, 1998.
[51] N. Abdella, M. Al Arouj, A. Al Nakhi, A. Al Assoussi, andM.Moussa, “Non-insulin-dependent diabetes in Kuwait: preva-lence rates and associated risk factors,” Diabetes Research andClinical Practice, vol. 42, no. 3, pp. 187–196, 1998.
[52] A.Memon, P.M.Moody, T. N. Sugathan et al., “Epidemiology ofsmoking among Kuwaiti adults: prevalence, characteristics, andattitudes,” Bulletin of theWorld Health Organization, vol. 78, no.11, pp. 1306–1315, 2000.
[53] F. Ahmed, C. Waslien, M. Al-Sumaie, and P. Prakash, “Trendsand risk factors of hypercholesterolemia among Kuwaiti adults:National Nutrition Surveillance Data from 1998 to 2009,”Nutrition, vol. 28, no. 9, pp. 917–923, 2012.
[54] I. Al Rashdan and Y. Al Nesef, “Prevalence of overweight,obesity, and metabolic syndrome among adult Kuwaitis: resultsfrom community-based national survey,” Angiology, vol. 61, no.1, pp. 42–48, 2010.
[55] F. Ahmed, C. Waslien, M. A. Al-Sumaie, and P. Prakash,“Secular trends and risk factors of overweight and obesityamong Kuwaiti adults: National Nutrition Surveillance Systemdata from 1998 to 2009,” Public Health Nutrition, vol. 15, no. 11,pp. 2124–2130, 2012.
[56] F. Ahmed, C. Waslien, M. A. Al-Sumaie, P. Prakash, and A.Allafi, “Trends and risk factors of hyperglycemia and diabetesamong Kuwaiti adults: National Nutrition Surveillance Datafrom 2002 to 2009,” BMC Public Health, vol. 13, no. 1, article 103,2013.
[57] H. R. Mohammed, I. M. Newman, and R. Tayeh, “Sheeshasmoking among a sample of future teachers in Kuwait,” KuwaitMedical Journal, vol. 38, no. 2, article 107, 2006.
[58] A. Bener, J. Al-Suwaidi, K. Al-Jaber, S. Al-Marri, and I. E. A.Elbagi, “Epidemiology of hypertension and its associated riskfactors in the Qatari population,” Journal of Human Hyperten-sion, vol. 18, no. 7, pp. 529–530, 2004.
[59] A. Bener, M. Zirie, I. M. Janahi, A. O. A. A. Al-Hamaq, M.Musallam, and N. J. Wareham, “Prevalence of diagnosed andundiagnosed diabetes mellitus and its risk factors in a popula-tion-based study of Qatar,”Diabetes Research and Clinical Prac-tice, vol. 84, no. 1, pp. 99–106, 2009.
[60] A. O. Musaiger, F. A. Al-Khalaf, and N. E. Shahbeek, “Risk fac-tors for cardiovascular disease among women attending healthcenters in Qatar,” Emirates Journal of Food and Agriculture, vol.6, no. 1, pp. 188–200, 1994.
[61] A. A. Al Riyami and M. Afifi, “Smoking in Oman: prevalenceand characteristics of smokers,” Eastern Mediterranean HealthJournal, vol. 10, no. 4-5, pp. 600–609, 2004.
[62] S. Al-Moosa, S. Allin, N. Jemiai, J. Al-Lawati, and E. Mossialos,“Diabetes and urbanization in the Omani population: ananalysis of national survey data,” Population HealthMetrics, vol.4, article 5, 2006.
[63] J. A. Al-Lawati and P. J. Jousilahti, “Prevalence and 10-yearsecular trend of obesity in Oman,” Saudi Medical Journal, vol.25, no. 3, pp. 346–351, 2004.
[64] J. A. Al-Lawati and P. Jousilahti, “Body mass index, waist cir-cumference and waist-to-hip ratio cut-off points for categorisa-tion of obesity among Omani Arabs,” Public Health Nutrition,vol. 11, no. 1, pp. 102–108, 2008.
[65] A. Al Riyami, M. A. Abd Elaty, M. Morsi, H. Al Kharusi, W.Al Shukaily, and S. Jaju, “Oman World Health Survey: part 1—methodology, sociodemographic profile and epidemiology ofnon-communicable diseases in Oman,” Oman Medical Journal,vol. 27, no. 5, pp. 425–443, 2012.

Advances in Public Health 23
[66] F. Al-Mahroos and K. Al-Roomi, “Obesity among adult Bah-raini population: impact of physical activity and educationallevel,” Annals of Saudi Medicine, vol. 21, no. 3-4, pp. 183–187,2001.
[67] A. O. Musaiger and M. A. Al-Mannai, “Social and lifestyle fac-tors associated with diabetes in the adult Bahraini population,”Journal of Biosocial Science, vol. 34, no. 2, pp. 277–281, 2002.
[68] A. O. Musaiger and M. A. Al-Mannai, “Weight, height, bodymass index and prevalence of obesity among the adult popula-tion in Bahrain,” Annals of Human Biology, vol. 28, no. 3, pp.346–350, 2001.
[69] F. Al-Mahroos, K. Al-Roomi, and P. M. McKeigue, “Relation ofhigh blood pressure to glucose intolerance, plasma lipids andeducational status in an ArabianGulf population,” InternationalJournal of Epidemiology, vol. 29, no. 1, pp. 71–76, 2000.
[70] F. Al-Mahroos and P. M. Mckeigue, “High prevalence of dia-betes in bahrainis: associations with ethnicity and raised plasmacholesterol,” Diabetes Care, vol. 21, no. 6, pp. 936–942, 1998.
[71] R. R. Hamadeh and A. O. Musaiger, “Lifestyle patterns insmokers and non-smokers in the state of Bahrain,” Nicotine &Tobacco Research, vol. 2, no. 1, pp. 65–69, 2000.
[72] F. I. Al Zurba and A. Al Garf, “Prevalence of diabetes mellitusamong Bahrainis attending primary health care centres,” East-ern Mediterranean Health Journal, vol. 2, no. 2, pp. 274–282,1996.
[73] W. Almahmeed, M. S. Arnaout, R. Chettaoui et al., “Coronaryartery disease in Africa and the Middle East,”Therapeutics andClinical Risk Management, vol. 8, pp. 65–72, 2012.
[74] S. S. Anand, S. Yusuf, V. Vuksan et al., “Differences in riskfactors, atherosclerosis, and cardiovascular disease betweenethnic groups in Canada: the Study of Health Assessment andRisk in Ethnic groups (SHARE),”The Lancet, vol. 356, no. 9226,pp. 279–284, 2000.
[75] R. Gupta, P. Joshi, V. Mohan, K. S. Reddy, and S. Yusuf, “Epide-miology and causation of coronary heart disease and stroke inIndia,” Heart, vol. 94, no. 1, pp. 16–26, 2008.
[76] A. T. Yan, P. Jong, R. T. Yan et al., “Clinical trial-derived riskmodel may not generalize to real-world patients with acute cor-onary syndrome,” American Heart Journal, vol. 148, no. 6, pp.1020–1027, 2004.
[77] A. Rosengren, L. Wallentin, M. Simoons et al., “Cardiovascularrisk factors and clinical presentation in acute coronary syn-dromes,” Heart, vol. 91, no. 9, pp. 1141–1147, 2005.
[78] D. Hasdai, S. Behar, L. Wallentin et al., “A prospective surveyof the characteristics, treatments and outcomes of patients withacute coronary syndromes in Europe and the Mediterraneanbasin: the Euro Heart Survey of Acute Coronary Syndromes(Euro Heart Survey ACS),” European Heart Journal, vol. 23, no.15, pp. 1190–1201, 2002.
[79] K. A. A. Fox, S. G. Goodman, F. A. Anderson Jr. et al.,“From guidelines to clinical practice: the impact of hospital andgeographical characteristics on temporal trends in the man-agement of acute coronary syndromes: the Global Registry ofAcute Coronary Events (GRACE),”EuropeanHeart Journal, vol.24, no. 15, pp. 1414–1424, 2003.
[80] P. P. Ashok, K. Radhakrishnan, R. Sridharan, and M. A. El-Mangoush, “Incidence and pattern of cerebrovascular diseasesin Benghazi, Libya,” Journal of Neurology Neurosurgery andPsychiatry, vol. 49, no. 5, pp. 519–523, 1986.
[81] W. M. Sweileh, A. F. Sawalha, S. M. Al-Aqad, S. H. Zyoud,and S. W. Al-Jabi, “The epidemiology of stroke in northern
palestine: a 1-year, hospital-based study,” Journal of Stroke andCerebrovascular Diseases, vol. 17, no. 6, pp. 406–411, 2008.
[82] P. D. Syme, A. W. Byrne, R. Chen, R. Devenny, and J. F. Forbes,“Community-based stroke incidence in a Scottish population:the Scottish borders stroke study,” Stroke, vol. 36, no. 9, pp. 1837–1843, 2005.
[83] A. G. Thrift, H. M. Dewey, R. A. L. Macdonell, J. J. McNeil, andG. A. Donnan, “Stroke incidence on the east coast of Australia:the North EastMelbourne Stroke Incidence Study (NEMESIS),”Stroke, vol. 31, no. 9, pp. 2087–2092, 2000.
[84] S. Kamran, A. B. Bener, D. Deleu et al., “The level of awarenessof stroke risk factors and symptoms in the Gulf CooperationCouncil countries: Gulf Cooperation Council stroke awarenessstudy,” Neuroepidemiology, vol. 29, no. 3-4, pp. 235–242, 2008.
[85] A. M. Sibai, N. Hwalla, N. Adra, and B. Rahal, “Prevalence andcovariates of obesity in Lebanon: findings from the first epide-miological study,”Obesity Research, vol. 11, no. 11, pp. 1353–1361,2003.
[86] C. Erem, C. Arslan, A. Hacihasanoglu et al., “Prevalence ofobesity and associated risk factors in a Turkish population(Trabzon City, Turkey),”Obesity Research, vol. 12, no. 7, pp. 1117–1127, 2004.
[87] C. L. Ogden, M. D. Carroll, L. R. Curtin, M. A. McDowell, C. J.Tabak, and K. M. Flegal, “Prevalence of overweight and obesityin the United States, 1999–2004,” The Journal of the AmericanMedical Association, vol. 295, no. 13, pp. 1549–1555, 2006.
[88] A. Misra, R. M. Pandey, J. R. Devi, R. Sharma, N. K. Vikram,and N. Khanna, “High prevalence of diabetes, obesity and dys-lipidaemia in urban slum population in northern India,” Inter-national Journal of Obesity, vol. 25, no. 11, pp. 1722–1729, 2001.
[89] A. M. Sibai, L. Nasreddine, A. H. Mokdad, N. Adra, M. Tabet,andN. Hwalla, “Nutrition transition and cardiovascular diseaserisk factors in middle East and North Africa countries: review-ing the evidence,” Annals of Nutrition &Metabolism, vol. 57, no.3-4, pp. 193–203, 2011.
[90] E. S. Ford, C. Li, W. S. Pearson, G. Zhao, and A. H. Mokdad,“Trends in hypercholesterolemia, treatment and control amongUnited States adults,” International Journal of Cardiology, vol.140, no. 2, pp. 226–235, 2010.

Submit your manuscripts athttp://www.hindawi.com
Stem CellsInternational
Hindawi Publishing Corporationhttp://www.hindawi.com Volume 2014
Hindawi Publishing Corporationhttp://www.hindawi.com Volume 2014
MEDIATORSINFLAMMATION
of
Hindawi Publishing Corporationhttp://www.hindawi.com Volume 2014
Behavioural Neurology
EndocrinologyInternational Journal of
Hindawi Publishing Corporationhttp://www.hindawi.com Volume 2014
Hindawi Publishing Corporationhttp://www.hindawi.com Volume 2014
Disease Markers
Hindawi Publishing Corporationhttp://www.hindawi.com Volume 2014
BioMed Research International
OncologyJournal of
Hindawi Publishing Corporationhttp://www.hindawi.com Volume 2014
Hindawi Publishing Corporationhttp://www.hindawi.com Volume 2014
Oxidative Medicine and Cellular Longevity
Hindawi Publishing Corporationhttp://www.hindawi.com Volume 2014
PPAR Research
The Scientific World JournalHindawi Publishing Corporation http://www.hindawi.com Volume 2014
Immunology ResearchHindawi Publishing Corporationhttp://www.hindawi.com Volume 2014
Journal of
ObesityJournal of
Hindawi Publishing Corporationhttp://www.hindawi.com Volume 2014
Hindawi Publishing Corporationhttp://www.hindawi.com Volume 2014
Computational and Mathematical Methods in Medicine
OphthalmologyJournal of
Hindawi Publishing Corporationhttp://www.hindawi.com Volume 2014
Diabetes ResearchJournal of
Hindawi Publishing Corporationhttp://www.hindawi.com Volume 2014
Hindawi Publishing Corporationhttp://www.hindawi.com Volume 2014
Research and TreatmentAIDS
Hindawi Publishing Corporationhttp://www.hindawi.com Volume 2014
Gastroenterology Research and Practice
Hindawi Publishing Corporationhttp://www.hindawi.com Volume 2014
Parkinson’s Disease
Evidence-Based Complementary and Alternative Medicine
Volume 2014Hindawi Publishing Corporationhttp://www.hindawi.com