
National Cooperative Highway Research Program...
21
National Cooperative Highway Research Program RESEARCH RESULTS DIGEST December 2003—Number 284 Subject Areas: IIB Pavement Design, Management, Responsible Senior Program Officer: Edward T. Harrigan and Performance and IIIB Materials and Construction Refining the Calibration and Validation of Hot Mix Asphalt Performance Models: An Experimental Plan and Database This digest summarizes key findings from NCHRP Project 9-30, “Experimental Plan for Calibration and Validation of Hot Mix Asphalt Performance Models for Mix and Structural Design,” conducted by Fugro-BRE, Inc. The digest is an abridgement of portions of the project final report authored by the principal investigator, Harold L. Von Quintus, P.E., Fugro-BRE, Inc.; Charles Schwartz, Ph.D., P.E., University of Maryland–College Park; Richard H. McCuen, Ph.D., University of Maryland–College Park; and Dragos Andrei, Ph.D., Fugro-BRE, Inc. INTRODUCTION This digest summarizes findings from research conducted under NCHRP Project 9-30 with the objective of developing a detailed, statistically sound, and practical experimental plan to refine the calibration and validation of the performance models incorporated in the pavement design guide (hereinafter referred to as the 2002 Design Guide) produced in NCHRP Project 1-37A with laboratory- measured hot mix asphalt (HMA) material prop- erties. NCHRP Project 1-37A, entitled “Development of the 2002 Guide for the Design of New and Rehabilitated Pavement Structures: Phase II,” identified state-of-the-practice performance models and supporting test methods for use in the 2002 Design Guide. Present plans call for adapting these same performance models to the requirements of the HMA mix design. Using these tools, the engi- neer will arrive at a final mix design by consider- ing structural, traffic, and environmental factors, in addition to material properties, thus fulfilling the original goal of the 1993 Strategic Highway Research Program (SHRP) Superpave mix design and analysis method. In Project 1-37A, an analytical approach was used for the calibration and validation of the HMA models; the calibration and validation were based on material properties either contained in the Long Term Pavement Performance (LTPP) database or derived from LTPP data by calculation. This digest presents an experimental plan for refining the calibra- tion and validation of these models with measured material properties and briefly describes a support- ing mechanistic-empirical (M-E) database devel- oped in NCHRP Project 9-30. CONFIRMATION OF MECHANISTIC- EMPIRICAL DISTRESS PREDICTION MODELS Pavement distress prediction models, or trans- fer functions, are the key components of any M-E design and analysis procedure. Calibration and validation of these prediction models are manda- tory steps in the development process to establish confidence in the design-analysis procedure and facilitate its acceptance and use. The term calibra- tion refers to the mathematical process through which the total error or difference between observed and predicted values of distress is minimized. The term validation refers to the process to confirm that the calibrated model can produce robust and accurate predictions for cases other than those used for model calibration. A successful validation process requires that the bias and precision statistics of the model obtained for the validation data set be simi- lar to those obtained during calibration. Pavement design is a complex process that involves uncertainty, variability, and approxima-
Transcript of National Cooperative Highway Research Program...

National Cooperative Highway Research Program
RESEARCH RESULTS DIGESTDecember 2003—Number 284
Subject Areas: IIB Pavement Design, Management, Responsible Senior Program Officer: Edward T. Harriganand Performance and IIIB Materials and Construction
Refining the Calibration and Validation of Hot Mix AsphaltPerformance Models: An Experimental Plan and Database
This digest summarizes key findings from NCHRP Project 9-30, “Experimental Plan for Calibration and Validation ofHot Mix Asphalt Performance Models for Mix and Structural Design,” conducted by Fugro-BRE, Inc.
The digest is an abridgement of portions of the project final report authored by the principal investigator,Harold L. Von Quintus, P.E., Fugro-BRE, Inc.; Charles Schwartz, Ph.D., P.E., University of Maryland–College Park;
Richard H. McCuen, Ph.D., University of Maryland–College Park; and Dragos Andrei, Ph.D., Fugro-BRE, Inc.
INTRODUCTION
This digest summarizes findings from researchconducted under NCHRP Project 9-30 with theobjective of developing a detailed, statisticallysound, and practical experimental plan to refinethe calibration and validation of the performancemodels incorporated in the pavement design guide(hereinafter referred to as the 2002 Design Guide)produced in NCHRP Project 1-37A with laboratory-measured hot mix asphalt (HMA) material prop-erties.
NCHRP Project 1-37A, entitled “Developmentof the 2002 Guide for the Design of New andRehabilitated Pavement Structures: Phase II,”identified state-of-the-practice performance modelsand supporting test methods for use in the 2002Design Guide. Present plans call for adapting thesesame performance models to the requirements ofthe HMA mix design. Using these tools, the engi-neer will arrive at a final mix design by consider-ing structural, traffic, and environmental factors,in addition to material properties, thus fulfillingthe original goal of the 1993 Strategic HighwayResearch Program (SHRP) Superpave mix designand analysis method.
In Project 1-37A, an analytical approach wasused for the calibration and validation of the HMAmodels; the calibration and validation were basedon material properties either contained in the LongTerm Pavement Performance (LTPP) database or
derived from LTPP data by calculation. This digestpresents an experimental plan for refining the calibra-tion and validation of these models with measuredmaterial properties and briefly describes a support-ing mechanistic-empirical (M-E) database devel-oped in NCHRP Project 9-30.
CONFIRMATION OF MECHANISTIC-EMPIRICAL DISTRESS PREDICTIONMODELS
Pavement distress prediction models, or trans-fer functions, are the key components of any M-Edesign and analysis procedure. Calibration andvalidation of these prediction models are manda-tory steps in the development process to establishconfidence in the design-analysis procedure andfacilitate its acceptance and use. The term calibra-tion refers to the mathematical process throughwhich the total error or difference between observedand predicted values of distress is minimized. Theterm validation refers to the process to confirmthat the calibrated model can produce robust andaccurate predictions for cases other than those usedfor model calibration. A successful validation processrequires that the bias and precision statistics of themodel obtained for the validation data set be simi-lar to those obtained during calibration.
Pavement design is a complex process thatinvolves uncertainty, variability, and approxima-
2
CONTENTS
Introduction, 1
Confirmation of Mechanistic-Empirical Distress Prediction Models, 1
Distress-Performance Observations Included in the Plan, 4Pavement Types and Rehabilitation Strategies, 4Mixture Properties and Tests, 4
Initial Calibration of 2002 Design Guide Prediction Models, 5
Jackknife Testing to Refine Model Calibration and Validation, 8
Experimental Plan and Matrix for Refining Calibration and Validation, 9Matrix Stratification Approach, 9Experimental Test Sections and Related Requirements, 10Field Forensic and Evaluation Studies, 15Materials Testing Plan, 16
Preliminary Schedule and Budget, 17
Mechanistic-Empirical Database for Model Calibration and Validation, 18Microsoft Access Database, 18Characteristics and Features of the Database, 18Population of Database, 20
References, 21

3
tions of all input parameters. Even though mechanistic con-cepts provide a more rational and realistic methodology toaccount for such variations and approximations, all cali-brated models will have an error associated with them. Thiserror explains the scatter in the data about the line of equal-ity between the predicted and observed values of distress.The calibration process is used to determine the accuracy orthe standard error estimate (Se) of the predictions and themajor components of the error term.
All performance models in the 2002 Design Guide werecalibrated and validated on a global level to observed fieldperformance at a representative set of pavement test sitesaround North America. LTPP test sections were used exten-sively in the calibration-validation process because of theconsistency in the monitored data over time and the diver-sity of test sections spread throughout North America.
The highest-quality calibration of prediction modelsrequires the testing and characterization of HMA, unboundpavement materials, and subgrade soils at selected field sites.
No laboratory testing was completed as a part of NCHRPProject 1-37A; it was assumed that the material propertiesand other inputs needed for the calibration process wereavailable from existing databases. However, this assump-tion was proven incorrect.
Many of the material property and site feature inputsfor the 2002 Design Guide were unavailable from the LTPPdatabase. Because of the limited number of pavement testsites with all levels of input data, minimal testing of selectedproperties, the use of calculated properties from regressionequations, and the global scope of the calibration effort, thepredictions from the calibrated models have a relatively highlevel of uncertainty and a limited inference space of applica-tion. Table 1 lists the standard error of each distress predic-tion model reported by the Project 1-37A research team inJuly 2003.
The standard error of the rutting model is relatively low,while the errors for the fracture models are relatively high.Tighter calibration of the fracture models based upon mea-
TABLE 1 Summary of the standard error for each distress prediction model included in the2002 Design Guide software (as of July 2003)
Distress Prediction
Model
Design Level
or Pavement
Type
Standard
Error of
Model
Error Model, Standard
Deviation1
HMA 0.14 ( ) 001.01282.0406.0 +TotalRD
Soil, Coarse-
Grained( ) 001.01361.0
6501.0 +SubgradeRDRutting or Permanent
Deformation, inchesSoil, Fine-
Grained( ) 001.01008.0
3139.0 +SubgradeRD
Load-Related Fatigue
Cracks—Area Cracking,
ft2/500 ft.
( )( )
++ +− 001.0221
1.9957.32
DLoge
Load-Related Fatigue
Cracks—Longitudinal
Cracking, ft/500 ft.
( )( )
++ +− 0001.08527.2772.01
8.11477
DLoge
Level 1
( )( )
++ − TCe 0025.031
2419
Level 2
( )( )
++ − TCe 0025.031
2419
Non-Load-Related
Cracks—Transverse or
Thermal CracksLevel 3
( )( )
++ − TCe 0025.031
2419
Conventional 0.386
Deep-Strength 0.292
Semi-Rigid 0.229
HMA over
Flexible0.179
Smoothness, 2 as measured
by IRI, m/km
HMA over
Rigid
0.197
Notes:
1. Where:
D = Fatigue damage index.
RDTotal = Total rut depth.
TC = Length of Thermal Cracks.
2. Smoothness is calculated using regression models relating increases in various distress values to
decreases in smoothness; M-E models are not used directly.

4
sured material properties, design and construction practices,and performance histories from a more localized regionshould yield better predictive accuracy. More importantly,there is a need to obtain consistent data that can be used formultiple outcomes, including the calibration-validation ofHMA mixture and structural design procedures, perfor-mance-related specifications, and management of HMApavements. Thus, the experimental plan and M-E databasedeveloped under NCHRP Project 9-30 to confirm and vali-date the distress prediction models for mixture and struc-tural design were required to be applicable to other uses toreduce the amount of duplication and costs of future projects.
DISTRESS-PERFORMANCE OBSERVATIONSINCLUDED IN THE PLAN
Distress prediction models are the backbone of the 2002Design Guide procedure as well as any other design-analysisprocedure based on M-E principles. However, the 2002Design Guide is one of the first such procedures to includethe capability to accumulate damage on a monthly basis (orbimonthly basis, depending on frost conditions) over theentire design period. This approach attempts to simulate how“real world” pavement damage occurs incrementally, loadby load, over continuous time periods. By accumulatingdamage monthly, the design procedure is very versatile andcomprehensive.
The 2002 Design Guide includes M-E models for dis-tortion (rutting in each layer), load-related cracking (bothsurface-initiated and bottom-initiated cracks), non-load-related cracking, and smoothness. Reflection cracking is notincluded because no model was judged suitable for imple-mentation in the 2002 Design Guide based on the scope of
work and ground rules established by NCHRP.1 The finaloutput from the performance prediction system is predictedmagnitudes of pavement distress over time.
Pavement Types and Rehabilitation Strategies
The pavement types and rehabilitation strategies thatwere considered in developing the 1-37A calibration andvalidation experimental factorials and in selecting pavementtest sections are listed in Table 2. Table 3 summarizes thedistresses and deterioration parameters considered for eachpavement type and rehabilitation strategy.
Mixture Properties and Tests
Table 4 provides a generic tabulation of material prop-erties that are considered important for calibrating and vali-dating distress prediction models used for HMA mixtureand structural design, performance-related specifications,and management of HMA pavement structures. The high-lighted material properties are needed for the 2002 DesignGuide. Table 5 tabulates the tests that are recommended formeasuring the fundamental material properties included inTable 4.
TABLE 2 Summary of the pavement types and rehabilitation strategies that were used in the calibration and validationof the 2002 Design Guide performance prediction models
1A fundamental “ground rule” for the 2002 Design Guide develop-ment was that it be based on existing models and technology. No develop-ment of new models or significant enhancement of existing models wasallowed.
Family of HMA Pavements & Rehabilitation Strategies
New ConstructionHMA Overlay of HMA
Pavement
HMA Overlay of Intact
PCC
HMA Overlay of
Fractured Slabs
1. Conventional – thin HMA
surface with untreated
aggregate base
5. Unmilled surface or
minimal surface preparation
prior to overlay
7. JPCP 10. Rubblized PCC
2. Deep strength HMA
pavement
6. Mill surface or extensive
surface preparation & repairs
prior to overlay
8. JRCP 11. Break and seat JRCP
3. Full-depth HMA pavement9. CRCP 12. Crack and seat JPCP
4. Semi-rigid pavement
Note: Twelve types of HMA pavements were considered in the NCHRP Project 1-37A calibration factorial, as listed above.

5
INITIAL CALIBRATION OF 2002 DESIGN GUIDEPREDICTION MODELS
The performance prediction models included in the2002 Design Guide were calibrated using data from nearly150 LTPP test sections, as well as from the ongoing Minne-sota Road Research Project (MnROAD) and the AASHORoad Test conducted between 1958 and 1961. However,
most of the HMA fundamental properties required in sup-port of the performance prediction equations were not avail-able in the LTPP and AASHO databases. These and otherinputs were estimated from regression equations, and, insome cases, a “best-guessed” value was used. These mixtureproperty estimates increased the uncertainty of the predic-tions and overall error between the predicted and observedperformance values.
TABLE 3 Distresses and deterioration parameters considered in the 2002 Design Guide for each family of pavement andrehabilitation strategy
Distress Type & Deterioration Parameters
Rutting1
Fatigue Cracking2
Other Cracking3
Pavement TypeTotal,
SurfaceHMA Base Subg.
Initiate,
Bottom
Initiate,
SurfaceThermal Reflect.
Rutting
Variance
IRI –
Ride
Quality
Thin HMA
Surface, Thick
Aggr. Base
Yes Yes Yes Yes Yes No Yes NA Yes Yes
Deep Strength Yes Yes Yes Yes Yes No Yes NA Yes Yes
Full Depth Yes Yes NA Yes Yes No Yes NA Yes Yes
Semi-Rigid Yes Yes NA Yes Yes No Yes NA Yes Yes
HMA Overlay Yes Yes NA NA Yes No Yes No Yes Yes
Mill Prior to
Overlay Yes Yes NA NA Yes No Yes No Yes Yes
HMA Overlay of
Intact JPCP
Slabs
Yes Yes NA NA NA No No No Yes Yes
HMA Overlay of
Intact JRCP
Slabs
Yes Yes NA NA NA No No No Yes Yes
HMA Overlay of
CRCP Yes Yes NA NA NA No Yes No Yes Yes
HMA Overlay of
Rubb. PCC Yes Yes Yes Yes Yes No Yes NA Yes Yes
HMA Overlay of
Break & Seat –
JRCP
Yes Yes NA Yes NA No Yes No Yes Yes
HMA Overlay of
Crack & Seat –
JPCP
Yes Yes NA Yes NA No Yes No Yes Yes
Notes:1 The individual layer rut depths were not confirmed through the calibration process because trenching studies were unavailable
for the LTPP test sections.2 Damage indices were computed throughout the HMA layer. However, the greatest damage always occurred at the bottom of
the HMA layer, as classical fatigue cracking initiated at the bottom of the layer. Without core studies, the reality of this finding
and model accuracy for the LTPP test sections could not be confirmed.3 Reflection cracking was not included in the calibration work, because no M-E model was included in the 2002 Design Guide.

6
A three-level hierarchical approach for defining thedesign inputs to the program was selected to simplify andfacilitate the implementation process of the 2002 DesignGuide. Level 1 inputs provide the highest level of accuracyand the lowest level of uncertainty or error in the design. Adesign based on Level 1 inputs requires laboratory or fieldtests or measurements to determine the requisite traffic,materials, and environmental inputs. Level 2 inputs providean intermediate level of design accuracy; such a design isprobably closest to the typical procedures used with the cur-rent and previous editions of the AASHTO Guide for Designof Pavement Structures. This level of input data could beused when resources or testing equipment needed for Level 1
data are not available. Input data might be user selected(possibly from an agency database), derived from a limitedtest program, or estimated through correlations. Level 3inputs provide the lowest level of accuracy; input data mightbe user-selected values or typical regional averages.
This hierarchical approach will allow state agencieswith little experience in more advanced material character-ization or agencies with little historical truck traffic data touse the program with a relatively low investment cost. How-ever, the hierarchical approach complicates the calibration-validation process and increases the number of data elementsthat need to be considered in developing the database torefine the M-E design and analysis procedures. Ideally, the
TABLE 4 Material properties considered important for predicting performance of HMA mixtures or estimating the life ofHMA pavements and overlays using different M-E distress prediction models
continues
Performance IndicatorMix/Pavement
Parameter and
Test TypeRut Depth
Fatigue
Cracking
Thermal
Cracking
Reflection
CrackingSmoothness
Other
Distresses
HMA Mixture Fundamental/Mechanical Properties
Dynamic Modulus
Master Curve√√√√ √√√√
Compressive
Resilient Modulus√√√√ √√√√
Shear Modulus
Master Curve√√√√
IDT Compliance
Master Curve√√√√
Flow Time in
Compression√√√√
Flow Number in
Compression√√√√
Slope/Intercept,
Uniaxial Permanent
Deformation
√√√√
Slope/Intercept,
Shear Permanent
Deformation
√√√√
IDT Resilient
Moduls√√√√ √√√√ √√√√ √√√√
IDT Strength √√√√ √√√√ √√√√ √√√√
IDT Strain at
Failure√√√√ √√√√ √√√√ √√√√
Fatigue Strength √√√√ √√√√
HMA Thermal
Coefficient√√√√
HMA Phase Angle √√√√ √√√√
HMA Dissipated
Energy/Work√√√√

7
TABLE 4 (continued)
Performance IndicatorMix/Pavement
Parameter and
Test TypeRut Depth
Fatigue
Cracking
Thermal
Cracking
Reflection
CrackingSmoothness
Other
Distresses
HMA Volumetric/Component Properties
Asphalt viscosity @
70F√√√√ √√√√
Asphalt viscosity @
135C+ +
Asphalt Viscosity-
Temp. Relationship√√√√ √√√√
Asphalt Penetration
Index√√√√
Eff. Asphalt
Content by Volume√√√√ √√√√ √√√√ √√√√
Asphalt Content by
Weight√√√√ √√√√ √√√√
Air Voids of Mix √√√√ √√√√ √√√√ √√√√
Voids in Mineral
Aggregate (VMA)√√√√ √√√√ √√√√
HMA Density √√√√
Percent Passing No.
3/4 Sieve√√√√
Percent Passing No.
3/8 Sieve√√√√
Percent Passing No.
4 Sieve√√√√
Percent Passing No.
200 Sieve√√√√ √√√√
Aggregate
Angularity√√√√ √√√√
Unbound Material Properties
Resilient Modulus
of Soil/Aggregate√√√√ √√√√ √√√√
Triaxial Permanent
Deformation Tests√√√√
Percent Clay in Soil √√√√
Percent Sand in Soil √√√√
Percent Passing No.
200 Sieve√√√√ √√√√
Plasticity Index of
Soil√√√√
Moisture Content of
Soil/Aggregate√√√√ √√√√
Note: The cells that are shaded or highlighted are the materials tests, response parameters, and material properties
that are needed in support of the 2002 Design Guide.

8
error terms for each input level should be determined sepa-rately, rather than by combining all levels together, in orderto allow the error term for each distress to be quantified byinput level. However, only one set of error terms is in thecurrent version of the 2002 Design Guide. These error termswere determined from the calibration process by using thebest available data among input levels 1, 2, and 3.
JACKKNIFE TESTING TO REFINE MODELCALIBRATION AND VALIDATION
Development of pavement performance models for M-Epavement design methods requires a rational procedure forperforming calibration and validation. Given the effort andexpense required to collect distress data, it is essential tohave a means of accurately estimating the amount of dataneeded for calibration and validation.
Since distress data are expensive and time-consumingto collect, the use of a single database for both calibrationand validation is preferable. Jackknifing is a model valida-tion procedure that provides measures of goodness-of-fit thatare independent of the corresponding calibration statisticsthat depend on the data used for fitting the model parameters.Thus, the model validation statistics are developed indepen-dently of the data used for calibration and are more likely toindicate the accuracy of future predictions than are statisticsbased on calibration of all data vectors. Multiple jackknifingis used to assess the stability of the prediction statistics andsensitivity of the validation goodness-of-fit statistics tosample size. Another advantage is that the method is easy toapply.
Split-sample validation differs from jackknifing in thatthe goodness-of-fit statistics for both calibration and predic-tion are based on n/2 values (for symmetric split sampling,the usual case) rather than n values. Traditional split-sample
TABLE 5 Material tests considered important for predicting performance of HMA mixtures or estimating the life of HMApavements and overlays using different M-E distress prediction models
Performance IndicatorMix/Pavement
Parameter and
Test TypeRut Depth
Fatigue
Cracking
Thermal
Cracking
Reflection
CrackingSmoothness
Other
Distresses
Fundamental (Mechanical) Tests in Support of the M-E Models
HMA Compressive
Dynamic Modulus√√√√ √√√√ √√√√
Triaxial Resilient
Modulus√√√√
Shear Modulus-
Constant Height√√√√
IDT Indirect Tensile
Creep/Strength√√√√ √√√√ √√√√
IDT Resilient
Modulus, HMA√√√√ √√√√ √√√√
IDT Strength-
Failure Strain HMA√√√√ √√√√ √√√√ √√√√
Constant-Height,
Permanent
Deformation Shear
√√√√
Triaxial Permanent
Deformation, HMA√√√√
Triaxial Creep,
HMA√√√√
Beam Fatigue Tests √√√√ √√√√
Resilient Modulus,
Soils/Aggregates√√√√ √√√√ √√√√
Triaxial Repeated
Load Permanent
Deformation Tests
√√√√
Note: The cells that are shaded or highlighted are the materials tests, response parameters, and material properties
that are needed in support of the 2002 Design Guide.

9
validation has the distinct disadvantage that, if n is smallrelative to the inference space being simulated, then n/2 iseven smaller, which produces inaccurate calibrations, inaccu-rate coefficients, and less reliable prediction accuracy. Toovercome in part this deficiency, the experimental plandeveloped in NCHRP Project 9-30 is based on the use of amethod combining jackknifing and split-sample testing thatis essentially an n/2 jackknifing scheme termed split-samplejackknifing. Split-sample jackknifing provides somewhatbetter measures of prediction accuracy than the traditionalsplit-sample validation. NCHRP Research Results Digest283: Jackknife Testing—An Experimental Approach to RefineModel Calibration and Validation illustrates the use of split-sample jackknifing using simulations of rutting performancebased on measured data from in-service MnROAD pave-ment sections.
EXPERIMENTAL PLAN AND MATRIX FORREFINING CALIBRATION AND VALIDATION
Matrix Stratification Approach
Table 6 is a general table for categorizing each testsection included in the calibration-validation refinementexperimental plan for all four distresses of interest. Within
this table, traffic and climate are treated as secondaryparameters because traffic is probably interrelated withHMA thickness and climate is interrelated with asphaltbinder grade. The table can be stratified or blocked by familyof pavement for each distress. Each column in the table rep-resents the effect of changing structure and mixture. Thistype of table was selected because the experiment will evalu-ate the effect of material characterization (laboratory tests)on reducing the overall error term or uncertainty caused byusing best-guessed material properties or properties calcu-lated from regression equations. The effect can be (and prob-ably is) different for different distresses.
The number in each cell of Table 6 is that of the requiredpaired or companion test sections, one with a relatively highmagnitude of distress and one with a relatively low magni-tude of distress. For experimental efficiency, the compara-tive test sections with relatively low magnitudes of distresswill come from another distress matrix or factorial. Forexample, the test sections that exhibit relatively high amountsof fatigue cracking can be used in the rutting matrix orthermal cracking matrix for low magnitudes of those dis-tresses. The testing plan to measure the HMA mixture prop-erties needed for predicting all four major distress types willbe implemented for each test section to keep the total numberof test sections that are needed in the experimental matrix toa practical minimum.
TABLE 6 Categories for each test section included in the calibration-validation refinement experimental plan forall distresses
Family of Pavements
HMA Overlay of:Pav’t.
Type
HMA
Thick.Mix Type
Thin
Surf.,
Conv.
Thick
Surf.,
Deep
Full-
Depth
Semi-
Rigid HMAIntact
PCC
Break
& Seat
PCC
Rubb.
PCC
Total
No. of
Sections
Conventional 1 4 5
PMA 2 2 4
Grading 1 1 2Thin
Drainage 2 2
Conventional 1 1 4 6
PMA 2 2 2 6
Grading 1 1 1 3
New
Thick
Drainage 2 2 4
Conventional 1 1 1 3
PMA 1 1 1 1 4
Grading 1 1 1 1 4Thin
Drainage
Conventional 1 1 1 2 5
PMA 1 1 1 1 4
Grading 2 1 1 1 5
Rehab.
Thick
Drainage
Total Sections 6 6 6 14 7 6 6 6 57
Notes:
1. HMA Thickness: Thin – less than or equal to 5 inches; Thick – greater than or equal to 8 inches.
2. Mix Type: Conventional – A conventional mix, unmodified; PMA – Polymer Modified Asphalt mix; Grading – A fine, coarse, or
gap graded aggregate blend that is different than the conventional grading used; Drainage – Sections with subsurface drainage
within structure.
3. Thin Surface Pavement Type – A conventional flexible pavement; thin surface with a relatively thick aggregate or granular base.
4. Thick Surface, Deep Strength – A thick HMA pavement with an asphalt-stabilized or -treated base mixture.
5. More semi-rigid pavements were included in the above table because so few were used in the initial calibration-validation
experiment of NCHRP Project 1-37A.
10
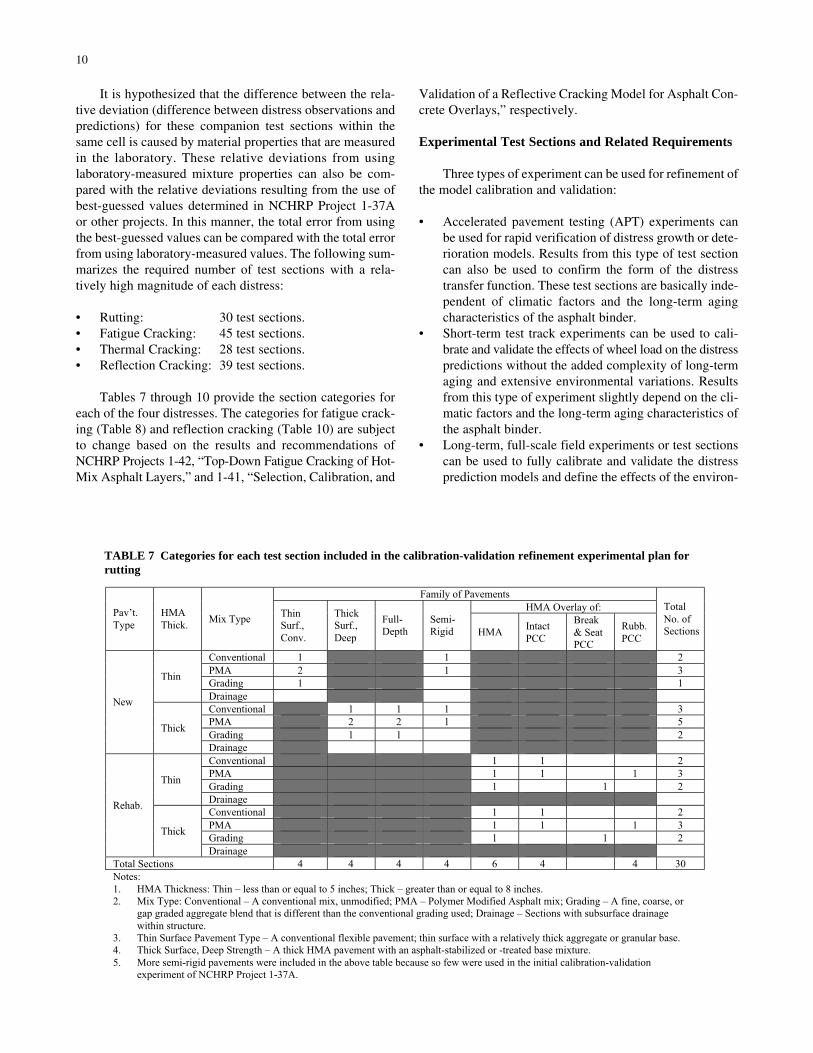
It is hypothesized that the difference between the rela-tive deviation (difference between distress observations andpredictions) for these companion test sections within thesame cell is caused by material properties that are measuredin the laboratory. These relative deviations from usinglaboratory-measured mixture properties can also be com-pared with the relative deviations resulting from the use ofbest-guessed values determined in NCHRP Project 1-37Aor other projects. In this manner, the total error from usingthe best-guessed values can be compared with the total errorfrom using laboratory-measured values. The following sum-marizes the required number of test sections with a rela-tively high magnitude of each distress:
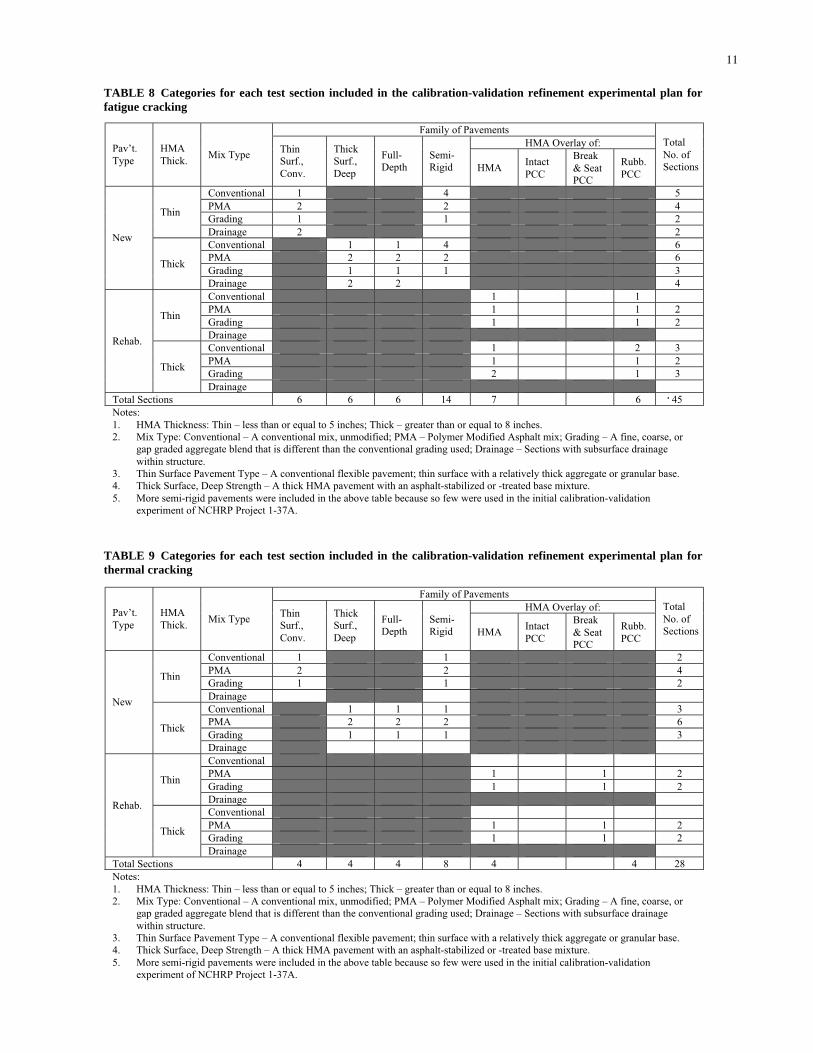
• Rutting: 30 test sections.• Fatigue Cracking: 45 test sections.• Thermal Cracking: 28 test sections.• Reflection Cracking: 39 test sections.
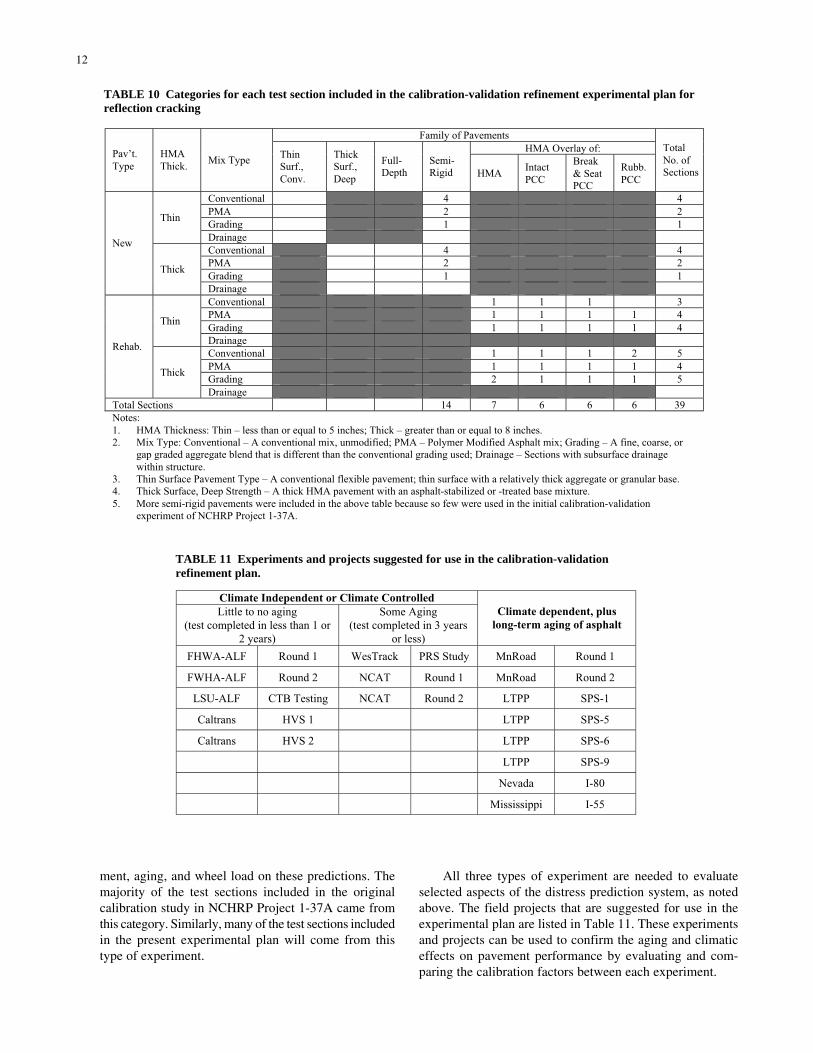
Tables 7 through 10 provide the section categories foreach of the four distresses. The categories for fatigue crack-ing (Table 8) and reflection cracking (Table 10) are subjectto change based on the results and recommendations ofNCHRP Projects 1-42, “Top-Down Fatigue Cracking of Hot-Mix Asphalt Layers,” and 1-41, “Selection, Calibration, and
Validation of a Reflective Cracking Model for Asphalt Con-crete Overlays,” respectively.
Experimental Test Sections and Related Requirements
Three types of experiment can be used for refinement ofthe model calibration and validation:
• Accelerated pavement testing (APT) experiments canbe used for rapid verification of distress growth or dete-rioration models. Results from this type of test sectioncan also be used to confirm the form of the distresstransfer function. These test sections are basically inde-pendent of climatic factors and the long-term agingcharacteristics of the asphalt binder.
• Short-term test track experiments can be used to cali-brate and validate the effects of wheel load on the distresspredictions without the added complexity of long-termaging and extensive environmental variations. Resultsfrom this type of experiment slightly depend on the cli-matic factors and the long-term aging characteristics ofthe asphalt binder.
• Long-term, full-scale field experiments or test sectionscan be used to fully calibrate and validate the distressprediction models and define the effects of the environ-
TABLE 7 Categories for each test section included in the calibration-validation refinement experimental plan forrutting
Family of Pavements
HMA Overlay of:Pav’t.
Type
HMA
Thick.Mix Type
Thin
Surf.,
Conv.
Thick
Surf.,
Deep
Full-
Depth
Semi-
Rigid HMAIntact
PCC
Break
& Seat
PCC
Rubb.
PCC
Total
No. of
Sections
Conventional 1 1 2
PMA 2 1 3
Grading 1 1Thin
Drainage
Conventional 1 1 1 3
PMA 2 2 1 5
Grading 1 1 2
New
Thick
Drainage
Conventional 1 1 2
PMA 1 1 1 3
Grading 1 1 2Thin
Drainage
Conventional 1 1 2
PMA 1 1 1 3
Grading 1 1 2
Rehab.
Thick
Drainage
Total Sections 4 4 4 4 6 4 4 30
Notes:
1. HMA Thickness: Thin – less than or equal to 5 inches; Thick – greater than or equal to 8 inches.
2. Mix Type: Conventional – A conventional mix, unmodified; PMA – Polymer Modified Asphalt mix; Grading – A fine, coarse, or
gap graded aggregate blend that is different than the conventional grading used; Drainage – Sections with subsurface drainage
within structure.
3. Thin Surface Pavement Type – A conventional flexible pavement; thin surface with a relatively thick aggregate or granular base.
4. Thick Surface, Deep Strength – A thick HMA pavement with an asphalt-stabilized or -treated base mixture.
5. More semi-rigid pavements were included in the above table because so few were used in the initial calibration-validation
experiment of NCHRP Project 1-37A.
11
TABLE 9 Categories for each test section included in the calibration-validation refinement experimental plan forthermal cracking
Family of Pavements
HMA Overlay of:Pav’t.
Type
HMA
Thick.Mix Type
Thin
Surf.,
Conv.
Thick
Surf.,
Deep
Full-
Depth
Semi-
Rigid HMAIntact
PCC
Break
& Seat
PCC
Rubb.
PCC
Total
No. of
Sections
Conventional 1 1 2
PMA 2 2 4
Grading 1 1 2Thin
Drainage
Conventional 1 1 1 3
PMA 2 2 2 6
Grading 1 1 1 3
New
Thick
Drainage
Conventional
PMA 1 1 2
Grading 1 1 2Thin
Drainage
Conventional
PMA 1 1 2
Grading 1 1 2
Rehab.
Thick
Drainage
Total Sections 4 4 4 8 4 4 28
Notes:
1. HMA Thickness: Thin – less than or equal to 5 inches; Thick – greater than or equal to 8 inches.
2. Mix Type: Conventional – A conventional mix, unmodified; PMA – Polymer Modified Asphalt mix; Grading – A fine, coarse, or
gap graded aggregate blend that is different than the conventional grading used; Drainage – Sections with subsurface drainage
within structure.
3. Thin Surface Pavement Type – A conventional flexible pavement; thin surface with a relatively thick aggregate or granular base.
4. Thick Surface, Deep Strength – A thick HMA pavement with an asphalt-stabilized or -treated base mixture.
5. More semi-rigid pavements were included in the above table because so few were used in the initial calibration-validation
experiment of NCHRP Project 1-37A.
TABLE 8 Categories for each test section included in the calibration-validation refinement experimental plan forfatigue cracking
Family of Pavements
HMA Overlay of:Pav’t.
Type
HMA
Thick.Mix Type
Thin
Surf.,
Conv.
Thick
Surf.,
Deep
Full-
Depth
Semi-
Rigid HMAIntact
PCC
Break
& Seat
PCC
Rubb.
PCC
Total
No. of
Sections
Conventional 1 4 5
PMA 2 2 4
Grading 1 1 2Thin
Drainage 2 2
Conventional 1 1 4 6
PMA 2 2 2 6
Grading 1 1 1 3
New
Thick
Drainage 2 2 4
Conventional 1 1
PMA 1 1 2
Grading 1 1 2Thin
Drainage
Conventional 1 2 3
PMA 1 1 2
Grading 2 1 3
Rehab.
Thick
Drainage
Total Sections 6 6 6 14 7 6 45
Notes:
1. HMA Thickness: Thin – less than or equal to 5 inches; Thick – greater than or equal to 8 inches.
2. Mix Type: Conventional – A conventional mix, unmodified; PMA – Polymer Modified Asphalt mix; Grading – A fine, coarse, or
gap graded aggregate blend that is different than the conventional grading used; Drainage – Sections with subsurface drainage
within structure.
3. Thin Surface Pavement Type – A conventional flexible pavement; thin surface with a relatively thick aggregate or granular base.
4. Thick Surface, Deep Strength – A thick HMA pavement with an asphalt-stabilized or -treated base mixture.
5. More semi-rigid pavements were included in the above table because so few were used in the initial calibration-validation
experiment of NCHRP Project 1-37A.
12
All three types of experiment are needed to evaluateselected aspects of the distress prediction system, as notedabove. The field projects that are suggested for use in theexperimental plan are listed in Table 11. These experimentsand projects can be used to confirm the aging and climaticeffects on pavement performance by evaluating and com-paring the calibration factors between each experiment.
ment, aging, and wheel load on these predictions. Themajority of the test sections included in the originalcalibration study in NCHRP Project 1-37A came fromthis category. Similarly, many of the test sections includedin the present experimental plan will come from thistype of experiment.
TABLE 10 Categories for each test section included in the calibration-validation refinement experimental plan forreflection cracking
Family of Pavements
HMA Overlay of:Pav’t.
Type
HMA
Thick.Mix Type
Thin
Surf.,
Conv.
Thick
Surf.,
Deep
Full-
Depth
Semi-
Rigid HMAIntact
PCC
Break
& Seat
PCC
Rubb.
PCC
Total
No. of
Sections
Conventional 4 4
PMA 2 2
Grading 1 1Thin
Drainage
Conventional 4 4
PMA 2 2
Grading 1 1
New
Thick
Drainage
Conventional 1 1 1 3
PMA 1 1 1 1 4
Grading 1 1 1 1 4Thin
Drainage
Conventional 1 1 1 2 5
PMA 1 1 1 1 4
Grading 2 1 1 1 5
Rehab.
Thick
Drainage
Total Sections 14 7 6 6 6 39
Notes:
1. HMA Thickness: Thin – less than or equal to 5 inches; Thick – greater than or equal to 8 inches.
2. Mix Type: Conventional – A conventional mix, unmodified; PMA – Polymer Modified Asphalt mix; Grading – A fine, coarse, or
gap graded aggregate blend that is different than the conventional grading used; Drainage – Sections with subsurface drainage
within structure.
3. Thin Surface Pavement Type – A conventional flexible pavement; thin surface with a relatively thick aggregate or granular base.
4. Thick Surface, Deep Strength – A thick HMA pavement with an asphalt-stabilized or -treated base mixture.
5. More semi-rigid pavements were included in the above table because so few were used in the initial calibration-validation
experiment of NCHRP Project 1-37A.
TABLE 11 Experiments and projects suggested for use in the calibration-validationrefinement plan.
Climate Independent or Climate Controlled
Little to no aging
(test completed in less than 1 or
2 years)
Some Aging
(test completed in 3 years
or less)
Climate dependent, plus
long-term aging of asphalt
FHWA-ALF Round 1 WesTrack PRS Study MnRoad Round 1
FWHA-ALF Round 2 NCAT Round 1 MnRoad Round 2
LSU-ALF CTB Testing NCAT Round 2 LTPP SPS-1
Caltrans HVS 1 LTPP SPS-5
Caltrans HVS 2 LTPP SPS-6
LTPP SPS-9
Nevada I-80
Mississippi I-55
13
continues
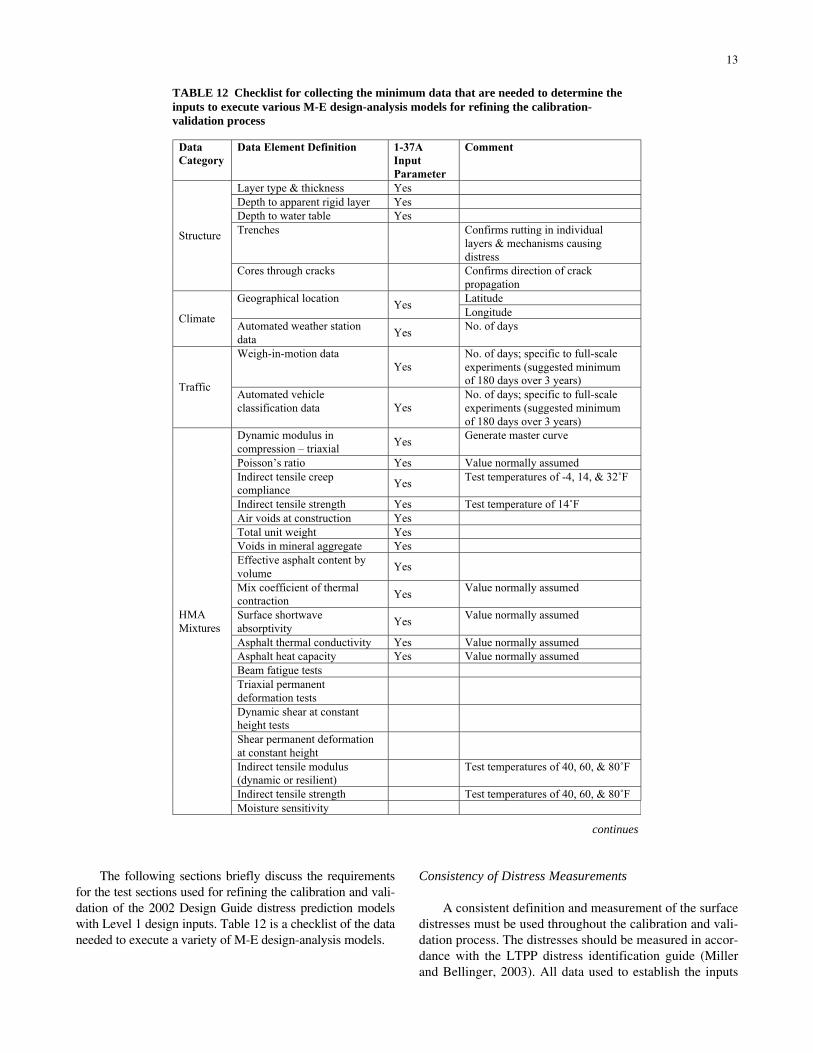
The following sections briefly discuss the requirementsfor the test sections used for refining the calibration and vali-dation of the 2002 Design Guide distress prediction modelswith Level 1 design inputs. Table 12 is a checklist of the dataneeded to execute a variety of M-E design-analysis models.
Consistency of Distress Measurements
A consistent definition and measurement of the surfacedistresses must be used throughout the calibration and vali-dation process. The distresses should be measured in accor-dance with the LTPP distress identification guide (Millerand Bellinger, 2003). All data used to establish the inputs
Data
Category
Data Element Definition 1-37A
Input
Parameter
Comment
Layer type & thickness Yes
Depth to apparent rigid layer Yes
Depth to water table Yes
Trenches Confirms rutting in individual
layers & mechanisms causing
distress
Structure
Cores through cracks Confirms direction of crack
propagation
LatitudeGeographical locationYes
LongitudeClimate
Automated weather station
dataYes
No. of days
Weigh-in-motion data
Yes
No. of days; specific to full-scale
experiments (suggested minimum
of 180 days over 3 years)Traffic
Automated vehicle
classification data Yes
No. of days; specific to full-scale
experiments (suggested minimum
of 180 days over 3 years)
Dynamic modulus in
compression – triaxialYes
Generate master curve
Poisson’s ratio Yes Value normally assumed
Indirect tensile creep
complianceYes
Test temperatures of -4, 14, & 32˚F
Indirect tensile strength Yes Test temperature of 14˚F
Air voids at construction Yes
Total unit weight Yes
Voids in mineral aggregate Yes
Effective asphalt content by
volumeYes
Mix coefficient of thermal
contractionYes
Value normally assumed
Surface shortwave
absorptivityYes
Value normally assumed
Asphalt thermal conductivity Yes Value normally assumed
Asphalt heat capacity Yes Value normally assumed
Beam fatigue tests
Triaxial permanent
deformation tests
Dynamic shear at constant
height tests
Shear permanent deformation
at constant height
Indirect tensile modulus
(dynamic or resilient)
Test temperatures of 40, 60, & 80˚F
Indirect tensile strength Test temperatures of 40, 60, & 80˚F
HMA
Mixtures
Moisture sensitivity
TABLE 12 Checklist for collecting the minimum data that are needed to determine theinputs to execute various M-E design-analysis models for refining the calibration-validation process
14
for the models (including material test results, climatic data,and traffic data) and performance monitoring should be col-lected or measured in accordance with standard procedures(Federal Highway Administration, 1993).
Time-Series Distress Data
Projects or test sections should have at least four ormore distress surveys or observations. Distress measure-ments should be made in 2-year intervals, with the excep-tion of rutting, until the distress starts to approach criticallevels that will trigger some type of rehabilitation. At thatpoint, the frequency of observations should increase to onceper year. For rutting or transverse profile readings, readingsmust be made each year for the first 3 years after construc-tion. The reason for taking these early measurements is todistinguish the initial or primary densification rate from thelong-term or secondary (also referred to as the steady-stateregion) permanent deformation rate. All distress measure-ments should be made in accordance with the LTPP distressidentification guide (Miller and Bellinger, 2003) for consis-tency between projects.
Level 1 Input Parameters
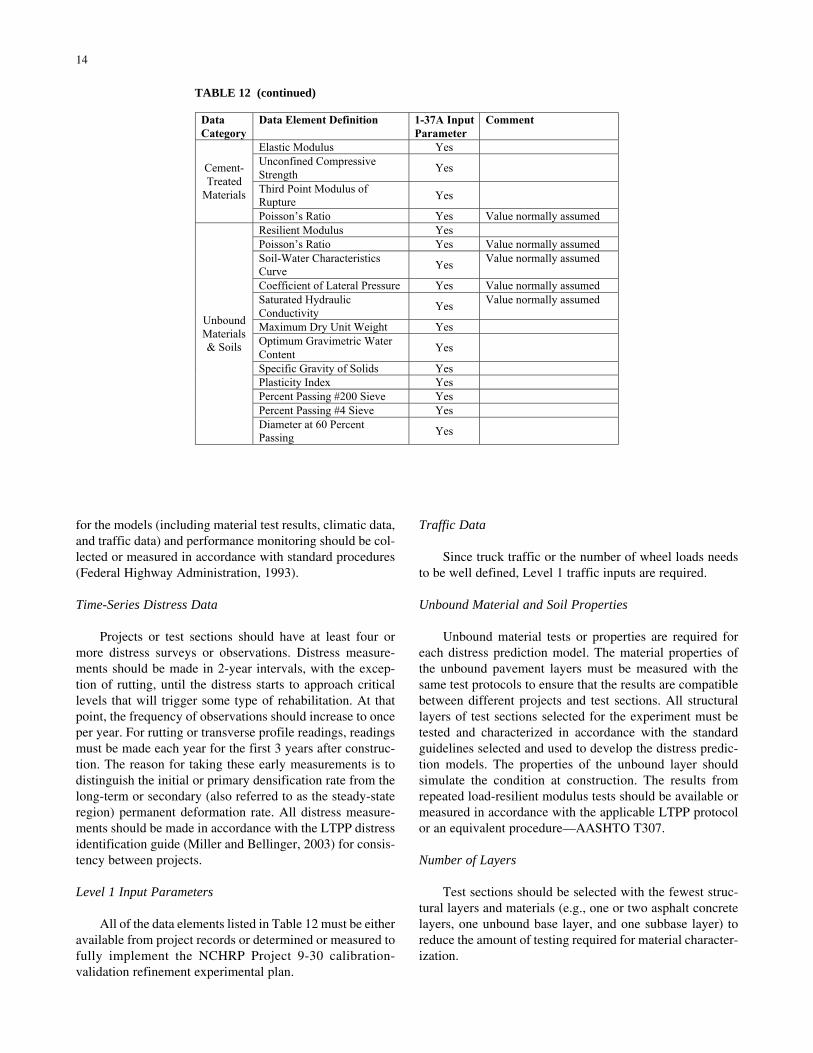
All of the data elements listed in Table 12 must be eitheravailable from project records or determined or measured tofully implement the NCHRP Project 9-30 calibration-validation refinement experimental plan.
Traffic Data
Since truck traffic or the number of wheel loads needsto be well defined, Level 1 traffic inputs are required.
Unbound Material and Soil Properties
Unbound material tests or properties are required foreach distress prediction model. The material properties ofthe unbound pavement layers must be measured with thesame test protocols to ensure that the results are compatiblebetween different projects and test sections. All structurallayers of test sections selected for the experiment must betested and characterized in accordance with the standardguidelines selected and used to develop the distress predic-tion models. The properties of the unbound layer shouldsimulate the condition at construction. The results fromrepeated load-resilient modulus tests should be available ormeasured in accordance with the applicable LTPP protocolor an equivalent procedure—AASHTO T307.
Number of Layers
Test sections should be selected with the fewest struc-tural layers and materials (e.g., one or two asphalt concretelayers, one unbound base layer, and one subbase layer) toreduce the amount of testing required for material character-ization.
Data
Category
Data Element Definition 1-37A Input
Parameter
Comment
Elastic Modulus Yes
Unconfined Compressive
StrengthYes
Third Point Modulus of
RuptureYes
Cement-
Treated
Materials
Poisson’s Ratio Yes Value normally assumed
Resilient Modulus Yes
Poisson’s Ratio Yes Value normally assumed
Soil-Water Characteristics
CurveYes
Value normally assumed
Coefficient of Lateral Pressure Yes Value normally assumed
Saturated Hydraulic
ConductivityYes
Value normally assumed
Maximum Dry Unit Weight Yes
Optimum Gravimetric Water
ContentYes
Specific Gravity of Solids Yes
Plasticity Index Yes
Percent Passing #200 Sieve Yes
Percent Passing #4 Sieve Yes
Unbound
Materials
& Soils
Diameter at 60 Percent
PassingYes
TABLE 12 (continued)

15
Rehabilitation and New Construction
Test sections with and without overlays are needed forthe model calibration and validation. Test sections that havedetailed time-series performance data prior to and afterrehabilitation are preferred because these test sections canserve in dual roles as both new construction and rehabili-tated pavements.
Nonconventional Mixtures
Test sections that include nonconventional mixtures orlayers should be included in the experimental plan to ensurethat the model forms and calibration factors are representa-tive of these mixtures. Nonconventional mixtures includestone matrix asphalt (SMA), polymer-modified asphalt(PMA), and open-graded drainage layers. Most of the testsections used to calibrate the NCHRP Project 1-37A perfor-mance models were built with conventional HMA mixtures.
HMA Bulk Mixture
At lease 800 lb of bulk mixture is required for eachHMA layer. If this amount of bulk mixture is not stored oravailable, then at least 1,000 lb of aggregate and 100 lb ofthe asphalt binder is required. Bulk mixture is preferredbecause it is most representative of the mix in place in thepavement.
HMA Volumetric Properties
The initial air voids and other HMA volumetric proper-ties must be available from construction or project records.All test specimens will be compacted with an approvedgyratory compactor in accordance with AASHTO T312 tothe air voids measured immediately after construction.
Field Forensic and Evaluation Studies
The field evaluation activities in the experimental planconsist of sampling and testing the pavement structure andtaking truck traffic and climate measurements.
Trenches
Trenches are needed to (1) measure the amount of rut-ting within each paving layer and the subgrade and (2) takea sufficient number of samples from the underlying layersand subgrade for laboratory testing. The rutting measure-ments are used to improve on the calibration of the perma-nent deformation within each layer of the pavement struc-ture. The trenches can also be used to determine the directionof crack propagation.
Cores
Cores should be taken to determine the direction ofcrack propagation. This information is used to determine thecause and mechanism of the crack—for example, whetherthe crack was caused by segregation of the HMA mixture ora weak bond between two adjacent HMA layers and whetherit started at the surface or bottom of the HMA layer. Coresshould also be taken to measure the air voids and other in-place properties of the HMA.
Traffic
For test sections located on the highway network, weigh-in-motion (WIM) and automated vehicle classifiers (AVCs)should be used to measure the actual truck traffic in terms ofboth axle weight and number of applications. The historicaltruck traffic data should be based on actual measurementsover the analysis period. Tire pressures should also be mea-sured on trucks selected at random at enforcement sites orports of entry. If traffic data are missing or unavailable, thefield site should be excluded from the experiment.
Nondestructive Deflection Tests
Falling weight deflectometer (FWD) deflection basintests should be taken periodically, but at a minimum of twotime periods, immediately after construction (i.e., within thesame season that the wearing surface was placed, to estab-lish the baseline values) and prior to sampling and testingthe pavement structure. The optimum time periods includeafter construction and within each season of a typical year,both prior to and after the occurrence of any cracks.
Distress Surveys
Distress surveys measure the magnitude and severity ofdistress. Distress surveys should be performed in accordancewith the LTPP distress identification manual (Miller andBellinger, 2003), with the exception that rut depths shouldbe measured every year for the first 3 years after construc-tion. The distress surveys should be completed once the dis-tress has occurred. Four distress surveys are needed, at aminimum, but if fewer surveys are available, the field siteshould be dropped, unless the time-series data show a con-sistent trend in the distress magnitude and severity level.
Climate
Automated weather stations (AWSs) can be used to col-lect the climate data that are needed to predict pavementperformance with the 2002 Design Guide software. The2002 Design Guide software contains historical data formany weather stations. The test section location should bechecked against the AWS sites included in the software toensure that a site or a combination of sites (to develop a
16
virtual weather station) have a sufficient amount of weatherdata for the subject calibration site. If the data are insuffi-cient, the field site should be dropped.
Materials Sampling
In addition to the HMA bulk mixture requirements pre-sented above, at least 300 lb of material from each unboundaggregate layer and the foundation soil is required to per-form the testing needed for measuring the base-year proper-ties input to the 2002 Design Guide.
Materials Testing Plan
The materials testing plan focuses on the 2002 DesignGuide and the test protocols that support determination ofthe Level 1 material property inputs. However, the M-Edatabase discussed in a later section also provides for theinclusion of test protocols and material properties requiredby the other M-E model forms listed in Table 12.
The Level 1 inputs to the 2002 Design Guide requirethe following HMA mixture testing:
• Triaxial dynamic modulus.• Indirect tensile creep-compliance.• Indirect tensile strength.• Beam fatigue strength.• Triaxial repeated load permanent deformation.
Beam fatigue tests and triaxial repeated permanentdeformation tests are included in the test program to adjust
the predictions to better account for the effects of mixture orgradation type than in the original NCHRP Project 1-37Acalibration. The results of the WesTrack project (Epps et al.,2002) showed that the fatigue strength of HMA mixturescould not be solely explained by the dynamic modulus ofthe mix; aggregate gradation also had a significant effect.Thus, the experimental plan must account for these type offactors to reduce the total error and decrease the level ofuncertainty in the predictions.
Beam fatigue tests are also included in the test plan formeasuring the fatigue and fracture strength of non-conventional mixtures. It is expected that up to half of themixtures included in the experimental plan will consist ofPMA or some other nonconventional mixture for which theexponents and coefficients of the fatigue relationships haveyet to be well defined.
An M-E prediction model for reflection cracks is notincluded in the 2002 Design Guide software, and the mecha-nism of surface-initiated fatigue cracks has yet to be con-firmed. Thus, the preliminary test program was developedunder the assumption that the fracture properties of an HMAmixture can be adequately measured using the indirect ten-sile and beam fatigue tests for predicting both reflectioncracks and surface-initiated fatigue cracks.
Other mechanistic tests are included in Table 12 toensure that agencies can accurately characterize HMA mix-tures for forensic investigations, when bulk mixture is unavail-able, and for acceptance testing using in-place properties.
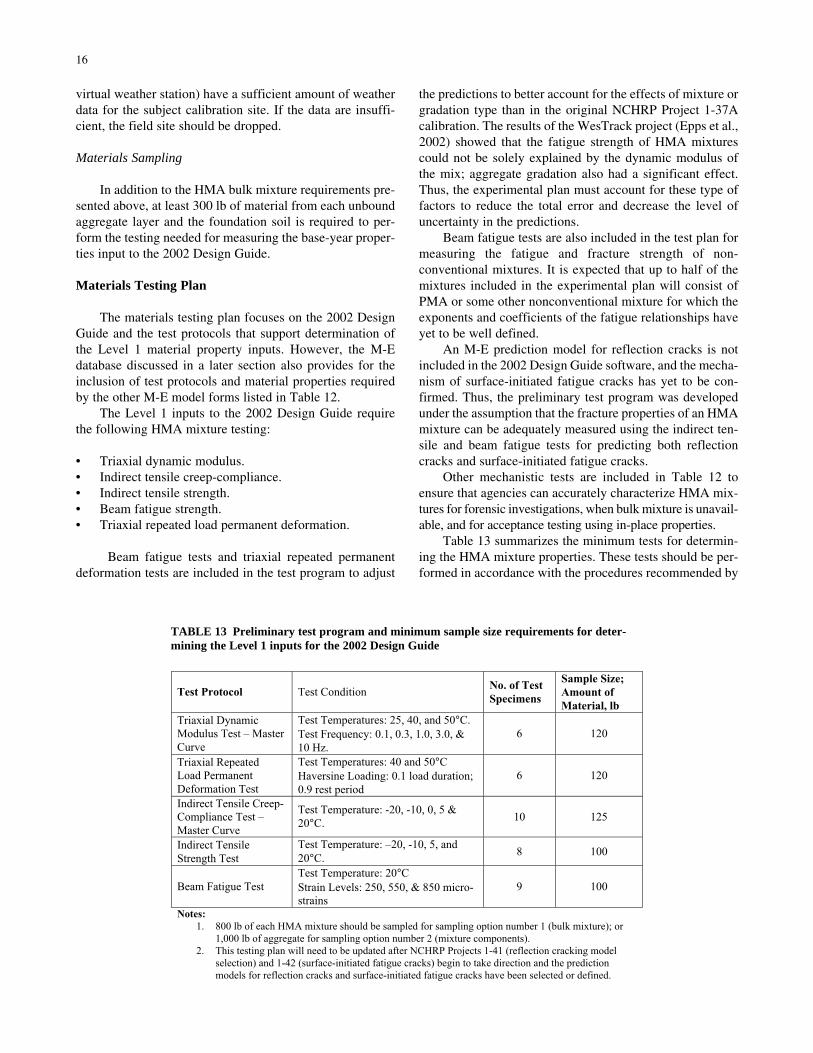
Table 13 summarizes the minimum tests for determin-ing the HMA mixture properties. These tests should be per-formed in accordance with the procedures recommended by
Test Protocol Test ConditionNo. of Test
Specimens
Sample Size;
Amount of
Material, lb
Triaxial Dynamic
Modulus Test – Master
Curve
Test Temperatures: 25, 40, and 50°C.
Test Frequency: 0.1, 0.3, 1.0, 3.0, &
10 Hz.
6 120
Triaxial Repeated
Load Permanent
Deformation Test
Test Temperatures: 40 and 50°C
Haversine Loading: 0.1 load duration;
0.9 rest period
6 120
Indirect Tensile Creep-
Compliance Test –
Master Curve
Test Temperature: -20, -10, 0, 5 &
20°C.10 125
Indirect Tensile
Strength Test
Test Temperature: –20, -10, 5, and
20°C.8 100
Beam Fatigue Test
Test Temperature: 20°C
Strain Levels: 250, 550, & 850 micro-
strains
9 100
Notes:
1. 800 lb of each HMA mixture should be sampled for sampling option number 1 (bulk mixture); or
1,000 lb of aggregate for sampling option number 2 (mixture components).
2. This testing plan will need to be updated after NCHRP Projects 1-41 (reflection cracking model
selection) and 1-42 (surface-initiated fatigue cracks) begin to take direction and the prediction
models for reflection cracks and surface-initiated fatigue cracks have been selected or defined.
TABLE 13 Preliminary test program and minimum sample size requirements for deter-mining the Level 1 inputs for the 2002 Design Guide

17
NCHRP Projects 1-37A and 9-19 or the test protocols devel-oped during SHRP that are now available in AASHTOformat. As discussed above, other HMA mixture tests canbe performed and the results included in the M-E databasefor calibrating other M-E distress prediction models, butthese tests were not included in the table because it focuseson tests needed in support of the 2002 Design Guide.
Materials from all bound and unbound pavement layersalso need to be tested and evaluated for the pavement sec-tions included in the parts of the experiments dealing withload-related distresses. Repeated load-resilient modulus testsshould be completed in accordance with LTPP Test ProtocolTP46 or AASHTO T 307. This eliminates the need to rely onmore variable, back-calculated material properties, proper-ties calculated through the use of regression equations, orthe use of the best-guessed values for the surface and underly-ing pavement layers and subgrade. Repeated load-resilientmodulus tests were used to test the unbound layers in accor-dance with TP46 for many of the projects listed in Table 11.
Table 14 lists the estimated number of projects or HMAmixtures to be included in the laboratory test plan for mix-ture characterization by distress type, taking into consider-ation the HMA mixture testing already completed on otherprojects. The following projects are those for which no M-Elaboratory tests have been performed; some of these projectsare still under construction or in the planning stage.
• SPS-1: Alabama, Montana, Nebraska• SPS-5: Colorado, Mississippi, Texas• SPS-6: Alabama, California• SPS-9: Montana
• LA-ALF: Louisiana; cement-treated base (CTB)experiment
• FHWA-ALF: Round 2 (under construction)• Mississippi: I-55, PMA Experiment• MnRoad: Round 2 (planned)• NCAT: Round 2 (under construction)
The LA-ALF experiment is the only project of thoselisted above that includes a semi-rigid pavement structure, apavement type that is underrepresented among the test sec-tions available for the experimental plan.
The testing program for reflection cracking may changeas the findings of NCHRP Project 1-41 become available;the number of sections shown in Table 10 could increase ordecrease.
PRELIMINARY SCHEDULE AND BUDGET
The HMA materials testing and field studies describedabove will take about 2 years to complete. This time framewill permit the inclusion of relevant results from the secondround of testing underway at the NCAT test track and theFHWA-ALF.
Table 15 summarizes the expected cost per test sectionto carry out the materials testing plan. This cost assumesthat sufficient HMA mixture is available in bulk; costs mightbe as much as $4,000 higher if HMA specimens must beprepared by compaction and aging from component materi-als. In addition to the laboratory tests in the table, fieldstudies are needed to determine the permanent deformation
TABLE 14 Estimated number of projects or HMA mixtures that should be included in thelaboratory test plan by distress type, at a minimum
Distress CategoryPavement Type or Family of
PavementsRutting
Fatigue
Cracking
Thermal
Cracking
Reflection
Cracking
Conventional Pavements; Thin
HMA Surfaces2 2 2 NA
Deep Strength Pavements; Thick
HMA Surfaces & Bases2 2 2 NA
Full Depth HMA Pavements2 2 6 NA
Semi-Rigid Pavements4 14 NA 14
HMA Overlays of Flexible
Pavements2 2 2 7
HMA Overlays of Intact PCC
Slabs0 NA NA 6
HMA Overlays of Cracked &
Seated PCC Pavements2 NA NA 6
HMA Overlays of Rubblized
PCC Slabs4 6 6 6
Total Number of Sections 18 28 18 39

18
Item or Activity Item Unit Unit Cost, $
Shipping of materials from storage point to laboratory; asphalt binder
and bulk HMA mixture.
800 to 1,000 lb 1,000
Binder testing and characterization to determine performance grade of
original asphalt binder.
AASHTO MP1
tests
1,000
Binder extraction from field sample, testing, and characterization to
determine performance grade of aged asphalt binder.
AASHTO MP1
tests
1,500
Test specimen preparation and triaxial dynamic modulus tests to
develop master curve for rutting and fatigue cracking
characterization.
6 specimens 1,200
Test specimen preparation and triaxial permanent deformation tests
for rutting characterization.
6 specimens 1,800
Indirect tensile creep and
compliance tests to develop
master curve.
6 specimens 1,200Test specimen preparation for
low-temperature cracking
characterization.
Indirect tensile strength tests. 4 specimens 400
Indirect tensile creep and
compliance tests.
4 specimens 800Test specimen preparation for
fracture characterization.
Indirect tensile strength tests. 4 specimens 800
Test specimen preparation and beam fatigue tests for fracture
characterization.
9 specimens 6,300
Total Unit Costs for Materials Characterization 16,000
Total Unit Costs for Field Investigations—Forensic Studies Project Site 7,500
TABLE 15 Costs per HMA mixture for measuring the Level 1 materials property inputs requiredfor the 2002 Design Guide
in each layer, confirm the direction of crack propagation,measure the propagation depth of thermal cracks, or all three.The cost of this field work, as shown in the table, includingtraffic control and repairs to trenched or cored pavementareas, is estimated at $7,500 per project site, assuming threetest sections at each project site.
MECHANISTIC-EMPIRICAL DATABASE FORMODEL CALIBRATION AND VALIDATION
Microsoft Access Database
Model calibration and validation require the assemblyand analysis of large quantities of data for each of manyfield sites. A well-designed and easy-to-use relational data-base can greatly ease the management and access of thisinformation. Consequently, the design of an appropriatedatabase structure was an important product within the over-all development of the NCHRP Project 9-30 experimentalplan.
The M-E Distress Prediction Models (M-E_DPM) data-base was developed in Microsoft Access to provide anappropriate database structure for storing all pavement andmaterials data required for the continued refinement of theHMA M-E distress prediction models in the 2002 DesignGuide. However, the database was designed with the flex-ibility to encompass the calibration and validation of otherdistress prediction models such as those developed in theWesTrack project (Epps et al., 2002).
The starting point for the database design was the LTPPDataPave 3.0 database. The LTPP database is well designedto store climate, traffic, and measured performance data,and it was desirable to retain as much of the familiar LTPPdatabase structure as possible.
Characteristics and Features of the Database
M-E_DPM should be perceived as a living source ofdata to be used in the future, similar to the LTPP database.M-E_DPM was developed with the following characteris-tics and features to satisfy the NCHRP Project 9-30 objec-tive and goals:
• Flexibility.• Links to LTPP DataPave.• Maximization of potential use.
Flexibility
Flexibility is designed into M-E_DPM to permit theaddition of other parameters that may need to be added basedon future studies. The basic structure of the database con-sists of three parts or tables:
• Part I—Descriptive Database. This part consists of textfiles that define or document details of the data includedin the second part of the database. Ample provision wasprovided for including explanatory notes for each datarecord. In most instances, the data fields for these

19
explanatory notes are of the “Memo” type, which inMicrosoft Access permits entry of up to 64,000 charac-ters of information.
• Part II—Inputs/Data for M-E Model Execution. Thispart consists of the actual data that are needed to executethe distress prediction models. This part is further sub-divided into pavement structure, material properties,traffic, and climatic data.
• Part III—Performance Data. These data include the dateon which the distress surveys were made and the valuesfor the magnitude and severity of the distress.
Following the LTPP schema, a prefix is used through-out M-E_DPM to designate the general topic area (module,in LTPP terms) for the various data tables. All new datatables in M-E_DPM begin with a CAL prefix. Tables in thedatabase that are lookup tables (e.g., contain the universe ofvalues for other fields in the database) have a CAL_Lookupprefix, as listed and defined in Table 16.
Links to LTPP DataPave
The design of M-E_DPM was based on new, improvedtables for general project information, pavement structure(layer) data, and material property data. However,M-E_DPM retained and provides a link to the climate,traffic, and performance tables from the LTPP DataPave 3.0database. The design of the new material property data tables
in M-E_DPM is highly flexible. Instead of predefining thematerial properties to be stored for each layer, multiplematerial property records are linked to each layer, with thematerial property name part of the content of the data record.This flexibility allows other material properties to be enteredthat are not required inputs to the 2002 Design Guide.
The listing of possible material property names and theircharacteristics is specified in a separate “property dictio-nary” table or the descriptive database portion. Although theinitial implementation of M-E_DPM focuses on the materialproperties required for the 2002 Design Guide models, thematerial property tables are designed in such a way thatother properties can be added in the future.
Maximization of Potential Use
M-E_DPM was developed to maximize its potential usefor calibrating and validating M-E distress prediction modelsfor use in design and analysis. Besides the national-scalecalibration and validation of distress prediction models,other potential uses of M-E_DPM include the following:
• Documenting regional calibration studies.• Tying mixture design to structural design to perfor-
mance-related specifications.• Confirming or rejecting various hypotheses for distress
mechanisms (for example, surface-initiated fatiguecracks).
TABLE 16 Summary of data table descriptions and data identifications in the M-Edatabase, M-E_DPM
1 CAL_Sections General section information
2 CAL_Layers Layer structure information
3 CAL_Property_Dictionary Listing of all material property types that can
be stored in the database
4 CAL_Property_Values Values for material properties
5 CAL_Lookup_Aggregates Lookup table for aggregate types—e.g.,
limestone, basalt
6 CAL_Lookup_Binder_Grades Lookup table for binder grading systems—e.g.,
Superpave vs. conventional viscosity
7 CAL_Lookup_Cement_Types Lookup table for cement types—e.g., Type I
8 CAL_Lookup_Cement_Curing_Methods Lookup table for cement curing method
types—e.g., wet curing
9 CAL_Lookup_Infiltration Lookup table for pavement infiltration
categories
10 CAL_Lookup_Materials Lookup table for material types—e.g., asphalt,
PCC
11 CAL_Lookup_Pavement_Types Lookup table for types of pavement
construction—e.g., flexible, composite
12 CAL_Lookup_Property_Qualifiers Lookup table for property qualifiers—e.g.,
temperature, frequency, water content
13 CAL_Lookup_Property_Types Lookup table for property types—e.g.,
mechanical vs. thermohydraulic
14 CAL_Lookup_Property_Value_Method Lookup table for methods of determining
material property values—e.g., measured vs.
estimated
15 CAL_Lookup_Units Lookup table for material property unit of
measure—e.g., mm, kpa

20
TABLE 17 Projects and test sections that were used to initially populate the M-E database
Project or Experiment
Identification
Applicable
Distresses
Test Section Information
MnRoad Fatigue & Thermal
Fracture, Rutting, IRI
Conventional &
Deep Strength
HMA Pavement
1, 3, 4, 14, 15, 16, 17, 18,
19, 20, 21, 22
WesTrack Fatigue Fracture,
Rutting & IRI
Conventional
HMA Pavement
1, 3 to 24
NCAT Round 1 Rutting & IRI Deep Strength
Pavement
E06, N02, N03, N05, N07,
N11, N12, N13, S02, S12,
S13
Nevada I-80;
Modifier
Fatigue & Thermal
Fracture, Rutting, IRI
Conventional
Pavement
SPAC-20P, SPPG64-22,
NVAC-20P, NVPG64-22
Mississippi I-55;
Modifier
Fatigue Fracture,
Rutting, IRI
Conventional
Pavement
9 Sections with different
modifiers
FHWA-
ALF
Round 1 Fatigue Fracture,
Rutting
Conventional
Pavement
Lanes: 5_S2, 7_S2, 8_S1,
9_S2, 10_S1, 10_S2,
11_S1, 11_S2, 12_S1
LA-ALF CTB
Experiment
Fatigue Fracture,
Rutting
Semi-Rigid
Pavement
Lanes: 2 to 10
Fatigue & Thermal
Fracture, Rutting, IRI
HMA Overlay Arizona; 902, 903
Fatigue Fracture,
Rutting, IRI
HMA Overlay Indiana; 901, 902, 904
LTPP SPS-9
Experiment
Fatigue Fracture,
Rutting, IRI
HMA Overlay Indiana; A901, A902,
A903, A959, A960, A961
Fatigue & Thermal
Fracture, Rutting, IRI
Conventional
Pavement
Montana; 901, 902, 903
Fatigue Fracture,
Rutting, IRI
Conventional
Pavement
Arizona; B901, B902,
B903, B960, B961, B962,
B964
LTPP SPS-9
Experiment
Fatigue & Thermal
Fracture, Rutting, IRI
Conventional
Pavement
Ontario; 901, 902, 903
LTPP SPS-6
Experiment
Rutting, IRI HMA Overlay
of PCC
Alabama, California
LTPP SPS-1
Experiment
Fatigue Fracture,
Rutting, IRI
Conventional &
Deep Strength
Pavement
Alabama; 01 to 12;
Montana; 13 to 24;
Nebraska; 13 to 24
LTPP SPS-5
Experiment
Fatigue Fracture,
Rutting, IRI
HMA Overlay
of HMA
Pavement
Colorado; 02 to 09;
Minnesota; 02 to 09;
Mississippi; 02 to 09;
Texas; A502 to A509
Notes:
• Data from the two Caltrans HVS experimental studies were not used to initially populate the
M-E database.
• Other LTPP projects that can provide valuable data but have limited materials available for
testing include the SPS–9 projects in Michigan, Quebec, Texas, and Wisconsin; the SPS-1
projects in Florida, New Mexico, Nevada, and Texas; and the SPS-5 projects in Arizona,
California, and Maine.
Population of Database
The starting point for population of the database wasthe project databases developed in the Superpave SimplePerformance Test field validation effort in NCHRP Project9-19 and, most especially, the calibration and validationdatabase developed for the 2002 Design Guide. These data-bases drew extensively from other sources, including LTPP,
MnRoad, WesTrack, and FHWA ALF. Table 17 lists theprojects and test sections that were used to initially populatethe M-E database. Population of the database with informa-tion from new sites identified in the NCHRP Project 9-30experimental plan will be carried in future projects thatimplement the plan. In addition, data from regional calibra-tion studies may be included in M-E_DPM.

21
REFERENCES
Epps, J. A., et al., NCHRP Report 455: Recommended Per-formance-Related Specification for Hot-Mix AsphaltConstruction: Results of the WesTrack Project, Trans-portation Research Board of the National Academies,Washington, DC, 2002.
Federal Highway Administration, LTPP Division, Data Col-lection Guide for Long-Term Pavement PerformanceStudies, Operational Guide No. SHRP-LTPP-OG-001,Revised October 1993.
Miller, J. S., and Bellinger, W. Y., Distress IdentificationManual for the Long-Term Pavement Performance Pro-gram, Report FHWA-RD-03-031, Federal HighwayAdministration, McLean, Virginia, June 2003.


