
JATILUHUR - JAKARTA PIPELINE AND WATER … funded project designed to promote economic growth ......
48
JATILUHUR - JAKARTA PIPELINE AND WATER TREATMENT PLANT PRE-FEASIBILITY STUDY
Transcript of JATILUHUR - JAKARTA PIPELINE AND WATER … funded project designed to promote economic growth ......

JATILUHUR - JAKARTA PIPELINE AND WATER TREATMENT PLANT
PRE-FEASIBILITY STUDY

INDONESIA
INFRASTRUCTURE
INITIATIVE
February 2010
JATILUHUR - JAKARTA PIPELINE AND WATER TREATMENT PLANT
PRE-FEASIBILITY STUDY

INDONESIA INFRASTRUCTURE INITIATIVE
This document has been published by the Indonesia Infrastructure Initiative (IndII), an Australian Government funded project designed to promote economic growth in Indonesia by enhancing the relevance, quality and quantum of infrastructure investment.
The views expressed in this report do not necessarily reflect the views of the Australian Indonesian Partnership or the Australian Government. Please direct any comments or questions to the IndII Director, tel. +62 (21) 230-6063, fax +62 (21) 3190-2994. Website: www.indii.co.id
ACKNOWLEDGEMENTS
This report has been prepared by GHD which was engaged under the Indonesia Infrastructure Initiative (IndII) as part of the Activity on Jatiluhur-Jakarta Pipeline and Water Treatment Plant, Stage 1, funded by AusAID.
The support provided by Ken Trebilco and his team is gratefully acknowledged. Any errors of fact or interpretation are solely those of the author.
GHD
Jakarta, February 2010
© IndII 2010
All original intellectual property contained within this document is the property of the Indonesia Infrastructure Initiative (IndII). It can be used freely without attribution by consultants and IndII partners in preparing IndII documents, reports designs and plans; it can also be used freely by other agencies or organisations, provided attribution is given.
Every attempt has been made to ensure that referenced documents within this publication have been correctly attributed. However, IndII would value being advised of any corrections required, or advice concerning source documents and/or updated data.

i
TABLE OF CONTENTS
CHAPTER 1: INTRODUCTION ......................................................................................................... 1
1.1 OBJECTIVES OF PROPOSED JATILUHUR – JAKARTA PIPELINE PROJECT ................................ 1
1.2 SITE VISITS ......................................................................................................... 1
CHAPTER 2: INITIAL DATA COLLECTION ......................................................................................... 2
2.1 SUMMARY OF DATA COLLECTION FROM PT JASA TIRTA II ............................................. 2
2.1.1 Profile of PT Jasa Tirta II (PJT II) .................................................................... 2 2.1.2 Existing Condition ......................................................................................... 2 2.1.3 Key Issues ..................................................................................................... 5
2.2 SUMMARY OF DATA COLLECTION FROM PDAM KARAWANG ......................................... 6
2.2.1 Profile of Karawang Regency........................................................................ 6 2.2.2 Existing Condition ......................................................................................... 6 2.2.3 Key Issues ................................................................................................... 10
2.3 SUMMARY OF DATA COLLECTION FROM PDAM BEKASI ............................................. 10
2.3.1 Profile of Bekasi Regency ........................................................................... 10 2.3.2 Existing Condition ....................................................................................... 11 2.3.3 Key Issues ................................................................................................... 15
2.4 SUMMARY OF DATA COLLECTION FROM PDAM TIRTA PATRIOT – BEKASI CITY ................. 15
2.4.1 Profile of PDAM Tirta Patriot ..................................................................... 15 2.4.2 Existing Condition ....................................................................................... 16 2.4.3 Key Issues ................................................................................................... 18
2.5 SUMMARY OF DATA COLLECTION FROM PALYJA ....................................................... 18
2.5.1 Profile of Palyja .......................................................................................... 18 2.5.2 Existing Condition ....................................................................................... 18
2.6 SUMMARY OF DATA COLLECTION FROM AETRA ........................................................ 23
2.6.1 Profile of Aetra ........................................................................................... 23 2.6.2 Existing Condition ....................................................................................... 23 2.6.3 Key Issues ................................................................................................... 26
CHAPTER 3: DATA ANALYSIS ....................................................................................................... 28
3.1 INITIAL WATER DEMAND ANALYSIS ........................................................................ 28
3.2 SUPPLY ANALYSIS ............................................................................................... 30
3.2.1 Water Quantity .......................................................................................... 30 3.2.2 Water Quality ............................................................................................. 30 3.2.3 Existing Treatment Plant Capacity ............................................................. 35
3.3 SUPPLY RELIABILITY ............................................................................................ 36
CHAPTER 4: PROJECT OPTIONS ................................................................................................... 37
4.1 OPTIONS FOR PROJECT STAGING ............................................................................ 38
4.2 OPTIONS FOR WTP LOCATIONS ............................................................................. 38
4.3 OPTIONS FOR TRANSMISSION ROUTES .................................................................... 39
CHAPTER 5: SCOPE OF WORK FOR STAGE II - TECHNICAL ASPECT ................................................. 41

ii
LIST OF TABLES
Table 1: Site Visit Location ...................................................................................................................... 1
Table 2: Citarum River Water Balance .................................................................................................... 3
Table 3: Effective Volume of Reservoir as per 28 January 2010 ............................................................. 4
Table 4: Supply Break Down .................................................................................................................... 5
Table 5: PDAM Tirta Tarum Coverage Area ............................................................................................ 6
Table 6: Service Area, Capacity and Customer of PDAM Tirta Tarum..................................................... 7
Table 7: Production Capacity and Installed Capacity of PDAM Bekasi WTP ......................................... 13
Table 8: PDAM Bekasi Reservoir Capacity ............................................................................................. 14
Table 9: Projections of Connections and Base Demand ........................................................................ 15
Table 10: PDAM Tirta Patriot Water Production and Capacity in 2009 ................................................ 16
Table 11: Distribution Components for PDAM Tirta Patriot ................................................................. 17
Table 12: Projections of Connections and Base Demand ...................................................................... 17
Table 13: PALYJA Water Source and Production Capacity .................................................................... 20
Table 14: Distribution Components for PALYJA .................................................................................... 20
Table 15: Base Demand Calculation ...................................................................................................... 22
Table 16: Customer Group Breakdown ................................................................................................. 22
Table 17: AETRA Water Source and Production Capacity ..................................................................... 23
Table 18: Distribution Components for AETRA ..................................................................................... 25
Table 19: Base Demand Calculation ...................................................................................................... 26
Table 20: Customer Group Breakdown ................................................................................................. 26
Table 21: Water Demand Prediction ..................................................................................................... 28
Table 22: 2009 Water Balance .............................................................................................................. 30
Table 23: Summary of Water Quality .................................................................................................... 32
Table 24: Water Quality Standard for Class I (Clean Water Quality Standard) ..................................... 34
Table 25: Existing Treatment Plant Capacity ......................................................................................... 35
Table 26: Indicative Options for Project Staging ................................................................................... 38
Table 27: Options for WTP Locations .................................................................................................... 39
Table 28: Options for Transmission Routes .......................................................................................... 39

iii
LIST OF FIGURES
Figure 1: Schematic of Water Resources (PJT II Presentation – IPA Workhop) ...................................... 3
Figure 2: Villages Serviced by PDAM Tirta Tarum (Source: Technical Planning of SPAM Development 2010-2014, PDAM Tirta Tarum) ............................................................................................... 9
Figure 3: Map of Existing Service Coverage (Source: Business Plan 2009-2013 Presentation) ............ 12
Figure 4: Service Coverage of PDAM Tirta Patriot................................................................................. 16
Figure 5: PALYJA Service Area (Source: PALYJA Master Plan, January 2008) ........................................ 19
Figure 6: Aetra Service Area (Source: TPJ Master Plan) ........................................................................ 24
Figure 7: Projection of Base Demand .................................................................................................... 29
Figure 8: Water Quality Results in Jatiluhur - Curug ............................................................................. 31

1 CHAPTER 1: INTRODUCTION
CHAPTER 1: INTRODUCTION
A majority of the water supply to Jakarta, Bekasi and Karawang comes mainly from the Jatiluhur reservoir, operated by Perum Jasa Tirta II (PJT II), a state-owned enterprise. The water flows through an open channel - the West Tarum Canal (WTC) until it reaches the water treatment plant in the municipalities. The operators for clean water supply are PT Pam Lyonnaise Jaya (PALYJA) and Aetra in Jakarta, PDAM Bekasi in Bekasi and PDAM Karawang in Karawang. The current raw water supply from Jatiluhur is deteriorating as it has been contaminated by domestic and industrial pollution from the West Tarum canal before reaching the water treatment facility.
PT GHD, together with KPMG and Makarim & Taira’s have been appointed by the Indonesia Infrastructure Initiative (IndII) to assist with Stage 1 of the Jatiluhur – Jakarta Pipeline and Water Treatment Plant Project. The scope of work for GHD involves collection and assessment of available technical data in relation with the proposed Jatiluhur – Jakarta Pipeline and Water Treament Plant, identify information gaps and initial scope of work for Stage 2. KPMG and Makarim & Taira’s are responsible for commercial and legal assessments respectively.
1.1 OBJECTIVES OF PROPOSED JATILUHUR – JAKARTA PIPELINE PROJECT
The objective of this activity is to ensure the supply of treated water in the areas of DKI Jakarta, Bekasi City, Bekasi Regency and Karawang Regency, which have increasing demand. The construction of an upstream water treatment plant and the transmission of treated water through a closed-pipe system directly to the operators in Jakarta, Bekasi and Karawang, i.e., Aetra and PALYJA, PDAM Bekasi and PDAM Karawang respectively, is the initial project plan.
1.2 SITE VISITS
While assisting on this project, several site visits have been undertaken to collect the available data from relevant stakeholders. Site visits conducted were:
Table 1: Site Visit Location
Site Visit Location Date of Visit
PDAM Karawang 13 January 2010
PT Jasa Tirta II Jatiluhur
Jatiluhur Reservoir, Curug Dam
Pasir Gombong – alternative WTP location
14 January 2010
14 January 2010
21 January 2010
PDAM Bekasi 19 January 2010
PALYJA 20 January 2010
AETRA 22 January 2010
PAM Jaya 22 January 2010
PDAM Tirta Patriot 28 January 2010

CHAPTER 2: INITIAL DATA COLLECTION 2
CHAPTER 2: INITIAL DATA COLLECTION
2.1 SUMMARY OF DATA COLLECTION FROM PT JASA TIRTA II
2.1.1 Profile of PT Jasa Tirta II
PJT II is a state-owned company which manages the water resources for raw water supply in the areas of Citarum river and a part of Ciliwung – the Cisadane river. The company manages the three largest dams in Indonesia - H Djuanda (Jatiluhur), Cirata and Saguling for irrigation, hydropower generation, water utilities and recreational purposes. This source of water is vital for water supply in Jakarta, as 80 percent of water or 14.6 m3/s is supplied from this area (Source: PALYJA and TPJ Master Plan, 2007). The channel that supplies water to Jakarta is the WTC with intake at Curug.
2.1.2 Existing Condition
Service Area
PJT II coverage area includes approximately 74 rivers within the West Java Province and DKI Jakarta Province, which comprises of several municipalities/regencies as follows1:
East Jakarta City
Bekasi City
Bekasi Regency
Karawang Regency
Purwakarta Regency
Subang Regency
Part of Indramayu Regency
Part of Sumedang Regency
Bandung Municipality
Bandung Regency
Cimahi Municipality
Part of Cianjur Regency and
Part of Bogor Regency
According to the PJT II official website, the total service area is + 12,000 km2.
Raw Water Source
The water resources managed by PJT II are derived from the Citarum river (46 percent) and from other rivers (54 percent). The potential water from the above sources amounts to 12.95 billion m3/year. Out of this, only 7.5 billion m3/year (52 percent of the total water source) is currently regulated by PJT II, of which 5.7 billion m3/year comes from Citarum, and the remaining 1.8 billion
1 Source: http://www.jasatirta2.co.id/pjtII.php?x=perusahaan&z=c649d1c5a6b6b2a60afb55c859780fcf&y=detail

CHAPTER 2: INITIAL DATA COLLECTION 3
m3/year from the other rivers. Thus, there is approximately 5.45 billion m3/year of water (42 percent of the potential water source), unutilised, flowing straight into the Java sea. The water capacity at the dams and the configuration of raw water flow is depicted in Error! Reference source not found.:
Figure 1: Schematic of Water Resources (PJT II Presentation – IPA Workhop)
The flow of water from the Citarum river has been recorded for over 40 years and has shown a reliable result to meet water demand for its coverage area. The average annual flow between 1963 – 2007 is 5.6 billion m3/year. The highest annual debit occured in 1992 with 8.1 billion m3/year, and the lowest was in 1997 with 3.6 billion m3/year. Considering water demand downstream of approximately 4.2 billion m3/year, the current system is likely to be sufficient to meet the demand, provided that no further degradation occurs within the catchment area.
Table 2: Citarum River Water Balance
Water Debit (billion m3/year) Percentage (%)
Regulated water
Citarum river
Other river
7.5
5.7
1.8
57.9
Unregulated water flowing to sea 5.45 42.1
Total 12.95 100
Source: Presentasi Seminar Tambahan 10 Juta Sambungan Air Bersih 15 Oktober 2008, PJT II
CHAPTER 2: INITIAL DATA COLLECTION 4
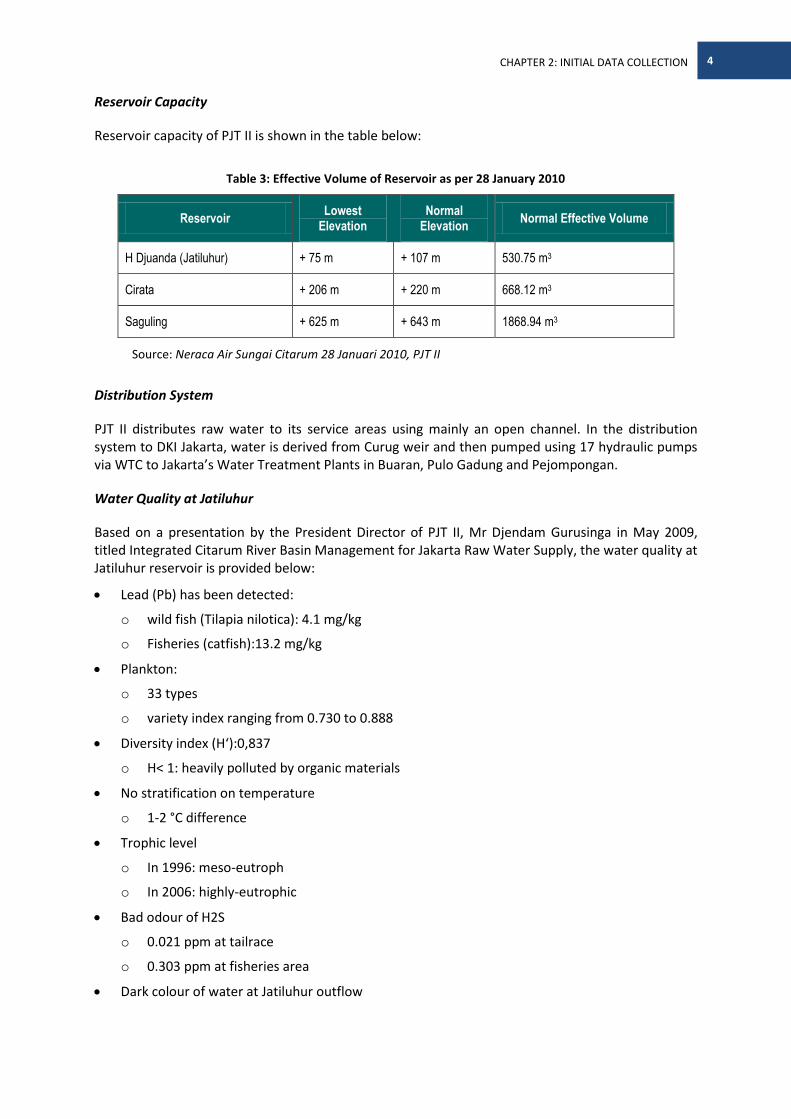
Reservoir Capacity
Reservoir capacity of PJT II is shown in the table below:
Table 3: Effective Volume of Reservoir as per 28 January 2010
Reservoir Lowest
Elevation Normal
Elevation Normal Effective Volume
H Djuanda (Jatiluhur) + 75 m + 107 m 530.75 m3
Cirata + 206 m + 220 m 668.12 m3
Saguling + 625 m + 643 m 1868.94 m3
Source: Neraca Air Sungai Citarum 28 Januari 2010, PJT II
Distribution System
PJT II distributes raw water to its service areas using mainly an open channel. In the distribution system to DKI Jakarta, water is derived from Curug weir and then pumped using 17 hydraulic pumps via WTC to Jakarta’s Water Treatment Plants in Buaran, Pulo Gadung and Pejompongan.
Water Quality at Jatiluhur
Based on a presentation by the President Director of PJT II, Mr Djendam Gurusinga in May 2009, titled Integrated Citarum River Basin Management for Jakarta Raw Water Supply, the water quality at Jatiluhur reservoir is provided below:
Lead (Pb) has been detected:
o wild fish (Tilapia nilotica): 4.1 mg/kg
o Fisheries (catfish):13.2 mg/kg
Plankton:
o 33 types
o variety index ranging from 0.730 to 0.888
Diversity index (H‘):0,837
o H< 1: heavily polluted by organic materials
No stratification on temperature
o 1-2 °C difference
Trophic level
o In 1996: meso-eutroph
o In 2006: highly-eutrophic
Bad odour of H2S
o 0.021 ppm at tailrace
o 0.303 ppm at fisheries area
Dark colour of water at Jatiluhur outflow
CHAPTER 2: INITIAL DATA COLLECTION 5
Currently, there are over 16,000 floating-net fish farms which is far in excess of the allowable number of 3,000 according to a study conducted by IPB or 5,000 according to the local government (LG). In addition, water quality monitoring was also conducted in 75 points across the distribution and transmission network.
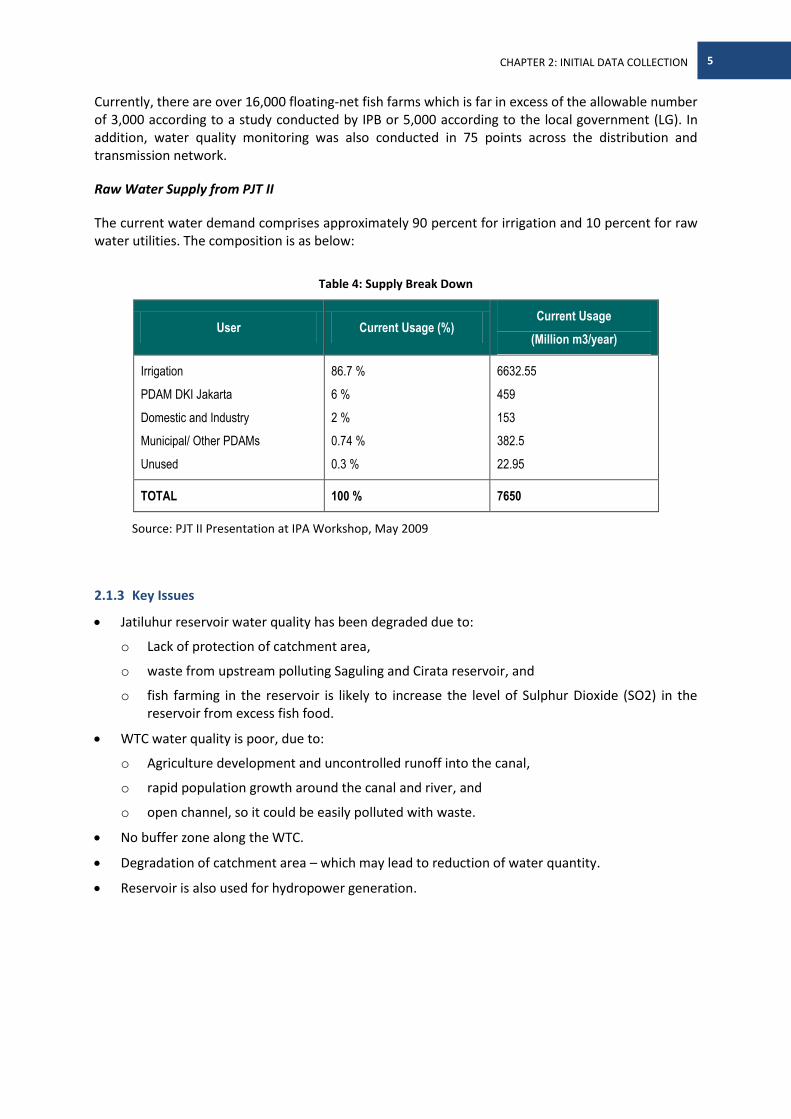
Raw Water Supply from PJT II
The current water demand comprises approximately 90 percent for irrigation and 10 percent for raw water utilities. The composition is as below:
Table 4: Supply Break Down
User Current Usage (%) Current Usage
(Million m3/year)
Irrigation
PDAM DKI Jakarta
Domestic and Industry
Municipal/ Other PDAMs
Unused
86.7 %
6 %
2 %
0.74 %
0.3 %
6632.55
459
153
382.5
22.95
TOTAL 100 % 7650
Source: PJT II Presentation at IPA Workshop, May 2009
2.1.3 Key Issues
Jatiluhur reservoir water quality has been degraded due to:
o Lack of protection of catchment area,
o waste from upstream polluting Saguling and Cirata reservoir, and
o fish farming in the reservoir is likely to increase the level of Sulphur Dioxide (SO2) in the reservoir from excess fish food.
WTC water quality is poor, due to:
o Agriculture development and uncontrolled runoff into the canal,
o rapid population growth around the canal and river, and
o open channel, so it could be easily polluted with waste.
No buffer zone along the WTC.
Degradation of catchment area – which may lead to reduction of water quantity.
Reservoir is also used for hydropower generation.

CHAPTER 2: INITIAL DATA COLLECTION 6
2.2 SUMMARY OF DATA COLLECTION FROM PDAM KARAWANG
2.2.1 Profile of Karawang Regency
Karawang Regency is located in North West Java and geographically located at 107o02’ - 107o40’ Longitude (East) and 5o562’ - 6o34’ Latitude (South). Karawang Regency is considered as lowland and has varied slopes between 0 – 2 percent, 2 – 15 percent and above 40 percent.
Ground surface in the Karawang Regency is relatively flat in majority, with elevation between 0-5 m above sea level. Only a small portion of the area is hilly with elevation between 0-1200 m.
The total area of Karawang Regency is approximately 1753.27 km2 or 3.73 percent of the West Java Province area. Administratively, the Karawang Regency comprises of 30 sub districts and is intersected by rivers flowing in the north direction. The Citarum river forms the boundary between the Karawang and Bekasi Regencies, while the Cimalaya River forms the boundary with the Subang Regency. Apart from the two rivers, there are three main irrigation canals which originate in Jatiluhur. These canals are the North Tarum Main Canal, Central Tarum Main Canal and West Tarum Main Canal, which are utilised for field irrigation, fish pond, power generation and raw water source for Karawang Regency PDAM.
2.2.2 Existing Condition
PDAM Tirta Tarum is the main provider of clean water in Karawang Regency. Up to October 2009, the PDAM demonstrated good performance based on BPPSPAM assessment with performance rate of 2.15. According to this result, PDAM Tirta Tarum is classified as a “healthy” PDAM.
Service Area
The PDAM Tirta Tarum served 15 percent of the total population and 31.33 percent of the administrative area for the 2009 period. The service area of PDAM Tirta Tarum comprises of 16 subdistricts out of the total 30 subdistricts in the Karawang Regency. The serviced subdistricts as well as total villages is shown in Error! Reference source not found..
Table 5: PDAM Tirta Tarum Coverage Area
No Sub District Villages Covered
1 Karawang Barat 6
2 Karawang Timur 5
3 Banyusari 6
4 Telukjambe 3
5 Klari 4
6 Pangkalan 3
7 Cilamaya Wetan 4
8 Rengas Dengklok 4

CHAPTER 2: INITIAL DATA COLLECTION 7
No Sub District Villages Covered
9 Ciampel 2
10 Kutawaluya 3
11 Cibuaya 5
12 Batujaya 9
13 Cikampek 8
14 Pedes 5
15 Jatisari 4
16 Telagasari 3
17 Rawamerta 3
18 Kota Baru 7
Service area of PDAM Tirta Tarum is illustrated in Error! Reference source not found.Error! Reference source not found.
Raw Water Source
A majority of the PDAM’s raw water supply comes from surface water sources, coming from the WTC and a small portion from deep wells (approximately 3.2 percent of total production)
Production Capacity
The total installed production capacity of PDAM Tirta Tarum is 720 l/s in 2009 with 80 percent production efficiency. This total production includes all water treatment plants (WTPs) within PDAM Tirta Tarum authority, including deep wells. Capacity and production of each WTP is provided in Error! Reference source not found..
Table 6: Service area, capacity and customers of PDAM Tirta Tarum
No Water Treatment Source Capacity
l/s
Production
l/s Status
1 Karawang Surface Water 300 270 Branch (Cabang)
2 Rengasdengklok Surface Water 40 27 Branch (Cabang)
3 Klari Surface Water 40 22 Branch (Cabang)
4 Telukjambe Surface Water 50 50 Branch (Cabang)
5 Cilamaya Surface Water 70 20 Branch (Cabang)
6 Rawamerta Deep Well 5 4 Capital Subdistrict (IKK )

CHAPTER 2: INITIAL DATA COLLECTION 8
No Water Treatment Source Capacity
l/s
Production
l/s Status
7 Telagasari Deep Well 5 4 Capital Subdistrict (IKK )
8 Lemah Abang Deep Well 10 8 Capital Subdistrict (IKK )
9 Pedes Surface Water 20 13 Capital Subdistrict (IKK )
10 Jatisari Surface Water 30 20 Capital Subdistrict (IKK )
11 Batujaya Surface Water 20 20 Capital Subdistrict (IKK )
12 Pangkalan Surface Water 20 14 Capital Subdistrict (IKK )
13 Cibuaya Surface Water 20 17 Capital Subdistrict (IKK )
14 Cikampek* Surface Water 40
15 Ciampel Surface Water 10 5 Capital Subdistrict (IKK )
16 Tirta Jaya* Surface Water 50
TOTAL 730 494
*The WTP at Cikampek and Tirta Jaya are not yet operating in full production.
Distribution System
PDAM Tirta Tarum uses a pump system as its distribution system from WTP or deep well.
The serviced areas are not yet interconnected to one and other and are still individually operated, whether it is the raw water source, or its production and distribution.
The NRW level based on 2009 data is 35 percent for the entire coverage area and 40 percent for Karawang area. The NRW is caused by leaks within the distribution pipes, of which many are ageing, especially GIP pipes. NRW target of PDAM Karawang in their business plan is 31 percent.
Schematic of transmission and distribution system is shown in Error! Reference source not found..
CHAPTER 2: INITIAL DATA COLLECTION 9
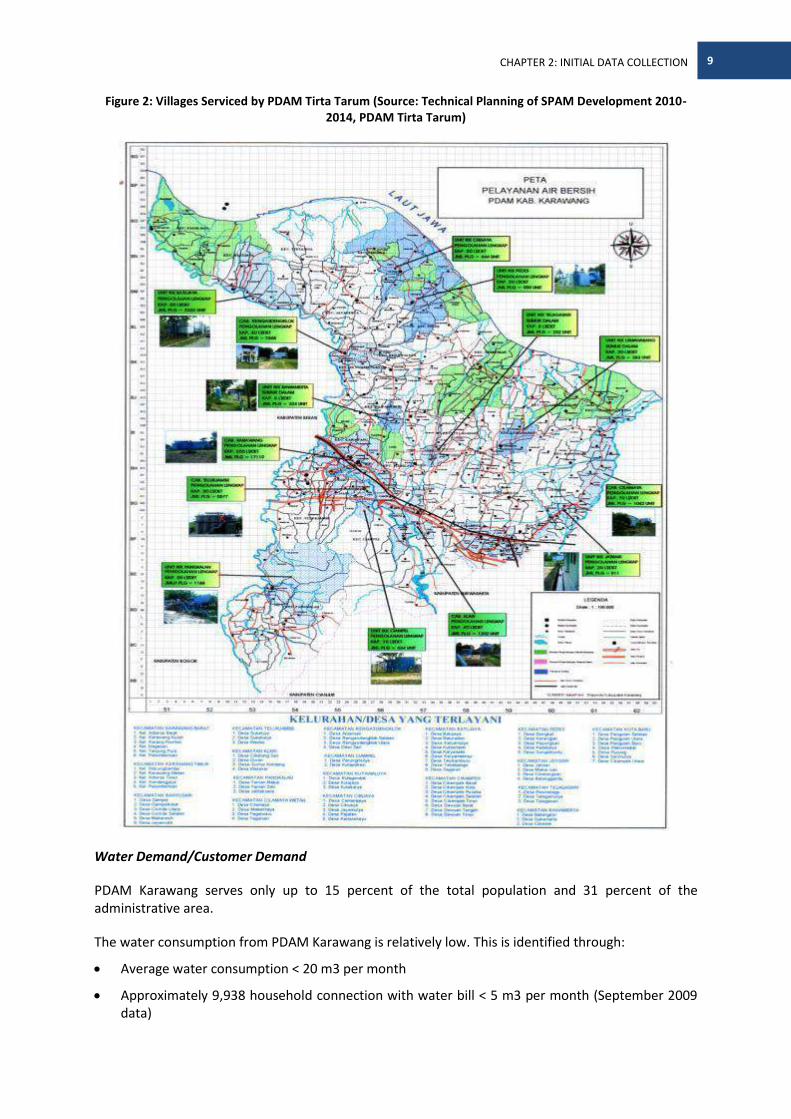
Figure 2: Villages Serviced by PDAM Tirta Tarum (Source: Technical Planning of SPAM Development 2010-2014, PDAM Tirta Tarum)
Water Demand/Customer Demand
PDAM Karawang serves only up to 15 percent of the total population and 31 percent of the administrative area.
The water consumption from PDAM Karawang is relatively low. This is identified through:
Average water consumption < 20 m3 per month
Approximately 9,938 household connection with water bill < 5 m3 per month (September 2009 data)

CHAPTER 2: INITIAL DATA COLLECTION 10
The consumer structure of PDAM is currently dominated with households/domestic (approximately 95 percent), while the commercial customer is only 5 percent. Meanwhile, based on the information from local government (PEMDA), there are approximately 650 industries operating in Karawang Regency, where majority are still using deep wells as the source of raw water.
2.2.3 Key Issues
Quantity and quality of raw water supplied by PJT II is declining and there is no guarantee for raw water quality.
The system condition, both for production unit as well as distribution unit, generally has been in operation for over 30 years.
Not all systems in PDAM Karawang have a water meter.
Meter zoning system by PDAM Tirta Tarum has not been performing optimally due to limited funds.
Some of the customer meters are in a bad condition (either damaged or unreadable).
The installed pipes for transmission and distribution are mostly located on the roadside. Leakage improvement will add extra cost. In addition, the pipe leakage could also be caused by repair of other road utilities, etc.
Production efficiency is below 100 percent at the WTP, caused by the declining condition of the pumps (Q).
Operational system of clean water supply is still under 24 hours, since the production capacity exceeds the demand. This is because the existing distribution pipes have not yet covered all consumers within the service area.
PDAM is not involved in the installation of large diameter pipes. Planning and implementation of large-diameter pipe installation is carried out by MPW, whose operation is then transferred to the PDAM.
There are approximately 650 industries in Karawang Regency, of which a majority disposes their effluent into the Citarum river.
2.3 SUMMARY OF DATA COLLECTION FROM PDAM BEKASI
2.3.1 Profile of Bekasi Regency
In the Bekasi Regency, there are 16 main rivers: Citarum, Bekasi, Cikarang, Ciherang, Belencong, Jambe, Sadang, Cikedokan, Ulu, Cilemahabang, Cibeet, Cipamingkis, Siluman, Serengseng, Sepang and Jaeran. The width of these rivers ranges between 3 to 80 meters.
There are also 13 streams across subdistricts: Situ Tegal Abidin, Situ Bojongmangu , Situ Bungur, Situ Ceper, Situ Cipagadungan, Situ Cipalahar, Situ Ciantra, Situ Taman, Situ Burangkeng, Situ Liang Maung, Siru Cibeureum, Situ Cilengsir and Situ Binong. The groundwater condition in Bekasi regency is mainly shallow groundwater at the depth of 5-25 m from ground level, while deep groundwater was found between the depth of 90 - 200 m.
CHAPTER 2: INITIAL DATA COLLECTION 11
2.3.2 Existing Condition
Service Area
PDAM Bekasi Tirta Dharma serves customers in the regencies as well as some customers within the city. The total service coverage was 29 percent according to PDAM Bekasi Business Plan Presentation 2009 -2013. During an interview, a PDAM Bekasi representative stated that PDAM Bekasi Coverage Area includes 26.42 percent for Bekasi City and 13 percent for Bekasi Regency. The map of PDAM Bekasi service area is given in Error! Reference source not found.
Raw Water Source and Production Capacity
99.25 percent of raw water source for PDAM Bekasi comes from WTC with flow of 2,005 l/s and small portion from groundwater (0.75 percent) with flow of 15 l/s. In addition, PDAM Bekasi also has an agreement to purchase treated water from PDAM Tirta Patriot up to 175 l/s but only utilise 140 l/s.
PDAM Bekasi has 20 units of WTP with current total capacity of 2020 l/s and current production of 1,725 l/s. Details of capacity of each WTP is provided in the following table and also within Error! Reference source not found..
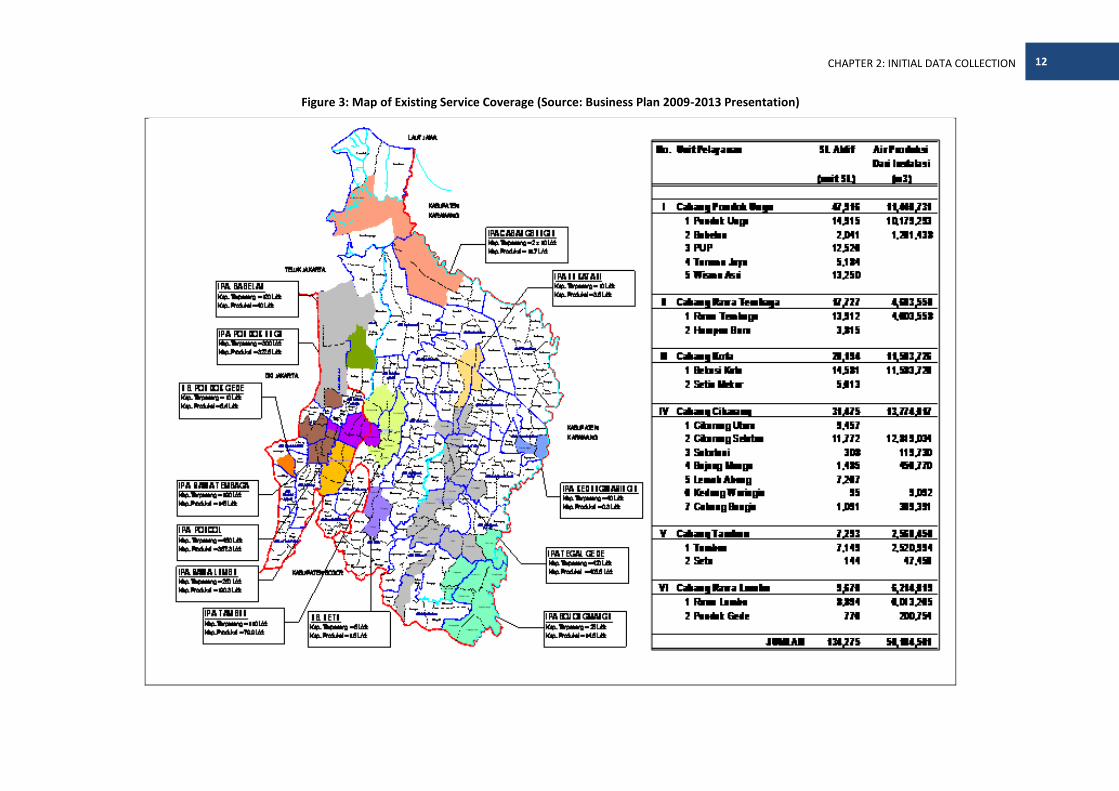
CHAPTER 2: INITIAL DATA COLLECTION 12
Figure 3: Map of Existing Service Coverage (Source: Business Plan 2009-2013 Presentation)

CHAPTER 2: INITIAL DATA COLLECTION 13
Table 7: Production Capacity and Installed Capacity of PDAM Bekasi WTP
No Branch / WTP Production Capacity
(l/s) Installed Capacity
(l/s)
Pondok Ungu Branch 491.4 420
1 Pondok Ungu 322.8 300
2 Babelan 40 120
3 PUP 38 -
4 Taruma Jaya - -
5 Wisma Asri 90.7 -
Rawa Tembaga Branch 150.9 190
6 Rawa Tembaga 146 190
7 Harapan Baru 5 0
City Branch 367.3 480
8 Bekasi City 367.3 480
9 Setia Mekar - -
Cikarang Branch 463.8 545
10 Cikarang Utara - -
11 Cikarang Selatan 406.5 420
12 Sukatani 3.8 20
13 Bojong Mangu 14.5 25
14 Lemah Abang - -
15 Kedung Waringin 0.3 40
16 Cabang Bungin 11.7 40
Tambun Branch 81.4 115
17 Tambun 79.9 110
18 Setu 1.5 5
Rawa Lumbu Branch 197 270
19 Rawa Lumbu 190.7 260
20 Pondok Gede (Deep Well) 6.4 10
Source: PDAM Bekasi Business Plan Presentation, 2009-2013

CHAPTER 2: INITIAL DATA COLLECTION 14
Distribution System
Up to 2008, total length of distribution system was approximately 1,886 km, mainly comprising of PVC pipes. Current NRW from distribution is 36.98 percent. Total reservoir capacity is 12,900 m3, capacity at each branch is given below:
Table 8: PDAM Bekasi Reservoir Capacity
Branch Capacity (m3)
Pondok Ungu 2000
Rawa Tembaga 2 x 500
City 250
500
4000
Rawa Lumbu 2 x 500
Tambun 250
1000
South Cikarang 1200
Babelan 500
Cabang Bungin 250
50
Sukatani 50
Bojong Mangu 250
Kedung Waringin 500
Pondok Gede 100
Total 12900
Source: PDAM Bekasi Business Plan Presentation, 2009-2013
Water Demand/Customer Demand
It was informed during the interview that PDAM Bekasi has a high demand for new connections, which averaged at three demands everyday. Currently, the PDAM has a waiting list of approximately 60,000 household connections with a total demand of approximately 400 l/s comprising of 20 percent for Bekasi City and 80 percent for Bekasi Regency2. The household connections in 2008 were 134,275 according to Business Plan Presentation and 140,495 connections at the end of 2009, based on data from PDAM Bekasi3.
2 MoM with PDAM Bekasi Dated 19 Jan 2010
3 Data from PDAM Bekasi – Production and Distribution.pdf: Laporan Sambungan Langganan Cabang / Wilayah
CHAPTER 2: INITIAL DATA COLLECTION 15
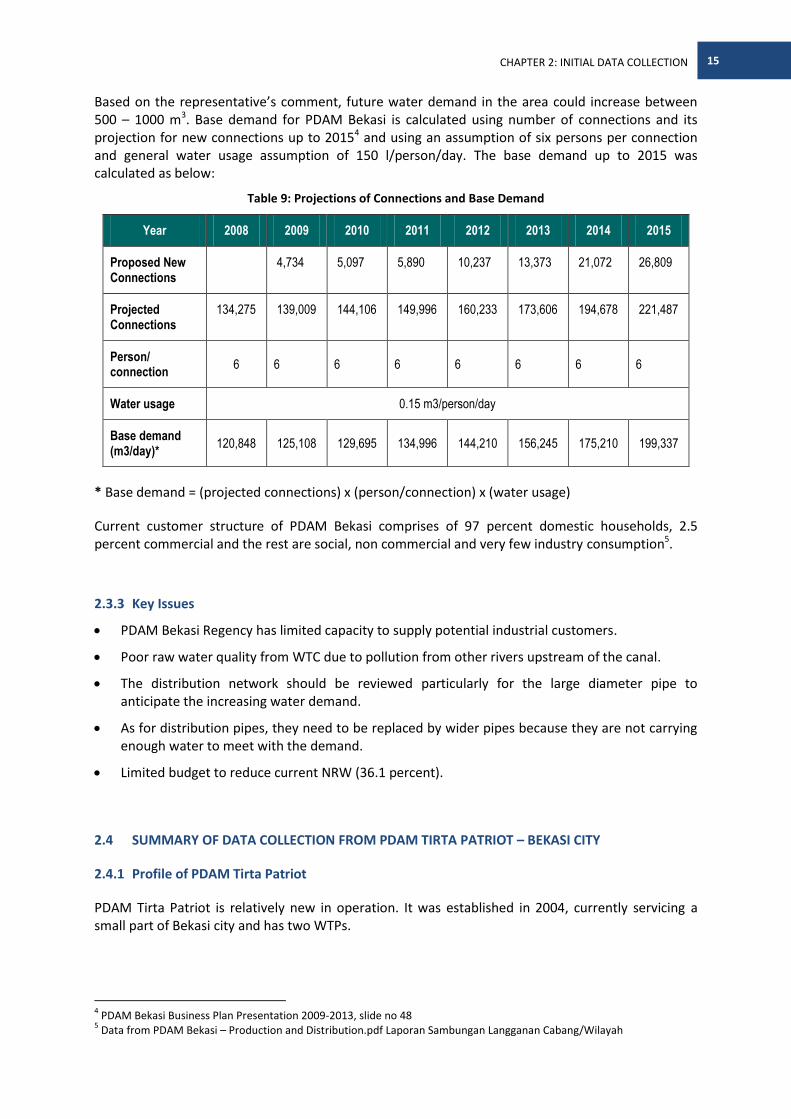
Based on the representative’s comment, future water demand in the area could increase between 500 – 1000 m3. Base demand for PDAM Bekasi is calculated using number of connections and its projection for new connections up to 20154 and using an assumption of six persons per connection and general water usage assumption of 150 l/person/day. The base demand up to 2015 was calculated as below:
Table 9: Projections of Connections and Base Demand
Year 2008 2009 2010 2011 2012 2013 2014 2015
Proposed New Connections
4,734 5,097 5,890 10,237 13,373 21,072 26,809
Projected Connections
134,275 139,009 144,106 149,996 160,233 173,606 194,678 221,487
Person/ connection
6 6 6 6 6 6 6 6
Water usage 0.15 m3/person/day
Base demand (m3/day)*
120,848 125,108 129,695 134,996 144,210 156,245 175,210 199,337
* Base demand = (projected connections) x (person/connection) x (water usage)
Current customer structure of PDAM Bekasi comprises of 97 percent domestic households, 2.5 percent commercial and the rest are social, non commercial and very few industry consumption5.
2.3.3 Key Issues
PDAM Bekasi Regency has limited capacity to supply potential industrial customers.
Poor raw water quality from WTC due to pollution from other rivers upstream of the canal.
The distribution network should be reviewed particularly for the large diameter pipe to anticipate the increasing water demand.
As for distribution pipes, they need to be replaced by wider pipes because they are not carrying enough water to meet with the demand.
Limited budget to reduce current NRW (36.1 percent).
2.4 SUMMARY OF DATA COLLECTION FROM PDAM TIRTA PATRIOT – BEKASI CITY
2.4.1 Profile of PDAM Tirta Patriot
PDAM Tirta Patriot is relatively new in operation. It was established in 2004, currently servicing a small part of Bekasi city and has two WTPs.
4 PDAM Bekasi Business Plan Presentation 2009-2013, slide no 48
5 Data from PDAM Bekasi – Production and Distribution.pdf Laporan Sambungan Langganan Cabang/Wilayah

CHAPTER 2: INITIAL DATA COLLECTION 16
2.4.2 Existing Condition
Service Area
PDAM Tirta Patriot serves mainly the northern part of Bekasi city, approximately 560 ha. The current coverage area is 11.7 percent of the population or 2.7 percent of Bekasi city area. Illustration of coverage area of PDAM Tirta Patriot is provided in the figure below.
Figure 4: Service Coverage of PDAM Tirta Patriot
Raw Water Source and Production Capacity
PDAM Tirta Patriot receives its entire supply of raw water from the WTC and has two WTPs with the following capacity:
Table 10: PDAM Tirta Patriot Water Production and Capacity in 2009
Installed Capacity (l/s) Current Use (l/s) Idle Capacity
WTP 1 = 200 Distributed to service area = 150
125 l/s WTP 2 = 250 Treated water to PDAM Bekasi = 175

CHAPTER 2: INITIAL DATA COLLECTION 17
Installed Capacity (l/s) Current Use (l/s) Idle Capacity
Total 450 l/s 325 l/s
Distribution System
Summary of PDAM Tirta Patriot’s distribution system is given in table below:
Table 11: Distribution Components for PDAM Tirta Patriot
Components Description
Current NRW Less than 20 percent6 or 16 percent average NRW7
Distribution network length, diameter and material
The overall length of distribution pipe is approx 212 km, of which almost 100 percent are PVC and the rest is Galvanised Iron (GI).
The diameter of PVC pipe ranges between 50 – 450 mm. Diameter of GI ranges between 100 – 500 mm.
Pumps PDAM Tirta Patriot has three intake pumps with a capacity of 100 l/s each, and one stand-by pump with a capacity of 250 l/s.
The distribution system also consists of three pumps with a capacity of 100 l/s each and one stand-by pump with a capacity of 250 l/s
PDAM Tirta Patriot proposes to have two additional distribution pumps with a capacity of 200 l/s each.
Storage Reservoirs Reservoir capacity is 4000 m3. PDAM Tirta Patriot proposes to have additional storage of 4000 m3
Source: PDAM Tirta Patriot Company Profile
Water Demand/Customer Demand
According to data provided by PDAM Tirta Patriot8, it had approximately 11,002 connections in 2009, with a target to increase 1,500 connections per year, up to 2020. This data was utilised to predict the water demand, using assumptions of 7 persons per house connection and water usage of 150 l/person/day. Accordingly, the projection of water demand is given in table below:
Table 12: Projections of Connections and Base Demand
Year 2009 2010 2011 2012 2013 2014
Proposed New Connections
1,500 1,500 1,500 1,500 1,500
6 From Interview with PDAM Tirta Patriot Representative
7 PDAM Tirta Patriot Company Profile Presentation
8 Spreadsheet Data provided by Tirta Patriot – Jumlah pelanggan.xls

CHAPTER 2: INITIAL DATA COLLECTION 18
Projected Connections
11,002 12,502 14,002 15,502 17,002 18,502
Person/ connection 7 7 7 7 7 7
Water Usage 0.15 m3/person/day
Base demand (m3/day)*
11,552 13,127 14,702 16,277 17,852 19,427
Year 2015 2016 2017 2018 2019 2020
Proposed New Connections
1,500 1,500 1,500 1,500 1,500
Projected Connections
20,002 21,502 23,002 24,502 26,002 27,502
Person/ connection 7 7 7 7 7 7
Water Usage 0.15 m3/person/day
Base demand (m3/day)*
21,002 22,577 24,152 25,727 27,302 28,877
* Base demand = (projected connections) x (person/connection) x (water usage)
Up to October 2009, the PDAM’s customer structure consisted of 99 percent domestic households, with the remaining being small commercial, social and non-commercial users.
2.4.3 Key Issues
Poor raw water quality from the WTC.
2.5 SUMMARY OF DATA COLLECTION FROM PALYJA
2.5.1 Profile of Palyja
PT Pam Lyonnaise Jaya (PALYJA) is a part of Suez-Environment, PT Astratel Nusantara and Citigroup Financial and has been operating drinking water services in the Western Part of DKI Jakarta since 1998. PALYJA owns four water plants, with two high capacity plants in Pejompongan (up to 6,200 l/s). The main raw water source for PALYJA comes from the WTC and some from Cisadane River, through purchased treated (bulk) water agreement with Tangerang.
2.5.2 Existing Condition
Service Area

CHAPTER 2: INITIAL DATA COLLECTION 19
PALYJA service area coverage is the western region of DKI Jakarta as shown in figure below. Service coverage in 2006 was 55.5 percent9.
Figure 5: PALYJA Service Area (Source: PALYJA Master Plan, January 2008)
Raw Water Source and Production Capacity
PALYJA receives raw water supply from the WTC, Cengkareng Drain, Krukut River, and Banjir Kanal and it also purchases treated water from Serpong WTP, Cikokol WTP and from Aetra, as shown in the table below.
9 PALYJA Master Plan, Volume 1, pg. 2-3

CHAPTER 2: INITIAL DATA COLLECTION 20
Table 13: PALYJA Water Source and Production Capacity
Description Raw Water Source (l/s) Design Capacity (l/s) Actual Production
(l/s)
PALYJA Production
Pejompongan 1 WTC 2,100 2,200 2,000
Pejompongan 2 WTC 3,780 3,800 3,600
Cilandak Krukut River n/a 400 400
Taman Kota (to be closed) Cengkareng Drain n/a 200 160
Total WTP Production Capacity 6,160 l/s
Purchased Treated Water
DCR5+DCR4 Cisadane Serpong n/a 2,800 2,600
Cikokol Cikokol WTP n/a 78 84
TPJ n/a 199 50
Total 5,880 l/s from West Tarum Canal
9,677 l/s 8,894 l/s
Source: PALYJA Master Plan Volume 4, 2007
Distribution System
Summary of PALYJA’s distribution system is given in Error! Reference source not found..
Table 14: Distribution Components for PALYJA
Components Description
Customer Services Unit (CSU) Central CSU (Zone 1)
West CSU (Zone 4)
South CSU (Zone 5)
Main CSU for large volume customers
Water into distribution network Pejompongan 1 and 2 WTP (mainly CSU Central)
Cilandak WTP (mainly CSU South)
Taman Kota WTP (CSU West)
Distribution Centre DC-R4 (from Cisadane into CSU West)
Distribution Centre DC-R5 (from Cisadane into CSU South)
Cikokol pipeline into CSU West
Cengkareng Booster pump station

CHAPTER 2: INITIAL DATA COLLECTION 21
Components Description
Transfer from TPJ
Pressures within network Ranges between 0 and 1.4 bar
Average: 0.4 – 0.6 bar, inadequate pressure in the north and northwest
Current NRW 43 percent10
Primary and Distribution network The overall length is 5106 km, of which 379 km – or 7 percent – forms the primary network.
Distribution network makes up 93 percent of overall network which amounts to 4,727 km.
Pipe Diameter Diameter of primary network pipeline ranges from 300 – 1200 mm.
Diameter of distribution network is approximately 250 mm or less.
Pipe Materials11 Primary network:
49 percent DCI, 23 percent PVC, 23 percent STL, the rest are HDPE, GIP, FGP, AC
Distribution network extension:
84 percent PVC , 8 percent GIP, 8 percent DCI
Pumping Stations
Distribution pumping stations
Booster Pump Stations
At all WTPs and DCs. Highest capacity and number of pumps in Pejompongan 1 and 2, as follows:
Pejompongan 1:
3 x 1000 l/s x 42m
2 x 500 l/s x 42m
2 x 100 l/s x 42m
Pejompongan 2:
3 x 1500 l/s x 48m
3 x 750 l/s x 48m
BP Jembatan Besi, BP Gedong Panjang, BP Cengkareng, BP Daan Mogot
Storage Reservoirs
At Treatment Plants
At Distribution Centres
Booster Pump Stations
111,220 m3
63,750 m3
45,000 m3
2,470 m3
Source: PALYJA Master Plan Volume 5, 2007
10
From MoM with PALYJA dated 20 January 2010 11
PALYJA Master Plan Vol 5 p.2-7/2.8

CHAPTER 2: INITIAL DATA COLLECTION 22
Water Demand/Customer Demand
Based on PALYJA master plan, water demand was predicted to increase from 354,368 m3/day in 2005 to 515,775 m3/day by 2022. The prediction of base demand is summarised below.
Table 15: Base Demand Calculation
Year 2005 2007 2012 2017 2022
Base Demand 354,368 360,356 443,842 486,355 515,775
Source: PALYJA Master Plan, Vol 3, 2007
According to its official website, PALYJA had approximately 412,456 connections in 200912. Structure of the customer group is provided below:
Table 16: Customer Group Breakdown
Group Description Customer Percentage
K1 Social Customer 48 percent
K2 Low Income Costumer
K3A Middle Class
K3B Upper Class 22 percent
K4A Small Business 30 percent
K4B Non Domestic
KSP Special
Source: PALYJA Master Plan Volume 2, 2007
Water Quality
According to PALYJA Master Plan, 97.25 percent of water samples taken from distributed water to customers in 2006 were in compliance with ‘Clean Water Standards’. The highest proportion of failed samples was mostly due to total coli and organics.
Key Issues
Poor raw water quality standard.
High NRW (51-43 percent).
Frequency of interruptions affecting water supply, in particular for Pejompongan (unreliable electricity).
12
http://www.palyja.co.id/?page=ourcompany&postid=20
CHAPTER 2: INITIAL DATA COLLECTION 23
2.6 SUMMARY OF DATA COLLECTION FROM AETRA
2.6.1 Profile of Aetra
PT Aetra Air Jakarta (AETRA) is a private company operating clean water systems in the eastern side of Jakarta since 2007. This service was formerly operated under PT Thames Pam Jaya.
AETRA has three water treatment plants; two of which are located in Buaran and the third in Pulo Gadung. The total production capacity of AETRA is approximately 9,000 l/s, where almost 100 percent of water supply is from the WTC.
2.6.2 Existing Condition
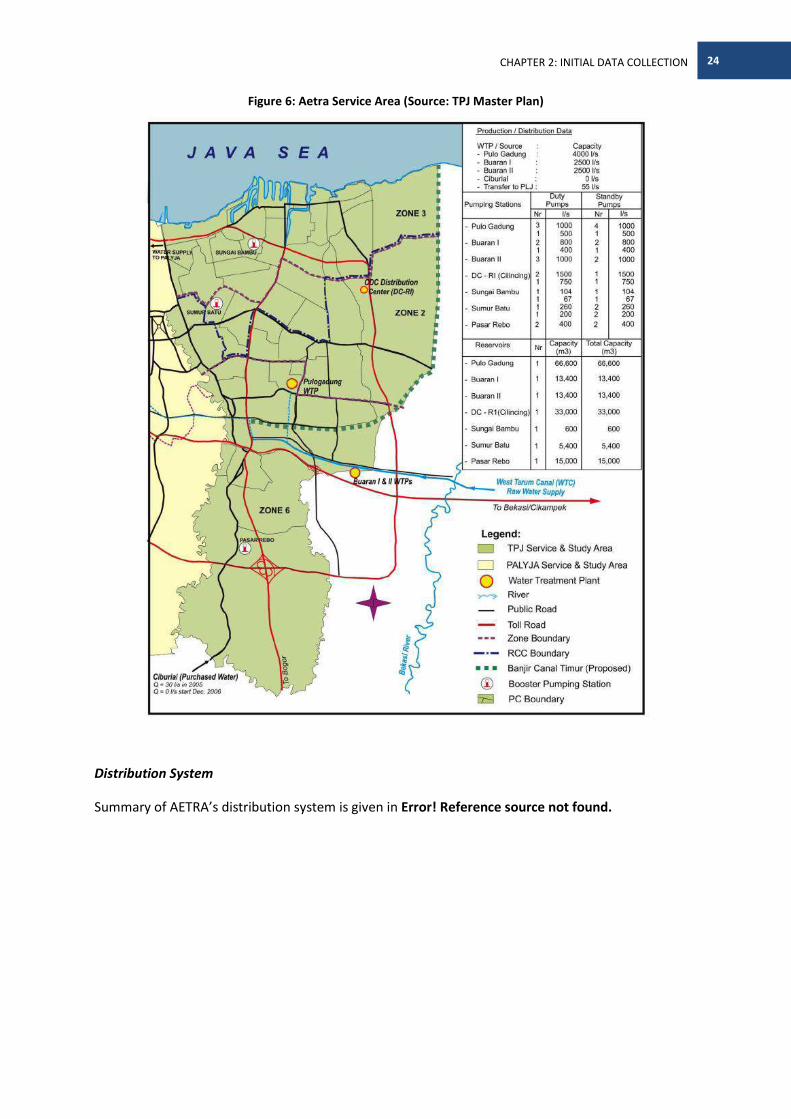
Service Area
AETRA service area covers the eastern region of DKI Jakarta as shown in the figure below. Service coverage was 67 percent13 in 2006 and 62 percent in 2009, based on an interview with the AETRA representative14.
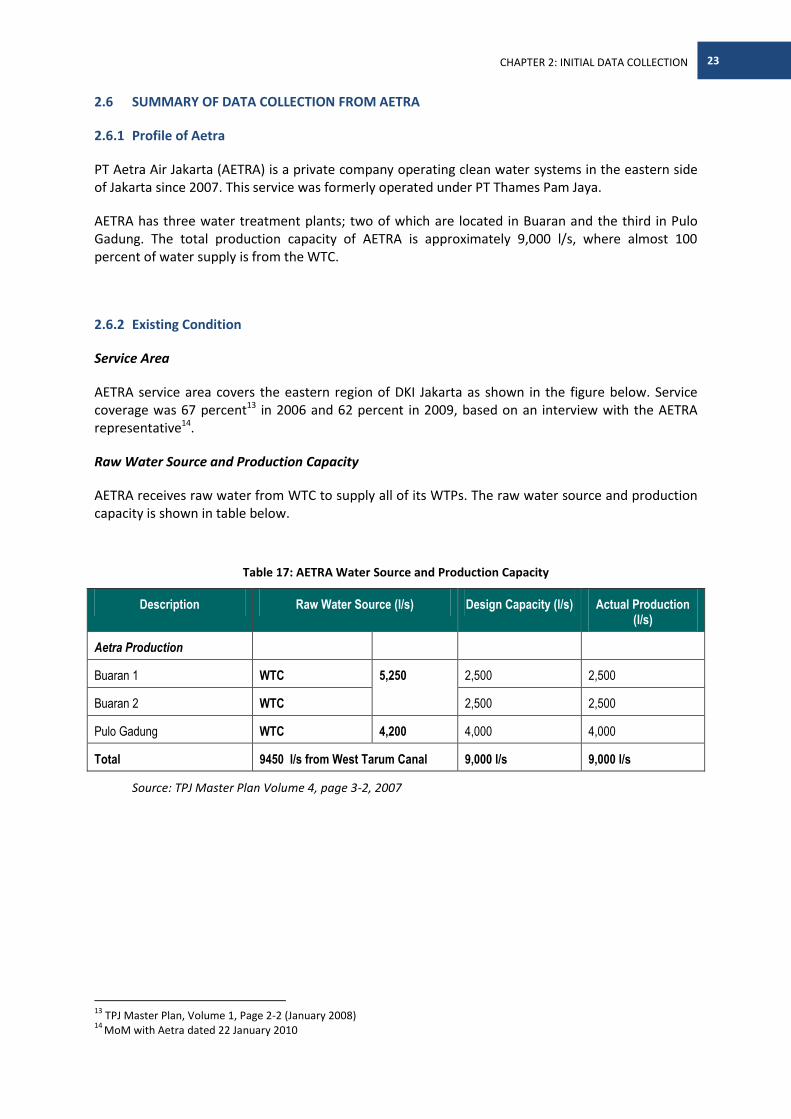
Raw Water Source and Production Capacity
AETRA receives raw water from WTC to supply all of its WTPs. The raw water source and production capacity is shown in table below.
Table 17: AETRA Water Source and Production Capacity
Description Raw Water Source (l/s) Design Capacity (l/s) Actual Production (l/s)
Aetra Production
Buaran 1 WTC 5,250 2,500 2,500
Buaran 2 WTC 2,500 2,500
Pulo Gadung WTC 4,200 4,000 4,000
Total 9450 l/s from West Tarum Canal 9,000 l/s 9,000 l/s
Source: TPJ Master Plan Volume 4, page 3-2, 2007
13
TPJ Master Plan, Volume 1, Page 2-2 (January 2008) 14
MoM with Aetra dated 22 January 2010
CHAPTER 2: INITIAL DATA COLLECTION 24
Figure 6: Aetra Service Area (Source: TPJ Master Plan)
Distribution System
Summary of AETRA’s distribution system is given in Error! Reference source not found.
CHAPTER 2: INITIAL DATA COLLECTION 25
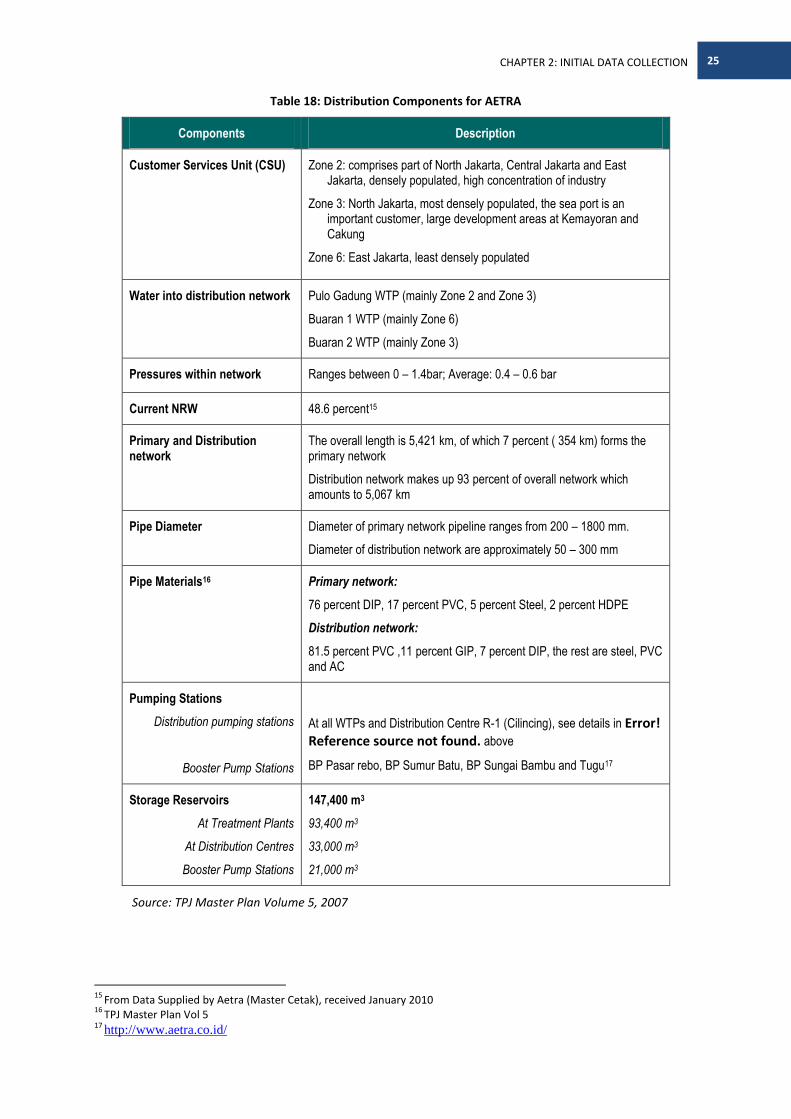
Table 18: Distribution Components for AETRA
Components Description
Customer Services Unit (CSU) Zone 2: comprises part of North Jakarta, Central Jakarta and East Jakarta, densely populated, high concentration of industry
Zone 3: North Jakarta, most densely populated, the sea port is an important customer, large development areas at Kemayoran and Cakung
Zone 6: East Jakarta, least densely populated
Water into distribution network Pulo Gadung WTP (mainly Zone 2 and Zone 3)
Buaran 1 WTP (mainly Zone 6)
Buaran 2 WTP (mainly Zone 3)
Pressures within network Ranges between 0 – 1.4bar; Average: 0.4 – 0.6 bar
Current NRW 48.6 percent15
Primary and Distribution network
The overall length is 5,421 km, of which 7 percent ( 354 km) forms the primary network
Distribution network makes up 93 percent of overall network which amounts to 5,067 km
Pipe Diameter Diameter of primary network pipeline ranges from 200 – 1800 mm.
Diameter of distribution network are approximately 50 – 300 mm
Pipe Materials16 Primary network:
76 percent DIP, 17 percent PVC, 5 percent Steel, 2 percent HDPE
Distribution network:
81.5 percent PVC ,11 percent GIP, 7 percent DIP, the rest are steel, PVC and AC
Pumping Stations
Distribution pumping stations
Booster Pump Stations
At all WTPs and Distribution Centre R-1 (Cilincing), see details in Error! Reference source not found. above
BP Pasar rebo, BP Sumur Batu, BP Sungai Bambu and Tugu17
Storage Reservoirs
At Treatment Plants
At Distribution Centres
Booster Pump Stations
147,400 m3
93,400 m3
33,000 m3
21,000 m3
Source: TPJ Master Plan Volume 5, 2007
15
From Data Supplied by Aetra (Master Cetak), received January 2010 16
TPJ Master Plan Vol 5 17 http://www.aetra.co.id/

CHAPTER 2: INITIAL DATA COLLECTION 26
Water Demand/Customer Demand
Based on TPJ master plan, water demand was predicted to increase from 377,276 m3/day in 2005 to 562,823 m3/day by 2022. The prediction of base demand is summarised below.
Table 19: Base Demand Calculation
Year 2005 2007 2012 2017 2022
Base Demand 377,276 345,690 452,203 514,206 562,823
Source: TPJ Master Plan, Vol 3, 2007
The latest data from AETRA18 shows that it had a total of 382,693 connections in 2009. Structure of customer group is provided below:
Table 20: Customer Group Breakdown
Group Description Total Customer Percentage
K1 Social Customer 4140 1 percent
K2 Low Income Costumer 37590 10 percent
K3A Middle Class 200853 52 percent
K3B Upper Class 82653 22 percent
K4A Small Business 45200 12 percent
K4B Non Domestic 12254 3 percent
KSP Special 3 0 percent
TOTAL 382,693
Source: AETRA Customer Structure Data, excerpt from PPSES Report
Water Quality
According to TPJ Master Plan, 97.6 percent of water samples taken from water supplied to customers in 2006 were in compliance with ‘Clean Water Standards’.
2.6.3 Key Issues
High number of connections with zero consumption.
18
Data from AETRA, Number of Customer 2009 (Master Cetak)

CHAPTER 2: INITIAL DATA COLLECTION 27
Poor raw water quality
High NRW (48.6 percent)

CHAPTER 3: DATA ANALYSIS 28
CHAPTER 3: DATA ANALYSIS
3.1 INITIAL WATER DEMAND ANALYSIS
Based on the existing data, the current base water demand is estimated at 937,500 m3/day and is projected to increase to 1,606,000 m3/day or approximately to 18 m3/s in 2025, excluding NRW. However, this figure has to be confirmed in the next stage as there are missing data and targets required in making accurate projections. The water demand projection is shown in the table and figure below.
Table 21: Water Demand Prediction
2005 2007 2009 2012 2015 2017 2022 2025
PALYJA (opt1) 354,368 360,356 393,750 443,842 469,350 486,355 515,775 533,427
Aetra (Opt 1) 377,276 345,690 382,693 452,203 489,405 514,206 562,823 591,993
PDAM Bekasi 120,848 144,209 199,337 236,090 327,971 383,099
PDAM Tirta Patriot 11,552 16,277 21,002 24,152 32,027 36,752
PDAM Karawang 28,620 33,131 38,354 42,285 53,967 60,977
Total (m3/d) 937,463 1,089,662 1,217,448 1,303,088 1,492,563 1,606,248
Total (m3/s) 10.85 12.61 14.09 15.08 17.28 18.59
Legend:
5% growth rate assumption
from master plan from calculations / projections
from PALYJA - master cetak
data not available

CHAPTER 3: DATA ANALYSIS 29
Figure 7: Projection of Base Demand
From the table and figure above, water demand from both PALYJA and AETRA makes up 70 percent of the overall demand, followed by Bekasi Regency, Bekasi City and Karawang. Assumptions used for calculating water demand for each operator is described below:
PDAM Karawang
The demand for Karawang is estimated based on current house connections19, water demand assumption of 120 litre/person/day and ratio of six people per connection (verbal confirmation from PDAM Karawang) and assumption of 5 percent increase in growth rate.
PDAM Bekasi Regency
The demand for PDAM Bekasi is estimated based on current house connections and its target for expansion up to 2015, as given in their Business Plan20, using ratio of six people per connection. Since no data is available, water demand in 2017-2025 is projected from demand in previous year, using linear equation.
PDAM Tirta Patriot, Bekasi City
The water demand for PDAM Tirta Patriot is calculated based on their actual existing connection, rate of 1,500 connection increase per year21 and ratio of seven people per connection.
PALYJA
All data used for PALYJA is taken from Master Plan 2007, except for the years 2009, 2015 and 2025, where it uses projection method.
19
PDAM Karawang presentation – Perencanaan Teknis Pengembangan SPAM Tahun Anggaran 2008 - 2014 20
PDAM Bekasi presentation – Business Plan 2009 – 2013 21
PDAM Tirta Tarum PROYEKSI KEBUTUHAN AIR BERSIH PENDUDUK WILAYAH UTARA KOTA BEKASI s.d Th. 2020 – excel spreadsheet
Projection of Base Demand (m3/day)
0
200,000
400,000
600,000
800,000
1,000,000
1,200,000
1,400,000
1,600,000
1,800,000
2005 2007 2009 2012 2015 2017 2022 2025
Year
Dem
and
(m3/
day)
PALYJA (opt1) Aetra (Opt 1) PDAM Bekasi
PDAM Tirta Patriot PDAM Karawang Total (m3/d)

CHAPTER 3: DATA ANALYSIS 30
AETRA
The current data (2009) used for AETRA is based on actual data provided by the operator. The past and future projections are taken from TPJ Master Plan 2007, except for 2015 and 2025 where it uses projection method.
3.2 SUPPLY ANALYSIS
The supply analysis is performed for both, quantity and quality of water in relevant location.
3.2.1 Water Quantity
Based on the Citarum Water Balance provided by PJT II (dated 28 January 2010), the combined effective annual volume of Saguling, Cirata and Djuanda (Jatiluhur) dam is 1,708.28 million m3. Quantity of water from Citarum river is 4,764.63 million m3 per annum, with an assumption of normal flow. With addition of water from other local sources, the volume of water available is 8,126 million m3 per annum before extracted with current use. The detail is provided below:
Table 22: 2009 Water Balance
Water Supply (million m3/year) Existing Use (million m3/year)
Effective Volume from 3 dams 1,708.28 Irrigation 4,651.8
Flow from Citarum 4,764.63 Industrial 813.57
Other Local sources 1,653.29 Gadu II (Others) 286.5
Total Potential Water Supply 8,126.2 Total existing usage 5,751.87
Water Balance Available for Other Use 2,374.33 million m3/year
75.29 m3/s
Source: PJT II Neraca Air Sungai Citarum as per 28 January 2010
3.2.2 Water Quality
GHD has obtained water quality results within Jatiluhur Reservoir and along Citarum River from January - December 2009, provided by PJT II. The water quality results appear not to have been carried out by an accredited testing agency. The sampling and analysis methods have not been indicated.
This section provides evaluation of the results as presented.
The locations of interest are the possible locations for proposed WTP, except for Cikao which is the only waterway between Jatiluhur and Curug. From all the sampling points, the locations of interest are described below:

CHAPTER 3: DATA ANALYSIS 31
1. Pasir Gombong – possible location for WTP. There was no sampling taken in the location during 2009. The nearest water quality sampling taken was in Kerenceng, approximately 7 km from Pasir Gombong on the Jatiluhur Dam.
2. Citarum river before the confluence with Cikao river – possible location for WTP. Represented by the sampling taken at Jatiluhur outlet.
3. Cikao river – the only major waterway between Jatiluhur – Curug. Sampling taken upstream or before confluence with Citarum river.
4. Curug dam – possible location for WTP.
All the above locations of interest are shown in Error! Reference source not found.Error! Reference source not found..
Figure 8: Water Quality Results in Jatiluhur - Curug
The water quality data for the above locations are summarised in Error! Reference source not found. Error! Reference source not found..

CHAPTER 3: DATA ANALYSIS 32
Table 23: Summary of Water Quality
Water Quality Standard22
Jan Feb Mar Apr May Jun Jul Aug Sep Oct Nov Dec
Turbidity (NTU)
1.Kerenceng 4.06 1.54 2.86 2.86 - - 2.86 1.93 4.06 - - -
2.Jatiluhur outlet 6.29 1.32 1.28 - - - 2.30 2.28 6.29 2.02 2.50 2.50
3.Cikao 69.50 39.10 84.50 - - - 21.90 12.50 69.50 11.70 2.70 2.70
4.Curug 28.6 44.0 5.4 60.1 27.6 - 28.6 28.6 - - -
TDS (mg/l) 1000
1.Kerenceng 180.00 100.00 280.00 280.00 - - 280.00 320.00 180.00 - - -
2.Jatiluhur outlet 190.00 100.00 100.00 - - - 270.00 30.00 190.00 110.00 60.00 60.00
3.Cikao 130.00 110.00 80.00 - - - 260.00 670.00 130.00 130.00 110.00 110.00
4.Curug 70 210 150 160 140 - - 70 70 - - -
BOD (mg/l) 6
1.Kerenceng 7.34 1.08 3.04 3.04 - - 3.04 4.36 7.34 - - -
2.Jatiluhur outlet 8.33 5.56 3.04 - - - 4.02 2.18 8.33 1.11 3.34 3.34
3.Cikao 2.55 5.51 1.37 - - - 9.43 2.98 2.55 1.22 2.13 2.13
4.Curug 4.08 5.88 5.56 5.12 - - - - - - -
22
Surat Keputusan Gubernur Jawa Barat No 39 Tahun 2000

CHAPTER 3: DATA ANALYSIS 33
Water Quality Standard22
Jan Feb Mar Apr May Jun Jul Aug Sep Oct Nov Dec
COD (mg/l) 10
1.Kerenceng 19.12 5.00 7.23 7.23 - - 7.23 10.71 19.12 - - -
2.Jatiluhur outlet 21.51 13.54 7.14 - - - 10.16 5.26 21.51 5.00 8.06 8.06
3.Cikao 6.37 13.54 5.00 - - - 25.20 6.88 6.37 5.00 5.24 5.24
4.Curug 7.14 10.20 15.26 13.54 12.85 - - 7.14 7.14 - - -
H2S (mg/l) 0.002
1.Kerenceng 0.03 0.03 0.03 0.03 - - 0.03 0.03 0.03 - - -
2.Jatiluhur outlet 0.03 0.05 0.03 - - - 0.08 0.04 0.03 0.35 0.03 0.03
3.Cikao 0.08 0.11 0.03 - - - 0.03 0.04 0.08 0.04 1.03 1.03
4.Curug < 0.025 0.04 0.07 0.04 0.09 - - < 0.025 < 0.025 - - -
Source: Consolidated Water Quality Data Provided by PJT II

CHAPTER 3: DATA ANALYSIS 34 34
Based on the above results, the water quality in proposed locations is within the permitted limit for raw water, except for H2S in all locations and for turbidity and COD at Curug (high turbidity from Cikao River is causing high turbidity at Curug).
However, there are significant gaps in provided data i.e. missing data in May - June and October – December, no WQ sampling for lead, identical results repeated for several months, etc. These results also contradict with the water quality results presented by PJT II in the IPA Workshop presentation23, dated May 2009. PJT II - IPA Workshop presentation results indicate:
lead detected in some fish species
heavily polluted by organic materials
highly eutrophic level in 2006
bad odour of H2S at tailrace and fisheries area
high sediment in at least half of the dam area
dark colour water at Jatiluhur outflow
The source of the data presented has not been confirmed. A sampling and testing program by accredited laboratory is required for more reliable assessment of the water quality.
In addition, the reference standard currently used is the Surat Keputusan Gubernur Jawa Barat No 39 Tahun 2000 tentang Peruntukan Air pada sungai Citarum dan anak-anak sungainya di Jawa Barat, with water quality for class BCD (suitable for fish cultivation, farming, irrigation, etc). If the raw water from Jatiluhur will be used as raw water for drinking water, it has to comply with water quality standard for Class I of Government Regulation - Peraturan Pemerintah No. 82 Tahun 2001. The key water quality parameters for Class I are as follows:
Table 24: Water Quality Standard for Class I (Clean Water Quality Standard)
PARAMETER Unit
Class
PARAMETER Unit
Class
I I
Physical Chemical – cont.
Temperature 0C + 3 Chrome (VI) mg/L 0.05
TDS mg/L 1000 Copper mg/L 0.02
TSS mg/L 50 Iron (Fe) mg/L 0.3
Chemical Lead (Pb) mg/L 0.03
pH 6 - 9 Manganese mg/L 0.1
BOD mg/L 2 Mercury (Hg) mg/L 0.001
COD mg/L 10 Zinc mg/L 0.05
23
PJT II Presentation – Integrated Citarum River Basin Management for Jakarta Raw Water Supply

CHAPTER 3: DATA ANALYSIS 35 35
PARAMETER Unit
Class
PARAMETER Unit
Class
I I
DO mg/L Minimum 6 Chloride mg/L 600
Phosphate - P mg/L 0.2 Cyanide mg/L 0.02
NO3 - N mg/L 10 Fluoride mg/L 0.5
NH3-N mg/L 0.5 Nitrite - N mg/L 0.06
Arsenic mg/L 0.05 Sulphate mg/L 400
Cobalt mg/L 0.2 Free Chlorine mg/L 0.03
Barium mg/L 1 Sulphur as H2S mg/L 0.002
Boron mg/L 1 Microbiology
Selenium mg/L 0.01 Fecal Coliform /100 ml 100
Cadmium mg/L 0.01 Total coliform /100 ml 1000
3.2.3 Existing Treatment Plant Capacity
Existing treatment plant capacity of PDAMs and Operators are summarised in the following table. No assessment of the residual economic life of these plants has been conducted.
Table 25: Existing Treatment Plant Capacity
WTP Operator Production
Capacity (l/s)
Design Production
Capacity (l/s)
Raw Water Source
Raw water from WTC
(l/s)
Year Built/ Upgrade
Pejompongan I WTP
PALYJA 2,000 2,200 West Tarum Canal
2,100 1957/1996
Pejompongan II WTP
PALYJA 3,600 3,800 West Tarum Canal
3,780 1970/1986
Taman Kota WTP (proposed closure)
PALYJA 160 200 Cengkareng Drain
- 1982/1989
Cilandak WTP PALYJA 200 400 Krukut River - 1977/1999
Buaran WTP AETRA 5,000 5,000 West Tarum Canal
5,250 1995
Pulo Gadung WTP AETRA 4,000 4,000 West Tarum Canal
4,200 1982
Bekasi WTP PDAM Bekasi 1,725 2,020 West Tarum Canal
2,010 n/a

CHAPTER 3: DATA ANALYSIS 36 36
WTP Operator Production
Capacity (l/s)
Design Production
Capacity (l/s)
Raw Water Source
Raw water from WTC
(l/s)
Year Built/ Upgrade
Tirta Patriot WTP PDAM Tirta Patriot
325 450 West Tarum Canal
n/a 2003
Karawang WTP PDAM Karawang
494 720 West Tarum Canal
n/a 1968/ 2007/ 2008
3.3 SUPPLY RELIABILITY
The water supply in terms of quantity appears to be adequate for the estimated demand projection up to 2025. From the limited water quality data provided, it appears all sources may not meet the clean raw water for drinking water quality standard.
The reliability of both, water quantity and water quality depends on protection of catchment area, which is still very poor. This is evident by the extensive fish farming in the Jatiluhur Reservoir, limited control of untreated wastewater discharge to the waterways as well as forest degradation.
The supply reliability is also influenced by the PLN power generation storage and demand requirements.
The next stage will need to include comprehensive plan of water balance for the Jatiluhur reservoir to substantiate supply reliability.

CHAPTER 4: PROJECT OPTIONS 37 37
CHAPTER 4: PROJECT OPTIONS
The Jakarta-Jatiluhur Pipeline Project to provide drinking water quality supply to DKI Jakarta and selected PDAM’s should include:
Staging Options
There are two options for project development.
One is to start treating to drinking water standard immediately. This would require existing PDAM’s assets to be shut down or convert to distribution centres. The sub-options are to stage or not to stage process unit and the pipelines (see Error! Reference source not found. – Indicative Staging options).
Second option is to treat clean water using the existing PDAM system and stage the development of the new treatment plant until eventually it will deliver drinking water quality.
Intake and WTP Location
Currently three possible intakes and water treatment locations have been considered. These locations and primary reason for consideration are as follows. The detailed pros and cons are considered in Error! Reference source not found..
Curug, adjacent to the existing WTC headworks. This location has associated infrastructure, such as power and access are already established.
Citarum river upstream of the confluence with Cikao river. Better quality of water and close to the discharge of Jatiluhur Reservoir.
Pasir Gombong. Better quality of water as new intake will be directly from Jatiluhur Reservoir and pumping costs would be considerably reduced as advantage can be taken of the dam elevation.
For scenario utilising current PDAM’s WTP, a treatment plant in the upstream is still required since it has to meet the standard of clean raw water for drinking water quality standard (Government Regulation no. 82 year 2001: Water Quality Standard Class I Water), the capacity of existing WTP should also be considered to meet with drinking water quality standard.
Piping route (trunk main route options)
The main consideration for piping routes are the land acquisition and head availability related with pumping system consideration.
From all three options, the route along toll road and route along kalimalang would have relatively minimal land acquisition, but has other considerations, in particular the possibility of inadequate space.
The alternative route via Jonggol presumably requires more land acquisition and has longer trunk main as it has to be connected to Bekasi and Karawang, but has possible future development for south Jakarta.
CHAPTER 4: PROJECT OPTIONS 38 38
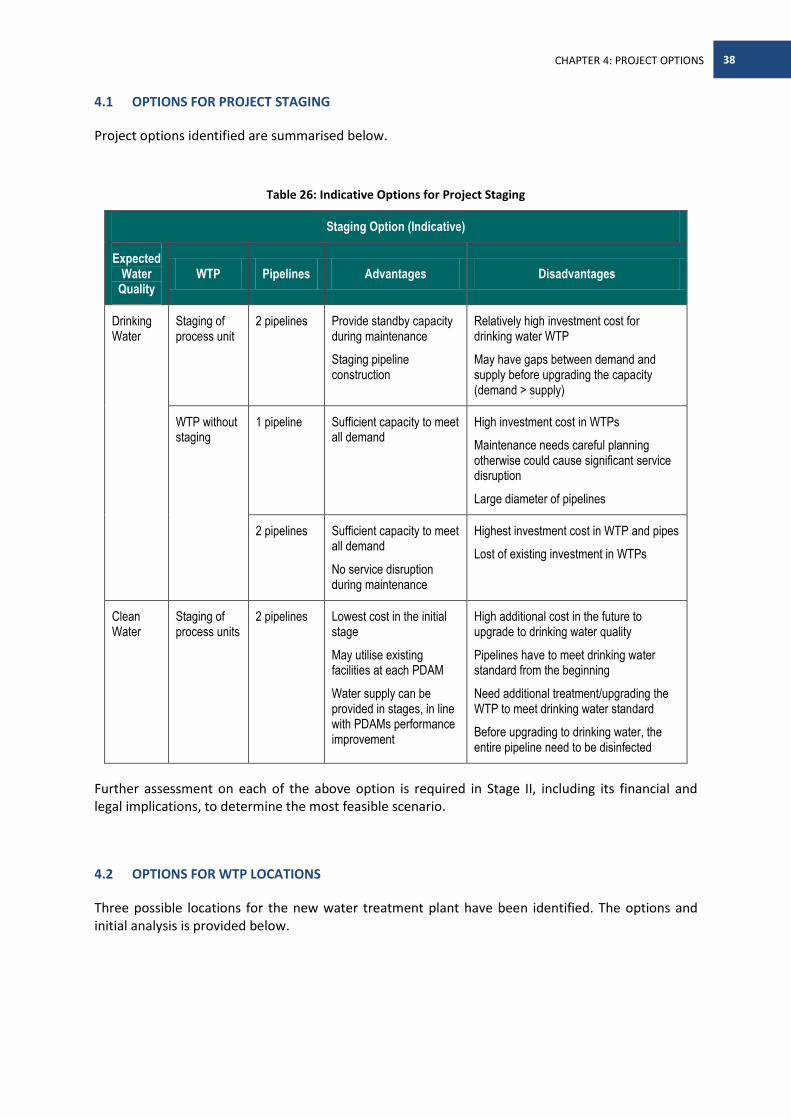
4.1 OPTIONS FOR PROJECT STAGING
Project options identified are summarised below.
Table 26: Indicative Options for Project Staging
Staging Option (Indicative)
Expected Water
Quality WTP Pipelines Advantages Disadvantages
Drinking Water
Staging of process unit
2 pipelines Provide standby capacity during maintenance
Staging pipeline construction
Relatively high investment cost for drinking water WTP
May have gaps between demand and supply before upgrading the capacity (demand > supply)
WTP without staging
1 pipeline Sufficient capacity to meet all demand
High investment cost in WTPs
Maintenance needs careful planning otherwise could cause significant service disruption
Large diameter of pipelines
2 pipelines Sufficient capacity to meet all demand
No service disruption during maintenance
Highest investment cost in WTP and pipes
Lost of existing investment in WTPs
Clean Water
Staging of process units
2 pipelines Lowest cost in the initial stage
May utilise existing facilities at each PDAM
Water supply can be provided in stages, in line with PDAMs performance improvement
High additional cost in the future to upgrade to drinking water quality
Pipelines have to meet drinking water standard from the beginning
Need additional treatment/upgrading the WTP to meet drinking water standard
Before upgrading to drinking water, the entire pipeline need to be disinfected
Further assessment on each of the above option is required in Stage II, including its financial and legal implications, to determine the most feasible scenario.
4.2 OPTIONS FOR WTP LOCATIONS
Three possible locations for the new water treatment plant have been identified. The options and initial analysis is provided below.

CHAPTER 4: PROJECT OPTIONS 39 39
Table 27: Options for WTP Locations
WTP Location
Pros Cons Consideration Factors
At Curug Requires less pipeline length, closer to other PDAMs population
Poor water quality, pumping requirement is higher, land availability is unknown
Water quality, protection of waterway from Jatiluhur and Curug, staging development
At Pasir Gombong Better water quality, high head difference with Jakarta, higher head and thus pumping costs will be reduced
High investment in pipelines and equipment to control head loss
Water quality, protection of catchment area up to Bandung, restriction of fish farming, less water available for existing power plant, staging development
Jatiluhur - Upstream of Cikao River
Better water quality High pumping requirement, land availability
Water quality, protection of waterways, staging development
Utilise current PDAM’s WTP
Less investment cost, better water quality
Still require WTP upstream for preliminary treatment
Future capacity at PDAM’s WTP, staging development
Further assessment on each of the above options is required in Stage II, including its financial and legal implications, to determine the most feasible location.
4.3 OPTIONS FOR TRANSMISSION ROUTES
Three possible routes for the transmission system from Jatiluhur to Jakarta have been identified. The options and initial analysis is provided below.
Table 28: Options for Transmission Routes
Piping Routes
Pros Cons Consideration Factors
Along Kalimalang (From Curug or upstream of Cikao River)
Relatively minimum land acquisition, along existing road to Jakarta
Insufficient width of RoW for pipeline construction, insufficient access on land for embankment for use of heavy machinery during canal maintenance, cross sections are not uniform
Depth of pipe due to heavy maintenance equipments on embankment, pipeline construction. Pipeline length approximately 68.5 km from Curug. Additional pipeline from upstream of Cikao River to Curug is approximately 6.5 km – 8 km.
Along Toll Road (From Curug or upstream of Cikao River)
Relatively minimum land acquisition
Lack of space for pipeline placement since there are electricity, telecommunication and also gas utilities alongside the toll road, may face difficulties in obtaining MoU with Jasa Marga and Bina Marga. Constructed within toll RoW
Agreement (MoU) with Bina Marga / Jasa Marga to use RoW, coordination with PLN, Telkom and PN Gas, pipeline construction consideration. Pipeline length approx 67 km. Additional pipeline from upstream of Cikao River to Curug is approximately 6.5 km – 8 km.

CHAPTER 4: PROJECT OPTIONS 40 40
Piping Routes
Pros Cons Consideration Factors
From Pasir Gombong via Jonggol - Cibubur
Less pumping required (higher elevation), construction is relatively easy as mostly is rural land, possible future development for south Jakarta
Long connection of pipeline to supply Karawang and Bekasi (longer trunk mains)
Land acquisition, longer trunk mains. Pipeline length approximately 64 – 70 km (excluding trunk mains to Karawang and Bekasi)
Further assessment on each of the above options is required in Stage II, including its financial and legal implications, to determine the most feasible route.

CHAPTER 5: SCOPE OF WORK FOR STAGE II - TECHNICAL ASPECT 41 41
CHAPTER 5: SCOPE OF WORK FOR STAGE II - TECHNICAL ASPECT
The Scope of Work for Stage II – Technical Aspect includes the following:
Water quality o Review and verification of existing water quality data
o Water quality sampling and laboratory analysis program at relevant locations
o Analyse water quality result and compare with Water Quality Standard requirements
Detailed demand analysis o Review and verification of existing demand data
o Future demand projection
Detailed supply analysis o Review and verification of existing supply data
o Water balance analysis of Jatiluhur Reservoir
o Risk analysis of supply sustainability
Identification of possible alternatives for Jakarta water supply o Identify other possible sources for drinking water supply for Jakarta, e.g. desalination, Jati
Gede reservoir in West Java, etc.
o Develop ballpark costing for comparison with Jatiluhur project
o Identify risks of alternative project implementation in the future to Jatiluhur project
Assessment of Water Treatment Plant o Review and verification of WTP locations and treatment capacity
o Preliminary topographic and geotechnical survey
o Identify options for WTP process
o Assessment of staging requirements for each option
o Preliminary design and budget estimation for each option, including capex and opex
o Identify preferred option
Assessment of Pipeline Route and Pump Stations Options o Review and verification of route options
o Establish termination points for pipeline options
o Preliminary topographic and geotechnical survey
o Preliminary design and budget estimation for each option including capex and opex
o Identify preferred option for pipeline route and pumping
Concept Design o Detailed topographic and geotechnical survey
o Develop concept design for WTP
o Develop concept design for transmission pipeline and pumping
o Develop technical specification
o Cost estimation

GHD
Jl. HR Rasuna Said Kav C5 Jakarta 12940 Indonesia T: 62 21 2557 8000 F: 62 21 522 9095 E: [email protected]
© GHD 2010
This document is and shall remain the property of GHD. The document may only be used for the purpose for which it was commissioned and in accordance with the Terms of Engagement for the commission. Unauthorised use of this document in any form whatsoever is prohibited.


![[Pipeline] Inspecting Pipeline Installation](https://static.fdocuments.net/doc/165x107/55cf8d045503462b1391543e/pipeline-inspecting-pipeline-installation.jpg)
