Investment and Securities Trading Simulation An ... and Securities Trading Simulation An Interactive...
124
Investment and Securities Trading Simulation An Interactive Qualifying Project Report submitted to the Faculty of WORCESTER POLYTECHNIC INSTITUTE in partial fulfillment of the requirements for the Degree of Bachelor of Science by Jean Friend Diego Lugo Greg Mannke Date: May 1, 2011 Approved: Professor Hossein Hakim
Transcript of Investment and Securities Trading Simulation An ... and Securities Trading Simulation An Interactive...
Investment and Securities Trading Simulation
An Interactive Qualifying Project Report
submitted to the Faculty of
WORCESTER POLYTECHNIC INSTITUTE
in partial fulfillment of the requirements for the
Degree of Bachelor of Science
by
Jean Friend
Diego Lugo
Greg Mannke
Date: May 1, 2011
Approved:
Professor Hossein Hakim
1
Abstract:
Investing in the Foreign Exchange market, also known as the FOREX market,
is extremely risky. Due to a high amount of people trying to invest in currency
movements, just one unwatched position can result in a completely wiped out
bank account. In order to prevent the loss of funds, a trading plan must be
followed in order to gain a maximum profit in the market. This project
complies a series of steps to become a successful FOREX trader, including
setting stop losses, using indicators, and other types of research.
2
Acknowledgement:
We would like to thank Hakim Hossein, Professor, Electrical & Computer
Engineering Department, Worcester Polytechnic Institute for his guidance
throughout the course of this project and his contributions to this project.
3
Table of Contents
1 Introduction .............................................................................................................................. 6
1.1 Introduction ....................................................................................................................... 6
1.2 Project Description ............................................................................................................. 9
2 Background ................................................................................................................................... 10
2.1 History of Forex....................................................................................................................... 10
2.2 Introduction to Corporate Structure ......................................................................................... 16
2.3 Corporate Finance ................................................................................................................... 20
2.4 Stock Market Basics ................................................................................................................ 23
2.5 Currency Parings: .................................................................................................................... 27
2.6 Choosing a Trading Platform: .................................................................................................. 29
2.7 Trading Indicators ................................................................................................................... 30
2.7.1 Indicator Signs ................................................................................................................. 31
2.8 Momentum Indicators ............................................................................................................ 33
2.8.1 ROC Indicator ................................................................................................................. 37
2.8.2 RSI Indicator ................................................................................................................... 38
2.8.3 Stochastic Indicator ......................................................................................................... 39
2.8.4 Ultimate Oscillator Indicator ........................................................................................... 41
2.8.5 Williams % R Indicator ..................................................................................................... 42
2.8.6 Awsome Oscillator ........................................................................................................... 43
2.9 Trend Indicators ..................................................................................................................... 44
2.9.1 CCI indicator ..................................................................................................................... 47
2.9.2 Simple Moving Average .................................................................................................... 48
2.9.3 Weighted Moving Average ................................................................................................ 49
2.9.4 Exponential Moving Average ............................................................................................ 51
2.9.5 MACD indicator ................................................................................................................ 52
2.9.6 Parabolic SAR Indicator .................................................................................................... 53
2.9.7 ADX Indicator .................................................................................................................. 54
2.9.8 Candlestick trend reversal indicators ................................................................................. 55
2.10 Volume Indicators................................................................................................................. 56
2.10.1 Chaikin Money Flow ........................................................................................................ 57
2.10.2 Force Index ..................................................................................................................... 58
4
2.10.3 Money Flow Index ........................................................................................................... 60
2.10.4 Ease of Movement .......................................................................................................... 61
2.11 Volatility Indicators ............................................................................................................... 62
2.11.1 Chaikin Volatility ............................................................................................................. 63
2.11.2 Average True Range ........................................................................................................ 64
2.11.3 Volatility Ratio ................................................................................................................ 65
2.11.3 Bollinger Bands ...............................................................................................................66
2.12 Price Chart patterns .............................................................................................................. 67
2.12.1 Fibonacci Retracement.................................................................................................... 70
2.12.2 Pivot point indicator........................................................................................................ 71
2.8 Fundamental Analysis: ............................................................................................................ 71
2.9 Importance of Stop Losses: ..................................................................................................... 74
2.10 Resources available for the modern trader: ............................................................................. 76
3 Methodology ................................................................................................................................. 77
4 Implementation ............................................................................................................................ 79
4.1 Choosing Indicators ................................................................................................................. 79
4.2 Selecting a platform ................................................................................................................ 83
4. 3 Trading Resources .................................................................................................................. 84
5 Results and conclusion ................................................................................................................... 87
6 Citations ....................................................................................................................................... 89
7 Appendices.................................................................................................................................... 90
Appendix A: Indicator Research (Example of Technical Analysis) ................................................ 90
Appendix B: EURO UPDATES (Examples of Fundamental Research) ........................................... 94
Appendix C: Barron’s Review of Trading Platforms ................................................................... 102
Appendix D: Example of a Trading Journal ............................................................................... 103
Appendix E: Example of a Gartman letter ................................................................................ 106
Appendix F: Example of a Henry Lui weekly market outlook ..................................................... 114
5
List of figures:
Figure 2.1: standard stock chart ........................................................................................................ 26
Figure 2.2: Currency Correlation chart ............................................................................................... 28
Figure 2.3: indicator and price chart divergence ................................................................................. 32
Figure 2.4: moving average crossover ............................................................................................... 33
Figure 2.5: Momentum indicator showing signs of trend reversal ....................................................... 35
Figure 2.6: example of a Williams oscillator ....................................................................................... 36
Figure 2.7: example of the Rate of Change indicator .......................................................................... 38
Figure 2.8: example of the RSI indicator ............................................................................................ 39
Figure 2.9: example of the slow stochastic indicator .......................................................................... 41
Figure 2.10: example of the Ultimate Oscillator ................................................................................. 42
Figure 2.11: example of a Williams % R indicator................................................................................ 43
Figure 2.12: example of awesome oscillaor indicator .......................................................................... 44
Figure 2.13: example of a simple moving average indicator: ............................................................... 46
Figure 2.14: example of the CCI indicator .......................................................................................... 48
Figure 2.15: example of the simple moving average indicator ............................................................. 49
Figure 2.16: example of the weighted moving average indicator ........................................................ 50
Figure 2.17: example of the exponential moving average indicator ..................................................... 51
Figure 2.18: example of the MACD indicator ...................................................................................... 53
Figure 2.19: example of a the Parabolic SAR indicator ........................................................................ 54
Figure 2.20: example of the ADX indicator ........................................................................................ 55
Figure 2.21: example of a Spinning Top candlestick pattern. .............................................................. 56
Figure 2.22: example of the Chaikin money flow indicator.................................................................. 58
Figure 2.23: example of a the force index indicator ............................................................................ 60
Figure 2.24: example of the monet flow index indicator ..................................................................... 61
Figure 2.25: example of the ease of movement indicator ................................................................... 62
Figure 2.26: example of the Chaikin Volatility indicator ..................................................................... 64
Figure 2.27: example of the Average True Range indicator ................................................................. 65
Figure 2.28: example of the Volatility ratio indicator ..........................................................................66
Figure 2.29: example of the Bolinger Band indicator .......................................................................... 67
Figure 2.30: level of support .............................................................................................................. 68
Figure 2.31:Price chart and Moving average crossover .......................................................................69
Figure 2.32: Fibonacci Retracement lines........................................................................................... 70
Figure 2.33: Pivot point indicator ....................................................................................................... 71
Figure 4.2 Example of an Oscillation pattern ..................................................................................... 82
Figure 4.3: Example of Railroad track indicator .................................................................................. 83
6
1 Introduction
1.1 Introduction
Doing work without compensation is pointless. Giving away a product with no gain by
the producer is a loss. Even in the earliest types of societies people realized this as no one
wanted to work for free. Not everyone could be some sort of farmer, growing for himself. This
problem established a trade system that would allow people to trade some sort of goods for
another, making it possible for farmers to specialize in a smaller number of products to give
other farmers in exchange for what they specialized in.
It could be determined that one of the first types of currency was any good that could
be exchanged for another. This currency exchange within a society is called economy, and
every modern day country has one. Over many years it became international as well. The first
government to implement an economy was the Babylonian government. They developed the
first record of some debt laws and private property. It wasn’t until several centuries later that
they expanded their record to show dept and payments up to date as well as the invention of
an inventory and keeping records of such inventory. This was taking place around 2600 BC.
The same government implemented laws about dividing property and interests on debt, as
well as rules on monetary compensation for property damage or physical damage to a person.
They also instituted fines for people who would act out of line, as a sort of punishment that in
present day still exists as a fine or infraction.
7
The next step closer to what we call a modern economy happened in the Middle Ages.
Many more forms of exchange started to come about, closely related to those modern ones.
Most exchanges happened between a social group. Conquerors also raised venture capital to
aid with the military at the time and protect their own. Once they conquered a new land, the
good from that area would cover the deficit created by taking over. It was around this time as
well that the first banks were founded by as Jakob Fugger (1459–1525) and Giovanni di Bicci de'
Medici (1360–1428). Global economy was founded after the discoveries of Marco Polo (1254–
1324), Christopher Columbus (1451–1506) and Vasco da Gama (1469–1524). Economy at the
time meant primarily trade.
Once all these discoveries were made, the areas captured became colonies of Europe as
the rise of nations like Spain, Portugal, England and the Netherlands began to emerge. These
nations then started controlling the trade with custom duties and taxes to protect their
national economy. Once these countries were established they needed finance and bankers
such as Amschel Mayer Rothschild (1773–1855), who started to finance national projects such
as wars and infrastructure. From then on, a modern definition of economy came about.
Countries then kept appearing and now were desperate for a way to control the
incoming and outgoing markets of their own. People needed a way to buy something in
another country but make sure they did not get cheated. The solution was an exchange rate,
this compares two different international currencies and based on the current economy of
those countries gives a ratio of how much one currency is equal to the other in its own terms.
8
To be able to control these exchange rates, banks all over the world started sending
data internationally over a computer system that allowed exchange rates to fluctuate based on
current national and global economy. The system that allows individuals and countries alike to
buy and sell currency is called Forex, or Foreign Exchange.
Forex is a market dedicated to the trade of currency around the world; it has many
unique features that separates it from the well known New York Stock Exchange market. For
example, it has a very high volume that leads to high liquidity. An estimated $3.21 trillion get
turned over every day, and the total market volume is estimated to be $3.98 trillion. Another
advantage of trading in Forex is the leverage, which means that one can buy up to 100:1, so to
manage an account with $100,000 with a margin of 1%, someone would only need $1,000 in an
account. This market also operates 24 hours a day with the exception of weekends.
The way the Forex market works is by trading a currency against another in a pair. The
most common pairs include: EUR/USD, USD/JPY, GBP/USD, AUD/USD, USD/CHF and
USD/CAD.
Forex has developed over the years to be the global standard for trading, and events all
around the world will affect the market. For example, a strike in a country that produces and
exports corn will have a very large drop in the exchange rate of corn against other countries.
This is where a person or bank will want to try and sell that currency against a stable or rising
currency and make a profit. The goal of Forex trading is to profit from the moving foreign
currency.
9
Forex traders can make very large profits off a single investment, but there are also
risks which include exchange rate risks, interest rate risks, credit risks, and country risks.
Around 80% of all currency trades occur in less than a week, with 40% of all trades opening and
closing within two days. Due to the short lifespan of trades, the best way to trade this market is
with technical indicators which give a good estimate for entry and exit point. Nothing beats
good investing experience, as well as a good intuition and a solid trading plan.
There are many types of indicators, and testing them is very important before putting
them into use. The most common type of indicators include: Bollinger Bands, MACD, Parabolic
SAR, Stochastic and relative strength index. Throughout this project these indicators will be
tested and proposed results will be shown.
1.2 Project Description
The purpose of this project is to test various methods of investement. This was done by
using different indicators. Indicators were used one at a time or with a combination of two or
more at a time. Although there is no single way to make money guaranteed in a market such
as Forex, using a desgined method to trade money can results in smaller loses. In this project
different platforms were used, in order to compare how user-friendly they can be.
10
2 Background
2.1 History of Forex
Dating back to before biblical times, people have been trading with each other for
goods that they do not have or that they wanted to resell for profit. These ancient traders sold
and bought livestock, precious metals, crops, and anything that they could get their hands on.
This small trade continued throughout the centuries, and then nations started developing.
These new nations all used different currencies, and trading with different currencies got a bit
complicated. From this, foreign exchange was born, although a formal global market for
foreign exchange did not develop until the 1800’s with cable transfers taking place between
London and New York. Trading with the different currencies meant that the two currencies
had to be compared for value and some currencies were worth more and some were worth
less. The fluctuation of values caused trades to go up and down with the trends and caused a
need for a central market.
The modern day FOREX history started in 1875, when the gold standard was put in
place. Before this, countries used gold and silver as international payments. When new
deposits of gold and silver were found though, the value of the precious metals would cause
the countries to lose value and this changed with supply and demand all the time. Due to the
11
instability of the precious metals, something had to change. The purpose of setting this gold
standard was to make sure that currency was guaranteed by gold or silver. Countries now
needed large gold reserves to back the currency. The exchange rate became the difference in
an ounce of gold between nations. The gold standard fell through at the start of World War I,
when political turmoil with Germany made the Europeans focus on the structure and shaping
of the military. There was a sudden lack of gold as there was an excess of currency, and this
again changed the standard of exchange rates. The lack of gold caused the abolishment of the
gold standard, and this matter tended to by the Allied countries. A convention was held at
Bretton Woods, New Hampshire, in July of 1944, to solve this problem. This convention led to
the inception of the “Bretton Woods monetary system”. This system proposed that a new
method of obtaining a fixed foreign exchange rate was needed. The gold standard was to be
replaced with the US Dollar as the ultimate exchange currency. The US Dollar was to be the
only currency that was still backed by gold and three international authorities guarded over all
foreign transactions. This monetary exchange system lasted about 25 years and failed
primarily because the US Dollar was the only currency to be backed by gold. The U.S
announced the end of the exchange of gold for US Dollars by foreign banks in August of 1971.
In the past, governments attempted to set exchange rates themselves to improve a
country's trade position. When an exchange rate is set low in comparison to other countries, it
makes the exports more affordable and imports less affordable. This improves a countries
position in the market. These changes in exchange rates caused frequent “trade wars”, where
countries would compete to get the best rate. Since the 1970’s, countries’ exchange rates
depend on the supply and demand, called “floating”. Although it is semi-controlled, most
12
countries keep a reserve of gold or foreign currencies in case of crisis. The buying or selling of
these reserves can control the movement of a currency.
Today, countries can choose from many types of exchange systems. A free floating
exchange system, as was mentioned before, permits the market, instead of a country, to
establish the price of a currency. Many factors both technical and fundamental affect the
exchange rates, and would all be able to occur regardless of their effects on the currency. A
pegged exchange rate like the Bretton Woods system would work like the original gold
standard, with currencies being linked. A central bank can also buy a specific amount of the
domestic currency, in times of deficit, in return for its foreign currency reserves. This brings
back the price of the currency to its original value but also at the same time depletes the
amount of its currency reserves.
Once a world economy had emerged there was a need for foreign exchange. Rather than
exchange currencies, countries would trade Gold, since gold was used by most of the major
countries. The Gold Exchange Standard, which was the international standard for trading from
1879 to 1934, had a fixed value of gold for all of the major currencies. Since all the currencies
had a fixed value associated to them the rate of exchange was fixed between each country. For
example the Japanese Yen was worth 36 grains of gold and a U.S. dollar was worth 12 grains of
gold, then the Yen would have had three times the value of a U.S. dollar, fixing the exchange
rate at 3 dollars for each dollar Yen. One key requirement was that the countries adhering to
the gold standard needed to maintain their money supply to a fixed quantity of gold, so the
government could only issue more money if it had obtained more gold. This requirement was
13
to prevent countries from just printing money to pay foreigners and to ensure that every bill
had a gold backing.
This system was effective for a while, but several flaws were revealed once international
trading started to expand. At the beginning of World War II many European countries needed
more currency to fund their war efforts. However, they did not have the gold backing that was
required to acquire the amount of currency they needed. The main problem with the gold
standard was that if a country was not competitive in the world marketplace, it would lose
more and more gold as more goods were imported than exported. With a depreciated supply
of gold, the country was required to reduce their money supply, which would hurt the country's
economy. Less money in circulation reduces employment, income, and output. Another major
flaw in the gold exchange system was gold was heavy and difficult to transport across the
oceans from country to country.
The gold standard finally collapsed during the Great Depression of the 1930's. Countries
started to abandon the gold standard by devaluing their currency. Countries began reducing
the amount of gold backing their currency so that they could increase their money supply in an
attempt to stimulate their economies. When some of the countries abandoned the gold
standard it collapsed because it was a system that could not work unless all of the trading
countries complied with it. 1
The leaders of the allied nations met in Bretton Woods, New Hampshire in 1944, to set
up an improved system of fixed exchange rates. The U.S. dollar was fixed at $35 per ounce of
1 http://thismatter.com/money/forex/foreign_exchange_history.htm
14
gold and all other currencies were valued in terms of the US dollar. This official fixed rate of
exchange was known as the par value of currency. Nations also agreed to buy and sell U.S.
dollars to keep their currencies within 1% of the fixed rate.
The Bretton Woods system began to weaken in the 1960s, when foreigner nations
accumulated large amounts of U.S. dollars from post World War II aid and from sales of their
exports in the US. There were concerns as to whether the U.S. had enough gold to back all the
dollars. At the time Fort Knox only contained a third of the gold necessary to cover the amount
of dollars in foreign hands. With reserves of gold falling, the system could not be sustained and
the U.S. decided to abandon this system. In 1971, President Nixon announced that U.S. dollars
would no longer be convertible into gold, so the exchange rate was allowed to float and the
Bretton Woods system was ended.2
The next system introduced was called the Managed floating exchange rate, which is
the system that exists today, is a rate that mostly floats. A country can sometimes manipulate
their exchange rate through their central banks. If a country wants to implement a change it is
usually done by buying or selling the currency that the country wants to influence, and thereby
influencing supply and demand. Many smaller countries fix their exchange rate by pegging
their currency to the United States dollar to try and stabilize their currency.
2 http://www.time.com/time/business/article/0,8599,1852254,00.html#ixzz1DwrcSuur
15
The major benefit of the Managed floating exchange rate is that it corrects imbalances
automatically. If a country imports more than it exports, its currency will decline in relation to
the importing country's currency, which will make imports more expensive and exports less
expensive. This will reverse the imbalance. A floating exchange rate allows for the exchange
rate to mirror the strength of a country’s economy. For example, if a country experiences a
significant recession or boost in their economy their currency will weaken or strength
corresponding to the strength of that country’s economy. This opens up the ability to trade
based on country’s fundamentals. Another major benefit of the floating exchange rate is that
it allows countries to manage their own economies through monetary policy. For example, a
country can expand their money supply to try and stimulate the economy, or contracting its
supply to reduce inflation. Since countries can manipulate their foreign exchange rate the
publication of significant changes in monetary policy, such as the raising or lowering of interest
rates by the major countries can increase volatility in its currency, both before and after the
news is published. This opens up the opportunity for traders to trade news releases. The
current system makes it easy for countries to exchange money at a fair rate and is a great
opportunity for investors to profit from the volatility of currency correlations.
Leverage is a very important aspect of forex trading and is one of the reasons why
trading the foreign exchange market is so appealing. Leverage is a loan that is provided to an
investor by the broker of a forex account. Currently, leverage is limited to 50:1. This means that
for every 1 dollar invested then transaction is multiplied by 50 dollars. If a person were to trade
1 lot of USD/EUR, which is equal to US$100,000 the margin required would be US$2,000.
Forex is very appealing because it offers a much higher leverage that the other trading markets
16
such as futures. A person who only has $2,000 to invest might not be able to purchase enough
stocks to have a well balanced portfolio but they would be able to trade forex because the 50:1
leverage allows them to trade 1 lot of currency. With leverage, traders are given a better
chance of a much higher return. However, it should be pointed out that leverage works in both
directions. While you can earn a lot of money very quickly by making winning trades, you can
also lose money very quickly when in a losing position because of leverage. It is very easy to
potentially lose all of your capital because of an over leveraged position. This makes it
extremely important to calculate the potential losses of a position and to have a stop loss in
place in order to prevent excessive losses.
To obtain an even better edge while trading, investors research how a coporate
structure is built in order to learn about the fluctuation of money. This in turn provides an
oppurtunity to follow trends after certain news reports that affect companies in a nation.
2.2 Introduction to Corporate Structure
When starting a business, it is important to consider the different ways in which
businesses can be structured. Whether it is a sole proprietorship, partnership, or a corporation,
each business type offers certain advantages and disadvantages. For example, a sole
proprietorship is fairly simple to establish, and offers favorable tax advantages. An example of
this type of business is any owner-operated business, such as a barber shop or corner store.
This is typical of small businesses and the main disadvantage with this type is that it is limited
by the sole proprietor’s resources. The resources are limited in terms of knowledge,
experience, and skills as well as in financial resources. The obvious solution to this is to
17
establish a partnership, where two or more partners pool their money and talents and can thus
achieve more effective operations and at a larger scale than a sole proprietor could. However,
each partner is equally liable for the company’s debts, and can be personally sued should
anything go wrong. To avoid this problem, many businesses become incorporated.
A corporation is a separate legal entity, created by law in a state of its own choosing,
and has most of the rights that any person would have. A corporation is entirely separate from
its owners and acts under its own name rather than in the name of its stockholders. It can buy,
own, and sell property. Corporations can also borrow money and enter into legally binding
contracts. It may also sue or be sued, and it pays taxes as a separate entity. Corporations issue
stocks, or shares in the company, which are transferrable units that can be bought or sold
freely, thus transferring ownership in the company. It is important to note that transfer of
ownership rights among stockholders normally has no effect on the operating activities of the
corporation, nor does it affect the corporation’s assets, liabilities, and total stockholder’s
equity.
A corporation has a number of advantages over more traditional business forms. It is
relatively easy for a corporation to acquire capital through the issuance of stock, as long as the
stock is bought. Buying stock in a corporation is often attractive to an investor because a
stockholder has limited liability and shares of stock are readily transferable. Numerous
individuals can become stockholders by investing small amounts of money, which can also be
appealing to an investor. Another advantage is that a corporation can have a continuous and
perpetual life as its existence does not depend on the natural life of any stockholder,
18
employee, or officer. The life of a corporation can sometimes be limited to a specific number of
years in the company’s charter, but the charter can also be renewed, making it everlasting. The
company’s charter describes the name and purpose of the corporation. The charter also
describes the types and number of shares of stock that are authorized to be issued. It contains
the names of the individuals that formed the company, and the number of shares that these
individuals agreed to purchase. It also contains bylaws which establish internal rules and
procedures for conducting the affairs of the corporation. Corporations are free to engage in
interstate commerce, but they must first obtain a license from each state in which they plan to
do business. Regardless of the number of states in which a corporation does business, it can
only be incorporated in one state. Because of this, it is important to choose to become
incorporated in a state with laws and tax codes favorable to corporations.
The way a corporation is managed is also unique among business forms. In a
corporation, the stockholders manage the company indirectly through a board of directors
they elect. The board then formulates the operating policies and selects officers to perform
essential management functions. The chief executive officer, or CEO, has overall responsibility
for managing the business. Also, the chief accounting officer is the controller, meaning he is
responsible for maintaining accurate accounting records, maintaining an adequate system of
internal control of funds, and for preparing financial statements, tax returns, and internal
reports. The treasurer has custody of the corporation’s funds and is responsible for maintaining
the company’s cash position.
19
Because of a corporation’s unique status as an independent entity, it is subject to
additional government regulations. At the federal level, there are federal securities laws which
govern the sale of capital stock to the general public. There are also state laws that prescribe
the requirements for issuing stock, the distributions of earnings permitted to stockholders, and
acceptable methods for retiring stock. In addition, publicly held corporations are required to
disclose their records of financial activities to the Securities and Exchange Commission, or
SEC. Also, when a corporation is listed and traded on an organized securities exchange, it must
comply with the reporting requirements of these exchanges. Corporations are required to pay
taxes as a separate legal entity in a high tax bracket, sometimes as high as 40% of taxable
income. In addition, individual stockholders are taxed on dividends they receive from the
corporation, creating a situation known as double taxation. This means that the income
received by the corporation is taxed twice; once at the corporate level and again at the
individual level.
Holding stock in a corporation has many advantages. For one, owners of common stock
are able to vote in elections naming the board of directors, and are also allowed to vote on
actions that require stockholder approval. Stockholders are entitled to a share of the corporate
earnings through receipt of dividends. They are also usually granted the option of buying more
stock when new shares of stock are issued in order to maintain their same percentage
ownership. This is called preemptive right. Finally, stockholders are entitled to their share of
assets upon liquidation in proportion to their holdings. This is called residual claim because
owners are paid with assets that remain after all other claims have been paid.
20
2.3 Corporate Finance
One of the advantages a corporation enjoys is the ability to raise capital with relative ease.
There are five major ways corporations raise money:
Issuing bonds
Issuing preferred stock
Selling common stock
Loan
Using profit
Issuing bonds is the preferred way for the corporations to raise capital. A bond is a
written promise to an individual, a company, or a government that the corporation will pay
back the borrowed capital at a specific date or dates that they agreed on with a predetermined
interest rate. It is the preferred method to raise capital because the interest that the
corporations owe to the bondholders is comparably lower than other methods such as loans
from the bank. Also, interest paid to bondholders is considered a tax-deductible business
expense.2 Corporations are required to pay bondholders their interest even if the company is
not making any profit.
Preferred stock is stock that a corporation releases when it is in financial danger. Buyers
of this stock have special rights over common stock holders that give them preferred status,
meaning their dividends are paid after the bondholders get their interest, but before the
common stockholders. For example, if the dividend rate on preferred stock is 5 dollars per
share, common shareholders will not receive any dividends in the current year until preferred
21
stockholders have received 5 dollars per share.3 Sometimes, preferred stock contracts contain
cumulative dividend. This means that preferred stock holders must be paid both current year
and any previous years that they have not yet been paid before common stockholders get their
dividends.3 However, some preferred stocks that have not been declared in a given period of
time are considered not liable. No obligation exists until the board of directors formally
declares that the company will pay dividends.
Selling common stock is the most convenient and most commonly used method for the
company to raise money. This type of buying and selling is much different than the buying and
selling people experience on a day to day basis. The company must first issue stocks before the
public can buy them. Regarding the issuing process, the company must get the authorized
stock. Authorized stock is the amount of stock that a corporation is authorized to sell as
indicated in its contract. The company must get permission from the state of incorporation in
order to change the contract if they have sold all the authorized stock and want to sell more.
When the authorized stocks are obtained, the company can issue stock in two different ways,
either indirectly or directly.3 A company can issue common stock directly to investors, or they
can issue indirectly through an investment banking firm that specializes in bringing securities
to the attention of prospective investors. Selling common stock is a reliable and an easy way
for a corporation to raise the capital. Even though it is selling the ownership of the corporation
to the public, it’s a good money making method without high risk for the corporation.
Getting a loan from a bank is another method for a company to raise capital, but it is
not usually preferred due to high interest rates. Generally speaking, a corporation will not
22
borrow money from a bank unless it is in a financial crisis or they have no other way of raising
the capital.
Companies also use their income to raise more money. Some companies use 50 percent
for expansion and other necessities and use the other 50 percent of the income to pay
dividends to the stockholders. Some companies, usually small ones, reinvest all their net
income back into research and expansion of the company hoping to pay rapidly increasing
dividends to the stockholders.
Business incubators are programs designed to accelerate the successful development
of entrepreneurial companies through an array of business support and services through
network contract.1 Some small companies look into business incubators—a business park with
new starting companies. They take advantage of reduced rent and minimize start-up cost by
sharing with other small corporations. This is indirect way of raising capital, because incubators
often attract many investors looking for new potential corporations. These business incubation
programs are not open for anyone. Corporations who wish to join must apply for admission.
Normally, corporations with reasonable potential ideas are admitted to the program.1 Many
investors have positive reactions toward the business incubation program since historically
speaking, 87% of the corporations started from incubation program managed to stay in
business.1

23
2.4 Stock Market Basics
It is important to have a basic understanding of the stock market before trying to
grasp some of the more complicated concepts that are associated with investing in the stock
market. When an investor buys stock in a company they are essentially taking ownership of a
very small portion of the company. As a shareholder, you technically own a very small piece
of everything that the company owns. However, just because you are a shareholder, it does
not mean that you have a say in how the company is managed. A shareholder can vote to
have the management of a company removed. In order for this to happen, a shareholder
must have control of a large amount of stock in the company before they have any influence
on the management of the company.
For the most part, shareholders are more interested in other benefits than investing in
stock offers, because they won’t be buying enough stock to have a real impact on the
management of a company. Actually, most shareholders are not at all interested in managing
the company that they invest in; they are more interested in capitalizing on the fluctuation of
the stock’s price. A stock’s price is based on supply and demand. “If more people want to buy a
stock (demand) than sell it (supply), then the price moves up. Conversely, if more people
wanted to sell a stock than buy it, there would be greater supply than demand, and the price
would fall.”3 An investor must take both the strength of the company and the performance of
the stock into account. A company might be showing signs of large earning growth, but at the
same time have a stock that is not performing well. This is because investors have not yet
noticed the potential of this company and the demand is low for its stock. However, if the
3 http://www.investopedia.com/university/stocks/stocks4.asp
24
company continues to perform at a high level, investors will take notice. As a result, the
demand for the company will eventually grow, along with the stock price.
On the contrary, a company might have a stock that has a high demand among
investors, but if the company does not have a strong business strategy to maintain their high
earnings, the demand for the company’s stock will be lost and the price will dive. In essence, an
investor isn’t just evaluating a stock for its current price, they are making an evaluation of how
they expect the price of the stock to fluctuate and change in the future, in order for them to
make a profit.
Stock exchanges are places where buyers and sellers come together and make trades.
The two major stock exchanges in the US are the New York stock exchange and the NASDAQ
(National Association of Securities Dealers Automated Quotations) stock exchange. A stock
exchange can have a physical location or be can be electronic. For example, the New York
stock exchange is located on Wall Street in New York City, and the NASDAQ stock exchange is
an electronic exchange where trades are completed over the computer.
In the past, a person buying stock would do so through a broker. A broker is a person
that buys and sells stocks on behalf of an investor. A broker can offer advice to what moves to
make, but ultimately the final decision is left to the investor. However, with the increase in
technology over the past decade, a broker is no longer necessary for an individual who wants
to invest. There are many online trading platforms available like E*trade, Ameritrade, or
tradestation. These platforms are usually cheaper than paying a broker commission and
usually offer lots of customizable tools that allow an investor to do their own unique research.
25
Each investor has a unique strategy for evaluating a stock’s potential. Many investors
look at various financial reports and statements that companies are required to release in order
to try and predict the company’s future stock value. A strong report can motivate an investor
to buy stock because they think the company’s stock price will rise in the future. This is called a
microeconomic perspective, or the belief that the individual company’s performance has the
most influence over the price of its stock.
Another perspective is called a macroeconomic perspective. It is the belief that “share
prices are influence by three broad factors: the general performance of the economy, including
changes in interest rates, inflation and real economic growth, the performance of a given
industry, and the quality of a management in a specific firm.”4 This belief is why many experts
recommend having a diverse portfolio, or a collection of stocks from different industries.
Having a diverse portfolio will protect your investments. If an industry is struggling, only one of
the stocks in your collection will be negatively affected. Basically, if you invest in several
different industries, the probability that they will all fail at the same time is lower than if you
invest everything in one industry.
An important chart to be able to read and understand is a stock table. It offers an
opportunity to scrutinize your stock’s performance in comparison to the performance of
others. Below is an example of a stock table that can be found in many newspapers such as The
New York Times. 5
4 Putnam and Zimmer, The Blackwell Guide to Wall Street( New York: Basil Blackwell Inc. 1987),Pg. 41 5 http://www.disnat.com/en/knowledge/stocks/stocks6.asp
26
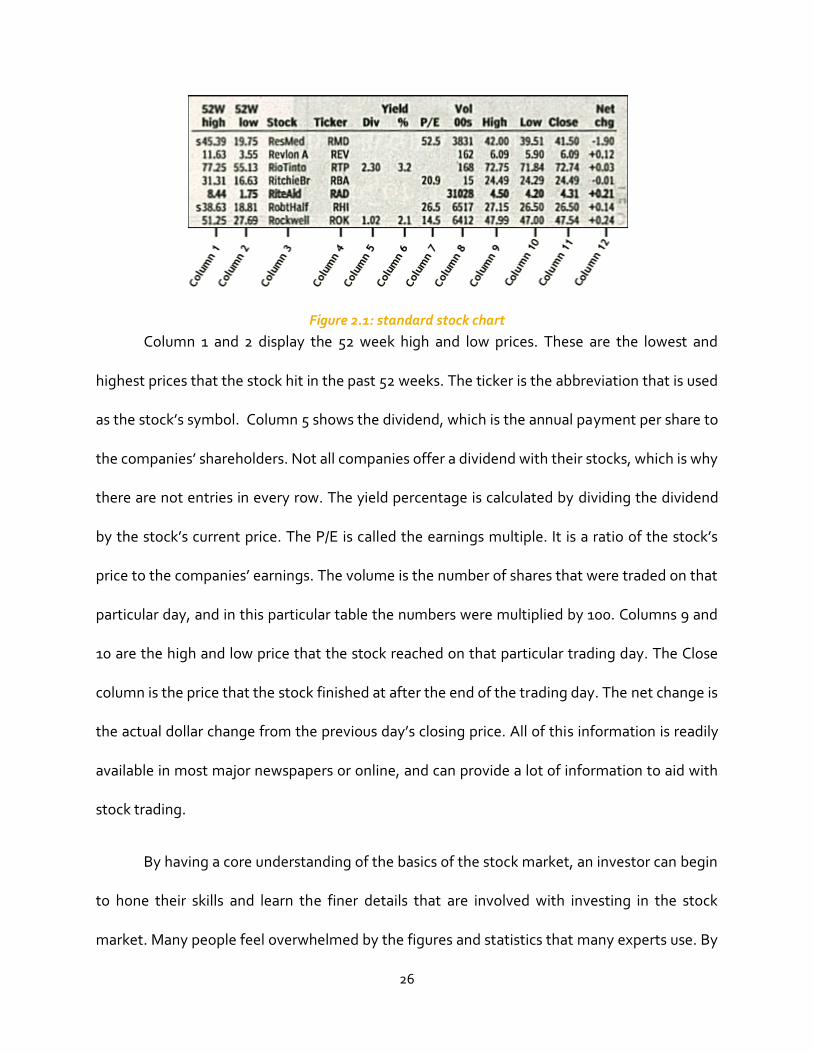
Figure 2.1: standard stock chart
Column 1 and 2 display the 52 week high and low prices. These are the lowest and
highest prices that the stock hit in the past 52 weeks. The ticker is the abbreviation that is used
as the stock’s symbol. Column 5 shows the dividend, which is the annual payment per share to
the companies’ shareholders. Not all companies offer a dividend with their stocks, which is why
there are not entries in every row. The yield percentage is calculated by dividing the dividend
by the stock’s current price. The P/E is called the earnings multiple. It is a ratio of the stock’s
price to the companies’ earnings. The volume is the number of shares that were traded on that
particular day, and in this particular table the numbers were multiplied by 100. Columns 9 and
10 are the high and low price that the stock reached on that particular trading day. The Close
column is the price that the stock finished at after the end of the trading day. The net change is
the actual dollar change from the previous day’s closing price. All of this information is readily
available in most major newspapers or online, and can provide a lot of information to aid with
stock trading.
By having a core understanding of the basics of the stock market, an investor can begin
to hone their skills and learn the finer details that are involved with investing in the stock
market. Many people feel overwhelmed by the figures and statistics that many experts use. By
27
establishing a basic understanding of the market and the figures themselves, it becomes easier
to understand some of the more complicated strategies that the experts use daily.
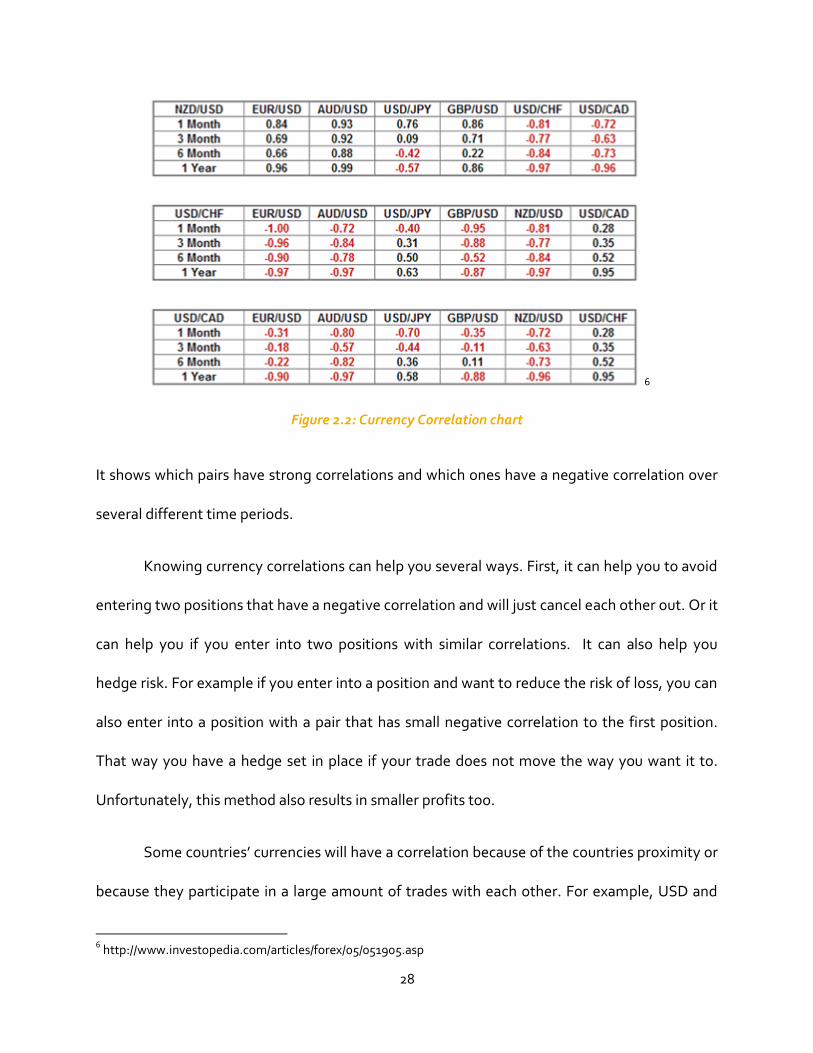
2.5 Currency Parings:
Currency Correlations are extremely important in understanding when trading Forex.
Some currency pairs move in tandem and some move in the opposite directions. Basically,
currency correlations measure how much a currency pair moves in relation to another currency
pair. Theses correlations are measured on a scale from -1 to 1. Two currency pairs are rated as a
-1 that means they move in opposite directions 100% of the time. If the pairs are rated at a 1
they move together 100% of the time. A rating of 0 means the two pairs move in a completely
random relationship to each other. Currency correlations are not set in stone and often change
from month to month and need to be checked often. Below is a picture of a currency
correlation chart:
28
6
Figure 2.2: Currency Correlation chart
It shows which pairs have strong correlations and which ones have a negative correlation over
several different time periods.
Knowing currency correlations can help you several ways. First, it can help you to avoid
entering two positions that have a negative correlation and will just cancel each other out. Or it
can help you if you enter into two positions with similar correlations. It can also help you
hedge risk. For example if you enter into a position and want to reduce the risk of loss, you can
also enter into a position with a pair that has small negative correlation to the first position.
That way you have a hedge set in place if your trade does not move the way you want it to.
Unfortunately, this method also results in smaller profits too.
Some countries’ currencies will have a correlation because of the countries proximity or
because they participate in a large amount of trades with each other. For example, USD and
6 http://www.investopedia.com/articles/forex/05/051905.asp
29
CAD have a strong correlation because the US gets a large supply of oil from Canada. As a
result, the price of Oil and the USD/CAD pair often trade at very close correlations.
2.6 Choosing a Trading Platform:
A trading platform is software through which traders can place orders and manage their
open positions. Trading platforms are offered by brokers either for free or at a discount rate in
exchange for maintaining a funded account and or making a specified number of trades per
month. These platforms allow for electronic trading that can be accessed anywhere there is an
internet connection opposed to trading on the floor of a stock exchange or over the phone.
Brokers often provide certain services and trading tools to their customers to try and get
traders to use their platform. Most brokers will allow traders to open a demo account so that
they can test out the platform and hone their trading skills. The parts of a trading platform
usually consist of a charts window, an area to place new orders as well as monitor your open
positions, some offer economic news calendar as well as live news feed. Most platforms offer a
market watch area where you can monitor the current bid and ask prices of many different
currency pairings. Additionally, some platforms allow you to join live video sessions with a
trading advisor who will train you to be a more efficient and effective trader.
When choosing a platform there are several factors that a trader should consider
before selecting one. You must consider what fees, if any, are associated with each platform.
Another factor that must be considered is the technical indicators that are offered by each
platform. Additional services some platforms offer are training seminars or videos with
investment experts as well as specialized indicators that are created by the investment experts.
30
Some platforms allow you to backtest your trading strategy to see how successful it would
have performed over a period of time. This is a very useful tool to show how effective your
trading strategy will be in the future. Other factors to consider when choosing a platform are
the types of market orders that the platforms offers and whether or not the platform allows
you to trade directly from their charts. When looking for a platform, you want to make sure
the platform you choose offers all the tools that it takes for you to be a successful trader.
2.7 Trading Indicators
Indicators provide a means of organization in an otherwise chaotic currency market. For
an indicator to work, raw data is taken as the basic input and manipulated to create an output
of an actionable trading scenario. These indicators include a wide variety of categories, such as
oscillators, Larry Williams indicators, moving averages, momentum indicators, volatility
indicators, volume indicators and many others. Due to the nature of an indicator being based
on previous data, it is not a predicting tool. The best application of an indicator is to give order
to the price data to outline possible winning opportunities for the investor. One can never say
an indicator is wrong or right, but each must be used in a way that uses that data in an
appropriate money management strategy to maximize the results. The amount of indicators
always keeps growing. It is hard to say exactly how many there are because it is not difficult to
define a new tool to evaluate the market, as long as one has a basic understanding of what an
average is and what the final goal of the indicator will be (Forex Indicators). “So you can regard
indicators as your compass and ruler in navigating waves of the Forex market. We would use a
compass or a ruler to predict when or where a storm will hit, but every sailor knows their
usefulness in defining a path over the high seas,” (Forex Indicators par. 3) Before we look at the
31
various indicators that are popular in forex trading we will first look at some common indicator
patterns so that we have a basic terminology and an idea of the types of signals indicators
produce.
2.7.1 Indicator Signs
There are several patterns that are produced by indicators such as overbought,
oversold, divergence and crossover. An important sign given by an indicator is the overbought
signal. This is produced when the demand for an asset is pushes the price to a point at which
the value of the asset is unfounded and unjustified. Essential the demand causes the price to
rise to a point at which the asset becomes overvalued.7 It is important to identify when this
occurs because the market will eventually correct itself and pull back to a more appropriate
level. In momentum indicators that have a range from 0 to 100, overbought conditions are
typically identified when the indicator crosses above the 80% level.
The oversold signal is the exact opposite to the overbought signal. This occurs when the
demand for an asset drops which causes the price to fall to a level that makes it very
undervalued.8 The market will correct itself once again and the price of the asset will be return
to a normal value. Momentum indicators indentify oversold conditions when the indicator
drops below the 20% level. Many traders enter into a buy position when the indicator drops
below the 20% level and then returns back above this level.
Another sign produced by momentum indicator is when the pattern diverges from the
price chart pattern. When the indicator is moving in the opposite direction of the price chart
7 http://www.investopedia.com/terms/o/overbought.asp 8 http://www.investopedia.com/terms/o/oversold.asp
32
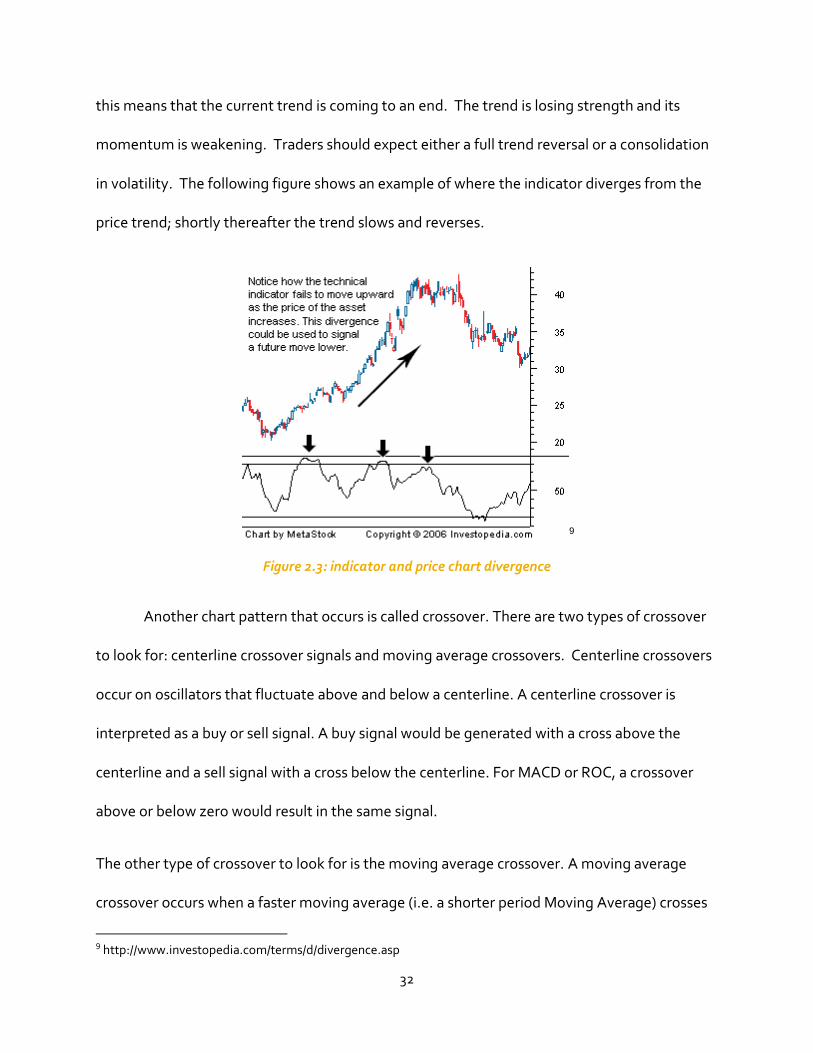
this means that the current trend is coming to an end. The trend is losing strength and its
momentum is weakening. Traders should expect either a full trend reversal or a consolidation
in volatility. The following figure shows an example of where the indicator diverges from the
price trend; shortly thereafter the trend slows and reverses.
9
Figure 2.3: indicator and price chart divergence
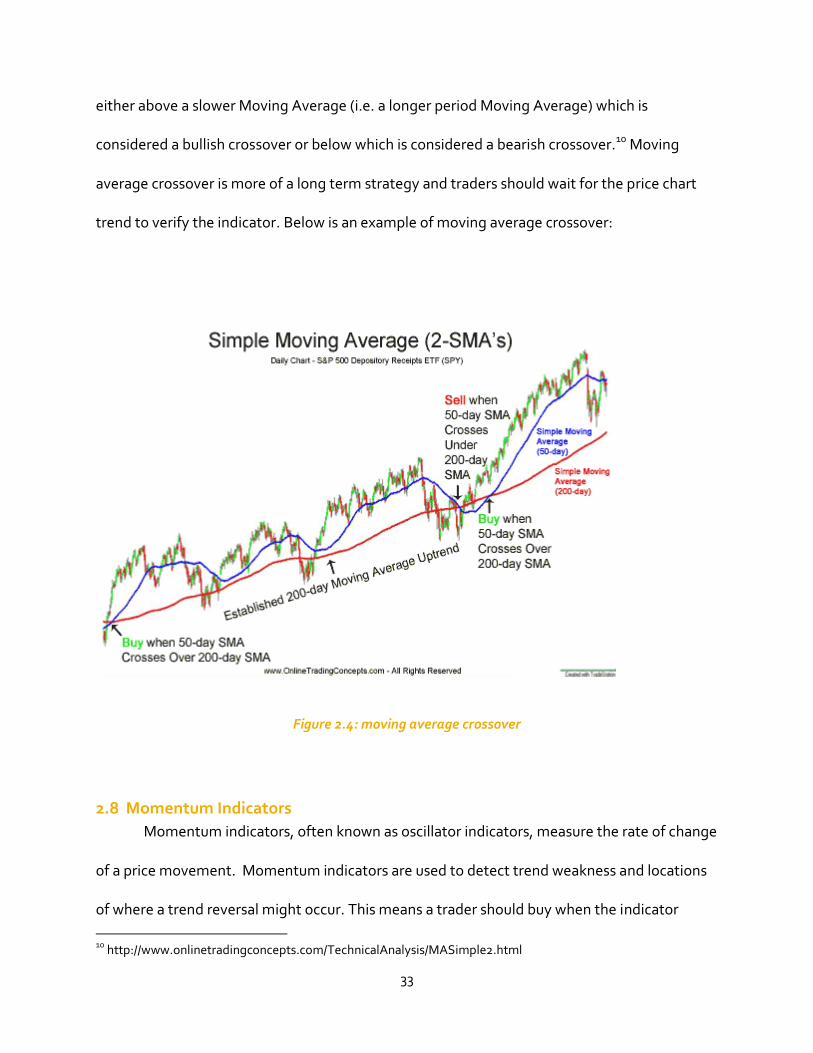
Another chart pattern that occurs is called crossover. There are two types of crossover
to look for: centerline crossover signals and moving average crossovers. Centerline crossovers
occur on oscillators that fluctuate above and below a centerline. A centerline crossover is
interpreted as a buy or sell signal. A buy signal would be generated with a cross above the
centerline and a sell signal with a cross below the centerline. For MACD or ROC, a crossover
above or below zero would result in the same signal.
The other type of crossover to look for is the moving average crossover. A moving average
crossover occurs when a faster moving average (i.e. a shorter period Moving Average) crosses
9 http://www.investopedia.com/terms/d/divergence.asp
33
either above a slower Moving Average (i.e. a longer period Moving Average) which is
considered a bullish crossover or below which is considered a bearish crossover.10 Moving
average crossover is more of a long term strategy and traders should wait for the price chart
trend to verify the indicator. Below is an example of moving average crossover:
Figure 2.4: moving average crossover
2.8 Momentum Indicators
Momentum indicators, often known as oscillator indicators, measure the rate of change
of a price movement. Momentum indicators are used to detect trend weakness and locations
of where a trend reversal might occur. This means a trader should buy when the indicator
10 http://www.onlinetradingconcepts.com/TechnicalAnalysis/MASimple2.html
34
bottoms and turns back up and sell when the indicator peaks and turns down. Momentum is
calculated by calculating the current price compared to the price over a past period of time. To
generalize, a momentum indicator is used to detect the enthusiasm of the buyers or sellers at
the current point in time. When a market peaks the indicator will climb steeply to match the
market movement and then drop off sharply when the market trend looses strength. When a
momentum indicator is showing a trend reversal, it is important to wait for the price chart to
also match the reversal. It does not make sense to enter into a position when a momentum
indicator and a price chart are not showing corresponding patterns because it is not
uncommon for momentum indicators to diverge from the price chart.11 It’s critical to see the
price reverse when the indicator also reverses.
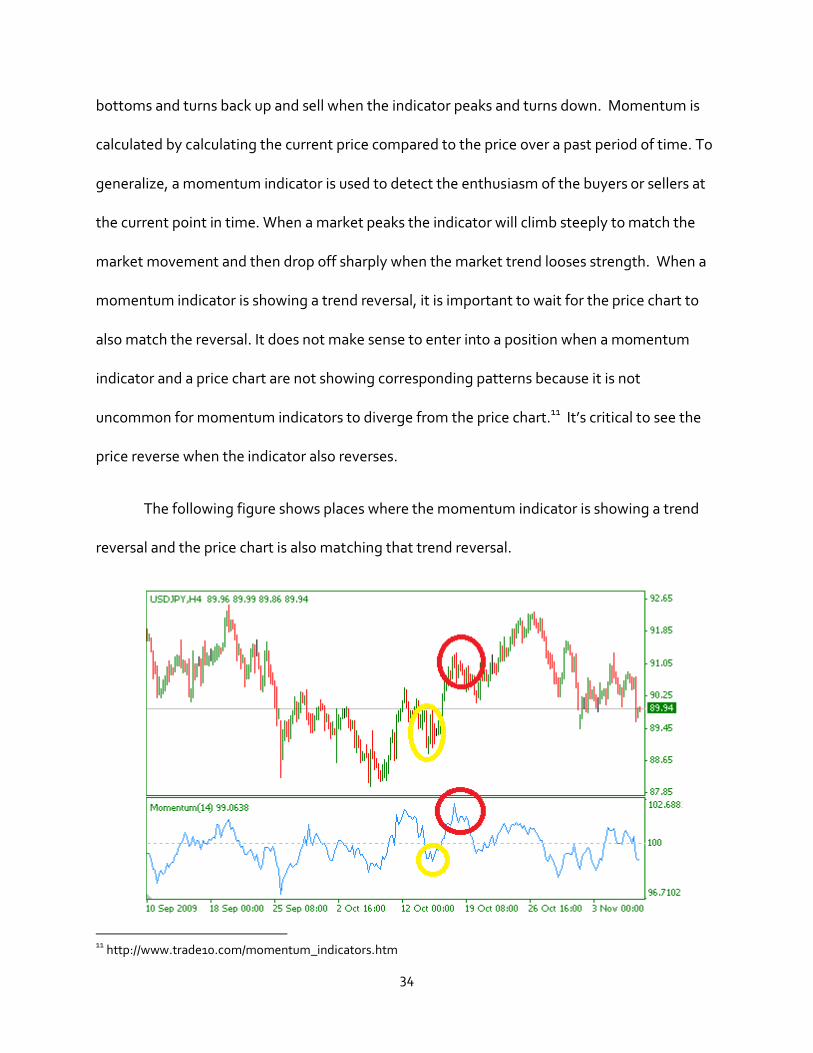
The following figure shows places where the momentum indicator is showing a trend
reversal and the price chart is also matching that trend reversal.
11 http://www.trade10.com/momentum_indicators.htm
35
Figure 2.5: Momentum indicator showing signs of trend reversal
There are several weaknesses that are associated with momentum indicators. Every
market has a high and a low over a period of time, and this indicator displays the amount of
buyers and sellers and the volume to make it easy to see when the market has hit a peak and
will turn back. These peaks are achieved when the amount of people buying slows down and
the price slowly increases. As for other indicators, it does not predict the direction of the
market. It shows the likelihood of the market changing. Additionally, in a ranging market price
movement tend to erratic and may not have a strong driving force behind them. Finally, as a
result of the method a momentum indicator is derived, abnormally high or low price ranges in
the window that is being compared can cause distortion in the information the indicator is
showing. 12For example, if a momentum indicator is comparing the current price to the price in
the past 15 bars and an abnormally high peak in price in the past 15 bars occurs, there will be a
distortion in information that the momentum indicator is currently displaying because of the
abnormal price peak. 13 Certain momentum indicators correct for these weakness better than
others.
Oscillating indicators are high and low barriers on an infinite number of prices that a
currency could reach. This gives the investor a smaller range of possible change in a price by
identifying high and low turning points over a certain period of time. However, a high can
easily be superseded at any given moment, since the indicator is only based on passed data
and the market is ever-changing. From the wide variety of momentum indicators, some are
12 http://www.incrediblecharts.com/indicators/momentum_indicators.php#go-Momentum-Indicators-toc1 13 http://www.incrediblecharts.com/indicators/momentum_indicators.php#go-Momentum-Indicators-toc1
36
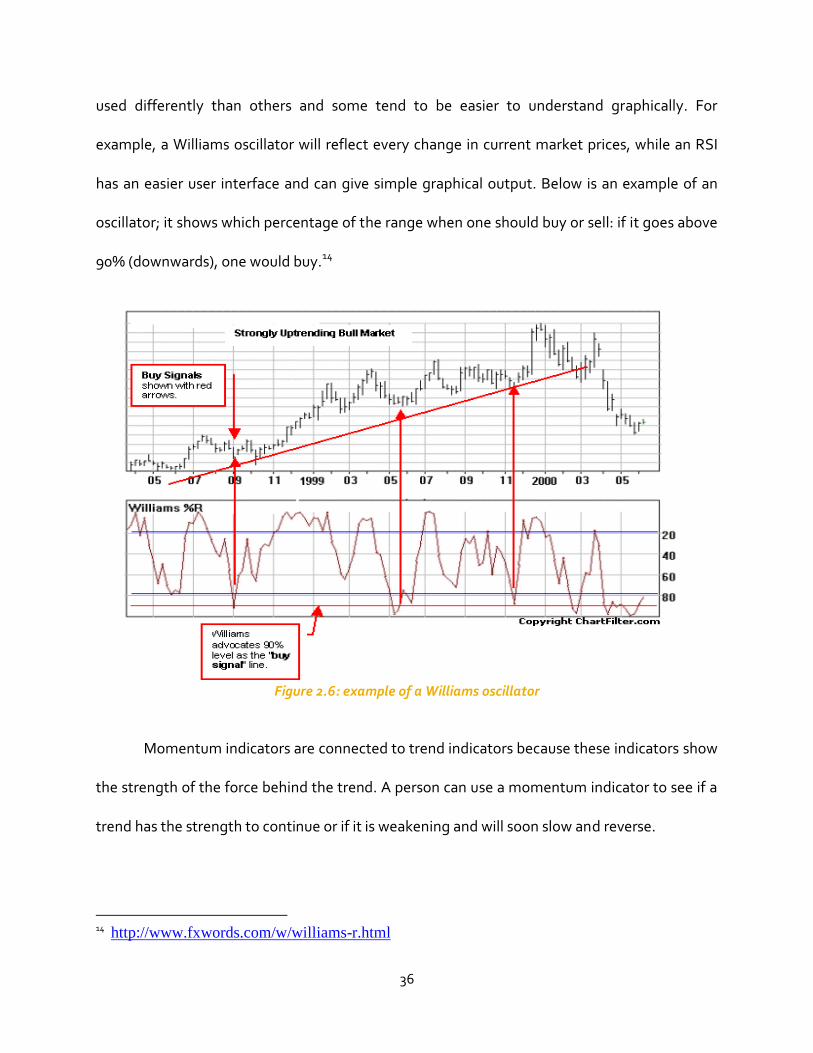
used differently than others and some tend to be easier to understand graphically. For
example, a Williams oscillator will reflect every change in current market prices, while an RSI
has an easier user interface and can give simple graphical output. Below is an example of an
oscillator; it shows which percentage of the range when one should buy or sell: if it goes above
90% (downwards), one would buy.14
Figure 2.6: example of a Williams oscillator
Momentum indicators are connected to trend indicators because these indicators show
the strength of the force behind the trend. A person can use a momentum indicator to see if a
trend has the strength to continue or if it is weakening and will soon slow and reverse.
14 http://www.fxwords.com/w/williams-r.html
37
Momentum indicators can be used to describe trends in markets over a certain
period of time, which can be broken down and made into smaller trends. Oscillators can also
be combined to form better tools for trading according to the investor.
There are certain indicators that hint that there would be a reversal in the current trend.
Recognizing when a trend is going to reverse is important because it can alert you when to
enter a trade or when to close your current position. Several important indicators to look for
are the CCI Indicator, MACD, the spinning top, and railroad tracks. If several of these indicators
are showing at the same time, the probability for a change in trend is increased. Although
there is no perfect indicator, these three indicators are an accurate way to catch a trend
reversal before it happens.
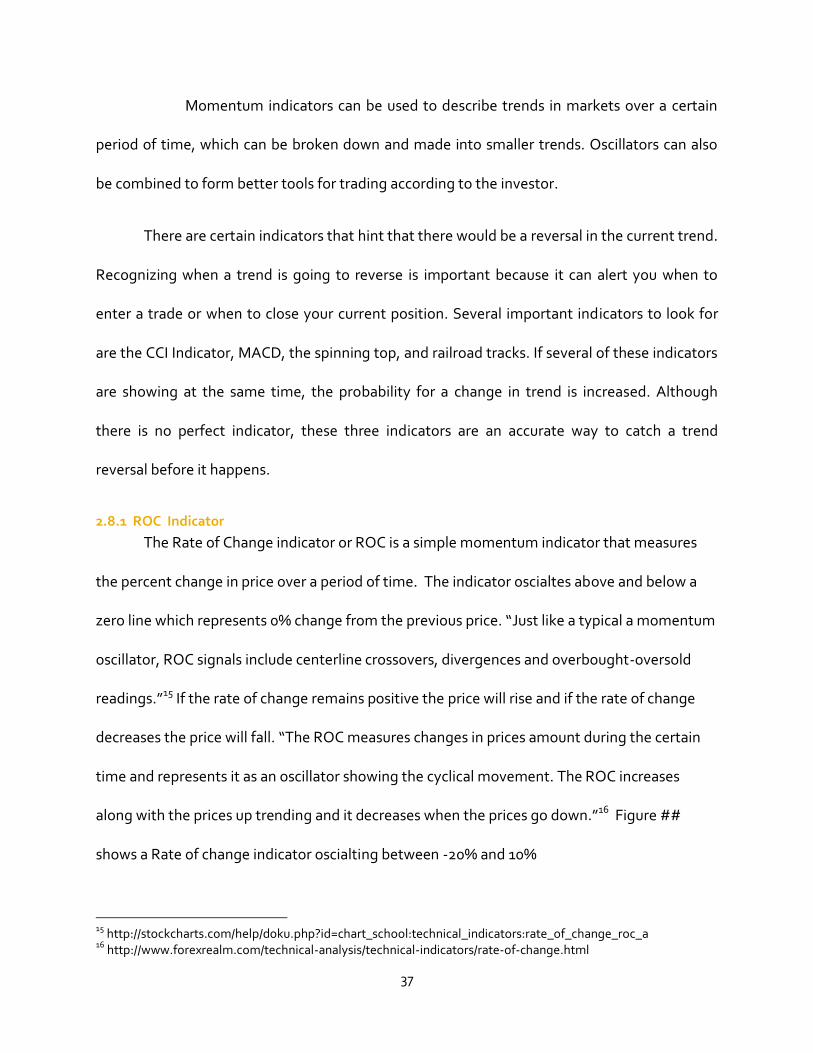
2.8.1 ROC Indicator
The Rate of Change indicator or ROC is a simple momentum indicator that measures
the percent change in price over a period of time. The indicator oscialtes above and below a
zero line which represents 0% change from the previous price. “Just like a typical a momentum
oscillator, ROC signals include centerline crossovers, divergences and overbought-oversold
readings.”15 If the rate of change remains positive the price will rise and if the rate of change
decreases the price will fall. “The ROC measures changes in prices amount during the certain
time and represents it as an oscillator showing the cyclical movement. The ROC increases
along with the prices up trending and it decreases when the prices go down.”16 Figure ##
shows a Rate of change indicator oscialting between -20% and 10%
15 http://stockcharts.com/help/doku.php?id=chart_school:technical_indicators:rate_of_change_roc_a 16 http://www.forexrealm.com/technical-analysis/technical-indicators/rate-of-change.html
38
Figure 2.7: example of the Rate of Change indicator
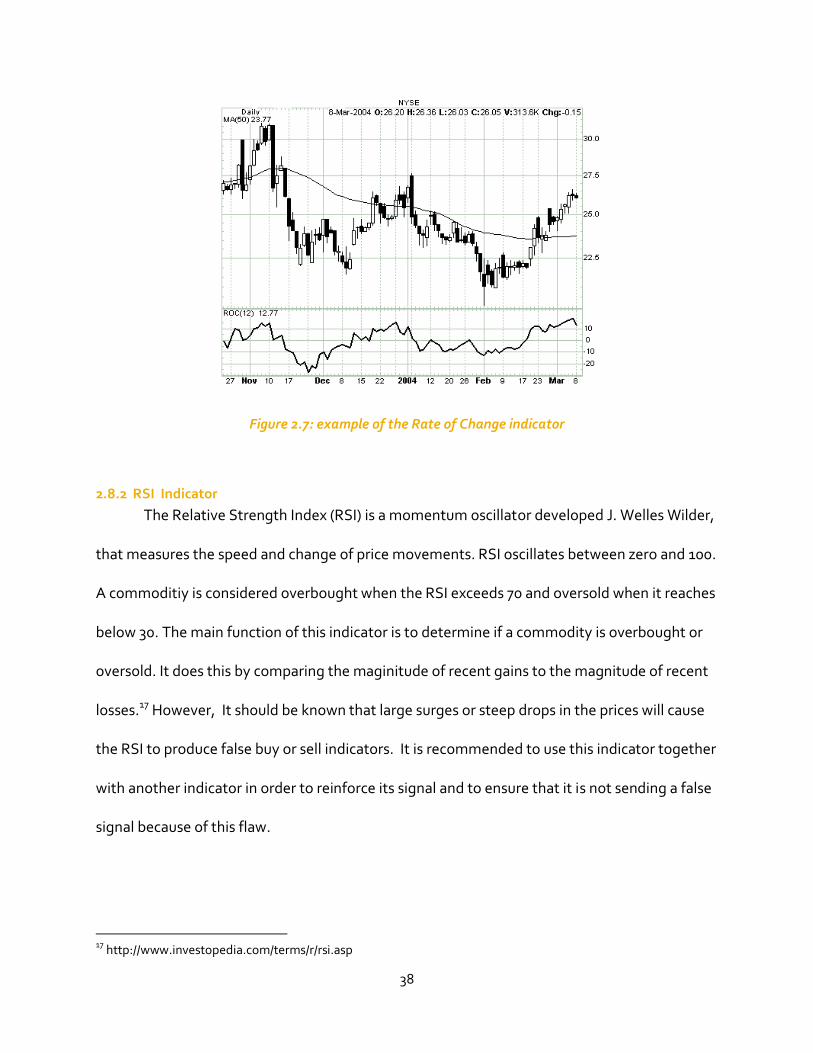
2.8.2 RSI Indicator
The Relative Strength Index (RSI) is a momentum oscillator developed J. Welles Wilder,
that measures the speed and change of price movements. RSI oscillates between zero and 100.
A commoditiy is considered overbought when the RSI exceeds 70 and oversold when it reaches
below 30. The main function of this indicator is to determine if a commodity is overbought or
oversold. It does this by comparing the maginitude of recent gains to the magnitude of recent
losses.17 However, It should be known that large surges or steep drops in the prices will cause
the RSI to produce false buy or sell indicators. It is recommended to use this indicator together
with another indicator in order to reinforce its signal and to ensure that it is not sending a false
signal because of this flaw.
17 http://www.investopedia.com/terms/r/rsi.asp
39
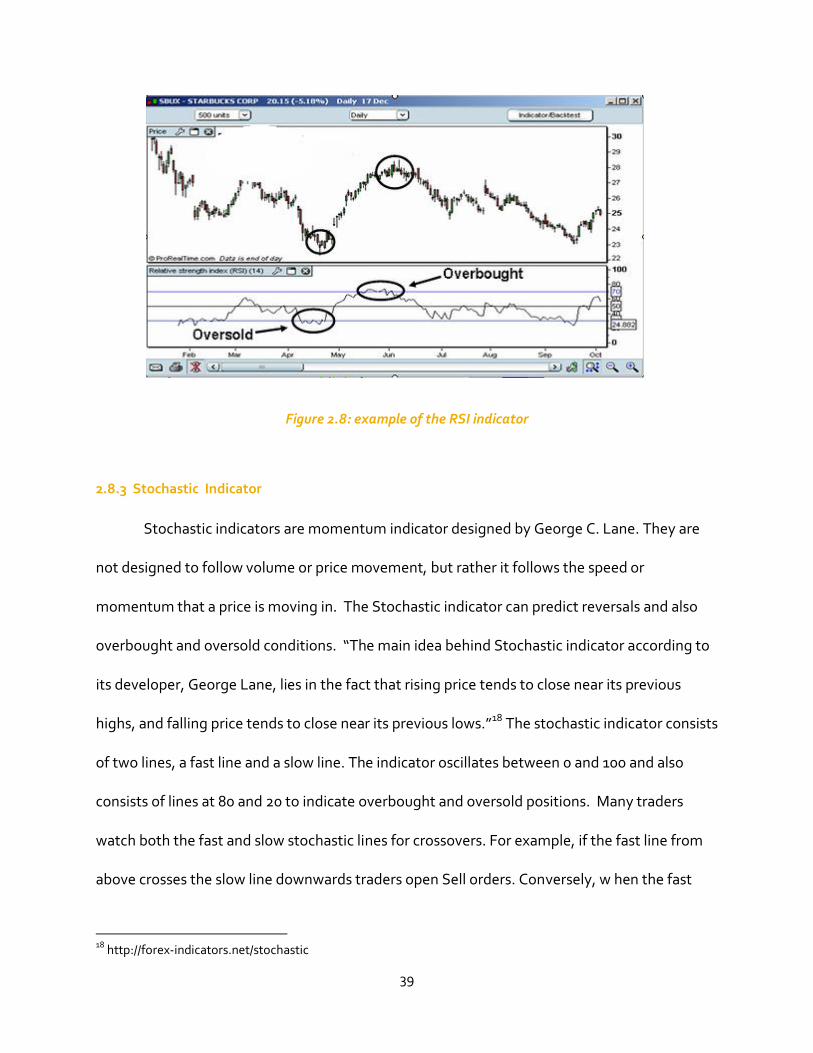
Figure 2.8: example of the RSI indicator
2.8.3 Stochastic Indicator
Stochastic indicators are momentum indicator designed by George C. Lane. They are
not designed to follow volume or price movement, but rather it follows the speed or
momentum that a price is moving in. The Stochastic indicator can predict reversals and also
overbought and oversold conditions. “The main idea behind Stochastic indicator according to
its developer, George Lane, lies in the fact that rising price tends to close near its previous
highs, and falling price tends to close near its previous lows.”18 The stochastic indicator consists
of two lines, a fast line and a slow line. The indicator oscillates between 0 and 100 and also
consists of lines at 80 and 20 to indicate overbought and oversold positions. Many traders
watch both the fast and slow stochastic lines for crossovers. For example, if the fast line from
above crosses the slow line downwards traders open Sell orders. Conversely, w hen the fast
18 http://forex-indicators.net/stochastic
40
line from below crosses slow line upwards traders open Buy orders. This is the same strategy
used with moving averages. If these crossovers occur above the 80% level and below the 20%
the signal is considered to be even stronger. The lines can remain in the overbought or
oversold zones for a while in a trending market so it is important to wait for the lines to leave
the zone in order to confirm the trend is reversing.
There are three types of stochastic, full, fast and slow. In the fast stochastic the %K
Line, or the fast line, is not smooth and it not plotted as a moving average. In the slow
stochastic the %K line is smoothed by using a 3 period moving average of the %K line.
Basically, the %K line will move more in the fast stochastic. The fast stochastic will allow you to
enter into trades earlier because it will give earlier signals than the slow stochastic. The fast
stochastic allows you to get into trades earlier, but can also cause you to enter into false
positions because it will be moving more inaccurately than the slow stochastic. With the full
stochastic you can also choose a simple moving average for the %K line like in the slow
stochastic, but what makes it unique is you can also change the number of periods which
smoothes out the %D line, or slow line.
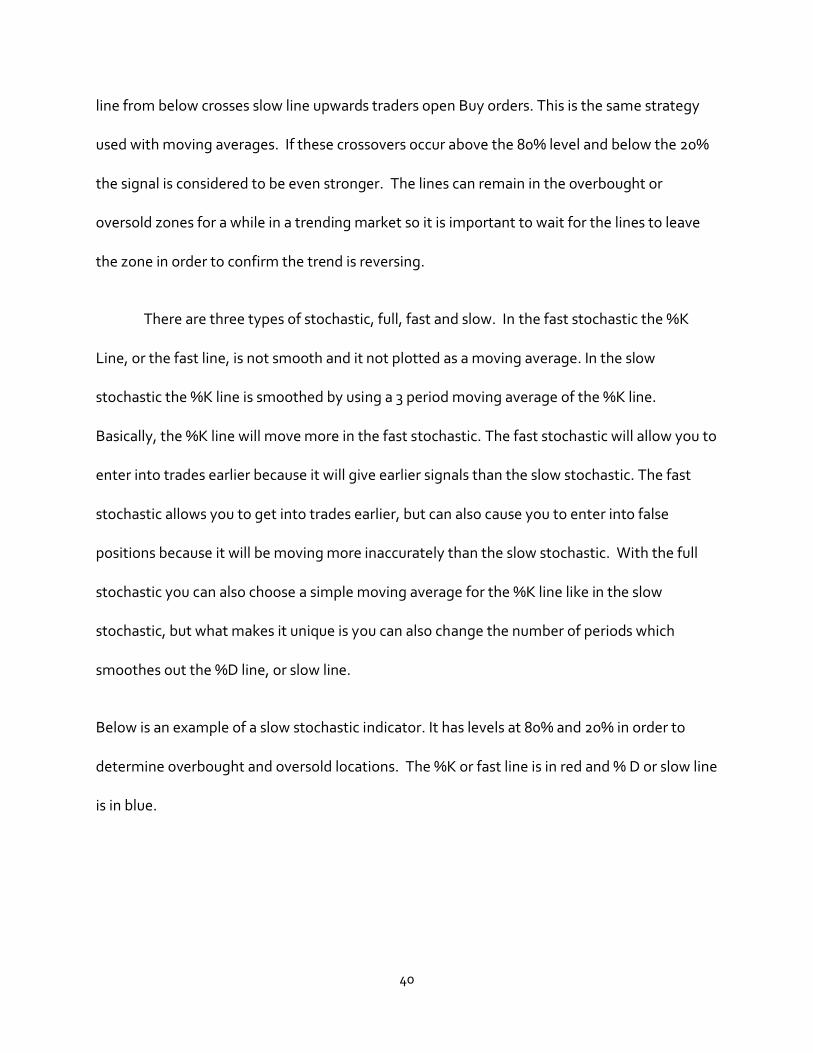
Below is an example of a slow stochastic indicator. It has levels at 80% and 20% in order to
determine overbought and oversold locations. The %K or fast line is in red and % D or slow line
is in blue.
41
Figure 2.9: example of the slow stochastic indicator
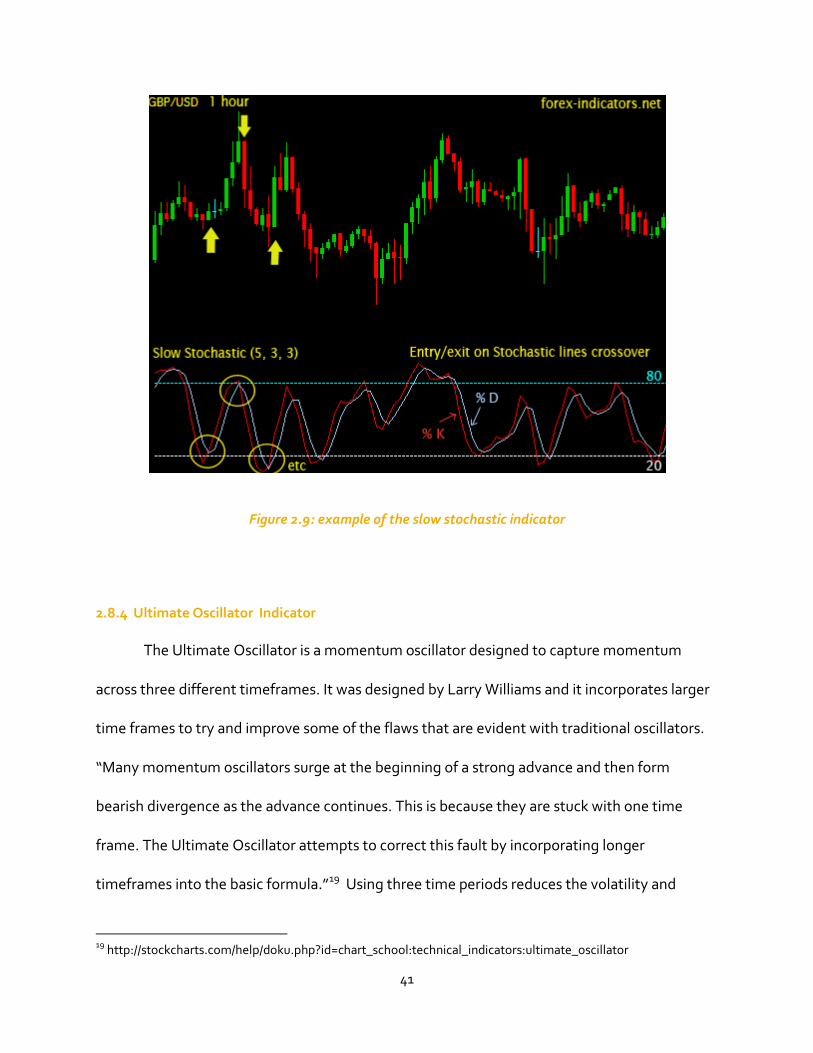
2.8.4 Ultimate Oscillator Indicator
The Ultimate Oscillator is a momentum oscillator designed to capture momentum
across three different timeframes. It was designed by Larry Williams and it incorporates larger
time frames to try and improve some of the flaws that are evident with traditional oscillators.
“Many momentum oscillators surge at the beginning of a strong advance and then form
bearish divergence as the advance continues. This is because they are stuck with one time
frame. The Ultimate Oscillator attempts to correct this fault by incorporating longer
timeframes into the basic formula.”19 Using three time periods reduces the volatility and
19 http://stockcharts.com/help/doku.php?id=chart_school:technical_indicators:ultimate_oscillator
42
decreases the chances of false signals that maybe result when just a single time period is
used.20 The ultimate oscillator fluctuates between 0 and 100. Overbought, oversold and
divergence are the type of signals that traders look for in the ultimate oscillator. The ultimate
oscillator tries to predict buying pressure. When Buying Pressure is strong the ultimate
oscillator rises and falls when buying pressure is weak. The centerline acts as a bear/bull
divider line. So if the ultimate oscillator moves above the center line the market is a bull and
the buying pressure is strong. If it moves below the center line the market is considered to be a
bear and the buying pressure is weak.
Figure 2.10: example of the Ultimate Oscillator
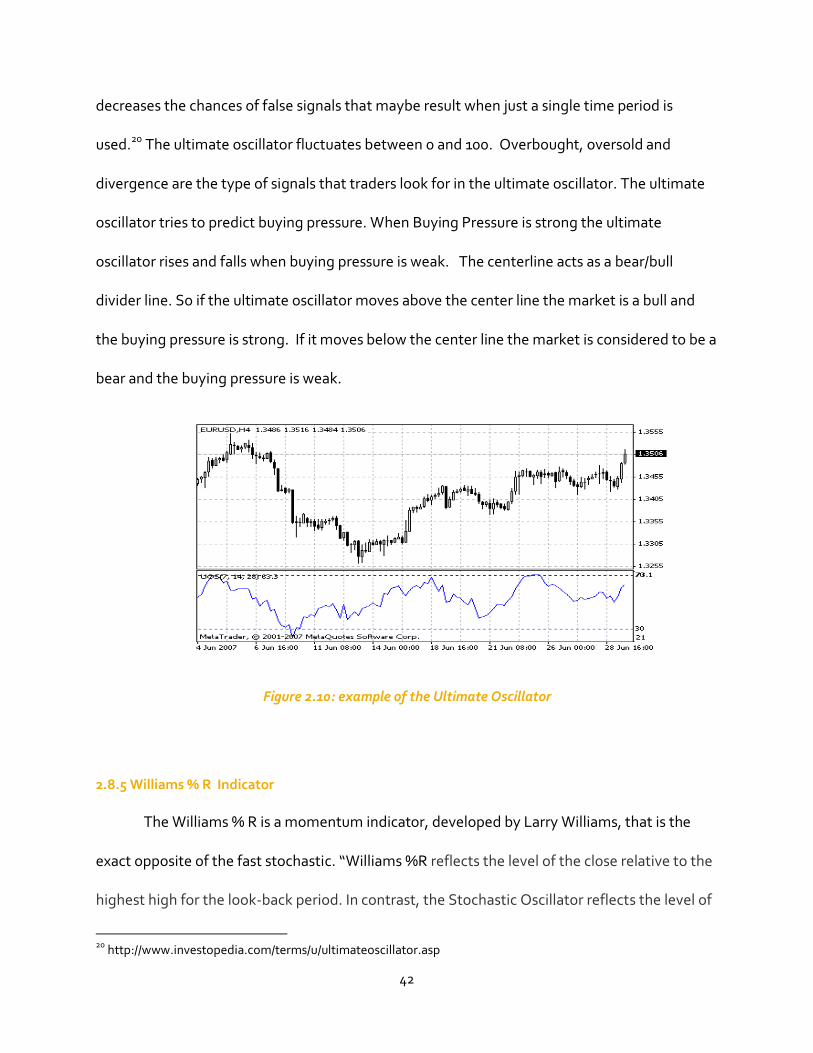
2.8.5 Williams % R Indicator
The Williams % R is a momentum indicator, developed by Larry Williams, that is the
exact opposite of the fast stochastic. “Williams %R reflects the level of the close relative to the
highest high for the look-back period. In contrast, the Stochastic Oscillator reflects the level of
20 http://www.investopedia.com/terms/u/ultimateoscillator.asp
43
the close relative to the lowest low. %R corrects for the inversion by multiplying the raw value
by -100.”21 The Williams % R looks exactly like the fast stochastic and gives the same signals.
Just like the fast stochastic the Williams %R does a great job of identifying overbought and
oversold markets.
Figure 2.11: example of a Williams % R indicator
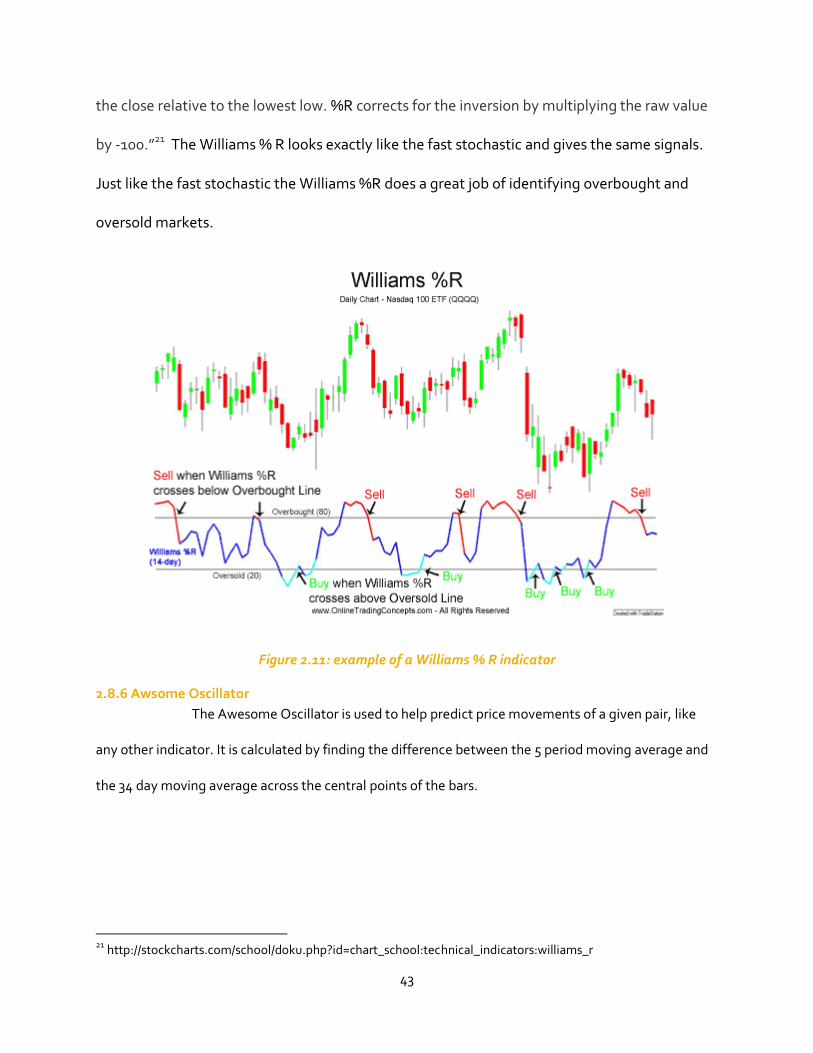
2.8.6 Awsome Oscillator
The Awesome Oscillator is used to help predict price movements of a given pair, like
any other indicator. It is calculated by finding the difference between the 5 period moving average and
the 34 day moving average across the central points of the bars.
21 http://stockcharts.com/school/doku.php?id=chart_school:technical_indicators:williams_r
44
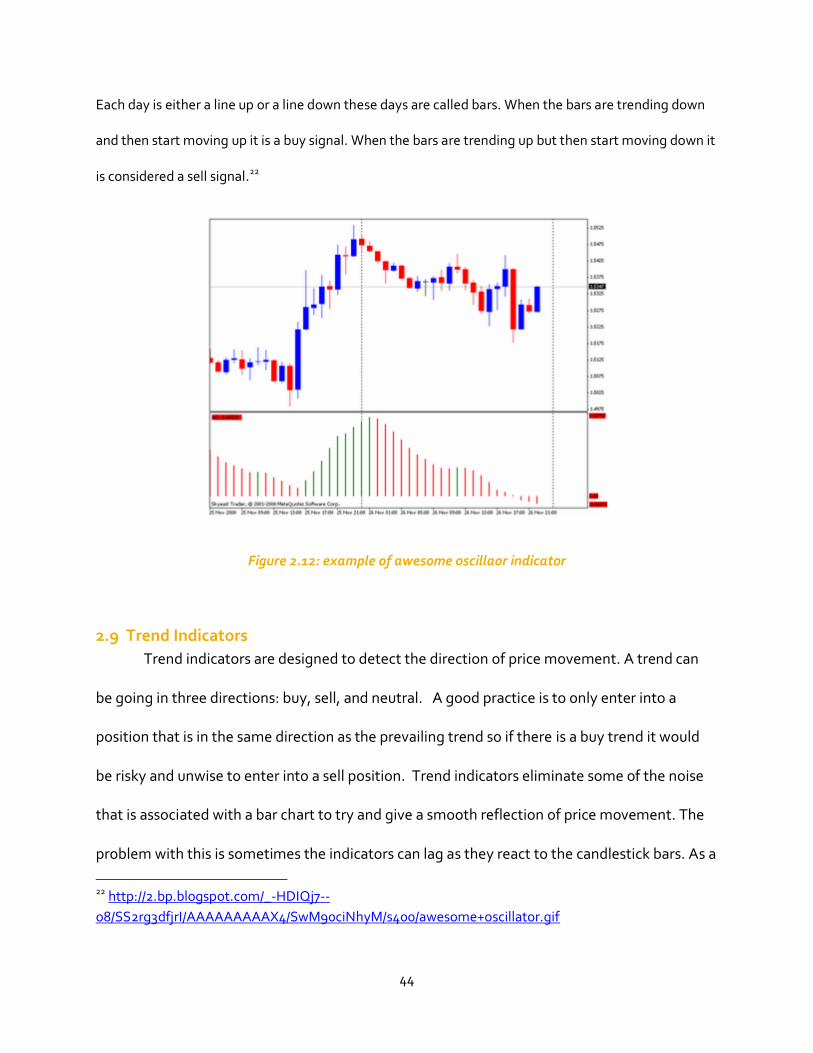
Each day is either a line up or a line down these days are called bars. When the bars are trending down
and then start moving up it is a buy signal. When the bars are trending up but then start moving down it
is considered a sell signal.22
Figure 2.12: example of awesome oscillaor indicator
2.9 Trend Indicators
Trend indicators are designed to detect the direction of price movement. A trend can
be going in three directions: buy, sell, and neutral. A good practice is to only enter into a
position that is in the same direction as the prevailing trend so if there is a buy trend it would
be risky and unwise to enter into a sell position. Trend indicators eliminate some of the noise
that is associated with a bar chart to try and give a smooth reflection of price movement. The
problem with this is sometimes the indicators can lag as they react to the candlestick bars. As a
22 http://2.bp.blogspot.com/_-HDIQj7--
o8/SS2rg3dfjrI/AAAAAAAAAX4/SwM90ciNhyM/s400/awesome+oscillator.gif
45
result of this lag trend indicators are misleading in a ranging or oscillating market. It’s
important to only rely on a trend indicator when the market is in a strong trend and not in an
oscillation pattern. In a ranging market the price fluctuates too fast for a trend indicator and
sometimes can give false information to traders.23
Trend indicators are effective because the price movement reflects the major economic
data that is prevalent at the present time. If a person follows the economic news releases and
then watches the trend indicator on a chart they can find good locations to enter into a trend.24
It’s important to let a trend establish for a bit in order to ensure that the strength of the price
movement is strong. By using this strategy you won’t catch the entire trend, but your risks of
entering into a bad position is decreased. Although this is a conservative trading method it is
still effective. Any time your risk is reduced typically the amount of profit is also reduced,
although this isn’t necessarily a bad thing because it is critical to manage your losses and try
and minimize the number of bad positions you enter into. Moving averages are indicators that
measure the momentum and direction of a trend. The idea behind moving averages is that the
price of a currency pair or stock will fluctuate above and below the average over a period of
time. Momentum is calculated by determining if the current prices are above or below the
market's average value. The period of time of an average is picked at random because it is
impossible to calculate the average (the market opened in 1980 and is relevant to current time
investing.) There are many types of moving averages; they include simple moving averages,
exponential moving averages, smoothed moving averages, and linear regressed moving
23 http://www.incrediblecharts.com/indicators/trend_indicators.php 24 http://www.forextraders.com/forex-analysis/forex-technical-analysis/forex-trend-indicators.html
46
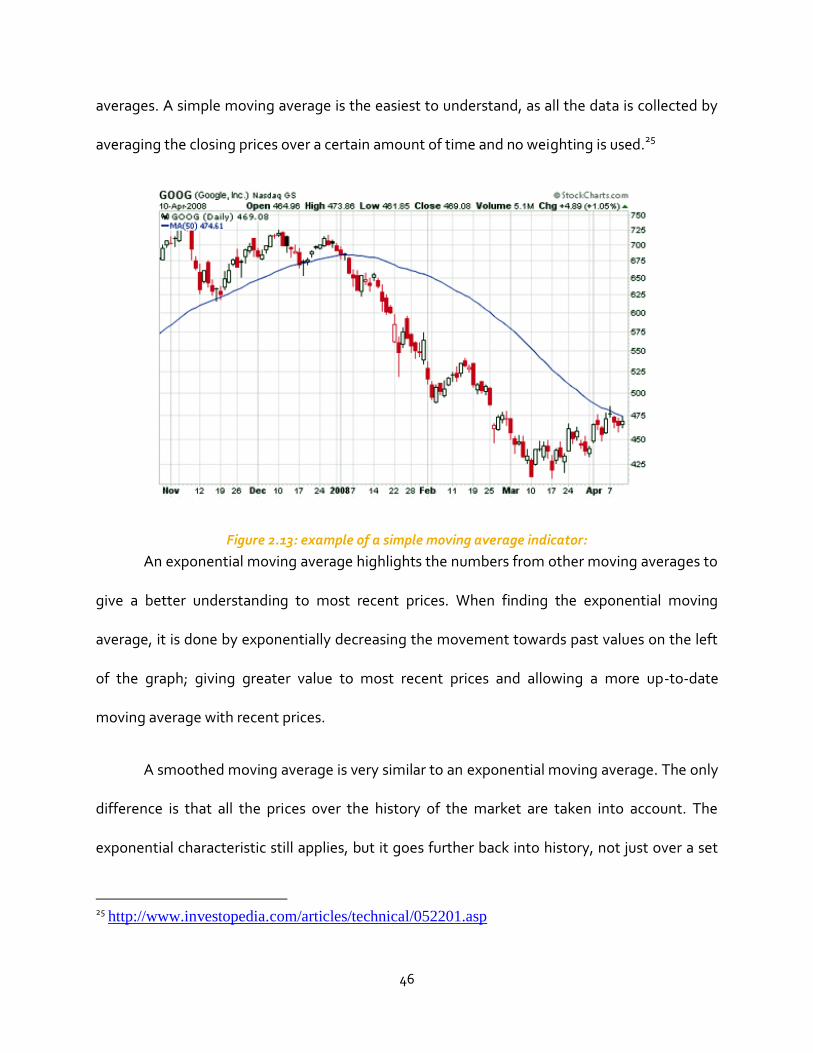
averages. A simple moving average is the easiest to understand, as all the data is collected by
averaging the closing prices over a certain amount of time and no weighting is used.25
Figure 2.13: example of a simple moving average indicator:
An exponential moving average highlights the numbers from other moving averages to
give a better understanding to most recent prices. When finding the exponential moving
average, it is done by exponentially decreasing the movement towards past values on the left
of the graph; giving greater value to most recent prices and allowing a more up-to-date
moving average with recent prices.
A smoothed moving average is very similar to an exponential moving average. The only
difference is that all the prices over the history of the market are taken into account. The
exponential characteristic still applies, but it goes further back into history, not just over a set
25 http://www.investopedia.com/articles/technical/052201.asp
47
period of time. This indicator is also used more commonly for, as described by the name,
smoothing price fluctuation by removing short-term volatility. It is useful to show clearly the
long term momentum of the market.
Linear regressed moving averages are similar to both simple moving averages and
exponential moving averages. However, instead of weighting past data that is exponentially
less, it does so linearly. It starts with an initial given period of time (n) that is multiplied by 1. A
more recent consecutive period of time is chosen and (n-1) and is multiplied by a factor of 2,
and so on until present time is reached. The following indicators are examples of trend indicators.
2.9.1 CCI indicator
The first indicator to use to try and spot a trend reversal is the CCI indicator. “An
oscillator used in technical analysis to help determine when an investment vehicle has been
overbought and oversold.”26 It is calculated by subtracting the forex price minus the Moving
Average, which is then divided by the standard deviation. The CCI, which was designed by
Donald Lambert is used to identify cyclical trends. When the indicator generates a signal
outside of the range of -100 to +100 a buy or sell signal is apparet. For example, When the CCI
crosses below the -100 level there is a stron downtrend and a sell signal is appropirate. The CCI
aslo gives realistic evidence to approximate changes in the direction of price movement. For
example, when the indicator hits a certain mark like +200 investors usually wait for the
indicator to retreat back to +100 before entering into a position in the direction of the now
strong downtrend.
26 http://www.investopedia.com/terms/c/commoditychannelindex.asp
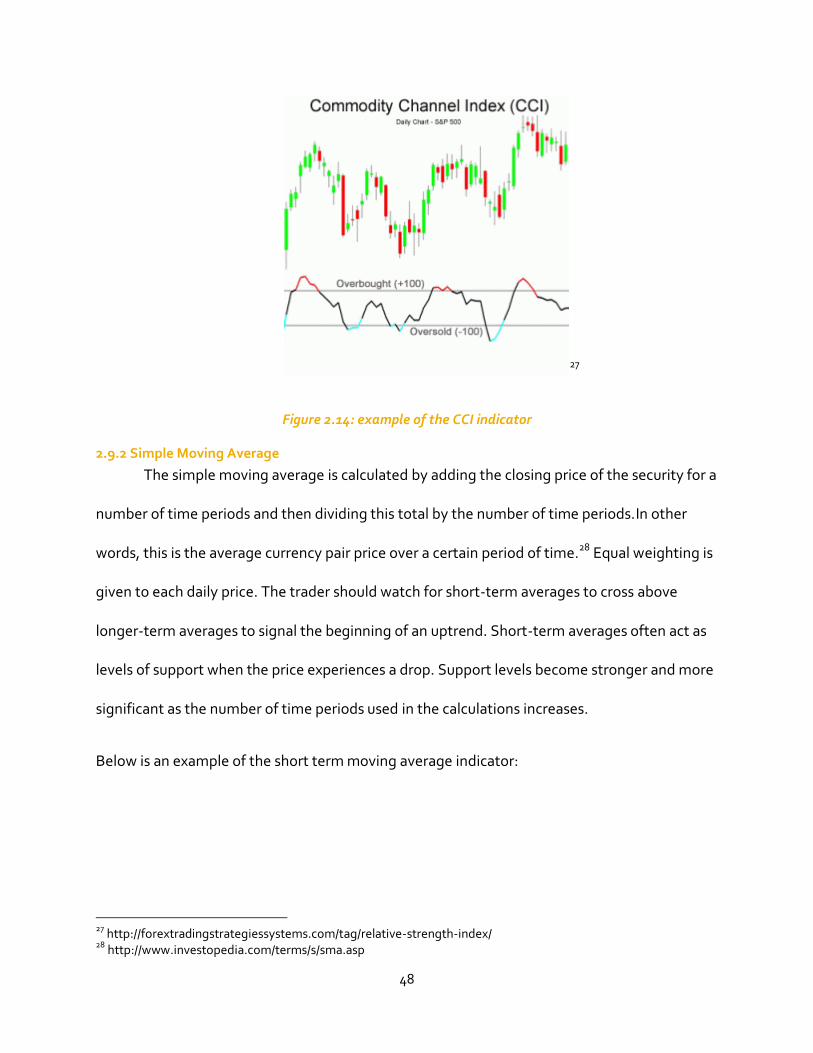
48
27
Figure 2.14: example of the CCI indicator
2.9.2 Simple Moving Average
The simple moving average is calculated by adding the closing price of the security for a
number of time periods and then dividing this total by the number of time periods.In other
words, this is the average currency pair price over a certain period of time.28 Equal weighting is
given to each daily price. The trader should watch for short-term averages to cross above
longer-term averages to signal the beginning of an uptrend. Short-term averages often act as
levels of support when the price experiences a drop. Support levels become stronger and more
significant as the number of time periods used in the calculations increases.
Below is an example of the short term moving average indicator:
27 http://forextradingstrategiessystems.com/tag/relative-strength-index/ 28 http://www.investopedia.com/terms/s/sma.asp
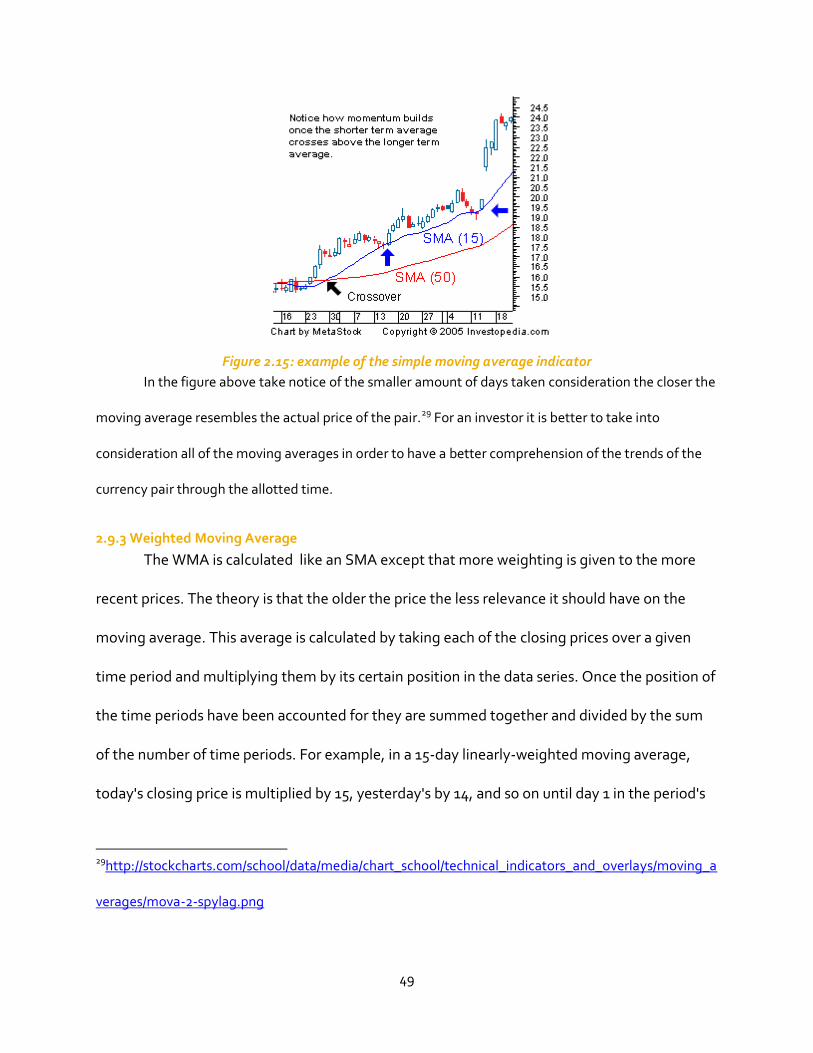
49
Figure 2.15: example of the simple moving average indicator
In the figure above take notice of the smaller amount of days taken consideration the closer the
moving average resembles the actual price of the pair.29 For an investor it is better to take into
consideration all of the moving averages in order to have a better comprehension of the trends of the
currency pair through the allotted time.
2.9.3 Weighted Moving Average
The WMA is calculated like an SMA except that more weighting is given to the more
recent prices. The theory is that the older the price the less relevance it should have on the
moving average. This average is calculated by taking each of the closing prices over a given
time period and multiplying them by its certain position in the data series. Once the position of
the time periods have been accounted for they are summed together and divided by the sum
of the number of time periods. For example, in a 15-day linearly-weighted moving average,
today's closing price is multiplied by 15, yesterday's by 14, and so on until day 1 in the period's
29http://stockcharts.com/school/data/media/chart_school/technical_indicators_and_overlays/moving_a
verages/mova-2-spylag.png
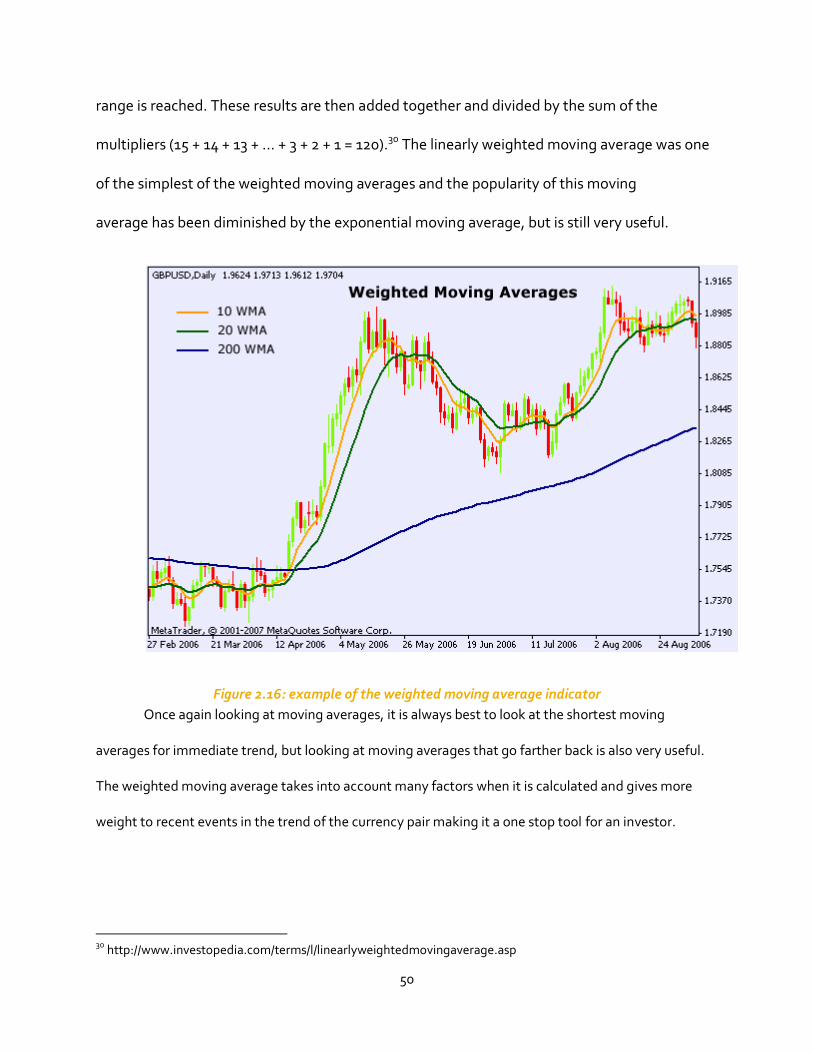
50
range is reached. These results are then added together and divided by the sum of the
multipliers (15 + 14 + 13 + ... + 3 + 2 + 1 = 120).30 The linearly weighted moving average was one
of the simplest of the weighted moving averages and the popularity of this moving
average has been diminished by the exponential moving average, but is still very useful.
Figure 2.16: example of the weighted moving average indicator
Once again looking at moving averages, it is always best to look at the shortest moving
averages for immediate trend, but looking at moving averages that go farther back is also very useful.
The weighted moving average takes into account many factors when it is calculated and gives more
weight to recent events in the trend of the currency pair making it a one stop tool for an investor.
30 http://www.investopedia.com/terms/l/linearlyweightedmovingaverage.asp
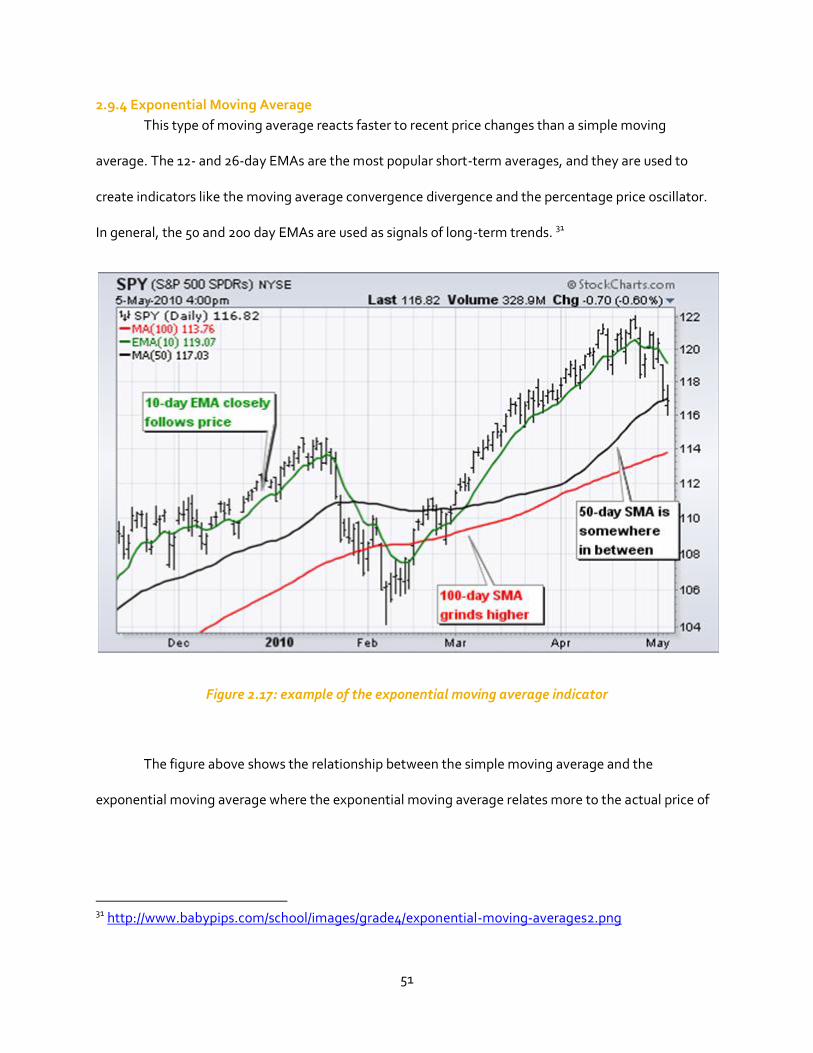
51
2.9.4 Exponential Moving Average
This type of moving average reacts faster to recent price changes than a simple moving
average. The 12- and 26-day EMAs are the most popular short-term averages, and they are used to
create indicators like the moving average convergence divergence and the percentage price oscillator.
In general, the 50 and 200 day EMAs are used as signals of long-term trends. 31
Figure 2.17: example of the exponential moving average indicator
The figure above shows the relationship between the simple moving average and the
exponential moving average where the exponential moving average relates more to the actual price of
31 http://www.babypips.com/school/images/grade4/exponential-moving-averages2.png
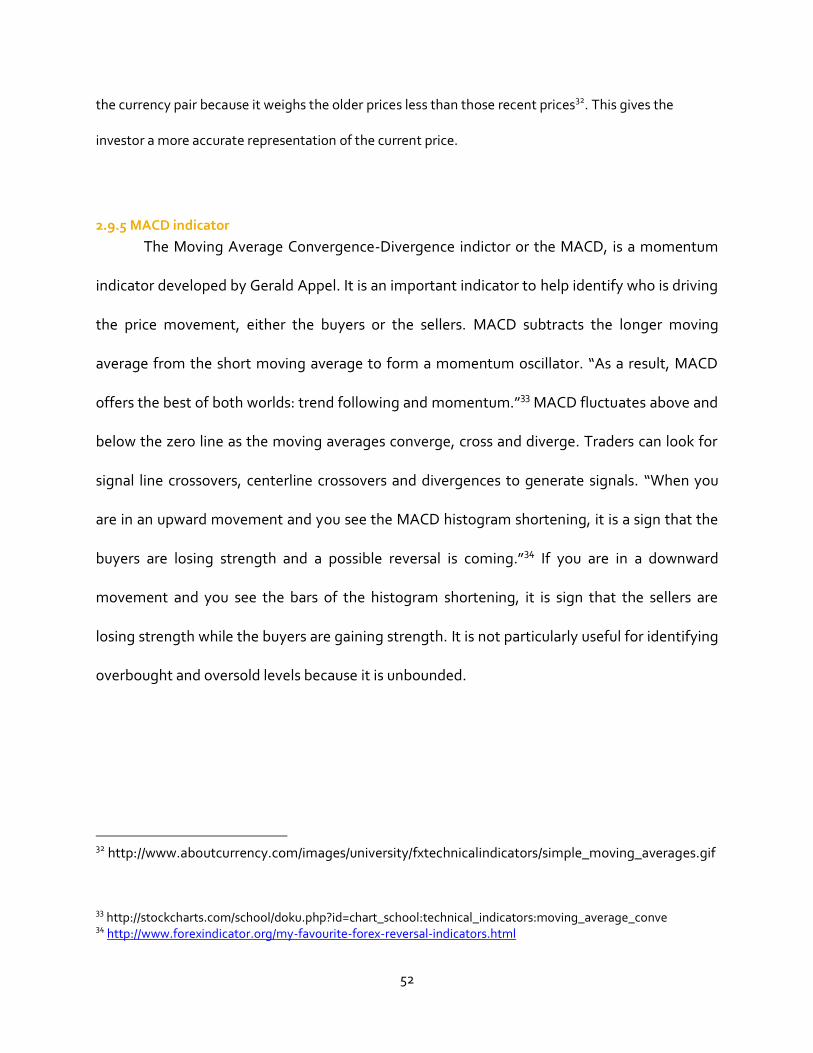
52
the currency pair because it weighs the older prices less than those recent prices32. This gives the
investor a more accurate representation of the current price.
2.9.5 MACD indicator
The Moving Average Convergence-Divergence indictor or the MACD, is a momentum
indicator developed by Gerald Appel. It is an important indicator to help identify who is driving
the price movement, either the buyers or the sellers. MACD subtracts the longer moving
average from the short moving average to form a momentum oscillator. “As a result, MACD
offers the best of both worlds: trend following and momentum.”33 MACD fluctuates above and
below the zero line as the moving averages converge, cross and diverge. Traders can look for
signal line crossovers, centerline crossovers and divergences to generate signals. “When you
are in an upward movement and you see the MACD histogram shortening, it is a sign that the
buyers are losing strength and a possible reversal is coming.”34 If you are in a downward
movement and you see the bars of the histogram shortening, it is sign that the sellers are
losing strength while the buyers are gaining strength. It is not particularly useful for identifying
overbought and oversold levels because it is unbounded.
32 http://www.aboutcurrency.com/images/university/fxtechnicalindicators/simple_moving_averages.gif
33
http://stockcharts.com/school/doku.php?id=chart_school:technical_indicators:moving_average_conve 34 http://www.forexindicator.org/my-favourite-forex-reversal-indicators.html
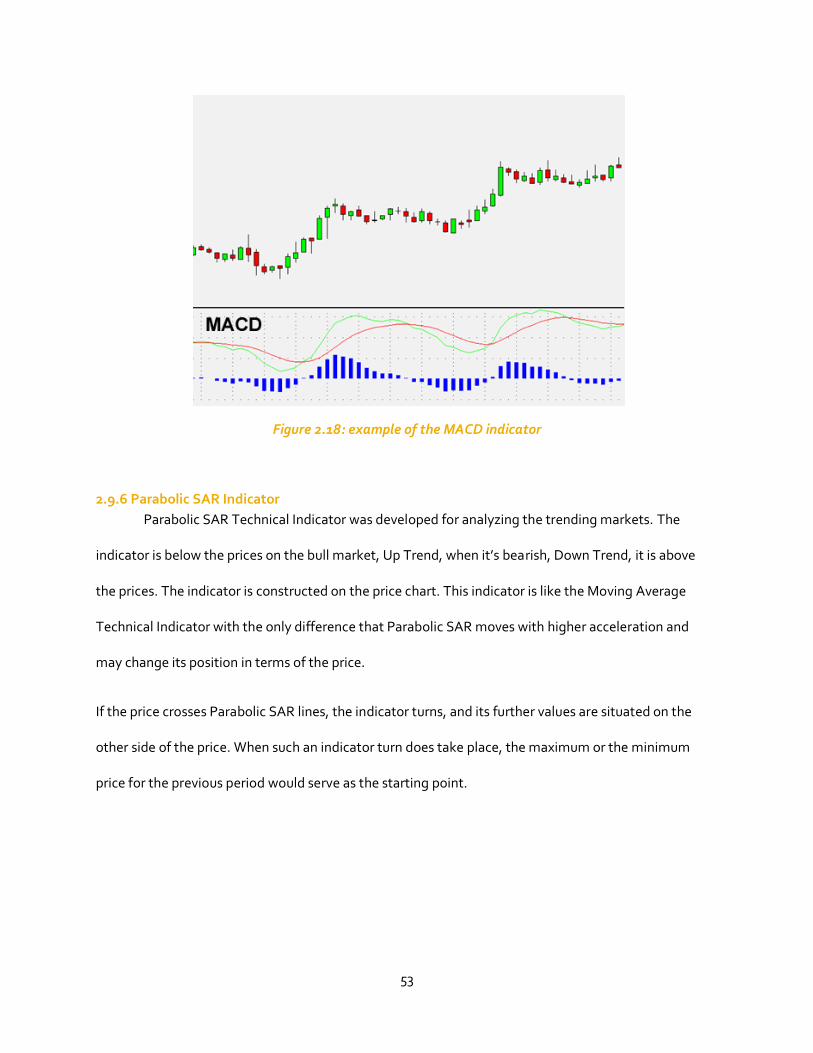
53
Figure 2.18: example of the MACD indicator
2.9.6 Parabolic SAR Indicator
Parabolic SAR Technical Indicator was developed for analyzing the trending markets. The
indicator is below the prices on the bull market, Up Trend, when it’s bearish, Down Trend, it is above
the prices. The indicator is constructed on the price chart. This indicator is like the Moving Average
Technical Indicator with the only difference that Parabolic SAR moves with higher acceleration and
may change its position in terms of the price.
If the price crosses Parabolic SAR lines, the indicator turns, and its further values are situated on the
other side of the price. When such an indicator turn does take place, the maximum or the minimum
price for the previous period would serve as the starting point.
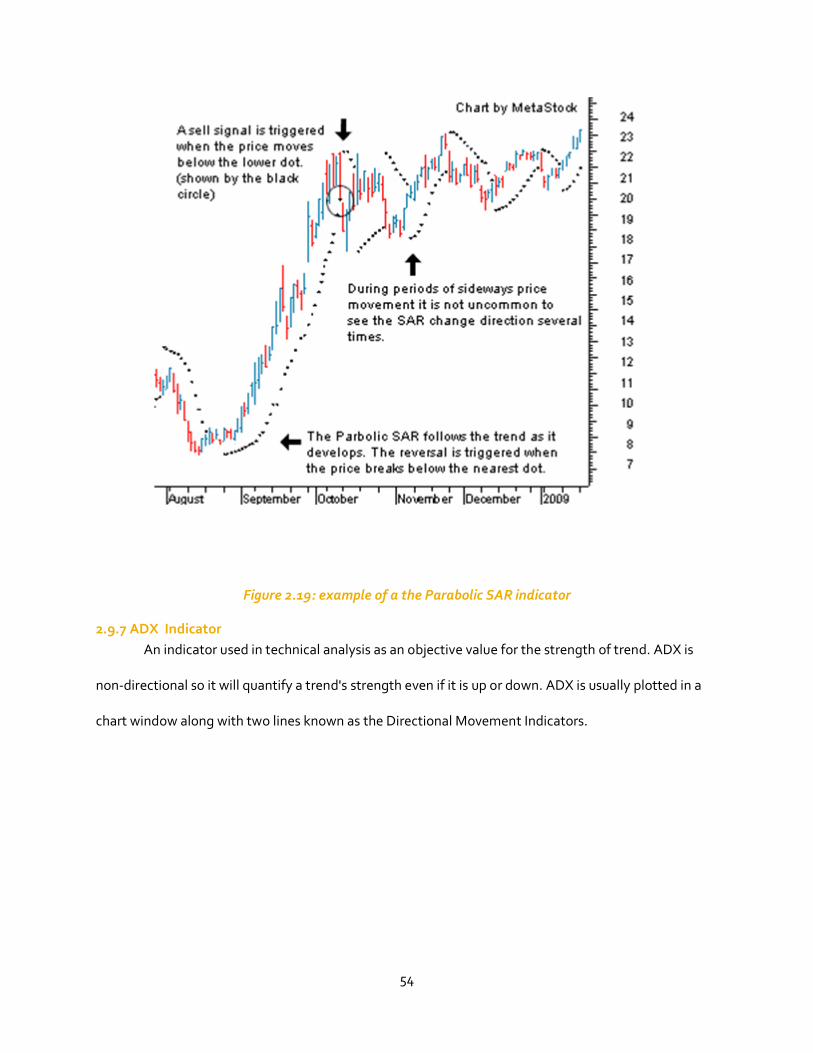
54
Figure 2.19: example of a the Parabolic SAR indicator
2.9.7 ADX Indicator
An indicator used in technical analysis as an objective value for the strength of trend. ADX is
non-directional so it will quantify a trend's strength even if it is up or down. ADX is usually plotted in a
chart window along with two lines known as the Directional Movement Indicators.
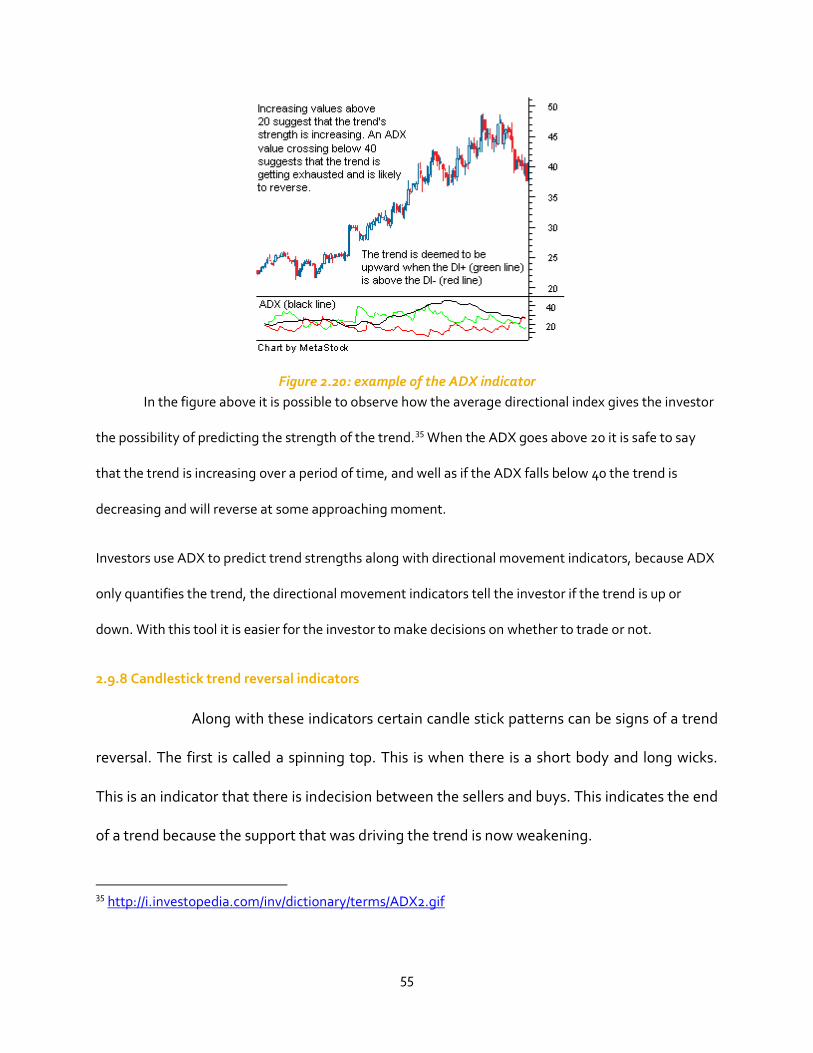
55
Figure 2.20: example of the ADX indicator
In the figure above it is possible to observe how the average directional index gives the investor
the possibility of predicting the strength of the trend.35 When the ADX goes above 20 it is safe to say
that the trend is increasing over a period of time, and well as if the ADX falls below 40 the trend is
decreasing and will reverse at some approaching moment.
Investors use ADX to predict trend strengths along with directional movement indicators, because ADX
only quantifies the trend, the directional movement indicators tell the investor if the trend is up or
down. With this tool it is easier for the investor to make decisions on whether to trade or not.
2.9.8 Candlestick trend reversal indicators
Along with these indicators certain candle stick patterns can be signs of a trend
reversal. The first is called a spinning top. This is when there is a short body and long wicks.
This is an indicator that there is indecision between the sellers and buys. This indicates the end
of a trend because the support that was driving the trend is now weakening.
35 http://i.investopedia.com/inv/dictionary/terms/ADX2.gif
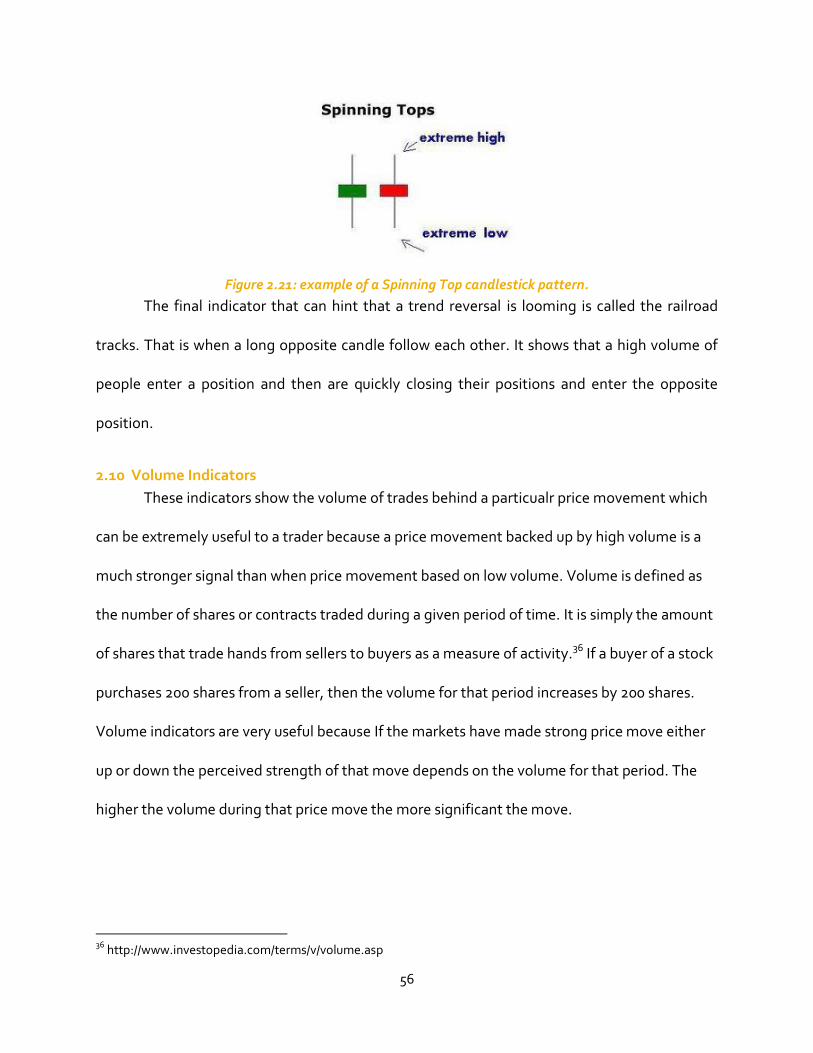
56
Figure 2.21: example of a Spinning Top candlestick pattern.
The final indicator that can hint that a trend reversal is looming is called the railroad
tracks. That is when a long opposite candle follow each other. It shows that a high volume of
people enter a position and then are quickly closing their positions and enter the opposite
position.
2.10 Volume Indicators
These indicators show the volume of trades behind a particualr price movement which
can be extremely useful to a trader because a price movement backed up by high volume is a
much stronger signal than when price movement based on low volume. Volume is defined as
the number of shares or contracts traded during a given period of time. It is simply the amount
of shares that trade hands from sellers to buyers as a measure of activity.36 If a buyer of a stock
purchases 200 shares from a seller, then the volume for that period increases by 200 shares.
Volume indicators are very useful because If the markets have made strong price move either
up or down the perceived strength of that move depends on the volume for that period. The
higher the volume during that price move the more significant the move.
36 http://www.investopedia.com/terms/v/volume.asp
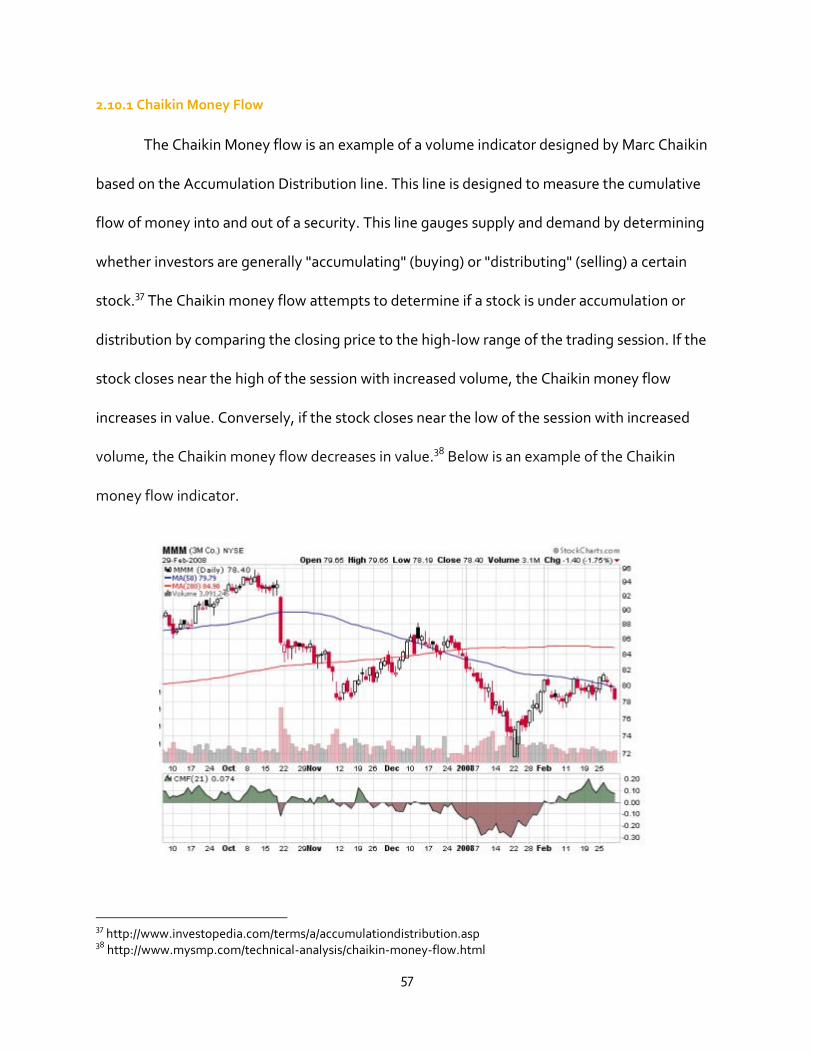
57
2.10.1 Chaikin Money Flow
The Chaikin Money flow is an example of a volume indicator designed by Marc Chaikin
based on the Accumulation Distribution line. This line is designed to measure the cumulative
flow of money into and out of a security. This line gauges supply and demand by determining
whether investors are generally "accumulating" (buying) or "distributing" (selling) a certain
stock.37 The Chaikin money flow attempts to determine if a stock is under accumulation or
distribution by comparing the closing price to the high-low range of the trading session. If the
stock closes near the high of the session with increased volume, the Chaikin money flow
increases in value. Conversely, if the stock closes near the low of the session with increased
volume, the Chaikin money flow decreases in value.38 Below is an example of the Chaikin
money flow indicator.
37 http://www.investopedia.com/terms/a/accumulationdistribution.asp 38 http://www.mysmp.com/technical-analysis/chaikin-money-flow.html
58
Figure 2.22: example of the Chaikin money flow indicator
2.10.2 Force Index
Developed by Alexander Elder, the Force index combines price movements and volume
to measure the strength of buyers and sellers in the market. It is calculated by subtracting the
close from the current period from the close from the previous period, and then multiplying
this by the volume. Force Index= [(Current Close)-(Previous Close)]* Volume. Sometimes the
force index is smoothed out by using a 13 period moving average. The indicator does not
oscillate between a set range, but if the Force index is above zero it signals that the bulls are in
control. Negative Force index signals that the bears are in control. If the index whipsaws
around zero it signals that neither side has control and no strong trend exists.39 There are
three elements to the Force Index. First, there is either a positive or negative price change. A
positive price change signals that buyers were stronger than sellers, while a negative price
change signals that sellers were stronger than buyers. Second, there is the extent of the price
change, which is simply the current close minus the prior close. The "extent" shows us just how
far prices moved. A big advance shows strong buying pressure, while a big decline shows
strong selling pressure. The third and final element is volume, which, according to Elder,
measures commitment. Just how committed are the buyers and sellers? A big advance on
heavy volume shows a strong commitment from buyers. Likewise, a big decline on heavy
volume shows a strong commitment from sellers. The Force Index quantifies these three
39 http://www.incrediblecharts.com/indicators/force_index.php
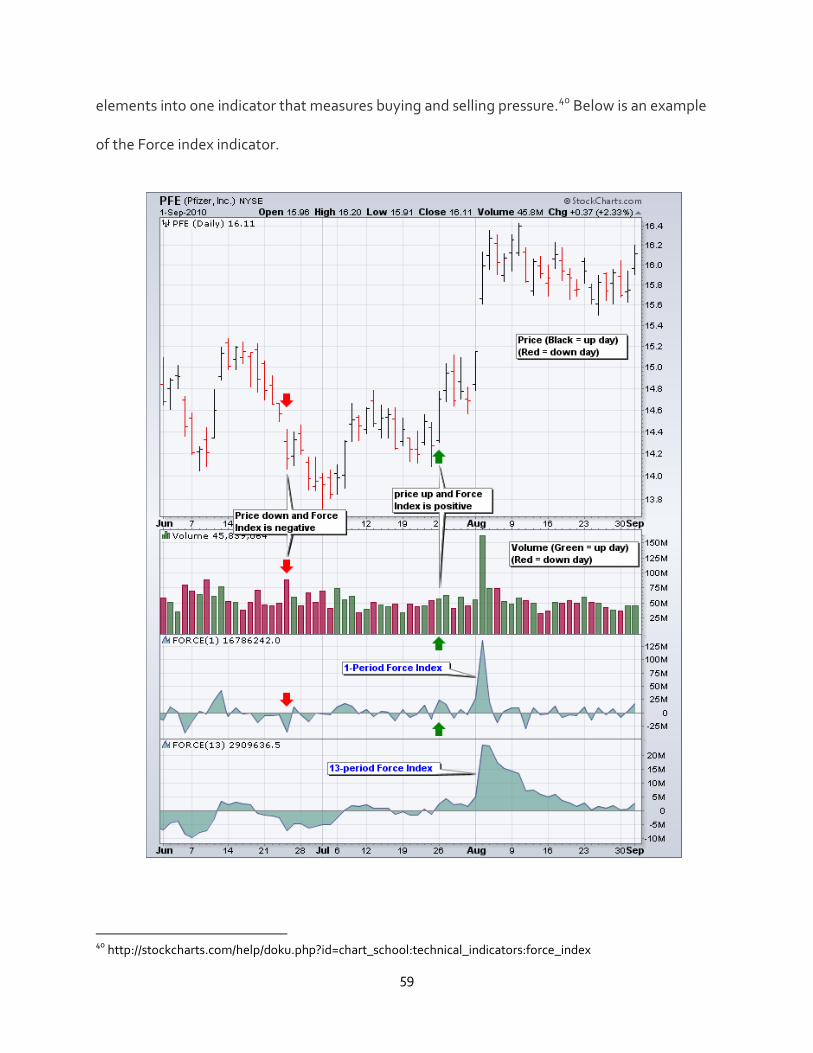
59
elements into one indicator that measures buying and selling pressure.40 Below is an example
of the Force index indicator.
40 http://stockcharts.com/help/doku.php?id=chart_school:technical_indicators:force_index
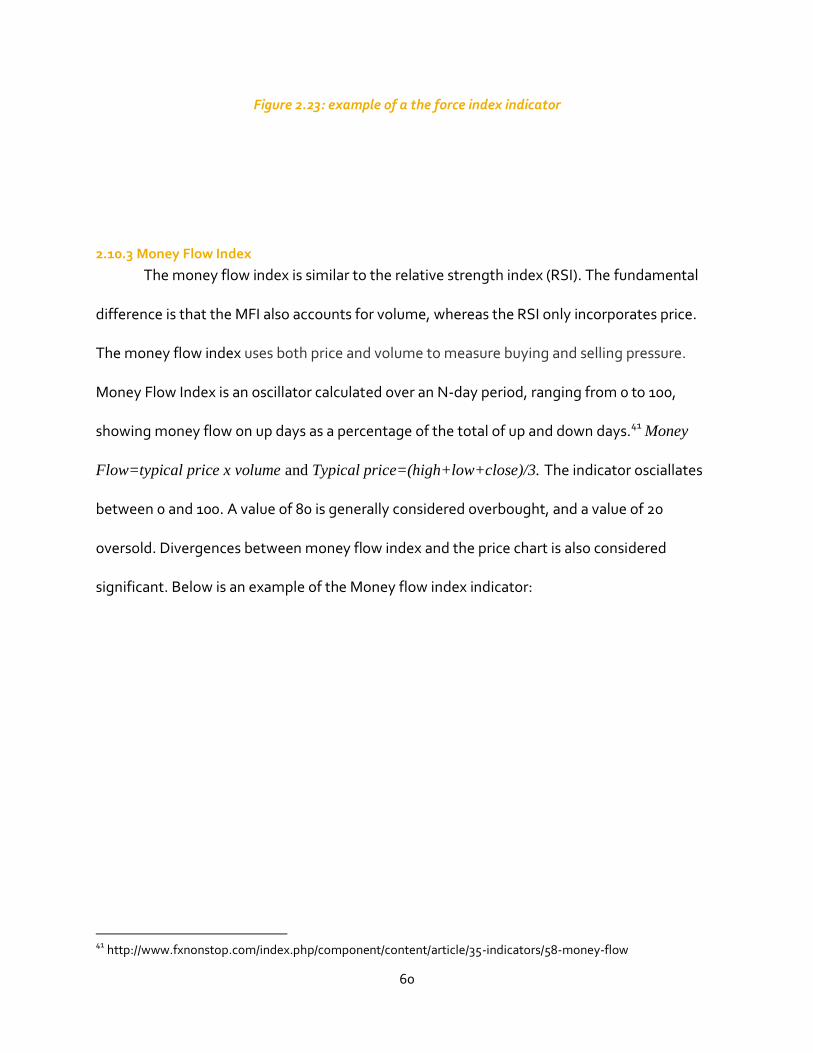
60
Figure 2.23: example of a the force index indicator
2.10.3 Money Flow Index
The money flow index is similar to the relative strength index (RSI). The fundamental
difference is that the MFI also accounts for volume, whereas the RSI only incorporates price.
The money flow index uses both price and volume to measure buying and selling pressure.
Money Flow Index is an oscillator calculated over an N-day period, ranging from 0 to 100,
showing money flow on up days as a percentage of the total of up and down days.41 Money
Flow=typical price x volume and Typical price=(high+low+close)/3. The indicator osciallates
between 0 and 100. A value of 80 is generally considered overbought, and a value of 20
oversold. Divergences between money flow index and the price chart is also considered
significant. Below is an example of the Money flow index indicator:
41 http://www.fxnonstop.com/index.php/component/content/article/35-indicators/58-money-flow
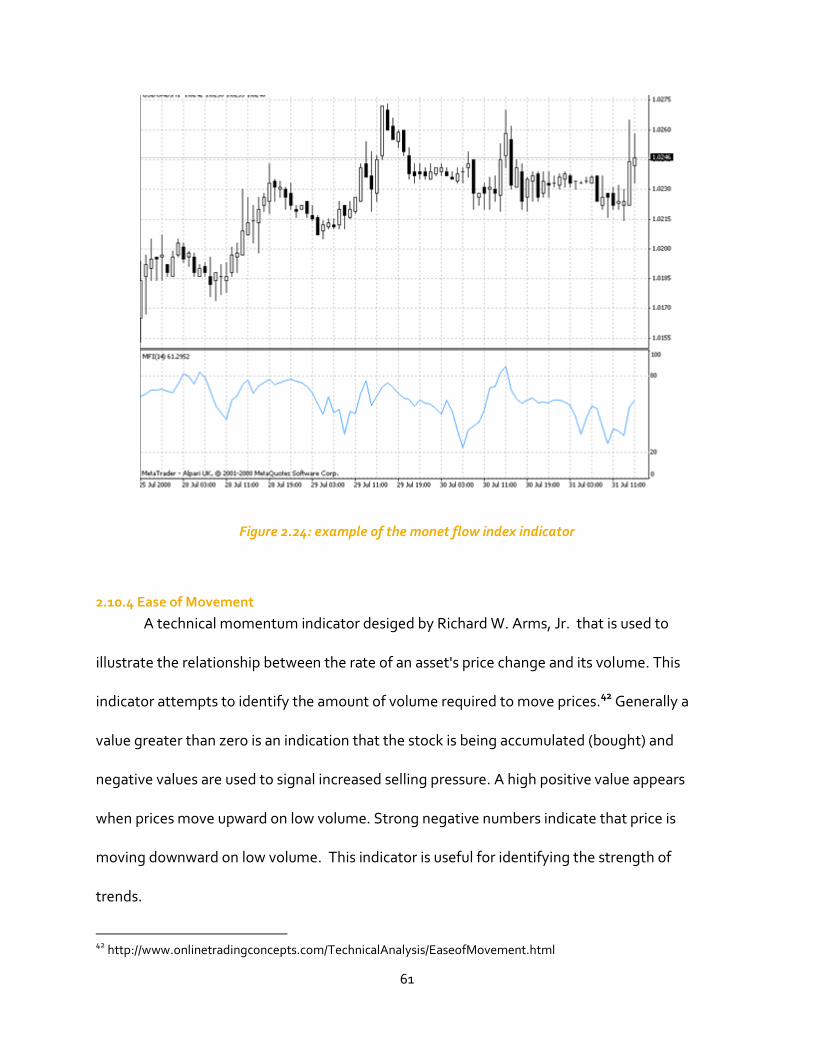
61
Figure 2.24: example of the monet flow index indicator
2.10.4 Ease of Movement
A technical momentum indicator desiged by Richard W. Arms, Jr. that is used to
illustrate the relationship between the rate of an asset's price change and its volume. This
indicator attempts to identify the amount of volume required to move prices.42 Generally a
value greater than zero is an indication that the stock is being accumulated (bought) and
negative values are used to signal increased selling pressure. A high positive value appears
when prices move upward on low volume. Strong negative numbers indicate that price is
moving downward on low volume. This indicator is useful for identifying the strength of
trends.
42 http://www.onlinetradingconcepts.com/TechnicalAnalysis/EaseofMovement.html
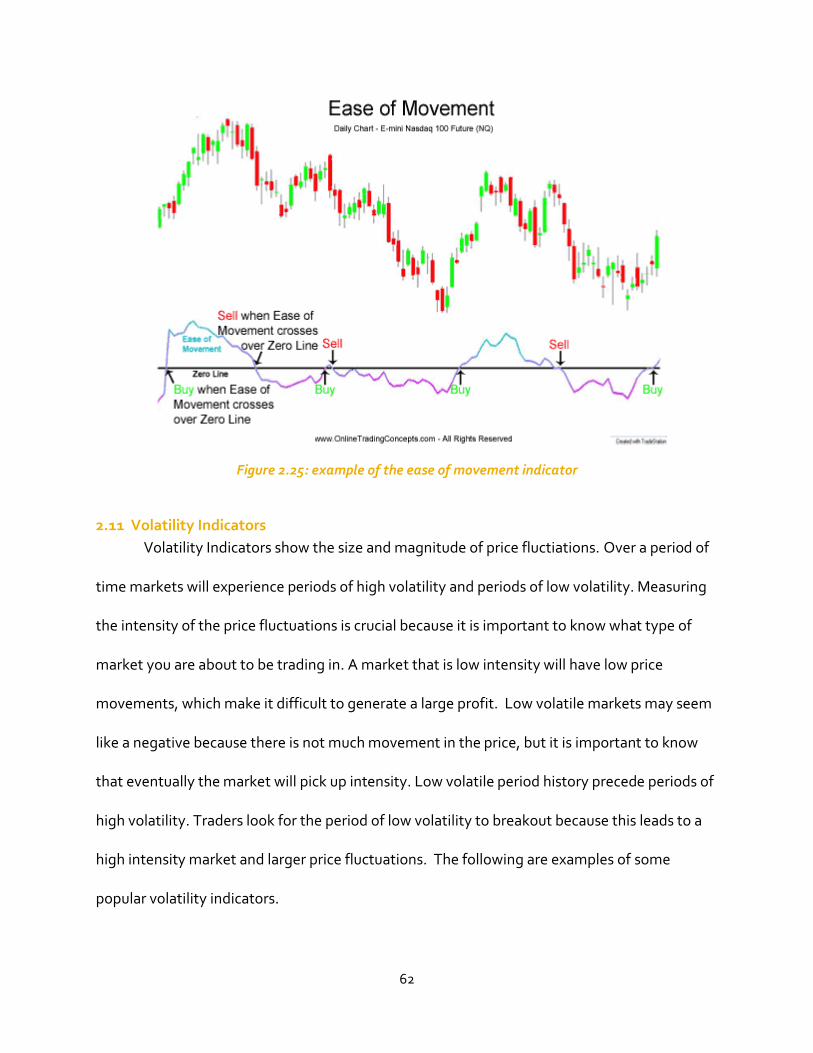
62
Figure 2.25: example of the ease of movement indicator
2.11 Volatility Indicators
Volatility Indicators show the size and magnitude of price fluctiations. Over a period of
time markets will experience periods of high volatility and periods of low volatility. Measuring
the intensity of the price fluctuations is crucial because it is important to know what type of
market you are about to be trading in. A market that is low intensity will have low price
movements, which make it difficult to generate a large profit. Low volatile markets may seem
like a negative because there is not much movement in the price, but it is important to know
that eventually the market will pick up intensity. Low volatile period history precede periods of
high volatility. Traders look for the period of low volatility to breakout because this leads to a
high intensity market and larger price fluctuations. The following are examples of some
popular volatility indicators.
63
2.11.1 Chaikin Volatility
Marc Chaikin's volatility indicator calculates the spread between the maximum and
minimum prices. It judges the value of volatility basing on the amplitude between the
maximum and the minimum. “In general, high values of Chaikin's volatility indicator indicate
increased market volatility and low values indicate low volatility. There are two basic methods
to interpret Chaikin's graphs”43:
Assume that market tops are accompanied by increased volatility and market
bottoms are accompanied by decreased volatility.
Assume that increase in indicator over a shorter time period indicates near-future
market bottom and decrease in indicator over a longer period indicates near-future
market top.
However, unlike the Average True Range indicator, Chaikin's indicator doesn't take
gaps into account. Below is an example of the Chaikin Volatility indicator:
43 http://blog.nobletrading.com/2010/05/chaikins-volatility-indicator.html
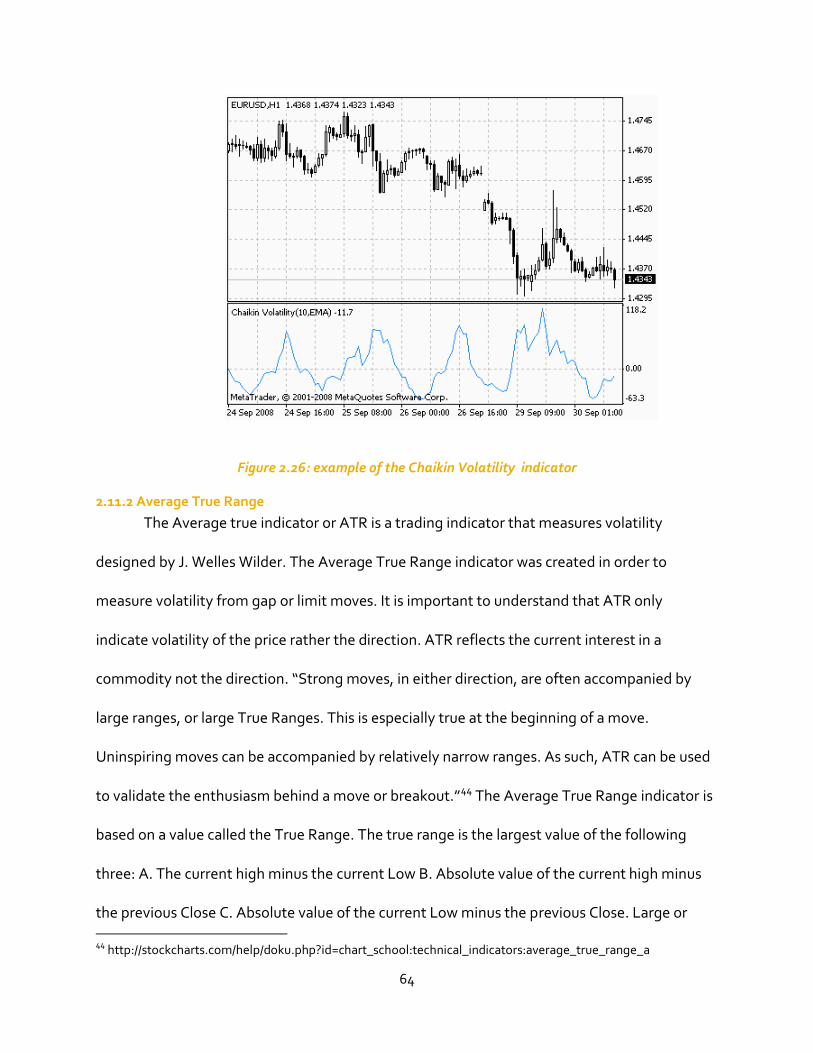
64
Figure 2.26: example of the Chaikin Volatility indicator
2.11.2 Average True Range
The Average true indicator or ATR is a trading indicator that measures volatility
designed by J. Welles Wilder. The Average True Range indicator was created in order to
measure volatility from gap or limit moves. It is important to understand that ATR only
indicate volatility of the price rather the direction. ATR reflects the current interest in a
commodity not the direction. “Strong moves, in either direction, are often accompanied by
large ranges, or large True Ranges. This is especially true at the beginning of a move.
Uninspiring moves can be accompanied by relatively narrow ranges. As such, ATR can be used
to validate the enthusiasm behind a move or breakout.”44 The Average True Range indicator is
based on a value called the True Range. The true range is the largest value of the following
three: A. The current high minus the current Low B. Absolute value of the current high minus
the previous Close C. Absolute value of the current Low minus the previous Close. Large or 44 http://stockcharts.com/help/doku.php?id=chart_school:technical_indicators:average_true_range_a
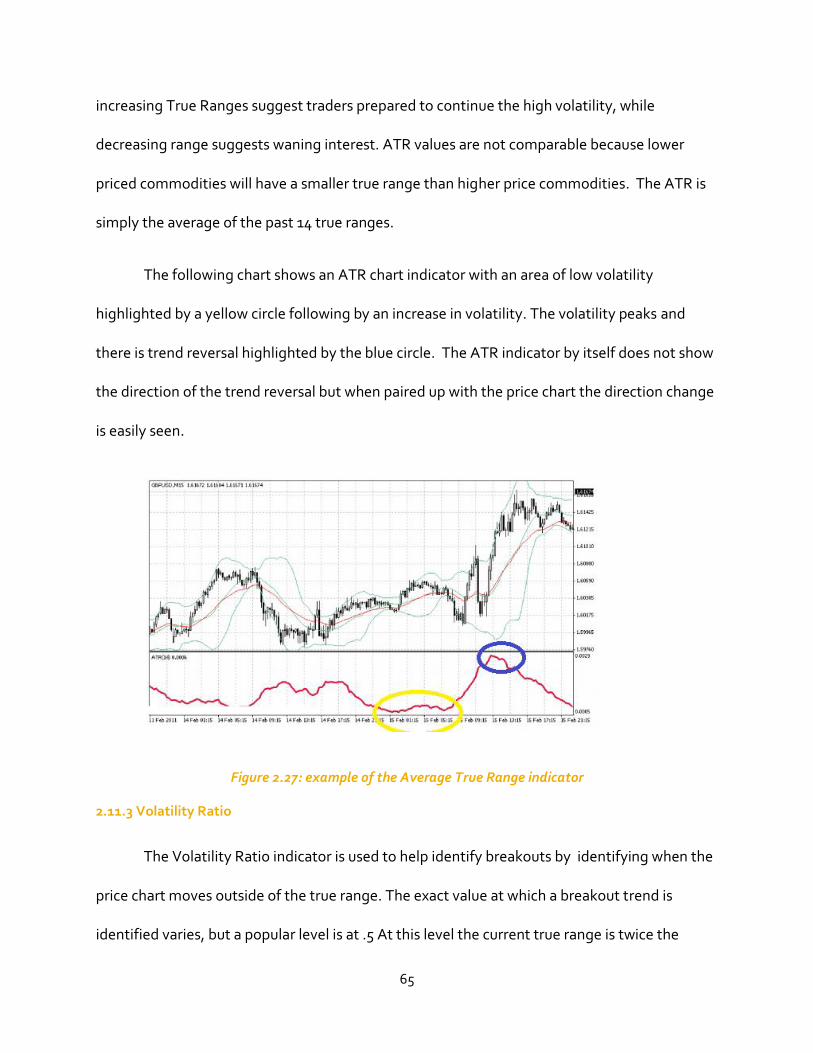
65
increasing True Ranges suggest traders prepared to continue the high volatility, while
decreasing range suggests waning interest. ATR values are not comparable because lower
priced commodities will have a smaller true range than higher price commodities. The ATR is
simply the average of the past 14 true ranges.
The following chart shows an ATR chart indicator with an area of low volatility
highlighted by a yellow circle following by an increase in volatility. The volatility peaks and
there is trend reversal highlighted by the blue circle. The ATR indicator by itself does not show
the direction of the trend reversal but when paired up with the price chart the direction change
is easily seen.
Figure 2.27: example of the Average True Range indicator
2.11.3 Volatility Ratio
The Volatility Ratio indicator is used to help identify breakouts by identifying when the
price chart moves outside of the true range. The exact value at which a breakout trend is
identified varies, but a popular level is at .5 At this level the current true range is twice the
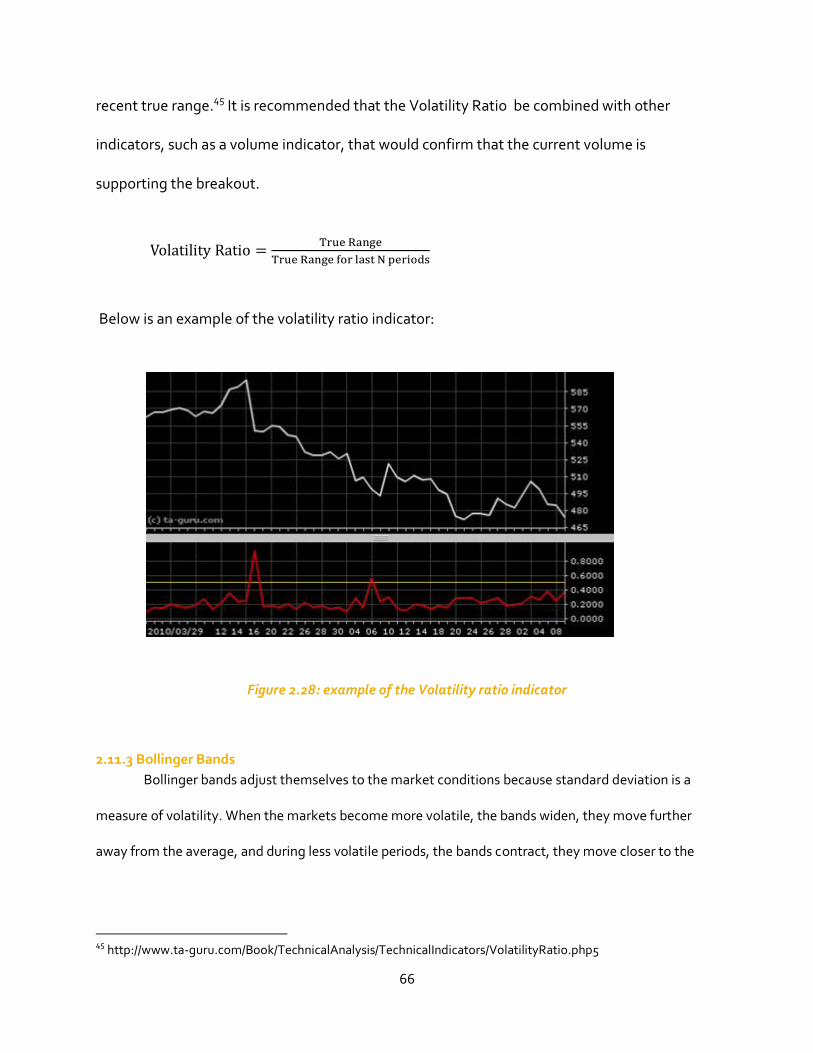
66
recent true range.45 It is recommended that the Volatility Ratio be combined with other
indicators, such as a volume indicator, that would confirm that the current volume is
supporting the breakout.
Below is an example of the volatility ratio indicator:
Figure 2.28: example of the Volatility ratio indicator
2.11.3 Bollinger Bands
Bollinger bands adjust themselves to the market conditions because standard deviation is a
measure of volatility. When the markets become more volatile, the bands widen, they move further
away from the average, and during less volatile periods, the bands contract, they move closer to the
45 http://www.ta-guru.com/Book/TechnicalAnalysis/TechnicalIndicators/VolatilityRatio.php5
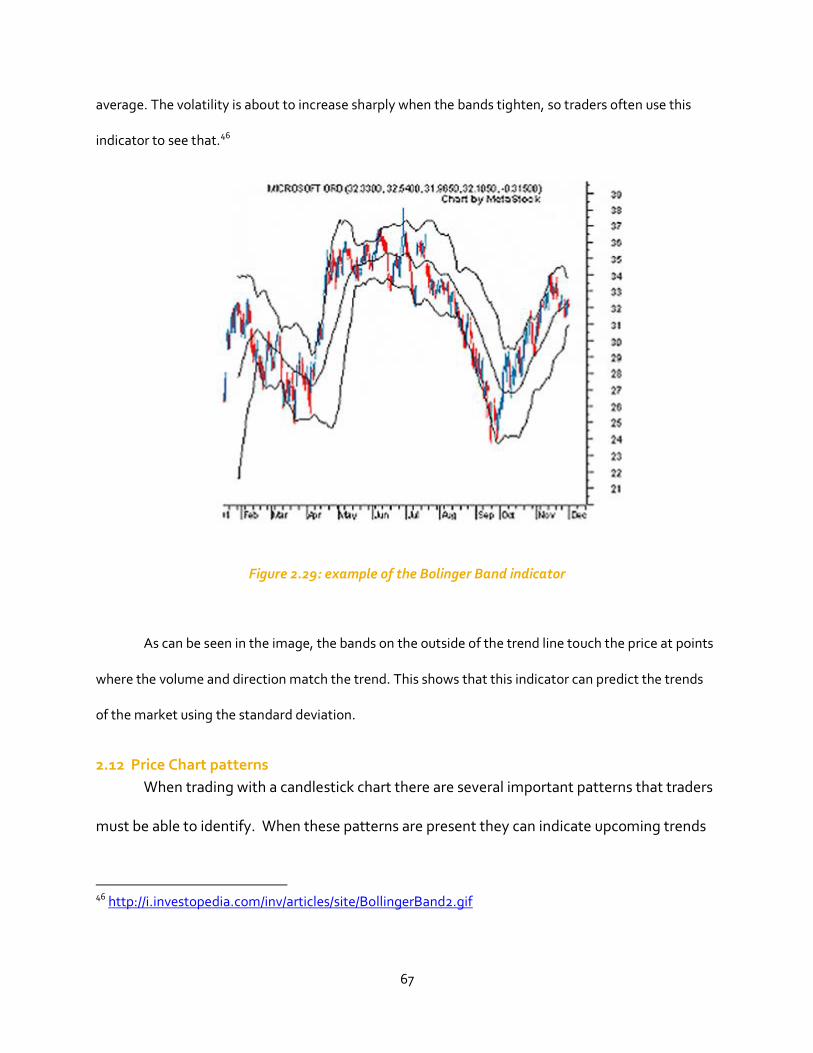
67
average. The volatility is about to increase sharply when the bands tighten, so traders often use this
indicator to see that.46
Figure 2.29: example of the Bolinger Band indicator
As can be seen in the image, the bands on the outside of the trend line touch the price at points
where the volume and direction match the trend. This shows that this indicator can predict the trends
of the market using the standard deviation.
2.12 Price Chart patterns
When trading with a candlestick chart there are several important patterns that traders
must be able to identify. When these patterns are present they can indicate upcoming trends
46 http://i.investopedia.com/inv/articles/site/BollingerBand2.gif
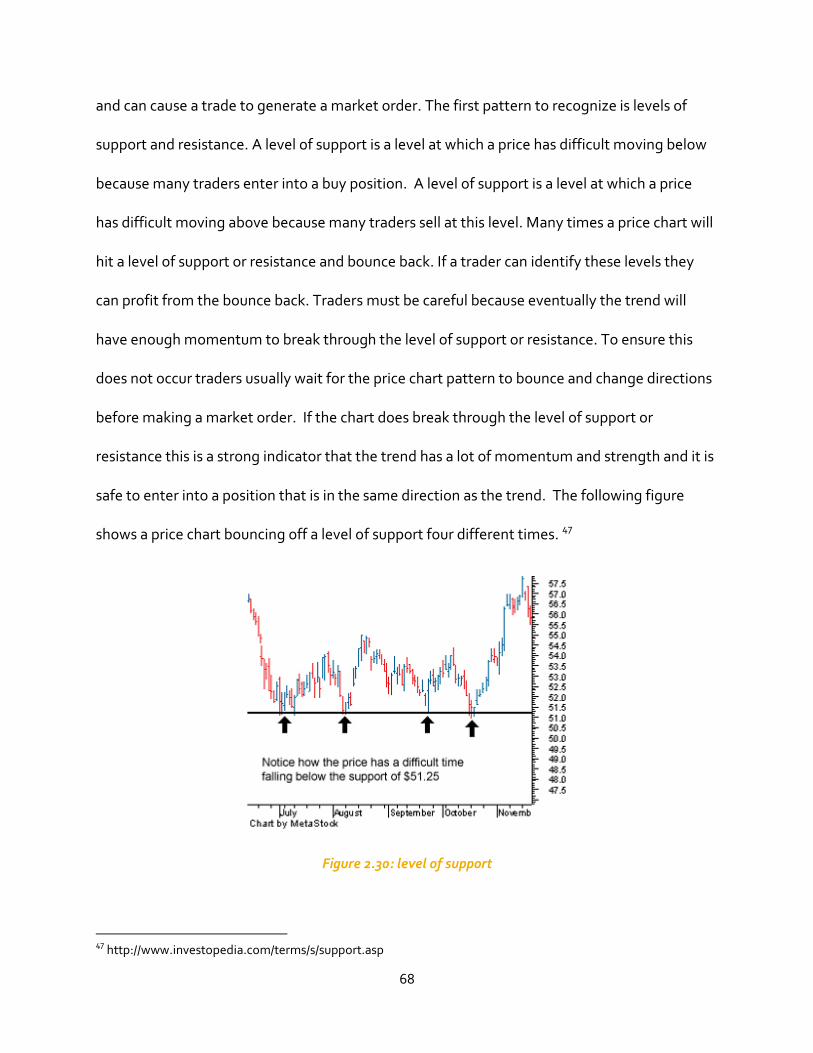
68
and can cause a trade to generate a market order. The first pattern to recognize is levels of
support and resistance. A level of support is a level at which a price has difficult moving below
because many traders enter into a buy position. A level of support is a level at which a price
has difficult moving above because many traders sell at this level. Many times a price chart will
hit a level of support or resistance and bounce back. If a trader can identify these levels they
can profit from the bounce back. Traders must be careful because eventually the trend will
have enough momentum to break through the level of support or resistance. To ensure this
does not occur traders usually wait for the price chart pattern to bounce and change directions
before making a market order. If the chart does break through the level of support or
resistance this is a strong indicator that the trend has a lot of momentum and strength and it is
safe to enter into a position that is in the same direction as the trend. The following figure
shows a price chart bouncing off a level of support four different times. 47
Figure 2.30: level of support
47 http://www.investopedia.com/terms/s/support.asp
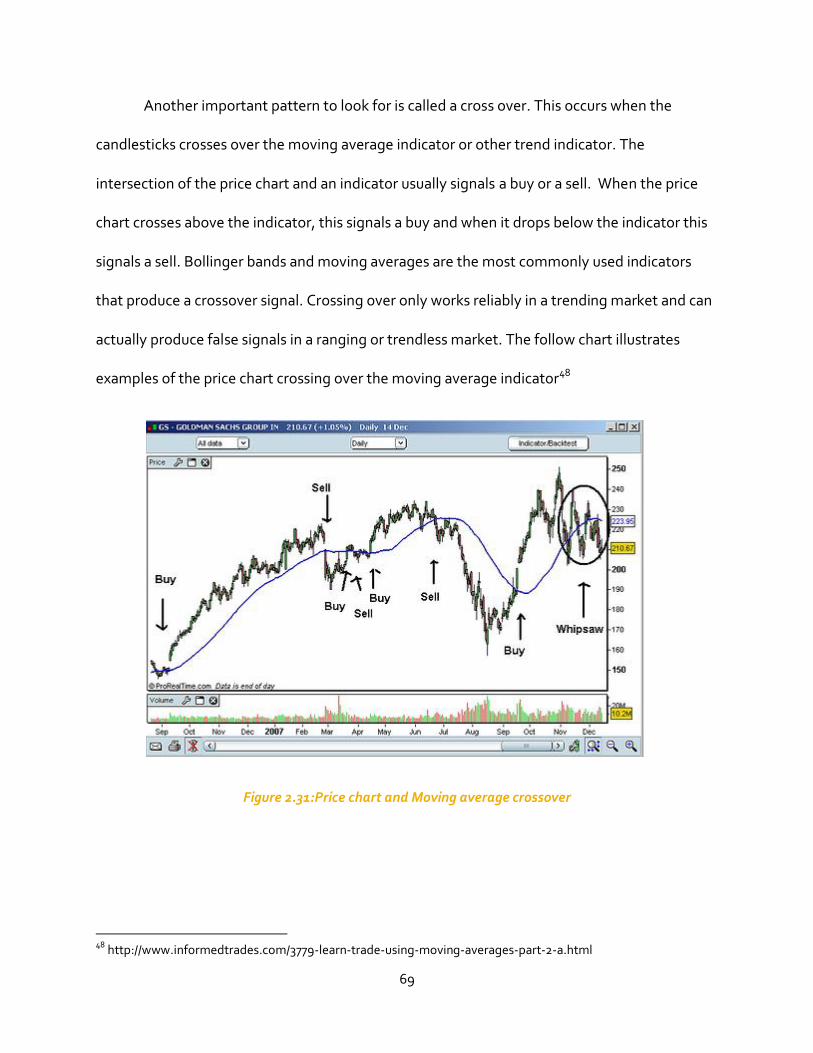
69
Another important pattern to look for is called a cross over. This occurs when the
candlesticks crosses over the moving average indicator or other trend indicator. The
intersection of the price chart and an indicator usually signals a buy or a sell. When the price
chart crosses above the indicator, this signals a buy and when it drops below the indicator this
signals a sell. Bollinger bands and moving averages are the most commonly used indicators
that produce a crossover signal. Crossing over only works reliably in a trending market and can
actually produce false signals in a ranging or trendless market. The follow chart illustrates
examples of the price chart crossing over the moving average indicator48
Figure 2.31:Price chart and Moving average crossover
48 http://www.informedtrades.com/3779-learn-trade-using-moving-averages-part-2-a.html
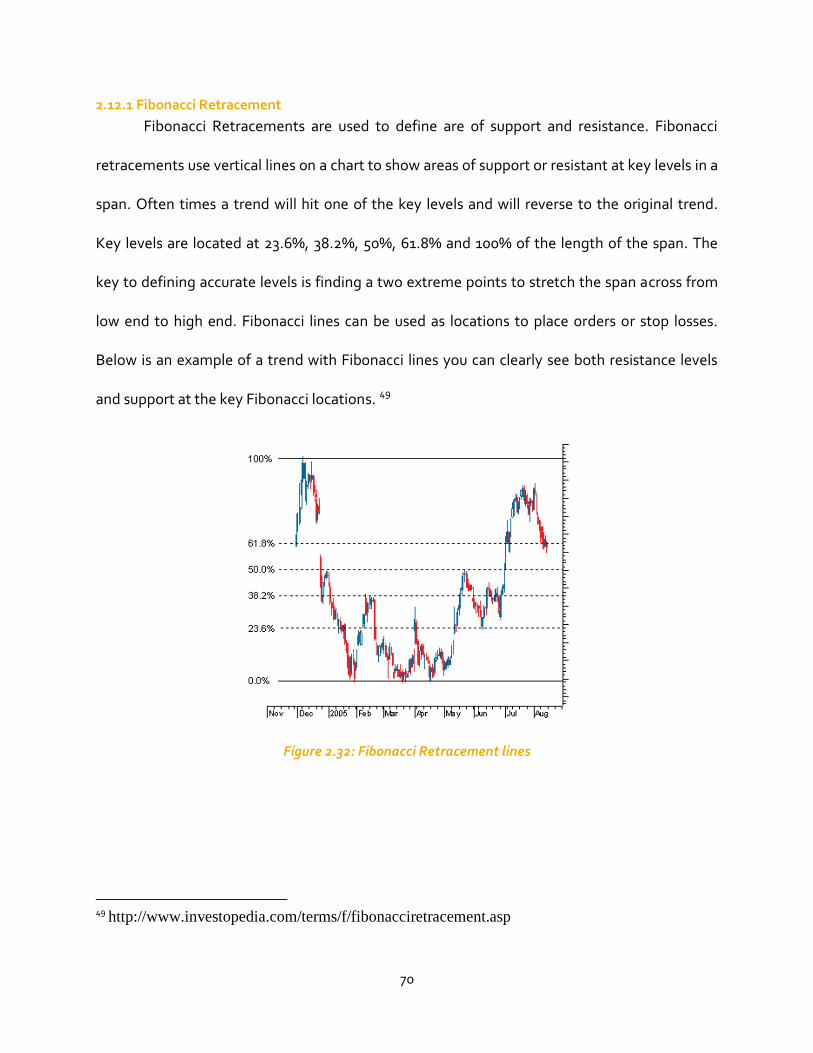
70
2.12.1 Fibonacci Retracement
Fibonacci Retracements are used to define are of support and resistance. Fibonacci
retracements use vertical lines on a chart to show areas of support or resistant at key levels in a
span. Often times a trend will hit one of the key levels and will reverse to the original trend.
Key levels are located at 23.6%, 38.2%, 50%, 61.8% and 100% of the length of the span. The
key to defining accurate levels is finding a two extreme points to stretch the span across from
low end to high end. Fibonacci lines can be used as locations to place orders or stop losses.
Below is an example of a trend with Fibonacci lines you can clearly see both resistance levels
and support at the key Fibonacci locations. 49
Figure 2.32: Fibonacci Retracement lines
49 http://www.investopedia.com/terms/f/fibonacciretracement.asp
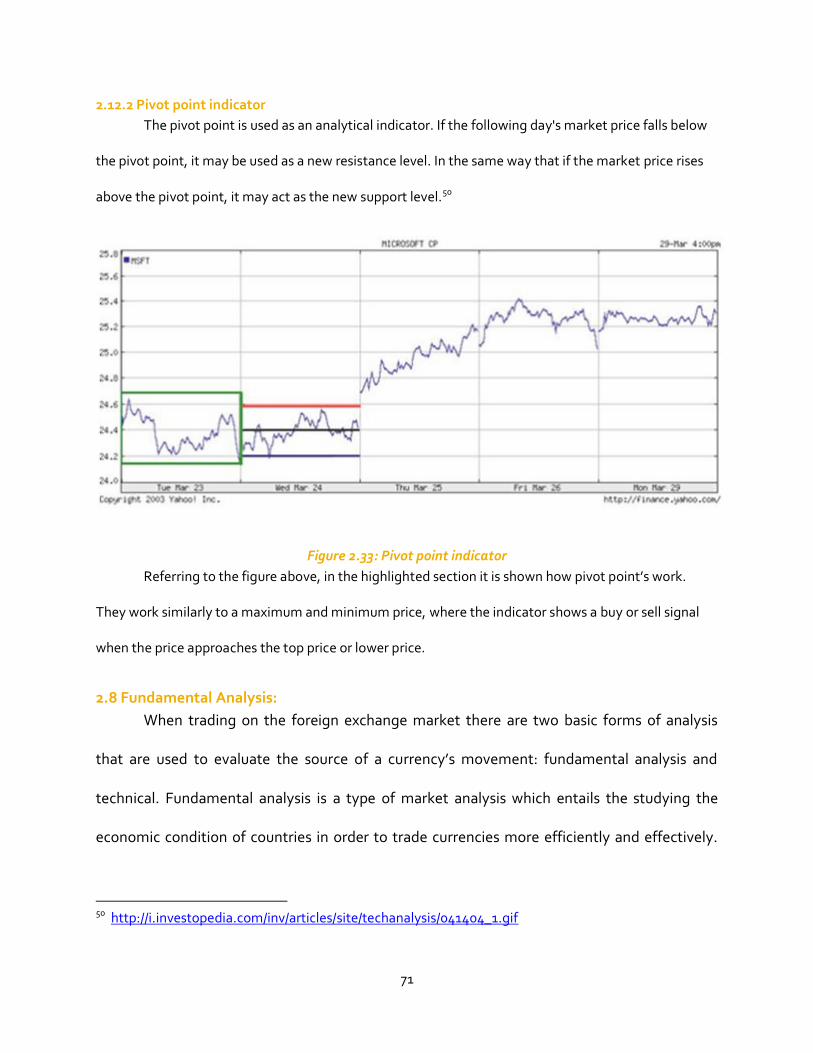
71
2.12.2 Pivot point indicator
The pivot point is used as an analytical indicator. If the following day's market price falls below
the pivot point, it may be used as a new resistance level. In the same way that if the market price rises
above the pivot point, it may act as the new support level.50
Figure 2.33: Pivot point indicator
Referring to the figure above, in the highlighted section it is shown how pivot point’s work.
They work similarly to a maximum and minimum price, where the indicator shows a buy or sell signal
when the price approaches the top price or lower price.
2.8 Fundamental Analysis:
When trading on the foreign exchange market there are two basic forms of analysis
that are used to evaluate the source of a currency’s movement: fundamental analysis and
technical. Fundamental analysis is a type of market analysis which entails the studying the
economic condition of countries in order to trade currencies more efficiently and effectively.
50 http://i.investopedia.com/inv/articles/site/techanalysis/041404_1.gif
72
By obtaining economic information from political speeches, economic reports and economic
legislation, traders can get an idea of a country's overall economic health and performance.
Economic reports are released by a country at scheduled times during the year. These
reports detail the health of a country’s economy and provide traders a clue of whether a
nation's economy has improved or declined since the previously issued report. Some reports
are more important than others and will cause large movements upon their announcement.
The reports can detail economic topics such as unemployment, housing data, consumer
sentiment, or industry strength.
The Gross Domestic Product (GDP) is report that represents the total market value of
all the goods and services produces in country for a given year. It is a broad measure of the
strength of a country’s economy and is a measure of its internal growth. Two preliminary
reports are issued before the final GDP report so if the information in all three reports is closely
correlated, the volatility will be low. However, if one report is significantly different than the
others it can cause significant price movement and a high volume of trades.
Another report that is worth paying attention to is Retail Sales report. This report
records the total receipts of all retail stores in a given country. This measurement is derived
from a diverse sample of retail stores throughout a nation. The report is adjusted for seasonal
variables and is very useful because it is a great indicator of the current consumer spending
sentiment. It can be used to assess the immediate strength of an economy. Once again
revisions to advanced reports of retail sales can cause significant volatility and price
movements.
73
The Industial Production report shows the change in the production of factories, mines
and utilities within a nation. It also reports their capacity utilization, which is a measure of the
degree to which the capacity of which a nation’s factories are being used. An ideal report for a
nation will show an increase of production as well as showing the factories being near
maximum capacity utilization.
The market is not always interested in every single report and some can be looked over.
For example, a few years ago during the real estate boom the market largely ignored most of
the housing reports because the housing market was strong at the time and the reports we
consistently reflecting this information. The market assumed that the data would not change
and ignored the reports. However, after the housing market crashed, reports such as U.S.
Housing Start, Existing Home Sales, and New Home Sales have suddenly became more
important because they can indicate that the economy is rebounding from the weak position
that economy is currently stuck in.
Every economic news release has an estimated figure that is released before the actual
report is released. The estimated figure is derived by surveying a sample of economist and
averaging out their expected figures. Sometimes a large movement in pips can be triggered if
the actual report deviates greatly from the predicted figure because the market is surprised
and will react to the deviation. Typically the larger the deviation the larger the market’s
reaction will be. When the actual figure is released at a high deviation to the predicted figure
we do not have to enter the market as soon as the figure is announced. Rather, if you wait for
74
the market to react you can catch the middle to end of the trend. A trader can lose a lot of
money trying to get the top and bottom of the trend, but focusing on catching the middle of
the trend is much safe and can still result in a respectable profit.
Following a country’s interest rate is extremely important because national banks use a
country’s interest rate to control inflation. If a nation’s currency is inflated the national bank
will increase the interest rate to try and slow down the economy and reel in the inflation.
Interest rates are effective in slowing down an economy because if an interest rate is increased
it makes it more expensive to buy with credit cards, borrow money or get a mortgage on a
home. When this happens the economy will slow and growth will be controlled which in turn
reduces inflation. If inflation is low the interest rate will be lowered, it will then be cheaper to
borrow money and the economy will be stimulated. “Since Inflation is the single most
important factor that affects Interest rates News releases that measure inflation are
particularly important for the Forex market. “51
2.9 Importance of Stop Losses:
With so many factors effecting the movement of a currency pairing, having a stop loss
in place on every trade is extremely important when establishing a position in forex because
just one bad position can result in the loss of a large portion of a person’s funds. It is more
important to manage one’s losses than to manage one’s profits. Having a stop loss is part of
executing a person’s money management system and often gets ignored because people don’t
like to this that they are about to enter into a losing position. Even if a trader makes money on
51 Henry Lui’s News Profiteer’s Definitive Guide to Fundamental News Trading
75
the majority of their positions they can still lose all of their profits on just one bad trade if they
do not have a stop loss in place. A stop loss is a level of acceptable loss for each trade. A stop
loss can protect inexperienced traders from losing money in bad positions and provides a
safeguard from any unexpected losses for more experienced traders. As a general rule most
people do not want to risk any more than 2-3% of their total account per trade. A person must
calculate how much they will gain or lose per pip and then calculate how many pips it will take
to reach their 2% threshold. For example, if a trader has $1000 USD and places and order of
3000 units on EUR/USD, this will give a change of about $.30 per pip. Assuming the trader is
willing to risk 2% of their total account, which is equal to $20, they must now calculate how
many pips it will take to reach a loss of 20 dollars. To do this they divide their allowable loss by
the loss per pip which is equal to 20/.30 or about 70 pips.
Sometimes stop losses can be established based on a location on a chart. If a trader
finds a level of resistance on a chart they can calculate the number of pips (or distance) from
the current market price to the level of resistance. From there if a trader divides their allowable
loss by number of pips from the current market price to the level of resistance they will be
given a total loss per change of pip. For example if a trader notices a level of resistance 50 pips
away from the current market price and they only want to risk $20 they will accept a loss of $.4
per pip. The trader can buy 4000 units and have a stop loss at the location of resistance. Using
this method a trader can place stop losses at high/low swings, locations of the beginning of a
trend or at locations related to Fibonacci retracements. 52
52 Henry Lui’s News Profiteer’s Definitive Guide to Fundamental News Trading
76
2.10 Resources available for the modern trader:
There are many resources available for the modern forex trader. There are hundreds of
websites where you can learn the basics of trading forex, find fundamental and technical
analysis, receive expert analysis or research upcoming news releases. It is important to find
reliable resources that work with your trading plan and help you to gain an advantage over the
rest of the market. News sources like cnn or reuters can be great resource for finding news
articles regarding the economic on goings of a nation.
Some experts, such as Henry Lui, produce weekly news letters that provide certain
signs to look for in the upcoming trading week. These can be very helpful when planning out
your trading strategy for the week but it’s important to remember that no expert is infallible. If
a forex expert had a “no lose” method for trading they would not have the need to generate
income by charging customers for their newsletter. An expert’s advice can be a very helpful
resource, but it should not be taken as fail safe plan. A trading mentor can be very helpful
source of information for a young trader. A mentor can pass on basic trading rules and
principles that should always be followed and can help an inexperienced trader avoid common
mistakes that many traders inevitably make when they first begin. An alarming 90% of forex
traders fail the first time they attempt to trade the market. By arming yourself with the correct
combination of forex resources and the basics of stock trading, the success rate in trading
increases exponentially.
77
3 Methodology
With the various indicators and investment strategies at hand, it was a difficult process to
choose a specific method to follow.
1. The first step was to decide what indicators were going to be used in our time trading.
Many practice accounts were explored to decide which would be the most suitable for
this project. The most used platforms by the group were Meta Trader 4 and Oanda.
2. This project started with each group member having one hundred thousand dollars to
invest and come up with the largest possible profits based on knowledge and
understanding of the market. To be able to do this the investor had to keep up to date
with the current market news, also known as fundamental analysis, and had to trade
using basic rules.
3. To manage a portfolio correctly the investor implemented a stop loss at 2% of his initial
investment. This made sure that the investor did not lose an excessive amount of
money and that emotions did not make up any reason to trade
4. A set number of daily trades were set up, including lot size, and at what specific points
of the day. This discouraged random investments and eliminated opening only one
large position instead of a few smaller positions around the same point. Opening more
positions allowed for the closing of some trades, while keeping others in the case of a
continuation of a trend.
5. Each member concentrated on a different currency and its pairs. This was done to give
a larger variety of possibilities to the project. This was an example of how an investor
78
used multiple options to invest. Always looking at more than one pair of currency is
very important to seek more opportunities.
6. Once each pair had been tested with an indicator, the indicator was switched and
possibly replaced with another one or two, in the case of using a combination of two
indicators.
7. Once each trade was finalized the results were recorded.
For this project, this portfolio management technique was developed and applied to every
trade. Having a maximum loss a day and various methods for how each trade had been
executed was very important, it allowed for a controlled loss and maximum gain from every
trade. It is recommended that each investor has his own investment portfolio.
79
4 Implementation
4.1 Choosing Indicators
In order to complete the goals we set in chapter 1 we decided to begin by studying
trading indicators. When choosing an indicator you must evaluate the type of chart movement
that is occurring at the current point in time. There are several types of indicators such as
trend, oscillation and momentum indicators. It is important to use the right type of indicator in
the right situations. We decided to use indicators a set of 2 or 3 so that we could confirm the
current market trends and not be overwhelmed with information. When picking a set of
indicators to use we decided to pick a set that would complement each other and would
provide different types of information about the market and not just provide duplicate signals.
The following are the indicators that we selected to use to help identify the current trend and
help us make better trades.
When we first started trading we decided to start off using a few simple
indicators to try and gain experience with using indicators. We started off using Bollinger
bands as well as simple moving averages. Bollinger bands are a very powerful indicator
because they provide a lot of market information about trend direction and volatility. Bollinger
bands were an ideal indicator for our purposes because with just one indicator we could get a
lot of information about the current market strength and direction. We also employed simple
moving averages because it is a simple and clear price trend indicator. Below is an example of
a simple moving average indicator, showing a clear down trend over an 8 hour period. The
yellow circle features a location where the candlestick bars extend above the moving average.
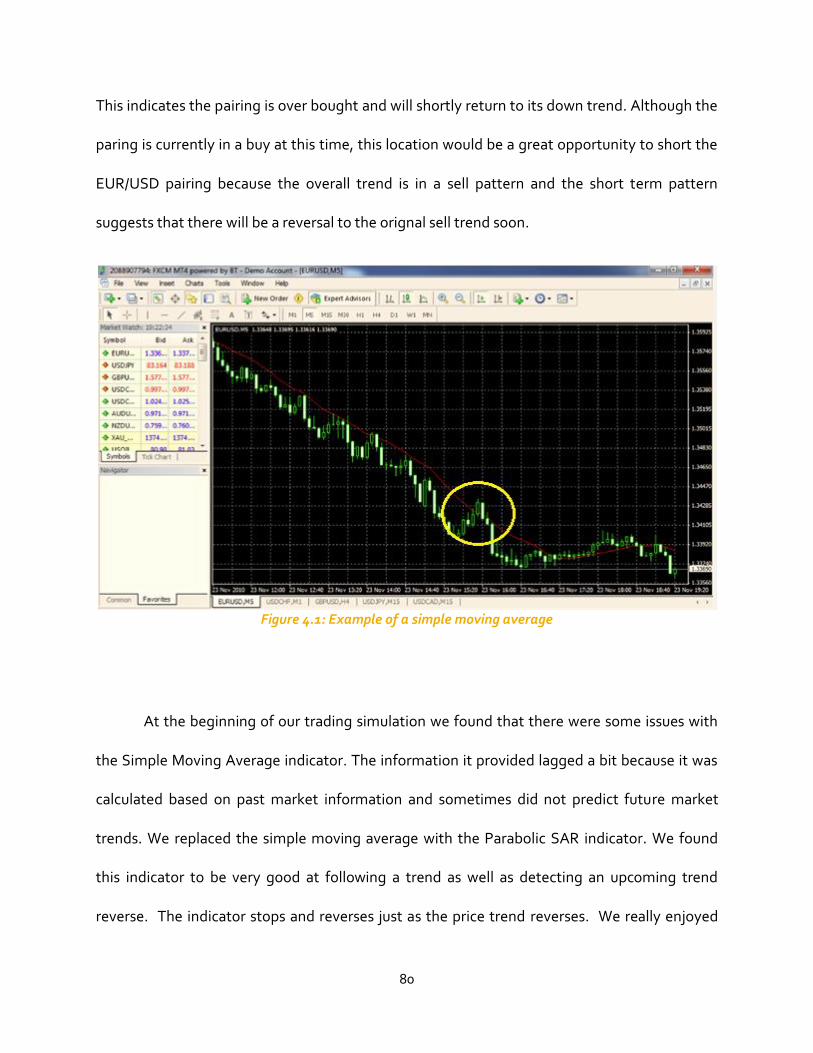
80
This indicates the pairing is over bought and will shortly return to its down trend. Although the
paring is currently in a buy at this time, this location would be a great opportunity to short the
EUR/USD pairing because the overall trend is in a sell pattern and the short term pattern
suggests that there will be a reversal to the orignal sell trend soon.
Figure 4.1: Example of a simple moving average
At the beginning of our trading simulation we found that there were some issues with
the Simple Moving Average indicator. The information it provided lagged a bit because it was
calculated based on past market information and sometimes did not predict future market
trends. We replaced the simple moving average with the Parabolic SAR indicator. We found
this indicator to be very good at following a trend as well as detecting an upcoming trend
reverse. The indicator stops and reverses just as the price trend reverses. We really enjoyed
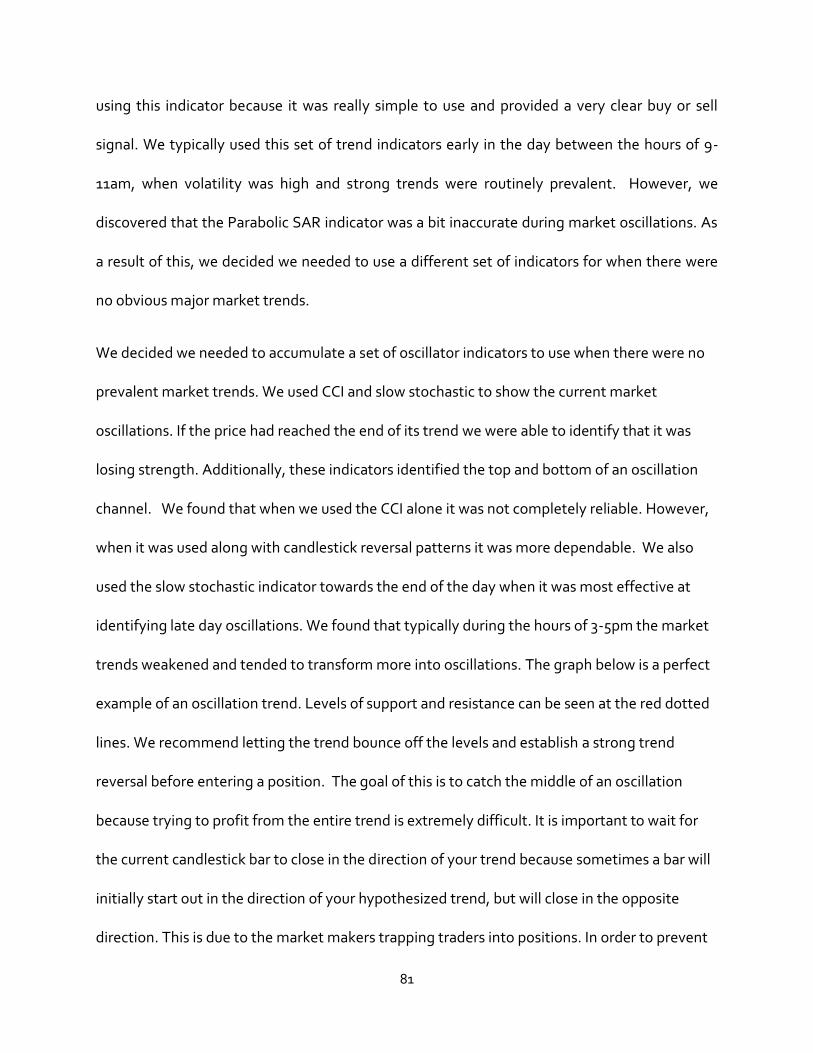
81
using this indicator because it was really simple to use and provided a very clear buy or sell
signal. We typically used this set of trend indicators early in the day between the hours of 9-
11am, when volatility was high and strong trends were routinely prevalent. However, we
discovered that the Parabolic SAR indicator was a bit inaccurate during market oscillations. As
a result of this, we decided we needed to use a different set of indicators for when there were
no obvious major market trends.
We decided we needed to accumulate a set of oscillator indicators to use when there were no
prevalent market trends. We used CCI and slow stochastic to show the current market
oscillations. If the price had reached the end of its trend we were able to identify that it was
losing strength. Additionally, these indicators identified the top and bottom of an oscillation
channel. We found that when we used the CCI alone it was not completely reliable. However,
when it was used along with candlestick reversal patterns it was more dependable. We also
used the slow stochastic indicator towards the end of the day when it was most effective at
identifying late day oscillations. We found that typically during the hours of 3-5pm the market
trends weakened and tended to transform more into oscillations. The graph below is a perfect
example of an oscillation trend. Levels of support and resistance can be seen at the red dotted
lines. We recommend letting the trend bounce off the levels and establish a strong trend
reversal before entering a position. The goal of this is to catch the middle of an oscillation
because trying to profit from the entire trend is extremely difficult. It is important to wait for
the current candlestick bar to close in the direction of your trend because sometimes a bar will
initially start out in the direction of your hypothesized trend, but will close in the opposite
direction. This is due to the market makers trapping traders into positions. In order to prevent
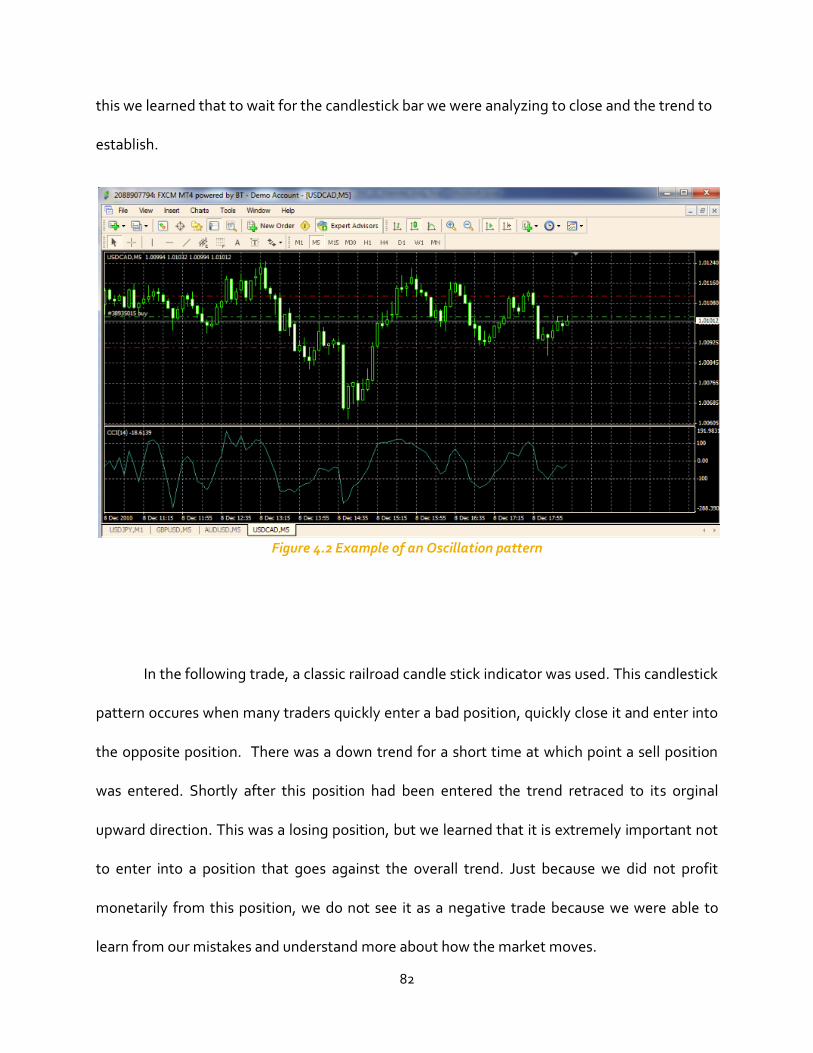
82
this we learned that to wait for the candlestick bar we were analyzing to close and the trend to
establish.
Figure 4.2 Example of an Oscillation pattern
In the following trade, a classic railroad candle stick indicator was used. This candlestick
pattern occures when many traders quickly enter a bad position, quickly close it and enter into
the opposite position. There was a down trend for a short time at which point a sell position
was entered. Shortly after this position had been entered the trend retraced to its orginal
upward direction. This was a losing position, but we learned that it is extremely important not
to enter into a position that goes against the overall trend. Just because we did not profit
monetarily from this position, we do not see it as a negative trade because we were able to
learn from our mistakes and understand more about how the market moves.
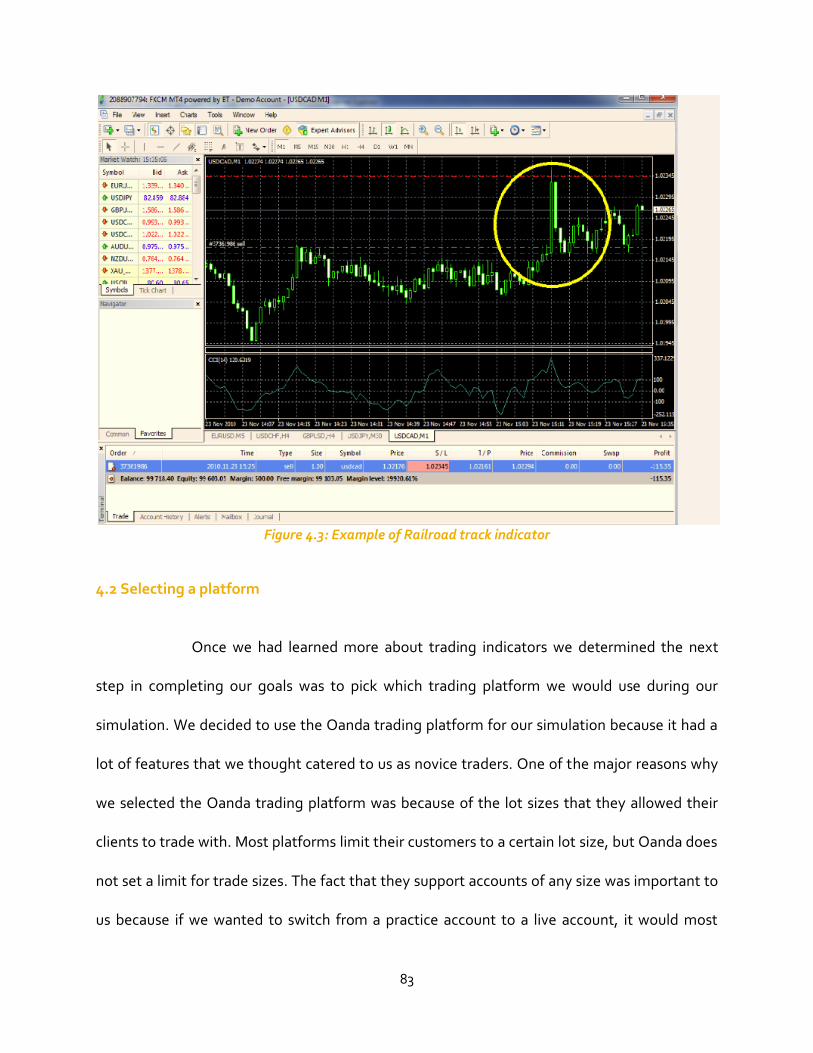
83
Figure 4.3: Example of Railroad track indicator
4.2 Selecting a platform
Once we had learned more about trading indicators we determined the next
step in completing our goals was to pick which trading platform we would use during our
simulation. We decided to use the Oanda trading platform for our simulation because it had a
lot of features that we thought catered to us as novice traders. One of the major reasons why
we selected the Oanda trading platform was because of the lot sizes that they allowed their
clients to trade with. Most platforms limit their customers to a certain lot size, but Oanda does
not set a limit for trade sizes. The fact that they support accounts of any size was important to
us because if we wanted to switch from a practice account to a live account, it would most
84
likely be with a small balance at first. We settled on Oanda’s practice trading platform because
we wanted to be familiar with their services for when we switched to a live account funded
with our own money.
Another benefit of the Oanda platform is the fxNews link which provides up-to-the-
minute financial news and analysis from market news providers such as Reuters, Dow Jones
International, 4CAST, and UBS Analysis. Having instant access to news releases and market
information is vital when trading news releases. Oanda also offers expert analysis that helps to
explain the driving force behind market movements. In the analysis section of the Oanda
platform they offer tables that show currency analysis, volatility and currency strength
comparisons. We also decided to use Oanda because they offered mobile trading applications
offered on smart phones. We liked that we could make trades as well as watch price charts at
anytime during the day. Oanda was one of the few platforms that offered mobile applications.
Another useful feature on the Oanda platform is the forum that they offer. This feature
allowed us to post questions that were answered by other Oanda customers. Customers can
use the forum to solve technical issues or get market advice.
4. 3 Trading Resources
Finally we determined that we needed a set of trading resources that we felt
would provide reliable trading information to us. With a dependable set of resources we could
make informed trades and achieve our goal of maximizing profits. When we started our
trading simulation we collected several resources that we felt were reliable that we could use
for our market research. The resources were grouped by fundamental and technical resources
85
based on the type of information that they offered. Our fundamental resources publish news
releases that gave us a glimpse of the current economic standings of a nation’s economy and
currency. We used cnn.com and reuter.com as our main sources for economic news releases
and announcements. We also used Forexfactory.com as our forex calendar resource. We used
this website to find out what economic announcements were being published each week as
well as to identify certain times during the week that we should avoid opening new positions
during.
During our simulation we found that technical analysis was more effective for the short
term types of trades that we were executing. A popular trading website we used for technical
analysis was Forexpros.com. It offered a comprehensive summary of technical signals for all of
the major currency pairings for time periods of 5 minutes, 10 minutes, hourly and daily. If the
signals matched across all four time periods it was a clear sign that a strong chart pattern was
present over several time periods. We found that this can be a good method for selecting
which currency pairings to trade, it is still necessary to pick out the appropriate locations on the
chart to enter a position. We found a combination of mostly technical analysis and some
background fundamental research was the most effective method for researching the currency
movement of a currency pairing. One of the techniques we implemented was lining up a
currency’s pairings to see if there was a relation between that currency and the driving force
behind. For example, if we all of USD’s pairing and noticed a distinct technical trend across all
of its pairings we could predict that the USD was the driving force. Once we detected a distinct
correlation throughout the pairings we then went to fundament research to find the root force
of the movement. Typically we found that the driving currency movement was the result of an
86
economy report or bank announcement that was recently released that educed a significant
strength adjustment of that nation’s currency. Since the majority of our trades were only active
for a few hours, we mostly used technical analysis and charts patterns to decide when to enter
a position and used fundament research to learn why a chart was moving in the manner that it
was.
One valuable resource what we began to use during the later part of our simulation was
weekly reports issued by trading experts. At the beginning of every week fundamental reports
are issued that detail the certain signs to look for during the upcoming week of trading. The
reports list all of the upcoming economic announcements that are scheduled for the week and
give their expected figure. The newsletters advise their readers how to trade based on how the
actual reported compares to the estimated figure. We found these newsletters to be useful
because it helped us key into which announcements are more important and should receive
more of our attention. We were careful not to fully buy into the advice of the newsletters
because no expert is perfect in their predictions and their advice is never fool proof. In
conclusion we found that a mix of mostly technical and some fundamental research was the
most effective method for our short term trading.
87
5 Results and conclusion
When starting to trade it is important to research every aspect of what was bought or
sold. Knowing the market that is to be invested in is impertaive in order to succed. There are
many tools available to help make these descisions.
When trading on Forex is it important to remember that it is a very quick and changing
market, where it is possible to loose a large amount of money in a small period of time.
Although it has high risk, a smart investor will be able to overcome by using an inestement
plan, indicators and the corredt platform for the situation.
After experimentation and research, there was one reoccuring thought and trend that
was evident in order to be successful. This notion was that the trader should use multiple
trading tools at a time to get the best outcome. Apart from using multiple trading tools, the
trader should be confortable with all of them and be able to trade with all, or most of them.
One of the most important tools that was used in the project was the management
portfolio plan. It is very important to have one in place such that it prevents majors losses and
has a higher success rate when used properly. Every trader should have his own management
plan, but it is encouraged to follow the advice of experts and teachers when first beginning to
trade.
88
Another very important aspect of trading is being aware of what is happening in the
global market at the time. Being aware of international news can give a very strong push in the
right direction when it come to trading. When knowing what governments aroung the world
are thinking, it is possible to predict to a certain exctent how the currency of that country will
be moving in the near future.
It was also seen that using various indicators was helpful, however it is important to
never rely on a single indicator for every trade. Every indicator had a time where it worked
better than others, and on the other hand it had some times where it did not accuaretly
represent the market. Some indicators, such as the slow stochastic, work better during
oscillating trends, but do not accurately predict trends when there are large movements.
Finally, from this project we were able to find that there is never a single right way to
trade. The market fluctuates everyday, and although some trends can be followed and
recorded, these should not be taken for granted. Forex would not exist if people were able to
destinctly recognize patterns in the market and trade based on these patterns. If it was easy to
trade, everyone would be a millionare.
89
6 Citations
1. http://thismatter.com/money/forex/foreign_exchange_history.htm
2. http://www.time.com/time/business/article/0,8599,1852254,00.html#ixzz1DwrcSuur
3. http://www.investopedia.com/university/stocks/stocks4.asp
4. Putnam and Zimmer, The Blackwell Guide to Wall Street( New York: Basil Blackwell Inc.
1987),Pg. 41
5. http://www.disnat.com/en/knowledge/stocks/stocks6.asp
6. http://www.investopedia.com/articles/forex/05/051905.asp
7. http://www.investopedia.com/terms/c/commoditychannelindex.asp
8. http://www.forexindicator.org/my-favourite-forex-reversal-indicators.html 9. http://www.fxwords.com/w/williams-r.html 10. http://www.investopedia.com/articles/technical/052201.asp
11. http://www.forex-tsd.com/setup-questions/6350-momentum-indicator.html
12. http://www.incademy.com/courses/Technical-analysis-II/The-momentum-
oscillator/17/1032/10002
13. http://www.investopedia.com/terms/f/fibonacciretracement.asp
14. Henry Lui’s News Profiteer’s Definitive Guide to Fundamental News Trading
15. Henry Lui’s News Profiteer’s Definitive Guide to Fundamental News Trading
90
7 Appendices
Appendix A: Indicator Research (Example of Technical Analysis)
This week I investigated certain indicators that hint that there would be a reversal in the
current trend. Recognizing when a trend is going to reverse is important because it can alert
you when to enter a trade or when to close your current position. Several important indicators
to look for are the CCI Indicator, MACD, the spinning top, and railroad tracks. If several of these
indicators are showing at the same time, the probability for a change in trend is increased.
Although there is no perfect indicator, these three indicators are an accurate way to catch a
trend reversal before it happens.
The first indicator to use to try and spot a trend reversal is the CCI indicator.” An
oscillator used in technical analysis to help determine when an investment vehicle has been
overbought and oversold.”53 It is calculated by subtracting the forex price minues the Moving
Average, which is then divided by the standard deviation. The CCI is used to identify cyclical
trends. When the indicator hits a certain mark like 200 investors usually wait for the indicator
to retreat back to 100 before entering a reversal trend. The CCI gives realistic evidence to
approximate changes in the direction of price movement.
The MACD is an important indicator to help identify who is driving the price movement,
either the buyers or the sellers. “When you are in an upward movement and you see the MACD
histogram shortening, it is a sign that the buyers are losing strength and a possible reversal is
53 http://www.investopedia.com/terms/c/commoditychannelindex.asp
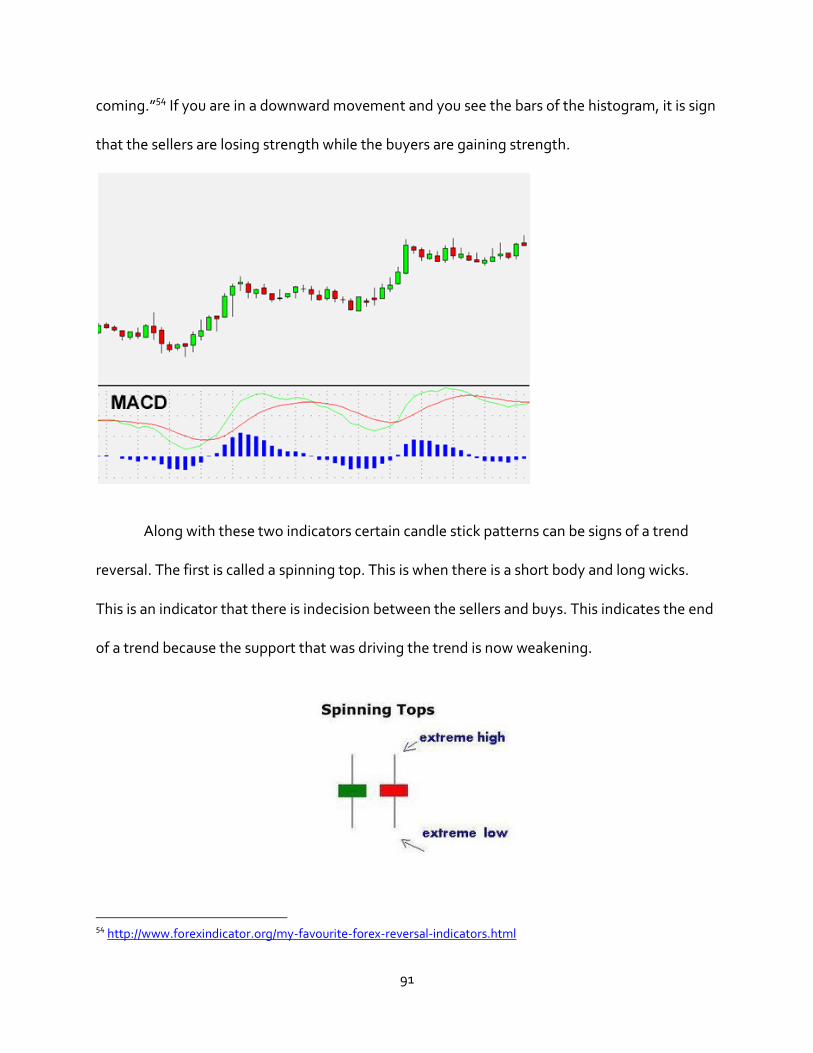
91
coming.”54 If you are in a downward movement and you see the bars of the histogram, it is sign
that the sellers are losing strength while the buyers are gaining strength.
Along with these two indicators certain candle stick patterns can be signs of a trend
reversal. The first is called a spinning top. This is when there is a short body and long wicks.
This is an indicator that there is indecision between the sellers and buys. This indicates the end
of a trend because the support that was driving the trend is now weakening.
54 http://www.forexindicator.org/my-favourite-forex-reversal-indicators.html
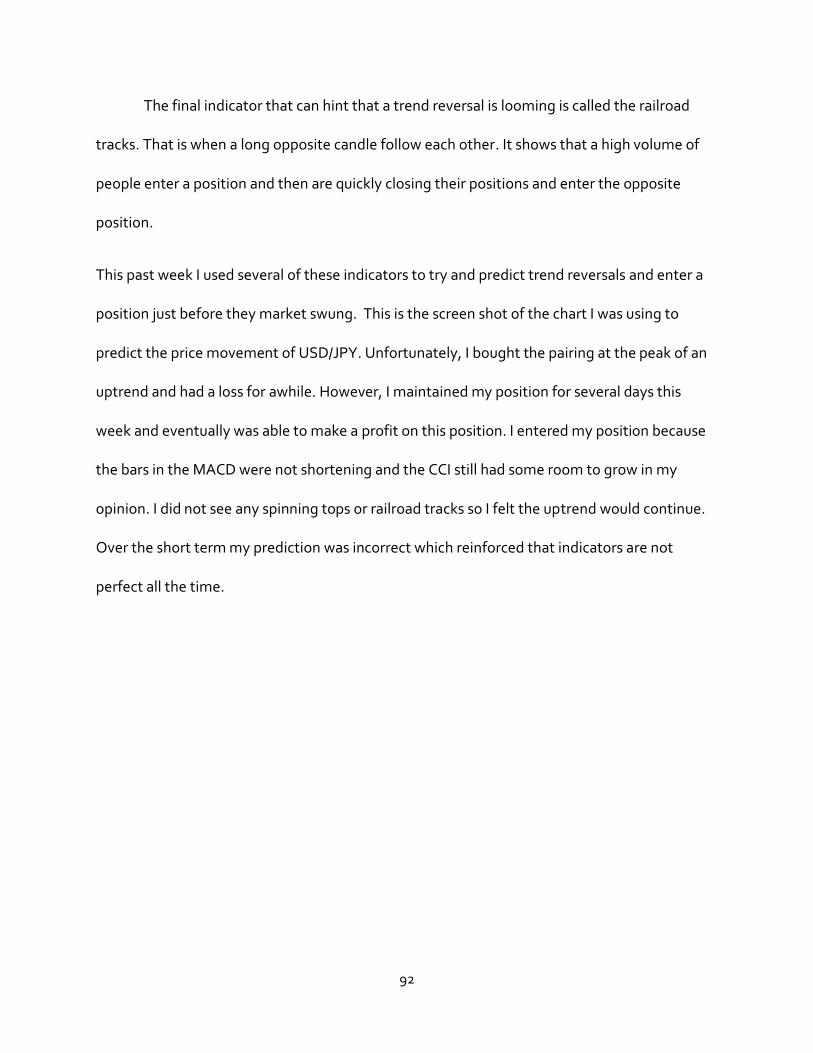
92
The final indicator that can hint that a trend reversal is looming is called the railroad
tracks. That is when a long opposite candle follow each other. It shows that a high volume of
people enter a position and then are quickly closing their positions and enter the opposite
position.
This past week I used several of these indicators to try and predict trend reversals and enter a
position just before they market swung. This is the screen shot of the chart I was using to
predict the price movement of USD/JPY. Unfortunately, I bought the pairing at the peak of an
uptrend and had a loss for awhile. However, I maintained my position for several days this
week and eventually was able to make a profit on this position. I entered my position because
the bars in the MACD were not shortening and the CCI still had some room to grow in my
opinion. I did not see any spinning tops or railroad tracks so I felt the uptrend would continue.
Over the short term my prediction was incorrect which reinforced that indicators are not
perfect all the time.
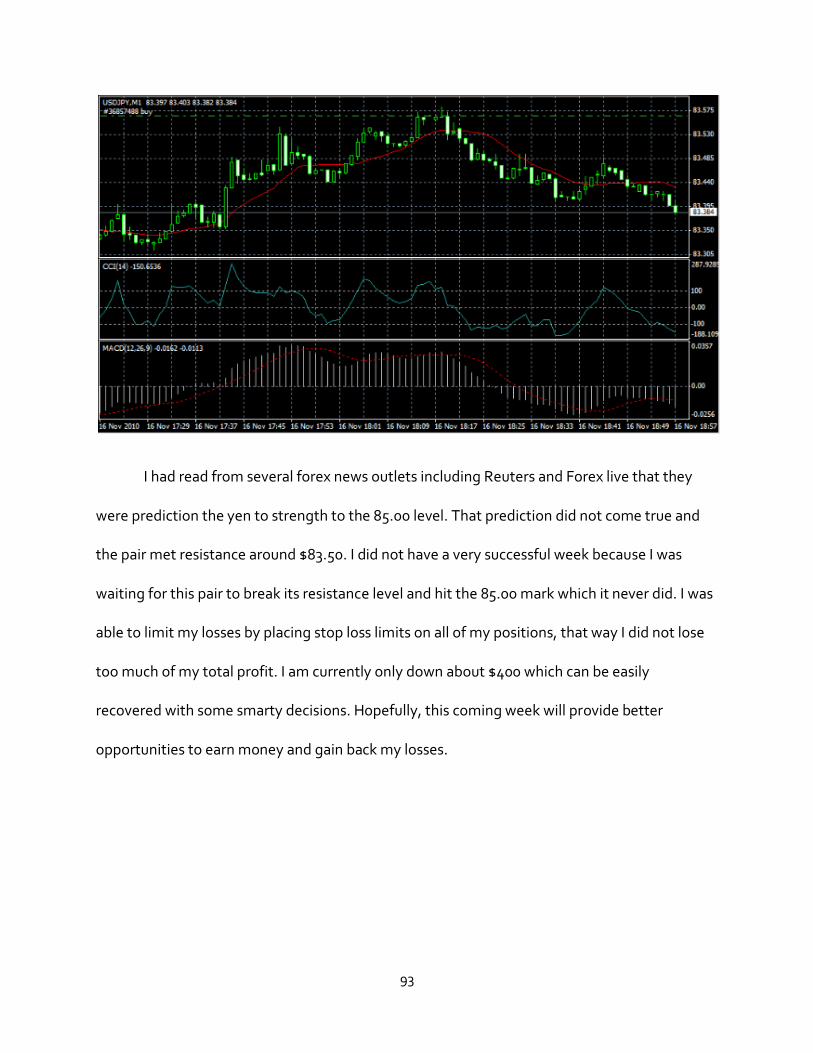
93
I had read from several forex news outlets including Reuters and Forex live that they
were prediction the yen to strength to the 85.00 level. That prediction did not come true and
the pair met resistance around $83.50. I did not have a very successful week because I was
waiting for this pair to break its resistance level and hit the 85.00 mark which it never did. I was
able to limit my losses by placing stop loss limits on all of my positions, that way I did not lose
too much of my total profit. I am currently only down about $400 which can be easily
recovered with some smarty decisions. Hopefully, this coming week will provide better
opportunities to earn money and gain back my losses.
94
Appendix B: EURO UPDATES (Examples of Fundamental Research)
November 16, 2010
The euro dramatically fell to a seven week low against the USD on Tuesday after an
amounting fear that the European debts will increase. On the other side of the Atlantic, the
USD rose to a seven week high against a large amount of currencies as low stock and
commodities prices drove the USD sharply upwards. The euro fell below $1.35 and will, in the
eyes of many, stay weak in the near term as debts increase in Europe and insecurity over the
resolution of these problems increase. Euro officials are thinking about a bailout package of 80
billion to 100 billion Euros for Ireland. Ireland has come under fire over the increasing debt, as
Euro officials warn that the entire European Union is in danger. News that Greece will mostly
probably miss its fiscal targets this year is not helping the Euros cause at all. There seems to be
an increasing fear of risk in the Euro market as these debts continue to stack up. The euro hit
$1.349, the weakest it has been since it hit that on September 28th. The agreement of this
bailout plan would help the Euro tremendously, as it would reassure many of the handling of
the debt.
November 17, 2010
The euro was at a seven week low on Tuesday carrying over into Wednesday, crippled
by the Irish debt and the lack of solution to it. A plan to bail out Ireland was laid down by
95
various European banks, but Ireland has yet to decide on its position in this plan. This didn’t
really help the Euro as the cost of helping out Ireland and lingering debt struggles around
Europe remain in the minds of investors. These debt problems could possibly spread to
Portugal and possibly other weak countries, further scaring off investors. Irish talks with the
IMF are to take place on Thursday. The euro rose slightly to $1.350, coming off of a seven-week
low of $1.344 on Tuesday.
November 18, 2010
The euro continues to hold on to the hopes that Ireland is near a deal to bailout the
depleted banks and cut the budget deficit. The euro did stop short of breaking above major
resistance. The euro rose from these hopes, but also got a small boost after the Federal
Reserve defended against the heavy criticism of the bond buying program. The bank argued
that it showed no signs of backing away from the program. Experts have warned that the euro
was not saved just yet. The Irish debt continues to mount up, and it is threatening to spill over
to other struggling European countries such as Portugal. The euro is bouncing back nicely from
a seven week low on Tuesday, and it looks as if it will rise even more with the bailout plan in the
works. The worst for the Euro seems to be over. The Euro needs to get above resistance at
$1.3750 in order to really show some great improvement.
November 19, 2010
The Euro kept rising on Friday, gaining steadily for a third straight day against the USD.
Investors are growing more and more confident in the diffusing of Ireland’s lingering debt
96
crisis. These gains in the Euro may be temporary as investors are growing afraid that Ireland's
debt problems can spread to other countries in the European Union. The persistent hopes that
Ireland was nearing an agreement for a bailout package in the range of 80- 90 billions of Euros
from the European Union and the International Monetary Fund had helped the Euro go slightly
above $1.37. Traders and investors have stated that this level is very likely to stay at $1.37 until
the bailout package is negotiated in full. The deal to help Ireland out with its depleted banks is
planned to be released early next week. There will also be a fiscal plan to save billions of euros
will also be released at the same time.
November 21, 2010
After an Irish plea for an international bailout this Monday in order to alleviate its
banking and budget woes, the euro rose sharply. This is a great help and it counters a major
decrease that had devalued the currency in the last month. The euro went up in value to as
high as around $1.374 going up from $1.36 at the NYSE last Friday. The next goal for the euro
to rise above can be seen at $1.3750 and above that, the euro faces $1.3860. This level is a 50
percent retracement from the fall. According to Richard Grace, chief currency strategist at the
Commonwealth Bank in Sydney, “We could see it back up to $1.3860 over the next 24-48
hours." Many traders are patiently observing the market and waiting to see how European
markets would react to the Irish bailout, before deciding on whether to push the euro even
higher. In some people’s view, the Euro rally will continue steadily as this news sinks in around
the troubled European markets. The negotiations about the size of Ireland’s bailout package
by the European Union and the International Monetary Fund have not taken place and are very
97
likely to be smaller than Greece’s. Greece’s bailout package was given last May, and was in the
ballpark of 110 billion Euros.
November 23, 2010
The euro dipped again, and fell under pressure in Asia as Irish political uncertainty and
worries about other European debts killed potential optimism over the Irish bailout plan. Many
investors are not convinced that the Irish bailout is going to prevent other struggling
economies to ask for a bailout plan of their own. The Portuguese crisis is getting bigger and
bigger, resulting in a debate on whether it needs a bailout as well. Because of this uncertainty,
the Euro fell to $1.3551, a slight rise from yesterday.
November 24, 2010
The euro dipped near a two month low as debts from Ireland were thought to spill onto
other struggling economies, namely Portugal and Spain. Portugal and now Spain are seen as
about to be in real danger, while Ireland's bailout plan has been criticized for assuming great
economic growth. Trade was very low on Wednesday, due to Thanksgiving on Thursday. The
Euro fell to $1.3312. It hit a two month low of $1.3284 earlier in the day. Against the Yen, the
euro fell to ¥111.15 after having fallen to ¥110.32 on Wednesday. Many investors view no point
in buying Euro for the day.
98
November 25, 2010
The euro stayed extremely weak on Thanksgiving, staying very close to around a two
month low against the USD. The European debt crisis is a predominant problem in the global
market, and it showed little, if any, signs of lessening. Investors remained very worried about
the spread of this debt to bigger European economies. Portugal and Spain appear to be the
next in line for worry, as the Irish problems seem to show a sign of resolve. Forex was very light
in volume, due to the American holiday of Thanksgiving. “The Euro remains a sell into rallies
and not a buy on dips," said Paul Mackel, a director of currency strategy at HSBC. The
Euro went up to $1.334 after hitting a low at $1.3287. The Euro is expected to fall towards
$1.308. The European Commission stated on Thursday that there were no discussions of more
bailout plans for struggling economies.
November 26, 2010
The Euro fell to a two month low against the USD on Friday as investors fear that
Portugal needs a bailout plan similar to the Irish plan. Many investors are shying away from the
Euro even though an Irish plan has been set in motion, as Spain and Portugal are struggling
heavily with debts of their own. Portuguese and Spanish officials are denying that they are
reaching out for help and a bailout plan of their own. Increased pressure on the euro has
surfaced after big countries such as Spain and Italy are beginning to show signs of a debt crisis.
The euro will remain under pressure for a while as there are no short term recovery plans for
the moment. The euro fell to $1.3217, having dropped to a low of $1.32.
99
November 28, 2010
The Euro dropped to a two month low against the USD on Monday as the world market
looked past the Irish bailout plan and looked at other crumbling European economies.
Financial officials in Europe endorsed an €85 billion bailout package to help Ireland cover bad
bank debts. This plan will cut a huge budget deficit and also includes an outline of a permanent
crisis resolution system which makes bond holders share the burden of restructuring debt after
2013. The Euro rose sharply in the Asian trade, right after the bailout package was endorsed. A
good trading source (Reuters) said that the move appeared to come from buying from one
party and then it quickly fizzled out. A big fear for investors is the lack of a game plan from the
European Union to keep the Irish debts from spilling over to other European countries like
Portugal, and a fear that the bailout plan will not work after the problem was not resolved in
Greece after its bail out earlier this year. The focus of the European market is moving onto
Spain and Portugal.
November 30th, 2010
The Euro fell heavily, falling down to a 2 and a half month low. The Irish bailout plan failed to
dispel fears about European debt, as the Euro fell to $1.2969, the lowest since mid-September.
There seems to be huge Spanish and Portuguese debt piling up, as well as German debt. The
European credit market is basically in a panic. The European Central Bank needs to assume
some kind of action against this. The Central Bank meeting this Thursday is a chance to relieve
investor’s fears by producing a concrete plan to deal with the debts.
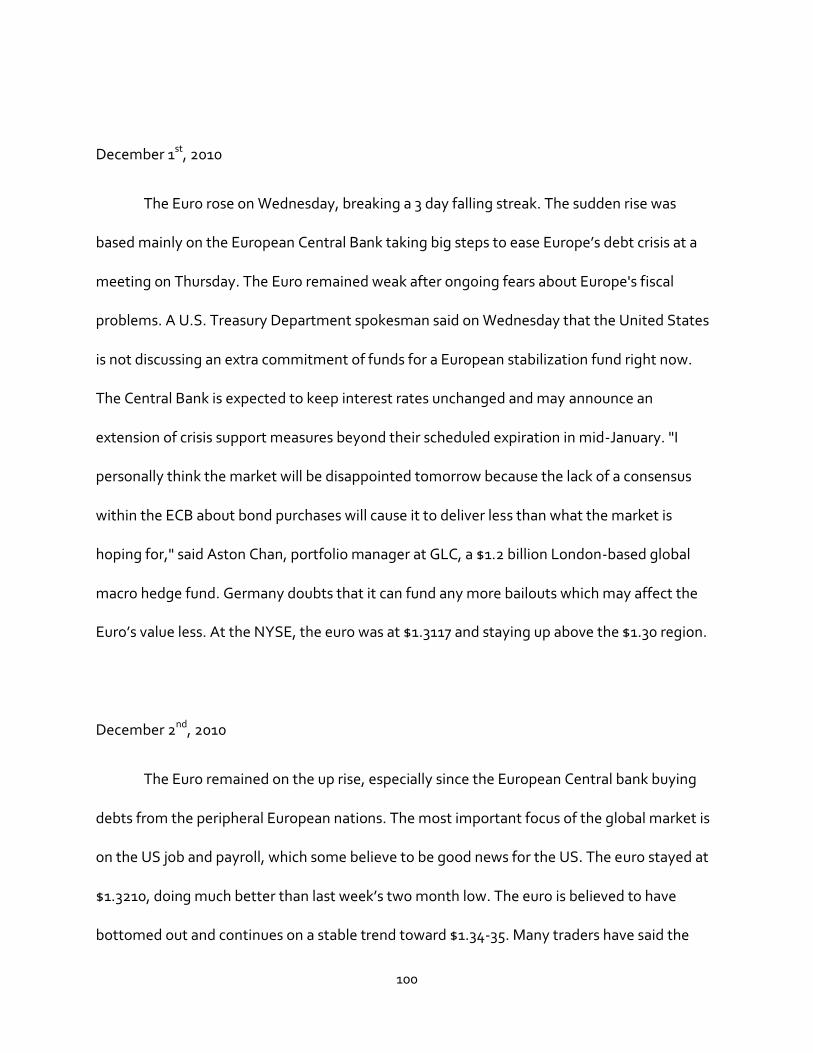
100
December 1st, 2010
The Euro rose on Wednesday, breaking a 3 day falling streak. The sudden rise was
based mainly on the European Central Bank taking big steps to ease Europe’s debt crisis at a
meeting on Thursday. The Euro remained weak after ongoing fears about Europe's fiscal
problems. A U.S. Treasury Department spokesman said on Wednesday that the United States
is not discussing an extra commitment of funds for a European stabilization fund right now.
The Central Bank is expected to keep interest rates unchanged and may announce an
extension of crisis support measures beyond their scheduled expiration in mid-January. "I
personally think the market will be disappointed tomorrow because the lack of a consensus
within the ECB about bond purchases will cause it to deliver less than what the market is
hoping for," said Aston Chan, portfolio manager at GLC, a $1.2 billion London-based global
macro hedge fund. Germany doubts that it can fund any more bailouts which may affect the
Euro’s value less. At the NYSE, the euro was at $1.3117 and staying up above the $1.30 region.
December 2nd, 2010
The Euro remained on the up rise, especially since the European Central bank buying
debts from the peripheral European nations. The most important focus of the global market is
on the US job and payroll, which some believe to be good news for the US. The euro stayed at
$1.3210, doing much better than last week’s two month low. The euro is believed to have
bottomed out and continues on a stable trend toward $1.34-35. Many traders have said the
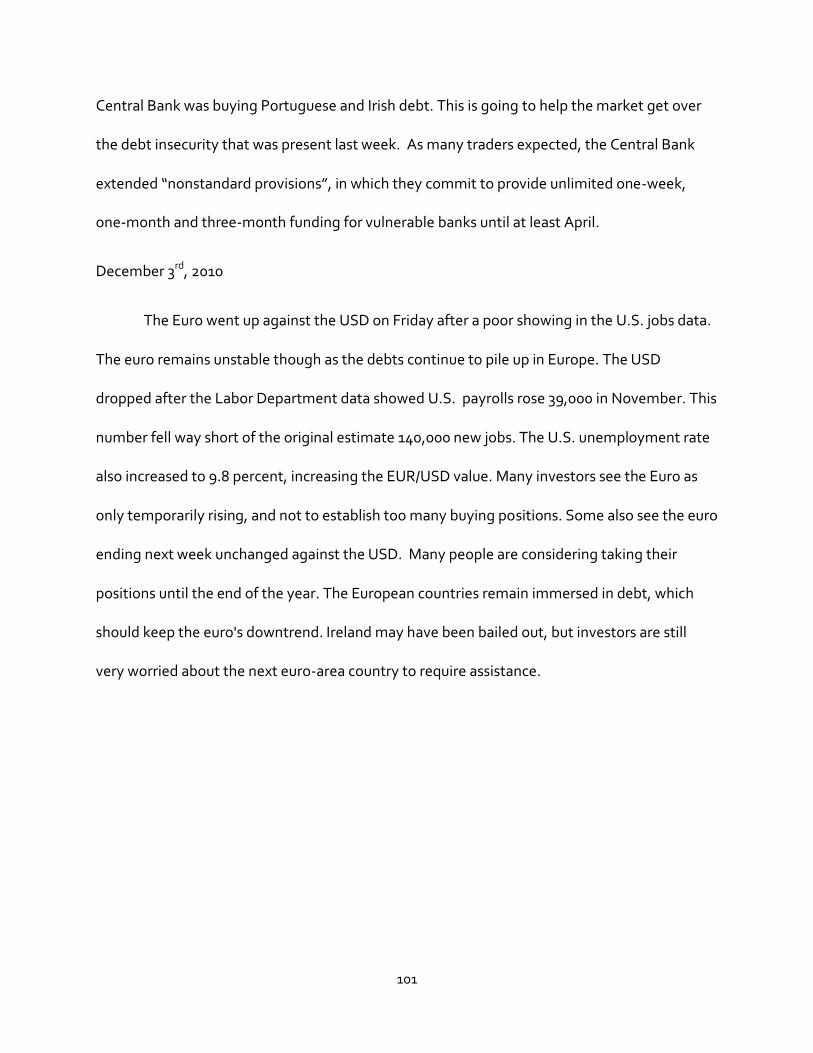
101
Central Bank was buying Portuguese and Irish debt. This is going to help the market get over
the debt insecurity that was present last week. As many traders expected, the Central Bank
extended “nonstandard provisions”, in which they commit to provide unlimited one-week,
one-month and three-month funding for vulnerable banks until at least April.
December 3rd, 2010
The Euro went up against the USD on Friday after a poor showing in the U.S. jobs data.
The euro remains unstable though as the debts continue to pile up in Europe. The USD
dropped after the Labor Department data showed U.S. payrolls rose 39,000 in November. This
number fell way short of the original estimate 140,000 new jobs. The U.S. unemployment rate
also increased to 9.8 percent, increasing the EUR/USD value. Many investors see the Euro as
only temporarily rising, and not to establish too many buying positions. Some also see the euro
ending next week unchanged against the USD. Many people are considering taking their
positions until the end of the year. The European countries remain immersed in debt, which
should keep the euro's downtrend. Ireland may have been bailed out, but investors are still
very worried about the next euro-area country to require assistance.
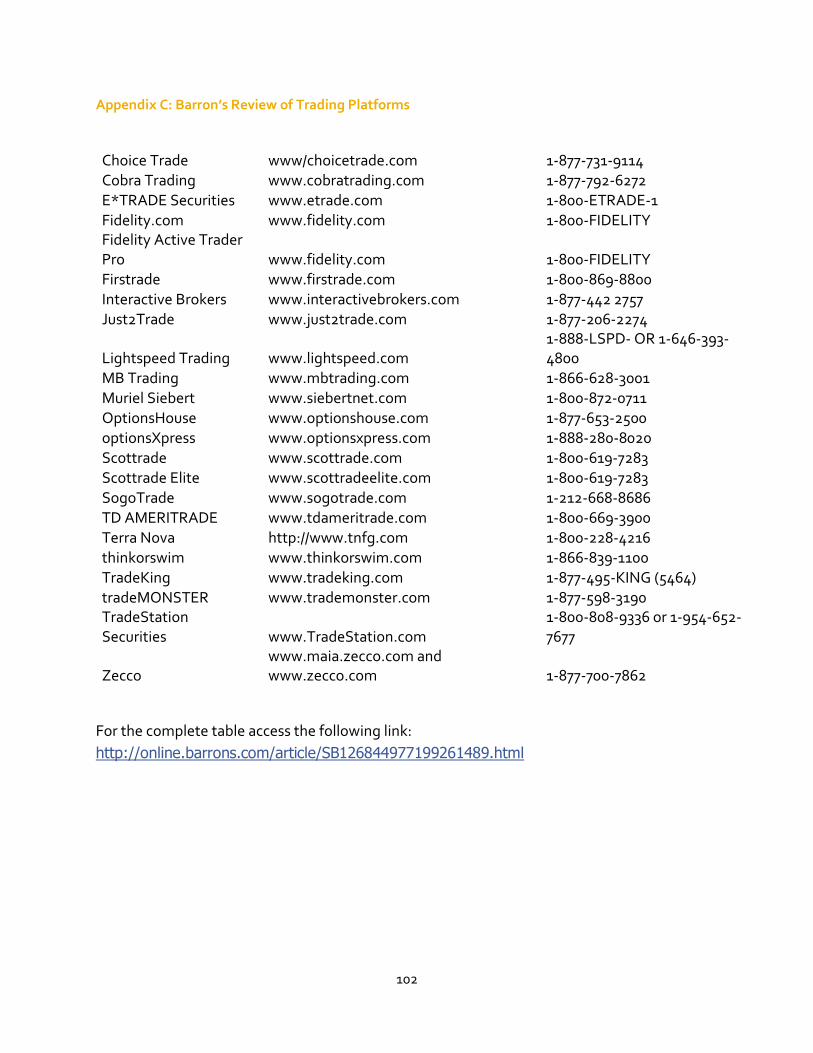
102
Appendix C: Barron’s Review of Trading Platforms
Choice Trade www/choicetrade.com 1-877-731-9114 Cobra Trading www.cobratrading.com 1-877-792-6272 E*TRADE Securities www.etrade.com 1-800-ETRADE-1
Fidelity.com www.fidelity.com 1-800-FIDELITY Fidelity Active Trader Pro www.fidelity.com 1-800-FIDELITY Firstrade www.firstrade.com 1-800-869-8800 Interactive Brokers www.interactivebrokers.com 1-877-442 2757 Just2Trade www.just2trade.com 1-877-206-2274
Lightspeed Trading www.lightspeed.com 1-888-LSPD- OR 1-646-393-4800
MB Trading www.mbtrading.com 1-866-628-3001 Muriel Siebert www.siebertnet.com 1-800-872-0711 OptionsHouse www.optionshouse.com 1-877-653-2500 optionsXpress www.optionsxpress.com 1-888-280-8020 Scottrade www.scottrade.com 1-800-619-7283 Scottrade Elite www.scottradeelite.com 1-800-619-7283
SogoTrade www.sogotrade.com 1-212-668-8686 TD AMERITRADE www.tdameritrade.com 1-800-669-3900 Terra Nova http://www.tnfg.com 1-800-228-4216 thinkorswim www.thinkorswim.com 1-866-839-1100 TradeKing www.tradeking.com 1-877-495-KING (5464) tradeMONSTER www.trademonster.com 1-877-598-3190 TradeStation Securities www.TradeStation.com
1-800-808-9336 or 1-954-652-7677
Zecco www.maia.zecco.com and www.zecco.com 1-877-700-7862
For the complete table access the following link:
http://online.barrons.com/article/SB126844977199261489.html
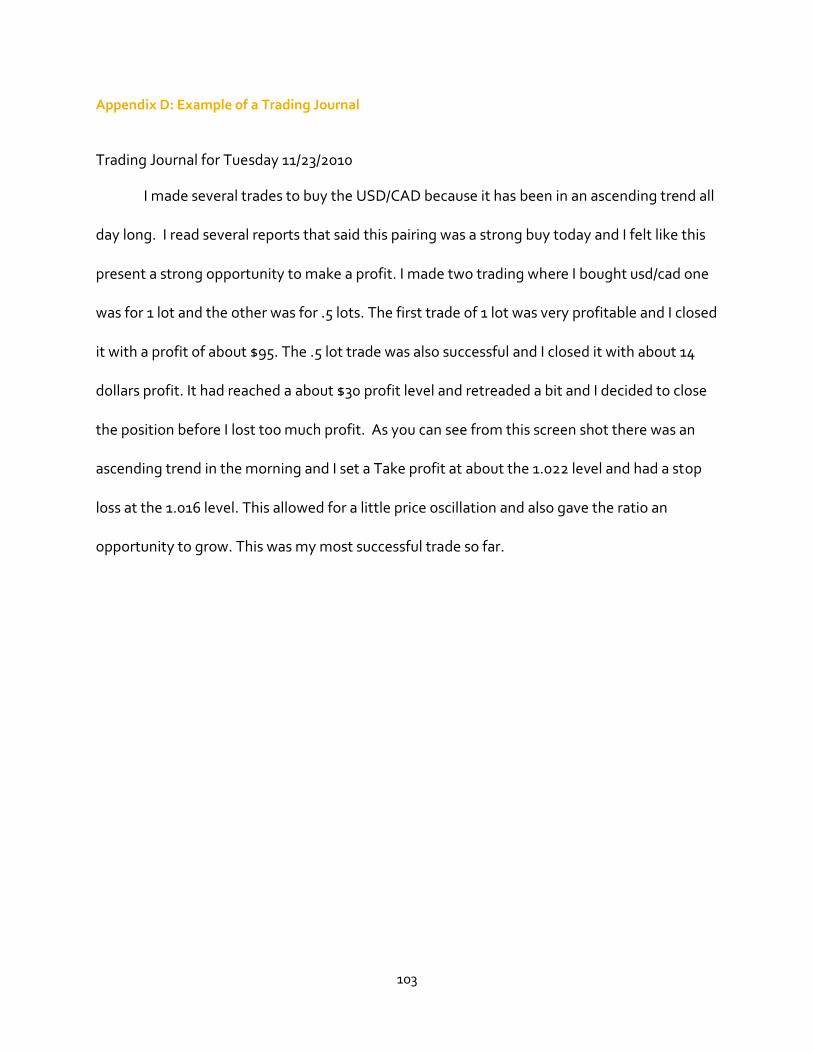
103
Appendix D: Example of a Trading Journal
Trading Journal for Tuesday 11/23/2010
I made several trades to buy the USD/CAD because it has been in an ascending trend all
day long. I read several reports that said this pairing was a strong buy today and I felt like this
present a strong opportunity to make a profit. I made two trading where I bought usd/cad one
was for 1 lot and the other was for .5 lots. The first trade of 1 lot was very profitable and I closed
it with a profit of about $95. The .5 lot trade was also successful and I closed it with about 14
dollars profit. It had reached a about $30 profit level and retreaded a bit and I decided to close
the position before I lost too much profit. As you can see from this screen shot there was an
ascending trend in the morning and I set a Take profit at about the 1.022 level and had a stop
loss at the 1.016 level. This allowed for a little price oscillation and also gave the ratio an
opportunity to grow. This was my most successful trade so far.
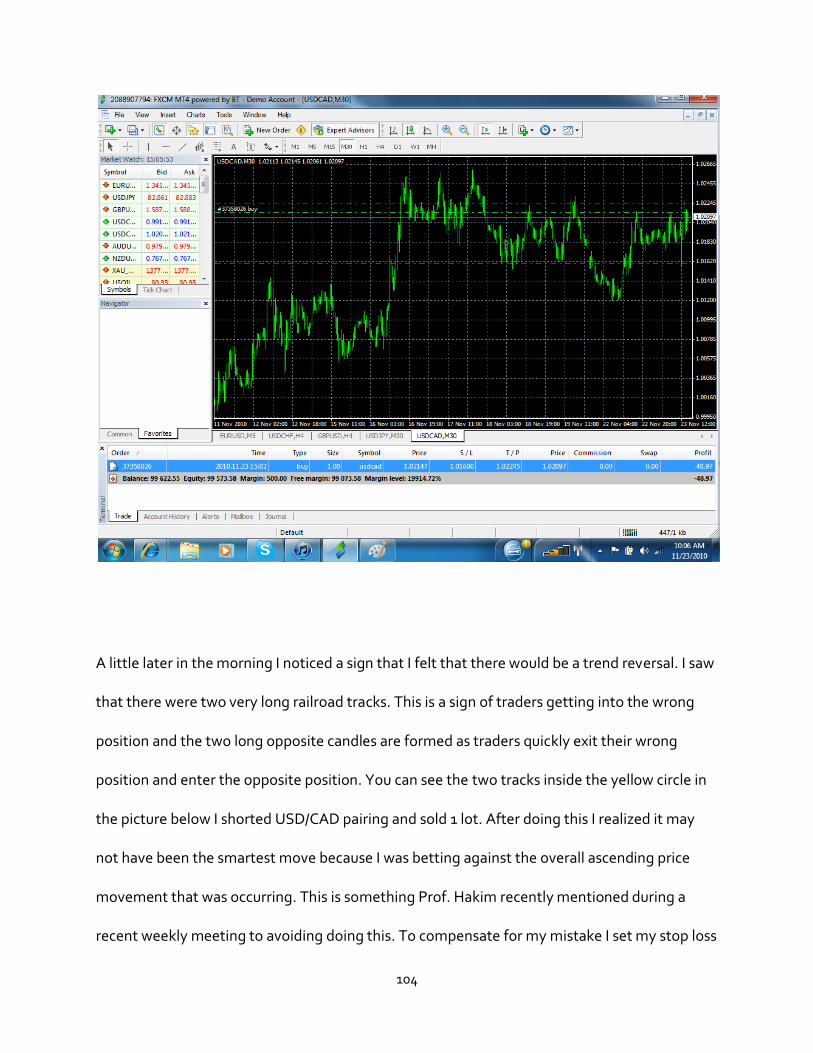
104
A little later in the morning I noticed a sign that I felt that there would be a trend reversal. I saw
that there were two very long railroad tracks. This is a sign of traders getting into the wrong
position and the two long opposite candles are formed as traders quickly exit their wrong
position and enter the opposite position. You can see the two tracks inside the yellow circle in
the picture below I shorted USD/CAD pairing and sold 1 lot. After doing this I realized it may
not have been the smartest move because I was betting against the overall ascending price
movement that was occurring. This is something Prof. Hakim recently mentioned during a
recent weekly meeting to avoiding doing this. To compensate for my mistake I set my stop loss
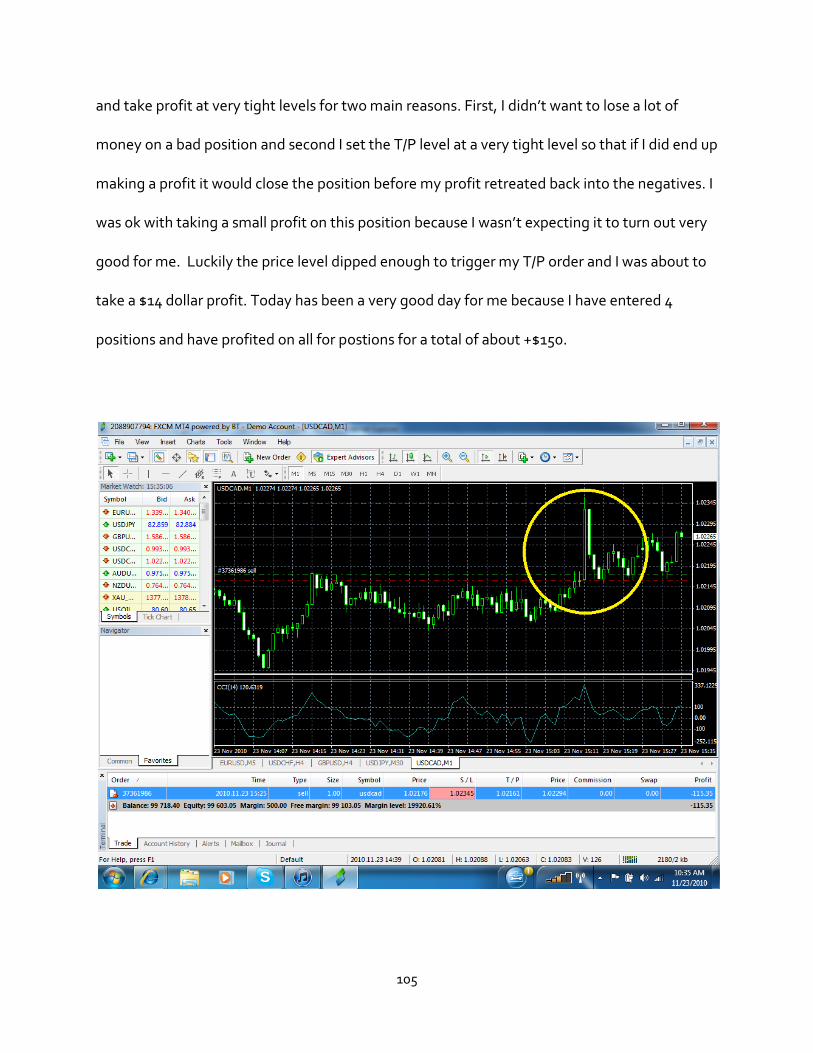
105
and take profit at very tight levels for two main reasons. First, I didn’t want to lose a lot of
money on a bad position and second I set the T/P level at a very tight level so that if I did end up
making a profit it would close the position before my profit retreated back into the negatives. I
was ok with taking a small profit on this position because I wasn’t expecting it to turn out very
good for me. Luckily the price level dipped enough to trigger my T/P order and I was about to
take a $14 dollar profit. Today has been a very good day for me because I have entered 4
positions and have profited on all for postions for a total of about +$150.

106
Appendix E: Example of a Gartman letter
Below is a January edition of a Gartman letter which is a weekly market outlook report:
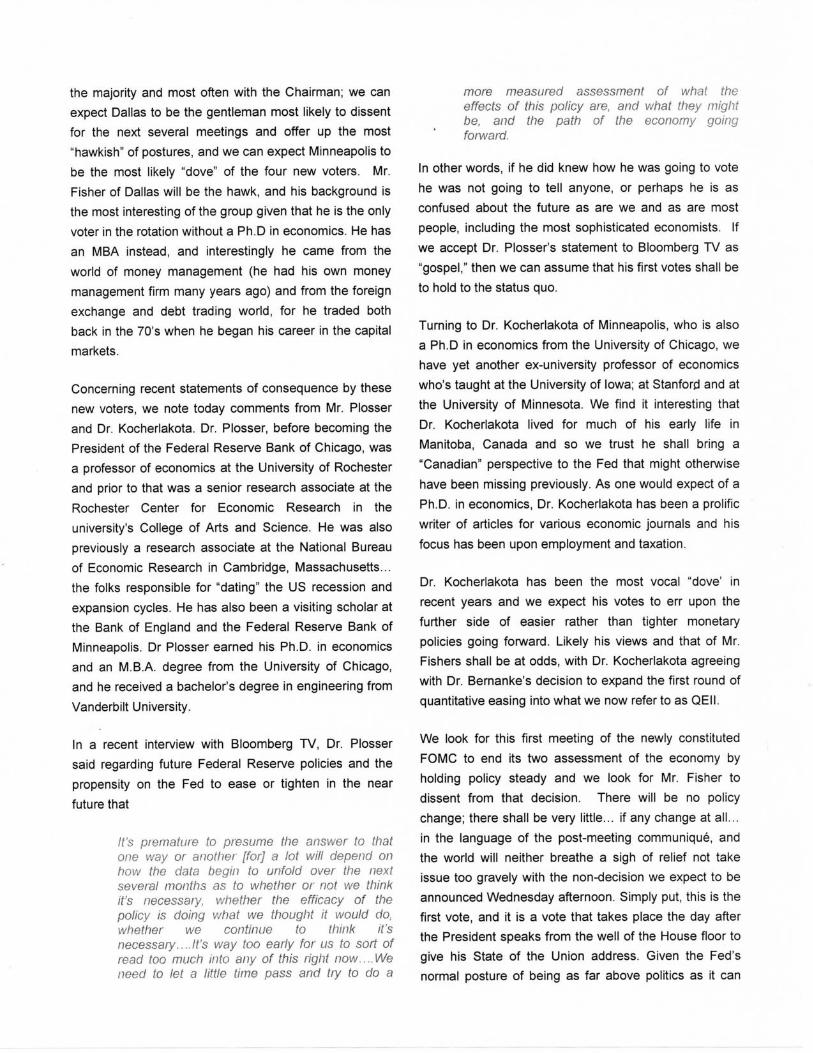
107
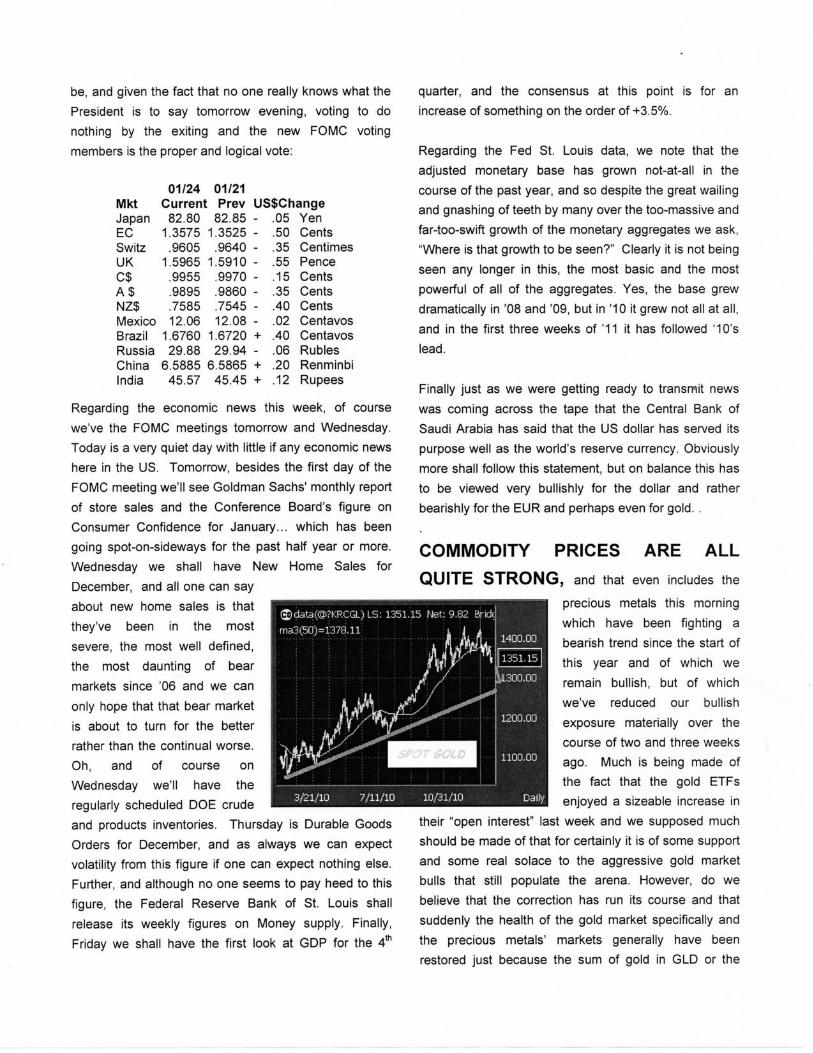
108
109
110
111
112
113
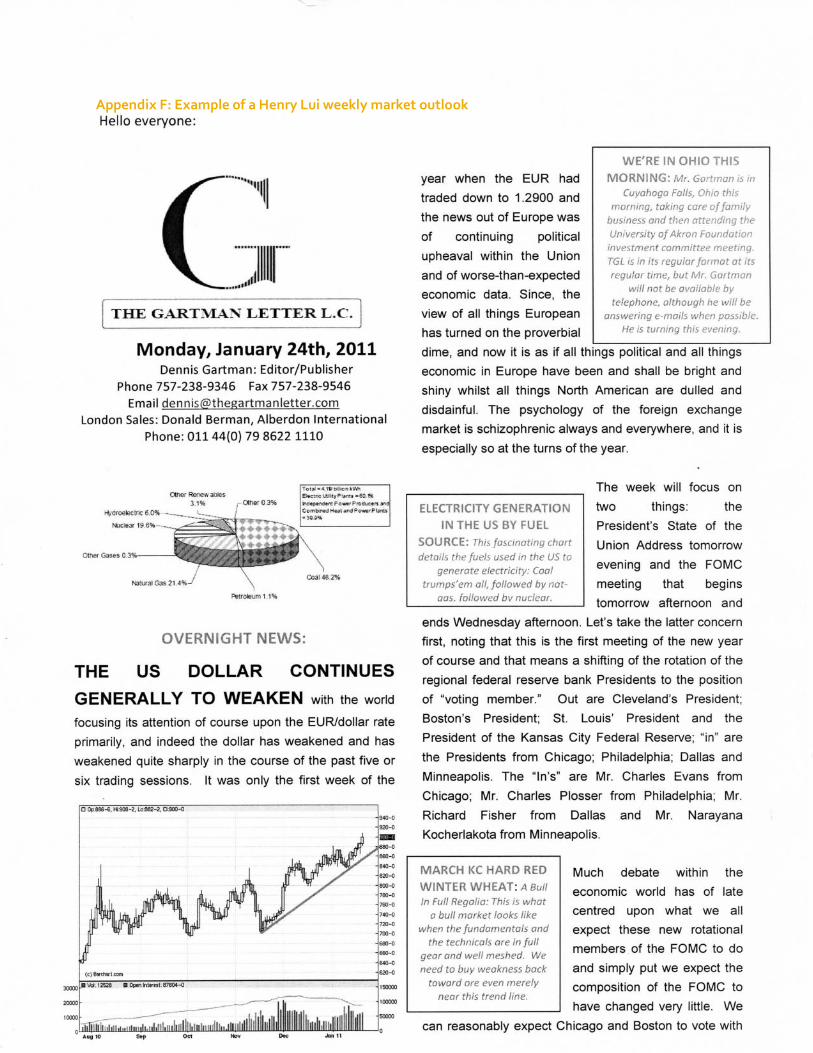
114
Appendix F: Example of a Henry Lui weekly market outlook
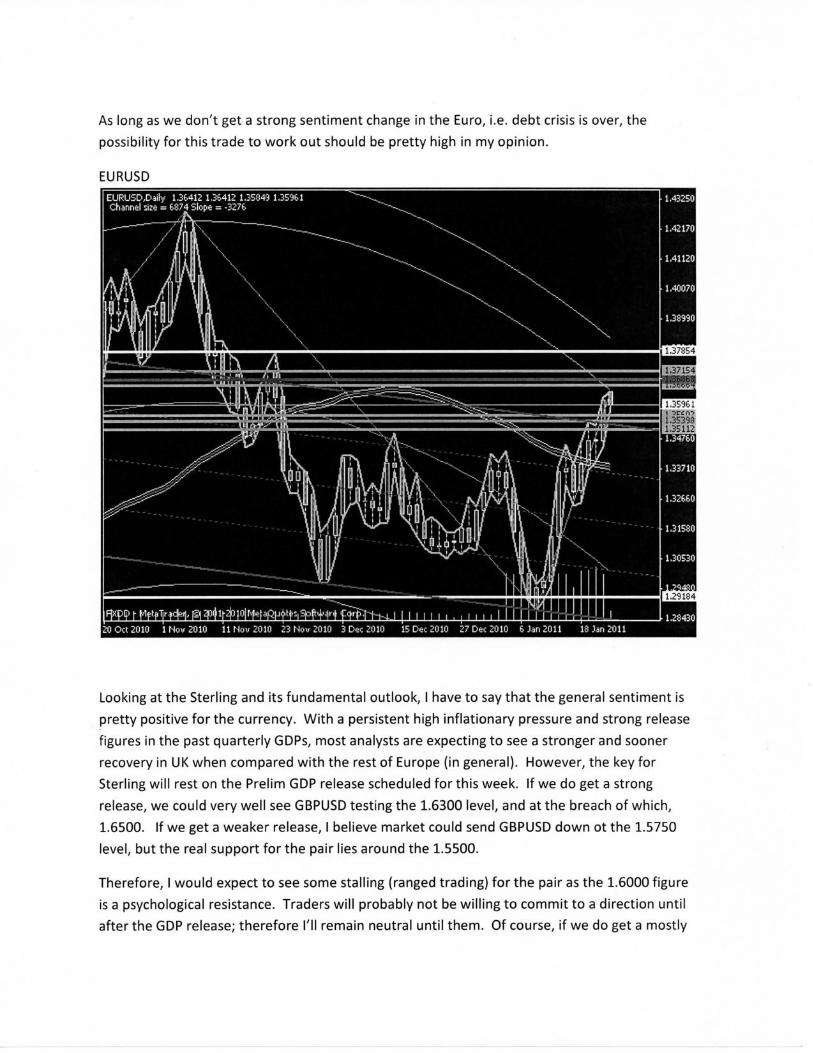
115
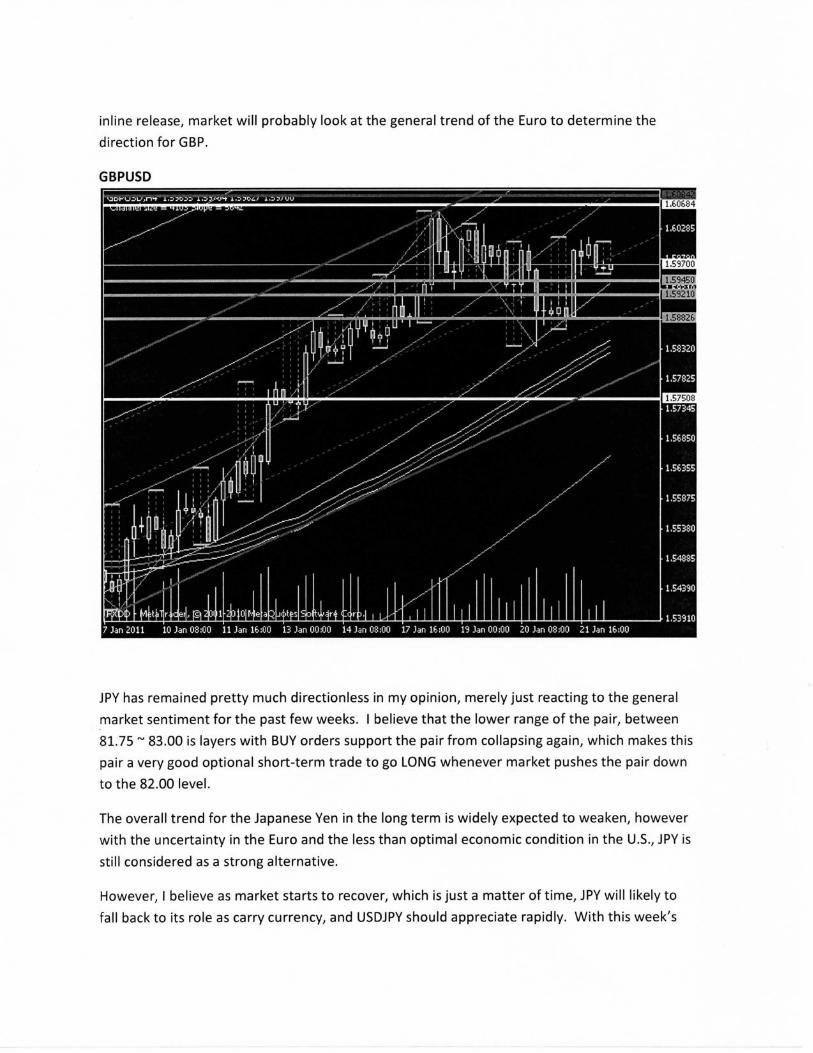
116
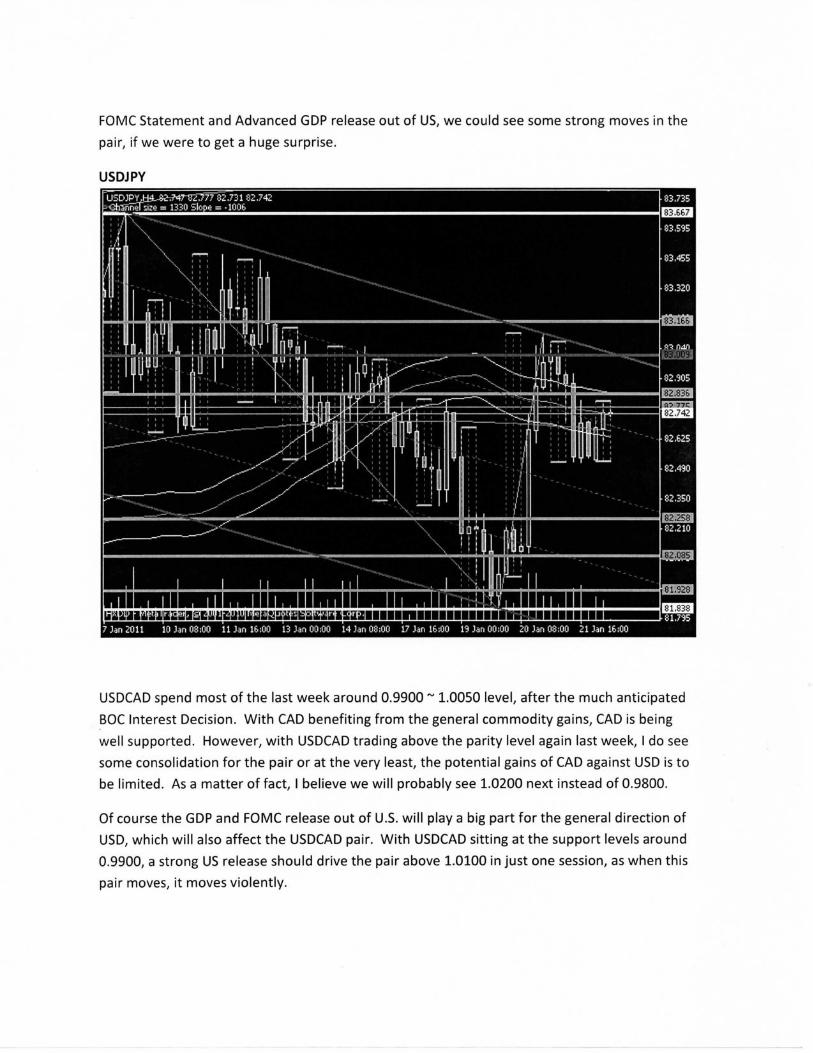
117
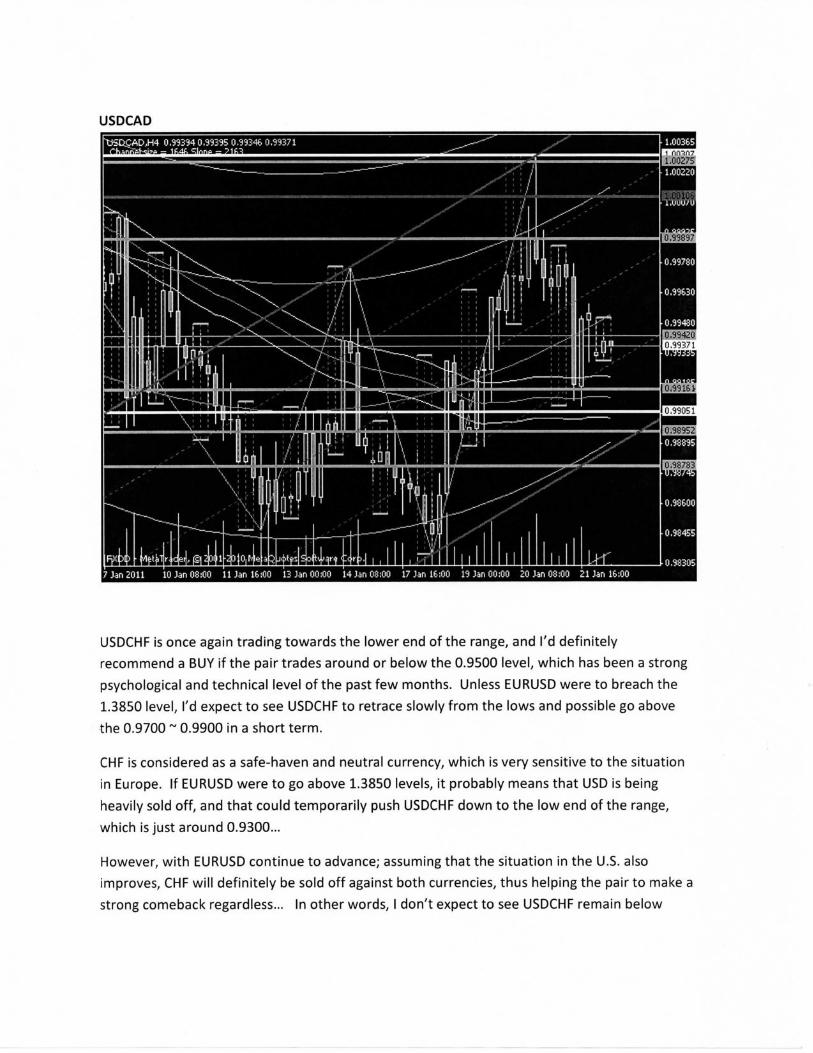
118
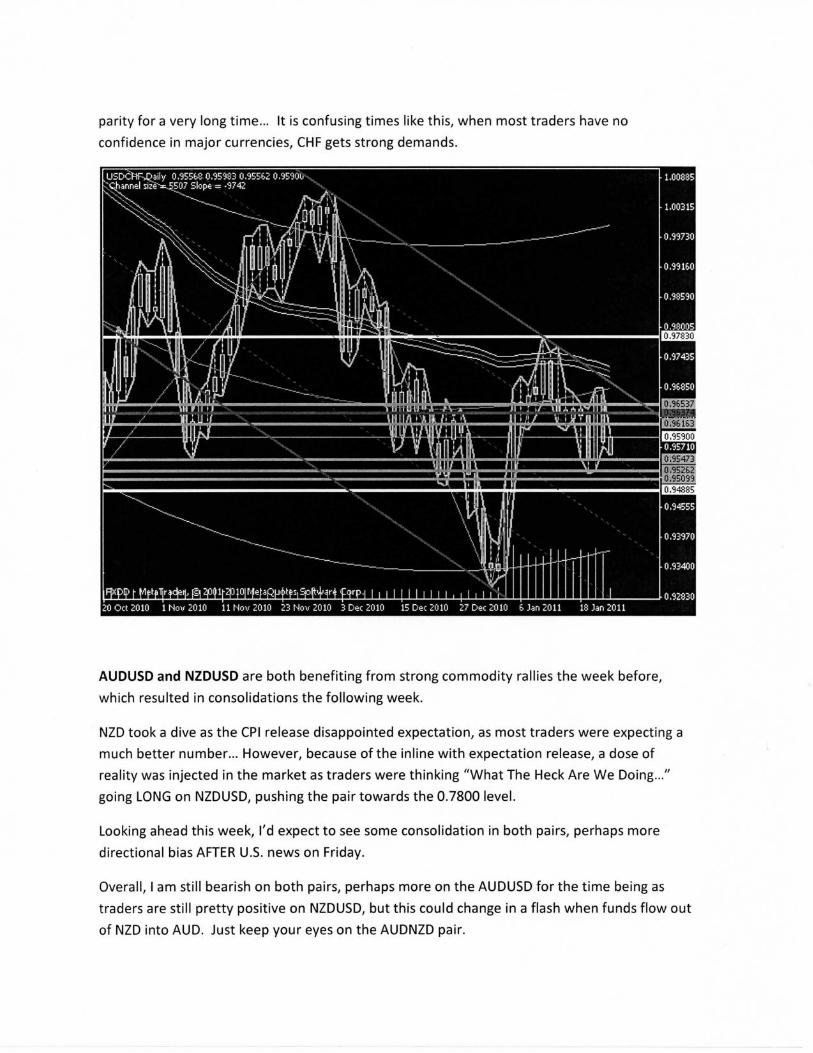
119
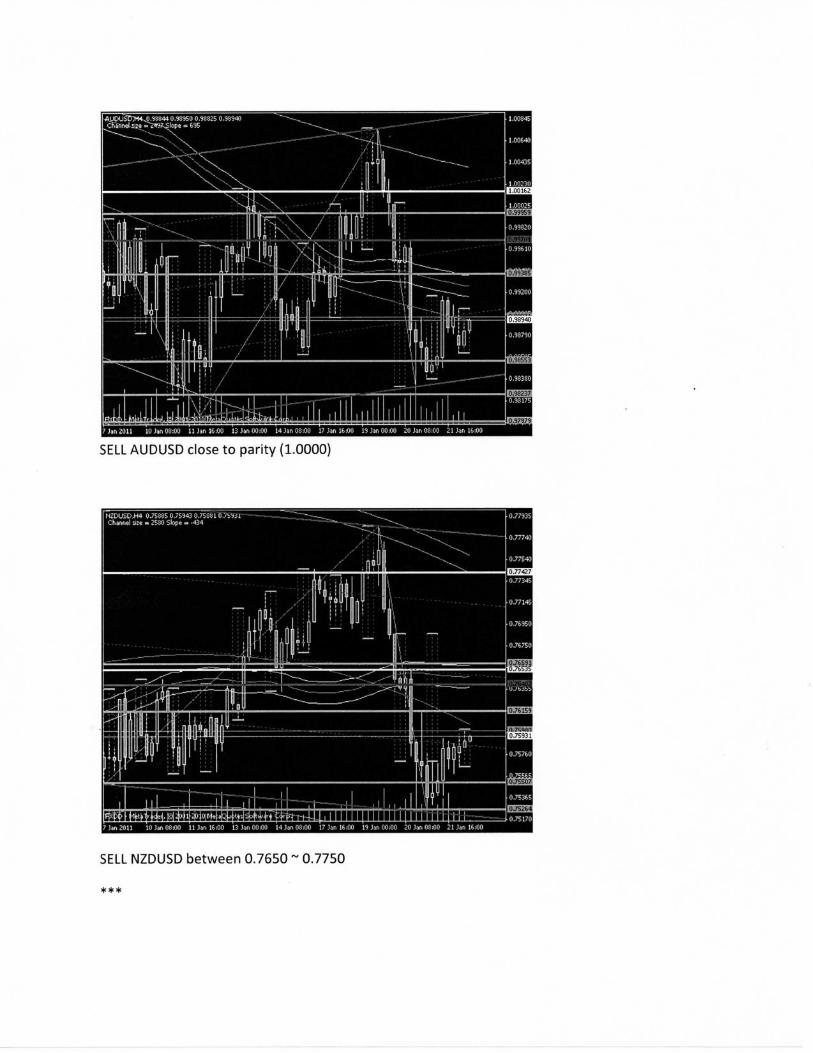
120
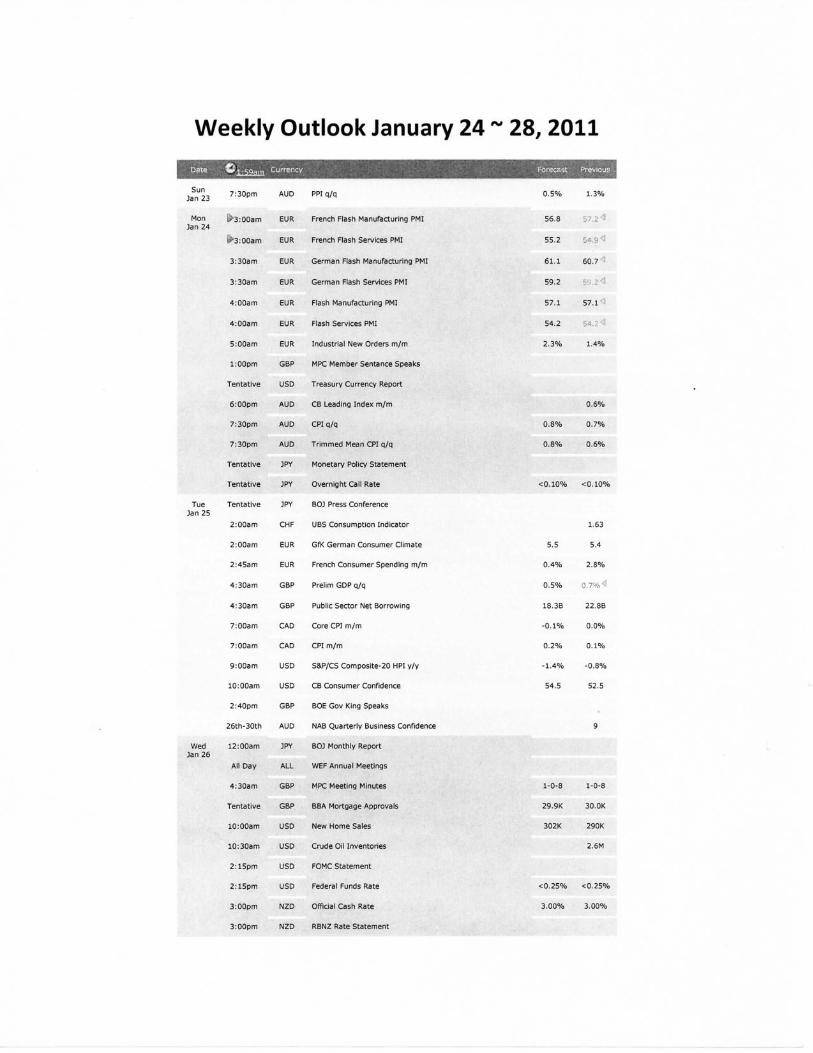
121
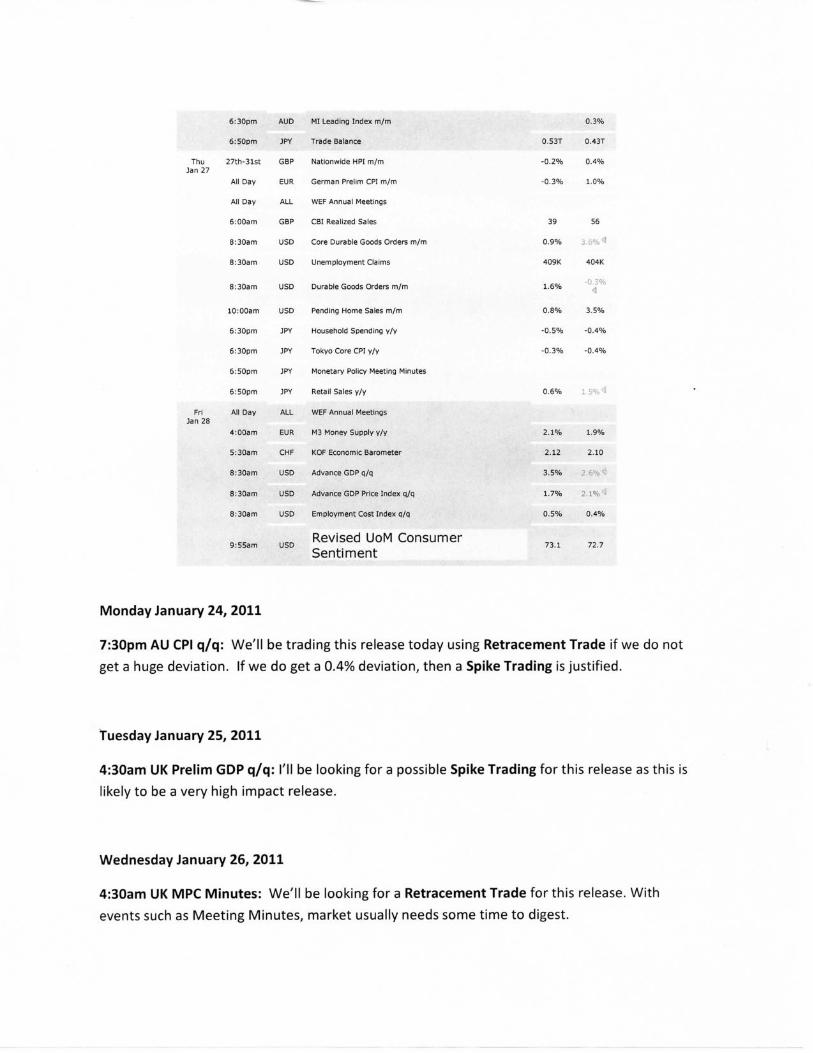
122
123