GRADE 8 MATH - s wonderland – math grade 8 2 grade 8 math in-school preparation...
37
CANADA’S WONDERLAND – Math Grade 8 1 GRADE 8 MATH TABLE OF CONTENTS In–School Preparation page 2 Amusement Ride Activities page 19
Transcript of GRADE 8 MATH - s wonderland – math grade 8 2 grade 8 math in-school preparation...
CANADA’S WONDERLAND – Math Grade 8 1
GRADE 8 MATH
TABLE OF CONTENTS In–School Preparation page 2 Amusement Ride Activities page 19
CANADA’S WONDERLAND – Math Grade 8 2
GRADE 8 MATH
IN-SCHOOL PREPARATION
TEACHER’S NOTE
MEETING THE EXPECTATIONS
AMUSEMENT RIDE RUBRIC
BEFORE THE PARK
TEACHER’S NOTE
CANADA’S WONDERLAND – Math Grade 8 3
Welcome Grade 8 Teachers to
Canada’s Wonderland’s Math Program
We have provided you with an Activity Manual that will take you from your classroom to
an action filled day at the Park. The “Before the Park” activities are set up for your
students to practice some new skills and review some old ones before they go to the Park.
The “At the Park” activities are a continuation and extension of the classroom activities.
The tasks set up for your students at the Park are designed to let them enjoy all that
Canada’s Wonderland has to offer, while gathering some data to be used back at the
school. The students will use this information to complete a “Summative Assessment”
that allows them to extend the experiences that they began in the classroom before the
trip. Every activity is completely linked to the new Revised Mathematics Curriculum
(2005).
Every activity is designed as a real-world experience. As in the real world, there are
many possible solutions to a variety of questions. We encourage you to challenge your
students to think deeply and reflect on the tasks that are set out before them. We hope
that this experience will be a celebration and extension of your teaching and learning this
year. Thank you for your on-going support for young people and our programs at
Canada’s Wonderland.
MEETING THE EXPECTATIONS
CANADA’S WONDERLAND – Math Grade 8 4
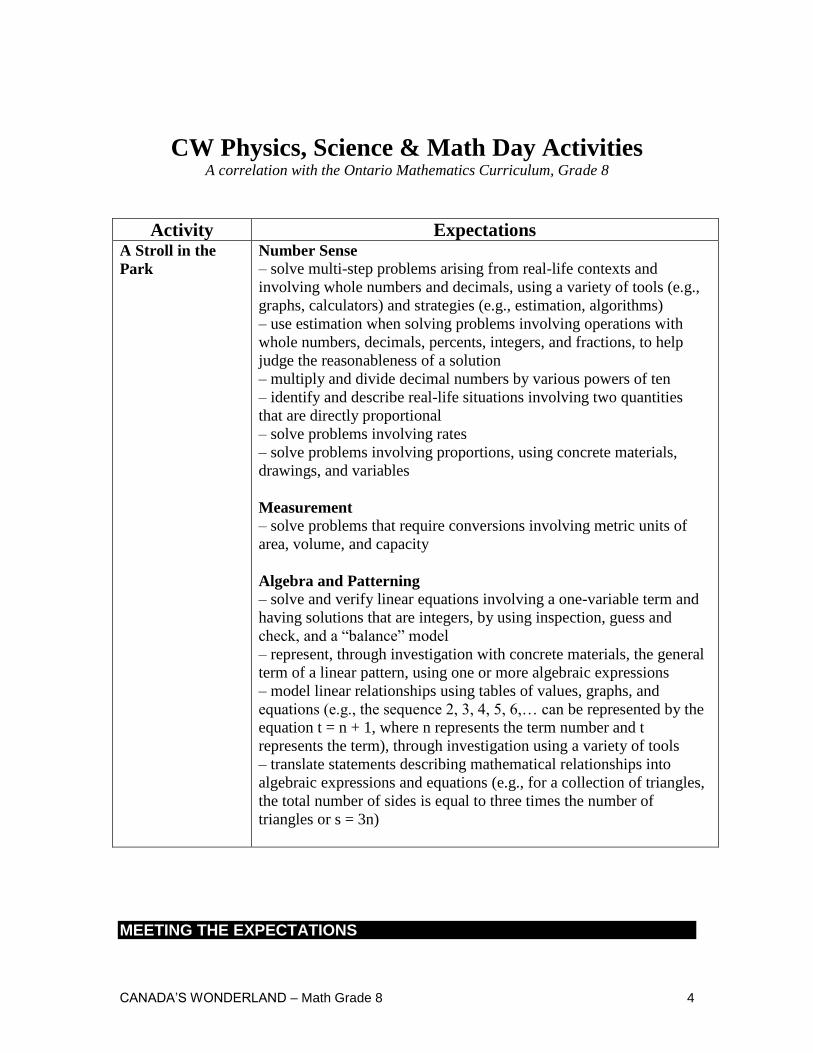
CW Physics, Science & Math Day Activities A correlation with the Ontario Mathematics Curriculum, Grade 8
Activity Expectations A Stroll in the
Park
Number Sense
– solve multi-step problems arising from real-life contexts and
involving whole numbers and decimals, using a variety of tools (e.g.,
graphs, calculators) and strategies (e.g., estimation, algorithms)
– use estimation when solving problems involving operations with
whole numbers, decimals, percents, integers, and fractions, to help
judge the reasonableness of a solution
– multiply and divide decimal numbers by various powers of ten
– identify and describe real-life situations involving two quantities
that are directly proportional
– solve problems involving rates
– solve problems involving proportions, using concrete materials,
drawings, and variables
Measurement
– solve problems that require conversions involving metric units of
area, volume, and capacity
Algebra and Patterning
– solve and verify linear equations involving a one-variable term and
having solutions that are integers, by using inspection, guess and
check, and a “balance” model
– represent, through investigation with concrete materials, the general
term of a linear pattern, using one or more algebraic expressions
– model linear relationships using tables of values, graphs, and
equations (e.g., the sequence 2, 3, 4, 5, 6,… can be represented by the
equation t = n + 1, where n represents the term number and t
represents the term), through investigation using a variety of tools
– translate statements describing mathematical relationships into
algebraic expressions and equations (e.g., for a collection of triangles,
the total number of sides is equal to three times the number of
triangles or s = 3n)
MEETING THE EXPECTATIONS

CANADA’S WONDERLAND – Math Grade 8 5
Round & Round Number Sense
– solve multi-step problems arising from real-life contexts and
involving whole numbers and decimals, using a variety of tools
(e.g., graphs, calculators) and strategies (e.g., estimation,
algorithms)
– use estimation when solving problems involving operations with
whole numbers, decimals, percents, integers, and fractions, to help
judge the reasonableness of a solution
– identify and describe real-life situations involving two quantities
that are directly proportional
– solve problems involving rates
– solve problems involving proportions, using concrete materials,
drawings, and variables
Measurement
– solve problems that require conversions involving metric units of
area, volume, and capacity
– measure the circumference, radius, and diameter of circular
objects, using concrete materials
– solve problems involving the estimation and calculation of the
circumference and the area of a circle
Geometry
– construct a circle, given its centre and radius, or its centre and a
point on the circle, or three points on the circle
Money in my
Number Sense
– solve problems involving rates
Data Management
– collect data by conducting a survey or an experiment to do with
themselves, their environment, issues in their school or community,
or content from another subject, and record observations or
measurements;
- organize into intervals a set of data that is spread over a broad
range
- collect and organize categorical, discrete, or continuous primary
data and secondary data, and display the data in charts, tables, and
graphs (including histograms and scatter plots) that have
appropriate titles, labels, and scales that suit the range and
distribution of the data, using a variety of tools
MEETING THE EXPECTATIONS
CANADA’S WONDERLAND – Math Grade 8 6
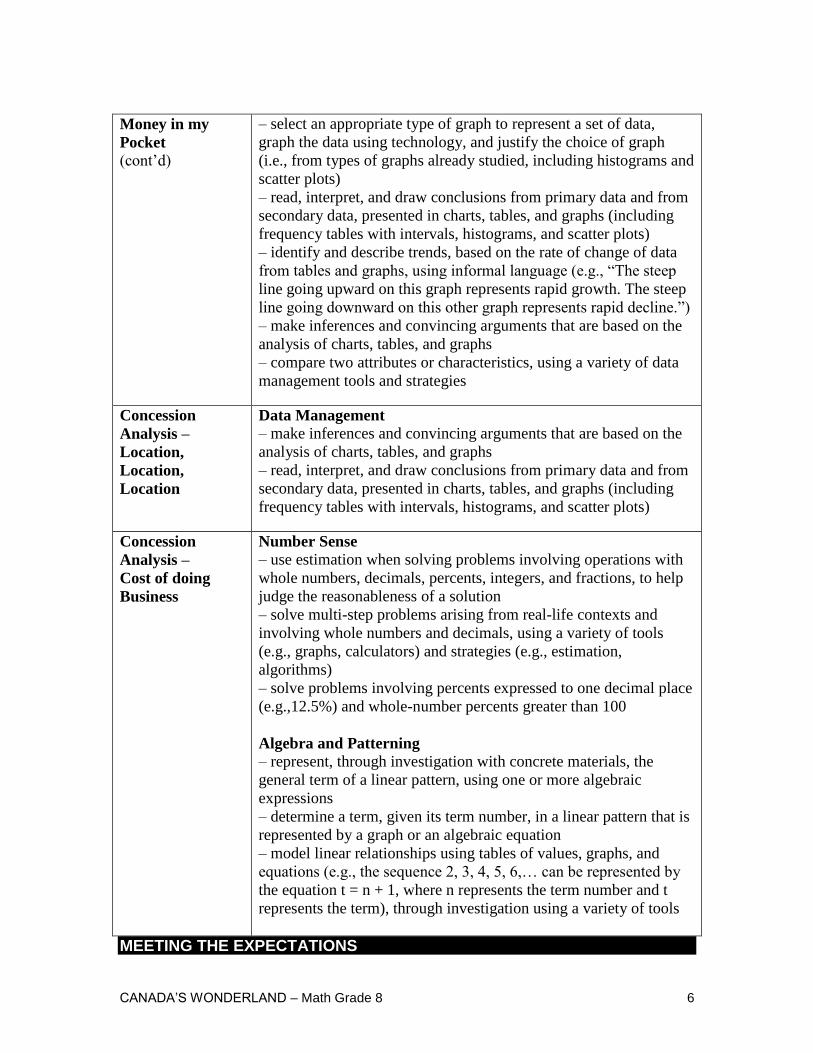
Money in my
(cont’d)
– select an appropriate type of graph to represent a set of data,
graph the data using technology, and justify the choice of graph
(i.e., from types of graphs already studied, including histograms and
scatter plots)
– read, interpret, and draw conclusions from primary data and from
secondary data, presented in charts, tables, and graphs (including
frequency tables with intervals, histograms, and scatter plots)
– identify and describe trends, based on the rate of change of data
from tables and graphs, using informal language (e.g., “The steep
line going upward on this graph represents rapid growth. The steep
line going downward on this other graph represents rapid decline.”)
– make inferences and convincing arguments that are based on the
analysis of charts, tables, and graphs
– compare two attributes or characteristics, using a variety of data
management tools and strategies
Concession
Analysis –
Location,
Location,
Location
Data Management
– make inferences and convincing arguments that are based on the
analysis of charts, tables, and graphs
– read, interpret, and draw conclusions from primary data and from
secondary data, presented in charts, tables, and graphs (including
frequency tables with intervals, histograms, and scatter plots)
Concession
Analysis –
Cost of doing
Business
Number Sense
– use estimation when solving problems involving operations with
whole numbers, decimals, percents, integers, and fractions, to help
judge the reasonableness of a solution
– solve multi-step problems arising from real-life contexts and
involving whole numbers and decimals, using a variety of tools
(e.g., graphs, calculators) and strategies (e.g., estimation,
algorithms)
– solve problems involving percents expressed to one decimal place
(e.g.,12.5%) and whole-number percents greater than 100
Algebra and Patterning
– represent, through investigation with concrete materials, the
general term of a linear pattern, using one or more algebraic
expressions
– determine a term, given its term number, in a linear pattern that is
represented by a graph or an algebraic equation
– model linear relationships using tables of values, graphs, and
equations (e.g., the sequence 2, 3, 4, 5, 6,… can be represented by
the equation t = n + 1, where n represents the term number and t
represents the term), through investigation using a variety of tools
MEETING THE EXPECTATIONS
CANADA’S WONDERLAND – Math Grade 8 7
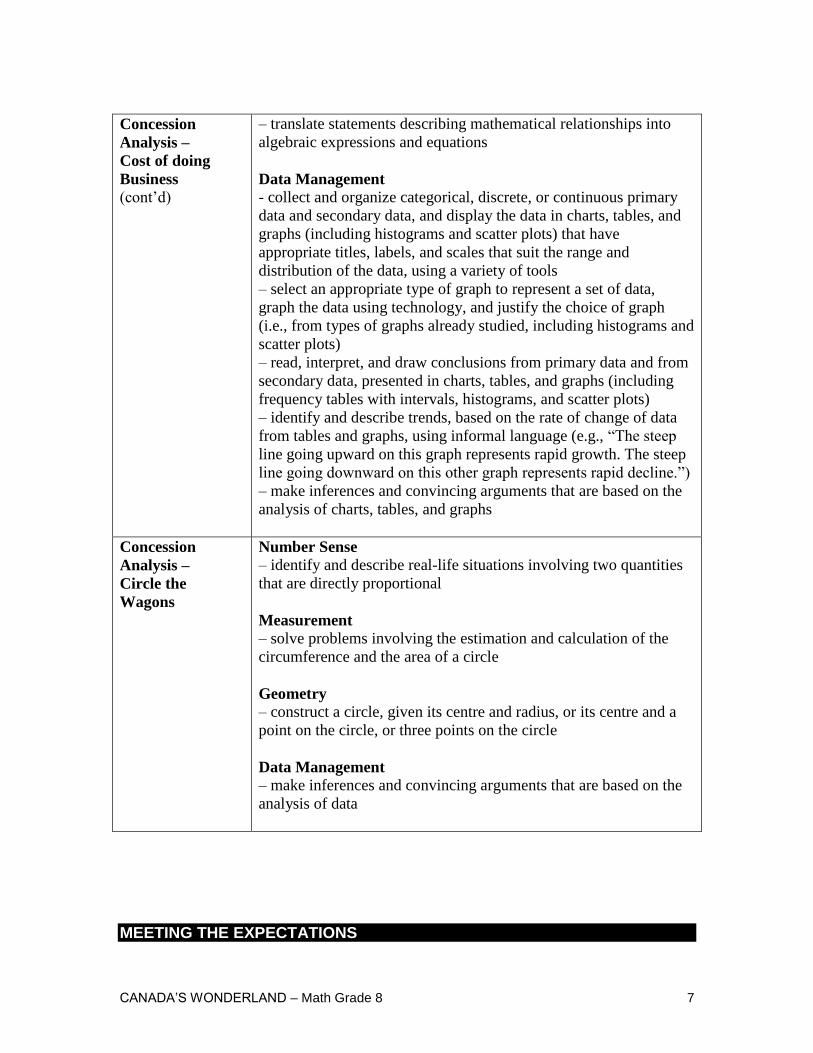
Concession
Analysis –
Cost of doing
Business
(cont’d)
– translate statements describing mathematical relationships into
algebraic expressions and equations
Data Management
- collect and organize categorical, discrete, or continuous primary
data and secondary data, and display the data in charts, tables, and
graphs (including histograms and scatter plots) that have
appropriate titles, labels, and scales that suit the range and
distribution of the data, using a variety of tools
– select an appropriate type of graph to represent a set of data,
graph the data using technology, and justify the choice of graph
(i.e., from types of graphs already studied, including histograms and
scatter plots)
– read, interpret, and draw conclusions from primary data and from
secondary data, presented in charts, tables, and graphs (including
frequency tables with intervals, histograms, and scatter plots)
– identify and describe trends, based on the rate of change of data
from tables and graphs, using informal language (e.g., “The steep
line going upward on this graph represents rapid growth. The steep
line going downward on this other graph represents rapid decline.”)
– make inferences and convincing arguments that are based on the
analysis of charts, tables, and graphs
Concession
Analysis –
Circle the
Wagons
Number Sense
– identify and describe real-life situations involving two quantities
that are directly proportional
Measurement
– solve problems involving the estimation and calculation of the
circumference and the area of a circle
Geometry
– construct a circle, given its centre and radius, or its centre and a
point on the circle, or three points on the circle
Data Management
– make inferences and convincing arguments that are based on the
analysis of data
MEETING THE EXPECTATIONS
CANADA’S WONDERLAND – Math Grade 8 8
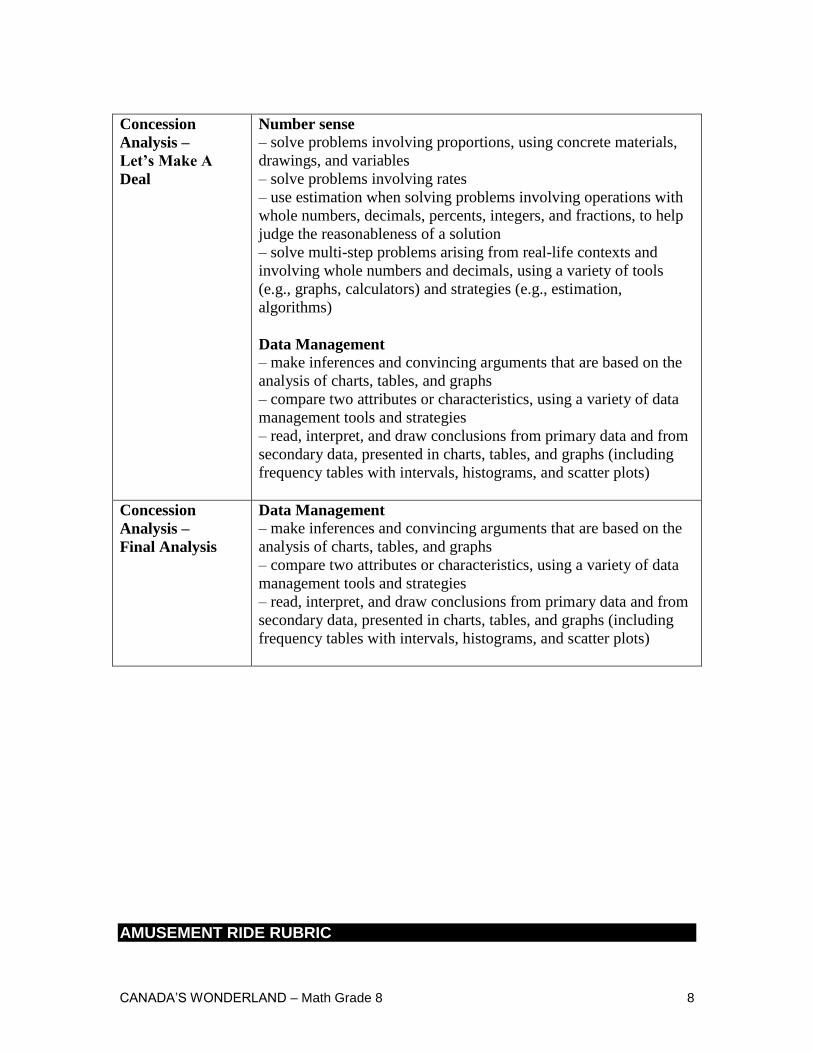
Concession
Analysis –
Let’s Make A
Deal
Number sense
– solve problems involving proportions, using concrete materials,
drawings, and variables
– solve problems involving rates
– use estimation when solving problems involving operations with
whole numbers, decimals, percents, integers, and fractions, to help
judge the reasonableness of a solution
– solve multi-step problems arising from real-life contexts and
involving whole numbers and decimals, using a variety of tools
(e.g., graphs, calculators) and strategies (e.g., estimation,
algorithms)
Data Management
– make inferences and convincing arguments that are based on the
analysis of charts, tables, and graphs
– compare two attributes or characteristics, using a variety of data
management tools and strategies
– read, interpret, and draw conclusions from primary data and from
secondary data, presented in charts, tables, and graphs (including
frequency tables with intervals, histograms, and scatter plots)
Concession
Analysis –
Final Analysis
Data Management
– make inferences and convincing arguments that are based on the
analysis of charts, tables, and graphs
– compare two attributes or characteristics, using a variety of data
management tools and strategies
– read, interpret, and draw conclusions from primary data and from
secondary data, presented in charts, tables, and graphs (including
frequency tables with intervals, histograms, and scatter plots)
AMUSEMENT RIDE RUBRIC
CANADA’S WONDERLAND – Math Grade 8 9
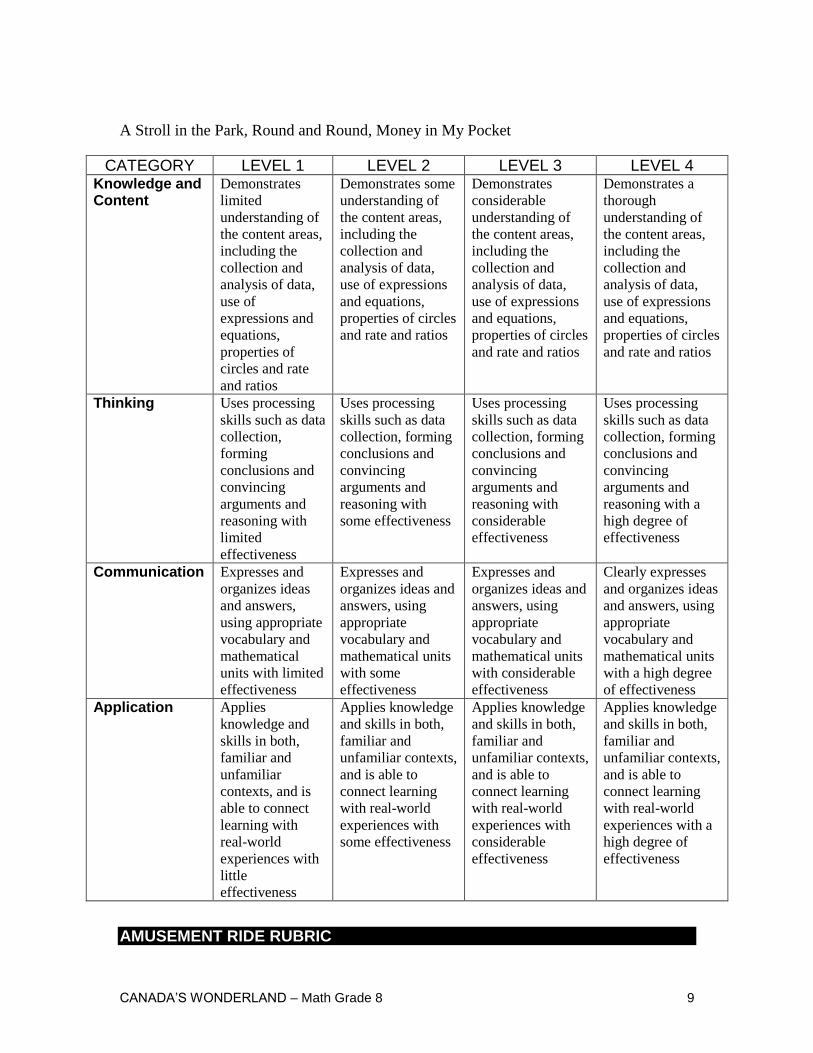
A Stroll in the Park, Round and Round, Money in My Pocket
AMUSEMENT RIDE RUBRIC
CATEGORY LEVEL 1 LEVEL 2 LEVEL 3 LEVEL 4 Knowledge and Content
Demonstrates
limited
understanding of
the content areas,
including the
collection and
analysis of data,
use of
expressions and
equations,
properties of
circles and rate
and ratios
Demonstrates some
understanding of
the content areas,
including the
collection and
analysis of data,
use of expressions
and equations,
properties of circles
and rate and ratios
Demonstrates
considerable
understanding of
the content areas,
including the
collection and
analysis of data,
use of expressions
and equations,
properties of circles
and rate and ratios
Demonstrates a
thorough
understanding of
the content areas,
including the
collection and
analysis of data,
use of expressions
and equations,
properties of circles
and rate and ratios
Thinking Uses processing
skills such as data
collection,
forming
conclusions and
convincing
arguments and
reasoning with
limited
effectiveness
Uses processing
skills such as data
collection, forming
conclusions and
convincing
arguments and
reasoning with
some effectiveness
Uses processing
skills such as data
collection, forming
conclusions and
convincing
arguments and
reasoning with
considerable
effectiveness
Uses processing
skills such as data
collection, forming
conclusions and
convincing
arguments and
reasoning with a
high degree of
effectiveness
Communication Expresses and
organizes ideas
and answers,
using appropriate
vocabulary and
mathematical
units with limited
effectiveness
Expresses and
organizes ideas and
answers, using
appropriate
vocabulary and
mathematical units
with some
effectiveness
Expresses and
organizes ideas and
answers, using
appropriate
vocabulary and
mathematical units
with considerable
effectiveness
Clearly expresses
and organizes ideas
and answers, using
appropriate
vocabulary and
mathematical units
with a high degree
of effectiveness
Application Applies
knowledge and
skills in both,
familiar and
unfamiliar
contexts, and is
able to connect
learning with
real-world
experiences with
little
effectiveness
Applies knowledge
and skills in both,
familiar and
unfamiliar contexts,
and is able to
connect learning
with real-world
experiences with
some effectiveness
Applies knowledge
and skills in both,
familiar and
unfamiliar contexts,
and is able to
connect learning
with real-world
experiences with
considerable
effectiveness
Applies knowledge
and skills in both,
familiar and
unfamiliar contexts,
and is able to
connect learning
with real-world
experiences with a
high degree of
effectiveness
CANADA’S WONDERLAND – Math Grade 8 10
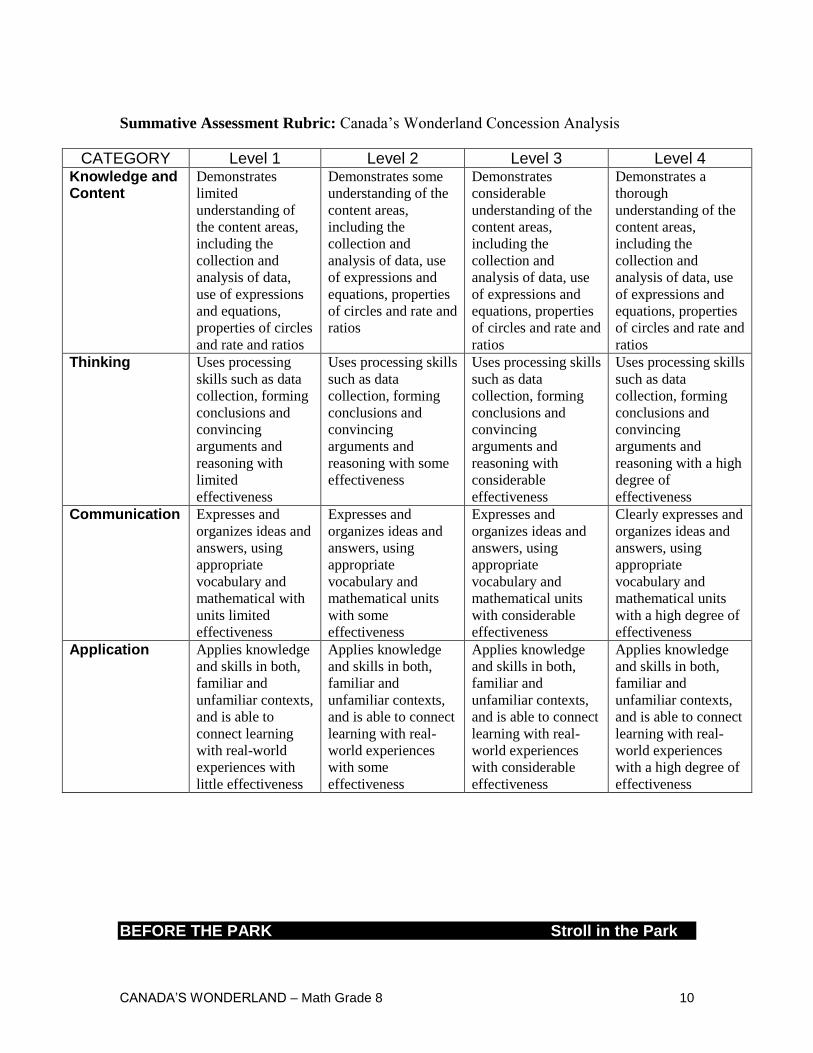
Summative Assessment Rubric: Canada’s Wonderland Concession Analysis
BEFORE THE PARK Stroll in the Park
CATEGORY Level 1 Level 2 Level 3 Level 4 Knowledge and Content
Demonstrates
limited
understanding of
the content areas,
including the
collection and
analysis of data,
use of expressions
and equations,
properties of circles
and rate and ratios
Demonstrates some
understanding of the
content areas,
including the
collection and
analysis of data, use
of expressions and
equations, properties
of circles and rate and
ratios
Demonstrates
considerable
understanding of the
content areas,
including the
collection and
analysis of data, use
of expressions and
equations, properties
of circles and rate and
ratios
Demonstrates a
thorough
understanding of the
content areas,
including the
collection and
analysis of data, use
of expressions and
equations, properties
of circles and rate and
ratios
Thinking Uses processing
skills such as data
collection, forming
conclusions and
convincing
arguments and
reasoning with
limited
effectiveness
Uses processing skills
such as data
collection, forming
conclusions and
convincing
arguments and
reasoning with some
effectiveness
Uses processing skills
such as data
collection, forming
conclusions and
convincing
arguments and
reasoning with
considerable
effectiveness
Uses processing skills
such as data
collection, forming
conclusions and
convincing
arguments and
reasoning with a high
degree of
effectiveness
Communication Expresses and
organizes ideas and
answers, using
appropriate
vocabulary and
mathematical with
units limited
effectiveness
Expresses and
organizes ideas and
answers, using
appropriate
vocabulary and
mathematical units
with some
effectiveness
Expresses and
organizes ideas and
answers, using
appropriate
vocabulary and
mathematical units
with considerable
effectiveness
Clearly expresses and
organizes ideas and
answers, using
appropriate
vocabulary and
mathematical units
with a high degree of
effectiveness
Application Applies knowledge
and skills in both,
familiar and
unfamiliar contexts,
and is able to
connect learning
with real-world
experiences with
little effectiveness
Applies knowledge
and skills in both,
familiar and
unfamiliar contexts,
and is able to connect
learning with real-
world experiences
with some
effectiveness
Applies knowledge
and skills in both,
familiar and
unfamiliar contexts,
and is able to connect
learning with real-
world experiences
with considerable
effectiveness
Applies knowledge
and skills in both,
familiar and
unfamiliar contexts,
and is able to connect
learning with real-
world experiences
with a high degree of
effectiveness
CANADA’S WONDERLAND – Math Grade 8 11
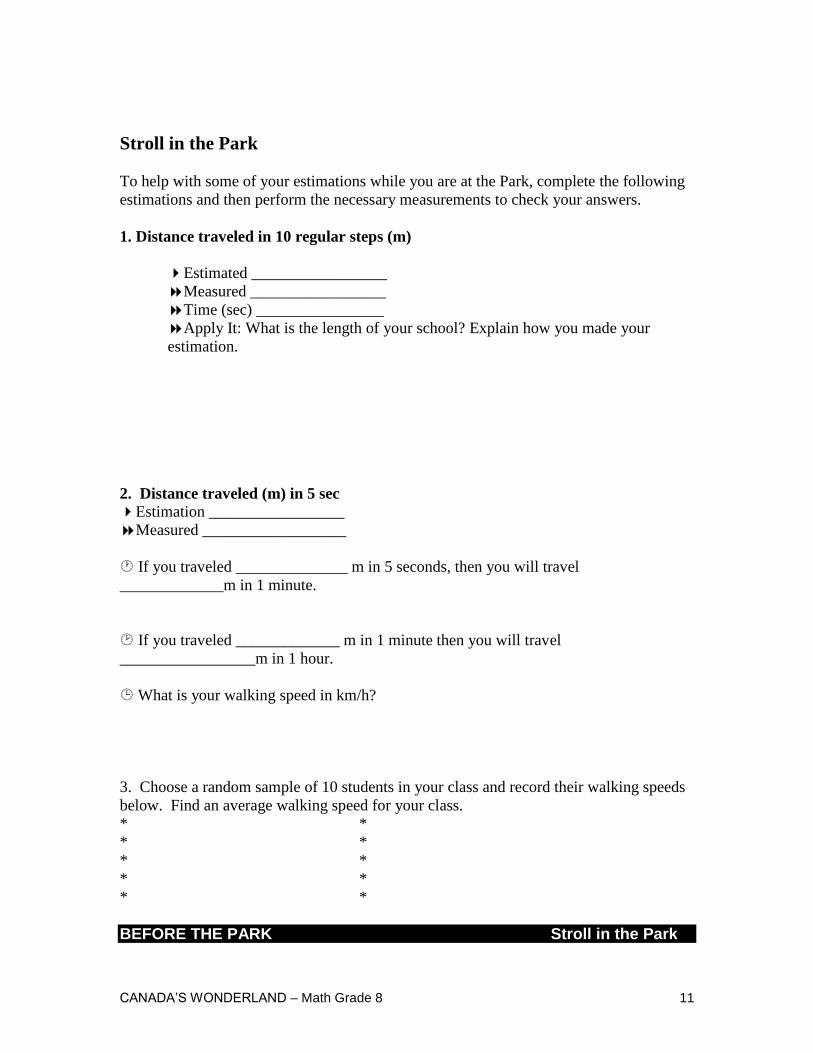
Stroll in the Park
To help with some of your estimations while you are at the Park, complete the following
estimations and then perform the necessary measurements to check your answers.
1. Distance traveled in 10 regular steps (m)
Estimated _________________
Measured _________________
Time (sec) ________________
Apply It: What is the length of your school? Explain how you made your
estimation.
2. Distance traveled (m) in 5 sec
Estimation _________________ Measured __________________
If you traveled ______________ m in 5 seconds, then you will travel
_____________m in 1 minute.
If you traveled _____________ m in 1 minute then you will travel
_________________m in 1 hour.
What is your walking speed in km/h?
3. Choose a random sample of 10 students in your class and record their walking speeds
below. Find an average walking speed for your class.
* *
* *
* *
* *
* *
BEFORE THE PARK Stroll in the Park
CANADA’S WONDERLAND – Math Grade 8 12
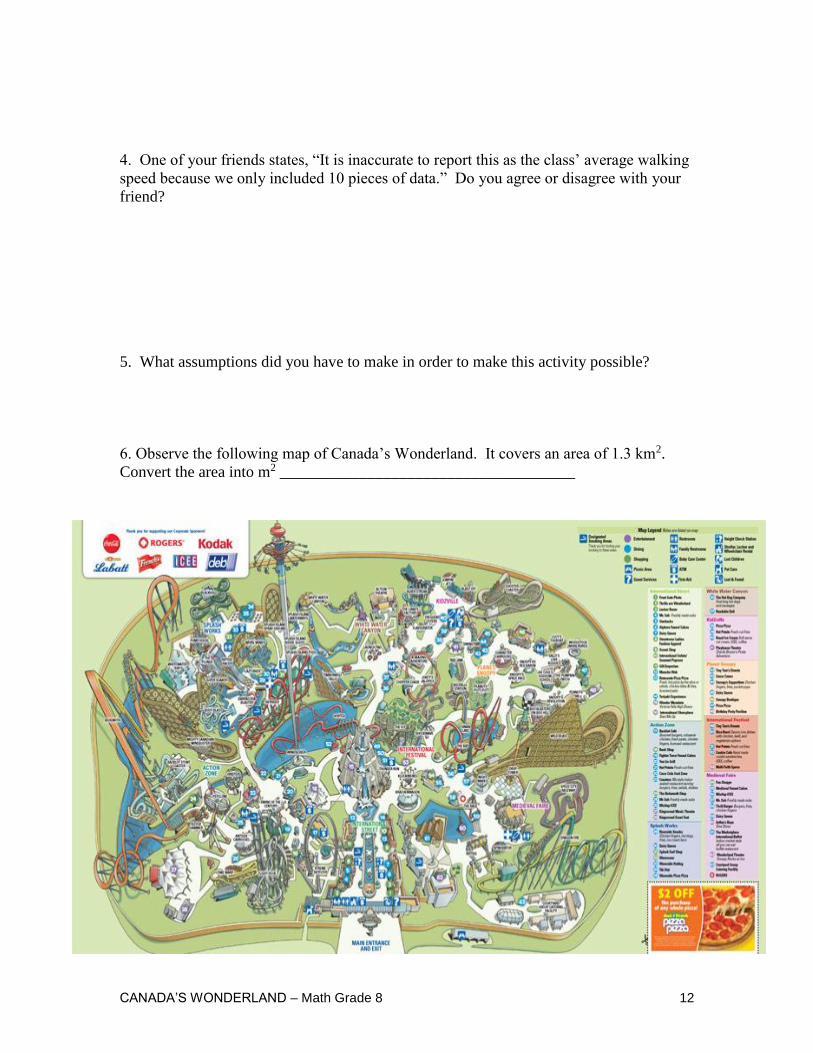
4. One of your friends states, “It is inaccurate to report this as the class’ average walking
speed because we only included 10 pieces of data.” Do you agree or disagree with your
friend?
5. What assumptions did you have to make in order to make this activity possible?
6. Observe the following map of Canada’s Wonderland. It covers an area of 1.3 km2.
Convert the area into m2 _____________________________________
CANADA’S WONDERLAND – Math Grade 8 13
BEFORE THE PARK Stroll in the Park
7. Estimate the approximate dimensions, in meters, of Canada’s Wonderland? Explain
how you determined your answer.
8. Assume that Canada’s Wonderland was a rectangle and the length was double the
width.
a) Write an algebraic expression to determine the total area of the Park.
8b) Fill in the following table using a “guess and check” method to try and find values
that will total the area of Canada’s Wonderland.
Length Width Area
(length x width) Difference between
actual area
8c) Using the expression in question 8, develop an equation and solve for the actual
dimensions of the Park.
CANADA’S WONDERLAND – Math Grade 8 14
BEFORE THE PARK Stroll in the Park
9. A scale is a ratio comparing the distance on a map with the actual “real life” distance.
For example 1:1000 means 1 cm on the map is equal to 1000 cm in real life. What is the
scale on the Canada’s Wonderland map?
CANADA’S WONDERLAND – Math Grade 8 15
BEFORE THE PARK Round & Round
Round & Round
To help with some of your estimations while you are at the Park, complete the following
and then perform the necessary measurements to check your answers.
1. Height (cm)
Estimated__________________
Measured__________________
Apply It: How high is the ceiling in your classroom? Explain how you made
your estimation.
2. Wing Span
Distance from left hand to right hand when arms are fully extended to the sides (cm)
Estimated _________________
Measured _________________
Apply It: How wide is your classroom? Explain how you made your estimation.
3. Open a compass to any length and draw a circle in the space below. Make 3 points on
the circle and label them A, B and C. Label the centre of the circle D.
CANADA’S WONDERLAND – Math Grade 8 16
BEFORE THE PARK Round & Round
4. What is the relationship between points A, B and C and the centre D?
5. Estimate the circumference of the circle. Explain how you made your estimation
6. Estimate the area of the circle. Explain how you made your estimation
7. Suppose this circle was a scale (1:10) drawing for a tire that was going to be used on
your bicycle. How many complete revolutions would the wheel make if you were to ride
your bike to Canada’s Wonderland?
CANADA’S WONDERLAND – Math Grade 8 17
BEFORE THE PARK Money in my Pocket
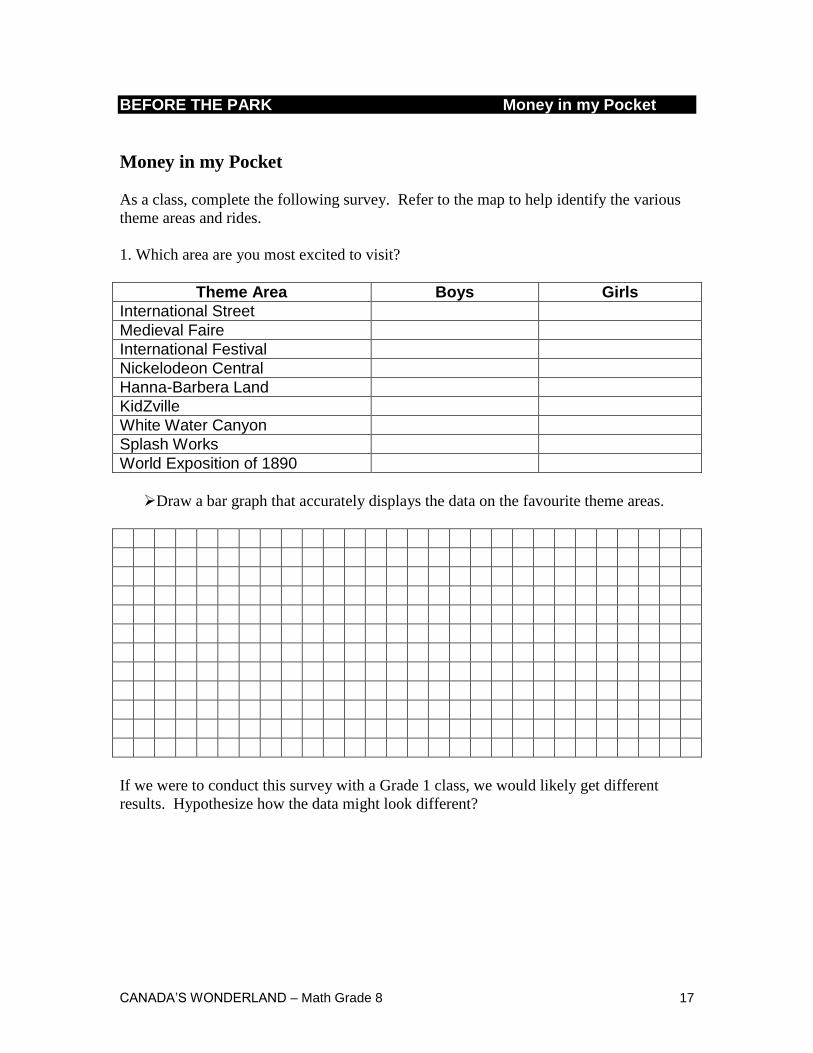
Money in my Pocket
As a class, complete the following survey. Refer to the map to help identify the various
theme areas and rides.
1. Which area are you most excited to visit?
Theme Area Boys Girls
International Street
Medieval Faire
International Festival
Nickelodeon Central
Hanna-Barbera Land
KidZville
White Water Canyon
Splash Works
World Exposition of 1890
Draw a bar graph that accurately displays the data on the favourite theme areas.
If we were to conduct this survey with a Grade 1 class, we would likely get different
results. Hypothesize how the data might look different?
CANADA’S WONDERLAND – Math Grade 8 18
BEFORE THE PARK Money in my Pocket
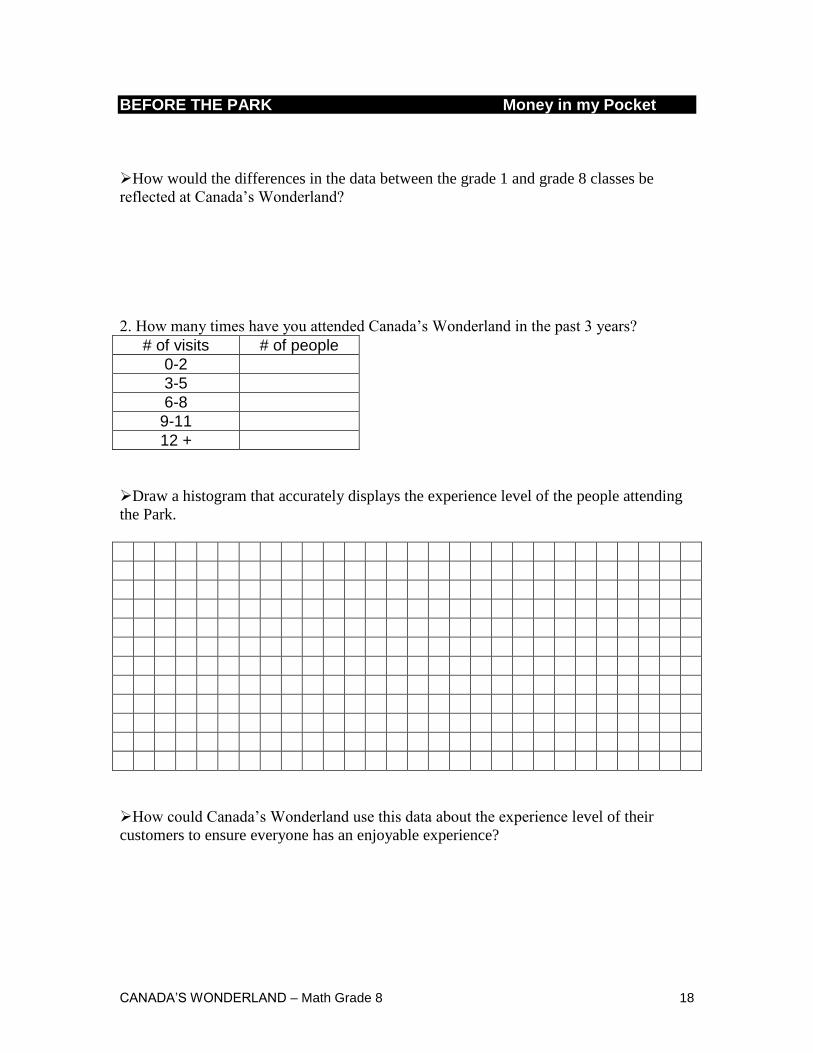
How would the differences in the data between the grade 1 and grade 8 classes be
reflected at Canada’s Wonderland?
2. How many times have you attended Canada’s Wonderland in the past 3 years?
# of visits # of people
0-2
3-5
6-8
9-11
12 +
Draw a histogram that accurately displays the experience level of the people attending
the Park.
How could Canada’s Wonderland use this data about the experience level of their
customers to ensure everyone has an enjoyable experience?
CANADA’S WONDERLAND – Math Grade 8 19
GRADE 8 MATH
AMUSEMENT RIDE ACTIVITIES
AT THE PARK
SUMMATIVE ASSESSMENT

CANADA’S WONDERLAND – Math Grade 8 20
AT THE PARK A Stroll in the Park
A Stroll in the Park
Based on the “Before the Park” activity, you found that the approximate dimensions of
Canada’s Wonderland are as follows:
Length__________________________________
Width___________________________________
Map Scale_______________________________
1 a. Based on this data, how long should it take you to walk from Psyclone to Drop
Tower? Show all your work.
CANADA’S WONDERLAND – Math Grade 8 21
AT THE PARK A Stroll in the Park
1b. Go for a stroll from Psyclone to Drop Tower, or in the opposite direction, and time
to see how long it actually takes.
Estimated Time __________________
Actual Time ____________________
1c. Were your times similar? Provide reasons to support your findings
2. Use the scale you developed to estimate the length of the track of Behemoth.
How long did it take the Behemoth train to make a complete trip from station to
station?
Suppose Behemoth travels at an average speed of 17 km/h from the time it leaves the
station until it returns, how long is the track?
3. You and your friends are debating which of the following is the fastest roller coaster at
Canada’s Wonderland:
You think it is Vortex at 720 m long.
Richie is sure it is Mighty Canadian Minebuster, one of the original roller coasters, it
covers a distance of 1167 m.
Suzette just came off Flight Deck and has assured both of you that it is the fastest at
covering its 689 m of track.
Who is correct? Walk to the rides and time one trip around the track from start to finish.
Calculate and show all your work.
CANADA’S WONDERLAND – Math Grade 8 22
AT THE PARK Round & Round
Round & Round
1. You and your friends decide to ride Sledge Hammer. Sledge Hammer stands 25.9m
above the ground. Estimate the length of each arm extending from the center. Explain
how you made the estimation.
2. What is the circumference of Sledge Hammer, based on your estimation from #1,
when the arms are fully extended?
3. How long did the ride last (sec)?
4. How far did each person travel while on the ride? Explain your answer.
5. What was the average speed (km/h) of Sledge Hammer?
CANADA’S WONDERLAND – Math Grade 8 23
AT THE PARK Round & Round
Challenge Travel over to Shockwave and observe how the ride works. On one ride,
how far would you travel (Hint: This is a 2 part question).
If you were sitting on the outside seat compared to the inside seat, would your answer
change? Explain why or why not
CANADA’S WONDERLAND – Math Grade 8 24
AT THE PARK Money in my Pocket
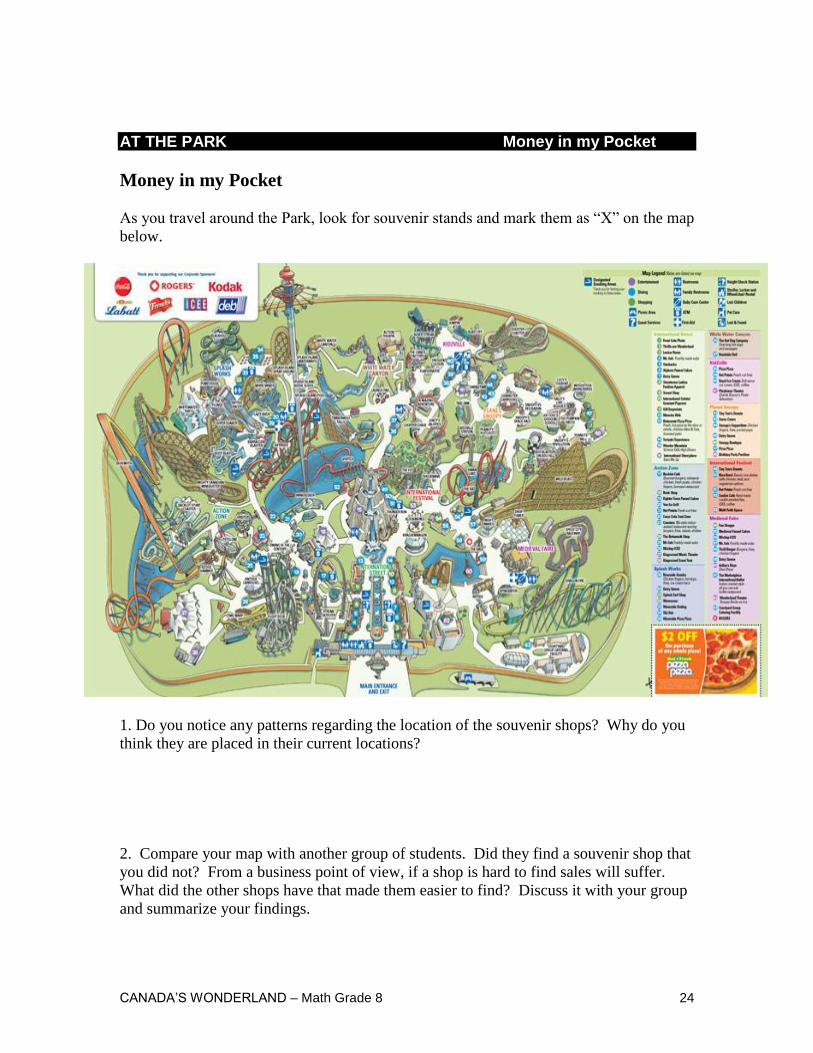
Money in my Pocket
As you travel around the Park, look for souvenir stands and mark them as “X” on the map
below.
1. Do you notice any patterns regarding the location of the souvenir shops? Why do you
think they are placed in their current locations?
2. Compare your map with another group of students. Did they find a souvenir shop that
you did not? From a business point of view, if a shop is hard to find sales will suffer.
What did the other shops have that made them easier to find? Discuss it with your group
and summarize your findings.

CANADA’S WONDERLAND – Math Grade 8 25
AT THE PARK Money in my Pocket
Stop at a souvenir shop for 5 minutes and record the following information.
Find 2 other souvenir shops in different theme areas and fill in the remaining columns:
Location (Theme
Area )
Merchandise (what are they selling)
Number of people who stop and look at merchandise
Number of people who make purchases
Number of attractions within a 50m radius
Average price of souvenir (Sample
minimum of 3 items)
Time of day
CANADA’S WONDERLAND – Math Grade 8 26
AT THE PARK Money in my Pocket
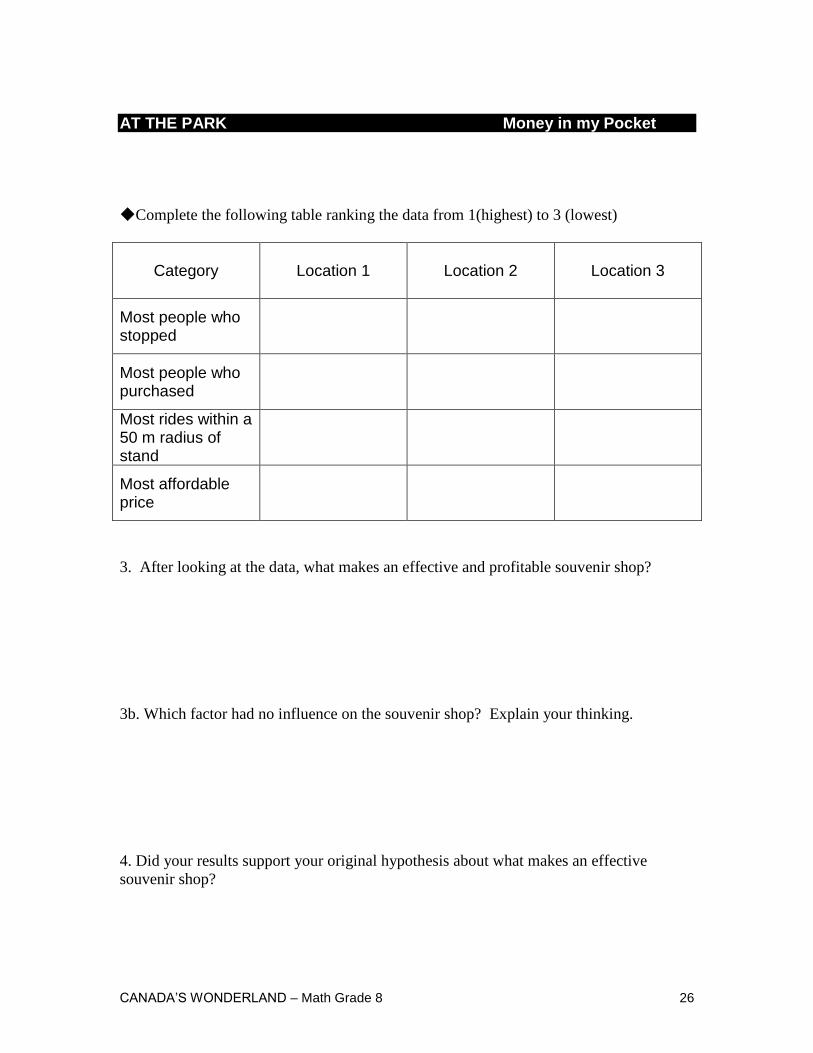
Complete the following table ranking the data from 1(highest) to 3 (lowest)
Category Location 1 Location 2
Location 3
Most people who stopped
Most people who purchased
Most rides within a 50 m radius of stand
Most affordable price
3. After looking at the data, what makes an effective and profitable souvenir shop?
3b. Which factor had no influence on the souvenir shop? Explain your thinking.
4. Did your results support your original hypothesis about what makes an effective
souvenir shop?
CANADA’S WONDERLAND – Math Grade 8 27
SUMMATIVE ASSESSMENT
Canada’s Wonderland
Concession Analysis
Prior Classroom Learning Required
Problem Solving and Reasoning Skills
Algebraic Expression, Equations and Patterning
Data Management and Making Predictions
Properties of Circles
Ratio, Rate and Proportions
Number Sense
Canada’s Wonderland is looking for a highly energetic, team member to use their
mathematical skills to examine the placement of new souvenir stands throughout
the park. (For purposes of activities)
Using a variety of techniques, which you mastered over your Grade 8 year, you
will be responsible for gathering data, making estimations, making decisions and
plotting the new locations of the stands.

CANADA’S WONDERLAND – Math Grade 8 28
SUMMATIVE ASSESSMENT CA: Location, Location, Location
Canada’s Wonderland Concession Analysis
Location, Location, Location
Canada’s Wonderland is looking for new locations for their souvenir stands. Reflect
on your observations in the “Money in My Pocket” activity during your visit to
Canada’s Wonderland. Using a red marker, place an “X” where you hypothesize the
new stands should go. Provide a brief description of your reasoning of why you
decided on those locations.
________________________________________________________________________
________________________________________________________________________
________________________________________________________________________
________________________________________________________________________
________________________________________________________________________
________________________________________________________________________
________________________________________________________________________
________________________________________________________________________
________________________________________________________________________
CANADA’S WONDERLAND – Math Grade 8 29
________________________________________________________________________
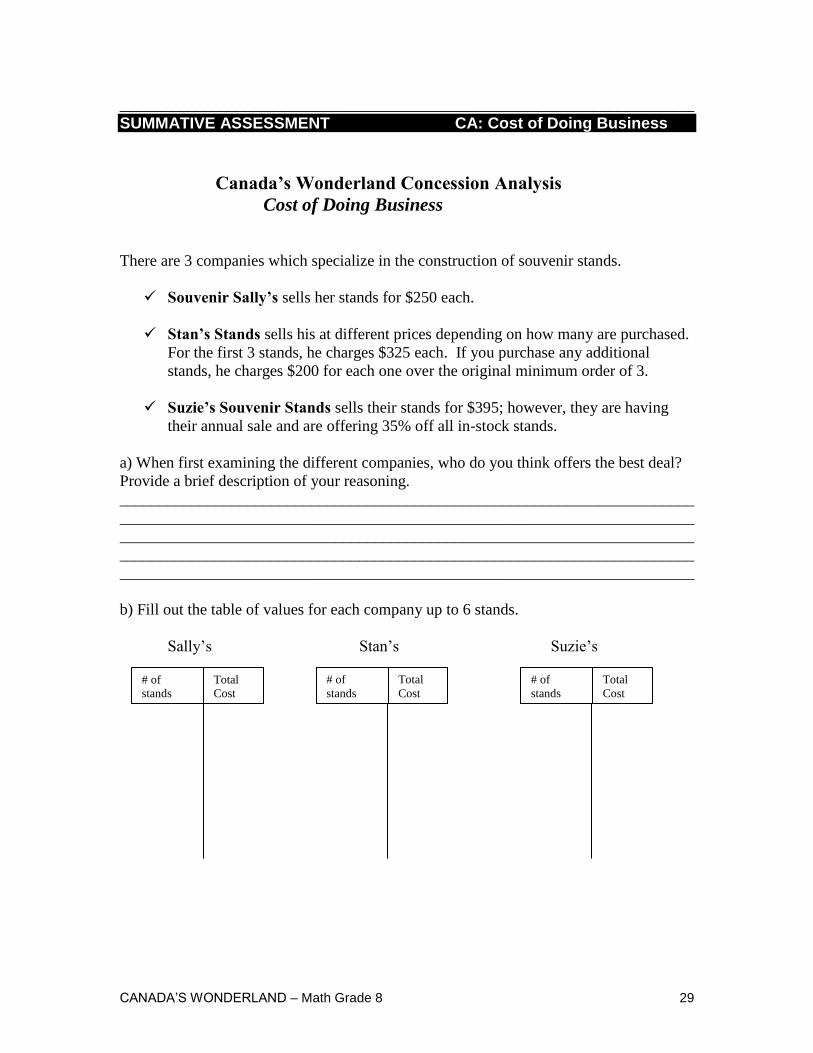
SUMMATIVE ASSESSMENT CA: Cost of Doing Business
Canada’s Wonderland Concession Analysis
Cost of Doing Business
There are 3 companies which specialize in the construction of souvenir stands.
Souvenir Sally’s sells her stands for $250 each.
Stan’s Stands sells his at different prices depending on how many are purchased.
For the first 3 stands, he charges $325 each. If you purchase any additional
stands, he charges $200 for each one over the original minimum order of 3.
Suzie’s Souvenir Stands sells their stands for $395; however, they are having
their annual sale and are offering 35% off all in-stock stands.
a) When first examining the different companies, who do you think offers the best deal?
Provide a brief description of your reasoning.
________________________________________________________________________
________________________________________________________________________
________________________________________________________________________
________________________________________________________________________
________________________________________________________________________
b) Fill out the table of values for each company up to 6 stands.
Sally’s Stan’s Suzie’s
# of
stands
Total
Cost
# of
stands
Total
Cost
# of
stands
Total
Cost
CANADA’S WONDERLAND – Math Grade 8 30
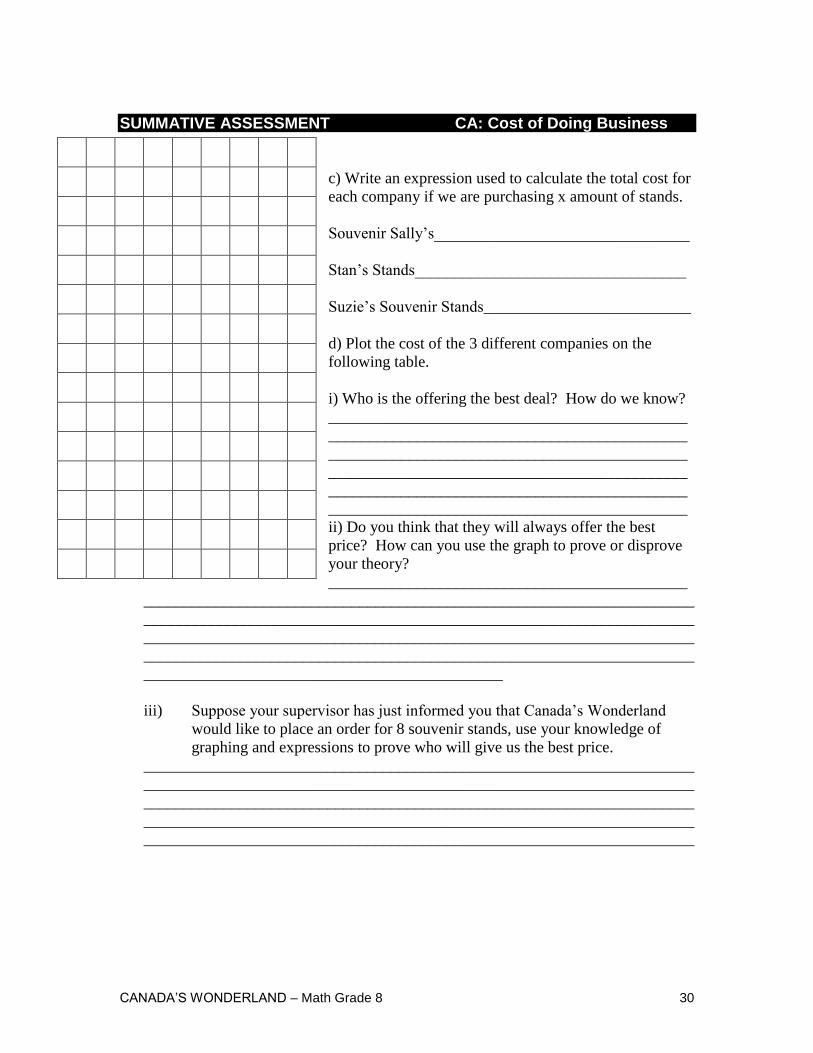
SUMMATIVE ASSESSMENT CA: Cost of Doing Business
c) Write an expression used to calculate the total cost for
each company if we are purchasing x amount of stands.
Souvenir Sally’s________________________________
Stan’s Stands__________________________________
Suzie’s Souvenir Stands__________________________
d) Plot the cost of the 3 different companies on the
following table.
i) Who is the offering the best deal? How do we know?
_____________________________________________
_____________________________________________
_____________________________________________
_____________________________________________
_____________________________________________
_____________________________________________
ii) Do you think that they will always offer the best
price? How can you use the graph to prove or disprove
your theory?
_____________________________________________
_____________________________________________________________________
_____________________________________________________________________
_____________________________________________________________________
_____________________________________________________________________
_____________________________________________
iii) Suppose your supervisor has just informed you that Canada’s Wonderland
would like to place an order for 8 souvenir stands, use your knowledge of
graphing and expressions to prove who will give us the best price.
_____________________________________________________________________
_____________________________________________________________________
_____________________________________________________________________
_____________________________________________________________________
_____________________________________________________________________
CANADA’S WONDERLAND – Math Grade 8 31
SUMMATIVE ASSESSMENT CA: Circle the Wagons
Canada’s Wonderland Concession Analysis
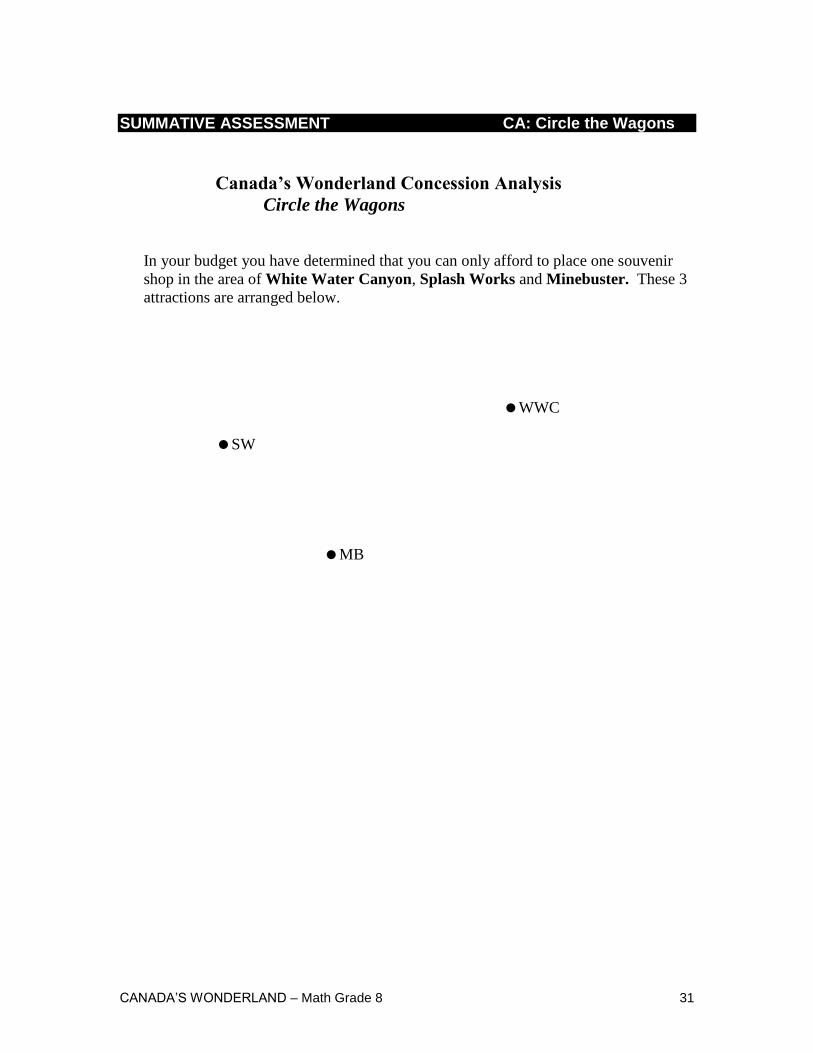
Circle the Wagons
In your budget you have determined that you can only afford to place one souvenir
shop in the area of White Water Canyon, Splash Works and Minebuster. These 3
attractions are arranged below.
WWC
SW
MB
CANADA’S WONDERLAND – Math Grade 8 32
SUMMATIVE ASSESSMENT CA: Circle the Wagons
Place a red X where you would place the shop to service all three areas. Provide a
brief description of your reasoning.
_____________________________________________________________________
_____________________________________________________________________
_____________________________________________________________________
_____________________________________________________________________
_____________________________________________________________________
Your supervisor is impressed with your choice, but she wants to be sure that it is
equally accessible from all areas. You study the problem carefully, then exclaim,
“Eureka! I can use my knowledge of circles to provide you with the proof you need.
All I have to do is …
_____________________________________________________________________
_____________________________________________________________________
_____________________________________________________________________
_____________________________________________________________________
_____________________________________________________________________
_____________________________________________________________________
_____________________________________________________________________
___________________________________________________________________.”
Your supervisor nods with approval and states “If you keep this up, we will have no
choice but to make you our full-time park mathematician!”
CANADA’S WONDERLAND – Math Grade 8 33
SUMMATIVE ASSESSMENT CA: Let’s Make a Deal
Canada’s Wonderland Concession Analysis
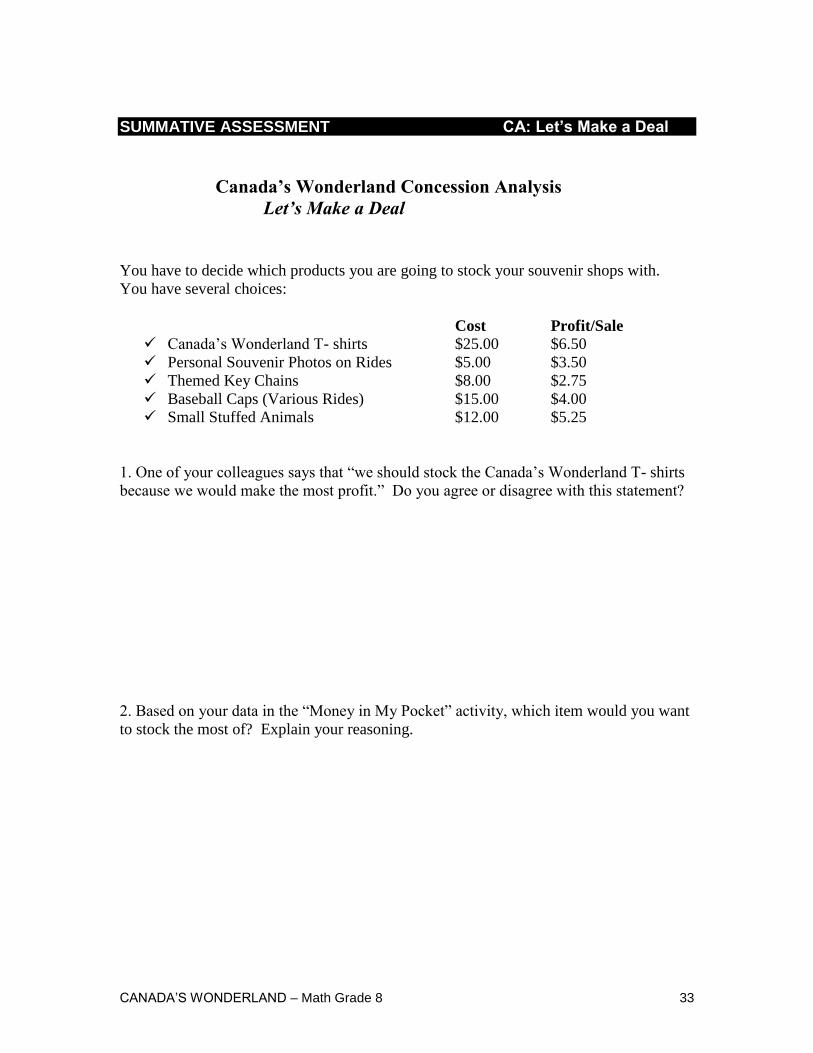
Let’s Make a Deal
You have to decide which products you are going to stock your souvenir shops with.
You have several choices:
Cost Profit/Sale Canada’s Wonderland T- shirts $25.00 $6.50
Personal Souvenir Photos on Rides $5.00 $3.50
Themed Key Chains $8.00 $2.75
Baseball Caps (Various Rides) $15.00 $4.00
Small Stuffed Animals $12.00 $5.25
1. One of your colleagues says that “we should stock the Canada’s Wonderland T- shirts
because we would make the most profit.” Do you agree or disagree with this statement?
2. Based on your data in the “Money in My Pocket” activity, which item would you want
to stock the most of? Explain your reasoning.
CANADA’S WONDERLAND – Math Grade 8 34
SUMMATIVE ASSESSMENT CA: Let’s Make a Deal
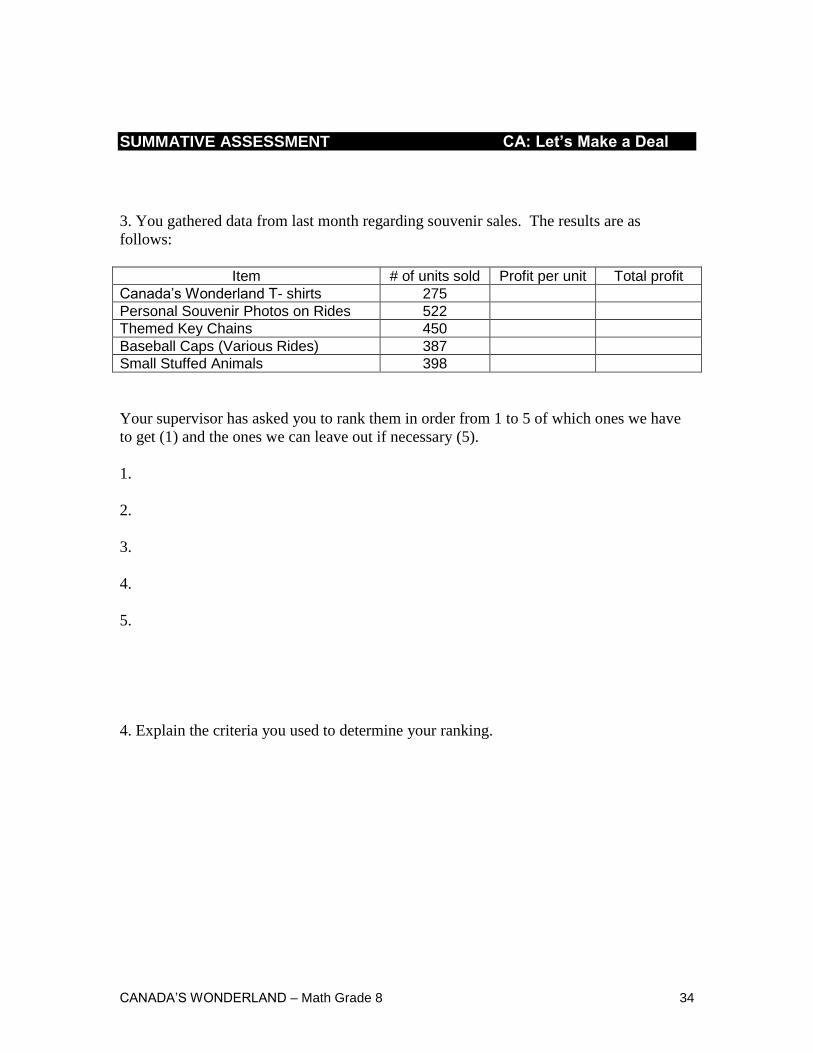
3. You gathered data from last month regarding souvenir sales. The results are as
follows:
Item # of units sold Profit per unit Total profit
Canada’s Wonderland T- shirts 275
Personal Souvenir Photos on Rides 522
Themed Key Chains 450
Baseball Caps (Various Rides) 387
Small Stuffed Animals 398
Your supervisor has asked you to rank them in order from 1 to 5 of which ones we have
to get (1) and the ones we can leave out if necessary (5).
1.
2.
3.
4.
5.
4. Explain the criteria you used to determine your ranking.
CANADA’S WONDERLAND – Math Grade 8 35
SUMMATIVE ASSESSMENT CA: Let’s Make a Deal
5. Every morning, the souvenirs need to be restocked within an hour. Your employee has
stated that this is impossible and he needs a $1000 motorized vehicle to complete the job
in a timelier manner. He is responsible for stocking the shops along the southern and
western edges of the Park. He walks at a pace of 3.5 km/h. How long will it take him to
complete this trip? State your answer in hours and minutes.
6. Did you have to make any assumptions to answer this question?
CANADA’S WONDERLAND – Math Grade 8 36
SUMMATIVE ASSESSMENT CA: The Final Analysis
Canada’s Wonderland Concession Analysis
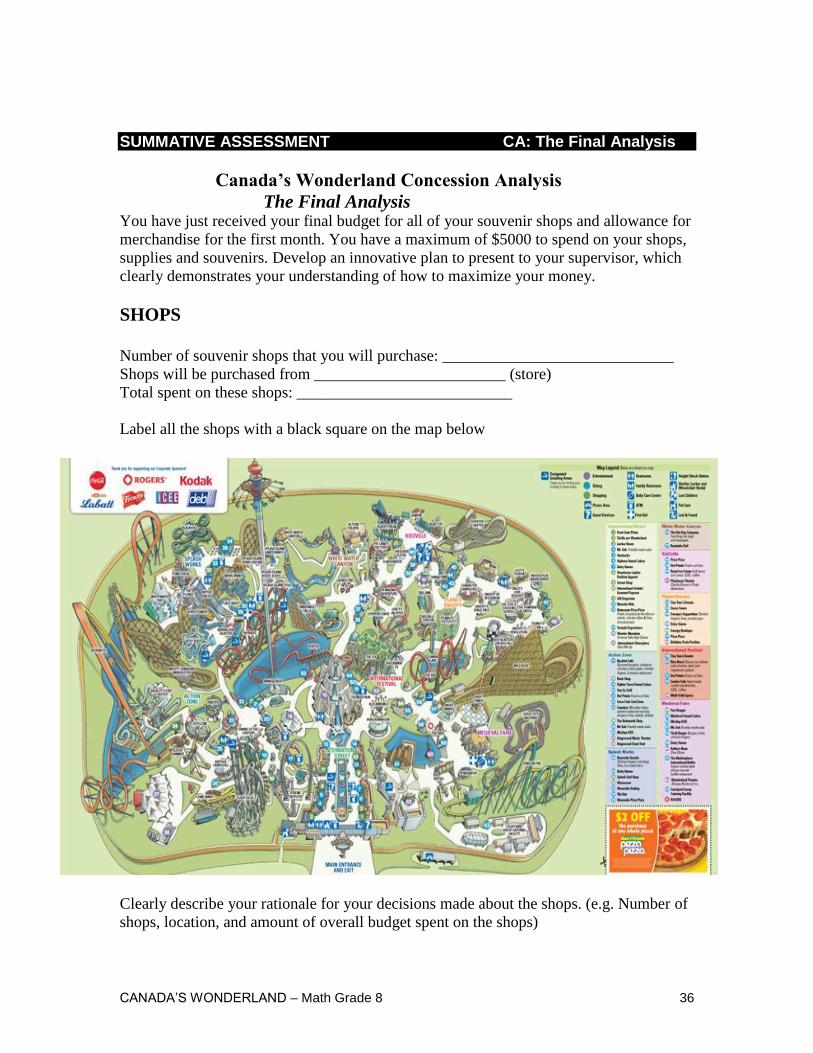
The Final Analysis You have just received your final budget for all of your souvenir shops and allowance for
merchandise for the first month. You have a maximum of $5000 to spend on your shops,
supplies and souvenirs. Develop an innovative plan to present to your supervisor, which
clearly demonstrates your understanding of how to maximize your money.
SHOPS
Number of souvenir shops that you will purchase: _____________________________
Shops will be purchased from ________________________ (store)
Total spent on these shops: ___________________________
Label all the shops with a black square on the map below
Clearly describe your rationale for your decisions made about the shops. (e.g. Number of
shops, location, and amount of overall budget spent on the shops)
CANADA’S WONDERLAND – Math Grade 8 37
SUMMATIVE ASSESSMENT CA: The Final Analysis
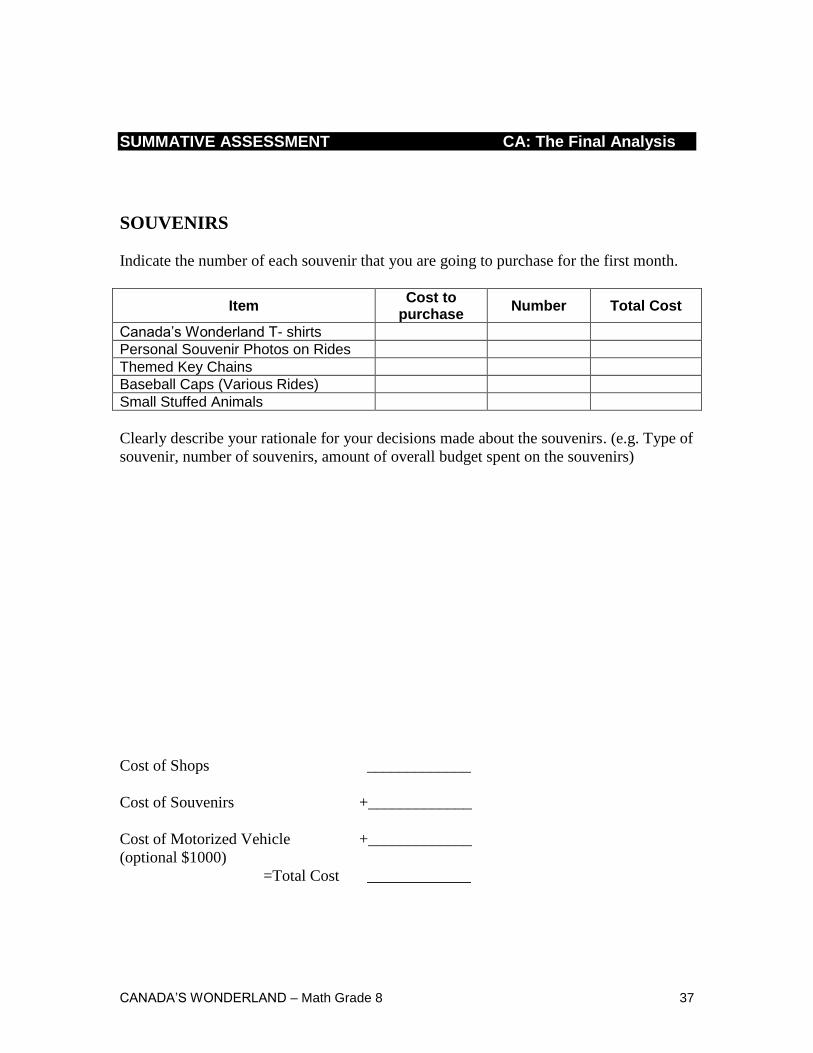
SOUVENIRS
Indicate the number of each souvenir that you are going to purchase for the first month.
Item Cost to
purchase Number Total Cost
Canada’s Wonderland T- shirts
Personal Souvenir Photos on Rides
Themed Key Chains
Baseball Caps (Various Rides)
Small Stuffed Animals
Clearly describe your rationale for your decisions made about the souvenirs. (e.g. Type of
souvenir, number of souvenirs, amount of overall budget spent on the souvenirs)
Cost of Shops _____________
Cost of Souvenirs +_____________
Cost of Motorized Vehicle +_____________
(optional $1000)
=Total Cost _____________