
General Session & Market Update - Ohio State...
16
General Session & Market Update 2016 CPIM Academy
-
Upload
truongxuyen -
Category
Documents
-
view
215 -
download
2
Transcript of General Session & Market Update - Ohio State...
General Session & Market Update
2016
CP
IM A
cad
em
y

Interest Rate Environment YTD the Yield Curve has Flattened
Source: Bloomberg as of 10/24/16
2

2-Year T-Note What does it tell us?
3
Source: Bloomberg as of 10/24/16

Yield Comparison STAR Ohio vs. Treasury vs. Avg Money Fund
4 4
-0.10
0.00
0.10
0.20
0.30
0.40
0.50
0.60 STAR Treasury Bills Avg Money Fund
Dec-14 Mar-15 Jun-15 Sep-15 Dec-15 Mar-16 Jun-16 Sep-16

Over $6 billion in Deposits Composition
8/31/2015
Commercial Paper - 32%Gov't Bond - 28%Repo - 8%Cash - 25%Corporate Bond - 7%
8/31/2016
Cash - 42%Commercial Paper - 39%Gov't Bond - 8%Corporate Bond - 10%Repo - 1%
5
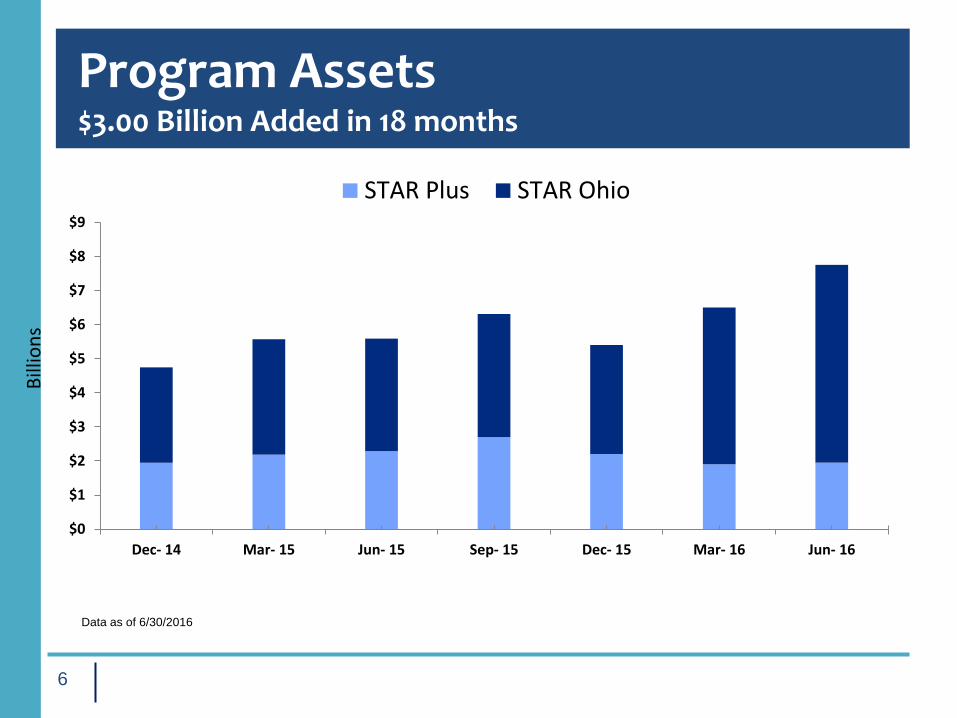
Program Assets $3.00 Billion Added in 18 months
Bill
ion
s
Data as of 6/30/2016
6
$0
$1
$2
$3
$4
$5
$6
$7
$8
$9
Dec- 14 Mar- 15 Jun- 15 Sep- 15 Dec- 15 Mar- 16 Jun- 16
STAR Plus STAR Ohio

STAR Ohio vs. STAR Plus
• Yield is based on portfolio of underlying securities
• Yield of securities is largely based on economic factors and expectations for interest rates, as well as credit risk
• As securities mature, the rate at which they can be reinvested depends on economic conditions at that time
• Current securities include: US Treasuries, US Government Agencies, Commercial Paper, Corporate Bonds, Repurchase Agreements, and Money Market Funds
STAR Ohio STAR Plus • Yield is based on underlying bucket of bank
deposit account
• Yield of bank deposit accounts is based upon each banks current desire for deposits
• As banks demand for deposits increase, the bank will increase the rate it pays in order to attract deposits
• As banks demand for deposits decreases, the bank will decrease the rate it pays in order to push deposits out of the bank
• Economic outlook has less affect on bank rates
7
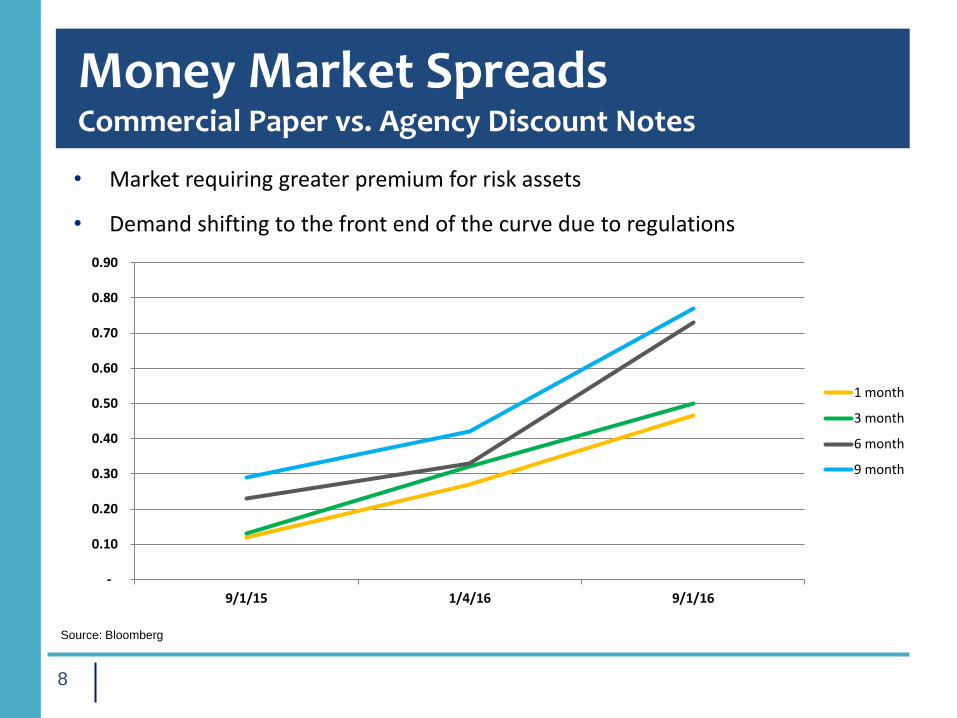
Money Market Spreads Commercial Paper vs. Agency Discount Notes
Source: Bloomberg
• Market requiring greater premium for risk assets
• Demand shifting to the front end of the curve due to regulations
8
-
0.10
0.20
0.30
0.40
0.50
0.60
0.70
0.80
0.90
9/1/15 1/4/16 9/1/16
1 month
3 month
6 month
9 month
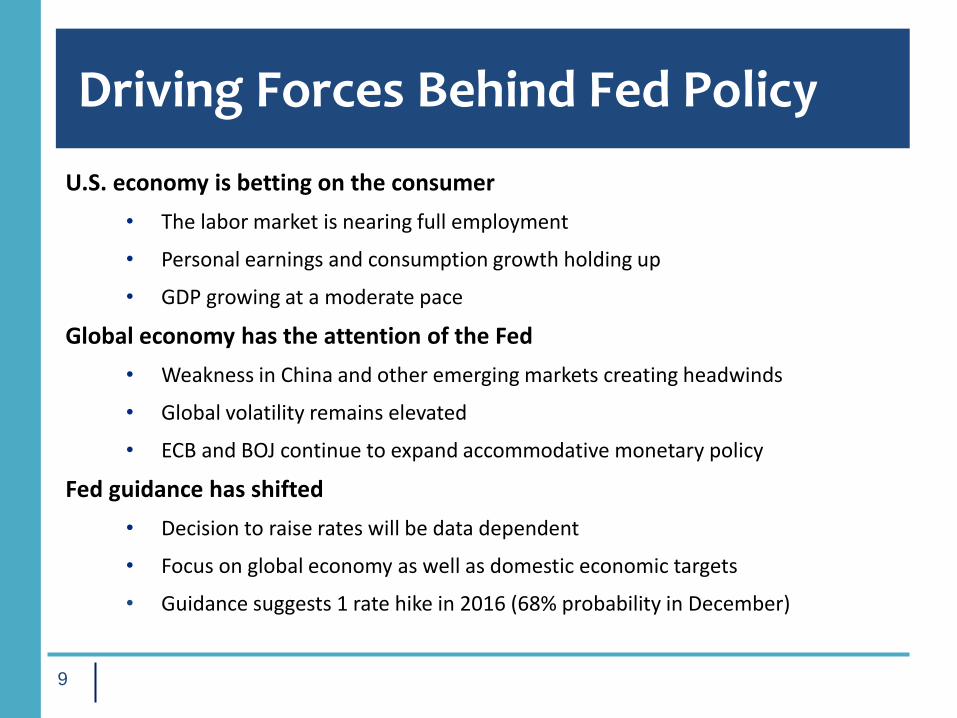
Driving Forces Behind Fed Policy
U.S. economy is betting on the consumer
• The labor market is nearing full employment
• Personal earnings and consumption growth holding up
• GDP growing at a moderate pace
Global economy has the attention of the Fed
• Weakness in China and other emerging markets creating headwinds
• Global volatility remains elevated
• ECB and BOJ continue to expand accommodative monetary policy
Fed guidance has shifted
• Decision to raise rates will be data dependent
• Focus on global economy as well as domestic economic targets
• Guidance suggests 1 rate hike in 2016 (68% probability in December)
9

Fed Funds Implied Probability of Rate Hike
Source: Bloomberg
• The Fed Funds implied probability of a rate increase in November below 20%
• Probability of rate hike in 2016 is over 70%
10
0.0%
10.0%
20.0%
30.0%
40.0%
50.0%
60.0%
70.0%
80.0%
90.0%
100.0%
Sep Oct Dec Feb Mar
Fed Funds Implied Probability of Rate Hike
12/31/15
9/1/16
Fed Meetings

U.S. Economic Factors
Employment • September unemployment rate at 5.0% • Slight increase from previous month • Participation rate remains low
Inflation • August 2016 Core PCE was 1.7%
• Continues to be below the FOMC threshold of 2%
Other • Retail Sales figures have been mixed • Manufacturing in U.S. is contracting
11

U.S. Economic Data
Upcoming economic data releases
• 10/28 GDP Annualized QoQ
• 10/31 PCE Core YoY
• 11/02 FOMC Rate Decision
• 11/04 Change in Nonfarm Payrolls
12

Negative Interest Rate Policy Current Global Rates
Source: Bloomberg
• 5 central banks have implemented NIRP
• Motivation is to stimulate economic growth by increasing credit
• Effectiveness and consequences yet to be determined
13
Country 2 year 3 year 5 year 7 year 10 year 15 year 30 year
US 0.79 0.93 1.22 1.51 1.67 2.40
Canada 0.58 0.60 0.72 0.88 1.16 1.77
UK 0.17 0.17 0.30 0.52 0.86 1.23 1.50
France -0.60 -0.55 -0.36 -0.19 0.30 0.61 1.10
Germany -0.65 -0.64 -0.49 -0.38 0.01 0.16 0.60
Sweden -0.61 -0.24 -0.11 0.27
Switzerland -1.08 -1.02 -0.85 -0.68 -0.49 -0.30 -0.03
Japan -0.22 -0.20 -0.17 -0.17 -0.03 0.17 0.50
Australia 1.54 1.52 1.63 1.80 1.96 2.34
As of 5/9/2016

Bank Regulations
Basel III
Represents the most complete overhaul of U.S. bank capital standards since the U.S. adoption of Basel I in 1989.
Requires banks to meet increased capital ratio targets, risk weighted asset requirements, and liquidity standards (LCR, NSFR).
Volcker
Part of Dodd Frank Act prohibiting banks from engaging in impermissible proprietary trading and covered fund purchases.
Eliminates the capacity for banks to engage in risky, proprietary trading funded by FDIC insured bank deposits.
Money Market Reform
Institutional municipal and prime money market mutual funds moving to floating NAV and instituting redemption gates and fees to bolster liquidity.
Government money market funds will be investment vehicle of choice for operating funds.
14

Prime Money Market Funds
What are they • Traditional money market funds are a type of mutual fund developed in the
1970s as an option for investors to purchase a pool of securities that generally provided higher returns than interest-bearing bank accounts.
• Prime money market funds invests generally in floating/variable rate debt and commercial paper of corporations and securities of the US government and agencies.
Reform • New rules would require institutional prime and municipal money market
funds to move from a stable $1.00 price per share to a floating net asset value.
• Prime money market funds are required to comply with these elements by October 14, 2016.
15

Bond Investment Strategies Ladder vs. Barbell
Ladder Strategy / Asset-Liability Match
Staggers maturities of bonds in a portfolio and
sets a schedule for reinvestment of proceeds
Benefits: • Periodic maturities allow for more investing
flexibility and control over liquidity
• Interest rate volatility reduced as portfolio is
spread across maturities and coupons
• Proceeds from the maturing investment can
be used for the scheduled draw, or reinvested
in another investment
Barbell Strategy
Utilizes only short-term investments and
longer term bonds
Benefits: • Longer-term bonds provide higher rates
• Shorter-term bonds provide liquidity
• Shorter-term bonds can offset impacts of a
rising rate environment as the maturing
bonds can be reinvested at higher rates
16


