Effect of microstructure on induced cracking behaviour of ... SCIENCE 105 Effect of microstructure...
149
• V I S I O N S • S C I E N C E • T E C H N O L O G Y • R E S E A R C H H I G H L I G H T S Dissertation 105 Effect of microstructure on low temperature hydrogen- induced cracking behaviour of nickel-based alloy weld metals Matias Ahonen
Transcript of Effect of microstructure on induced cracking behaviour of ... SCIENCE 105 Effect of microstructure...
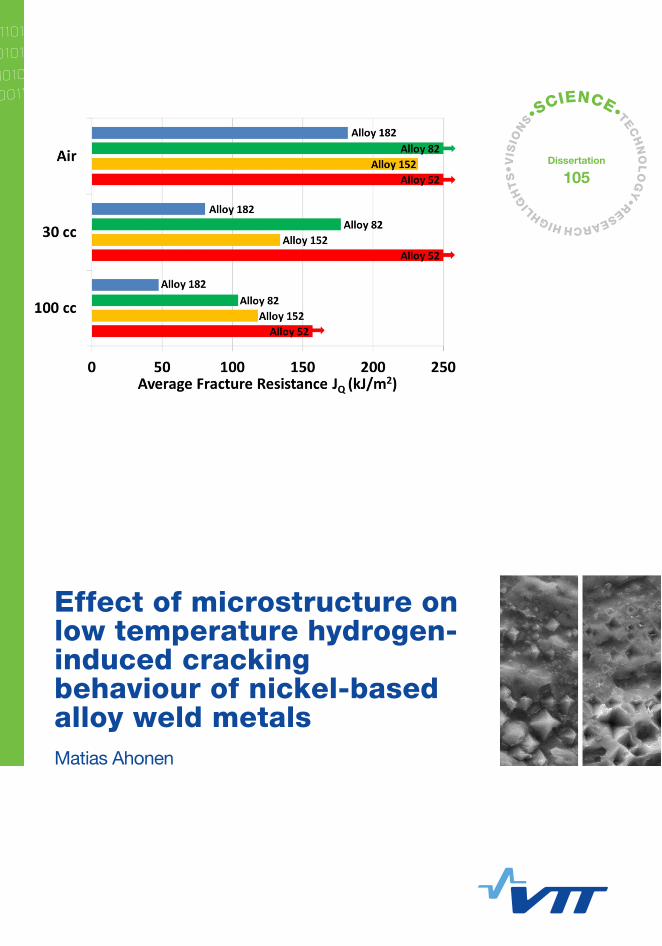
Effect of microstructure on low temperature hydrogen-induced cracking behaviour of nickel-based alloy weld metals Various nickel-based materials are susceptible to low temperature crack propagation (LTCP) in simulated PWR (pressurized water reactor) water at a temperature range of about 50 to 150 °C. Although no LTCP related incidents have been reported in open literature thus far, the understanding of the possible material degradation phenomena is of great importance in order to ensure safe operation of nuclear power plants. The experimental part of this work was focused on LTCP susceptibility of nickel-based Alloy 182, 82, 152 and 52 weld metals. Both all-weld metals and dissimilar metal weld (DMW) mock-ups were studied. The obtained J-R test results show that Alloy 182 is the most susceptible nickel-based weld metal to LTCP, whereas Alloy 52 retains its high fracture resistance in hydrogenated water with moderate hydrogen content. However, some specimens of Alloy 52 showed a dramatic reduction of fracture resistance with high dissolved hydrogen content. A clear relation between the low fracture resistance values and intergranular/interdendritic type of fracture was observed. The different LTCP behaviour of Alloy 182 and 52 weld metals is believed to be caused mainly by different types of carbides dominating the hydrogen-induced fracture. The carbides may have an effect on hydrogen distribution at the grain/dendrite boundaries and the availability of hydrogen close to the crack tip, by acting as trapping sites for hydrogen and by affecting the strain distribution at the grain boundary area.
ISBN 978-951-38-8338-6 (Soft back ed.) ISBN 978-951-38-8339-3 (URL: http://www.vttresearch.com/impact/publications) ISSN-L 2242-119X ISSN 2242-119X (Print) ISSN 2242-1203 (Online)
VT
T S
CIE
NC
E 1
05
Effe
ct o
f mic
rostru
ctu
re o
n lo
w te
mp
era
ture
...
•VIS
ION
S•SCIENCE•TEC
HN
OL
OG
Y•RESEARCHHIGHLI
GH
TS
Dissertation
105
Effect of microstructure on low temperature hydrogen-induced cracking behaviour of nickel-based alloy weld metals Matias Ahonen
VTT SCIENCE 105
Effect of microstructure on low temperature hydrogen-induced cracking behaviour of nickel-based alloy weld metals
Matias Ahonen
VTT Technical Research Centre of Finland Ltd
Thesis for the degree of Doctor of Science (Tech.) to be presented
with due permission of the School of Engineering for public
examination and criticism in Auditorium K216, at the Aalto University
School of Engineering (Espoo, Finland), on the 18th of September,
2015, at 12 o'clock noon.
ISBN 978-951-38-8338-6 (Soft back ed.) ISBN 978-951-38-8339-3 (URL: http://www.vttresearch.com/impact/publications)
VTT Science 105
ISSN-L 2242-119X ISSN 2242-119X (Print) ISSN 2242-1203 (Online)
Copyright © VTT 2015
JULKAISIJA – UTGIVARE – PUBLISHER
Teknologian tutkimuskeskus VTT Oy PL 1000 (Tekniikantie 4 A, Espoo) 02044 VTT Puh. 020 722 111, faksi 020 722 7001
Teknologiska forskningscentralen VTT Ab PB 1000 (Teknikvägen 4 A, Esbo) FI-02044 VTT Tfn +358 20 722 111, telefax +358 20 722 7001
VTT Technical Research Centre of Finland Ltd P.O. Box 1000 (Tekniikantie 4 A, Espoo) FI-02044 VTT, Finland Tel. +358 20 722 111, fax +358 20 722 7001
Juvenes Print, Tampere 2015
3
PrefaceThis work was carried out at VTT Technical Research Centre of Finland Ltd mainlywithin the ENVIS project which was a part of the Finnish Research Programme onNuclear Power Plant Safety (SAFIR) and also to some extent within the Tekesfunded SINI project. The actual writing of this thesis was mainly funded by VTT.The financial support from VTT and other partners in the projects is greatly appre-ciated.
I would like to express my gratitude to Professor Hannu Hänninen for his guid-ance, advice and encouraging attitude towards my work. Ulla Ehrnstén is grateful-ly acknowledged for her support and for giving me a possibility to gather a goodtest matrix for this thesis. I wish to thank Wade Karlsen for pushing me forwardand being my thesis advisor at VTT. I am also grateful to Professor ToshioYonezawa for his advice and interesting discussions that we had during his stay atAalto University.
Several colleagues at VTT and Aalto University have had contributions to thiswork and their help and support has been invaluable. I would like to thank PasiVäisänen, Aki Toivonen, Esko Arilahti, Jyrki Ranta and Pekka Moilanen for theirhelp and advice in autoclave testing. I also want to thank Tapio Saukkonen, JannePakarinen, Marketta Mattila, Taru Lehtikuusi, Juha-Matti Autio and MykolaIvanchenko for helping me in the microscopy. Olga Todoshchenko and Arto Kuk-konen are gratefully acknowledged for their contributions to the hydrogen contentmeasurements. I would also like to thank Pertti Aaltonen for many interestingdiscussions that we had at the office during this work. There are probably alsoother colleagues at VTT who have had some contribution to this thesis and theirwork and support is appreciated.
Finally, I want to thank my lovely wife Sirpa. Without your support this workcould not have been completed. I want to thank you for being such an amazingwife throughout the years. I am grateful to my parents Seppo and Kaisuliina Aho-nen for being supportive during my whole life. I also want to thank Ivan Dolgov forgiving me advice for data processing, but first and foremost for being a good friendduring the time in Otaniemi and also after that.
Espoo, August 2015Matias Ahonen
4
Doctoral dissertationSupervising professor Professor Hannu Hänninen
Department of Engineering Design andProductionSchool of EngineeringAalto UniversityEspoo, Finland
Thesis advisor Ph.D. Wade KarlsenVTT Technical Research Centre of Finland LtdEspoo, Finland
Pre-examiners Professor Toshio YonezawaNew Industry Creation Hatchery CenterTohoku University, Japan
Adjunct Professor Pål EfsingMaterials Mechanics and Structural IntegrityDepartment of Solid MechanicsRoyal Institute of Technology/KTHStockholm, Sweden
Opponents Professor Grace BurkeSchool of MaterialsThe University of Manchester, United Kingdom
Adjunct Professor Pål EfsingMaterials Mechanics and Structural IntegrityDepartment of Solid MechanicsRoyal Institute of Technology/KTHStockholm, Sweden
5
ContentsPreface ................................................................................................................. 3
Doctoral dissertation ........................................................................................... 4
List of abbreviations ............................................................................................ 8
Original features ................................................................................................ 11
1 Introduction .................................................................................................. 12
1.1 An overview of nickel-based alloys .......................................................... 121.2 Welding metallurgy of nickel-based alloys ................................................ 13
1.2.1 Weld solidification ......................................................................... 131.2.1.1 Epitaxial and nonepitaxial growth at fusion boundary ....... 131.2.1.2 Competitive growth ........................................................ 13
1.2.2 Grain structure ............................................................................. 141.2.3 Elemental segregation during solidification .................................... 161.2.4 Phases of nickel-based alloys ....................................................... 19
1.2.4.1 Gamma prime ( ’) .......................................................... 191.2.4.2 Gamma double prime ( ’’)............................................... 201.2.4.3 MC carbide .................................................................... 201.2.4.4 M23C6 carbide ................................................................ 201.2.4.5 M6C carbide ................................................................... 241.2.4.6 M7C3 carbide.................................................................. 251.2.4.7 Other phases ................................................................. 25
1.2.5 Dissimilar metal welding ............................................................... 251.3 SCC of nickel-based alloys ..................................................................... 261.4 Low temperature crack propagation (LTCP) ............................................. 26
1.4.1 LTCP of Alloy X-750 ..................................................................... 271.4.1.1 LTCP mechanism of Alloy X-750 .................................... 29
1.4.2 LTCP of Alloys 600 and 690 and their weld metals Alloy 182/82and Alloy 152/52 ........................................................................... 331.4.2.1 Sources of hydrogen ...................................................... 391.4.2.2 Hydrogen trapping.......................................................... 401.4.2.3 Hydrogen-induced degradation mechanisms ................... 41
1.5 LTCP risk in nickel-based materials ......................................................... 42
6
1.6 Basics of elastic-plastic fracture mechanics ............................................. 431.6.1 J-Integral ...................................................................................... 431.6.2 Fracture resistance curve.............................................................. 44
2 Objectives of the study ................................................................................ 46
3 Materials ....................................................................................................... 47
3.1 All-weld metal test blocks ........................................................................ 473.2 Dissimilar metal weld (DMW) mock-up test blocks ................................... 50
4 Methods ........................................................................................................ 52
4.1 J-R tests ................................................................................................. 524.1.1 J-R test specimens ....................................................................... 534.1.2 Environments and loading............................................................. 544.1.3 Post-weld heat treatments ............................................................ 564.1.4 Test matrix for J-R tests ................................................................ 56
4.2 Microscopy ............................................................................................. 584.3 Hardness measurements ........................................................................ 584.4 TDS measurements ................................................................................ 584.5 Bulk hydrogen measurements ................................................................. 59
5 Results ......................................................................................................... 60
5.1 J-R test results ....................................................................................... 605.1.1 As-welded materials ..................................................................... 605.1.2 Post-weld heat treated materials ................................................... 64
5.2 Hardness measurements ........................................................................ 655.3 TDS and bulk hydrogen content measurements ....................................... 665.4 Optical microscopy ................................................................................. 725.5 EDS line scans ....................................................................................... 735.6 Fractography .......................................................................................... 76
5.6.1 Alloy 182 fractography .................................................................. 775.6.1.1 As-welded (AW) Alloy 182 specimens ............................. 775.6.1.2 Post-weld heat treated Alloy 182 specimens ................... 82
5.6.2 Alloy 82 fractography .................................................................... 835.6.3 Alloy 152 fractography .................................................................. 845.6.4 Alloy 52 fractography .................................................................... 86
5.7 EBSD study on TEM samples ................................................................. 905.8 TEM examinations .................................................................................. 92
5.8.1 TEM of Alloy 182 DMW................................................................. 935.8.2 TEM of Alloy 52 DMW .................................................................. 96
6 Discussion.................................................................................................... 98
6.1 J-R tests ................................................................................................. 986.1.1 Scatter of fracture resistance (JQ) values ..................................... 1016.1.2 Differences between the all-weld metal and DMW results ............ 104
6.2 Hardness measurements ...................................................................... 105
7
6.3 Cracking path of Alloys 182 and 52 ....................................................... 1066.3.1 Cracking path of Alloy 182 .......................................................... 1066.3.2 Cracking path of Alloy 52 ............................................................ 107
6.4 Fractography and microstructural features of LTCP ............................... 1116.4.1 Grain boundary tortuosity ............................................................ 1116.4.2 Observations from the TEM study ............................................... 1136.4.3 Carbide coherency ..................................................................... 1146.4.4 Cracking of MC-type carbides ..................................................... 115
6.5 Hydrogen measurements ...................................................................... 1166.6 Role of grain boundary carbides in LTCP ............................................... 1186.7 Subjects for further studies .................................................................... 118
7 Conclusions ............................................................................................... 120
8 References ................................................................................................. 122
9 ANNEX ............................................................................................................ 1
9.1 J-R test results for as-welded (AW) specimens .......................................... 19.1.1 Air tests .......................................................................................... 19.1.2 100 cm3 H2/kg H2O tests for AW specimens .................................... 39.1.3 30 cm3 H2/kg H2O tests for AW specimens ...................................... 59.1.4 5 and 0 cm3 H2/kg H2O tests for AW specimens of Alloy 152 ............ 79.1.5 100 cm3 H2/kg H2O 24h pre-exposure tests for AW specimens......... 99.1.6 30 cm3 H2/kg H2O 30 days pre-exposure tests for AW specimens .. 109.1.7 5 cm3 H2/kg H2O 30 days pre-exposure tests for AW specimens .... 11
9.2 J-R test results for post-weld heat treated specimens ............................... 129.2.1 100 and 30 cm3 H2/kg H2O tests for post-weld heat treated
specimens .................................................................................... 12
8
List of abbreviationsa crack length
a0 initial crack length
a crack growth
dimensionless diffusion parameter
AH a heat treatment for Alloy X-750 consisting of equalizing andageing
b0 initial ligament length
b unbroken ligament length
B specimen thickness
Be effective specimen thickness
BH direct ageing, a heat treatment for Alloy X-750
Cs solid composition at the solid/liquid interface
C0 nominal alloy composition
Ds diffusivity of solute in solid
E Young’s modulus
E’ elastic modulus that is defined differently for plane stress andplane strain
ET activation energy for hydrogen needed to escape from a trap siteto the normal lattice site
EBSD electron backscatter diffraction
EDS energy dispersive X-ray spectroscopy
fs fraction of solid
heating rate
9
dimensionless constant used in J-integral calculation
HEE hydrogen environment embrittlement
HTH a heat treatment for Alloy X-750 consisting of solution anneal andageing
ID interdendritic
IG intergranular
IGSCC intergranular stress corrosion cracking
IHE internal hydrogen embrittlement
J J-integral
JIC value of J-integral near the initiation of stable crack growth, a sizeindependent value of fracture toughness
JQ value of J-integral near the initiation of stable crack growth, inter-im fracture toughness or fracture resistance
KI stress intensity factor
k equilibrium distribution coefficient
L half the dendrite arm spacing
LTCP low temperature crack propagation
MA mill annealed, a heat treatment condition of Alloys 600 and 690
P load
Pf load that is used to define a loading rate in ASTM E 1820 – 01standard
PWHT post-weld heat treatment
PWSCC pressurized water stress corrosion cracking
S roller pin span
SEM scanning electron microscope
SCC stress corrosion cracking
SSRT slow strain rate test
TEM transmission electron microscope
T0.5mm tearing modulus or tearing resistance at the crack growth 0.5 mm
Tc desorption peak temperature
tf solidification time
10
TT thermally treated, a heat treatment condition of Alloys 600 and690
Uc energy absorbed in the material
Uc(el) energy absorbed in the material due to elastic loading
Up energy absorbed in the material due to plastic deformation
Vpl plastic part of the load line displacement
W specimen width
load line displacement
Poisson’s ratio
Y yield strength
0 flow stress
11
Original featuresThe following features are believed to be original:
1. J-R tests were conducted in low temperature hydrogenated water usingspecimens extracted from dissimilar metal weld (DMW) mock-ups of Al-loys 182, 152 and 52 and all-weld metal test blocks. The fracture re-sistance behaviour of DMWs and all-weld metal specimens of Alloys 182and 52 were compared. Both types of Alloy 182 behaved in a similarmanner regarding fracture resistance, but the DMW of Alloy 52 wasfound to exhibit higher JQ values than all-weld metal Alloy 52.
2. Specimens of Alloy 182 and 52 weld metals were J-R tested in low tem-perature hydrogenated water in both as-welded and post-weld heat treat-ed (PWHT) conditions. PWHT was found to increase the tearing re-sistance of Alloy 182 whereas the fracture toughness JQ did not changemarkedly.
3. Intergranular or interdendritic (IG/ID) fracture surfaces of Alloy 52 weldmetal was found to have a fine grain boundary structure. Crack propaga-tion deviates between two parallel planes of a Cr-depleted zone near thegrain boundary. The width of this grain boundary zone fits well with theCr-rich M23C6 carbide size.
4. High temperature pre-exposure (300 °C) was shown to have a rathersmall but systematic increasing effect on fracture resistance of Alloy 182and 152 weld metals tested in low temperature water regardless of thehydrogen content of the water.
5. A model was applied for hydrogen thermal desorption of DMWs of Alloys52 and 182 in order to determine the activation energy for hydrogen de-sorption. Hydrogen trapping in Alloy 182 was observed to be dominatedby a single trapping site whereas in Alloy 52 two different trapping siteswere detected. The activation energy for hydrogen desorption was higherfor the trapping site of Alloy 182 than for the trapping sites of Alloy 52.
12
1 Introduction
1.1 An overview of nickel-based alloys
Nickel-based alloys are used in a wide range of industries, including power gener-ation, petrochemical, chemical processing, aerospace and pollution control, due totheir good mechanical and corrosion properties. Nickel-based alloys are importantto modern industry because of their ability to withstand a wide variety of severeoperating conditions involving corrosive environments, high temperatures, highstresses and different combinations of these factors. A specific application of nick-el-based alloys in the power generation industry is dissimilar metal welding be-tween carbon steels and austenitic stainless steels because they provide a transi-tion in the coefficient of thermal expansion for elevated temperature service(DuPont et al., 2009).
The most common use for nickel is that of an alloying element in ferrous alloys.The second most important end use is as a base metal in various alloys. Purenickel has a face-centered cubic (fcc) structure up to its melting point. Therefore,ductile-to-brittle transition, which occurs for example in ferritic steels, does notoccur in nickel-based alloys. Nickel has an extensive solubility for many alloyingelements. It forms a complete solid solution with Co and almost complete solidsolution with Fe. It can also dissolve about 35 % Cr, 20 % each of Mo and W and5 to 10 % each of Al, Ti, Mn and V. These alloying elements can be used for solidsolution strengthening and for formation of intermetallic precipitations that improvethe strength of the alloy up to high temperatures, and to improve corrosion andoxidation resistance (Davis, 2000). On the other hand, nickel forms eutectic withvarious elements including Cr, Mo, Si, Ti, Al, Nb, W, P, S, and C. These eutecticcrystals may have a detrimental effect on the fracture resistance and stress corro-sion cracking (SCC) susceptibility of nickel-based alloys (Yonezawa, 2012;Yonezawa et al., 2015).
Nickel-based alloys are widely used in nuclear power plants. During the recentdecades, earlier widely used Alloy 600 and its weld metals 182 and 82 are beingsubstituted by higher Cr Alloy 690 and its weld metals Alloys 152 and 52 thatexhibit better resistance to SCC (EPRI, 2004; Andresen et al., 2007; Buisine et al.,2010).
13
1.2 Welding metallurgy of nickel-based alloys
1.2.1 Weld solidification
Nucleation of a crystal from a liquid occurs if the energy barrier for nucleation canbe overcome. In the case of fusion welding, the energy barrier becomes zerobecause the liquid metal of the weld pool is in intimate contact with the substrategrains and the liquid wets the substrate completely. Crystals nucleate from liquidmetal upon the substrate grains without difficulties (Kou, 2003).
1.2.1.1 Epitaxial and nonepitaxial growth at fusion boundary
When welding without filler metal, nucleation occurs upon the substrate grains insuch manner that the crystallographic orientation of the nucleation remains thesame with the substrate grains. Such growth initiation process is called epitaxialnucleation (Kou, 2003). The continuity of crystallographic orientation that occurs inepitaxial nucleation across the fusion boundary was first observed by Savage etal. (Kou, 2003) when they applied the Laue X-ray back-reflection technique inorder to study welds. For materials exhibiting a face-centered cubic (fcc) or body-centered cubic (bcc) crystal structure, the trunks of columnar dendrites grow in the<100> direction.
When welding with a filler metal, the base metal and weld metal differ from eachother and therefore epitaxial growth is no longer possible and new grains will haveto nucleate at the fusion boundary. Nelson et al. (1999) proposed that, when thecrystal structures of the base metal and weld metal are different at the solidifica-tion temperature, nucleation of solid weld metal occurs in heterogeneous sites onthe partially melted base metal at the fusion boundary. As a consequence of this,the fusion boundary exhibits random misorientations between the base metal andthe weld metal grains.
1.2.1.2 Competitive growth
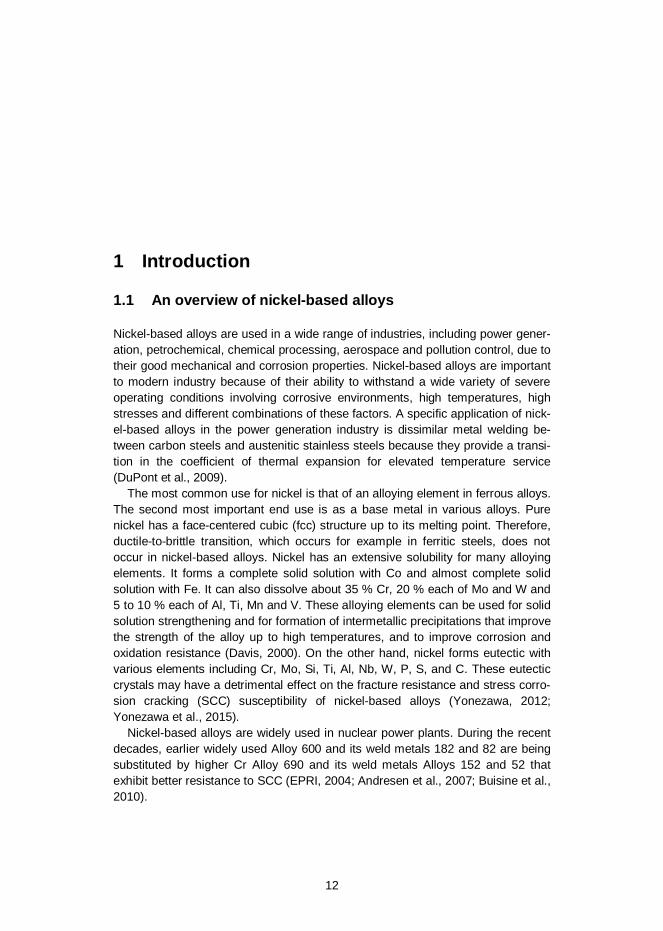
Away from the fusion line the grain structure is dominated by a mechanism knownas competitive growth (Kou, 2003), which is schematically presented in Figure 1.During solidification the grains tend to grow towards the direction of maximumheat extraction, which is the direction perpendicular to the liquid weld metal pool.The dendrites within the grains, however, grow preferably in the easy-growth di-rections, which is <100> for fcc and bcc materials. Therefore, grains that exhibit a<100> direction perpendicular to the pool boundary will grow more easily andcrowd out the less favourably oriented grains.
14
Figure 1. A schematic illustration of competitive growth in bulk fusion zone (Kou,2003).
1.2.2 Grain structure
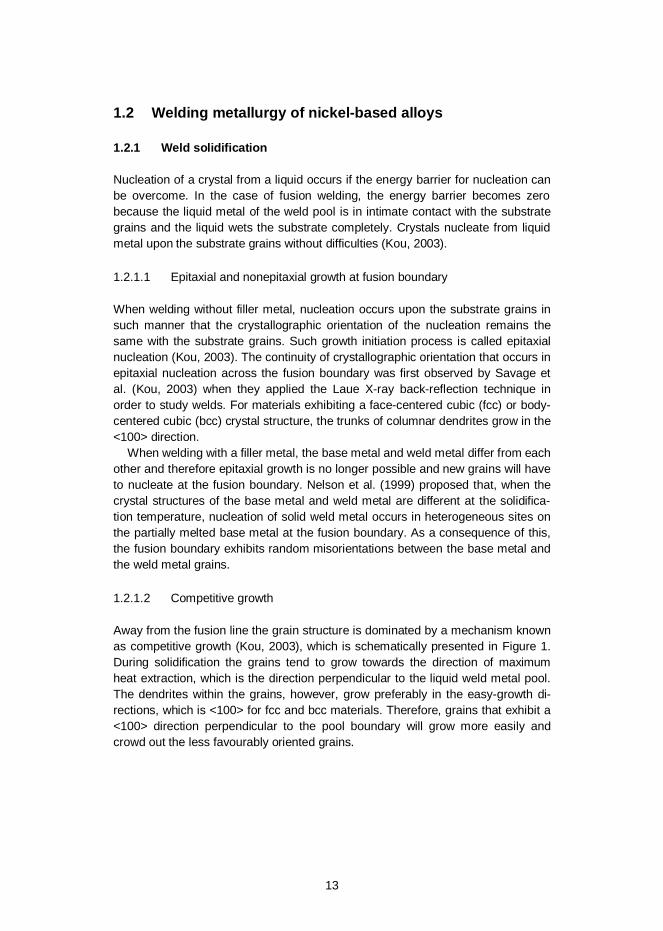
There are at least three different metallographically observable types of bounda-ries in nickel-based weld metals. Different boundaries are important since many ofthe defects, impurities and precipitates are associated with the boundaries. Anillustration of the different boundaries is presented in Figure 2. Figure 2 (a) illus-trates schematically how the different types of boundaries are formed during andafter welding. Figure 2 (b) shows migrated grain boundaries in FM-52 weld metal(also called Alloy 52 weld metal), which have pulled away from the segregationpatterns revealed by the etching (Lippold et al., 2004).
15
Figure 2. A shematical illustration of the different types of boundaries in (a) and aSEM image after etching showing migrated grain boundaries in (b) (Lippold et al.,2004).
Dendrite boundaries are a class of so called solidification subgrain boundaries(SSGB). These boundaries are evident in microstructure because of their differentcomposition from the adjacent bulk microstructure. The dendrites within the samegrain grow parallel to each other so that the crystallographic misorientationsacross the SSGBs are typically less than five degrees. Hence, the dislocationdensity along the SSGBs is low (Lippold et al., 1992).
The solidification grain boundaries (SGB) form when packets of dendrites inter-sect. These boundaries exhibit a high angular misorientation because each of thedendrite packets has a different growth direction. The large misorientation resultsin the development of a dislocation network along the SGB (DuPont et al., 2009).
It must be pointed out that the terminology of the different boundaries of weldsvaries. It is somewhat usual that solidification grain boundaries are called “dendriteboundaries” (Peng et al., 2003; Morra et al., 2014). It also appears that solidifica-tion grain boundaries are called merely “grain boundaries” by other researchers(Bruemmer et al., 2007). Another difficulty is to make a difference between SGBsthat form as a result of intersection of dendrite packets exhibiting a small or largeangular misorientation. If the angle between the dendrite packets is small thedifference between SGBs and SSGBs becomes obscure. In this work crackingthat occurs along boundaries in a weld is often referred as intergranu-lar/interdendritic (IG/ID) cracking meaning the solidification grain boundaries, thatare in literature called both grain and dendrite boundaries. Another reason forusing the term IG/ID is that it is difficult to distinguish the difference between thegrain and dendrite boundaries based on their appearance on the fracture surface.
In some cases it is possible that the solidification grain boundary of a nickel-based alloy weld starts to migrate to a position with lower boundary energy. The
16
chemical boundary still remains where the SGB was originally located as a conse-quence of the solidification. The new boundary that essentially is a crystallograph-ic boundary is called a migrated grain boundary (MGB). This kind of a boundaryoccurs for example in Alloy 52 weld metal. The original SGB has a tortuous ap-pearance and thus a high surface energy. A MGB is more smooth and straight andtherefore energetically favourable. In multipass welds reheating provides the en-ergy to activate such behaviour. The composition of a MGB varies locally depend-ing on the composition of the microstructure where the grain boundary has migrat-ed. Some segregation may also occur in MGBs via grain boundary sweepingmechanism, where fast diffusing interstitial elements such as S, P, B, O etc. maymove with the boundary when the boundary migrates and then stay in the grainboundary. Migrated grain boundaries usually occur only in fully austenitic weldmetals, because second phases are effective in pinning the SGBs and thus themigration cannot occur (DuPont et al., 2009).
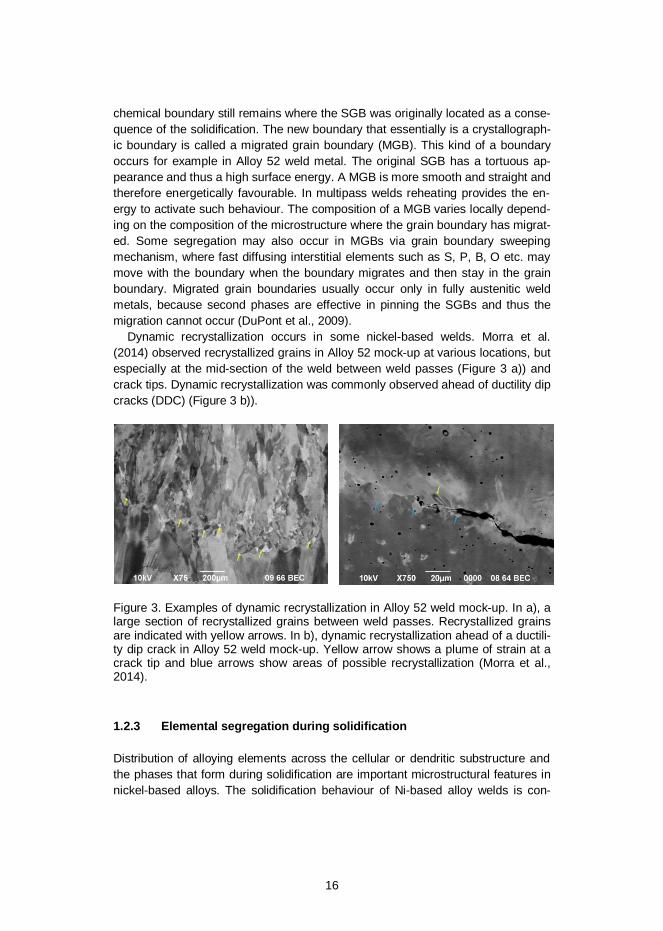
Dynamic recrystallization occurs in some nickel-based welds. Morra et al.(2014) observed recrystallized grains in Alloy 52 mock-up at various locations, butespecially at the mid-section of the weld between weld passes (Figure 3 a)) andcrack tips. Dynamic recrystallization was commonly observed ahead of ductility dipcracks (DDC) (Figure 3 b)).
Figure 3. Examples of dynamic recrystallization in Alloy 52 weld mock-up. In a), alarge section of recrystallized grains between weld passes. Recrystallized grainsare indicated with yellow arrows. In b), dynamic recrystallization ahead of a ductili-ty dip crack in Alloy 52 weld mock-up. Yellow arrow shows a plume of strain at acrack tip and blue arrows show areas of possible recrystallization (Morra et al.,2014).
1.2.3 Elemental segregation during solidification
Distribution of alloying elements across the cellular or dendritic substructure andthe phases that form during solidification are important microstructural features innickel-based alloys. The solidification behaviour of Ni-based alloy welds is con-
17
trolled by solute redistribution behaviour. Brody and Flemings (1966) proposed afollowing equation for solute redistribution of alloying elements:
= 1 1 + ,(1)
where Cs is the solid composition at the solid/liquid interface, C0 is the nominalalloy composition, fs is the fraction solid, and k is the equilibrium distribution coeffi-cient. parameter is a dimensionless diffusion parameter that is defined as:
= , (2)
where Ds is the diffusivity of solute in solid, tf is the solidification time, i.e., coolingtime between the liquidus and terminal solidus, and L is half the dendrite armspacing. The Dstf term describes the distance a solute atom can diffuse in the solidduring solidification, while the L term represents the length of the concentrationgradient. If the diffusion in the solid is insignificant, i.e., Dstf << L2, solute redistri-bution can be presented as proposed by Scheil (DuPont at al., 2009):
= [1 ] . (3)
The Scheil equation assumes equilibrium at the solid/liquid interface, completediffusion in the liquid, negligible diffusion in the solid and negligible dendrite tipundercooling. The k term, which is defined as a relation of the solid and liquidcomposition so that k=Cs/Cl, describes the solute atoms’ tendency to partition tothe liquid and solid phases during solidification. As the liquid solidifies, soluteatoms are rejected by the solid into the liquid if k < 1. Elements with very low kvalues can produce steep concentration gradients across the cellular or dendriticsubstructure of the weld.
The Scheil equation has been shown to describe the solute redistribution ratherwell in nickel-based alloys. Joo and Takeuchi (1994) evaluated parameter val-ues for alloying elements of Alloy 713, which is a precipitation-strengthened Ni-based alloy. They discovered that << 1 for all the elements considered under allcooling rate conditions. This kind of behaviour seems to be similar in other Ni-based alloys as well (Heubner et al., 1988). Thus, solid state diffusion of alloyingelements in nickel-based alloys is insignificant during solidification. However,parameter values calculated for C are significantly greater than unity. This is dueto C diffusion by interstitial mechanism that enables C to exhibit diffusion rates thatare orders of magnitude higher than those for the substitutional alloying elements(Bose & Grabke, 1978).
DuPont et al. (2009) have summarized experimentally measured k values fordifferent alloying elements in several Ni-based alloys that include both solid-solution and precipitation-strengthened alloys. The values represent k at the startof the solidification and do not account for variations in k that may occur during
18
solidification as the temperature decreases. The k values measured for differentcomplex multicomponent alloys and Ni-X binary systems do not differ significantlyfrom each other, except for Nb, Mo and in some quantity for Ti and Si. The k valueof Nb ranges from 0.42 to 0.58. The value is lower in the multi-component alloysthan in simple Ni-Nb system. This indicates that the presence of other alloyingelements decreases the solubility of Nb in Ni. The k values for elements with simi-lar atomic radii to Ni, namely Fe, Cr, and Co have k values close to unity. Also, thek values for W and Al are close about 1. Mo exhibits values ranging from 0.71 toalmost one and Ti from 0.58 to 0.76. Si exhibits k values ranging from 0.51 to0.69. The k values of C range from 0.21 to 0.27.
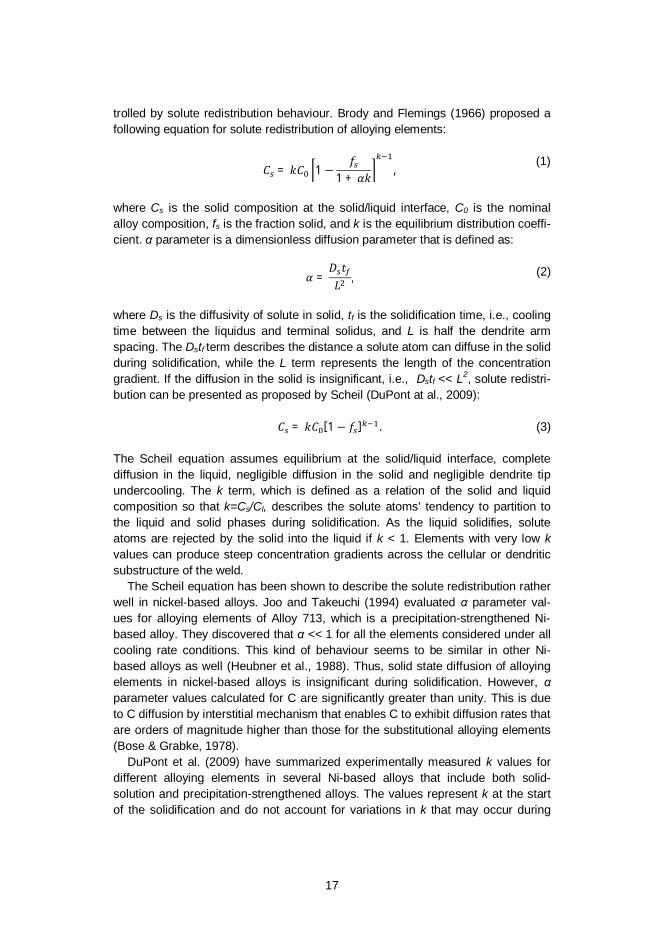
Young et al. (2001) calculated (JMatPro, version 4.1) solidification ranges fordifferent materials commonly used in nuclear power plant applications, includingnickel-based weld metals EN82, EN52 and EN52M. It must be pointed out thatScheil-based calculations are approximate and over predict the actual solidifica-tion temperature range because of the simplified assumptions such as equilibriumat the solid/liquid interface, complete diffusion in the liquid, negligible diffusion inthe solid and negligible dendrite tip undercooling. According to the calculations thesolidification range of EN52 is at about 1300–1400 °C, whereas EN82 solidifies ata range of about 1100–1350 °C, thus exhibiting solidification range more thantwice larger than EN52.
Figure 4. Comparison of the calculated (JMatPro, Version 4.1) solidification tem-perature ranges of some common materials used in nuclear power systems. Mate-rial compositions used for the calculation are typical values and significant variabil-ity exists within each alloy’s specification range (Young et al., 2001).
19
1.2.4 Phases of nickel-based alloys
Phase transformations observed in nickel-based alloys depend on the chemicalcomposition of the alloy. Solid-solution strengthened alloys contain little or no Al,Ti or Nb. They are strengthened primarily by the addition of substitutional ele-ments such as Cr, Fe, Mo, W and Cu which provide solid-solution strengthening ofthe austenite (fcc) microstructure. Nb provides some solid-solution strengtheningbut it is primarily added because it is carbide former. The precipitation hardenablealloys contain several percent Al and Ti and some also substantial amounts of Nbwhich can form a strengthening precipitate with nickel (Ni3Nb) (Davis, 2000;DuPont et al., 2009). Thermal treatment (TT) introduces formation of carbides inwrought nickel-based Alloy 600 and higher Cr Alloy 690. Alloy 600 exhibits M7C3
along the grain boundaries and additionally some intragranular M7C3 carbides,while Alloy 690 exhibits only M23C6 carbides (Yonezawa & Onimura, 1989).
Carbides are important precipitates in nickel-based alloy welds because theyincrease the strength of the grain boundaries when precipitated there, and havean effect on the corrosion behaviour of the material. Cr is an effective carbideformer because it has a strong affinity with C. The welding process generates heatwhich enables Cr to interact with C to form carbides such as M23C6 and M7C3
which then precipitate on the grain boundaries. The formation of carbides mayresult in Cr depletion within the first-pass welding layer or in the heat-affectedzone (HAZ), which causes degradation of the corrosion resistance. Cr depletioncan be avoided by either increasing the Cr content of the alloy, or by alloying highaffinity carbide formers such as Ti and Nb which typically form MC-type carbides(Davis, 2000; Lee et al., 2004). The typical phases observed in the nickel-basedalloys are presented in the following.
1.2.4.1 Gamma prime ( ’)
Gamma prime is an intermetallic precipitate and has an ordered fcc structure. Itscomposition is Ni3Al or Ni3(Al, Ti), although Co and Cr can replace some of the Ni.Fe can replace either Ni or Al. The lattice parameter of ’ is similar to the austenitematrix, and thus the formed precipitates are coherent with the matrix. The shapeof the precipitate can be either spherical (Fe-Ni-based alloys) or cuboidal, depend-ing on Mo content and Al/Ti ratio. Those elements have also an effect on the lat-tice mismatch. When the lattice mismatch between ’ and the matrix is high, ex-tended exposure above 700 °C causes formation of undesirable phases, namely (Ni3Ti) or (Ni3Nb) (Davis, 2000).
20
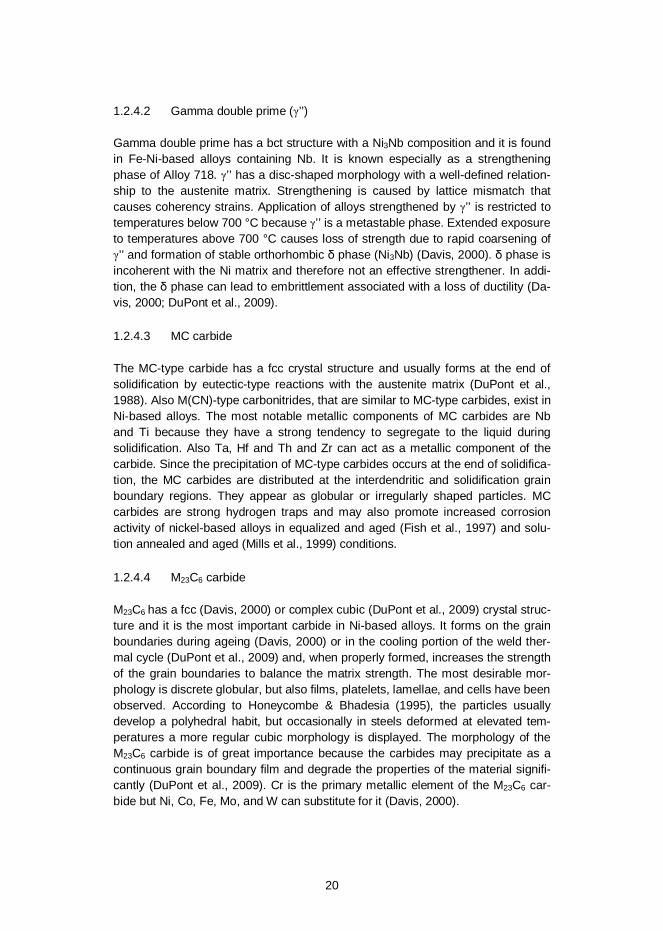
1.2.4.2 Gamma double prime ( ’’)
Gamma double prime has a bct structure with a Ni3Nb composition and it is foundin Fe-Ni-based alloys containing Nb. It is known especially as a strengtheningphase of Alloy 718. ’’ has a disc-shaped morphology with a well-defined relation-ship to the austenite matrix. Strengthening is caused by lattice mismatch thatcauses coherency strains. Application of alloys strengthened by ’’ is restricted totemperatures below 700 °C because ’’ is a metastable phase. Extended exposureto temperatures above 700 °C causes loss of strength due to rapid coarsening of’’ and formation of stable orthorhombic phase (Ni3Nb) (Davis, 2000). phase is
incoherent with the Ni matrix and therefore not an effective strengthener. In addi-tion, the phase can lead to embrittlement associated with a loss of ductility (Da-vis, 2000; DuPont et al., 2009).
1.2.4.3 MC carbide
The MC-type carbide has a fcc crystal structure and usually forms at the end ofsolidification by eutectic-type reactions with the austenite matrix (DuPont et al.,1988). Also M(CN)-type carbonitrides, that are similar to MC-type carbides, exist inNi-based alloys. The most notable metallic components of MC carbides are Nband Ti because they have a strong tendency to segregate to the liquid duringsolidification. Also Ta, Hf and Th and Zr can act as a metallic component of thecarbide. Since the precipitation of MC-type carbides occurs at the end of solidifica-tion, the MC carbides are distributed at the interdendritic and solidification grainboundary regions. They appear as globular or irregularly shaped particles. MCcarbides are strong hydrogen traps and may also promote increased corrosionactivity of nickel-based alloys in equalized and aged (Fish et al., 1997) and solu-tion annealed and aged (Mills et al., 1999) conditions.
1.2.4.4 M23C6 carbide
M23C6 has a fcc (Davis, 2000) or complex cubic (DuPont et al., 2009) crystal struc-ture and it is the most important carbide in Ni-based alloys. It forms on the grainboundaries during ageing (Davis, 2000) or in the cooling portion of the weld ther-mal cycle (DuPont et al., 2009) and, when properly formed, increases the strengthof the grain boundaries to balance the matrix strength. The most desirable mor-phology is discrete globular, but also films, platelets, lamellae, and cells have beenobserved. According to Honeycombe & Bhadesia (1995), the particles usuallydevelop a polyhedral habit, but occasionally in steels deformed at elevated tem-peratures a more regular cubic morphology is displayed. The morphology of theM23C6 carbide is of great importance because the carbides may precipitate as acontinuous grain boundary film and degrade the properties of the material signifi-cantly (DuPont et al., 2009). Cr is the primary metallic element of the M23C6 car-bide but Ni, Co, Fe, Mo, and W can substitute for it (Davis, 2000).
21
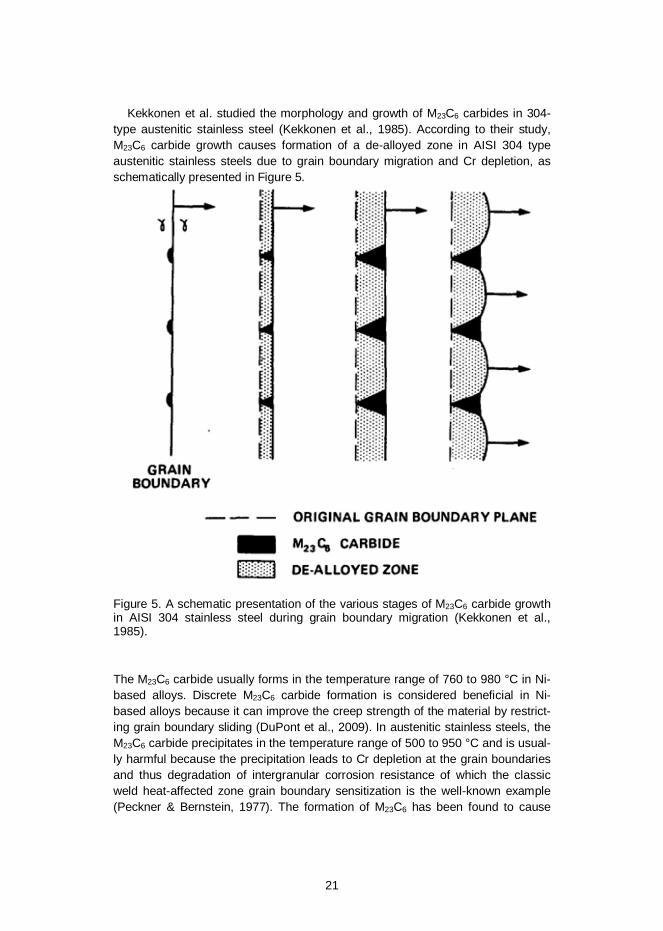
Kekkonen et al. studied the morphology and growth of M23C6 carbides in 304-type austenitic stainless steel (Kekkonen et al., 1985). According to their study,M23C6 carbide growth causes formation of a de-alloyed zone in AISI 304 typeaustenitic stainless steels due to grain boundary migration and Cr depletion, asschematically presented in Figure 5.
Figure 5. A schematic presentation of the various stages of M23C6 carbide growthin AISI 304 stainless steel during grain boundary migration (Kekkonen et al.,1985).
The M23C6 carbide usually forms in the temperature range of 760 to 980 °C in Ni-based alloys. Discrete M23C6 carbide formation is considered beneficial in Ni-based alloys because it can improve the creep strength of the material by restrict-ing grain boundary sliding (DuPont et al., 2009). In austenitic stainless steels, theM23C6 carbide precipitates in the temperature range of 500 to 950 °C and is usual-ly harmful because the precipitation leads to Cr depletion at the grain boundariesand thus degradation of intergranular corrosion resistance of which the classicweld heat-affected zone grain boundary sensitization is the well-known example(Peckner & Bernstein, 1977). The formation of M23C6 has been found to cause
22
strong, although not continuous, Cr depletion with levels down to ~5 % (13-15 %Cr in the matrix) in the grain boundary region also in Ni-based Alloy 182 weldmetal (Thomas et al., 2009) that has been widely used in nuclear power plants.However, there are conflicting reports on the benefits and disadvantages of sensi-tization of Ni-based weld metals on primary water stress corrosion cracking(PWSCC) (Webb & Burke, 1995).
Both the matrix and the M23C6 carbide have cubic symmetry and based on elec-tron diffraction evidence the orientation relationship has discovered to be as fol-lows (Honeycombe & Bhadesia, 1995):
{100} //{100} : 100 // 100
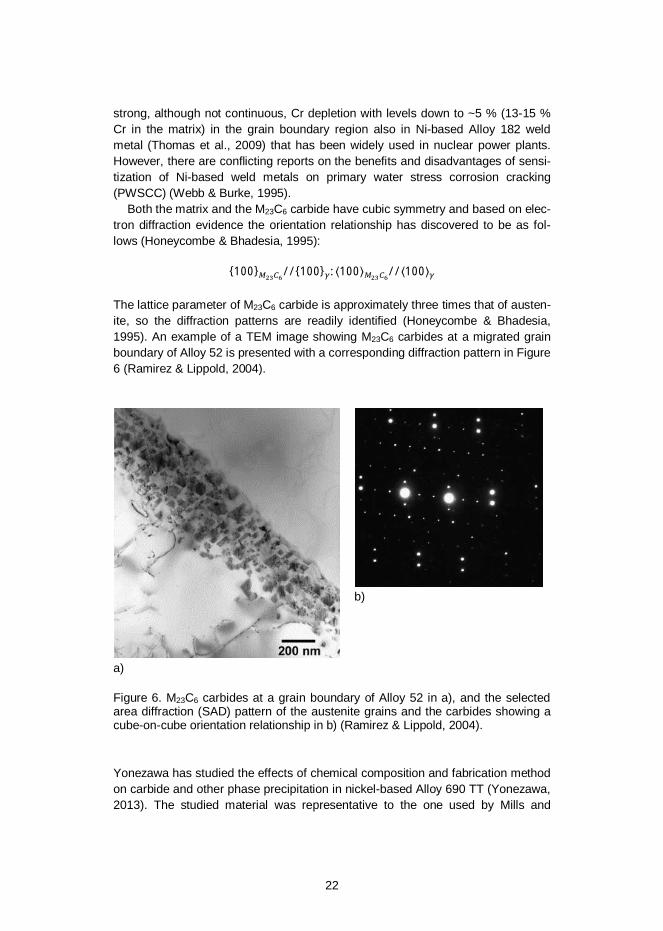
The lattice parameter of M23C6 carbide is approximately three times that of austen-ite, so the diffraction patterns are readily identified (Honeycombe & Bhadesia,1995). An example of a TEM image showing M23C6 carbides at a migrated grainboundary of Alloy 52 is presented with a corresponding diffraction pattern in Figure6 (Ramirez & Lippold, 2004).
a)
b)
Figure 6. M23C6 carbides at a grain boundary of Alloy 52 in a), and the selectedarea diffraction (SAD) pattern of the austenite grains and the carbides showing acube-on-cube orientation relationship in b) (Ramirez & Lippold, 2004).
Yonezawa has studied the effects of chemical composition and fabrication methodon carbide and other phase precipitation in nickel-based Alloy 690 TT (Yonezawa,2013). The studied material was representative to the one used by Mills and
23
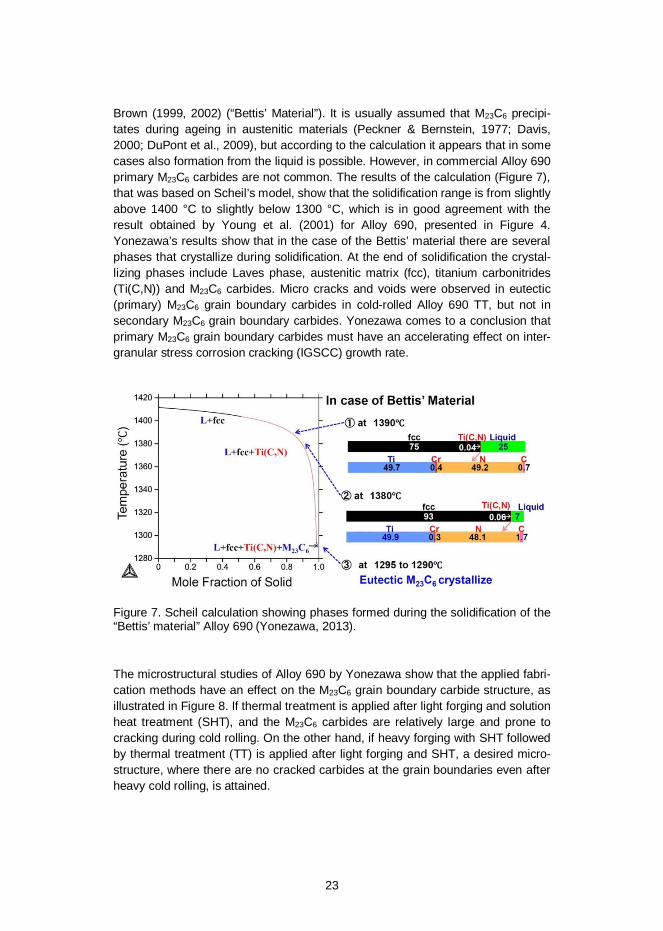
Brown (1999, 2002) (“Bettis’ Material”). It is usually assumed that M23C6 precipi-tates during ageing in austenitic materials (Peckner & Bernstein, 1977; Davis,2000; DuPont et al., 2009), but according to the calculation it appears that in somecases also formation from the liquid is possible. However, in commercial Alloy 690primary M23C6 carbides are not common. The results of the calculation (Figure 7),that was based on Scheil’s model, show that the solidification range is from slightlyabove 1400 °C to slightly below 1300 °C, which is in good agreement with theresult obtained by Young et al. (2001) for Alloy 690, presented in Figure 4.Yonezawa’s results show that in the case of the Bettis’ material there are severalphases that crystallize during solidification. At the end of solidification the crystal-lizing phases include Laves phase, austenitic matrix (fcc), titanium carbonitrides(Ti(C,N)) and M23C6 carbides. Micro cracks and voids were observed in eutectic(primary) M23C6 grain boundary carbides in cold-rolled Alloy 690 TT, but not insecondary M23C6 grain boundary carbides. Yonezawa comes to a conclusion thatprimary M23C6 grain boundary carbides must have an accelerating effect on inter-granular stress corrosion cracking (IGSCC) growth rate.
Figure 7. Scheil calculation showing phases formed during the solidification of the“Bettis’ material” Alloy 690 (Yonezawa, 2013).
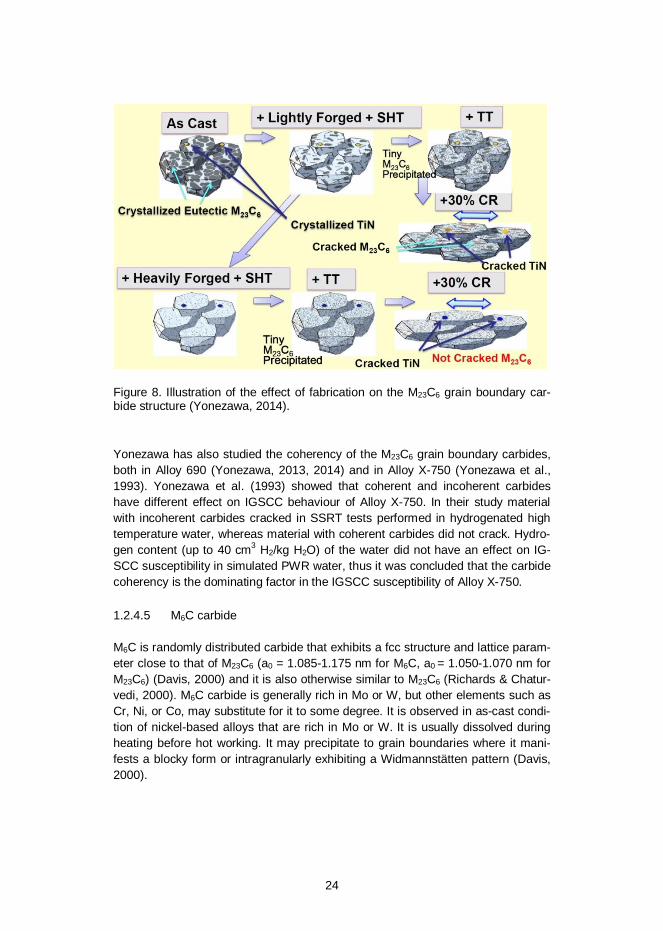
The microstructural studies of Alloy 690 by Yonezawa show that the applied fabri-cation methods have an effect on the M23C6 grain boundary carbide structure, asillustrated in Figure 8. If thermal treatment is applied after light forging and solutionheat treatment (SHT), and the M23C6 carbides are relatively large and prone tocracking during cold rolling. On the other hand, if heavy forging with SHT followedby thermal treatment (TT) is applied after light forging and SHT, a desired micro-structure, where there are no cracked carbides at the grain boundaries even afterheavy cold rolling, is attained.
24
Figure 8. Illustration of the effect of fabrication on the M23C6 grain boundary car-bide structure (Yonezawa, 2014).
Yonezawa has also studied the coherency of the M23C6 grain boundary carbides,both in Alloy 690 (Yonezawa, 2013, 2014) and in Alloy X-750 (Yonezawa et al.,1993). Yonezawa et al. (1993) showed that coherent and incoherent carbideshave different effect on IGSCC behaviour of Alloy X-750. In their study materialwith incoherent carbides cracked in SSRT tests performed in hydrogenated hightemperature water, whereas material with coherent carbides did not crack. Hydro-gen content (up to 40 cm3 H2/kg H2O) of the water did not have an effect on IG-SCC susceptibility in simulated PWR water, thus it was concluded that the carbidecoherency is the dominating factor in the IGSCC susceptibility of Alloy X-750.
1.2.4.5 M6C carbide
M6C is randomly distributed carbide that exhibits a fcc structure and lattice param-eter close to that of M23C6 (a0 = 1.085-1.175 nm for M6C, a0 = 1.050-1.070 nm forM23C6) (Davis, 2000) and it is also otherwise similar to M23C6 (Richards & Chatur-vedi, 2000). M6C carbide is generally rich in Mo or W, but other elements such asCr, Ni, or Co, may substitute for it to some degree. It is observed in as-cast condi-tion of nickel-based alloys that are rich in Mo or W. It is usually dissolved duringheating before hot working. It may precipitate to grain boundaries where it mani-fests a blocky form or intragranularly exhibiting a Widmannstätten pattern (Davis,2000).
25
1.2.4.6 M7C3 carbide
M7C3 carbides are present in some nickel-based alloys, such as Nimonic 80A(Davis, 2000) and Alloy 600 (Yonezawa & Onimura, 1989; Kaneda et al., 2007).The M7C3 carbide precipitates when the material is heated above 1000 °C and hasa hexagonal structure. Addition of elements such as Co, Mo, or Nb to nickel-basedalloys prevents formation of M7C3 (Davis, 2000).
1.2.4.7 Other phases
Mo and W act as stabilizing elements for some topologically close packed (tcp)phases, such as , µ, and Laves. Those phases are generally undesirable dueto their negative effect on both weldability and properties of nickel-based alloys.Their complex crystal structure leads to limited slip systems, which makes thembrittle. They can reduce the ductility and toughness of the material if they are pre-sent in considerable amounts. Laves phase is observed as coarse intergranular,and sometimes intragranular particles in welds that contain Nb. Also Si, in additionto Nb, promotes formation of Laves phase in Alloy 718 (Davis, 2000; DuPont etal., 2009).
1.2.5 Dissimilar metal welding
Nickel-based alloy weld metals are often used when welding dissimilar combina-tions, such as pressure vessel steels (low alloy steels) to stainless steels. In theseapplications, several inherent properties of nickel-based alloys make them an idealchoice of material. When austenitic stainless steels are welded directly to carbonsteels, the difference in coefficient of thermal expansion (CTE) can lead to fatigueand creep failures in the HAZ of the carbon steel (Lippold & Kotecki, 2005). TheCTE of Ni lies between those of austenitic stainless steels and carbon steels andthus it provides a gradation of CTE across the weld joint and better distributesthermal stresses that are originated by the different CTEs of the joined materials.Nickel-based weld metals also have good corrosion resistance in as-welded condi-tion (Kiser, 1990) and good impact strength at low temperatures (Hilkes et al.,2004). However, dilution of the two different base metals causes a non-identicalcomposition within the fusion zones, which may degrade the properties of theweldment in some cases (Jeng et al., 2005).
Large compositional gradients exist in the fusion boundary region when weldingcarbon steels with Ni-based alloys. C diffuses from the HAZ to the fusion zoneduring the welding or post-weld heat treatment (PWHT) due to this gradient(Lundin, 1982) which can result in formation of some martensite according to theSchaeffler diagram (DuPont et al., 2009). The tendency for C to migrate from HAZinto the weld metal during PWHT is especially strong in high-Cr alloys, such asAlloy 52 (Mouginot & Hänninen, 2013; Hänninen et al., 2014).
Type II boundary is a grain boundary that occurs only in dissimilar joints. It runsapproximately parallel to the fusion line and is located a few microns from the
26
fusion zone (DuPont et al., 2009). Type II boundary is important because a num-ber of instances of in-service cracking has been associated with them. It is a weakand approximately planar interface that makes a preferential cracking site in casesof large local mismatch between the hard martensitic zone at the fusion line andthe type II boundary region.
1.3 SCC of nickel-based alloys
Alloy 600 was developed in the 1950s as an alternative material to austeniticstainless steels. Alloy 600 has been used for stream generator tubing because itwas observed to have a high resistance to SCC in chloride solutions, as reportedby Copson (1959). Coriou et al. (1960) discovered the SCC susceptibility of someNi-rich Fe-Ni-Cr alloys in high temperature, high purity water, but the validity oftheir observation was questioned. However, widespread occurrence of intergranu-lar cracking of stream generator tubing in many PWR plants has revealed thegeneric character of the phenomenon (Berge, 1988; Welty & Blomgren, 1990). Inthe 1970s, thermally treated (TT) Alloy 600 was developed in order to improve theSCC resistance of Alloy 600, but SCC was eventually detected in TT material aswell. A higher Cr nickel-based Alloy 690 was developed as an alternative materialfor steam generator tubing and it has performed well thus far.
Both Alloys 182 and 82 were observed to be susceptible to SCC in PWR condi-tions in laboratory tests (Andresen, 1987). Later, the SCC susceptibility of theseweld metals was verified also by cracking cases in the operating power plants(Rao et al., 2002; Shah & MacDonald, 1993). SCC has occurred in PWRs in con-trol rod drive mechanisms and thermocouple nozzles made of Alloy 600. In BWRs,the first case of intergranular cracking in a safe-end made of Alloy 600 was ob-served 1978 in Duane Arnold (commercial start 1974). The crack had initiated inthe HAZ of the Alloy 600 and penetrated into the Alloy 182 weld metal causing aleak (Pasupathi et al., 1980). Since that several similar cracks have been found inBWR's.
Precipitate-hardenable nickel-based Alloy X-750 has also been found to besusceptible to SCC in PWR and BWR water. A pronounced effect of heat treat-ment on the IGSCC susceptibility has been reported (Hosoi et al., 1984; Yoneza-wa et al., 1984; Grove & Petzold, 1985; Skeldon & Hurst, 1988). A heat treatmentthat causes lower susceptibility consists of solution annealing at a relatively hightemperature (>1050 °C), followed by a single-step ageing treatment of approxi-mately 20 h at about 700 °C.
1.4 Low temperature crack propagation (LTCP)
Low temperature crack propagation (LTCP) is widely considered as a hydrogen-induced embrittlement phenomenon that has been observed in laboratory condi-tions for various nickel-based alloys at the temperature range of ~50 to 150 °C in
27
hydrogenated water. No LTCP incidents have been reported in open literature todate.
1.4.1 LTCP of Alloy X-750
Low temperature SCC, later named as LTCP, was first reported by Grove andPetzold (1985). They performed rising load tests for Charpy-sized precrackedthree-point bend specimens loaded at a constant extension rate of 0.005 cm/minin destilled 93 °C water. The studied material was Alloy X-750, which is a high-strength precipitation hardenable alloy originally developed for gas turbines andaerospace industry. It is widely used in internal applications for both Boiling WaterReactor (BWR) and Pressurized Water Reactor (PWR) designs, such as fuel as-sembly hold-down springs, control rod guide tube support pins, jet pump beams,and reactor internals structural bolting. Alloy X-750 is very similar in composition tosolution annealed Alloy 600, but it contains additions of Ti and Al, which combinewith Ni to form gamma prime ( ’) precipitates, Ni3Al and Ni3(Al, Ti), for strengthen-ing (Davis, 2000). The nominal composition of Alloy X-750 is presented in Table 1.Although Alloy X-750 has performed well in the light water reactor environments, ithas been observed that it is susceptible to fail under certain reactor operationaland environmental conditions with low ductility by a stress corrosion mechanismacting alone or as the concluding mechanism in instances where fatigue cracksare already present (Baty et al., 1984). Grove and Petzold (1985) investigated thehigh and low temperature SCC susceptibility of Alloy X-750 by applying threedifferent heat treatments:
1. Equalized and aged (AH), 885 C/24 hours + 704 C/20 hours,2. Direct-aged (BH), 704 C/20 hours3. Solution annealed and aged (HTH), 1093 C/1 hour + 704 C/20 hours.
AH microstructure typically consists of coarse gamma-prime precipitates within thegrains and few carbide precipitates at the grain boundaries. BH microstructureconsists of grain boundary carbides that appear semi-continuous to continuous.Contrary to the AH heat treated microstructure, no coarse gamma-prime is visiblewithin the grains. The microstructure of condition HTH is identical to that of typicalBH, except that the grain size is larger. In addition, the 1093 °C solution annealheat-treatment step of condition HTH significantly reduces variability introducedduring processing. Gamma-prime, M23C6, and most MC carbides are put intosolution, and grain growth occurs. The M23C6-type carbides precipitate at the newgrain boundaries during aging at 704 °C, and fine gamma-prime is precipitatedthroughout the material. Grain growth during solution annealing is required toreduce phosphorus at the grain boundaries (Grove & Petzold, 1985).
The test results obtained with Charpy-sized (10x10x55 mm) precracked three-point bend specimens (Grove & Petzold, 1985) showed extremely rapid crackgrowth rates of 250 cm/day in low temperature water. Grove and Petzold conclud-
28
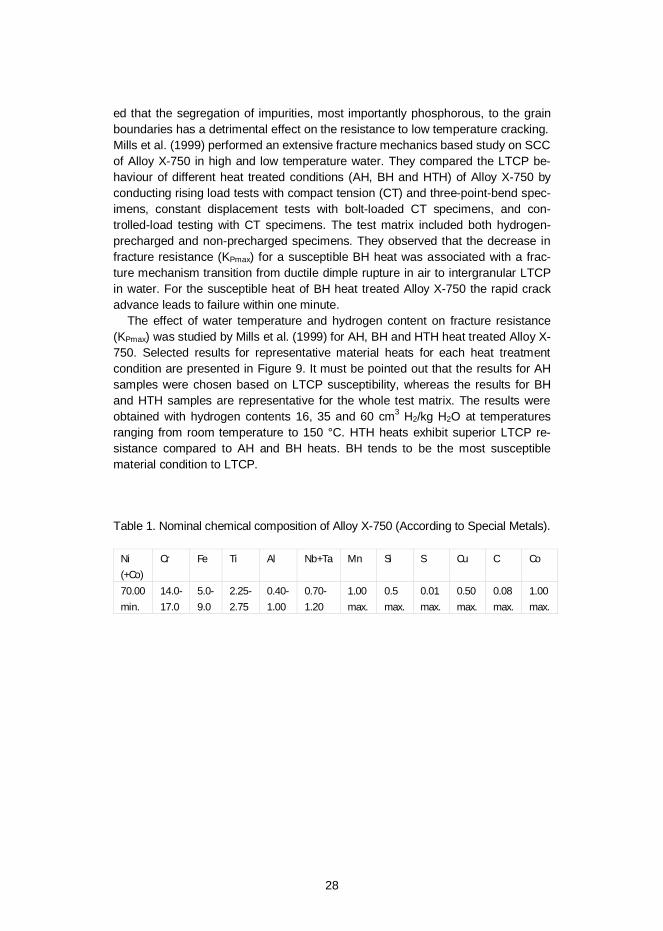
ed that the segregation of impurities, most importantly phosphorous, to the grainboundaries has a detrimental effect on the resistance to low temperature cracking.Mills et al. (1999) performed an extensive fracture mechanics based study on SCCof Alloy X-750 in high and low temperature water. They compared the LTCP be-haviour of different heat treated conditions (AH, BH and HTH) of Alloy X-750 byconducting rising load tests with compact tension (CT) and three-point-bend spec-imens, constant displacement tests with bolt-loaded CT specimens, and con-trolled-load testing with CT specimens. The test matrix included both hydrogen-precharged and non-precharged specimens. They observed that the decrease infracture resistance (KPmax) for a susceptible BH heat was associated with a frac-ture mechanism transition from ductile dimple rupture in air to intergranular LTCPin water. For the susceptible heat of BH heat treated Alloy X-750 the rapid crackadvance leads to failure within one minute.
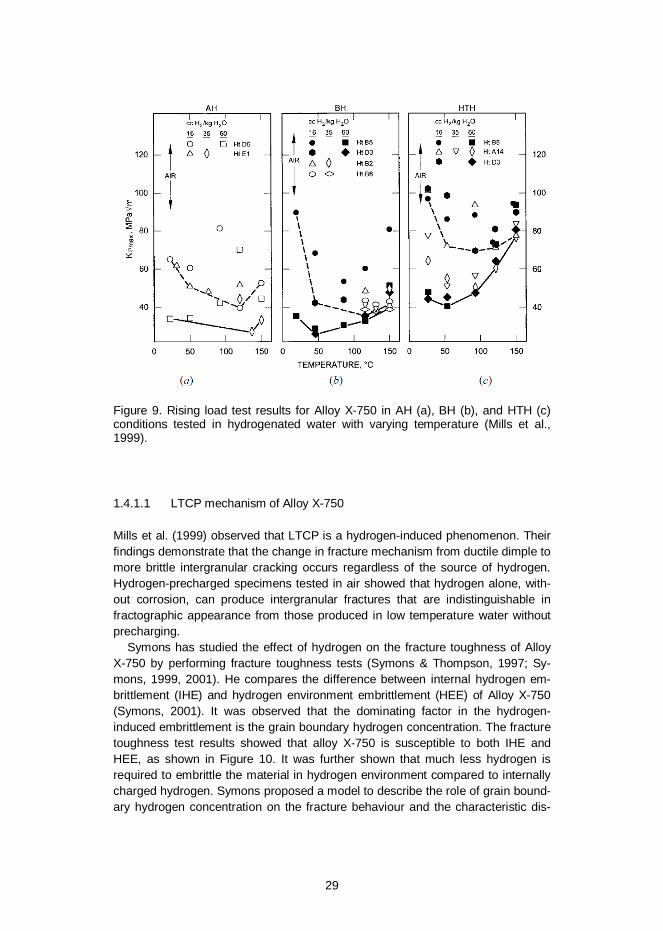
The effect of water temperature and hydrogen content on fracture resistance(KPmax) was studied by Mills et al. (1999) for AH, BH and HTH heat treated Alloy X-750. Selected results for representative material heats for each heat treatmentcondition are presented in Figure 9. It must be pointed out that the results for AHsamples were chosen based on LTCP susceptibility, whereas the results for BHand HTH samples are representative for the whole test matrix. The results wereobtained with hydrogen contents 16, 35 and 60 cm3 H2/kg H2O at temperaturesranging from room temperature to 150 °C. HTH heats exhibit superior LTCP re-sistance compared to AH and BH heats. BH tends to be the most susceptiblematerial condition to LTCP.
Table 1. Nominal chemical composition of Alloy X-750 (According to Special Metals).
Ni(+Co)
Cr Fe Ti Al Nb+Ta Mn Si S Cu C Co
70.00min.
14.0-17.0
5.0-9.0
2.25-2.75
0.40-1.00
0.70-1.20
1.00max.
0.5max.
0.01max.
0.50max.
0.08max.
1.00max.
29
Figure 9. Rising load test results for Alloy X-750 in AH (a), BH (b), and HTH (c)conditions tested in hydrogenated water with varying temperature (Mills et al.,1999).
1.4.1.1 LTCP mechanism of Alloy X-750
Mills et al. (1999) observed that LTCP is a hydrogen-induced phenomenon. Theirfindings demonstrate that the change in fracture mechanism from ductile dimple tomore brittle intergranular cracking occurs regardless of the source of hydrogen.Hydrogen-precharged specimens tested in air showed that hydrogen alone, with-out corrosion, can produce intergranular fractures that are indistinguishable infractographic appearance from those produced in low temperature water withoutprecharging.
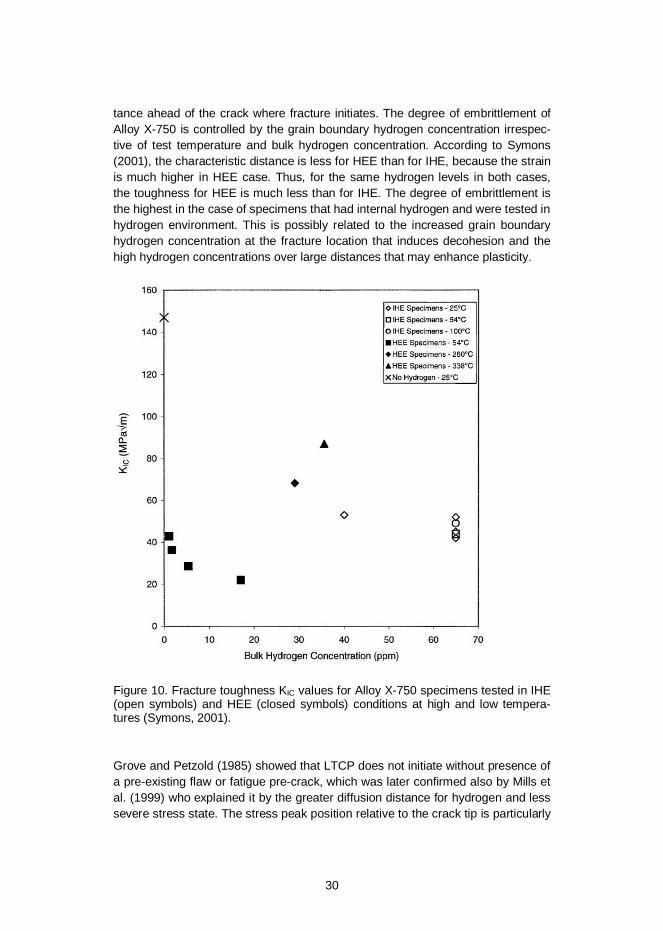
Symons has studied the effect of hydrogen on the fracture toughness of AlloyX-750 by performing fracture toughness tests (Symons & Thompson, 1997; Sy-mons, 1999, 2001). He compares the difference between internal hydrogen em-brittlement (IHE) and hydrogen environment embrittlement (HEE) of Alloy X-750(Symons, 2001). It was observed that the dominating factor in the hydrogen-induced embrittlement is the grain boundary hydrogen concentration. The fracturetoughness test results showed that alloy X-750 is susceptible to both IHE andHEE, as shown in Figure 10. It was further shown that much less hydrogen isrequired to embrittle the material in hydrogen environment compared to internallycharged hydrogen. Symons proposed a model to describe the role of grain bound-ary hydrogen concentration on the fracture behaviour and the characteristic dis-
30
tance ahead of the crack where fracture initiates. The degree of embrittlement ofAlloy X-750 is controlled by the grain boundary hydrogen concentration irrespec-tive of test temperature and bulk hydrogen concentration. According to Symons(2001), the characteristic distance is less for HEE than for IHE, because the strainis much higher in HEE case. Thus, for the same hydrogen levels in both cases,the toughness for HEE is much less than for IHE. The degree of embrittlement isthe highest in the case of specimens that had internal hydrogen and were tested inhydrogen environment. This is possibly related to the increased grain boundaryhydrogen concentration at the fracture location that induces decohesion and thehigh hydrogen concentrations over large distances that may enhance plasticity.
Figure 10. Fracture toughness KIC values for Alloy X-750 specimens tested in IHE(open symbols) and HEE (closed symbols) conditions at high and low tempera-tures (Symons, 2001).
Grove and Petzold (1985) showed that LTCP does not initiate without presence ofa pre-existing flaw or fatigue pre-crack, which was later confirmed also by Mills etal. (1999) who explained it by the greater diffusion distance for hydrogen and lesssevere stress state. The stress peak position relative to the crack tip is particularly
31
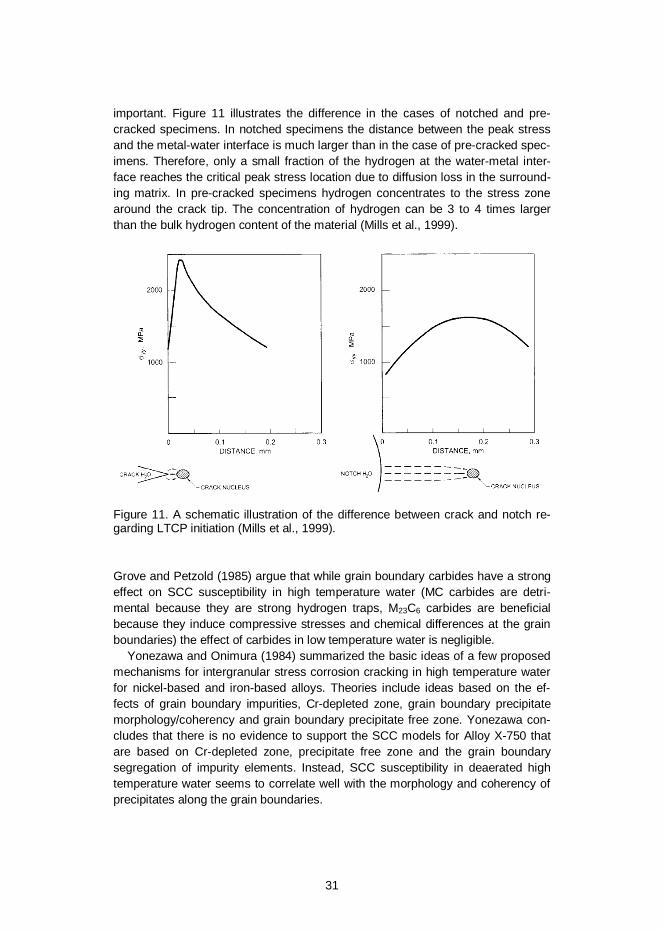
important. Figure 11 illustrates the difference in the cases of notched and pre-cracked specimens. In notched specimens the distance between the peak stressand the metal-water interface is much larger than in the case of pre-cracked spec-imens. Therefore, only a small fraction of the hydrogen at the water-metal inter-face reaches the critical peak stress location due to diffusion loss in the surround-ing matrix. In pre-cracked specimens hydrogen concentrates to the stress zonearound the crack tip. The concentration of hydrogen can be 3 to 4 times largerthan the bulk hydrogen content of the material (Mills et al., 1999).
Figure 11. A schematic illustration of the difference between crack and notch re-garding LTCP initiation (Mills et al., 1999).
Grove and Petzold (1985) argue that while grain boundary carbides have a strongeffect on SCC susceptibility in high temperature water (MC carbides are detri-mental because they are strong hydrogen traps, M23C6 carbides are beneficialbecause they induce compressive stresses and chemical differences at the grainboundaries) the effect of carbides in low temperature water is negligible.
Yonezawa and Onimura (1984) summarized the basic ideas of a few proposedmechanisms for intergranular stress corrosion cracking in high temperature waterfor nickel-based and iron-based alloys. Theories include ideas based on the ef-fects of grain boundary impurities, Cr-depleted zone, grain boundary precipitatemorphology/coherency and grain boundary precipitate free zone. Yonezawa con-cludes that there is no evidence to support the SCC models for Alloy X-750 thatare based on Cr-depleted zone, precipitate free zone and the grain boundarysegregation of impurity elements. Instead, SCC susceptibility in deaerated hightemperature water seems to correlate well with the morphology and coherency ofprecipitates along the grain boundaries.
32
Observations made by Yonezawa and Onimura (1984) on the effects of impuri-ties are somewhat contradictory to what Grove and Petzold (1985) reported.Yonezawa and Onimura compared the segregation of phosphorous at the grainboundaries with SCC susceptibility. Their results indicate that increasing amountsof phosphorous at the grain boundaries increases susceptibility to SCC in bothhigh and low temperature water. A significant number of heats with high grainboundary phosphorous concentrations fail, while heats with low grain boundaryphosphorous do not fail. However, not all the studied samples that had high phos-phorous concentrations failed. The better SCC resistance of some samples isbelieved to result from favourable grain boundary microstructure. Thus, Grove etal. believe that the combined effects of grain boundary chemistry and microstruc-ture explain the different SCC performance of the different heat-treated conditionsof Alloy X-750 that were investigated in the study.
Grove and Petzold created a following SCC model for Alloy X-750 in low- andhigh-temperature water: Hydrogen is generated in general corrosion processes.Hydrogen atoms are prevented from combining into molecular hydrogen at thegrain boundary surface by a recombination poison phosphorous, which is segre-gated to the grain boundaries. The concentration of atomic hydrogen builds up tosome critical value, whereby the grain boundary cracks. The reasons for the fail-ure may be pressure buildup, decohesion (lowering of the bond strength), for-mation of brittle hydride and increased local plasticity. Decohesion is assumed tobe the most plausible mechanism for the grain boundary failure. Concerning met-allurgical aspects, M23C6-type carbides at the grain boundaries are beneficial forlowering the SCC susceptibility, whereas MC-type carbides are harmful. M23C6-type carbides cause compressive stresses and chemical differences at the grainboundaries. MC-type carbides in Alloy X-750 principally contain titanium (TiC), andthey are trapping sites for hydrogen. Trapping would increase the mean stay timeof hydrogen at failure location and therefore result in earlier SCC. (Grove &Petzold, 1985)
Mills et al. (1999) explained the superior high temperature SCC performance ofcondition HTH by reduced phosphorous segregation, reduced intergranular gam-ma-prime, an absence of MC carbides along grain boundaries, a high density ofintergranular M23C6 carbides and a large grain size. The gamma-prime phase hastwo effects: Firstly, it induces hydrogen generation at the cathodic matrix becauseit is highly anodic. Hosoya et al. (1988) proposed that the galvanic effect betweengamma-prime and the matrix can result in extremely local anodic and cathodicprocess, which can promote accelerated cracking resulting from SCC, hydrogen-assisted cracking (HAC), or a combination of the two. Secondly, gamma-prime is astrong hydrogen trap. The HTH treatment reduces the amount of intergranulargamma-prime and increases the amount of Cr-rich M23C6, which is cathodic withrespect to the matrix. (Mills et al., 1999)
Young et al. (2001) studied the effect of service temperature (> 249 °C for ~10years) hydrogenated water on the low temperature fracture (LTF) of AH heattreated Alloy X-750. Exposure to high temperature water for extended times ap-pears to degrade the LTF resistance of Alloy X-750 in AH condition. The observed
33
degradation was assumed to be due to an increased hydrogen concentration atgrain boundary MC-type carbide trapping sites.
1.4.2 LTCP of Alloys 600 and 690 and their weld metals Alloy 182/82 andAlloy 152/52
The LTCP behaviour of solid-solution strengthened Alloys 600 and 690 and theirweld metals has been extensively studied over the past 15 years by Mills andBrown (Brown & Mills 1999, 2002, 2005, 2007; Mills & Brown 1999, 2001; Mills etal. 2001). Their results have later been confirmed by several other researchers(Young et al., 2005; McIlree et al., 2006; Herms et al., 2009; Sakima et al., 2011;Peng et al., 2012; Ahonen et al., 2013, 2014).
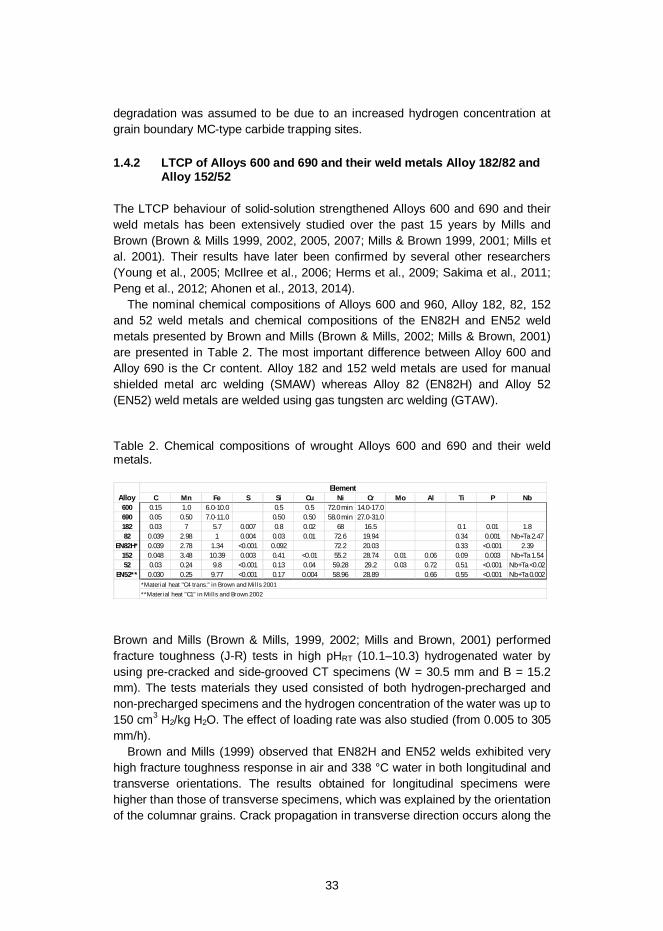
The nominal chemical compositions of Alloys 600 and 960, Alloy 182, 82, 152and 52 weld metals and chemical compositions of the EN82H and EN52 weldmetals presented by Brown and Mills (Brown & Mills, 2002; Mills & Brown, 2001)are presented in Table 2. The most important difference between Alloy 600 andAlloy 690 is the Cr content. Alloy 182 and 152 weld metals are used for manualshielded metal arc welding (SMAW) whereas Alloy 82 (EN82H) and Alloy 52(EN52) weld metals are welded using gas tungsten arc welding (GTAW).
Table 2. Chemical compositions of wrought Alloys 600 and 690 and their weldmetals.
Brown and Mills (Brown & Mills, 1999, 2002; Mills and Brown, 2001) performedfracture toughness (J-R) tests in high pHRT (10.1–10.3) hydrogenated water byusing pre-cracked and side-grooved CT specimens (W = 30.5 mm and B = 15.2mm). The tests materials they used consisted of both hydrogen-precharged andnon-precharged specimens and the hydrogen concentration of the water was up to150 cm3 H2/kg H2O. The effect of loading rate was also studied (from 0.005 to 305mm/h).
Brown and Mills (1999) observed that EN82H and EN52 welds exhibited veryhigh fracture toughness response in air and 338 °C water in both longitudinal andtransverse orientations. The results obtained for longitudinal specimens werehigher than those of transverse specimens, which was explained by the orientationof the columnar grains. Crack propagation in transverse direction occurs along the
C Mn Fe S Si Cu Ni Cr Mo Al Ti P Nb600 0.15 1.0 6.0-10.0 0.5 0.5 72.0 min 14.0-17.0690 0.05 0.50 7.0-11.0 0.50 0.50 58.0 min 27.0-31.0182 0.03 7 5.7 0.007 0.8 0.02 68 16.5 0.1 0.01 1.882 0.039 2.98 1 0.004 0.03 0.01 72.6 19.94 0.34 0.001 Nb+Ta 2.47
EN82H* 0.039 2.78 1.34 <0.001 0.092 72.2 20.03 0.33 <0.001 2.39152 0.048 3.48 10.39 0.003 0.41 <0.01 55.2 28.74 0.01 0.06 0.09 0.003 Nb+Ta 1.5452 0.03 0.24 9.8 <0.001 0.13 0.04 59.28 29.2 0.03 0.72 0.51 <0.001 Nb+Ta <0.02
EN52** 0.030 0.25 9.77 <0.001 0.17 0.004 58.96 28.89 0.66 0.55 <0.001 Nb+Ta 0.002
AlloyElement
*Material heat "C4 trans ." in Brown and Mills 2001**Material heat "C1" in Mills and Brown 2002
34
columnar grains and the boundaries and interdendritic precipitates tended to bealigned in the cracking direction. Also wrought Alloys 600 and 690 exhibited veryhigh fracture resistance JIC values in air and in high temperature water.
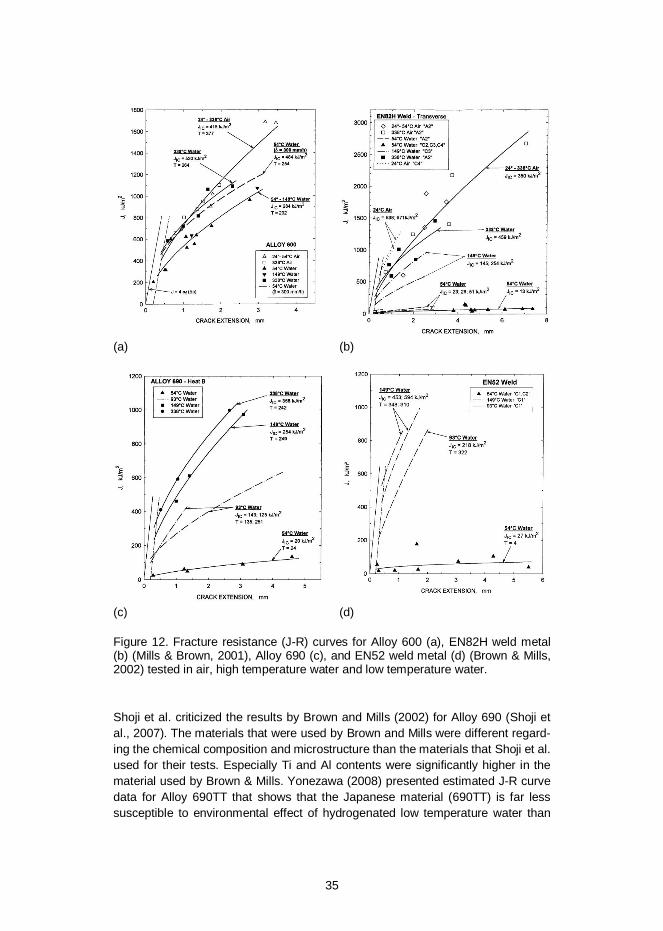
In 54 °C water with 150 cm3 H2/kg H2O, the fracture resistance (JIC) of Alloy 600decreased about 40 % from the value measured in air (Figure 12 (a)) (Brown &Mills, 2001). The tearing modulus (T), which is a measure of the tearing resistanceafter JIC is exceeded, was virtually unaffected by the environment, thus Alloy 600was demonstrated to maintain its excellent tearing resistance in low temperaturewater. However, the fracture resistance of EN82H weld metal was dramaticallyreduced in the same low temperature environment for both longitudinal and trans-verse specimens. The fracture resistance was decreased by an order of magni-tude or even more. The results for transverse specimens are presented in Figure12 (b). All the specimens of EN82H weld metal tested in low temperature hydro-genated water showed a marked reduction of fracture resistance values comparedto those obtained in air or in high temperature water. The lowest JIC values were14 and 13 kJ/m2 for longitudinal and transverse welds, respectively. All 10 J-R testresults obtained in 54 °C water showed JIC values clearly below 100 kJ/m2 (13–79kJ/m2). In an earlier study (Brown and Mills, 1999) JIC values of 18 and 114 kJ/m2
were reported for longitudinal orientation and 18 and 103 kJ/m2 for transverseorientation of EN82H weld metal. The increase of water temperature to 93 °C didnot markedly improve the fracture resistance. However, the fracture resistance ofEN82H was restored when the water temperature was increased to 149 °C (Brown& Mills, 2001).
Alloy 690 and its corresponding weld metal EN52 were tested in a similar study(Brown & Mills, 2002) as what was conducted for Alloy 600 and its weld metalEN82H. Alloy 690 was found to be significantly more susceptible to LTCP than thelower Cr Alloy 600, as seen in Figure 12 (c). EN52 welds, studied in longitudinalorientation, also showed a dramatic reduction of fracture resistance in low temper-ature water. Results for one material heat are presented in Figure 12 (d). Howev-er, the JIC values of EN52 are somewhat higher than those measured for EN82H.It was reported earlier (Brown & Mills, 1999) that not all specimens of EN52showed susceptibility to LTCP. Three of eight specimens fractured in a ductilemanner showing little or no effect of low temperature water.
All the specimens that were observed to be susceptible to LTCP showed atransition in fracture mechanism from ductile dimple rupture to intergranular crack-ing (Brown & Mills, 1999, 2001, 2002). This transition was found to occur in Alloy690 and weld metals EN82H and EN52 but not in Alloy 600 which retained its hightoughness and tearing resistance in low temperature water.
35
(a) (b)
(c) (d)
Figure 12. Fracture resistance (J-R) curves for Alloy 600 (a), EN82H weld metal(b) (Mills & Brown, 2001), Alloy 690 (c), and EN52 weld metal (d) (Brown & Mills,2002) tested in air, high temperature water and low temperature water.
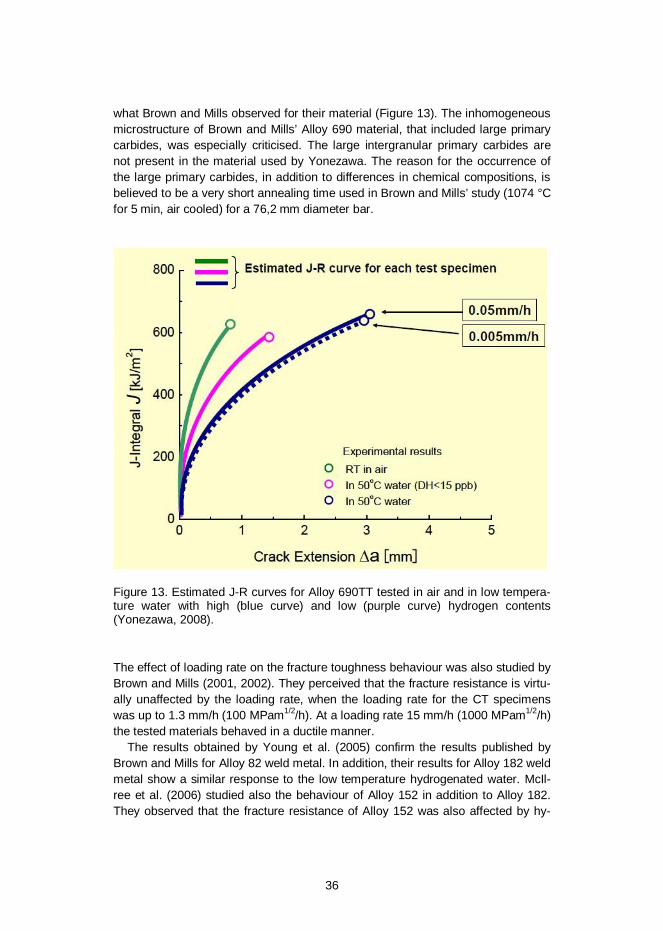
Shoji et al. criticized the results by Brown and Mills (2002) for Alloy 690 (Shoji etal., 2007). The materials that were used by Brown and Mills were different regard-ing the chemical composition and microstructure than the materials that Shoji et al.used for their tests. Especially Ti and Al contents were significantly higher in thematerial used by Brown & Mills. Yonezawa (2008) presented estimated J-R curvedata for Alloy 690TT that shows that the Japanese material (690TT) is far lesssusceptible to environmental effect of hydrogenated low temperature water than
36
what Brown and Mills observed for their material (Figure 13). The inhomogeneousmicrostructure of Brown and Mills’ Alloy 690 material, that included large primarycarbides, was especially criticised. The large intergranular primary carbides arenot present in the material used by Yonezawa. The reason for the occurrence ofthe large primary carbides, in addition to differences in chemical compositions, isbelieved to be a very short annealing time used in Brown and Mills’ study (1074 °Cfor 5 min, air cooled) for a 76,2 mm diameter bar.
Figure 13. Estimated J-R curves for Alloy 690TT tested in air and in low tempera-ture water with high (blue curve) and low (purple curve) hydrogen contents(Yonezawa, 2008).
The effect of loading rate on the fracture toughness behaviour was also studied byBrown and Mills (2001, 2002). They perceived that the fracture resistance is virtu-ally unaffected by the loading rate, when the loading rate for the CT specimenswas up to 1.3 mm/h (100 MPam1/2/h). At a loading rate 15 mm/h (1000 MPam1/2/h)the tested materials behaved in a ductile manner.
The results obtained by Young et al. (2005) confirm the results published byBrown and Mills for Alloy 82 weld metal. In addition, their results for Alloy 182 weldmetal show a similar response to the low temperature hydrogenated water. McIl-ree et al. (2006) studied also the behaviour of Alloy 152 in addition to Alloy 182.They observed that the fracture resistance of Alloy 152 was also affected by hy-
37
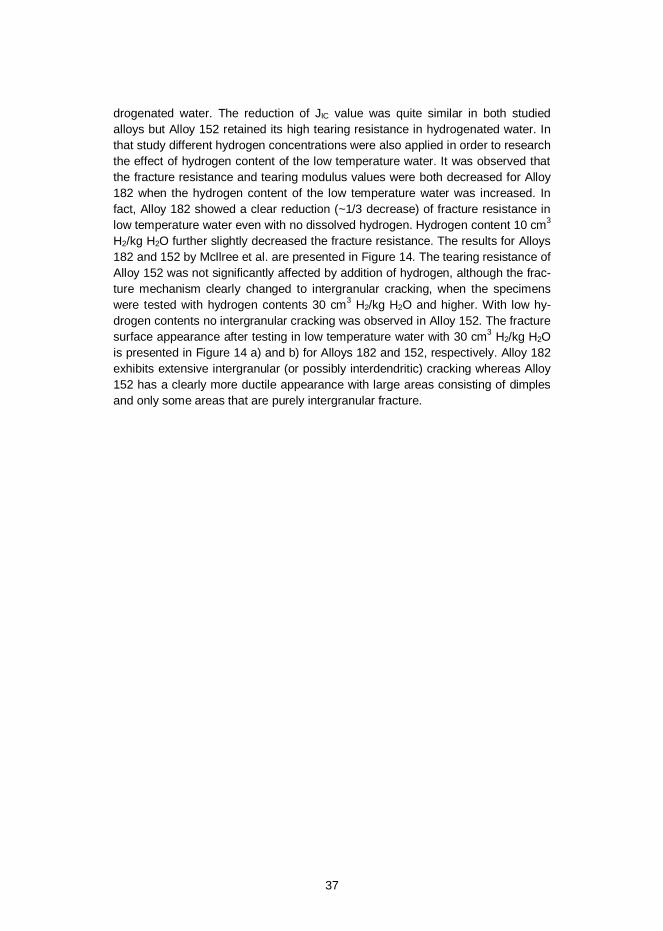
drogenated water. The reduction of JIC value was quite similar in both studiedalloys but Alloy 152 retained its high tearing resistance in hydrogenated water. Inthat study different hydrogen concentrations were also applied in order to researchthe effect of hydrogen content of the low temperature water. It was observed thatthe fracture resistance and tearing modulus values were both decreased for Alloy182 when the hydrogen content of the low temperature water was increased. Infact, Alloy 182 showed a clear reduction (~1/3 decrease) of fracture resistance inlow temperature water even with no dissolved hydrogen. Hydrogen content 10 cm3
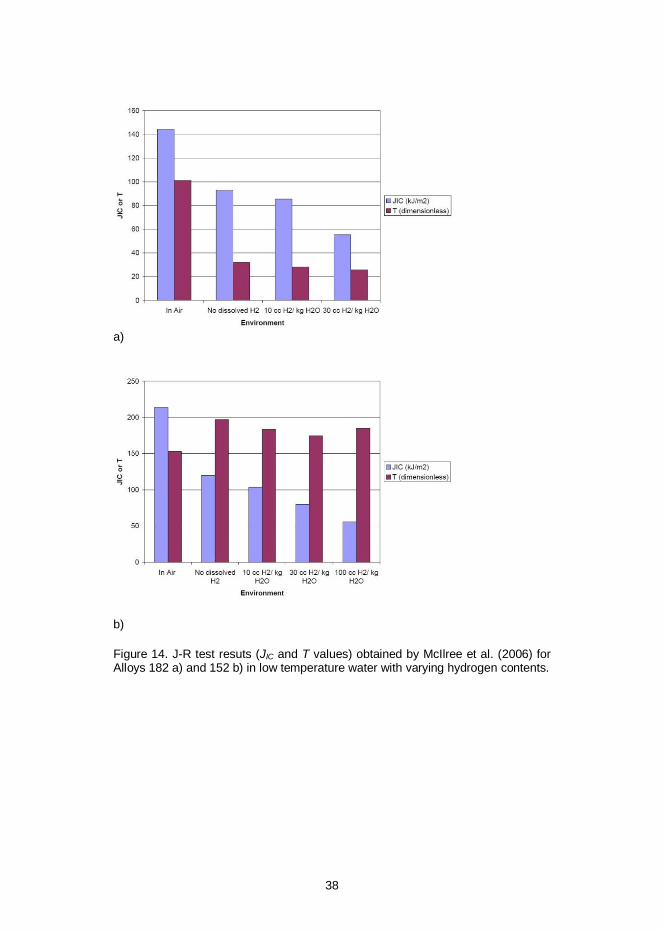
H2/kg H2O further slightly decreased the fracture resistance. The results for Alloys182 and 152 by McIlree et al. are presented in Figure 14. The tearing resistance ofAlloy 152 was not significantly affected by addition of hydrogen, although the frac-ture mechanism clearly changed to intergranular cracking, when the specimenswere tested with hydrogen contents 30 cm3 H2/kg H2O and higher. With low hy-drogen contents no intergranular cracking was observed in Alloy 152. The fracturesurface appearance after testing in low temperature water with 30 cm3 H2/kg H2Ois presented in Figure 14 a) and b) for Alloys 182 and 152, respectively. Alloy 182exhibits extensive intergranular (or possibly interdendritic) cracking whereas Alloy152 has a clearly more ductile appearance with large areas consisting of dimplesand only some areas that are purely intergranular fracture.
38
a)
b)
Figure 14. J-R test resuts (JIC and T values) obtained by McIlree et al. (2006) forAlloys 182 a) and 152 b) in low temperature water with varying hydrogen contents.
39
a) b)
Figure 15. SEM images of the fracture surfaces of Alloys 182 a) and 152 b) afterJ-R testing in low temperature water with hydrogen content 30 cm3 H2/kg H2O(McIlree et al., 2006).
Herms et al. (2009) observed that the fracture resistance of Alloy 182 is decreasedeven at very low hydrogen contents (3–5 cm3 H2/kg H2O) of the water. The fracto-graphic examinations showed that the observed decrease of fracture resistance atlow hydrogen content of the water was associated with intergranular cracking.
1.4.2.1 Sources of hydrogen
Hydrogen that is present in materials of nuclear power systems is originated fromthree primary sources that include (Young et al., 2012):
1) Hydrogen from fabrication, i.e. from welding or heat treating in hydrogenbearing atmospheres
2) Corrosion generated hydrogen3) Gaseous hydrogen added to the cooling water
The nickel-based alloys are usually welded using shield gas that consists mostlyof argon. Some hydrogen is sometimes added in order to decrease the amount ofoxidization and to increase the voltage of the arc which in turn increases the weld-ing temperature. Young et al. (2003) measured the bulk hydrogen contents ofEN82H welds after welding using 0–5 % hydrogen in the shielding gas and inaddition to that a shielding gas consisting of helium and argon (75 and 25 %, re-spectively). The hydrogen concentration of as-welded EN82H depends on theshielding gas, as shown in Figure 16. Hydrogen concentrations range from ~12.5wt. ppm in 95% Ar/5 % H2 weld to ~3.5 wt. ppm in the 75% He/25 % Ar weld.
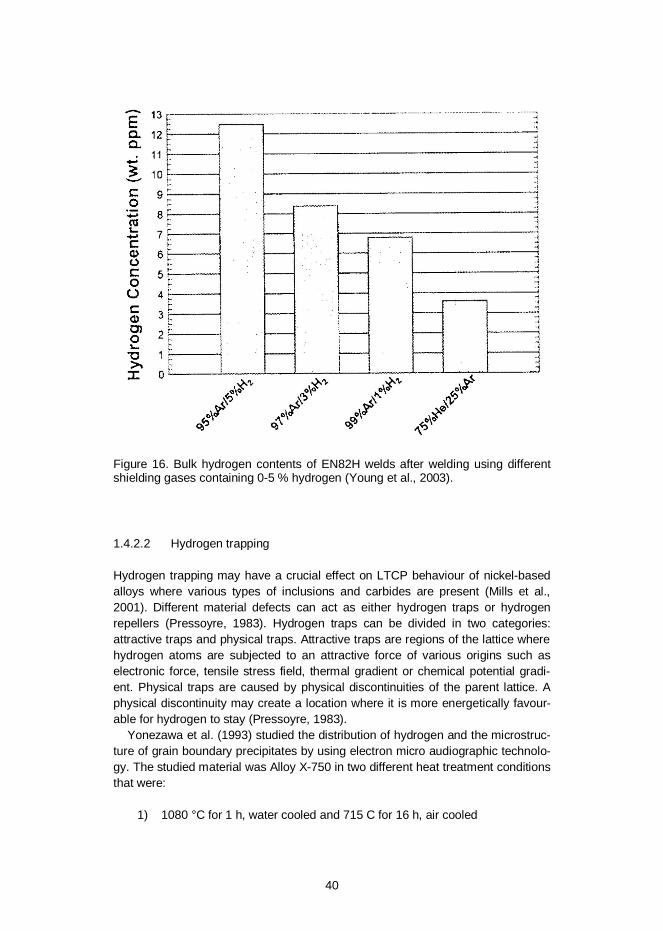
40
Figure 16. Bulk hydrogen contents of EN82H welds after welding using differentshielding gases containing 0-5 % hydrogen (Young et al., 2003).
1.4.2.2 Hydrogen trapping
Hydrogen trapping may have a crucial effect on LTCP behaviour of nickel-basedalloys where various types of inclusions and carbides are present (Mills et al.,2001). Different material defects can act as either hydrogen traps or hydrogenrepellers (Pressoyre, 1983). Hydrogen traps can be divided in two categories:attractive traps and physical traps. Attractive traps are regions of the lattice wherehydrogen atoms are subjected to an attractive force of various origins such aselectronic force, tensile stress field, thermal gradient or chemical potential gradi-ent. Physical traps are caused by physical discontinuities of the parent lattice. Aphysical discontinuity may create a location where it is more energetically favour-able for hydrogen to stay (Pressoyre, 1983).
Yonezawa et al. (1993) studied the distribution of hydrogen and the microstruc-ture of grain boundary precipitates by using electron micro audiographic technolo-gy. The studied material was Alloy X-750 in two different heat treatment conditionsthat were:
1) 1080 °C for 1 h, water cooled and 715 C for 16 h, air cooled
41
2) 982 °C for 1 h, air cooled and 719 °C for 16 h, air cooled.
These heat treatments resulted in different grain boundary carbides. The carbidesin the first heat treatment condition were semi-continuous coherent M23C6 car-bides, and in the second heat treatment condition discrete incoherent Cr carbides.The coherency of the carbides was observed to be important considering theIGSCC susceptibility of Alloy X-750 in SSRT test since only the material with inco-herent carbides showed IGSCC susceptibility in hydrogenated (up to 40 cm3 H2/kgH2O) high temperature simulated PWR water. The measured hydrogen content ofthe fractured material was up to 43 ppm close to the fracture surface of the SSRTspecimen. The conclusion of Yonezawa et al. is that the incoherent precipitatestrap more hydrogen and thus the precipitation conditions on grain boundariesdominate IGSCC susceptibility.
1.4.2.3 Hydrogen-induced degradation mechanisms
Oriani (1993) has reviewed the literature covering the proposed mechanisms forhydrogen-induced fracture. According to Oriani, the most important factor is theability of dissolved hydrogen to lessen the binding forces between metal atoms.This will lead to easier propagation of a cleavage crack, or by reduction of theforce needed for continuous emission of edge dislocations from the tip of a crackleading to easier crack propagation by localized plasticity. Hydrogen at low con-centrations in pure Ni, -Fe, -Ti and Nb decreases the flow stress. Impuritieschange the response drastically. Large concentrations of hydrogen in Ti, Ta, Vand Nb produce brittleness because the hydrides that are formed resist dislocationmotion.
Birnbaum and Sofronis (1994) state that there are several mechanisms that as-pire to explain hydrogen-related fracture phenomena. According the Birnbaum andSofronis, three mechanisms are the most plausible: stress-induced hydride for-mation and cleavage, hydrogen-enhanced localized plasticity (HELP) and hydro-gen-induced decohesion. HELP mechanism is based on the idea that the pres-ence of hydrogen in solid solution decreases the barriers to dislocation motion,thereby increasing the amount of deformation that occurs in a localized regionadjacent to the fracture surface. Hydrogen effects in microscopic scale based onobservations obtained in various in situ TEM studies performed at about 290 K,which allows the observation of the fracture process in real time. Those studieshave been performed for different bcc, fcc and hcp -structured metals coveringvarious solid solutions and precipitations. According to these studies, hydrogenincreases the dislocation mobility under conditions of constant stress. Enhanceddislocation velocities were observed on {112} and {110} slip planes of steel. Inaddition, hydrogen-enhanced operation of dislocation sources was observed with-in the crystals and at grain boundaries. Fractographic examinations also showedthat plastic deformation occurs at regions close to the fracture surface when thespecimen was stressed under hydrogen gas. It was also observed that when acrack stopped after some propagation in vacuum, it continued to grow when hy-
42
drogen gas was added to the environment. Hydrogen locally softens the materialin front of the crack and thus enables the ductile crack growth to continue. Howev-er, the observations of softening in microscopic scale are contradictory to themacroscopic behaviour, because hydrogen charging has been reported to result inincreased flow stress and only in a small number of cases has softening beenobserved. There are two things that are believed to explain this behaviour. Firstly,cathodic charging may introduce high hydrogen concentration gradients and cor-respondingly high stresses near the surface. The consequent hardening of thesurface region may mask the softening caused by hydrogen. Secondly, it hasbeen observed in the case of steels and nickel, that hydrogen induces localizationof slip on a limited number of slip planes. An inhomogeneous distribution of hydro-gen can cause shear localization which can cause significant hardening and in-crease of flow stress even in the presence of reduced barriers to dislocation mo-tion.
Nibur et al. (2006, 2009) studied the effect of dissolved hydrogen on the defor-mation of small volumes of the austenitic stainless steel 21Cr–6Ni–9Mn by usingnanoindentation examinations. Nanoindentation results show that homogeneousnucleation of circular dislocation loops is enhanced in the presence of hydrogen. Itis further shown that this is likely due to hydrogen reducing the shear modulus ofthe material.
Sirois and Birnbaum (1992) studied the effects of hydrogen and carbon onthermally activated deformation in nickel. Angelo et al. (1995) point out that theresults by Sirois and Birnbaum regarding hydrogen effect on dislocation move-ment measured using thin foils of pure nickel are controversial to a study per-formed for bulk nickel-based alloy IN903 specimens by Moody et al. (1993).Moody et al. observed that there is no difference in dislocation dynamics when thematerial is charged with hydrogen, whereas the results from the study by Siroisand Birbaum show that the activation enthalpy for dislocation slip in pure nickeldecreases with increasing hydrogen content. Hence, there is still a lack of consen-sus regarding the viability of the HELP mechanism.
LTCP is widely considered to be a hydrogen-related degradation phenomenon.Brown and Mills (2002) suggest that the intergranular cracking in the case ofLTCP is probably due to hydrogen-induced decohesion process, originally pre-sented by Troiano (1960), whereby hydrogen decreases cohesive strength andpromotes failure along specific crystallographic planes.
1.5 LTCP risk in nickel-based materials
Mills & Brown (1999) have proposed a classification for LTCP risk assessment innuclear power plants based on fracture resistance JIC and tearing resistance Tvalues. The highest risk category is for materials that exhibit JIC values lower than30 kJ/m2 and T below 10. At these toughness levels fracture may occur evenbelow yield stress loadings with relatively small flaw sizes and linear-elastic frac-
43
ture mechanics assessment should be included for design and operational anal-yses. For materials, whose JIC values range from 30 to 150 kJ/m2 and T between10 and 100, stable or unstable fracture can occur at approximately yield strengthloadings for components containing small or intermediate flaw sizes and fracturecontrol based on fracture mechanical analyses (elastic-plastic fracture mechanicsmethods) should be considered. For materials, that exhibit JIC greater than 150kJ/m2 and T above 100, conventional stress limits are adequate for guardingagainst fracture.
LTCP risk in PWR plants has been evaluated by Demma et al. (2005). Demmaet al. point out that LTCP is unlikely to occur during PWR shutdown because suchsituation where pressure, hydrogen addition and low temperature exist simultane-ously is avoided. Cronvall (2011) showed in a structural integrity analysis basedstudy that the critical crack size for Alloy 182 would be slightly more than 50 % ofthe wall thickness that was assumed to be 40 mm. Large cracks would most prob-ably be observed in non-destructive examinations (NDE) before reaching suchsize. On the other hand, if JI values of a crack reach the corresponding JIC valueunder LTCP conditions, the resulting crack growth could be fast and lead to aleaking crack before the next inspections.
1.6 Basics of elastic-plastic fracture mechanics
Linear elastic fracture mechanics (LEFM) is valid only as long as nonlinear materi-al deformation is confined to a small region surrounding the crack tip. In manyductile materials, including nickel-based alloys, it is virtually impossible to charac-terize the fracture behaviour with LEFM, and an alternative fracture mechanicsmodel is required. Elastic-plastic fracture mechanics applies to materials thatexhibit time-independent, nonlinear behaviour (i.e., plastic deformation) (Ander-son, 2005). Fracture resistance behaviour of austenitic materials can be studiede.g. by applying J-R testing.
1.6.1 J-Integral
J-integral represents a way to calculate the energy release rate per unit fracturesurface area in a material. J-integral for a variety of configurations can be writtenas follows (Anderson, 2005):
= (4)
where is a dimensionless constant ( =2 for a deeply cracked plate in pure bend-ing), Uc is the absorbed energy, B is the specimen thickness and b is the unbrokenligament size. Thus, the equation (2) expresses J as the energy absorbed, divided
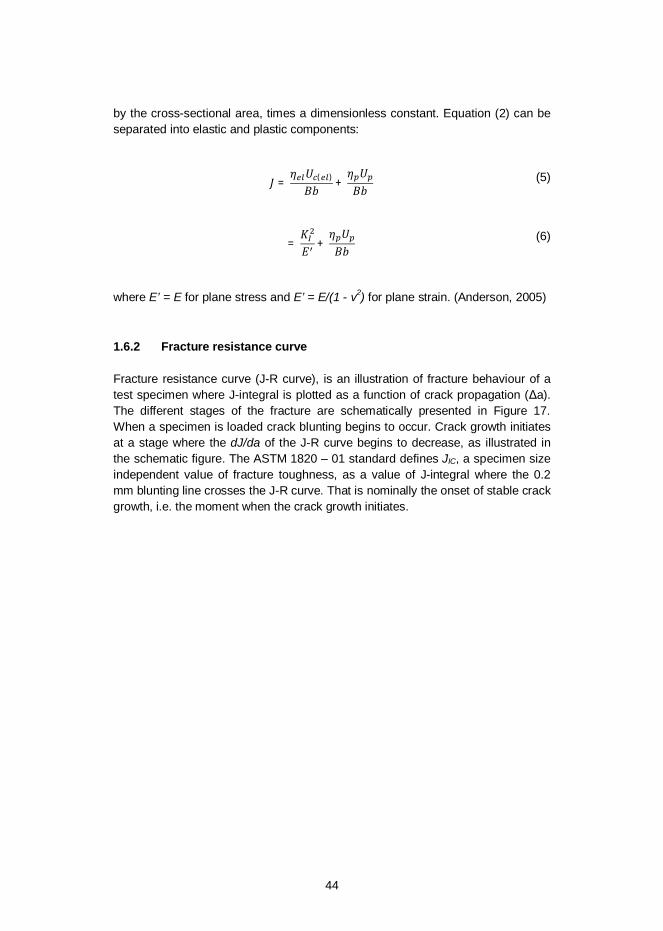
44
by the cross-sectional area, times a dimensionless constant. Equation (2) can beseparated into elastic and plastic components:
= ( ) + (5)
= + (6)
where E’ = E for plane stress and E’ = E/(1 - 2) for plane strain. (Anderson, 2005)
1.6.2 Fracture resistance curve
Fracture resistance curve (J-R curve), is an illustration of fracture behaviour of atest specimen where J-integral is plotted as a function of crack propagation ( a).The different stages of the fracture are schematically presented in Figure 17.When a specimen is loaded crack blunting begins to occur. Crack growth initiatesat a stage where the dJ/da of the J-R curve begins to decrease, as illustrated inthe schematic figure. The ASTM 1820 – 01 standard defines JIC, a specimen sizeindependent value of fracture toughness, as a value of J-integral where the 0.2mm blunting line crosses the J-R curve. That is nominally the onset of stable crackgrowth, i.e. the moment when the crack growth initiates.
45
Figure 17. A schematical illustration of the different stages of fracture during a J-Rtest (Anderson, 2005).
46
2 Objectives of the study
The aim of this study was to perform different experiments that can be used toevaluate the LTCP behaviour of nickel-based alloy welds. The experimental meth-ods selected for the study include J-R tests, microscopy, chemical analyses andhydrogen thermal desorption spectrometry. J-R tests were conducted in order todetermine the fracture resistance behaviour of the studied materials in low tem-perature hydrogenated water. Different types of microscopy and chemical anal-yses were utilized for microstructural characterization of the fracture surfaces of J-R test specimens and cross-sections of the welds. Thermal desorption spectros-copy was applied in order to study the hydrogen trapping behaviour of the studiedmaterials. Electron microscopy (SEM and TEM) was concentrated on the grainboundary structures, especially carbide structures, which provide information onthe possible hydrogen trapping sites.
Some factors that may have an effect on the fracture toughness behaviour ofnickel-based alloy welds have not been extensively studied thus far. These factorsinvolve the effect of high temperature (300 °C) pre-exposure and the effect ofpost-weld heat treatment on the LTCP behaviour of the dissimilar metal welds.The effects of these factors are studied for the DMW materials.
47
3 Materials
Two types of materials have been used to manufacture the SE(B) test specimensfor J-R testing, i.e., all-weld metal blocks and dissimilar metal weld mock-ups. All-weld metal blocks were fabricated by welding Alloy 182, 82, 152 and 52 weldmetals on crossed steel bars. In DMW mock-ups the studied weld metals consistof Alloys 182, 152 and 52. The coupons for thermal desorption spectroscopy wereextracted from DMW mock-ups from the mid-thickness of the weld.
3.1 All-weld metal test blocks
The SE(B) test specimens of all-weld metals, i.e., Alloy 182, Alloy 82, Alloy 152and Alloy 52, were cut from the samples presented in Figure 18. The sampleswere fabricated by welding multiple beads on crossed steel bars, as presented inFigure 19 a). Welding parameters when welding the test blocks were according tothe filler material manufacturer recommendations. The SE(B) specimens for J-Rtests were extracted as illustrated in Figure 19 b). The compositions of the all-weldmetal test blocks are identified in Table 3. The UNS standard compositions ac-cording to Special Metals for the corresponding weld filler metals are presented inTable 4. Compositions of the all-weld metals are within standard specifications,except for the Fe contents of Alloy 82 and 152 that are slightly high (4 and 13 %,respectively), and for the Mn content of Alloy 82 () that is also a little higher than inthe standard composition. Welding was carried out manually without post-weldheat treatment.
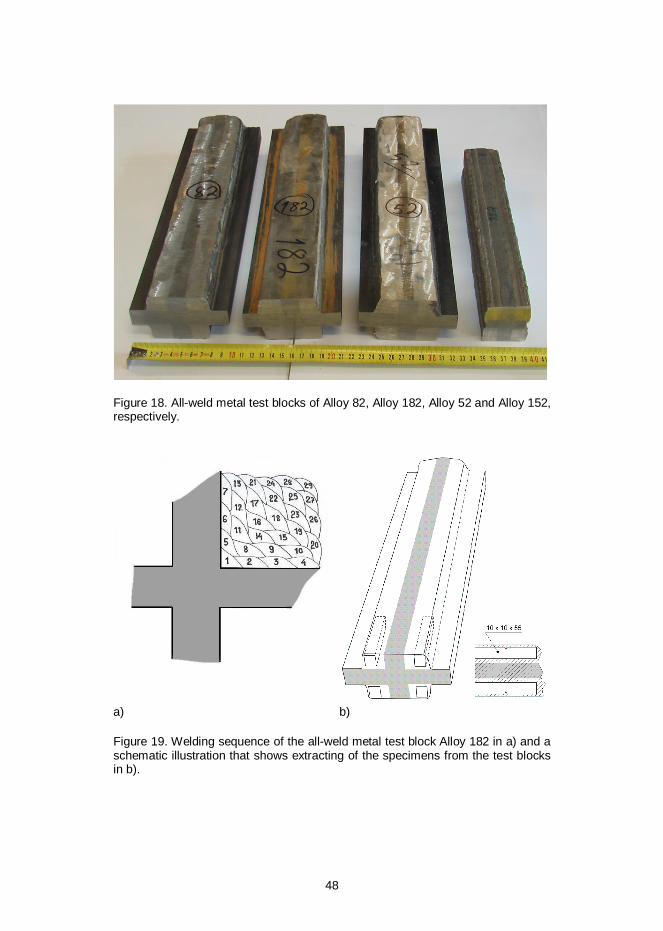
48
Figure 18. All-weld metal test blocks of Alloy 82, Alloy 182, Alloy 52 and Alloy 152,respectively.
a) b)
Figure 19. Welding sequence of the all-weld metal test block Alloy 182 in a) and aschematic illustration that shows extracting of the specimens from the test blocksin b).
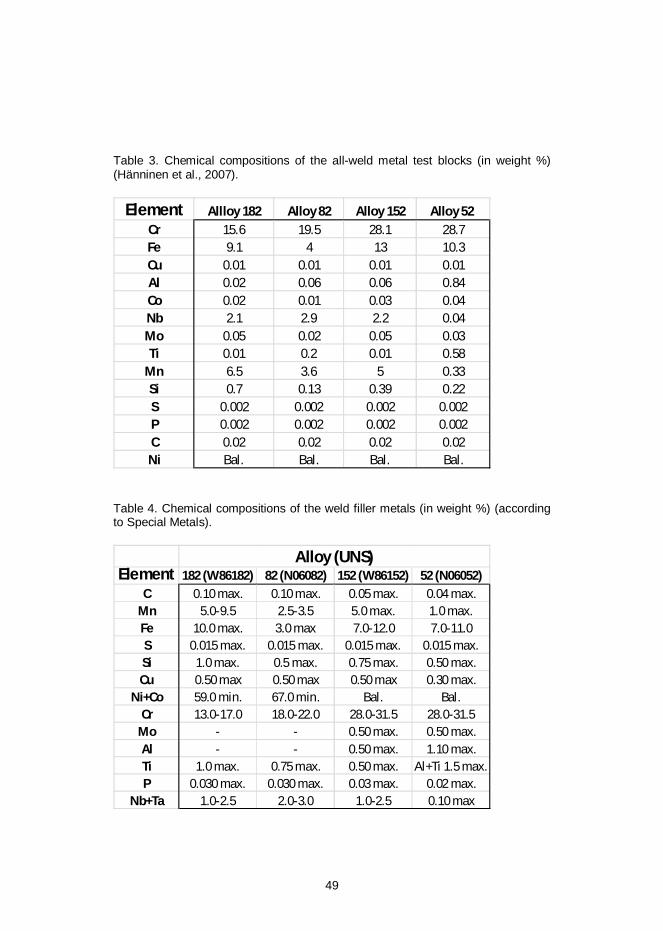
49
Table 3. Chemical compositions of the all-weld metal test blocks (in weight %)(Hänninen et al., 2007).
Table 4. Chemical compositions of the weld filler metals (in weight %) (accordingto Special Metals).
Element Allloy 182 Alloy 82 Alloy 152 Alloy 52Cr 15.6 19.5 28.1 28.7Fe 9.1 4 13 10.3Cu 0.01 0.01 0.01 0.01Al 0.02 0.06 0.06 0.84Co 0.02 0.01 0.03 0.04Nb 2.1 2.9 2.2 0.04Mo 0.05 0.02 0.05 0.03Ti 0.01 0.2 0.01 0.58
Mn 6.5 3.6 5 0.33Si 0.7 0.13 0.39 0.22S 0.002 0.002 0.002 0.002P 0.002 0.002 0.002 0.002C 0.02 0.02 0.02 0.02Ni Bal. Bal. Bal. Bal.
Element 182 (W86182) 82 (N06082) 152 (W86152) 52 (N06052)C 0.10 max. 0.10 max. 0.05 max. 0.04 max.
Mn 5.0-9.5 2.5-3.5 5.0 max. 1.0 max.Fe 10.0 max. 3.0 max 7.0-12.0 7.0-11.0S 0.015 max. 0.015 max. 0.015 max. 0.015 max.Si 1.0 max. 0.5 max. 0.75 max. 0.50 max.Cu 0.50 max 0.50 max 0.50 max 0.30 max.
Ni+Co 59.0 min. 67.0 min. Bal. Bal.Cr 13.0-17.0 18.0-22.0 28.0-31.5 28.0-31.5
Mo - - 0.50 max. 0.50 max.Al - - 0.50 max. 1.10 max.Ti 1.0 max. 0.75 max. 0.50 max. Al+Ti 1.5 max.P 0.030 max. 0.030 max. 0.03 max. 0.02 max.
Nb+Ta 1.0-2.5 2.0-3.0 1.0-2.5 0.10 max
Alloy (UNS)
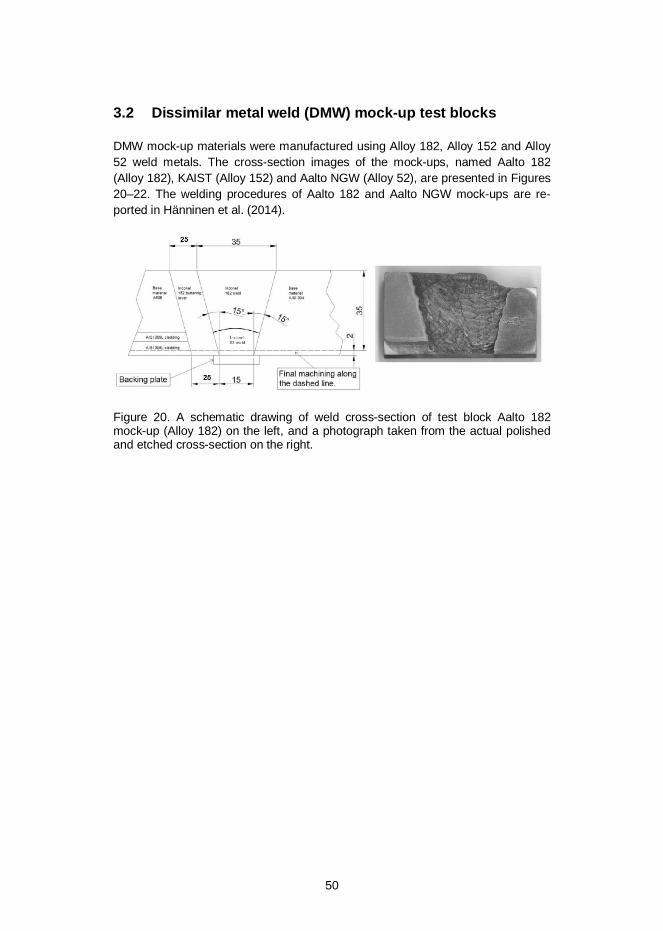
50
3.2 Dissimilar metal weld (DMW) mock-up test blocks
DMW mock-up materials were manufactured using Alloy 182, Alloy 152 and Alloy52 weld metals. The cross-section images of the mock-ups, named Aalto 182(Alloy 182), KAIST (Alloy 152) and Aalto NGW (Alloy 52), are presented in Figures20–22. The welding procedures of Aalto 182 and Aalto NGW mock-ups are re-ported in Hänninen et al. (2014).
Figure 20. A schematic drawing of weld cross-section of test block Aalto 182mock-up (Alloy 182) on the left, and a photograph taken from the actual polishedand etched cross-section on the right.
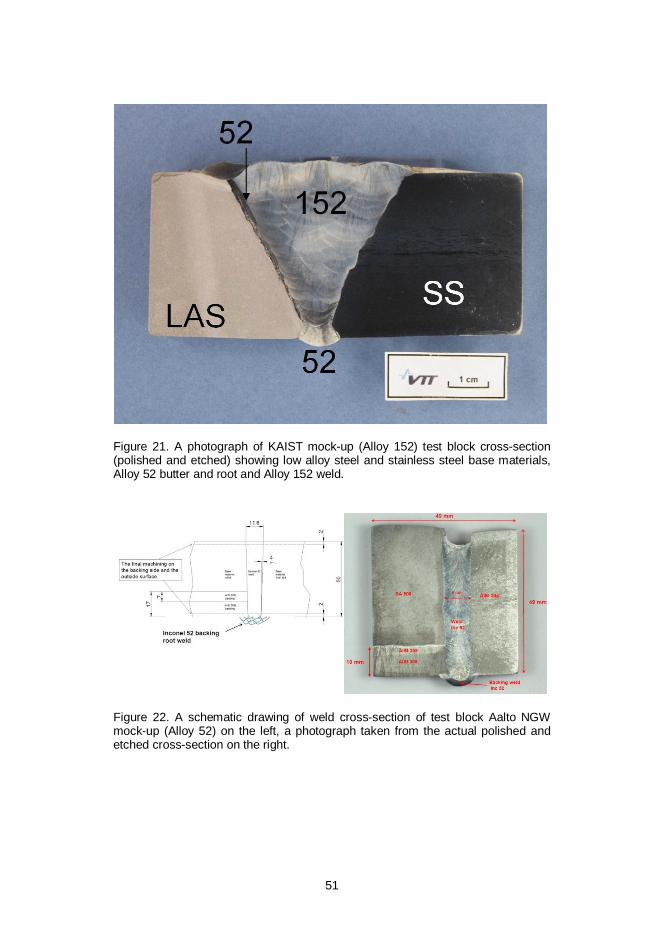
51
Figure 21. A photograph of KAIST mock-up (Alloy 152) test block cross-section(polished and etched) showing low alloy steel and stainless steel base materials,Alloy 52 butter and root and Alloy 152 weld.
Figure 22. A schematic drawing of weld cross-section of test block Aalto NGWmock-up (Alloy 52) on the left, a photograph taken from the actual polished andetched cross-section on the right.
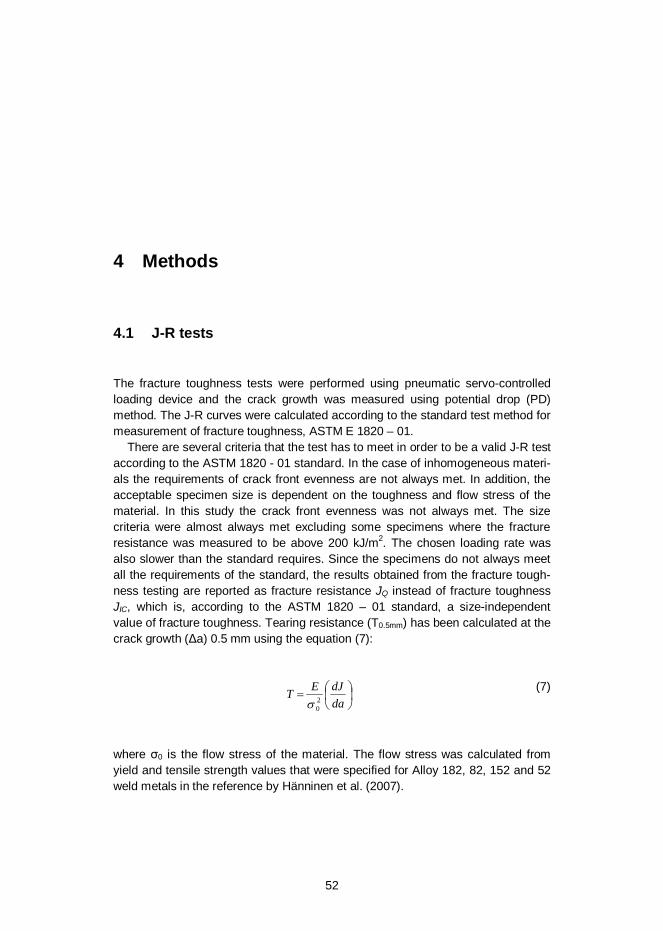
52
4 Methods
4.1 J-R tests
The fracture toughness tests were performed using pneumatic servo-controlledloading device and the crack growth was measured using potential drop (PD)method. The J-R curves were calculated according to the standard test method formeasurement of fracture toughness, ASTM E 1820 – 01.
There are several criteria that the test has to meet in order to be a valid J-R testaccording to the ASTM 1820 - 01 standard. In the case of inhomogeneous materi-als the requirements of crack front evenness are not always met. In addition, theacceptable specimen size is dependent on the toughness and flow stress of thematerial. In this study the crack front evenness was not always met. The sizecriteria were almost always met excluding some specimens where the fractureresistance was measured to be above 200 kJ/m2. The chosen loading rate wasalso slower than the standard requires. Since the specimens do not always meetall the requirements of the standard, the results obtained from the fracture tough-ness testing are reported as fracture resistance JQ instead of fracture toughnessJIC, which is, according to the ASTM 1820 – 01 standard, a size-independentvalue of fracture toughness. Tearing resistance (T0.5mm) has been calculated at thecrack growth ( a) 0.5 mm using the equation (7):
dadJET 2
0
(7)
where 0 is the flow stress of the material. The flow stress was calculated fromyield and tensile strength values that were specified for Alloy 182, 82, 152 and 52weld metals in the reference by Hänninen et al. (2007).
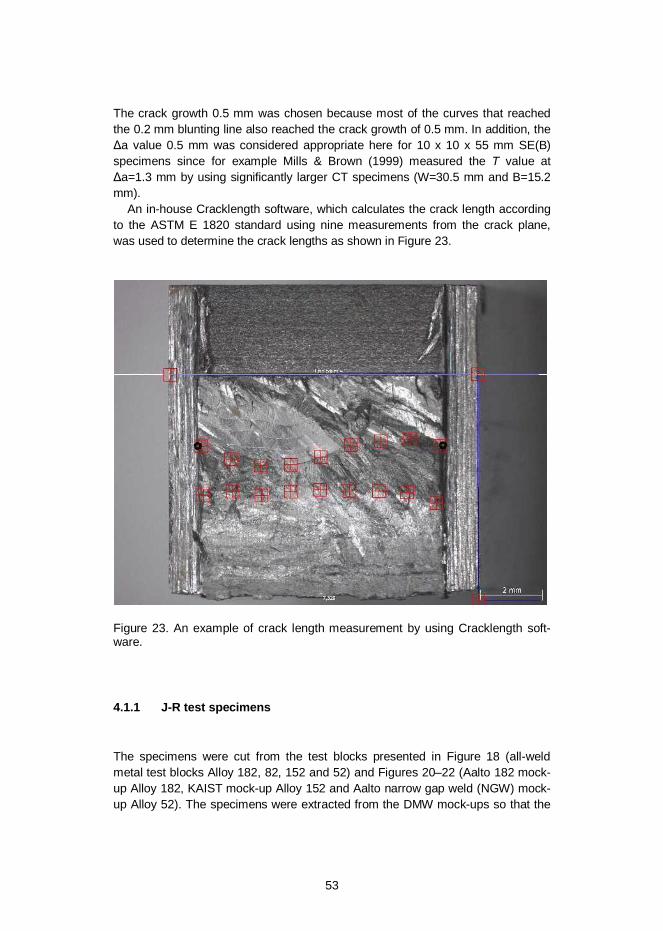
53
The crack growth 0.5 mm was chosen because most of the curves that reachedthe 0.2 mm blunting line also reached the crack growth of 0.5 mm. In addition, the
a value 0.5 mm was considered appropriate here for 10 x 10 x 55 mm SE(B)specimens since for example Mills & Brown (1999) measured the T value at
a=1.3 mm by using significantly larger CT specimens (W=30.5 mm and B=15.2mm).
An in-house Cracklength software, which calculates the crack length accordingto the ASTM E 1820 standard using nine measurements from the crack plane,was used to determine the crack lengths as shown in Figure 23.
Figure 23. An example of crack length measurement by using Cracklength soft-ware.
4.1.1 J-R test specimens
The specimens were cut from the test blocks presented in Figure 18 (all-weldmetal test blocks Alloy 182, 82, 152 and 52) and Figures 20–22 (Aalto 182 mock-up Alloy 182, KAIST mock-up Alloy 152 and Aalto narrow gap weld (NGW) mock-up Alloy 52). The specimens were extracted from the DMW mock-ups so that the
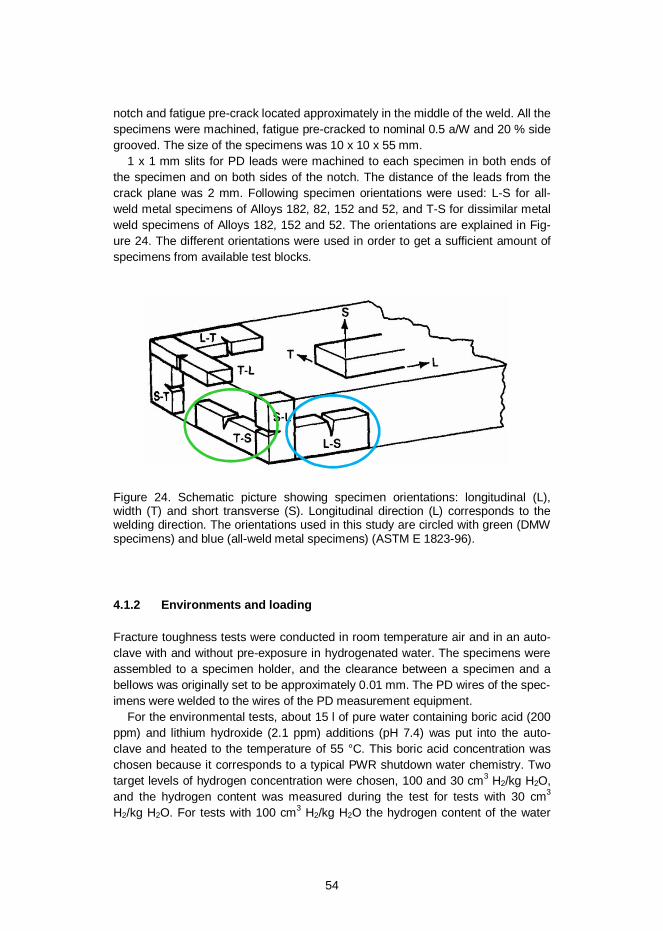
54
notch and fatigue pre-crack located approximately in the middle of the weld. All thespecimens were machined, fatigue pre-cracked to nominal 0.5 a/W and 20 % sidegrooved. The size of the specimens was 10 x 10 x 55 mm.
1 x 1 mm slits for PD leads were machined to each specimen in both ends ofthe specimen and on both sides of the notch. The distance of the leads from thecrack plane was 2 mm. Following specimen orientations were used: L-S for all-weld metal specimens of Alloys 182, 82, 152 and 52, and T-S for dissimilar metalweld specimens of Alloys 182, 152 and 52. The orientations are explained in Fig-ure 24. The different orientations were used in order to get a sufficient amount ofspecimens from available test blocks.
Figure 24. Schematic picture showing specimen orientations: longitudinal (L),width (T) and short transverse (S). Longitudinal direction (L) corresponds to thewelding direction. The orientations used in this study are circled with green (DMWspecimens) and blue (all-weld metal specimens) (ASTM E 1823-96).
4.1.2 Environments and loading
Fracture toughness tests were conducted in room temperature air and in an auto-clave with and without pre-exposure in hydrogenated water. The specimens wereassembled to a specimen holder, and the clearance between a specimen and abellows was originally set to be approximately 0.01 mm. The PD wires of the spec-imens were welded to the wires of the PD measurement equipment.
For the environmental tests, about 15 l of pure water containing boric acid (200ppm) and lithium hydroxide (2.1 ppm) additions (pH 7.4) was put into the auto-clave and heated to the temperature of 55 °C. This boric acid concentration waschosen because it corresponds to a typical PWR shutdown water chemistry. Twotarget levels of hydrogen concentration were chosen, 100 and 30 cm3 H2/kg H2O,and the hydrogen content was measured during the test for tests with 30 cm3
H2/kg H2O. For tests with 100 cm3 H2/kg H2O the hydrogen content of the water
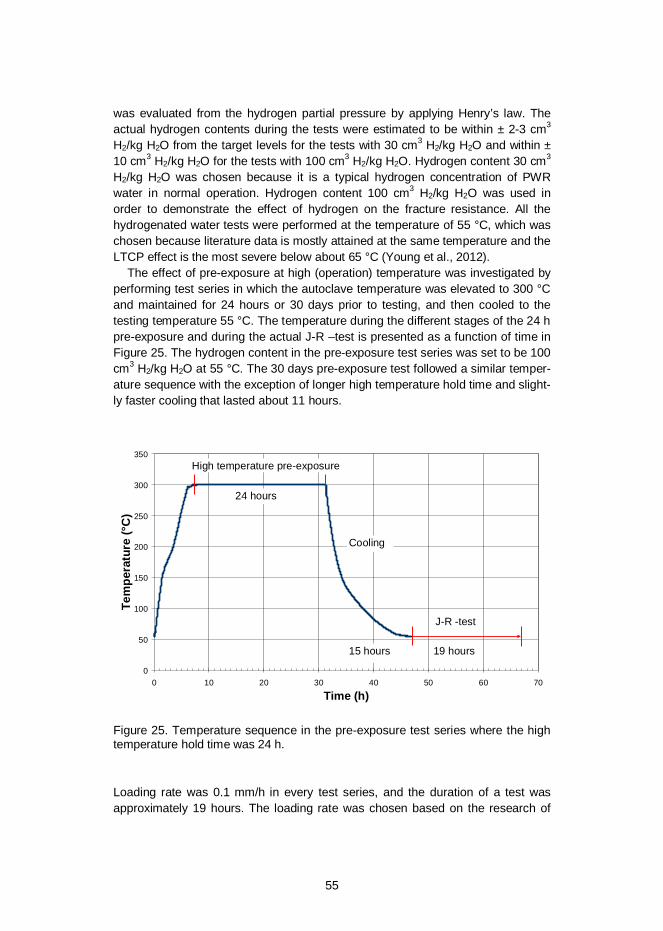
55
was evaluated from the hydrogen partial pressure by applying Henry’s law. Theactual hydrogen contents during the tests were estimated to be within ± 2-3 cm3
H2/kg H2O from the target levels for the tests with 30 cm3 H2/kg H2O and within ±10 cm3 H2/kg H2O for the tests with 100 cm3 H2/kg H2O. Hydrogen content 30 cm3
H2/kg H2O was chosen because it is a typical hydrogen concentration of PWRwater in normal operation. Hydrogen content 100 cm3 H2/kg H2O was used inorder to demonstrate the effect of hydrogen on the fracture resistance. All thehydrogenated water tests were performed at the temperature of 55 °C, which waschosen because literature data is mostly attained at the same temperature and theLTCP effect is the most severe below about 65 °C (Young et al., 2012).
The effect of pre-exposure at high (operation) temperature was investigated byperforming test series in which the autoclave temperature was elevated to 300 °Cand maintained for 24 hours or 30 days prior to testing, and then cooled to thetesting temperature 55 °C. The temperature during the different stages of the 24 hpre-exposure and during the actual J-R –test is presented as a function of time inFigure 25. The hydrogen content in the pre-exposure test series was set to be 100cm3 H2/kg H2O at 55 °C. The 30 days pre-exposure test followed a similar temper-ature sequence with the exception of longer high temperature hold time and slight-ly faster cooling that lasted about 11 hours.
Figure 25. Temperature sequence in the pre-exposure test series where the hightemperature hold time was 24 h.
Loading rate was 0.1 mm/h in every test series, and the duration of a test wasapproximately 19 hours. The loading rate was chosen based on the research of
0
50
100
150
200
250
300
350
0 10 20 30 40 50 60 70
Time (h)
Tem
pera
ture
(°C
)
J-R -test
15 hours
24 hours
19 hours
High temperature pre-exposure
Cooling
56
Mills and Brown (2001), so that the rate is clearly slower than the threshold rate,1.3 mm/h, proposed for CT-specimens (W = 30.5 mm, B = 15.2 mm) of AlloyEN82H, which corresponds to =100 MPa m1/2/h. In the case of SE(B) specimensof Alloy 182, 82, 152 and 52 weld metals, the chosen rate corresponds to valuesin the range of 24–31 MPa m1/2/h. The features affecting the value, which isconstant over the linear part of a constant displacement rate test, are the stiffnessand the initial crack length of a specimen. The chosen loading rate is slower thanthe ASTM E 1820 – 01 standard rate for SE(B) specimen testing. The standardlimits the time to reach the load Pf between 0.1 and 10.0 min, and in these teststhe corresponding time was approximately 40 min. The load Pf is defined as:
SBb
P Yf
205.0 (8)
4.1.3 Post-weld heat treatments
Post-weld heat treatment was performed for some samples extracted from NGWAlloy 52 and Aalto Alloy 182 mock-ups. Heat treatment for specimens of NGWAlloy 52 mock-up was 550 ± 15 C for 17.1 h following 610 ± 15 C for 7.4 h. Heattreatment for specimens of Aalto Alloy 182 was 615 °C for 6 h.
4.1.4 Test matrix for J-R tests
The test matrix consisting of successful tests conducted in low temperature wateris presented in Table 5. Some of the performed tests were unsuccessful due toproblems that occurred with measurements. Reference tests for Alloy 182, 82, 152and 52 weld metals were also performed in air in addition to environment tests,that are listed in Table 5.
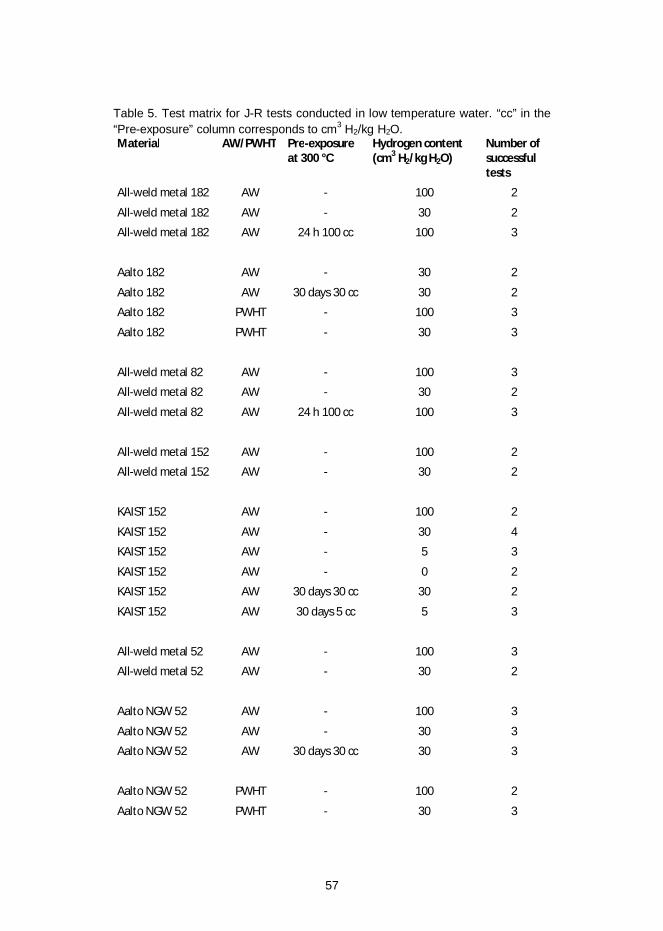
57
Table 5. Test matrix for J-R tests conducted in low temperature water. “cc” in the“Pre-exposure” column corresponds to cm3 H2/kg H2O.Material AW/PWHT Pre-exposure
at 300 °CHydrogen content(cm3 H2/kg H2O)
Number ofsuccessfultests
All-weld metal 182 AW - 100 2
All-weld metal 182 AW - 30 2
All-weld metal 182 AW 24 h 100 cc 100 3
Aalto 182 AW - 30 2
Aalto 182 AW 30 days 30 cc 30 2
Aalto 182 PWHT - 100 3
Aalto 182 PWHT - 30 3
All-weld metal 82 AW - 100 3
All-weld metal 82 AW - 30 2
All-weld metal 82 AW 24 h 100 cc 100 3
All-weld metal 152 AW - 100 2
All-weld metal 152 AW - 30 2
KAIST 152 AW - 100 2
KAIST 152 AW - 30 4
KAIST 152 AW - 5 3
KAIST 152 AW - 0 2
KAIST 152 AW 30 days 30 cc 30 2
KAIST 152 AW 30 days 5 cc 5 3
All-weld metal 52 AW - 100 3
All-weld metal 52 AW - 30 2
Aalto NGW 52 AW - 100 3
Aalto NGW 52 AW - 30 3
Aalto NGW 52 AW 30 days 30 cc 30 3
Aalto NGW 52 PWHT - 100 2
Aalto NGW 52 PWHT - 30 3
58
4.2 Microscopy
Optical microscopy was applied in order to examine the grain and dendrite struc-ture of the studied materials. Fractographic examinations were performed by usingScanning Electron Microscopy (SEM) in order to get more information on thecracking that occurred during J-R testing. The microscopy results for each materi-al, Alloy 182, 82, 152 and 52 weld metals, are presented, although the main focusof the SEM study was in Alloys 182 and 52 and especially in specimens tested inwater with high hydrogen content. The SEM examinations were performed at bothAalto University and at VTT. The microscope used at Aalto University was ZeissUltra 55 SEM and at VTT both Zeiss Ultra Plus field emission SEM and PhilipsXL30 ESEM microscopes were used. In addition, Transmission Electron Micros-copy (TEM) was applied in order to study the carbides located at the differentboundaries of Alloy 182 and 52 weld metals. The TEM specimens were extractedfrom the DMW materials of Alloys 182 and 52 and the materials were studied inboth as-welded (AW) and post-weld heat treated (PWHT) conditions. TEM exami-nations were carried out by using VTT’s microscope Philips CM200 FEG-STEM.Compositional analyses were carried out utilizing a Noran Voyager energy disper-sive X-ray analyser and Gatan System Six software. A liquid nitrogen cold-fingerwas also employed in order to help reduce hydrocarbon contamination in the mi-croscope.
4.3 Hardness measurements
Vickers hardness was measured for all-weld metal and DMW test blocks by apply-ing a load of 1 kg. The measurements were conducted on polished weld cross-sections, and the presented values are averages from at least five measurementsthat were located approximately in the middle of the welds, thus being representa-tive to the location of the pre-crack tip of a J-R test specimen.
4.4 TDS measurements
Thermal desorption spectra (TDS) were determined for Alloy 182, 152 and 52DMW samples. TDS curves were measured for Alloys 182, 52 and 152 for as-welded condition and for Alloys 182 and 52 also in relevant PWHT condition. Theeffect of pre-exposure at high temperature (300 °C) water was also studied byusing hydrogen contents 5 and 30 cm3 H2/kg H2O. The studied coupons wereextracted from DMW mock-ups that were also used for the J-R tests. The dimen-
59
sions of the TDS coupons were about 10 x 4 x 0.9 mm and they were grinded andcleaned before the measurements.
TDS measurements were carried out with a thermal desorption apparatus de-signed and assembled at Aalto University. It allows to analyse hydrogen desorp-tion in the temperature range of 25 to 1000 °C with background vacuum levelbetter than 10-8 mbar. The apparatus consists of main UHV (ultra-high vacuum)chamber equipped with furnace and mass spectrometer and high-vacuum air-locksystem for the sample supply into the main chamber. The heating system providesa direct control of the heating rate from 1 to 10 °C/min. Heating rate for most of themeasurements in this study was 6 °C/min. Additionally, heating rates of 3 and 9°C/min were applied for Alloys 182 and 52. Specimens for TDS measurementswere cleaned before measurements with acetone in an ultrasonic bath for 1 minand dried in the He-gas flow to remove any water residuals from the specimensurface.
Activation energies were determined for Alloys 182 and 52 (DMW samples) ac-cording to the model presented by Lee and Lee (1984) and later applied by e.g.Young et al. (1997) and Ai et al. (2013). Activation energy for hydrogen desorp-tion, ET, can be calculated for the desorption site observed using ramped TDSdata obtained at different heating rates, which produce a different desorption peaktemperature, Tc. The Tc increases with the heating rate, (= dT/dt), and ET de-pends on Tc and according to the following equation:
ln( )(1 ) = (9)
The hydrogen activation energy (ET) needed to escape from the trap site to thenormal lattice site is calculated from the slope of ln ( / ) vs (1/Tc) plot by measur-ing the change of peak temperatures with the heating rates.
4.5 Bulk hydrogen measurements
The bulk hydrogen measurements for DMW samples of Alloys 182, 152 and 52were performed using hydrogen measurement system of Leybold-Heraeus. Thesamples were grinded and cleaned prior to the measurements. The hydrogencontents were measured from as-welded samples (Alloys 182, 152 and 52) andpre-exposure (30 days at 300 °C PWR water with 30 cm3 H2/kg H2O) samples(Alloys 182 and 152).
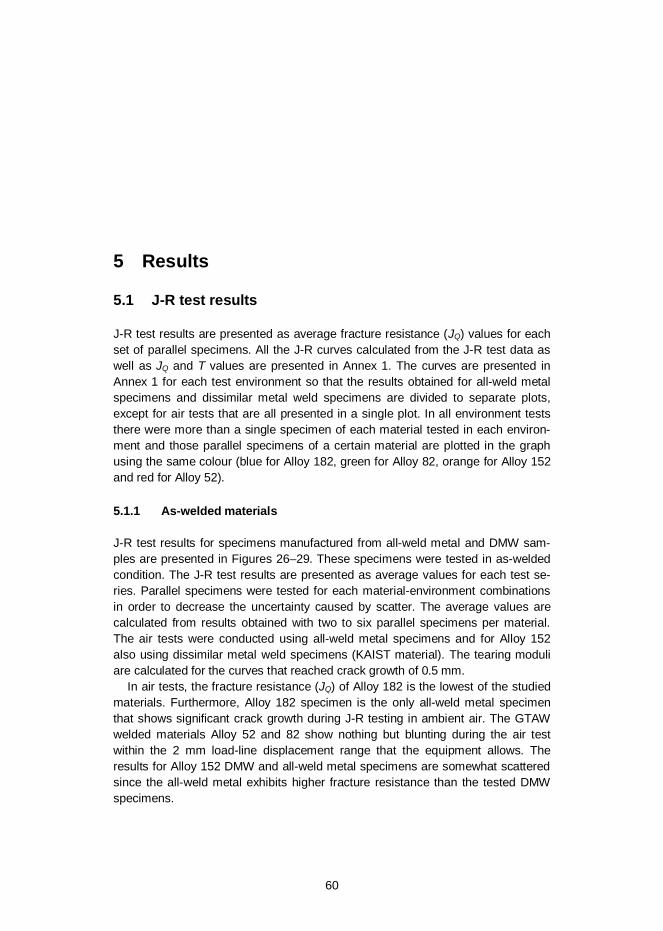
60
5 Results
5.1 J-R test results
J-R test results are presented as average fracture resistance (JQ) values for eachset of parallel specimens. All the J-R curves calculated from the J-R test data aswell as JQ and T values are presented in Annex 1. The curves are presented inAnnex 1 for each test environment so that the results obtained for all-weld metalspecimens and dissimilar metal weld specimens are divided to separate plots,except for air tests that are all presented in a single plot. In all environment teststhere were more than a single specimen of each material tested in each environ-ment and those parallel specimens of a certain material are plotted in the graphusing the same colour (blue for Alloy 182, green for Alloy 82, orange for Alloy 152and red for Alloy 52).
5.1.1 As-welded materials
J-R test results for specimens manufactured from all-weld metal and DMW sam-ples are presented in Figures 26–29. These specimens were tested in as-weldedcondition. The J-R test results are presented as average values for each test se-ries. Parallel specimens were tested for each material-environment combinationsin order to decrease the uncertainty caused by scatter. The average values arecalculated from results obtained with two to six parallel specimens per material.The air tests were conducted using all-weld metal specimens and for Alloy 152also using dissimilar metal weld specimens (KAIST material). The tearing moduliare calculated for the curves that reached crack growth of 0.5 mm.
In air tests, the fracture resistance (JQ) of Alloy 182 is the lowest of the studiedmaterials. Furthermore, Alloy 182 specimen is the only all-weld metal specimenthat shows significant crack growth during J-R testing in ambient air. The GTAWwelded materials Alloy 52 and 82 show nothing but blunting during the air testwithin the 2 mm load-line displacement range that the equipment allows. Theresults for Alloy 152 DMW and all-weld metal specimens are somewhat scatteredsince the all-weld metal exhibits higher fracture resistance than the tested DMWspecimens.
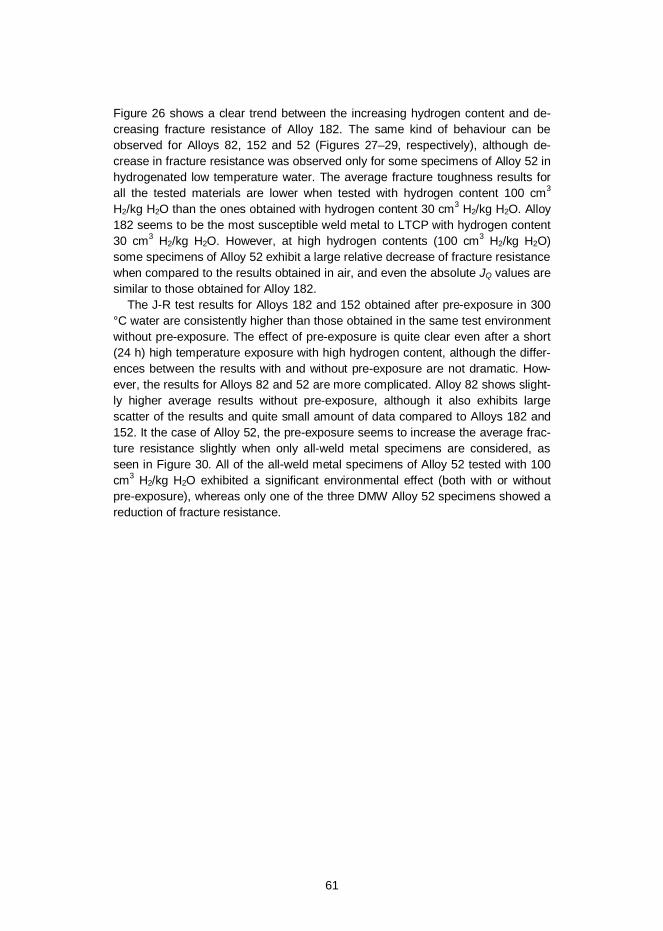
61
Figure 26 shows a clear trend between the increasing hydrogen content and de-creasing fracture resistance of Alloy 182. The same kind of behaviour can beobserved for Alloys 82, 152 and 52 (Figures 27–29, respectively), although de-crease in fracture resistance was observed only for some specimens of Alloy 52 inhydrogenated low temperature water. The average fracture toughness results forall the tested materials are lower when tested with hydrogen content 100 cm3
H2/kg H2O than the ones obtained with hydrogen content 30 cm3 H2/kg H2O. Alloy182 seems to be the most susceptible weld metal to LTCP with hydrogen content30 cm3 H2/kg H2O. However, at high hydrogen contents (100 cm3 H2/kg H2O)some specimens of Alloy 52 exhibit a large relative decrease of fracture resistancewhen compared to the results obtained in air, and even the absolute JQ values aresimilar to those obtained for Alloy 182.
The J-R test results for Alloys 182 and 152 obtained after pre-exposure in 300°C water are consistently higher than those obtained in the same test environmentwithout pre-exposure. The effect of pre-exposure is quite clear even after a short(24 h) high temperature exposure with high hydrogen content, although the differ-ences between the results with and without pre-exposure are not dramatic. How-ever, the results for Alloys 82 and 52 are more complicated. Alloy 82 shows slight-ly higher average results without pre-exposure, although it also exhibits largescatter of the results and quite small amount of data compared to Alloys 182 and152. It the case of Alloy 52, the pre-exposure seems to increase the average frac-ture resistance slightly when only all-weld metal specimens are considered, asseen in Figure 30. All of the all-weld metal specimens of Alloy 52 tested with 100cm3 H2/kg H2O exhibited a significant environmental effect (both with or withoutpre-exposure), whereas only one of the three DMW Alloy 52 specimens showed areduction of fracture resistance.
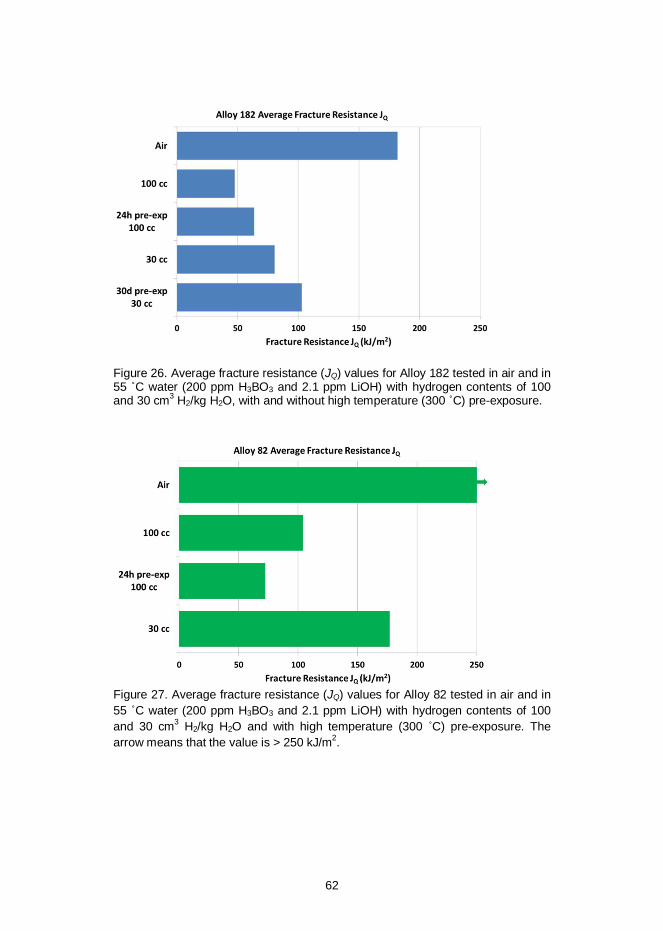
62
Figure 26. Average fracture resistance (JQ) values for Alloy 182 tested in air and in55 C water (200 ppm H3BO3 and 2.1 ppm LiOH) with hydrogen contents of 100and 30 cm3 H2/kg H2O, with and without high temperature (300 C) pre-exposure.
Figure 27. Average fracture resistance (JQ) values for Alloy 82 tested in air and in55 C water (200 ppm H3BO3 and 2.1 ppm LiOH) with hydrogen contents of 100and 30 cm3 H2/kg H2O and with high temperature (300 C) pre-exposure. Thearrow means that the value is > 250 kJ/m2.
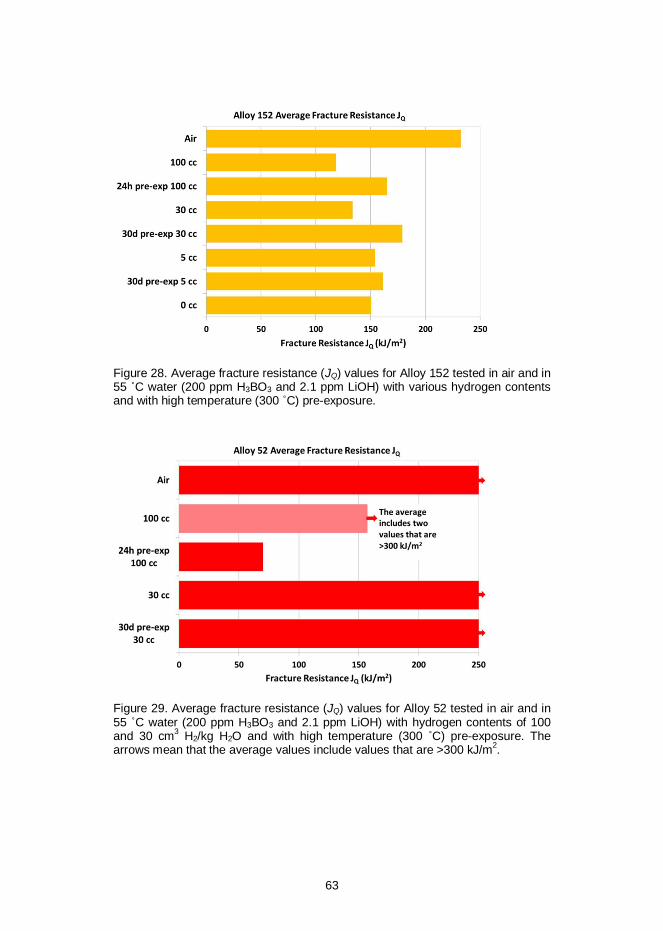
63
Figure 28. Average fracture resistance (JQ) values for Alloy 152 tested in air and in55 C water (200 ppm H3BO3 and 2.1 ppm LiOH) with various hydrogen contentsand with high temperature (300 C) pre-exposure.
Figure 29. Average fracture resistance (JQ) values for Alloy 52 tested in air and in55 C water (200 ppm H3BO3 and 2.1 ppm LiOH) with hydrogen contents of 100and 30 cm3 H2/kg H2O and with high temperature (300 C) pre-exposure. Thearrows mean that the average values include values that are >300 kJ/m2.
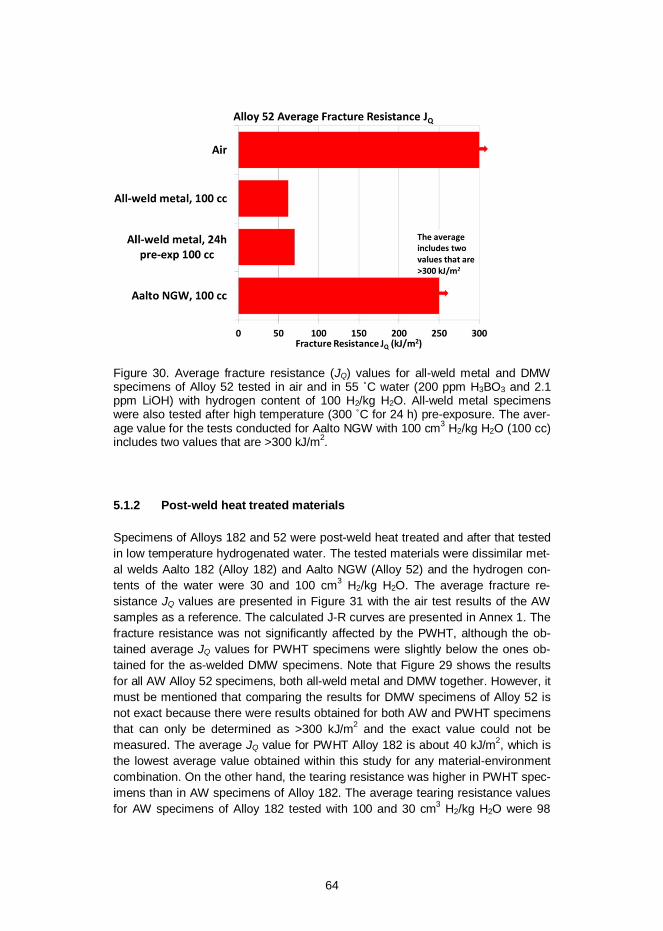
64
Figure 30. Average fracture resistance (JQ) values for all-weld metal and DMWspecimens of Alloy 52 tested in air and in 55 C water (200 ppm H3BO3 and 2.1ppm LiOH) with hydrogen content of 100 H2/kg H2O. All-weld metal specimenswere also tested after high temperature (300 C for 24 h) pre-exposure. The aver-age value for the tests conducted for Aalto NGW with 100 cm3 H2/kg H2O (100 cc)includes two values that are >300 kJ/m2.
5.1.2 Post-weld heat treated materials
Specimens of Alloys 182 and 52 were post-weld heat treated and after that testedin low temperature hydrogenated water. The tested materials were dissimilar met-al welds Aalto 182 (Alloy 182) and Aalto NGW (Alloy 52) and the hydrogen con-tents of the water were 30 and 100 cm3 H2/kg H2O. The average fracture re-sistance JQ values are presented in Figure 31 with the air test results of the AWsamples as a reference. The calculated J-R curves are presented in Annex 1. Thefracture resistance was not significantly affected by the PWHT, although the ob-tained average JQ values for PWHT specimens were slightly below the ones ob-tained for the as-welded DMW specimens. Note that Figure 29 shows the resultsfor all AW Alloy 52 specimens, both all-weld metal and DMW together. However, itmust be mentioned that comparing the results for DMW specimens of Alloy 52 isnot exact because there were results obtained for both AW and PWHT specimensthat can only be determined as >300 kJ/m2 and the exact value could not bemeasured. The average JQ value for PWHT Alloy 182 is about 40 kJ/m2, which isthe lowest average value obtained within this study for any material-environmentcombination. On the other hand, the tearing resistance was higher in PWHT spec-imens than in AW specimens of Alloy 182. The average tearing resistance valuesfor AW specimens of Alloy 182 tested with 100 and 30 cm3 H2/kg H2O were 98
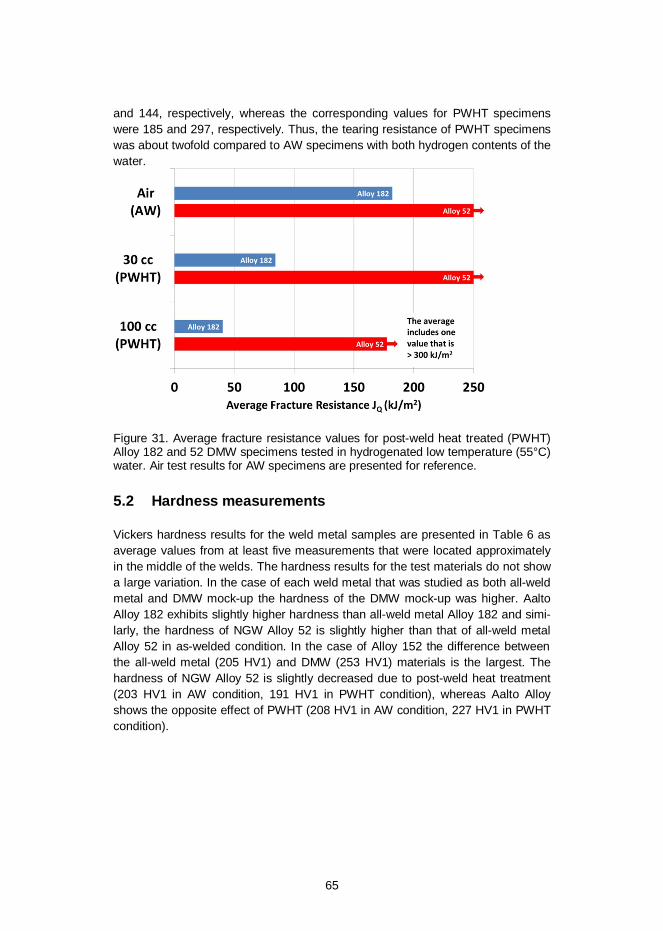
65
and 144, respectively, whereas the corresponding values for PWHT specimenswere 185 and 297, respectively. Thus, the tearing resistance of PWHT specimenswas about twofold compared to AW specimens with both hydrogen contents of thewater.
Figure 31. Average fracture resistance values for post-weld heat treated (PWHT)Alloy 182 and 52 DMW specimens tested in hydrogenated low temperature (55°C)water. Air test results for AW specimens are presented for reference.
5.2 Hardness measurements
Vickers hardness results for the weld metal samples are presented in Table 6 asaverage values from at least five measurements that were located approximatelyin the middle of the welds. The hardness results for the test materials do not showa large variation. In the case of each weld metal that was studied as both all-weldmetal and DMW mock-up the hardness of the DMW mock-up was higher. AaltoAlloy 182 exhibits slightly higher hardness than all-weld metal Alloy 182 and simi-larly, the hardness of NGW Alloy 52 is slightly higher than that of all-weld metalAlloy 52 in as-welded condition. In the case of Alloy 152 the difference betweenthe all-weld metal (205 HV1) and DMW (253 HV1) materials is the largest. Thehardness of NGW Alloy 52 is slightly decreased due to post-weld heat treatment(203 HV1 in AW condition, 191 HV1 in PWHT condition), whereas Aalto Alloyshows the opposite effect of PWHT (208 HV1 in AW condition, 227 HV1 in PWHTcondition).
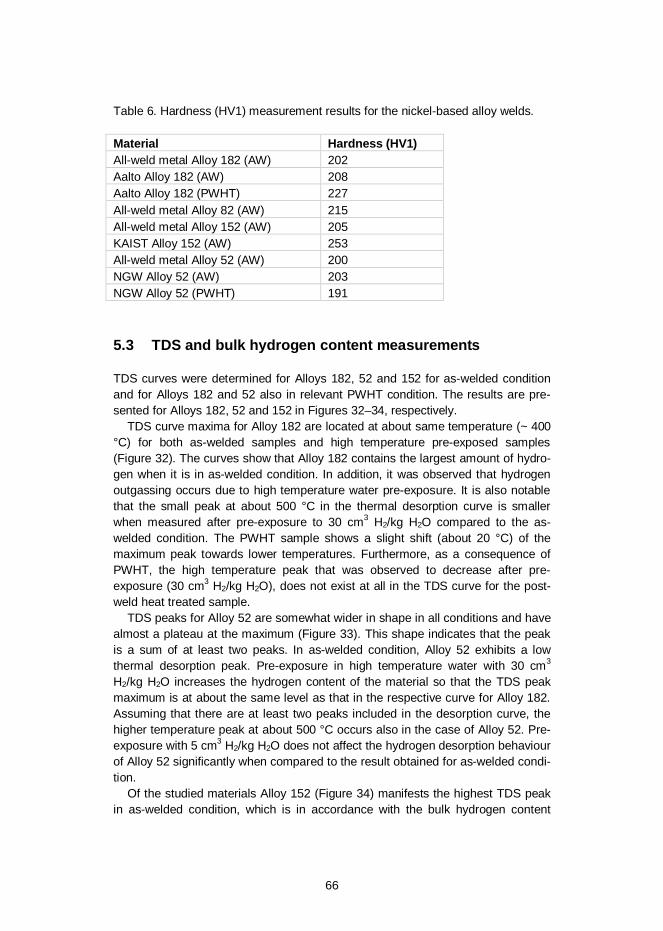
66
Table 6. Hardness (HV1) measurement results for the nickel-based alloy welds.
Material Hardness (HV1)All-weld metal Alloy 182 (AW) 202Aalto Alloy 182 (AW) 208Aalto Alloy 182 (PWHT) 227All-weld metal Alloy 82 (AW) 215All-weld metal Alloy 152 (AW) 205KAIST Alloy 152 (AW) 253All-weld metal Alloy 52 (AW) 200NGW Alloy 52 (AW) 203NGW Alloy 52 (PWHT) 191
5.3 TDS and bulk hydrogen content measurements
TDS curves were determined for Alloys 182, 52 and 152 for as-welded conditionand for Alloys 182 and 52 also in relevant PWHT condition. The results are pre-sented for Alloys 182, 52 and 152 in Figures 32–34, respectively.
TDS curve maxima for Alloy 182 are located at about same temperature (~ 400°C) for both as-welded samples and high temperature pre-exposed samples(Figure 32). The curves show that Alloy 182 contains the largest amount of hydro-gen when it is in as-welded condition. In addition, it was observed that hydrogenoutgassing occurs due to high temperature water pre-exposure. It is also notablethat the small peak at about 500 °C in the thermal desorption curve is smallerwhen measured after pre-exposure to 30 cm3 H2/kg H2O compared to the as-welded condition. The PWHT sample shows a slight shift (about 20 °C) of themaximum peak towards lower temperatures. Furthermore, as a consequence ofPWHT, the high temperature peak that was observed to decrease after pre-exposure (30 cm3 H2/kg H2O), does not exist at all in the TDS curve for the post-weld heat treated sample.
TDS peaks for Alloy 52 are somewhat wider in shape in all conditions and havealmost a plateau at the maximum (Figure 33). This shape indicates that the peakis a sum of at least two peaks. In as-welded condition, Alloy 52 exhibits a lowthermal desorption peak. Pre-exposure in high temperature water with 30 cm3
H2/kg H2O increases the hydrogen content of the material so that the TDS peakmaximum is at about the same level as that in the respective curve for Alloy 182.Assuming that there are at least two peaks included in the desorption curve, thehigher temperature peak at about 500 °C occurs also in the case of Alloy 52. Pre-exposure with 5 cm3 H2/kg H2O does not affect the hydrogen desorption behaviourof Alloy 52 significantly when compared to the result obtained for as-welded condi-tion.
Of the studied materials Alloy 152 (Figure 34) manifests the highest TDS peakin as-welded condition, which is in accordance with the bulk hydrogen content
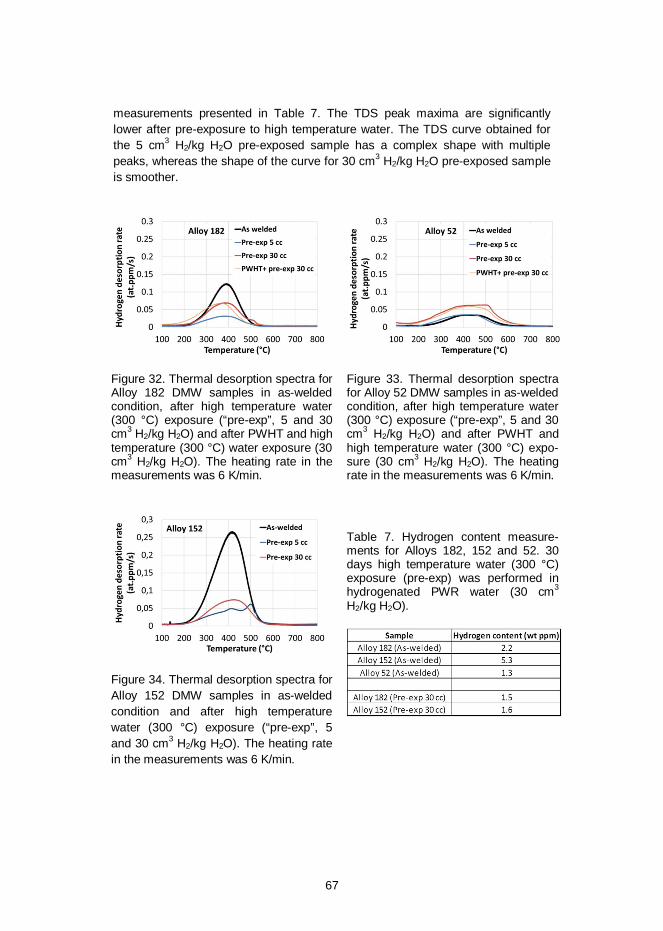
67
measurements presented in Table 7. The TDS peak maxima are significantlylower after pre-exposure to high temperature water. The TDS curve obtained forthe 5 cm3 H2/kg H2O pre-exposed sample has a complex shape with multiplepeaks, whereas the shape of the curve for 30 cm3 H2/kg H2O pre-exposed sampleis smoother.
Figure 32. Thermal desorption spectra forAlloy 182 DMW samples in as-weldedcondition, after high temperature water(300 °C) exposure (“pre-exp”, 5 and 30cm3 H2/kg H2O) and after PWHT and hightemperature (300 °C) water exposure (30cm3 H2/kg H2O). The heating rate in themeasurements was 6 K/min.
Figure 33. Thermal desorption spectrafor Alloy 52 DMW samples in as-weldedcondition, after high temperature water(300 °C) exposure (“pre-exp”, 5 and 30cm3 H2/kg H2O) and after PWHT andhigh temperature water (300 °C) expo-sure (30 cm3 H2/kg H2O). The heatingrate in the measurements was 6 K/min.
Figure 34. Thermal desorption spectra forAlloy 152 DMW samples in as-weldedcondition and after high temperaturewater (300 °C) exposure (“pre-exp”, 5and 30 cm3 H2/kg H2O). The heating ratein the measurements was 6 K/min.
Table 7. Hydrogen content measure-ments for Alloys 182, 152 and 52. 30days high temperature water (300 °C)exposure (pre-exp) was performed inhydrogenated PWR water (30 cm3
H2/kg H2O).
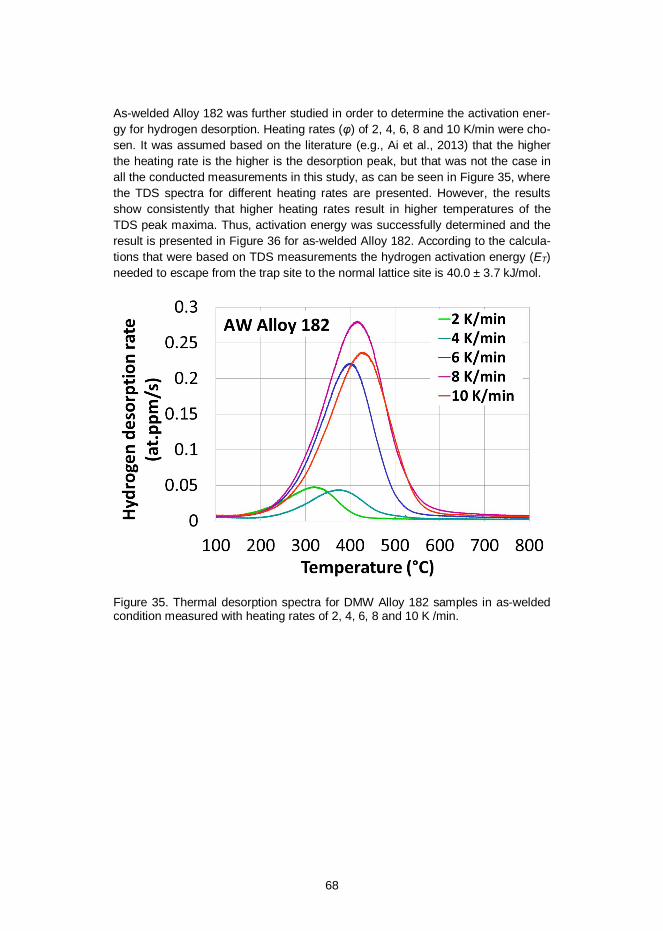
68
As-welded Alloy 182 was further studied in order to determine the activation ener-gy for hydrogen desorption. Heating rates ( ) of 2, 4, 6, 8 and 10 K/min were cho-sen. It was assumed based on the literature (e.g., Ai et al., 2013) that the higherthe heating rate is the higher is the desorption peak, but that was not the case inall the conducted measurements in this study, as can be seen in Figure 35, wherethe TDS spectra for different heating rates are presented. However, the resultsshow consistently that higher heating rates result in higher temperatures of theTDS peak maxima. Thus, activation energy was successfully determined and theresult is presented in Figure 36 for as-welded Alloy 182. According to the calcula-tions that were based on TDS measurements the hydrogen activation energy (ET)needed to escape from the trap site to the normal lattice site is 40.0 ± 3.7 kJ/mol.
Figure 35. Thermal desorption spectra for DMW Alloy 182 samples in as-weldedcondition measured with heating rates of 2, 4, 6, 8 and 10 K /min.
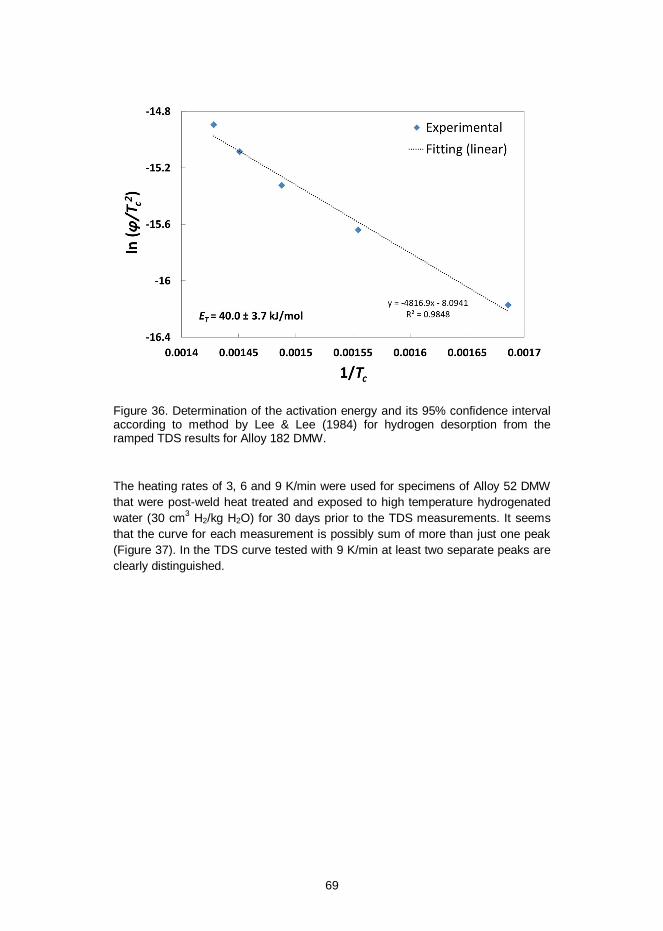
69
Figure 36. Determination of the activation energy and its 95% confidence intervalaccording to method by Lee & Lee (1984) for hydrogen desorption from theramped TDS results for Alloy 182 DMW.
The heating rates of 3, 6 and 9 K/min were used for specimens of Alloy 52 DMWthat were post-weld heat treated and exposed to high temperature hydrogenatedwater (30 cm3 H2/kg H2O) for 30 days prior to the TDS measurements. It seemsthat the curve for each measurement is possibly sum of more than just one peak(Figure 37). In the TDS curve tested with 9 K/min at least two separate peaks areclearly distinguished.
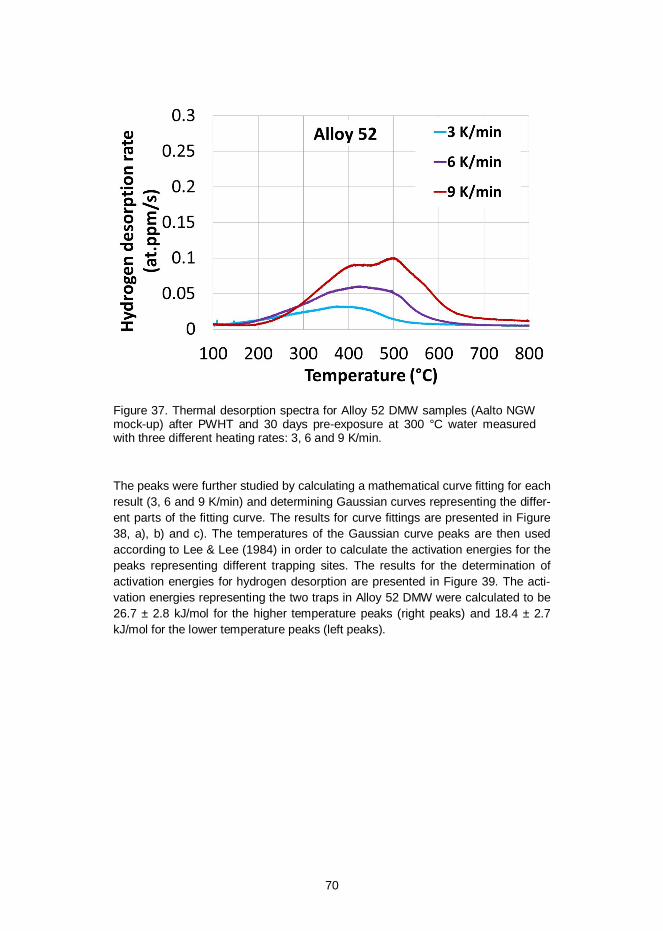
70
Figure 37. Thermal desorption spectra for Alloy 52 DMW samples (Aalto NGWmock-up) after PWHT and 30 days pre-exposure at 300 °C water measuredwith three different heating rates: 3, 6 and 9 K/min.
The peaks were further studied by calculating a mathematical curve fitting for eachresult (3, 6 and 9 K/min) and determining Gaussian curves representing the differ-ent parts of the fitting curve. The results for curve fittings are presented in Figure38, a), b) and c). The temperatures of the Gaussian curve peaks are then usedaccording to Lee & Lee (1984) in order to calculate the activation energies for thepeaks representing different trapping sites. The results for the determination ofactivation energies for hydrogen desorption are presented in Figure 39. The acti-vation energies representing the two traps in Alloy 52 DMW were calculated to be26.7 ± 2.8 kJ/mol for the higher temperature peaks (right peaks) and 18.4 ± 2.7kJ/mol for the lower temperature peaks (left peaks).
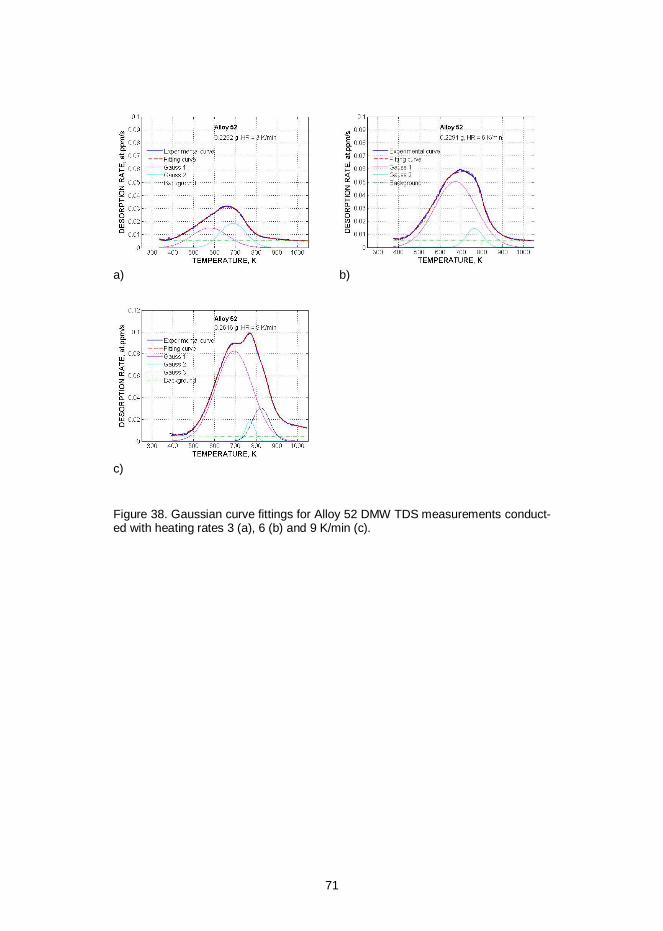
71
a) b)
c)
Figure 38. Gaussian curve fittings for Alloy 52 DMW TDS measurements conduct-ed with heating rates 3 (a), 6 (b) and 9 K/min (c).
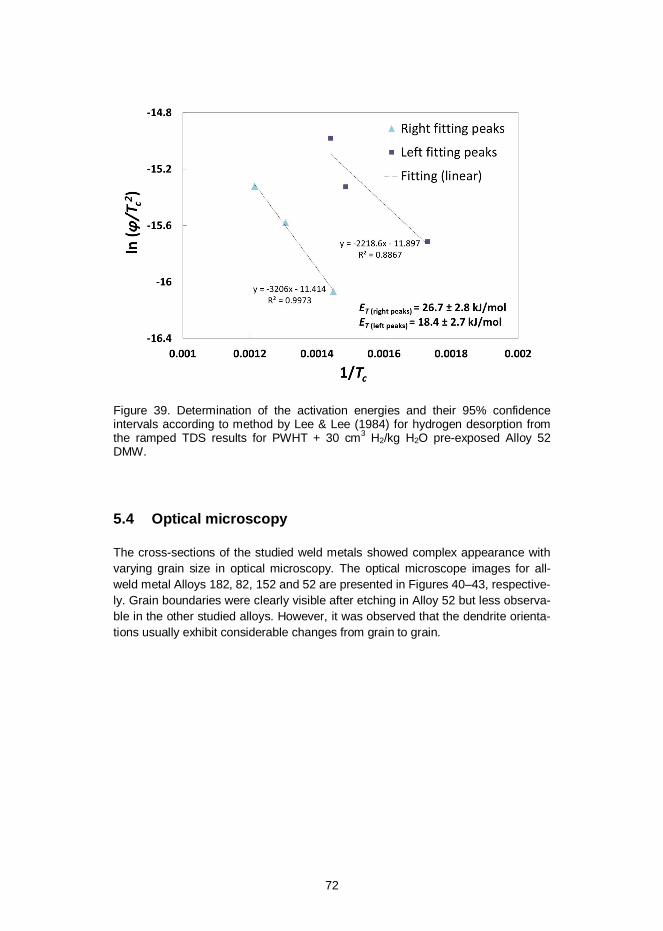
72
Figure 39. Determination of the activation energies and their 95% confidenceintervals according to method by Lee & Lee (1984) for hydrogen desorption fromthe ramped TDS results for PWHT + 30 cm3 H2/kg H2O pre-exposed Alloy 52DMW.
5.4 Optical microscopy
The cross-sections of the studied weld metals showed complex appearance withvarying grain size in optical microscopy. The optical microscope images for all-weld metal Alloys 182, 82, 152 and 52 are presented in Figures 40–43, respective-ly. Grain boundaries were clearly visible after etching in Alloy 52 but less observa-ble in the other studied alloys. However, it was observed that the dendrite orienta-tions usually exhibit considerable changes from grain to grain.
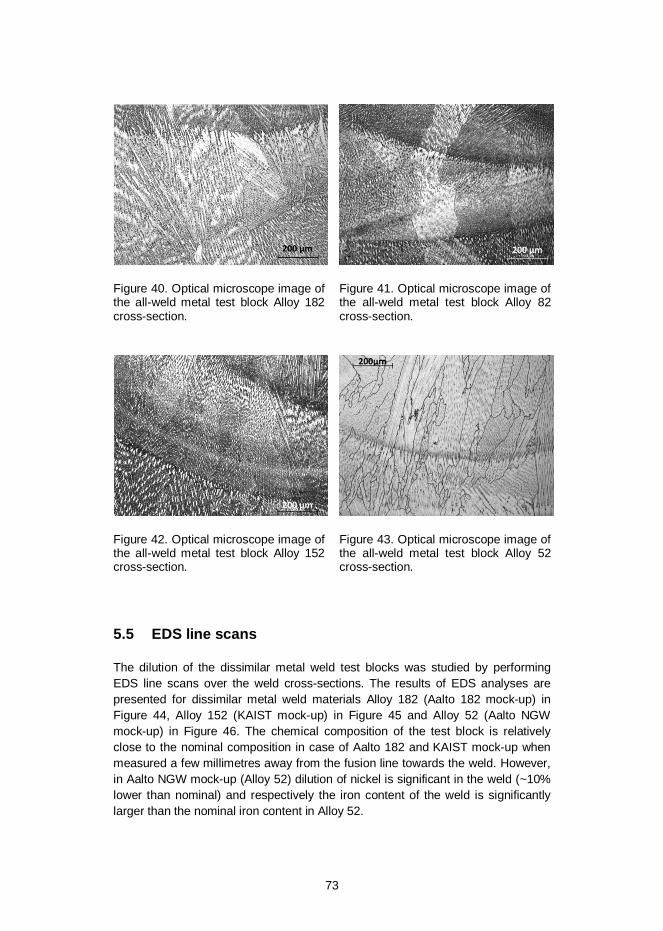
73
Figure 40. Optical microscope image ofthe all-weld metal test block Alloy 182cross-section.
Figure 41. Optical microscope image ofthe all-weld metal test block Alloy 82cross-section.
Figure 42. Optical microscope image ofthe all-weld metal test block Alloy 152cross-section.
Figure 43. Optical microscope image ofthe all-weld metal test block Alloy 52cross-section.
5.5 EDS line scans
The dilution of the dissimilar metal weld test blocks was studied by performingEDS line scans over the weld cross-sections. The results of EDS analyses arepresented for dissimilar metal weld materials Alloy 182 (Aalto 182 mock-up) inFigure 44, Alloy 152 (KAIST mock-up) in Figure 45 and Alloy 52 (Aalto NGWmock-up) in Figure 46. The chemical composition of the test block is relativelyclose to the nominal composition in case of Aalto 182 and KAIST mock-up whenmeasured a few millimetres away from the fusion line towards the weld. However,in Aalto NGW mock-up (Alloy 52) dilution of nickel is significant in the weld (~10%lower than nominal) and respectively the iron content of the weld is significantlylarger than the nominal iron content in Alloy 52.
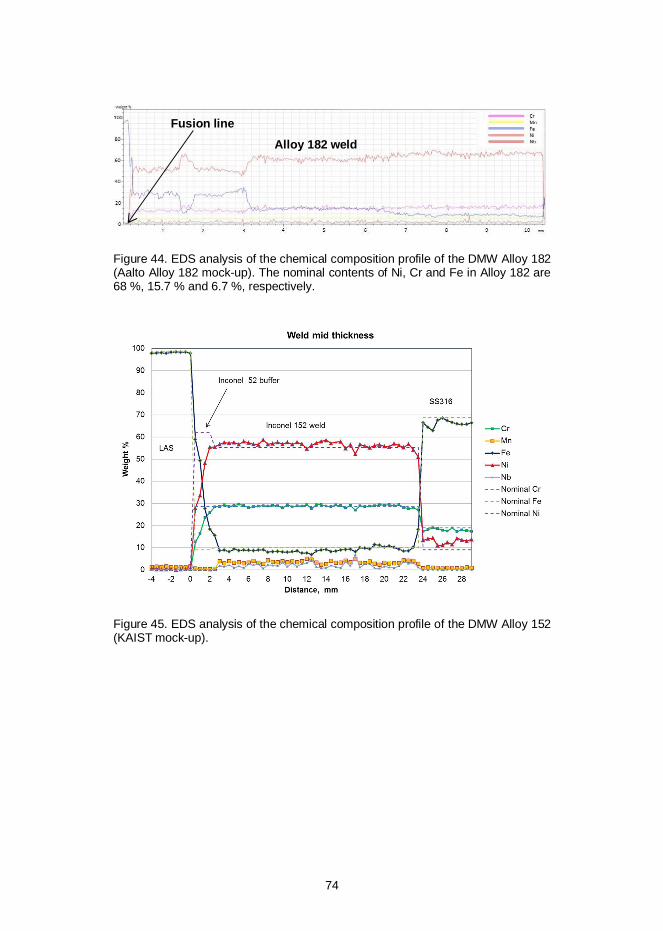
74
Figure 44. EDS analysis of the chemical composition profile of the DMW Alloy 182(Aalto Alloy 182 mock-up). The nominal contents of Ni, Cr and Fe in Alloy 182 are68 %, 15.7 % and 6.7 %, respectively.
Figure 45. EDS analysis of the chemical composition profile of the DMW Alloy 152(KAIST mock-up).
Fusion lineAlloy 182 weld
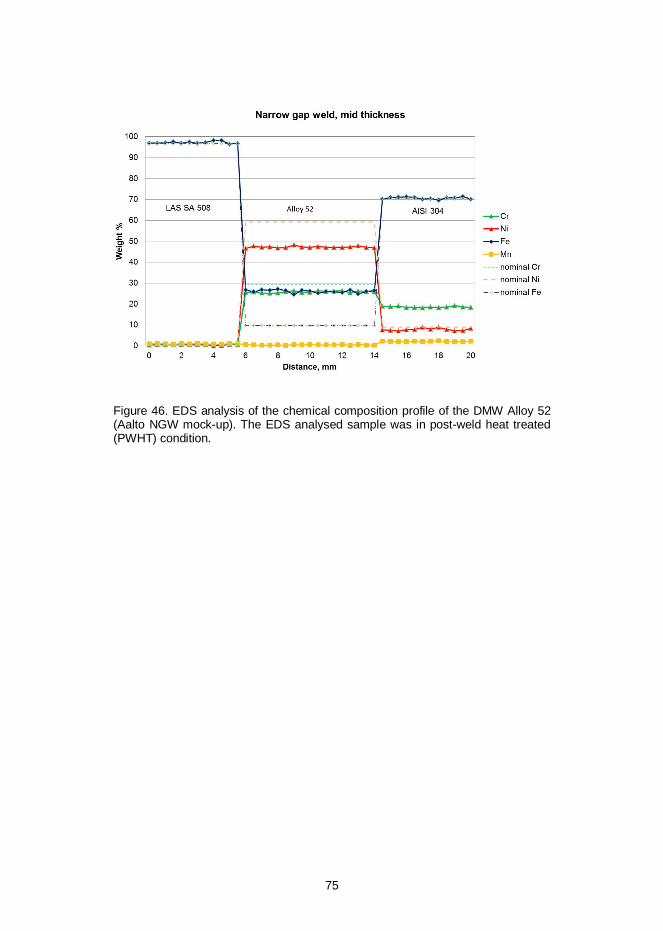
75
Figure 46. EDS analysis of the chemical composition profile of the DMW Alloy 52(Aalto NGW mock-up). The EDS analysed sample was in post-weld heat treated(PWHT) condition.
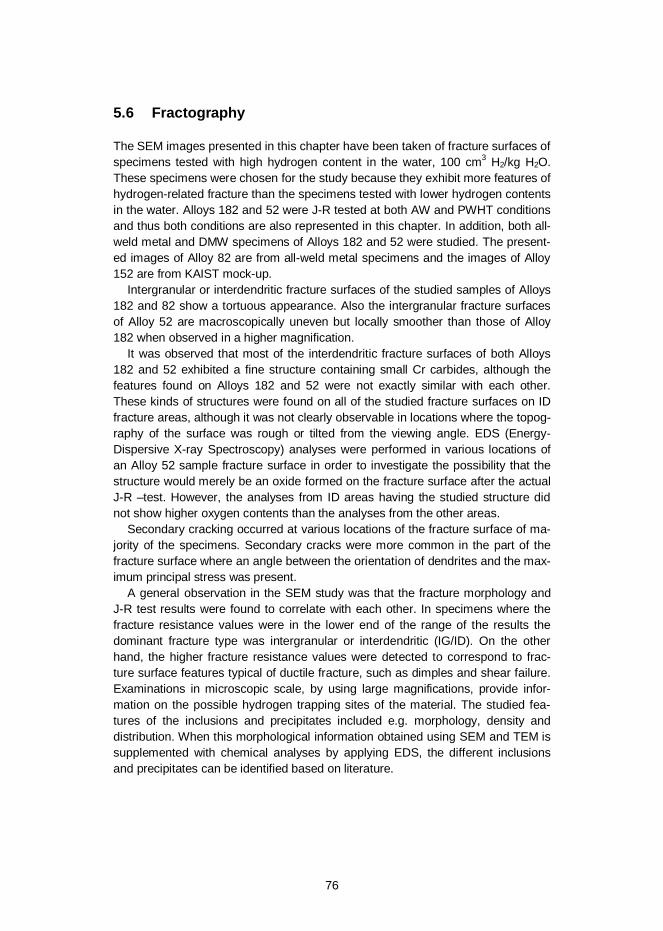
76
5.6 Fractography
The SEM images presented in this chapter have been taken of fracture surfaces ofspecimens tested with high hydrogen content in the water, 100 cm3 H2/kg H2O.These specimens were chosen for the study because they exhibit more features ofhydrogen-related fracture than the specimens tested with lower hydrogen contentsin the water. Alloys 182 and 52 were J-R tested at both AW and PWHT conditionsand thus both conditions are also represented in this chapter. In addition, both all-weld metal and DMW specimens of Alloys 182 and 52 were studied. The present-ed images of Alloy 82 are from all-weld metal specimens and the images of Alloy152 are from KAIST mock-up.
Intergranular or interdendritic fracture surfaces of the studied samples of Alloys182 and 82 show a tortuous appearance. Also the intergranular fracture surfacesof Alloy 52 are macroscopically uneven but locally smoother than those of Alloy182 when observed in a higher magnification.
It was observed that most of the interdendritic fracture surfaces of both Alloys182 and 52 exhibited a fine structure containing small Cr carbides, although thefeatures found on Alloys 182 and 52 were not exactly similar with each other.These kinds of structures were found on all of the studied fracture surfaces on IDfracture areas, although it was not clearly observable in locations where the topog-raphy of the surface was rough or tilted from the viewing angle. EDS (Energy-Dispersive X-ray Spectroscopy) analyses were performed in various locations ofan Alloy 52 sample fracture surface in order to investigate the possibility that thestructure would merely be an oxide formed on the fracture surface after the actualJ-R –test. However, the analyses from ID areas having the studied structure didnot show higher oxygen contents than the analyses from the other areas.
Secondary cracking occurred at various locations of the fracture surface of ma-jority of the specimens. Secondary cracks were more common in the part of thefracture surface where an angle between the orientation of dendrites and the max-imum principal stress was present.
A general observation in the SEM study was that the fracture morphology andJ-R test results were found to correlate with each other. In specimens where thefracture resistance values were in the lower end of the range of the results thedominant fracture type was intergranular or interdendritic (IG/ID). On the otherhand, the higher fracture resistance values were detected to correspond to frac-ture surface features typical of ductile fracture, such as dimples and shear failure.Examinations in microscopic scale, by using large magnifications, provide infor-mation on the possible hydrogen trapping sites of the material. The studied fea-tures of the inclusions and precipitates included e.g. morphology, density anddistribution. When this morphological information obtained using SEM and TEM issupplemented with chemical analyses by applying EDS, the different inclusionsand precipitates can be identified based on literature.
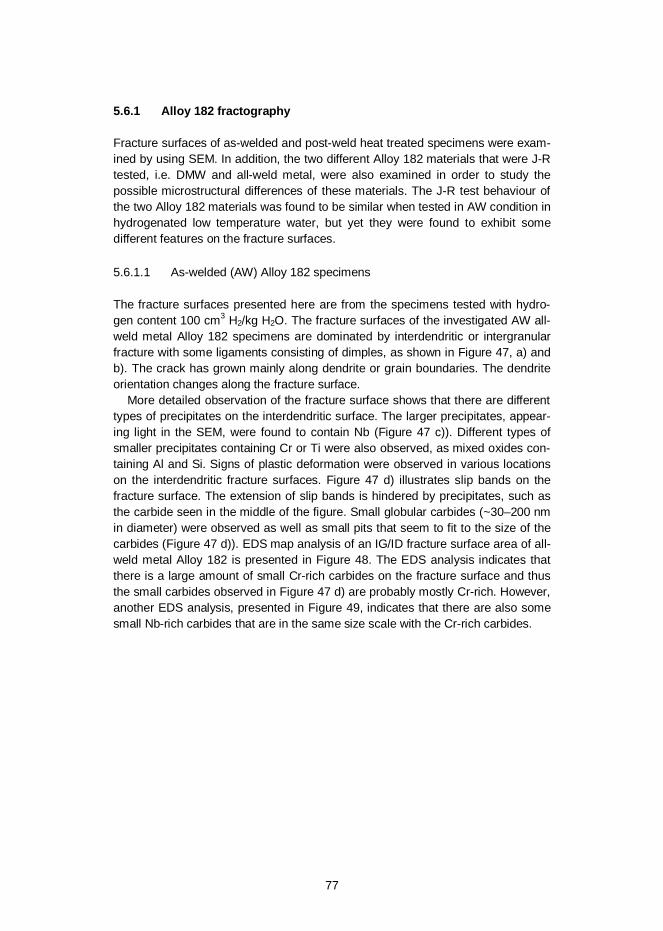
77
5.6.1 Alloy 182 fractography
Fracture surfaces of as-welded and post-weld heat treated specimens were exam-ined by using SEM. In addition, the two different Alloy 182 materials that were J-Rtested, i.e. DMW and all-weld metal, were also examined in order to study thepossible microstructural differences of these materials. The J-R test behaviour ofthe two Alloy 182 materials was found to be similar when tested in AW condition inhydrogenated low temperature water, but yet they were found to exhibit somedifferent features on the fracture surfaces.
5.6.1.1 As-welded (AW) Alloy 182 specimens
The fracture surfaces presented here are from the specimens tested with hydro-gen content 100 cm3 H2/kg H2O. The fracture surfaces of the investigated AW all-weld metal Alloy 182 specimens are dominated by interdendritic or intergranularfracture with some ligaments consisting of dimples, as shown in Figure 47, a) andb). The crack has grown mainly along dendrite or grain boundaries. The dendriteorientation changes along the fracture surface.
More detailed observation of the fracture surface shows that there are differenttypes of precipitates on the interdendritic surface. The larger precipitates, appear-ing light in the SEM, were found to contain Nb (Figure 47 c)). Different types ofsmaller precipitates containing Cr or Ti were also observed, as mixed oxides con-taining Al and Si. Signs of plastic deformation were observed in various locationson the interdendritic fracture surfaces. Figure 47 d) illustrates slip bands on thefracture surface. The extension of slip bands is hindered by precipitates, such asthe carbide seen in the middle of the figure. Small globular carbides (~30–200 nmin diameter) were observed as well as small pits that seem to fit to the size of thecarbides (Figure 47 d)). EDS map analysis of an IG/ID fracture surface area of all-weld metal Alloy 182 is presented in Figure 48. The EDS analysis indicates thatthere is a large amount of small Cr-rich carbides on the fracture surface and thusthe small carbides observed in Figure 47 d) are probably mostly Cr-rich. However,another EDS analysis, presented in Figure 49, indicates that there are also somesmall Nb-rich carbides that are in the same size scale with the Cr-rich carbides.
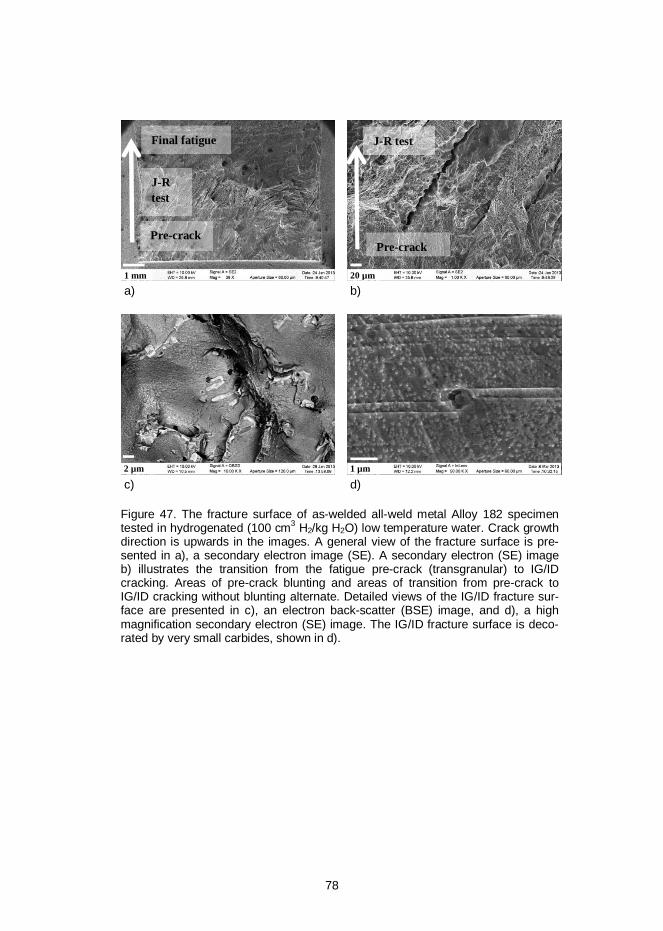
78
a) b)
c) d)
Figure 47. The fracture surface of as-welded all-weld metal Alloy 182 specimentested in hydrogenated (100 cm3 H2/kg H2O) low temperature water. Crack growthdirection is upwards in the images. A general view of the fracture surface is pre-sented in a), a secondary electron image (SE). A secondary electron (SE) imageb) illustrates the transition from the fatigue pre-crack (transgranular) to IG/IDcracking. Areas of pre-crack blunting and areas of transition from pre-crack toIG/ID cracking without blunting alternate. Detailed views of the IG/ID fracture sur-face are presented in c), an electron back-scatter (BSE) image, and d), a highmagnification secondary electron (SE) image. The IG/ID fracture surface is deco-rated by very small carbides, shown in d).
Pre-crack
J-Rtest
Final fatigue
Pre-crack
J-R test
1 mm 20 µm
2 µm 1 µm
79
Figure 48. The results of an EDS analysis performed for IG/ID fracture surfacearea of Alloy 182 presented in the upper left image. The red image represents C,yellow represents Ti, orange represents Cr, blue represents Al and purple repre-sents Nb.
a) b)
Figure 49. An EDS map analysis performed for an area a) of the fracture surface ofall-weld metal Alloy 182. The distribution of Nb is shown in b) in yellow. Some of thesmall carbides appear to be Nb-rich.
10 µm
600 nm 600 nm
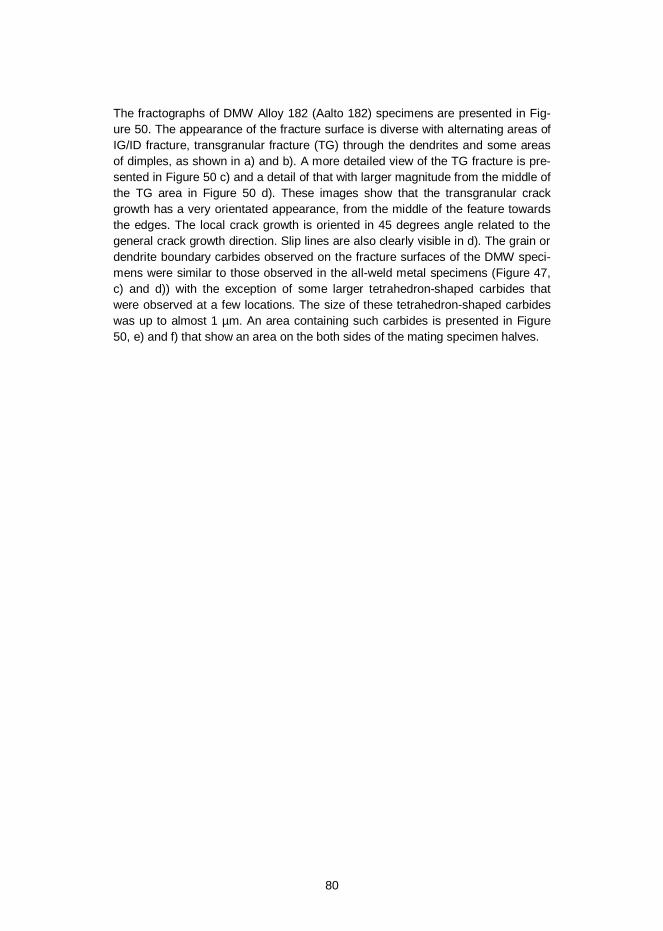
80
The fractographs of DMW Alloy 182 (Aalto 182) specimens are presented in Fig-ure 50. The appearance of the fracture surface is diverse with alternating areas ofIG/ID fracture, transgranular fracture (TG) through the dendrites and some areasof dimples, as shown in a) and b). A more detailed view of the TG fracture is pre-sented in Figure 50 c) and a detail of that with larger magnitude from the middle ofthe TG area in Figure 50 d). These images show that the transgranular crackgrowth has a very orientated appearance, from the middle of the feature towardsthe edges. The local crack growth is oriented in 45 degrees angle related to thegeneral crack growth direction. Slip lines are also clearly visible in d). The grain ordendrite boundary carbides observed on the fracture surfaces of the DMW speci-mens were similar to those observed in the all-weld metal specimens (Figure 47,c) and d)) with the exception of some larger tetrahedron-shaped carbides thatwere observed at a few locations. The size of these tetrahedron-shaped carbideswas up to almost 1 µm. An area containing such carbides is presented in Figure50, e) and f) that show an area on the both sides of the mating specimen halves.
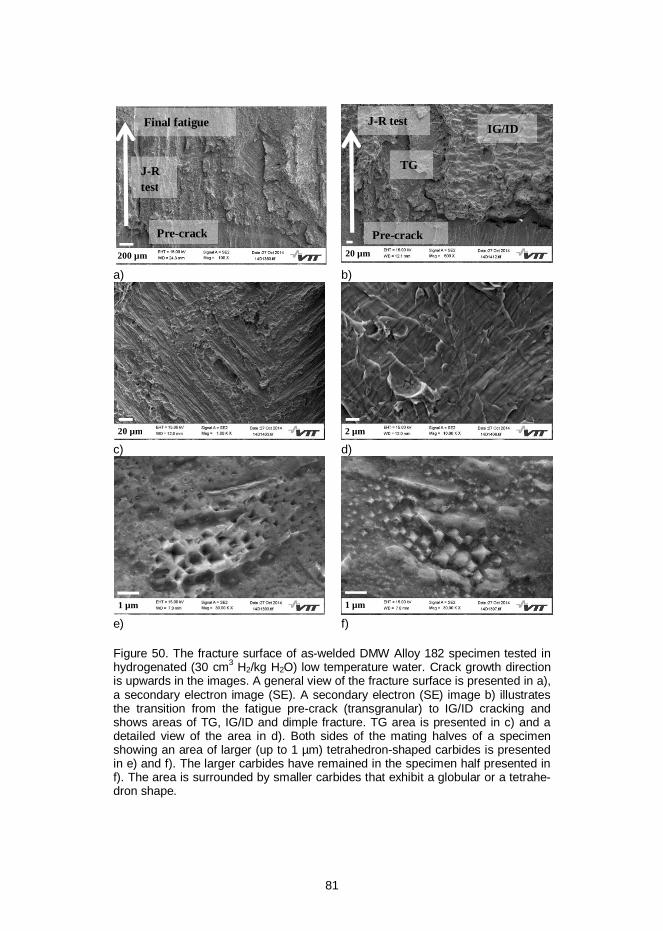
81
a) b)
c) d)
e) f)
Figure 50. The fracture surface of as-welded DMW Alloy 182 specimen tested inhydrogenated (30 cm3 H2/kg H2O) low temperature water. Crack growth directionis upwards in the images. A general view of the fracture surface is presented in a),a secondary electron image (SE). A secondary electron (SE) image b) illustratesthe transition from the fatigue pre-crack (transgranular) to IG/ID cracking andshows areas of TG, IG/ID and dimple fracture. TG area is presented in c) and adetailed view of the area in d). Both sides of the mating halves of a specimenshowing an area of larger (up to 1 µm) tetrahedron-shaped carbides is presentedin e) and f). The larger carbides have remained in the specimen half presented inf). The area is surrounded by smaller carbides that exhibit a globular or a tetrahe-dron shape.
Pre-crack
J-R test
Pre-crack
J-Rtest
Final fatigue
TG
IG/ID
200 µm 20 µm
20 µm 2 µm
1 µm 1 µm
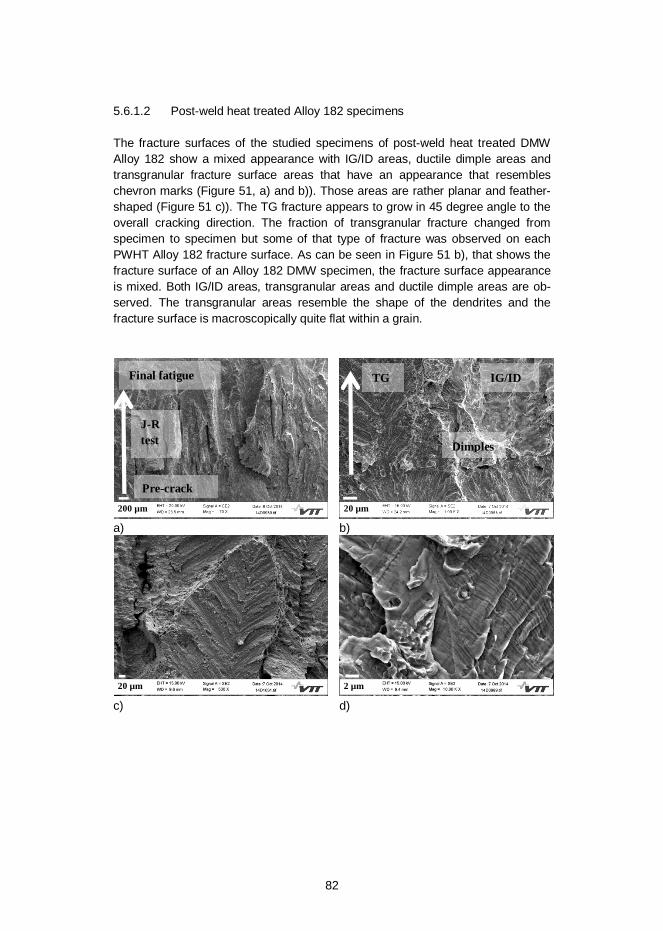
82
5.6.1.2 Post-weld heat treated Alloy 182 specimens
The fracture surfaces of the studied specimens of post-weld heat treated DMWAlloy 182 show a mixed appearance with IG/ID areas, ductile dimple areas andtransgranular fracture surface areas that have an appearance that resembleschevron marks (Figure 51, a) and b)). Those areas are rather planar and feather-shaped (Figure 51 c)). The TG fracture appears to grow in 45 degree angle to theoverall cracking direction. The fraction of transgranular fracture changed fromspecimen to specimen but some of that type of fracture was observed on eachPWHT Alloy 182 fracture surface. As can be seen in Figure 51 b), that shows thefracture surface of an Alloy 182 DMW specimen, the fracture surface appearanceis mixed. Both IG/ID areas, transgranular areas and ductile dimple areas are ob-served. The transgranular areas resemble the shape of the dendrites and thefracture surface is macroscopically quite flat within a grain.
a) b)
c) d)
Pre-crack
J-Rtest
Final fatigue TG
Dimples
IG/ID
200 µm 20 µm
20 µm 2 µm
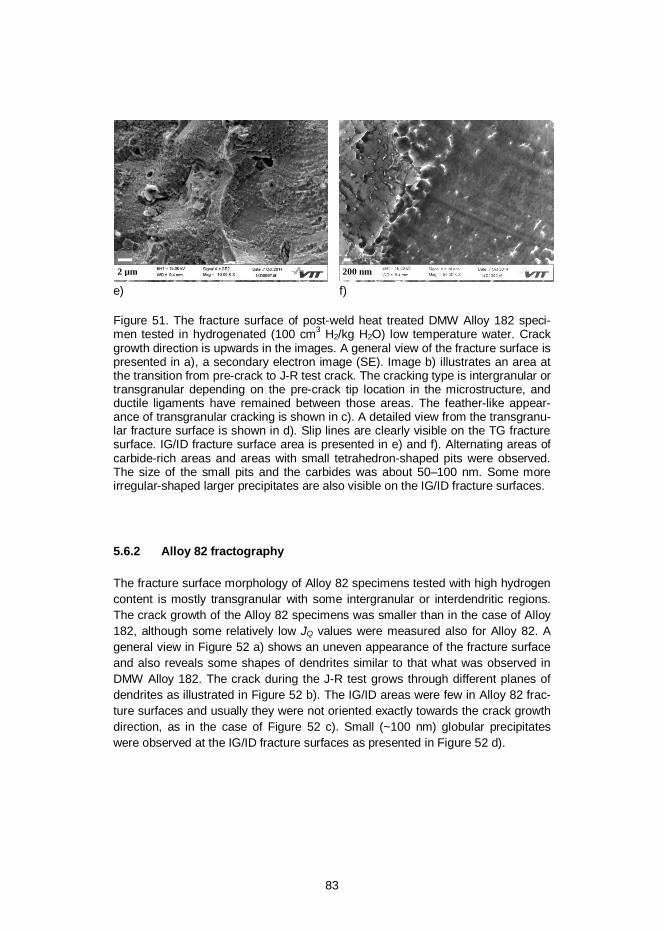
83
e) f)
Figure 51. The fracture surface of post-weld heat treated DMW Alloy 182 speci-men tested in hydrogenated (100 cm3 H2/kg H2O) low temperature water. Crackgrowth direction is upwards in the images. A general view of the fracture surface ispresented in a), a secondary electron image (SE). Image b) illustrates an area atthe transition from pre-crack to J-R test crack. The cracking type is intergranular ortransgranular depending on the pre-crack tip location in the microstructure, andductile ligaments have remained between those areas. The feather-like appear-ance of transgranular cracking is shown in c). A detailed view from the transgranu-lar fracture surface is shown in d). Slip lines are clearly visible on the TG fracturesurface. IG/ID fracture surface area is presented in e) and f). Alternating areas ofcarbide-rich areas and areas with small tetrahedron-shaped pits were observed.The size of the small pits and the carbides was about 50–100 nm. Some moreirregular-shaped larger precipitates are also visible on the IG/ID fracture surfaces.
5.6.2 Alloy 82 fractography
The fracture surface morphology of Alloy 82 specimens tested with high hydrogencontent is mostly transgranular with some intergranular or interdendritic regions.The crack growth of the Alloy 82 specimens was smaller than in the case of Alloy182, although some relatively low JQ values were measured also for Alloy 82. Ageneral view in Figure 52 a) shows an uneven appearance of the fracture surfaceand also reveals some shapes of dendrites similar to that what was observed inDMW Alloy 182. The crack during the J-R test grows through different planes ofdendrites as illustrated in Figure 52 b). The IG/ID areas were few in Alloy 82 frac-ture surfaces and usually they were not oriented exactly towards the crack growthdirection, as in the case of Figure 52 c). Small (~100 nm) globular precipitateswere observed at the IG/ID fracture surfaces as presented in Figure 52 d).
2 µm 200 nm
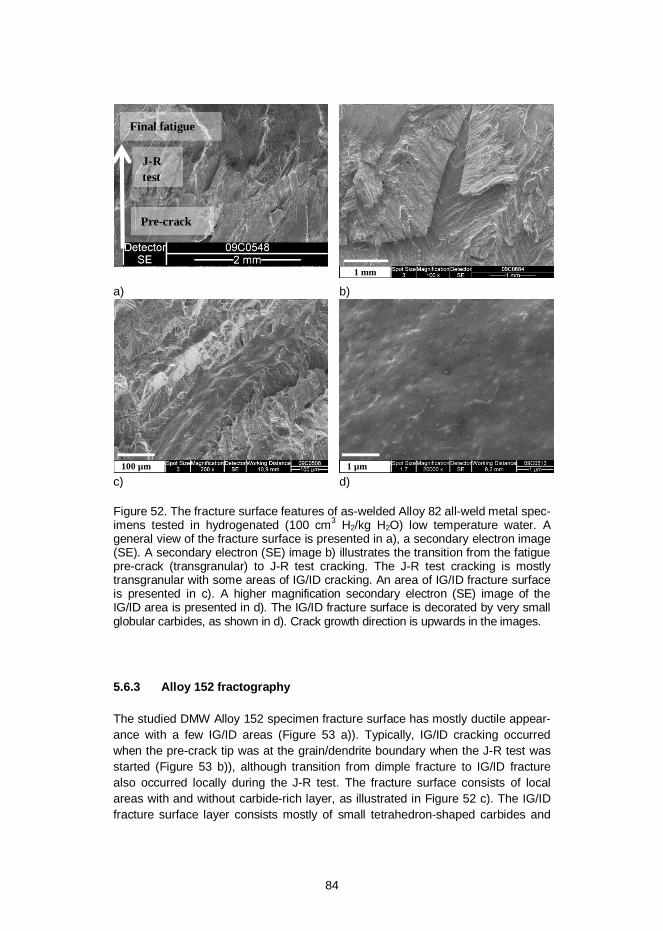
84
a) b)
c) d)
Figure 52. The fracture surface features of as-welded Alloy 82 all-weld metal spec-imens tested in hydrogenated (100 cm3 H2/kg H2O) low temperature water. Ageneral view of the fracture surface is presented in a), a secondary electron image(SE). A secondary electron (SE) image b) illustrates the transition from the fatiguepre-crack (transgranular) to J-R test cracking. The J-R test cracking is mostlytransgranular with some areas of IG/ID cracking. An area of IG/ID fracture surfaceis presented in c). A higher magnification secondary electron (SE) image of theIG/ID area is presented in d). The IG/ID fracture surface is decorated by very smallglobular carbides, as shown in d). Crack growth direction is upwards in the images.
5.6.3 Alloy 152 fractography
The studied DMW Alloy 152 specimen fracture surface has mostly ductile appear-ance with a few IG/ID areas (Figure 53 a)). Typically, IG/ID cracking occurredwhen the pre-crack tip was at the grain/dendrite boundary when the J-R test wasstarted (Figure 53 b)), although transition from dimple fracture to IG/ID fracturealso occurred locally during the J-R test. The fracture surface consists of localareas with and without carbide-rich layer, as illustrated in Figure 52 c). The IG/IDfracture surface layer consists mostly of small tetrahedron-shaped carbides and
Pre-crack
J-Rtest
Final fatigue
1 mm
100 µm 1 µm
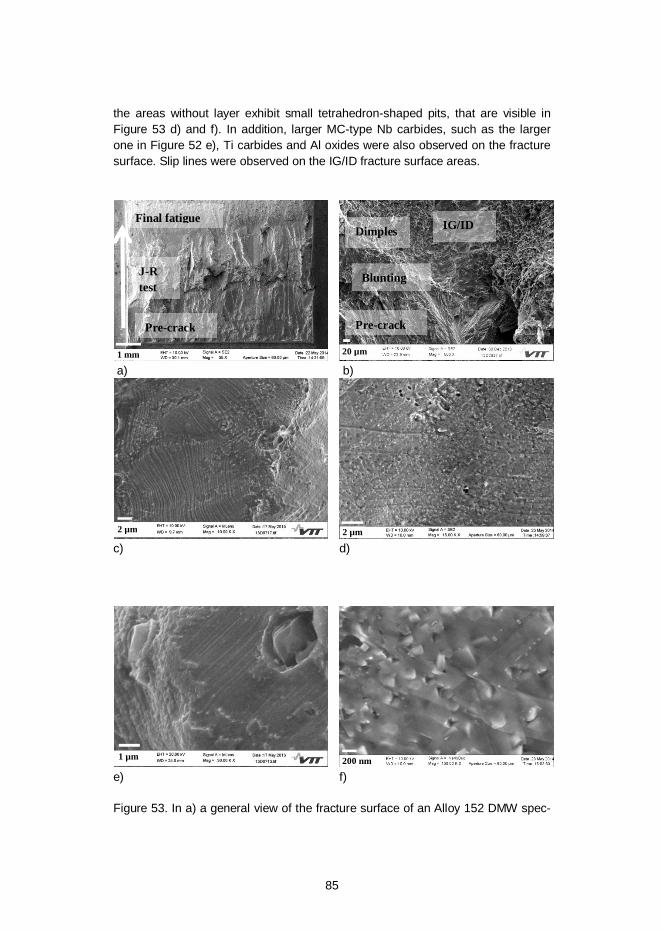
85
the areas without layer exhibit small tetrahedron-shaped pits, that are visible inFigure 53 d) and f). In addition, larger MC-type Nb carbides, such as the largerone in Figure 52 e), Ti carbides and Al oxides were also observed on the fracturesurface. Slip lines were observed on the IG/ID fracture surface areas.
a) b)
c) d)
e) f)
Figure 53. In a) a general view of the fracture surface of an Alloy 152 DMW spec-
Pre-crack
J-Rtest
Final fatigue IG/ID
Pre-crack
Dimples
Blunting
1 mm 20 µm
2 µm 2 µm
1 µm 200 nm
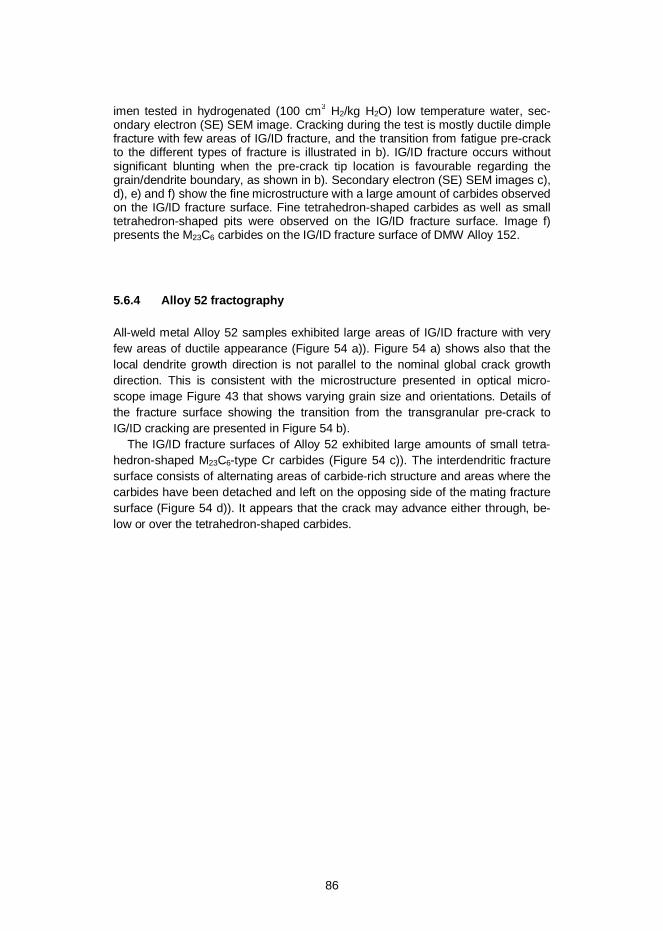
86
imen tested in hydrogenated (100 cm3 H2/kg H2O) low temperature water, sec-ondary electron (SE) SEM image. Cracking during the test is mostly ductile dimplefracture with few areas of IG/ID fracture, and the transition from fatigue pre-crackto the different types of fracture is illustrated in b). IG/ID fracture occurs withoutsignificant blunting when the pre-crack tip location is favourable regarding thegrain/dendrite boundary, as shown in b). Secondary electron (SE) SEM images c),d), e) and f) show the fine microstructure with a large amount of carbides observedon the IG/ID fracture surface. Fine tetrahedron-shaped carbides as well as smalltetrahedron-shaped pits were observed on the IG/ID fracture surface. Image f)presents the M23C6 carbides on the IG/ID fracture surface of DMW Alloy 152.
5.6.4 Alloy 52 fractography
All-weld metal Alloy 52 samples exhibited large areas of IG/ID fracture with veryfew areas of ductile appearance (Figure 54 a)). Figure 54 a) shows also that thelocal dendrite growth direction is not parallel to the nominal global crack growthdirection. This is consistent with the microstructure presented in optical micro-scope image Figure 43 that shows varying grain size and orientations. Details ofthe fracture surface showing the transition from the transgranular pre-crack toIG/ID cracking are presented in Figure 54 b).
The IG/ID fracture surfaces of Alloy 52 exhibited large amounts of small tetra-hedron-shaped M23C6-type Cr carbides (Figure 54 c)). The interdendritic fracturesurface consists of alternating areas of carbide-rich structure and areas where thecarbides have been detached and left on the opposing side of the mating fracturesurface (Figure 54 d)). It appears that the crack may advance either through, be-low or over the tetrahedron-shaped carbides.
87
a) b)
c) d)
Figure 54. In a) and b) general view of the fracture surface of an Alloy 52 all-weldmetal specimen tested in hydrogenated (100 cm3 H2/kg H2O) low temperature wa-ter, secondary electron (SE) SEM images. Crack growth direction is upwards in theimages. Secondary cracking occurs along the dendrite boundaries. Electron back-scatter (BSE) c) and secondary electron (SE) d) SEM images showing the M23C6carbide structure on the fracture surface of Alloy 52 all-weld metal. Image c) pre-sents variation of the carbide size and details of the carbides. Largest of them showcracking of the carbide. Image d) illustrates the fine fracture surface structure con-sisting of alternating areas of carbide-rich structure and areas where the carbideshave been detached and left on the opposing side of the mating fracture surface.
The SEM examined Alloy 52 DMW sample tested with 100 cm3 H2/kg H2O (JQ 150kJ/m2) exhibited only some areas of IG/ID fracture and large areas with ductileappearance (Figure 54 a)). The transition from the transgranular pre-crack toductile dimple fracture or IG/ID cracking is illustrated in Figure 54 b). Transitionfrom pre-crack to IG/ID cracking occurs typically when there is a similar orientationbetween the fatigue pre-crack and the grain/dendrite boundary. Such an area ofsimilar orientation is presented in Figure 56 c). There is a large amount of carbidespresent also in the IG/ID fracture surface of the Alloy 52 DMW specimen. The sizeof carbides, that most probably are M23C6, ranges between about 50 to 200 nm.
Pre-crack
J-Rtest
Final fatigue
Pre-crack
J-Rtest
1 mm 100 µm
1 µm 200 nm
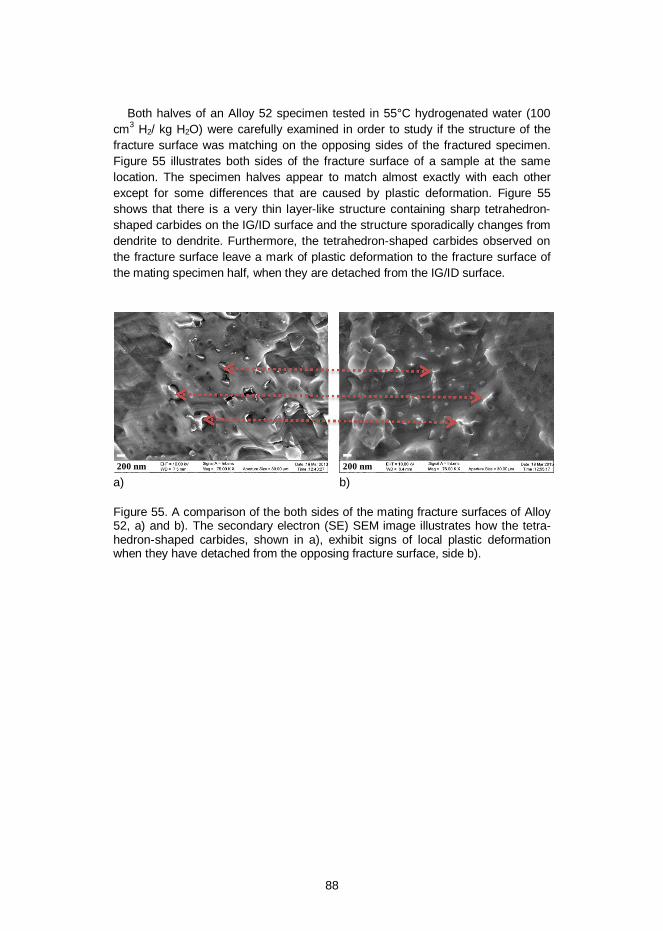
88
Both halves of an Alloy 52 specimen tested in 55°C hydrogenated water (100cm3 H2/ kg H2O) were carefully examined in order to study if the structure of thefracture surface was matching on the opposing sides of the fractured specimen.Figure 55 illustrates both sides of the fracture surface of a sample at the samelocation. The specimen halves appear to match almost exactly with each otherexcept for some differences that are caused by plastic deformation. Figure 55shows that there is a very thin layer-like structure containing sharp tetrahedron-shaped carbides on the IG/ID surface and the structure sporadically changes fromdendrite to dendrite. Furthermore, the tetrahedron-shaped carbides observed onthe fracture surface leave a mark of plastic deformation to the fracture surface ofthe mating specimen half, when they are detached from the IG/ID surface.
a) b)
Figure 55. A comparison of the both sides of the mating fracture surfaces of Alloy52, a) and b). The secondary electron (SE) SEM image illustrates how the tetra-hedron-shaped carbides, shown in a), exhibit signs of local plastic deformationwhen they have detached from the opposing fracture surface, side b).
200 nm 200 nm
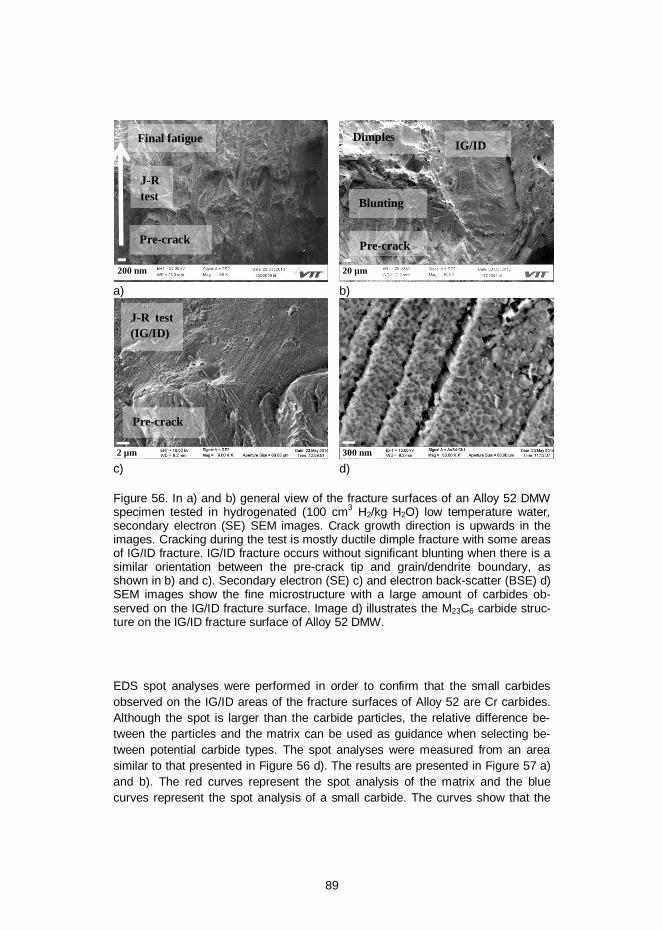
89
a) b)
c) d)
Figure 56. In a) and b) general view of the fracture surfaces of an Alloy 52 DMWspecimen tested in hydrogenated (100 cm3 H2/kg H2O) low temperature water,secondary electron (SE) SEM images. Crack growth direction is upwards in theimages. Cracking during the test is mostly ductile dimple fracture with some areasof IG/ID fracture. IG/ID fracture occurs without significant blunting when there is asimilar orientation between the pre-crack tip and grain/dendrite boundary, asshown in b) and c). Secondary electron (SE) c) and electron back-scatter (BSE) d)SEM images show the fine microstructure with a large amount of carbides ob-served on the IG/ID fracture surface. Image d) illustrates the M23C6 carbide struc-ture on the IG/ID fracture surface of Alloy 52 DMW.
EDS spot analyses were performed in order to confirm that the small carbidesobserved on the IG/ID areas of the fracture surfaces of Alloy 52 are Cr carbides.Although the spot is larger than the carbide particles, the relative difference be-tween the particles and the matrix can be used as guidance when selecting be-tween potential carbide types. The spot analyses were measured from an areasimilar to that presented in Figure 56 d). The results are presented in Figure 57 a)and b). The red curves represent the spot analysis of the matrix and the bluecurves represent the spot analysis of a small carbide. The curves show that the
Pre-crack
J-Rtest
Final fatigue IG/ID
Pre-crack
Dimples
Blunting
Pre-crack
J-R test(IG/ID)
200 nm 20 µm
2 µm 300 nm
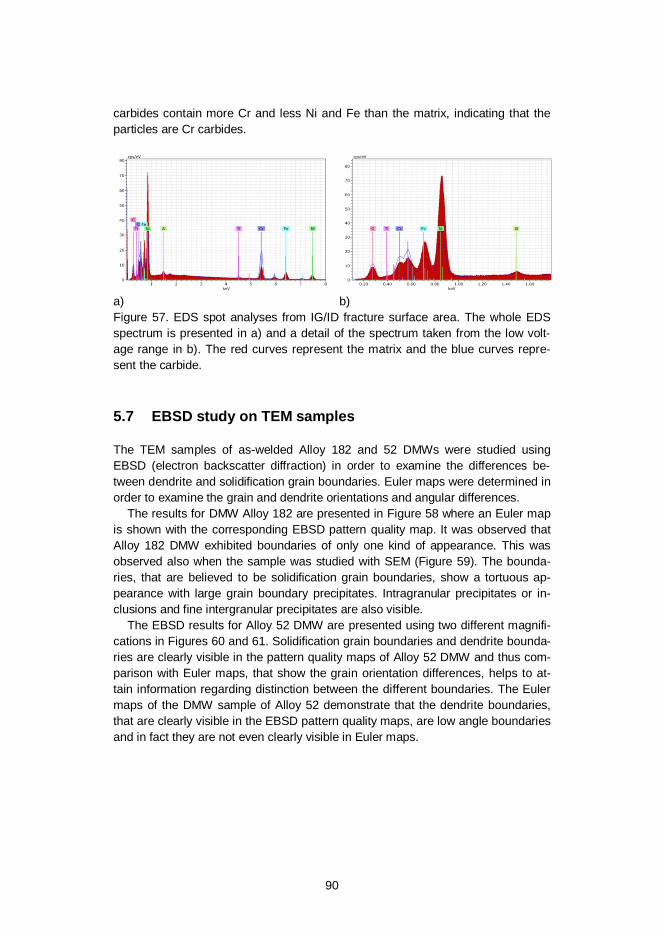
90
carbides contain more Cr and less Ni and Fe than the matrix, indicating that theparticles are Cr carbides.
a) b)Figure 57. EDS spot analyses from IG/ID fracture surface area. The whole EDSspectrum is presented in a) and a detail of the spectrum taken from the low volt-age range in b). The red curves represent the matrix and the blue curves repre-sent the carbide.
5.7 EBSD study on TEM samples
The TEM samples of as-welded Alloy 182 and 52 DMWs were studied usingEBSD (electron backscatter diffraction) in order to examine the differences be-tween dendrite and solidification grain boundaries. Euler maps were determined inorder to examine the grain and dendrite orientations and angular differences.
The results for DMW Alloy 182 are presented in Figure 58 where an Euler mapis shown with the corresponding EBSD pattern quality map. It was observed thatAlloy 182 DMW exhibited boundaries of only one kind of appearance. This wasobserved also when the sample was studied with SEM (Figure 59). The bounda-ries, that are believed to be solidification grain boundaries, show a tortuous ap-pearance with large grain boundary precipitates. Intragranular precipitates or in-clusions and fine intergranular precipitates are also visible.
The EBSD results for Alloy 52 DMW are presented using two different magnifi-cations in Figures 60 and 61. Solidification grain boundaries and dendrite bounda-ries are clearly visible in the pattern quality maps of Alloy 52 DMW and thus com-parison with Euler maps, that show the grain orientation differences, helps to at-tain information regarding distinction between the different boundaries. The Eulermaps of the DMW sample of Alloy 52 demonstrate that the dendrite boundaries,that are clearly visible in the EBSD pattern quality maps, are low angle boundariesand in fact they are not even clearly visible in Euler maps.
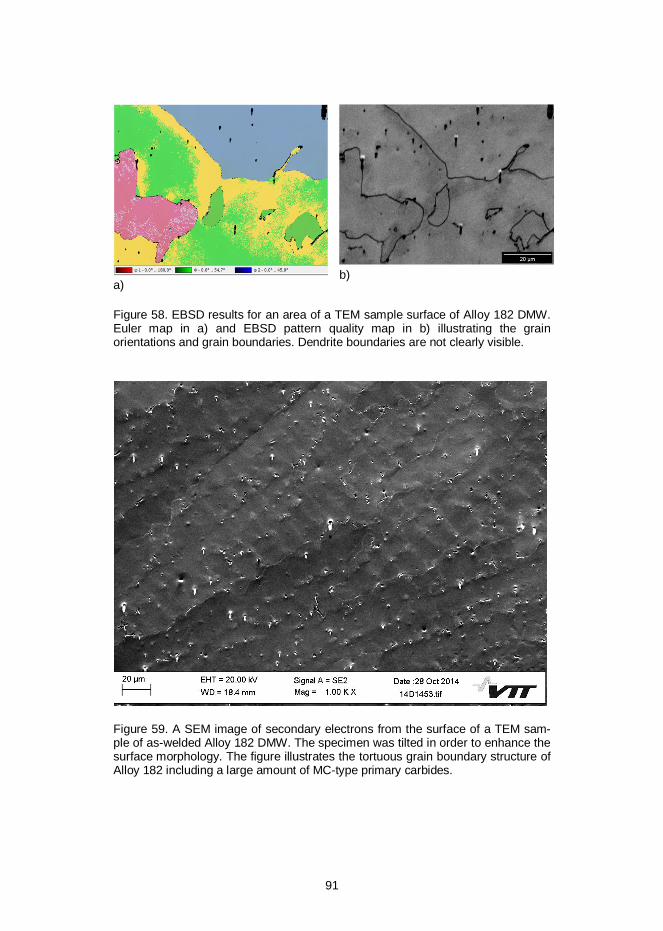
91
a)b)
Figure 58. EBSD results for an area of a TEM sample surface of Alloy 182 DMW.Euler map in a) and EBSD pattern quality map in b) illustrating the grainorientations and grain boundaries. Dendrite boundaries are not clearly visible.
Figure 59. A SEM image of secondary electrons from the surface of a TEM sam-ple of as-welded Alloy 182 DMW. The specimen was tilted in order to enhance thesurface morphology. The figure illustrates the tortuous grain boundary structure ofAlloy 182 including a large amount of MC-type primary carbides.
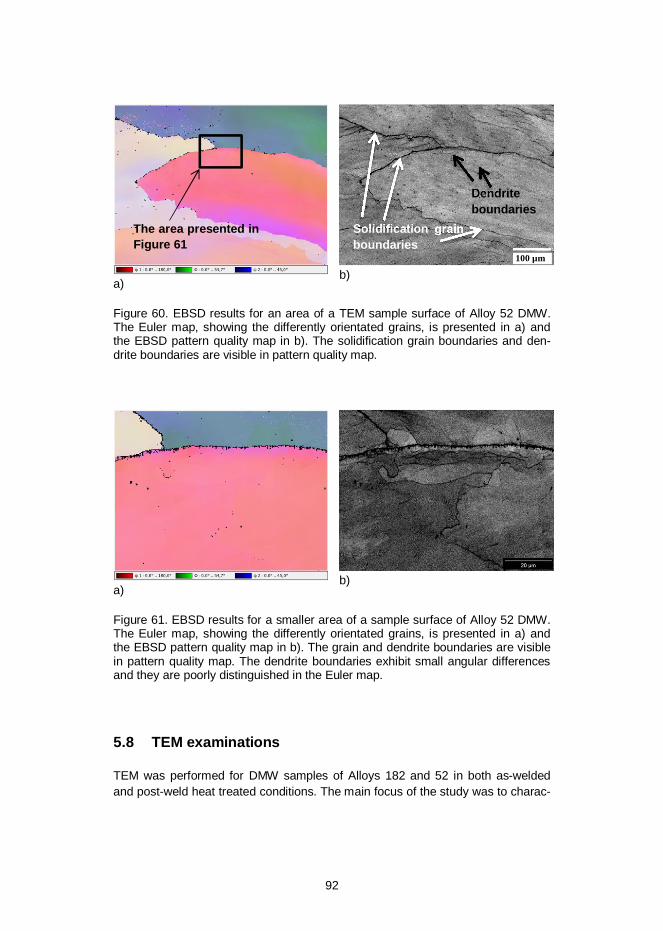
92
a)b)
Figure 60. EBSD results for an area of a TEM sample surface of Alloy 52 DMW.The Euler map, showing the differently orientated grains, is presented in a) andthe EBSD pattern quality map in b). The solidification grain boundaries and den-drite boundaries are visible in pattern quality map.
a)b)
Figure 61. EBSD results for a smaller area of a sample surface of Alloy 52 DMW.The Euler map, showing the differently orientated grains, is presented in a) andthe EBSD pattern quality map in b). The grain and dendrite boundaries are visiblein pattern quality map. The dendrite boundaries exhibit small angular differencesand they are poorly distinguished in the Euler map.
5.8 TEM examinations
TEM was performed for DMW samples of Alloys 182 and 52 in both as-weldedand post-weld heat treated conditions. The main focus of the study was to charac-
The area presented inFigure 61
Solidification grainboundaries
Dendriteboundaries
100 µm
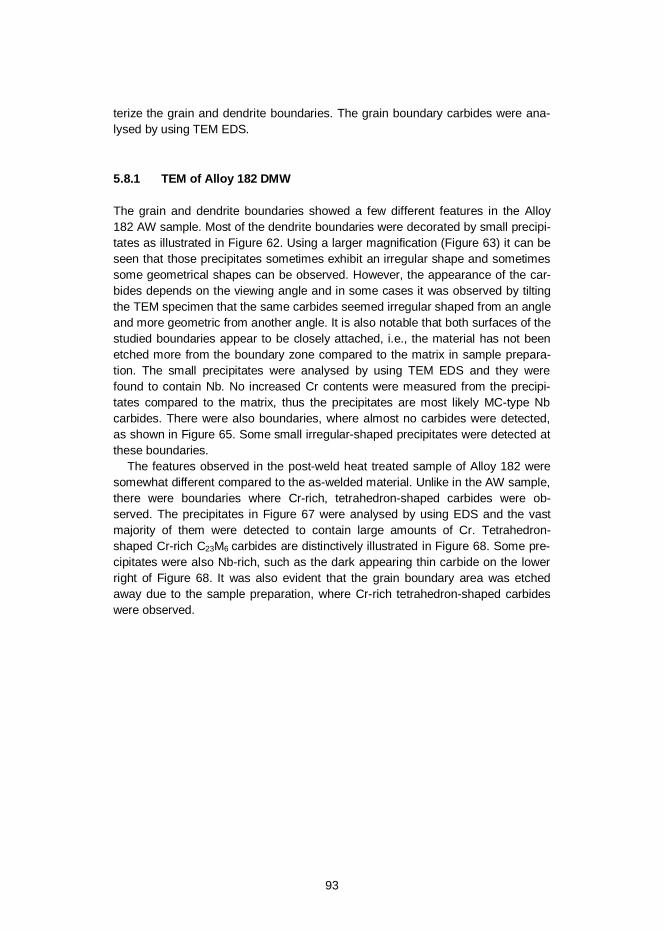
93
terize the grain and dendrite boundaries. The grain boundary carbides were ana-lysed by using TEM EDS.
5.8.1 TEM of Alloy 182 DMW
The grain and dendrite boundaries showed a few different features in the Alloy182 AW sample. Most of the dendrite boundaries were decorated by small precipi-tates as illustrated in Figure 62. Using a larger magnification (Figure 63) it can beseen that those precipitates sometimes exhibit an irregular shape and sometimessome geometrical shapes can be observed. However, the appearance of the car-bides depends on the viewing angle and in some cases it was observed by tiltingthe TEM specimen that the same carbides seemed irregular shaped from an angleand more geometric from another angle. It is also notable that both surfaces of thestudied boundaries appear to be closely attached, i.e., the material has not beenetched more from the boundary zone compared to the matrix in sample prepara-tion. The small precipitates were analysed by using TEM EDS and they werefound to contain Nb. No increased Cr contents were measured from the precipi-tates compared to the matrix, thus the precipitates are most likely MC-type Nbcarbides. There were also boundaries, where almost no carbides were detected,as shown in Figure 65. Some small irregular-shaped precipitates were detected atthese boundaries.
The features observed in the post-weld heat treated sample of Alloy 182 weresomewhat different compared to the as-welded material. Unlike in the AW sample,there were boundaries where Cr-rich, tetrahedron-shaped carbides were ob-served. The precipitates in Figure 67 were analysed by using EDS and the vastmajority of them were detected to contain large amounts of Cr. Tetrahedron-shaped Cr-rich C23M6 carbides are distinctively illustrated in Figure 68. Some pre-cipitates were also Nb-rich, such as the dark appearing thin carbide on the lowerright of Figure 68. It was also evident that the grain boundary area was etchedaway due to the sample preparation, where Cr-rich tetrahedron-shaped carbideswere observed.
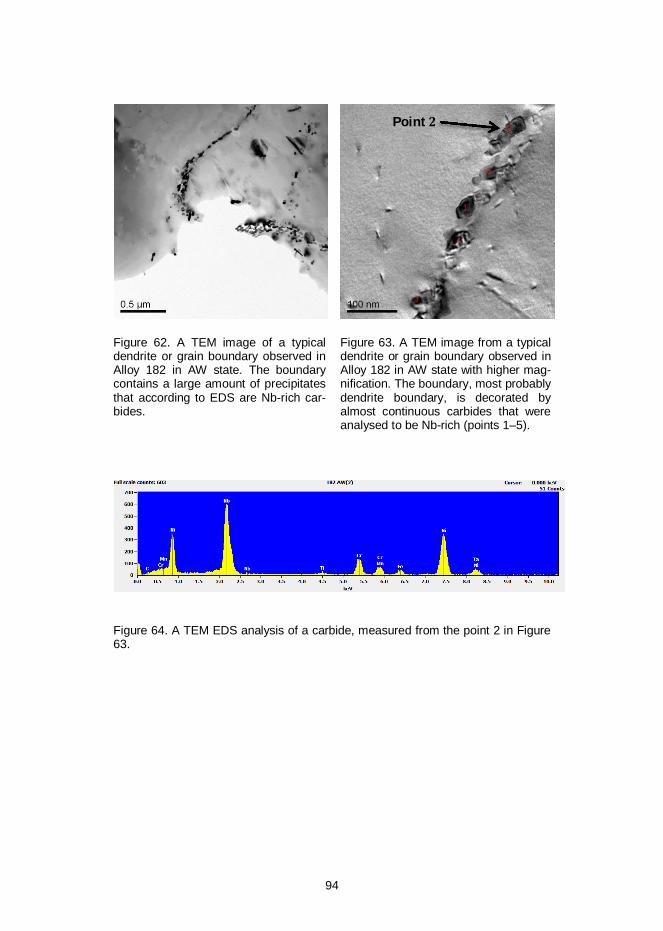
94
Figure 62. A TEM image of a typicaldendrite or grain boundary observed inAlloy 182 in AW state. The boundarycontains a large amount of precipitatesthat according to EDS are Nb-rich car-bides.
Figure 63. A TEM image from a typicaldendrite or grain boundary observed inAlloy 182 in AW state with higher mag-nification. The boundary, most probablydendrite boundary, is decorated byalmost continuous carbides that wereanalysed to be Nb-rich (points 1–5).
Figure 64. A TEM EDS analysis of a carbide, measured from the point 2 in Figure63.
Point
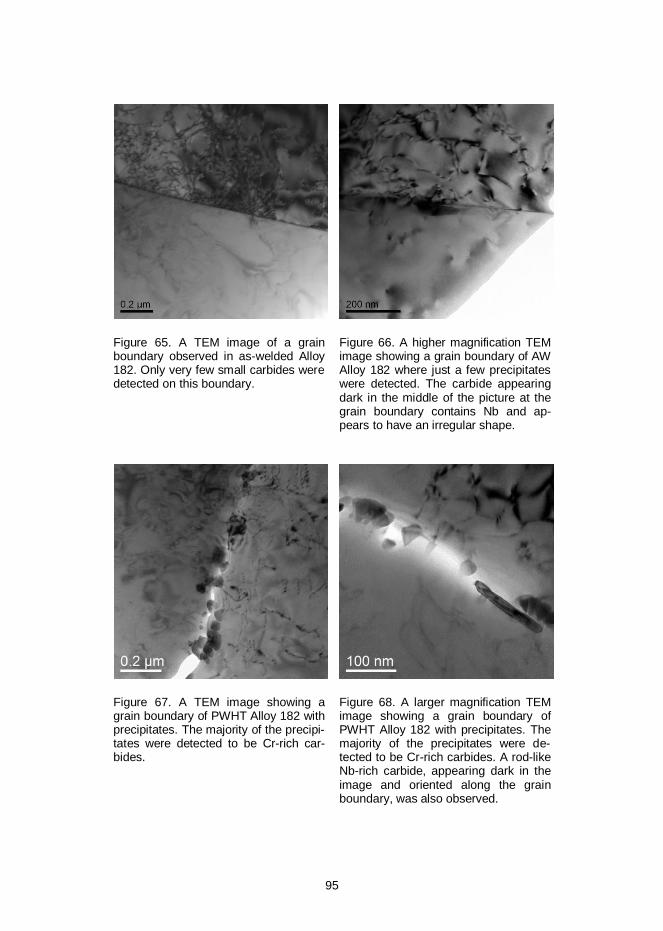
95
Figure 65. A TEM image of a grainboundary observed in as-welded Alloy182. Only very few small carbides weredetected on this boundary.
Figure 66. A higher magnification TEMimage showing a grain boundary of AWAlloy 182 where just a few precipitateswere detected. The carbide appearingdark in the middle of the picture at thegrain boundary contains Nb and ap-pears to have an irregular shape.
Figure 67. A TEM image showing agrain boundary of PWHT Alloy 182 withprecipitates. The majority of the precipi-tates were detected to be Cr-rich car-bides.
Figure 68. A larger magnification TEMimage showing a grain boundary ofPWHT Alloy 182 with precipitates. Themajority of the precipitates were de-tected to be Cr-rich carbides. A rod-likeNb-rich carbide, appearing dark in theimage and oriented along the grainboundary, was also observed.
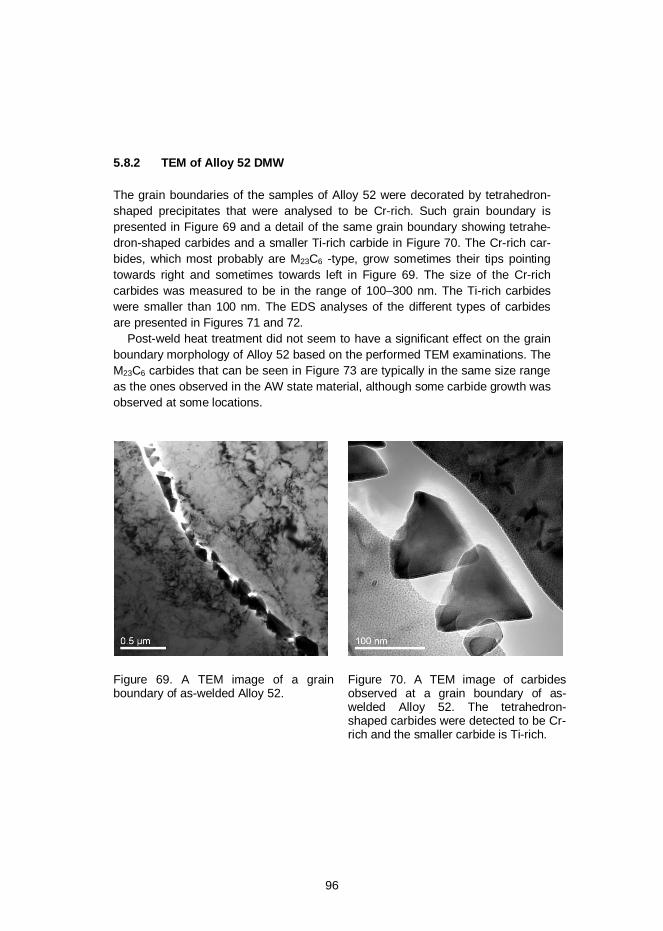
96
5.8.2 TEM of Alloy 52 DMW
The grain boundaries of the samples of Alloy 52 were decorated by tetrahedron-shaped precipitates that were analysed to be Cr-rich. Such grain boundary ispresented in Figure 69 and a detail of the same grain boundary showing tetrahe-dron-shaped carbides and a smaller Ti-rich carbide in Figure 70. The Cr-rich car-bides, which most probably are M23C6 -type, grow sometimes their tips pointingtowards right and sometimes towards left in Figure 69. The size of the Cr-richcarbides was measured to be in the range of 100–300 nm. The Ti-rich carbideswere smaller than 100 nm. The EDS analyses of the different types of carbidesare presented in Figures 71 and 72.
Post-weld heat treatment did not seem to have a significant effect on the grainboundary morphology of Alloy 52 based on the performed TEM examinations. TheM23C6 carbides that can be seen in Figure 73 are typically in the same size rangeas the ones observed in the AW state material, although some carbide growth wasobserved at some locations.
Figure 69. A TEM image of a grainboundary of as-welded Alloy 52.
Figure 70. A TEM image of carbidesobserved at a grain boundary of as-welded Alloy 52. The tetrahedron-shaped carbides were detected to be Cr-rich and the smaller carbide is Ti-rich.
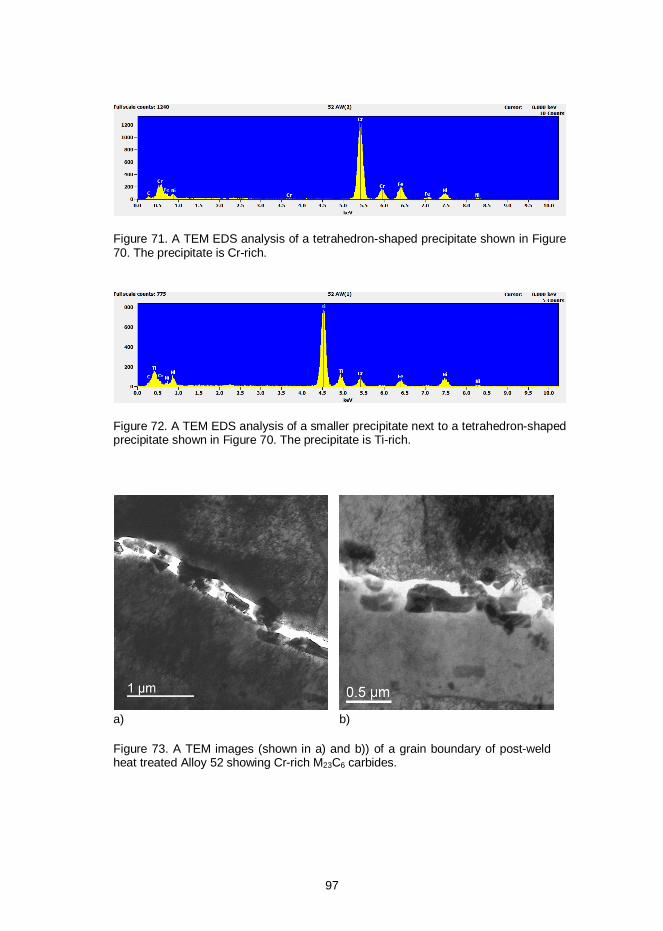
97
Figure 71. A TEM EDS analysis of a tetrahedron-shaped precipitate shown in Figure70. The precipitate is Cr-rich.
Figure 72. A TEM EDS analysis of a smaller precipitate next to a tetrahedron-shapedprecipitate shown in Figure 70. The precipitate is Ti-rich.
a) b)
Figure 73. A TEM images (shown in a) and b)) of a grain boundary of post-weldheat treated Alloy 52 showing Cr-rich M23C6 carbides.
98
6 Discussion
6.1 J-R tests
The fracture resistance of nickel-based Alloy 182/82 and Alloy 152/52 weld metalsdecreases in hydrogenated low-temperature water, as has been previously report-ed by a few researchers but most extensively by Mills and Brown. Even low hy-drogen contents (5 cm3 H2/kg H2O) are sufficient to cause intergranu-lar/interdendritic cracking and decrease the fracture resistance of Alloy 182(Herms et al., 2009). The results of this study confirm the degrading effect of hy-drogen on fracture resistance of nickel-based alloy weld metals. It has also beenshown in this study that higher hydrogen content results in lower JQ values. Aspresented in Figure 74, all the studied nickel-based alloy weld metals showed asimilar trend, regarding the effect of hydrogen content of the water, but to a differ-ent extent. Thus, a general observation is that fracture resistance of all the studiednickel-based alloys is decreased by hydrogenated low temperature water, alt-hough in the case of Alloy 52 high hydrogen contents are needed in order to in-duce LTCP. Alloy 182 exhibits the highest susceptibility to LTCP, whereas higherCr Alloys 152 and 52 exhibit higher fracture resistance values, in general. Howev-er, when tested with 100 cm3 H2/kg H2O, all-weld metal Alloy 52 specimensshowed extensive IG cracking and JQ values that were similar to those of Alloy182.
The effect of pre-exposure at the reactor operation temperature to the LTCPsusceptibility has not been extensively studied thus far. Herms et al. (2009) re-ported that pre-exposure at 320 °C for 250 or 1000 h did not have a significanteffect on the LTCP behavior of Alloys 182 and 152 at low hydrogen contents (3–5cm3 H2/kg H2O). In the present study low hydrogen content (5 cm3 H2/kg H2O) pre-exposure (30 days, about 720 h) was studied for DMW specimens of Alloy 152,and the attained results were somewhat similar with or without the pre-exposure,although there was a slight increase in the average fracture resistance values dueto the pre-exposure (Figure 28). Pre-exposure was studied with a moderate hy-drogen content (30 cm3 H2/kg H2O) for DMW specimens of Alloys 182, 152 and 52and the results obtained with and without pre-exposure are compared in Figure75. Alloys 182 and 152 showed a slight increase of the fracture resistance due tothe high temperature pre-exposure. DMW material NGW Alloy 52 was also studied
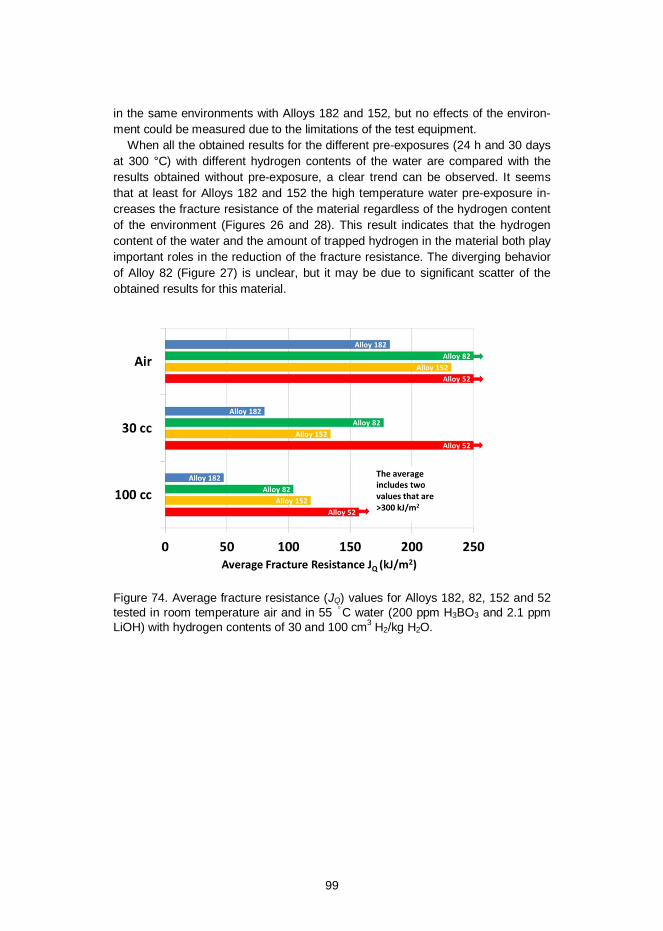
99
in the same environments with Alloys 182 and 152, but no effects of the environ-ment could be measured due to the limitations of the test equipment.
When all the obtained results for the different pre-exposures (24 h and 30 daysat 300 °C) with different hydrogen contents of the water are compared with theresults obtained without pre-exposure, a clear trend can be observed. It seemsthat at least for Alloys 182 and 152 the high temperature water pre-exposure in-creases the fracture resistance of the material regardless of the hydrogen contentof the environment (Figures 26 and 28). This result indicates that the hydrogencontent of the water and the amount of trapped hydrogen in the material both playimportant roles in the reduction of the fracture resistance. The diverging behaviorof Alloy 82 (Figure 27) is unclear, but it may be due to significant scatter of theobtained results for this material.
Figure 74. Average fracture resistance (JQ) values for Alloys 182, 82, 152 and 52tested in room temperature air and in 55 C water (200 ppm H3BO3 and 2.1 ppmLiOH) with hydrogen contents of 30 and 100 cm3 H2/kg H2O.
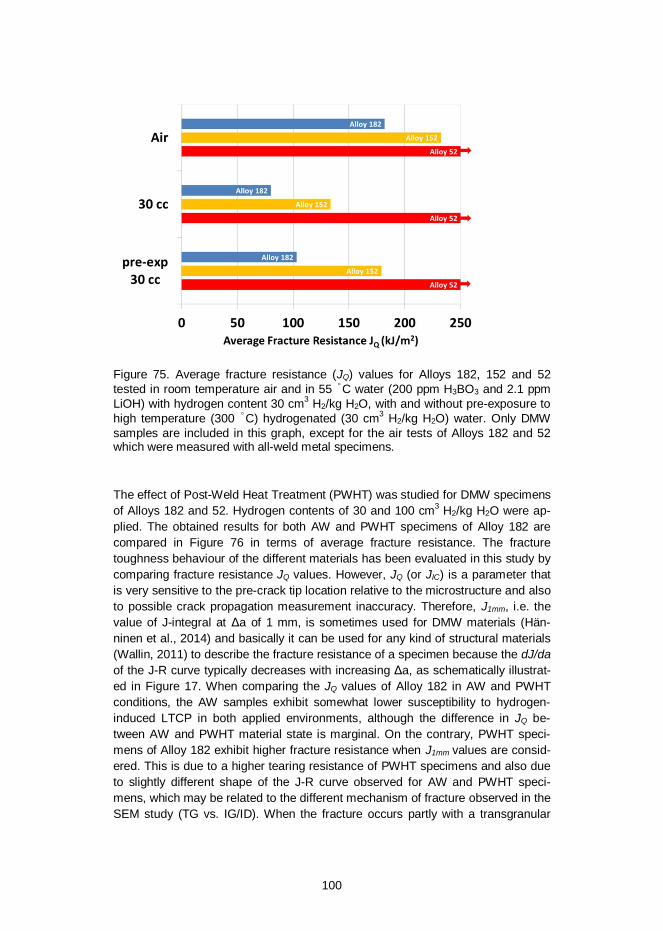
100
Figure 75. Average fracture resistance (JQ) values for Alloys 182, 152 and 52tested in room temperature air and in 55 C water (200 ppm H3BO3 and 2.1 ppmLiOH) with hydrogen content 30 cm3 H2/kg H2O, with and without pre-exposure tohigh temperature (300 C) hydrogenated (30 cm3 H2/kg H2O) water. Only DMWsamples are included in this graph, except for the air tests of Alloys 182 and 52which were measured with all-weld metal specimens.
The effect of Post-Weld Heat Treatment (PWHT) was studied for DMW specimensof Alloys 182 and 52. Hydrogen contents of 30 and 100 cm3 H2/kg H2O were ap-plied. The obtained results for both AW and PWHT specimens of Alloy 182 arecompared in Figure 76 in terms of average fracture resistance. The fracturetoughness behaviour of the different materials has been evaluated in this study bycomparing fracture resistance JQ values. However, JQ (or JIC) is a parameter thatis very sensitive to the pre-crack tip location relative to the microstructure and alsoto possible crack propagation measurement inaccuracy. Therefore, J1mm, i.e. thevalue of J-integral at a of 1 mm, is sometimes used for DMW materials (Hän-ninen et al., 2014) and basically it can be used for any kind of structural materials(Wallin, 2011) to describe the fracture resistance of a specimen because the dJ/daof the J-R curve typically decreases with increasing a, as schematically illustrat-ed in Figure 17. When comparing the JQ values of Alloy 182 in AW and PWHTconditions, the AW samples exhibit somewhat lower susceptibility to hydrogen-induced LTCP in both applied environments, although the difference in JQ be-tween AW and PWHT material state is marginal. On the contrary, PWHT speci-mens of Alloy 182 exhibit higher fracture resistance when J1mm values are consid-ered. This is due to a higher tearing resistance of PWHT specimens and also dueto slightly different shape of the J-R curve observed for AW and PWHT speci-mens, which may be related to the different mechanism of fracture observed in theSEM study (TG vs. IG/ID). When the fracture occurs partly with a transgranular
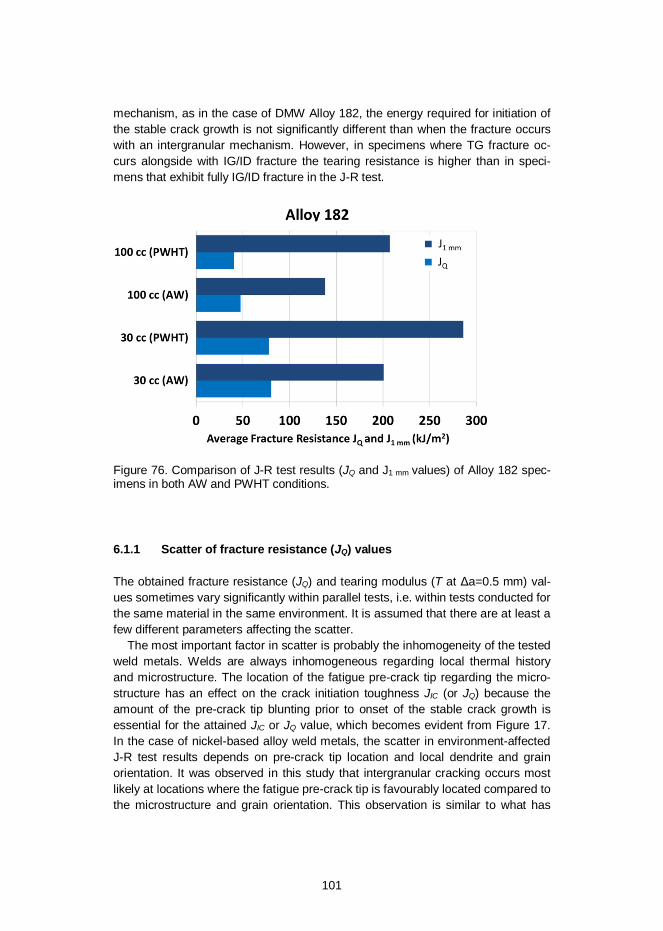
101
mechanism, as in the case of DMW Alloy 182, the energy required for initiation ofthe stable crack growth is not significantly different than when the fracture occurswith an intergranular mechanism. However, in specimens where TG fracture oc-curs alongside with IG/ID fracture the tearing resistance is higher than in speci-mens that exhibit fully IG/ID fracture in the J-R test.
Figure 76. Comparison of J-R test results (JQ and J1 mm values) of Alloy 182 spec-imens in both AW and PWHT conditions.
6.1.1 Scatter of fracture resistance (JQ) values
The obtained fracture resistance (JQ) and tearing modulus (T at a=0.5 mm) val-ues sometimes vary significantly within parallel tests, i.e. within tests conducted forthe same material in the same environment. It is assumed that there are at least afew different parameters affecting the scatter.
The most important factor in scatter is probably the inhomogeneity of the testedweld metals. Welds are always inhomogeneous regarding local thermal historyand microstructure. The location of the fatigue pre-crack tip regarding the micro-structure has an effect on the crack initiation toughness JIC (or JQ) because theamount of the pre-crack tip blunting prior to onset of the stable crack growth isessential for the attained JIC or JQ value, which becomes evident from Figure 17.In the case of nickel-based alloy weld metals, the scatter in environment-affectedJ-R test results depends on pre-crack tip location and local dendrite and grainorientation. It was observed in this study that intergranular cracking occurs mostlikely at locations where the fatigue pre-crack tip is favourably located compared tothe microstructure and grain orientation. This observation is similar to what has
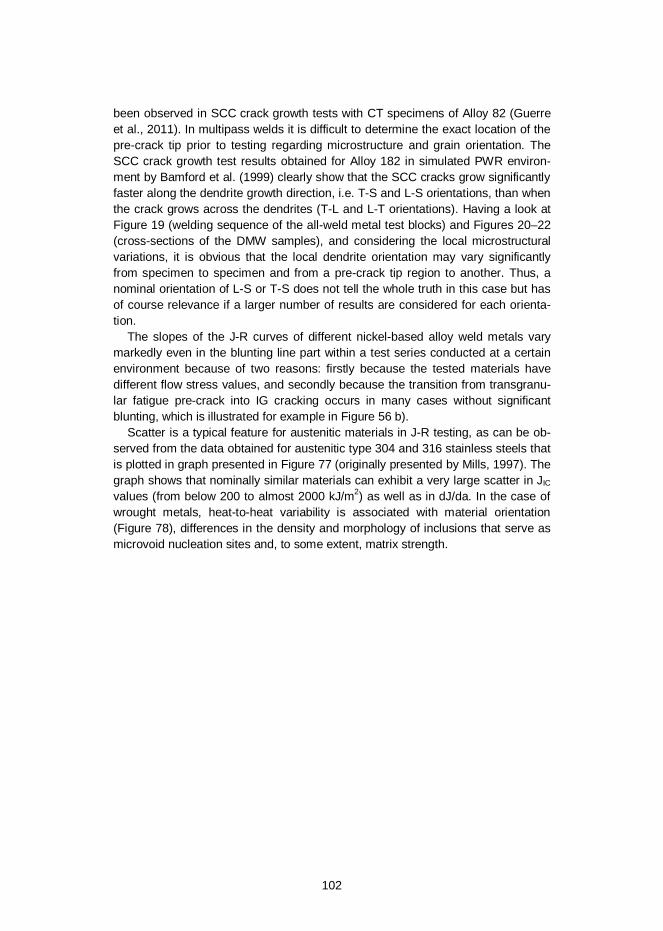
102
been observed in SCC crack growth tests with CT specimens of Alloy 82 (Guerreet al., 2011). In multipass welds it is difficult to determine the exact location of thepre-crack tip prior to testing regarding microstructure and grain orientation. TheSCC crack growth test results obtained for Alloy 182 in simulated PWR environ-ment by Bamford et al. (1999) clearly show that the SCC cracks grow significantlyfaster along the dendrite growth direction, i.e. T-S and L-S orientations, than whenthe crack grows across the dendrites (T-L and L-T orientations). Having a look atFigure 19 (welding sequence of the all-weld metal test blocks) and Figures 20–22(cross-sections of the DMW samples), and considering the local microstructuralvariations, it is obvious that the local dendrite orientation may vary significantlyfrom specimen to specimen and from a pre-crack tip region to another. Thus, anominal orientation of L-S or T-S does not tell the whole truth in this case but hasof course relevance if a larger number of results are considered for each orienta-tion.
The slopes of the J-R curves of different nickel-based alloy weld metals varymarkedly even in the blunting line part within a test series conducted at a certainenvironment because of two reasons: firstly because the tested materials havedifferent flow stress values, and secondly because the transition from transgranu-lar fatigue pre-crack into IG cracking occurs in many cases without significantblunting, which is illustrated for example in Figure 56 b).
Scatter is a typical feature for austenitic materials in J-R testing, as can be ob-served from the data obtained for austenitic type 304 and 316 stainless steels thatis plotted in graph presented in Figure 77 (originally presented by Mills, 1997). Thegraph shows that nominally similar materials can exhibit a very large scatter in JIC
values (from below 200 to almost 2000 kJ/m2) as well as in dJ/da. In the case ofwrought metals, heat-to-heat variability is associated with material orientation(Figure 78), differences in the density and morphology of inclusions that serve asmicrovoid nucleation sites and, to some extent, matrix strength.
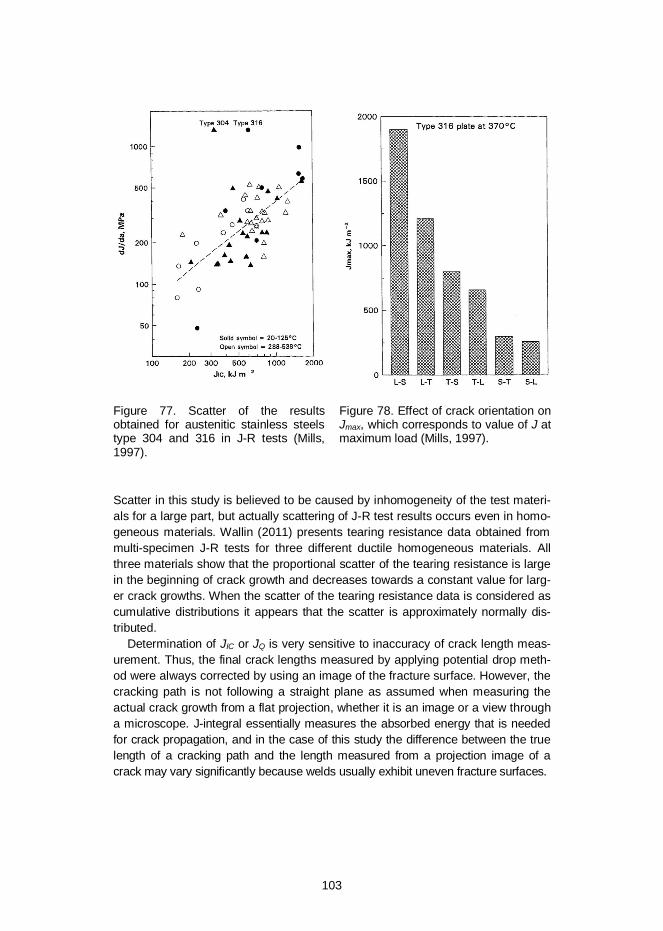
103
Figure 77. Scatter of the resultsobtained for austenitic stainless steelstype 304 and 316 in J-R tests (Mills,1997).
Figure 78. Effect of crack orientation onJmax, which corresponds to value of J atmaximum load (Mills, 1997).
Scatter in this study is believed to be caused by inhomogeneity of the test materi-als for a large part, but actually scattering of J-R test results occurs even in homo-geneous materials. Wallin (2011) presents tearing resistance data obtained frommulti-specimen J-R tests for three different ductile homogeneous materials. Allthree materials show that the proportional scatter of the tearing resistance is largein the beginning of crack growth and decreases towards a constant value for larg-er crack growths. When the scatter of the tearing resistance data is considered ascumulative distributions it appears that the scatter is approximately normally dis-tributed.
Determination of JIC or JQ is very sensitive to inaccuracy of crack length meas-urement. Thus, the final crack lengths measured by applying potential drop meth-od were always corrected by using an image of the fracture surface. However, thecracking path is not following a straight plane as assumed when measuring theactual crack growth from a flat projection, whether it is an image or a view througha microscope. J-integral essentially measures the absorbed energy that is neededfor crack propagation, and in the case of this study the difference between the truelength of a cracking path and the length measured from a projection image of acrack may vary significantly because welds usually exhibit uneven fracture surfaces.
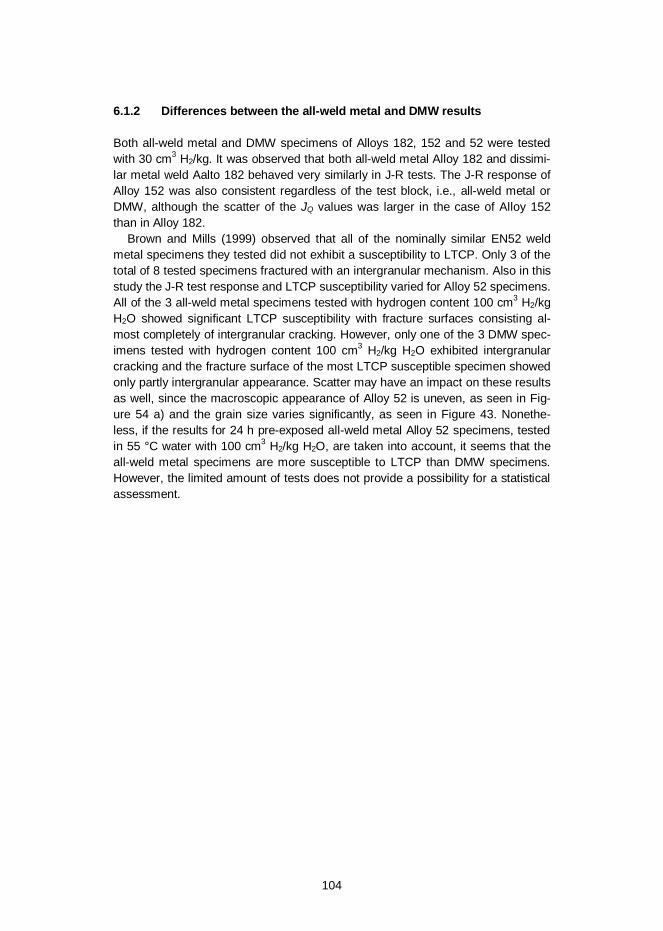
104
6.1.2 Differences between the all-weld metal and DMW results
Both all-weld metal and DMW specimens of Alloys 182, 152 and 52 were testedwith 30 cm3 H2/kg. It was observed that both all-weld metal Alloy 182 and dissimi-lar metal weld Aalto 182 behaved very similarly in J-R tests. The J-R response ofAlloy 152 was also consistent regardless of the test block, i.e., all-weld metal orDMW, although the scatter of the JQ values was larger in the case of Alloy 152than in Alloy 182.
Brown and Mills (1999) observed that all of the nominally similar EN52 weldmetal specimens they tested did not exhibit a susceptibility to LTCP. Only 3 of thetotal of 8 tested specimens fractured with an intergranular mechanism. Also in thisstudy the J-R test response and LTCP susceptibility varied for Alloy 52 specimens.All of the 3 all-weld metal specimens tested with hydrogen content 100 cm3 H2/kgH2O showed significant LTCP susceptibility with fracture surfaces consisting al-most completely of intergranular cracking. However, only one of the 3 DMW spec-imens tested with hydrogen content 100 cm3 H2/kg H2O exhibited intergranularcracking and the fracture surface of the most LTCP susceptible specimen showedonly partly intergranular appearance. Scatter may have an impact on these resultsas well, since the macroscopic appearance of Alloy 52 is uneven, as seen in Fig-ure 54 a) and the grain size varies significantly, as seen in Figure 43. Nonethe-less, if the results for 24 h pre-exposed all-weld metal Alloy 52 specimens, testedin 55 °C water with 100 cm3 H2/kg H2O, are taken into account, it seems that theall-weld metal specimens are more susceptible to LTCP than DMW specimens.However, the limited amount of tests does not provide a possibility for a statisticalassessment.
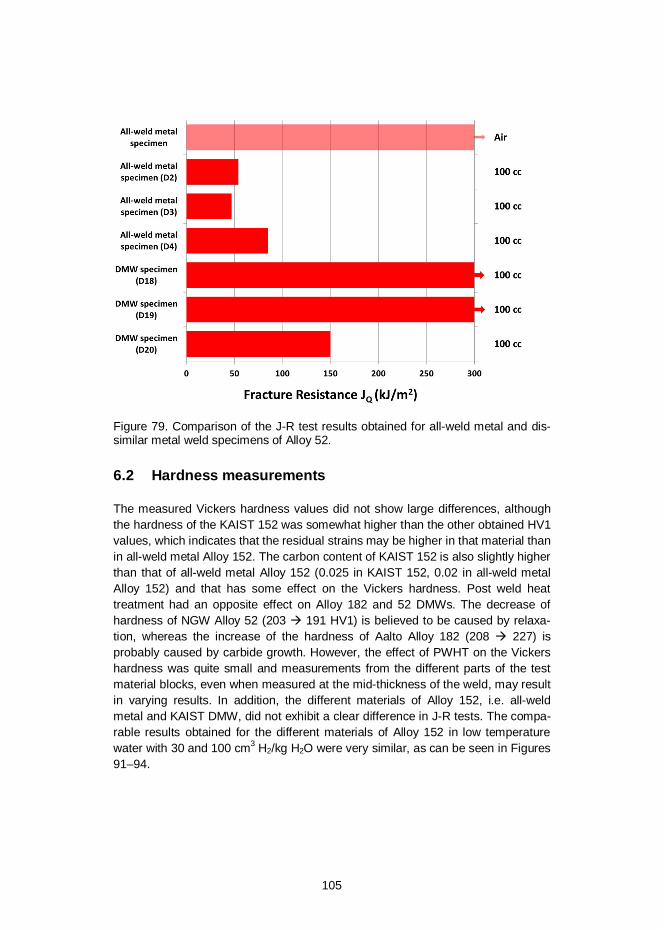
105
Figure 79. Comparison of the J-R test results obtained for all-weld metal and dis-similar metal weld specimens of Alloy 52.
6.2 Hardness measurements
The measured Vickers hardness values did not show large differences, althoughthe hardness of the KAIST 152 was somewhat higher than the other obtained HV1values, which indicates that the residual strains may be higher in that material thanin all-weld metal Alloy 152. The carbon content of KAIST 152 is also slightly higherthan that of all-weld metal Alloy 152 (0.025 in KAIST 152, 0.02 in all-weld metalAlloy 152) and that has some effect on the Vickers hardness. Post weld heattreatment had an opposite effect on Alloy 182 and 52 DMWs. The decrease ofhardness of NGW Alloy 52 (203 191 HV1) is believed to be caused by relaxa-tion, whereas the increase of the hardness of Aalto Alloy 182 (208 227) isprobably caused by carbide growth. However, the effect of PWHT on the Vickershardness was quite small and measurements from the different parts of the testmaterial blocks, even when measured at the mid-thickness of the weld, may resultin varying results. In addition, the different materials of Alloy 152, i.e. all-weldmetal and KAIST DMW, did not exhibit a clear difference in J-R tests. The compa-rable results obtained for the different materials of Alloy 152 in low temperaturewater with 30 and 100 cm3 H2/kg H2O were very similar, as can be seen in Figures91–94.
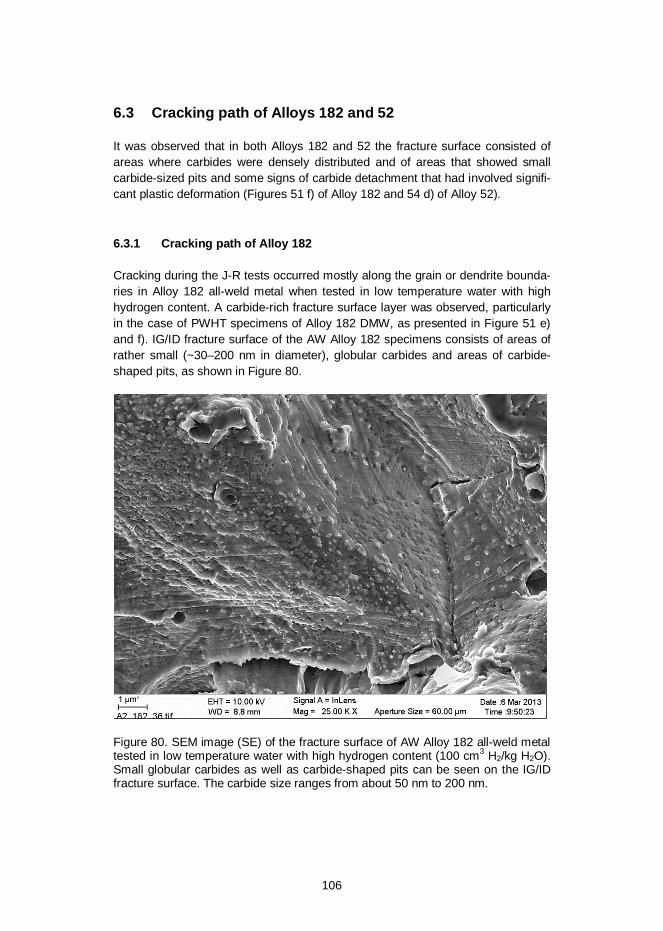
106
6.3 Cracking path of Alloys 182 and 52
It was observed that in both Alloys 182 and 52 the fracture surface consisted ofareas where carbides were densely distributed and of areas that showed smallcarbide-sized pits and some signs of carbide detachment that had involved signifi-cant plastic deformation (Figures 51 f) of Alloy 182 and 54 d) of Alloy 52).
6.3.1 Cracking path of Alloy 182
Cracking during the J-R tests occurred mostly along the grain or dendrite bounda-ries in Alloy 182 all-weld metal when tested in low temperature water with highhydrogen content. A carbide-rich fracture surface layer was observed, particularlyin the case of PWHT specimens of Alloy 182 DMW, as presented in Figure 51 e)and f). IG/ID fracture surface of the AW Alloy 182 specimens consists of areas ofrather small (~30–200 nm in diameter), globular carbides and areas of carbide-shaped pits, as shown in Figure 80.
Figure 80. SEM image (SE) of the fracture surface of AW Alloy 182 all-weld metaltested in low temperature water with high hydrogen content (100 cm3 H2/kg H2O).Small globular carbides as well as carbide-shaped pits can be seen on the IG/IDfracture surface. The carbide size ranges from about 50 nm to 200 nm.
107
Transgranular cracking was found to occur in Alloy 182 DMW tested with 30 and100 cm3 H2/kg H2O. Similar fracture surface appearance was observed for all-weldmetal Alloy 82 specimens at some locations. This kind of surface appearance wasnever uniform, but consisted of alternating areas of IG/ID and TG fracture. Some-what similar cracking was observed also by Mills et al. (2001) for annealed Alloy82H weld metal (Figure 81 a)). The TG cracking observed in this study for Alloy 82all-weld metal (Figure 81 b)) and Alloy 182 DMW has a similar appearance (TGareas in Figure 50 b)).
a)b)
Figure 81. A comparison of SEM images of TG fracture observed by Mills et al.(2001) for annealed Alloy 82H weld metal (in a) and that observed in this study foras-welded Alloy 82 weld metal (in b).
6.3.2 Cracking path of Alloy 52
The cracking observed in the J-R tests conducted in low temperature water withhigh hydrogen content was predominately intergranular or interdendritic, althoughin some cases very high fracture resistance (JQ) and corresponding ductile ap-pearance on the fracture surface was maintained.
The fracture surfaces of the specimens corresponding to lower JQ values can bestudied at three main levels. In a general view (Figure 82) the appearance of thefracture surface is uneven including steep forms and many different planes onwhich the fracture occurs. In addition, secondary cracking is observed in somespecimens. The orientation of the grains changes to some extent from specimento specimen due to slight differences of the pre-crack locations in weld thicknessdirection and varying shape of the weld beads in a multipass weld, which is alsoevident on the fracture surfaces. It is already clear from this general view that thefracture type is intergranular or interdendritic, because the fracture seems to followthe boundaries and no dimples are observed.
10 µm
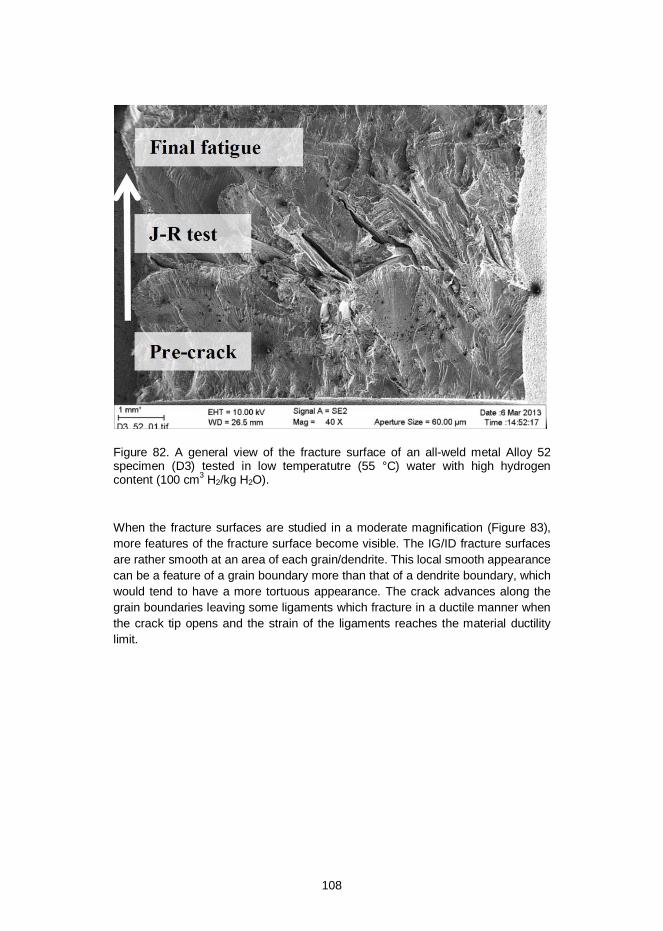
108
Figure 82. A general view of the fracture surface of an all-weld metal Alloy 52specimen (D3) tested in low temperatutre (55 °C) water with high hydrogencontent (100 cm3 H2/kg H2O).
When the fracture surfaces are studied in a moderate magnification (Figure 83),more features of the fracture surface become visible. The IG/ID fracture surfacesare rather smooth at an area of each grain/dendrite. This local smooth appearancecan be a feature of a grain boundary more than that of a dendrite boundary, whichwould tend to have a more tortuous appearance. The crack advances along thegrain boundaries leaving some ligaments which fracture in a ductile manner whenthe crack tip opens and the strain of the ligaments reaches the material ductilitylimit.
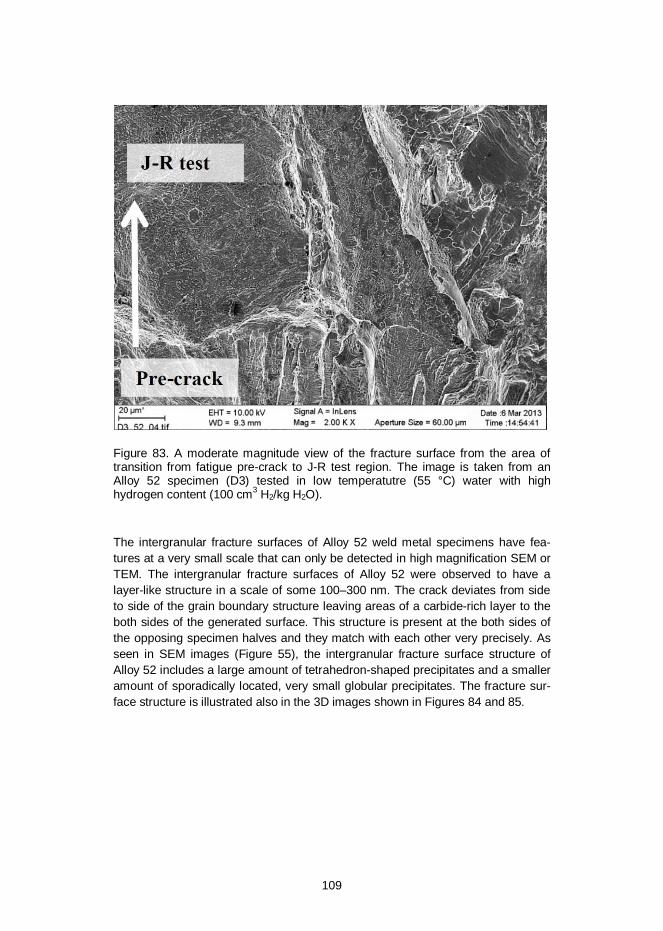
109
Figure 83. A moderate magnitude view of the fracture surface from the area oftransition from fatigue pre-crack to J-R test region. The image is taken from anAlloy 52 specimen (D3) tested in low temperatutre (55 °C) water with highhydrogen content (100 cm3 H2/kg H2O).
The intergranular fracture surfaces of Alloy 52 weld metal specimens have fea-tures at a very small scale that can only be detected in high magnification SEM orTEM. The intergranular fracture surfaces of Alloy 52 were observed to have alayer-like structure in a scale of some 100–300 nm. The crack deviates from sideto side of the grain boundary structure leaving areas of a carbide-rich layer to theboth sides of the generated surface. This structure is present at the both sides ofthe opposing specimen halves and they match with each other very precisely. Asseen in SEM images (Figure 55), the intergranular fracture surface structure ofAlloy 52 includes a large amount of tetrahedron-shaped precipitates and a smalleramount of sporadically located, very small globular precipitates. The fracture sur-face structure is illustrated also in the 3D images shown in Figures 84 and 85.
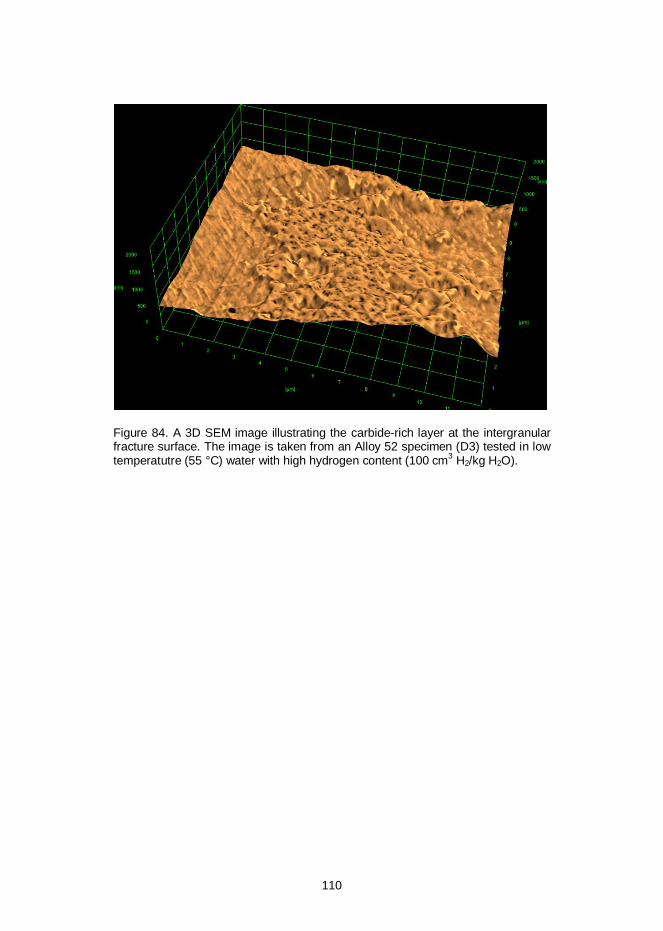
110
Figure 84. A 3D SEM image illustrating the carbide-rich layer at the intergranularfracture surface. The image is taken from an Alloy 52 specimen (D3) tested in lowtemperatutre (55 °C) water with high hydrogen content (100 cm3 H2/kg H2O).
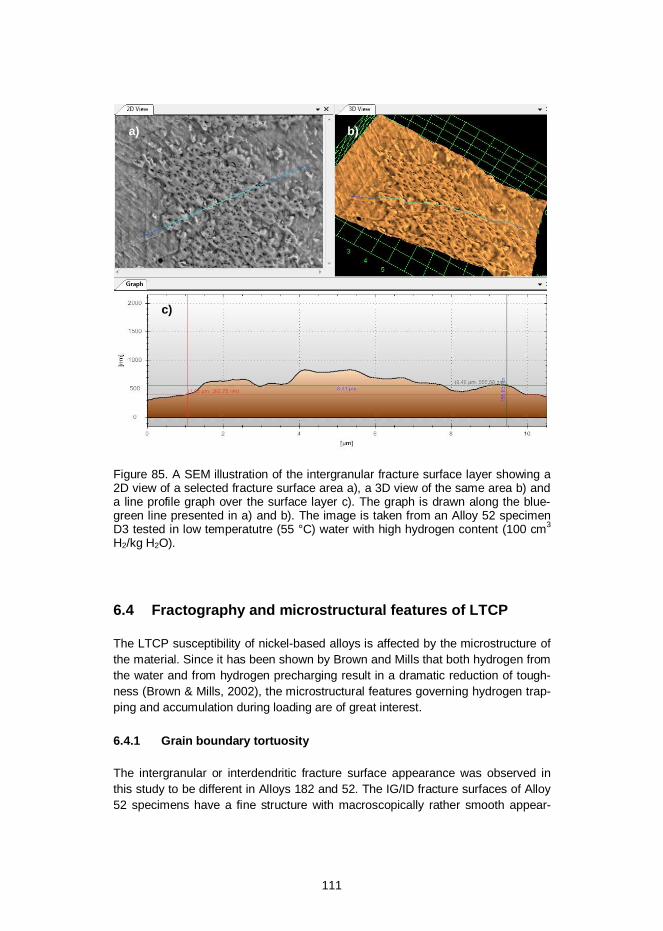
111
Figure 85. A SEM illustration of the intergranular fracture surface layer showing a2D view of a selected fracture surface area a), a 3D view of the same area b) anda line profile graph over the surface layer c). The graph is drawn along the blue-green line presented in a) and b). The image is taken from an Alloy 52 specimenD3 tested in low temperatutre (55 °C) water with high hydrogen content (100 cm3
H2/kg H2O).
6.4 Fractography and microstructural features of LTCP
The LTCP susceptibility of nickel-based alloys is affected by the microstructure ofthe material. Since it has been shown by Brown and Mills that both hydrogen fromthe water and from hydrogen precharging result in a dramatic reduction of tough-ness (Brown & Mills, 2002), the microstructural features governing hydrogen trap-ping and accumulation during loading are of great interest.
6.4.1 Grain boundary tortuosity
The intergranular or interdendritic fracture surface appearance was observed inthis study to be different in Alloys 182 and 52. The IG/ID fracture surfaces of Alloy52 specimens have a fine structure with macroscopically rather smooth appear-
a) b)
c)
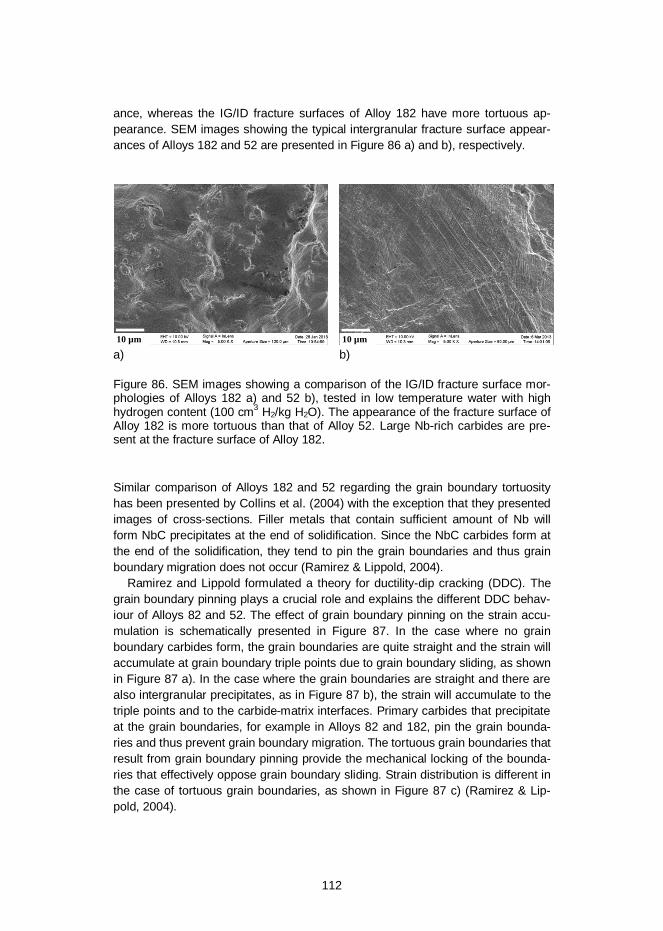
112
ance, whereas the IG/ID fracture surfaces of Alloy 182 have more tortuous ap-pearance. SEM images showing the typical intergranular fracture surface appear-ances of Alloys 182 and 52 are presented in Figure 86 a) and b), respectively.
a) b)
Figure 86. SEM images showing a comparison of the IG/ID fracture surface mor-phologies of Alloys 182 a) and 52 b), tested in low temperature water with highhydrogen content (100 cm3 H2/kg H2O). The appearance of the fracture surface ofAlloy 182 is more tortuous than that of Alloy 52. Large Nb-rich carbides are pre-sent at the fracture surface of Alloy 182.
Similar comparison of Alloys 182 and 52 regarding the grain boundary tortuosityhas been presented by Collins et al. (2004) with the exception that they presentedimages of cross-sections. Filler metals that contain sufficient amount of Nb willform NbC precipitates at the end of solidification. Since the NbC carbides form atthe end of the solidification, they tend to pin the grain boundaries and thus grainboundary migration does not occur (Ramirez & Lippold, 2004).
Ramirez and Lippold formulated a theory for ductility-dip cracking (DDC). Thegrain boundary pinning plays a crucial role and explains the different DDC behav-iour of Alloys 82 and 52. The effect of grain boundary pinning on the strain accu-mulation is schematically presented in Figure 87. In the case where no grainboundary carbides form, the grain boundaries are quite straight and the strain willaccumulate at grain boundary triple points due to grain boundary sliding, as shownin Figure 87 a). In the case where the grain boundaries are straight and there arealso intergranular precipitates, as in Figure 87 b), the strain will accumulate to thetriple points and to the carbide-matrix interfaces. Primary carbides that precipitateat the grain boundaries, for example in Alloys 82 and 182, pin the grain bounda-ries and thus prevent grain boundary migration. The tortuous grain boundaries thatresult from grain boundary pinning provide the mechanical locking of the bounda-ries that effectively oppose grain boundary sliding. Strain distribution is different inthe case of tortuous grain boundaries, as shown in Figure 87 c) (Ramirez & Lip-pold, 2004).
10 µm 10 µm
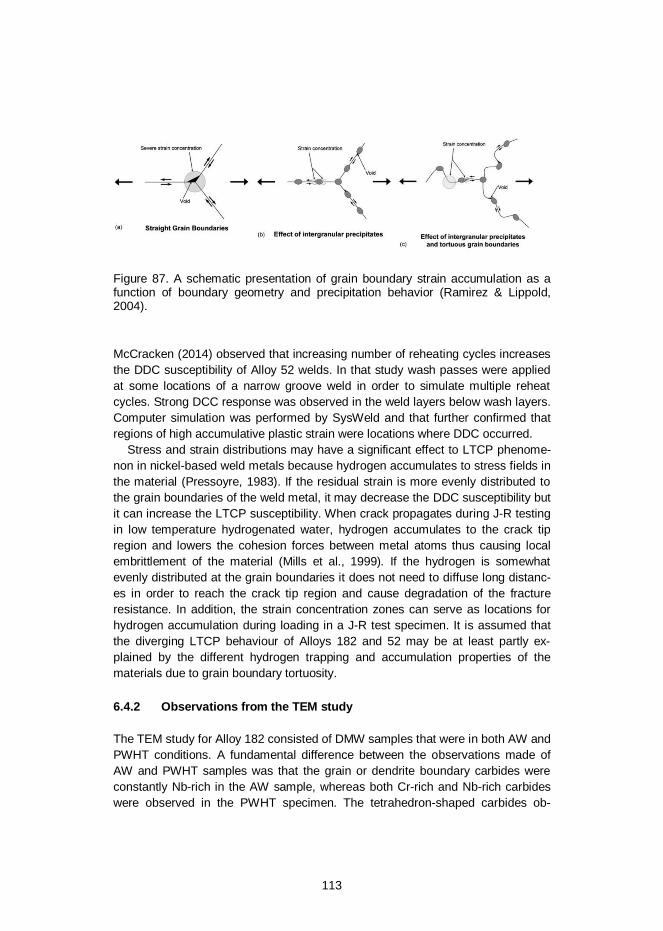
113
Figure 87. A schematic presentation of grain boundary strain accumulation as afunction of boundary geometry and precipitation behavior (Ramirez & Lippold,2004).
McCracken (2014) observed that increasing number of reheating cycles increasesthe DDC susceptibility of Alloy 52 welds. In that study wash passes were appliedat some locations of a narrow groove weld in order to simulate multiple reheatcycles. Strong DCC response was observed in the weld layers below wash layers.Computer simulation was performed by SysWeld and that further confirmed thatregions of high accumulative plastic strain were locations where DDC occurred.
Stress and strain distributions may have a significant effect to LTCP phenome-non in nickel-based weld metals because hydrogen accumulates to stress fields inthe material (Pressoyre, 1983). If the residual strain is more evenly distributed tothe grain boundaries of the weld metal, it may decrease the DDC susceptibility butit can increase the LTCP susceptibility. When crack propagates during J-R testingin low temperature hydrogenated water, hydrogen accumulates to the crack tipregion and lowers the cohesion forces between metal atoms thus causing localembrittlement of the material (Mills et al., 1999). If the hydrogen is somewhatevenly distributed at the grain boundaries it does not need to diffuse long distanc-es in order to reach the crack tip region and cause degradation of the fractureresistance. In addition, the strain concentration zones can serve as locations forhydrogen accumulation during loading in a J-R test specimen. It is assumed thatthe diverging LTCP behaviour of Alloys 182 and 52 may be at least partly ex-plained by the different hydrogen trapping and accumulation properties of thematerials due to grain boundary tortuosity.
6.4.2 Observations from the TEM study
The TEM study for Alloy 182 consisted of DMW samples that were in both AW andPWHT conditions. A fundamental difference between the observations made ofAW and PWHT samples was that the grain or dendrite boundary carbides wereconstantly Nb-rich in the AW sample, whereas both Cr-rich and Nb-rich carbideswere observed in the PWHT specimen. The tetrahedron-shaped carbides ob-
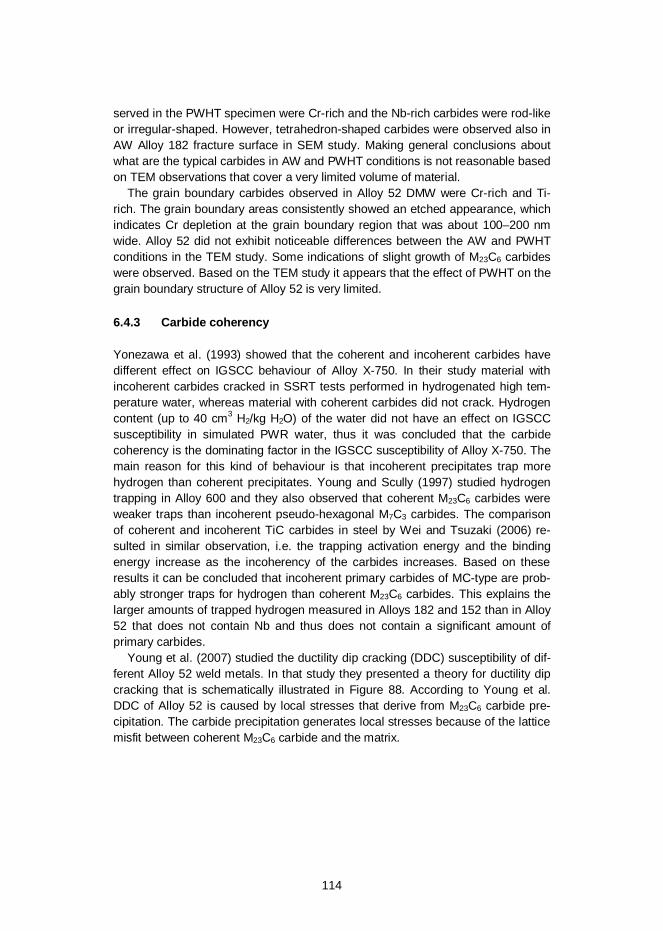
114
served in the PWHT specimen were Cr-rich and the Nb-rich carbides were rod-likeor irregular-shaped. However, tetrahedron-shaped carbides were observed also inAW Alloy 182 fracture surface in SEM study. Making general conclusions aboutwhat are the typical carbides in AW and PWHT conditions is not reasonable basedon TEM observations that cover a very limited volume of material.
The grain boundary carbides observed in Alloy 52 DMW were Cr-rich and Ti-rich. The grain boundary areas consistently showed an etched appearance, whichindicates Cr depletion at the grain boundary region that was about 100–200 nmwide. Alloy 52 did not exhibit noticeable differences between the AW and PWHTconditions in the TEM study. Some indications of slight growth of M23C6 carbideswere observed. Based on the TEM study it appears that the effect of PWHT on thegrain boundary structure of Alloy 52 is very limited.
6.4.3 Carbide coherency
Yonezawa et al. (1993) showed that the coherent and incoherent carbides havedifferent effect on IGSCC behaviour of Alloy X-750. In their study material withincoherent carbides cracked in SSRT tests performed in hydrogenated high tem-perature water, whereas material with coherent carbides did not crack. Hydrogencontent (up to 40 cm3 H2/kg H2O) of the water did not have an effect on IGSCCsusceptibility in simulated PWR water, thus it was concluded that the carbidecoherency is the dominating factor in the IGSCC susceptibility of Alloy X-750. Themain reason for this kind of behaviour is that incoherent precipitates trap morehydrogen than coherent precipitates. Young and Scully (1997) studied hydrogentrapping in Alloy 600 and they also observed that coherent M23C6 carbides wereweaker traps than incoherent pseudo-hexagonal M7C3 carbides. The comparisonof coherent and incoherent TiC carbides in steel by Wei and Tsuzaki (2006) re-sulted in similar observation, i.e. the trapping activation energy and the bindingenergy increase as the incoherency of the carbides increases. Based on theseresults it can be concluded that incoherent primary carbides of MC-type are prob-ably stronger traps for hydrogen than coherent M23C6 carbides. This explains thelarger amounts of trapped hydrogen measured in Alloys 182 and 152 than in Alloy52 that does not contain Nb and thus does not contain a significant amount ofprimary carbides.
Young et al. (2007) studied the ductility dip cracking (DDC) susceptibility of dif-ferent Alloy 52 weld metals. In that study they presented a theory for ductility dipcracking that is schematically illustrated in Figure 88. According to Young et al.DDC of Alloy 52 is caused by local stresses that derive from M23C6 carbide pre-cipitation. The carbide precipitation generates local stresses because of the latticemisfit between coherent M23C6 carbide and the matrix.
115
Figure 88. The origin of ductility dip cracking in Alloy 52 weld metal according toYoung et al. (2007).
This kind of behaviour is interesting also in LTCP point of view because the car-bide precipitation induces stresses and hydrogen accumulates to stress zones.These stress zones would be locations for hydrogen uptake from the water in thecase of Alloy 52 and explain the LTCP susceptibility of Alloy 52 when tested withhigh hydrogen contents.
6.4.4 Cracking of MC-type carbides
The MC-type carbides that form during solidification are typically relatively largeand irregular in shape. The SEM examinations of the fracture surfaces of Alloy182 evidence that these Nb-rich primary carbides tend to crack during J-R testing,as seen in Figure 89. Yonezawa (2013) concludes that cracking of primary car-bides during crack growth testing of Alloy 690 is a factor that accelerates IGSCC.When the specimen is loaded in a J-R test and the carbide cracking begins tooccur, sharp cracks and voids form and they can absorb hydrogen from the sur-rounding material. During the test more hydrogen diffuses into the metal when thespecimen is loaded in hydrogenated low temperature water and, eventually theprimary carbides and the surrounding deformed matrix with high dislocation densi-ty may reach high levels of hydrogen concentration. This mechanism may in-crease the LTCP susceptibility of Alloy 182, where large primary carbides arecommonly observed.
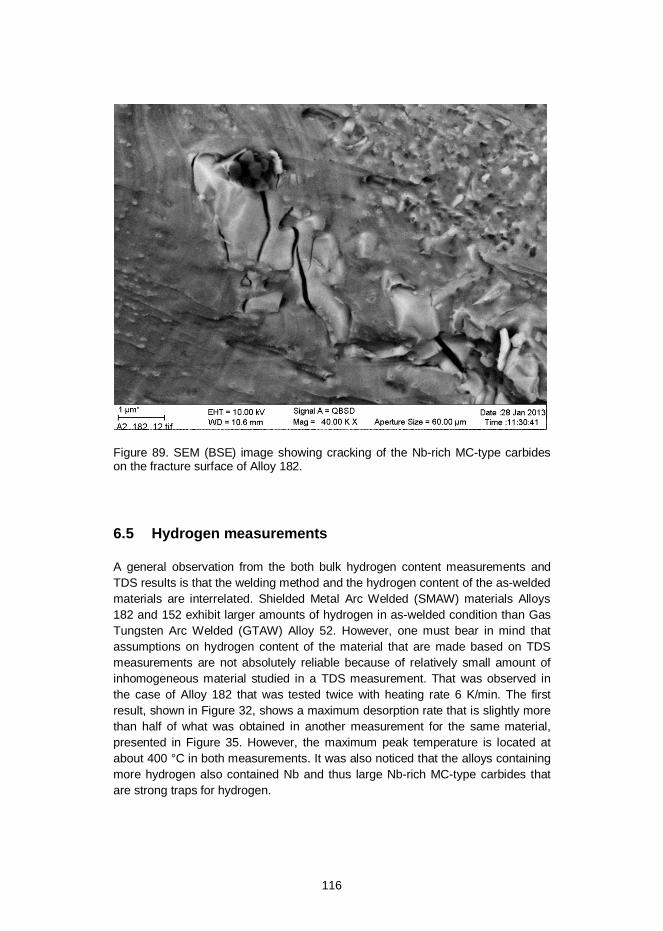
116
Figure 89. SEM (BSE) image showing cracking of the Nb-rich MC-type carbideson the fracture surface of Alloy 182.
6.5 Hydrogen measurements
A general observation from the both bulk hydrogen content measurements andTDS results is that the welding method and the hydrogen content of the as-weldedmaterials are interrelated. Shielded Metal Arc Welded (SMAW) materials Alloys182 and 152 exhibit larger amounts of hydrogen in as-welded condition than GasTungsten Arc Welded (GTAW) Alloy 52. However, one must bear in mind thatassumptions on hydrogen content of the material that are made based on TDSmeasurements are not absolutely reliable because of relatively small amount ofinhomogeneous material studied in a TDS measurement. That was observed inthe case of Alloy 182 that was tested twice with heating rate 6 K/min. The firstresult, shown in Figure 32, shows a maximum desorption rate that is slightly morethan half of what was obtained in another measurement for the same material,presented in Figure 35. However, the maximum peak temperature is located atabout 400 °C in both measurements. It was also noticed that the alloys containingmore hydrogen also contained Nb and thus large Nb-rich MC-type carbides thatare strong traps for hydrogen.
117
The bulk hydrogen content measurements presented in Table 7 show that thehydrogen contents of Alloys 182 and 152 actually decrease as a result of 30 dayspre-exposure in 300 °C hydrogenated (30 cm3 H2/kg H2O) water. This gives sup-port to the assumption that trapped hydrogen has an effect on LTCP and clarifiesthe relationship between the hydrogen content of the material and the fractureresistance, as it was shown earlier that high temperature pre-exposure increasedthe fracture resistance of Alloys 182 and 152. The results obtained from the ther-mal desorption measurements show that the trapped hydrogen is partly outgassedfrom the trapping sites during the pre-exposure. The maximum hydrogen desorp-tion rates for as-welded Alloys 182 and 152 are located slightly below and above400 °C, respectively. The desorption curve for as-welded Alloy 52 is significantlylower than those of as-welded Alloys 182 and 152, but the maximum desorptionrate temperature for as-welded Alloy 52 seems to be similar to that of as-weldedAlloy 152. The total amount of hydrogen is decreased to ~1/3 of the original valueas a result of pre-exposure (5 cm3 H2/kg H2O) for Alloys 182 and 152.
The analysis of thermal desorption measurements is a mean to characterize themicrostructural trapping sites of the material. All the studied alloys contain trappedhydrogen, which releases at the temperatures of about 400 °C and 500 °C. Pre-exposed alloys manifest a complicated shape of the thermal desorption peak ormultiple peaks which are caused by the presence of multiple types of trappingsites. Possible trapping positions of hydrogen are grain boundaries, precipitates,dislocations, voids, inclusions, and interstitial positions. The activation energy forhydrogen desorption obtained in this study for as-welded Alloy 182 DMW was 40.0± 3.7 kJ/mol. The calculated value was somewhat lower than the value obtainedby Young et al. for as-welded Alloy 182 all-weld metal (67.7 kJ/mol, in Young etal., 1997) and similar to that obtained by Ai et al. for solution heat treated andaged Monel K-500 (41.2 ± 1.7 kJ/mol, in Ai et al., 2013), although the trapping inthe case of Monel K-500 is due to ’ precipitates. Alloy 52 exhibits two differenttrapping sites that are lower energy traps compared to that of Alloy 182.
Some unusual small peaks were observed on occasion in TDS curves. Thesepeaks that occurred in some measurements but not in others for a certain materialare believed to be caused by impurity inclusions or weld defects. This kind of peakis present for example in the TDS curve of Alloy 152 measured after pre-exposurewith 5 cm3 H2/kg H2O at about 500 °C, but not in the curve measured after pre-exposure with 30 cm3 H2/kg H2O. In addition, it was observed for both Alloys 182and 52 that there was a small peak at about 500 °C, when measured after pre-exposure with 30 cm3 H2/kg H2O, but that peak does not occur in post-weld heattreated samples. This peak was not observed to occur in AW samples either.Thus, it is assumed that these peaks are also caused by hydrogen trapped occa-sionally in some weld defects or inclusions.
118
6.6 Role of grain boundary carbides in LTCP
LTCP behaviour of the studied Alloy 182, 82, 152 and 52 weld metals was foundto be somewhat different for each material. Alloys 182, 152 and 52 were mostextensively studied. The studied alloys can be divided based on their chemicalcomposition to higher and lower Cr alloys, and on the other hand to alloys contain-ing Nb and to alloys that do not contain Nb. The general impression, that is at-tained when all the results are evaluated as a whole is, that the key effect of thechemical composition on LTCP behaviour is the grain/dendrite boundary carbidestructure. In addition to chemical composition, thermal history has a significanteffect on the carbide precipitation and thus on LTCP behaviour of nickel-basedweld metals.
As was shown by hydrogen content measurements (bulk and TDS), Alloys 182and 152 containing Nb contained a higher amount of hydrogen than Alloy 52 inwhich Nb is not alloyed. This is also partly due to the different welding technique.Activation energies for hydrogen desorption from the trapping sites were observedto be different for Alloy 182 and 52 welds. In Alloy 182 there was one dominatingtrapping site which was a higher energy trap than the two different traps that wereobserved in Alloy 52. The study by Yonezawa et al. (1993) shows that incoherentcarbides are stronger traps than the coherent ones and for Alloy X-750 stresscorrosion cracking occurred only in materials with incoherent carbides. Hence, inAlloy 182 the hydrogen trapping is probably governed by intergranular Nb-richMC-type carbides, whereas trapping in Alloy 52 is caused by two different types ofcarbides that can be Cr-rich M23C6 and very fine Ti-rich MC-type carbides, ofwhich the fine MC-type carbides will account for the higher energy trap. Thetrapped hydrogen then induces decohesion at the grain boundaries during J-Rtesting. The grain boundary carbides and the dislocation networks around themcan also act as locations of hydrogen accumulation when the specimen is loaded.
6.7 Subjects for further studies
A variety of techniques was utilized and a significant amount of data was generat-ed in this study. The results obtained within this study extend the understanding ofthe phenomena occurring in nickel-based alloy weld metals in hydrogenated lowtemperature water. However, there are some areas where further studies aredesirable.
Transmission electron microscopy was applied in examining the grain boundarycarbides but the study was limited. Since the literature shows that there is a rela-tion between the grain boundary carbides and SCC susceptibility, the TEM exami-nations could be followed by a study of determining the orientation of the carbidesrelative to the matrix.
Welding parameters and thermal history seem to have an effect on the LTCPbehaviour of Alloy 52, since the results for all-weld metal specimens and DMW
119
specimens were somewhat different. The effect of thermal ageing on the fractureresistance behaviour of Alloy 52 would be of great interest considering the long-term operation and structural integrity of nuclear power plants, where Alloy 52 isused.
This study concentrated in fracture mechanical testing and microscopy. The re-sults and knowledge obtained from the results of this study could be further uti-lized by creating a FEM model that could illustrate and predict the fracture behav-iour of different austenitic materials in hydrogenated water.
It was observed during this study that the fracture surfaces of the weld metalspecimens exhibit a macroscopically uneven appearance. This results in slightlyfalse assumptions in J-integral calculations where the final crack length is meas-ured from the projection and not from the actual cracking path along the surface.The actual cracking paths could be measured using 3D topography and the moreaccurate J-R curves could then be determined by applying FEM and giving inputof a versus force-displacement.
120
7 Conclusions
1. Hydrogen decreases the fracture resistance of Alloys 182, 82, 152 and52 significantly in low temperature water with high hydrogen contents(100 cm3 H2/kg H2O). Alloy 182 is the most susceptible material to LTCP,and it exhibits a significant reduction of fracture resistance already withhydrogen content of 30 cm3 H2/kg H2O. The degrading effect of hydrogenon LTCP resistance of nickel-based Alloy 182, 82, 152 and 52 weld met-als in low temperature water has been clearly demonstrated.
2. Specimens of Alloy 52 DMW behaved in varying manner when testedwith high hydrogen content, in both AW and PWHT conditions. Somespecimens of Alloy 52 were observed to exhibit rather low JQ values,similar to those of Alloy 182, when tested with highest hydrogen content.The inhomogeneous microstructure and varying grain size of Alloy 52provides an explanation to this kind of behaviour because the pre-cracktip location regarding microstructure varies.
3. High temperature pre-exposure (300 °C) was shown to have a ratherslight but a systematic increasing effect on fracture resistance of Alloy182 and 152 weld metals tested in low temperature water regardless ofthe hydrogen content of the water.
4. Hydrogen trapping has a degrading effect on fracture resistance of Alloy182 and 152 weld metals. Bulk hydrogen content measurements showthat pre-exposure in high temperature water (30 days at 300 °C) de-creases the amount of trapped hydrogen and slightly increases the frac-ture resistance when compared to the results obtained for as-weldedsamples.
5. Pre-exposed alloys manifest a diverging shape of the TDS curves withsingle peak or multiple peaks, which is caused by the presence of multi-ple types of trapping sites. Different activation energies for hydrogen de-
121
sorption were determined for DMW Alloys 182 and 52 which indicatesthat the hydrogen trapping is caused by different carbides of the alloys.
6. Reduction of fracture resistance in J-R test results is typically observedon the fracture surfaces of the studied materials as a change in the typeof fracture. Higher JQ values correspond to fracture surfaces exhibitingmainly ductile dimple cracking, whereas specimens with lower JQ valuesshow large areas of IG/ID cracking.
7. Alloy 52 usually exhibits significant plastic deformation when the smalltetrahedron-shaped carbides are detached from the fracture surface,whereas the small carbides in Alloy 182 detach from the ID fracture sur-face without notable plastic deformation. This indicates on the differencesin the cohesion strength between the carbides and matrix of Alloy 182and 52 weld metals.
8. The IG/ID fracture surfaces of Alloy 52 manifest a complex surface struc-ture. Crack propagation deviates between two parallel planes of a Cr-depleted zone near the grain boundary. The width of the grain boundaryzone fits well with the Cr-rich M23C6 carbide size.
9. Alloy 182 DMW tested with moderate and high hydrogen contents exhib-ited a transgranular (or transdendritic) cracking mechanism that is be-lieved to be hydrogen-induced based on its macroscopically planar ap-pearance and somewhat low JQ values. Cracking occurred in the dendritegrowth direction <100>.
10. The different LTCP behaviour of Alloy 182 and 52 weld metals is believedto be caused mainly by different types of carbides affecting the hydrogen-induced fracture. The carbides may have an effect on hydrogen distribu-tion at the grain/dendrite boundaries and the availability of hydrogenclose to the crack tip.
11. Post-weld heat treatment slightly increases the J1mm values and tearingmodulus of DMW Alloy 182 tested in hydrogenated low temperature wa-ter but does not have a clear effect on JQ.
122
8 References
Ahonen, M., Ehrnstén, U., Saukkonen, T., Todoshchenko, O. & Hänninen, H.2013. Low Temperature Crack Propagation (LTCP) Susceptibility of Nickel-BasedAlloy 182, 152 and 52 Weld Metals in PWR Primary Water. In: Proceedings of the16th International Conference on Environmental Degradation of Materials in Nu-clear Power Systems - Water Reactors. Asheville, North Carolina, August 11-15,2013. USA: Omnipress (CD-ROM).
Ahonen, M., Ehrnstén, U. & Hänninen, H. 2014. The Effect of Microstructure onLow Temperature Crack Propagation (LTCP) Susceptibility of Nickel-Based Alloy182, 152 and 52 Weld Metals in PWR Primary Water. In: Proceedings of the 8th
Fontevraud Conference, Avignon, France, September 15-18, 2013. France: SFEN(CD-ROM).
Ai, J.-H., Ha, H. M., Gangloff, R. P. & Scully, J. R. 2013. Hydrogen Diffusion andTrapping in a Precipitation-Hardened Nickel-Copper-Aluminum Alloy Monel K-500(UNS N05500). Acta Materialia, 61 (2013), pp. 3186-3199.
Anderson, T. L. 2005. Fracture Mechanics Fundamentals and Applications, 3rd
Edition. USA: CRS Press, 610 p. ISBN 1-4200-5821-5 (eBook - PDF).
Andresen, P. 1987. Effect of Dissolved Oxygen, Solution Conductivity and StressIntensity on the Interdendritic Stress Corrosion Cracking of Alloy 182 Weld Metal.In: Proceedings of Corrosion/87. San Francisco, California, March 9-13, 1987.Paper No. 85. 12 p.
Andresen, P. L., Morra, M. M., Hickling, J., Ahluwalia, A. & Wilson, J. 2007.PWSCC of Alloys 690, 52 and 152. In: Proceedings of the 13th International Sym-posium on Environmental Degradation of Materials in Nuclear Power Systems -Water Reactors, Whistler, Canada, April 19-23, 2007. Canada: CNS-SNC (CD-ROM).
Angelo, J. E., Moody N. R. & Baskes, M. I. 1995. Trapping of Hydrogen to LatticeDefects in Nickel. Modelling and Simulation in Materials Science and Engineering,3 (1995), pp. 289-307.
Bamford, W. H., Foster, J. P. & Pathania, R. S. 1999. An Investigation of Alloy 182Stress Corrosion Cracking in Simulated PWR Environment. In: Bruemmer, S.,Ford, P. & Was, G. (Eds.). Proceedings of the 9th International Symposium onEnvironmental Degradation of Materials in Nuclear Power Systems – Water Reac-tors. Newport Beach, California, August 1-5, 1999. USA: TMS, pp. 279-296. ISBN0-87339-475-5.
123
Baty, D. L., Hayner, G. O., Clevinger, G. S., & Garner, G. L. 1984. MetallurgicalFactors Affecting the Failure of Alloy X-750 Holddown Springs. In: Roberts, J. T.A. & Berry, W. (Eds.). Proceedings of the International Symposium on Environ-mental Degradation of Materials in Nuclear Power Systems – Water Reactors.Myrtle Beach, South Carolina, August 22-24, 1983. USA: NACE, pp. 151-178.ISBN 0-915567-00-8.
Berge, P. 1988. Can PWR U-Tube Steam Generators Work Safely? In: Theus, G.J. & Weeks, J. R. (Eds.). Proceedings of 3rd International Conference on Environ-mental Degradation of Materials in Nuclear Power Systems – Water Reactors.Traverse City, Michigan, August 30-September 3, 1987. USA: The MetallurgicalSociety, Inc. pp. 49-54. ISBN 0-87339-030-X.
Birnbaum, H. K. & Sofronis, P. 1994. Hydrogen-Enhanced Localized Plasticity – aMechanism for Hydrogen Related Fracture. Materials Science and Engineering,A176 (1994), pp. 191-202.
Bose, S. K. & Grabke, H. J. 1978. Diffusion Coefficient of C in Fe-Ni Austenite inthe Temperature Range 950-1100 °C. Zeitschrift fur Metallkunde, 69 (1), pp. 8-15.
Brody, H. D. & Flemings, M. C. 1966. Solute Distribution in Dendritic Solidification.Transactions of AIME, 236 (5), pp. 615-624.
Brown, C. M. & Mills, W. J. 1999. Effect of Water on Mechanical Properties andStress Corrosion Behavior of Alloy 600, Alloy 690, EN82H Welds, and EN52Welds. Corrosion, 55 (2), pp. 173-186.
Brown, C. M. & Mills, W. J. 2002. Fracture Toughness of Alloy 690 and EN52Welds in Air and Water. Metallurgical and Materials Transactions A, 33A (6), pp.1725-1735.
Brown, C. M. & Mills, W. J. 2005. Load Path Effects on the Fracture Toughness ofAlloy 82H and 52 Welds in Low Temperature Water. In: Allen, T.R. (Ed.) Proceed-ings of the 12th International Symposium on Environmental Degradation of Materi-als in Nuclear Power Systems – Water Reactors. Salt Lake City, Utah, August 14-18, 2005. USA: TMS (CD-ROM).
Brown, C. M. & Mills, W. J. 2007. Effect of Defect Acuity on the Fracture Behaviorof Alloy 82H Welds in Low Temperature Water. In: Proceedings of the 13th Interna-tional Symposium on Environmental Degradation of Materials in Nuclear PowerSystems - Water Reactors, Whistler, Canada, April 19-23, 2007. Canada: CNS-SNC (CD-ROM).
124
Bruemmer, S. M., Vetrano, J. S. & Toloczko, M. B. 2007. Microstructure and SCCCrack Growth of Nickel-Base Alloy 182 Weld Metal in Simulated PWR PrimaryWater. In: Proceedings of the 13th International Symposium on EnvironmentalDegradation of Materials in Nuclear Power Systems - Water Reactors, Whistler,Canada, April 19-23, 2007. Canada: CNS-SNC (CD-ROM).
Buisine, D., de Bouvier, O., Rupa, N., Thebault, Y., Barbe, V. & Pitner, P. 2010.French Steam Generator Tubes: An Overview of Degradations. In: Proceedings ofthe 7th Fontevraud Conference, Avignon, France, September 26-30, 2010. France:SFEN (CD-ROM).
Collins, M. G., Ramirez, A. & Lippold, J. C. 2004. An Investigation of Ductility-DipCracing in Ni-Based Weld Metals – Part 3. Welding Journal, 83 (2), pp. 39s-49s.
Copson, H. R. 1959. Effect of Composition on Stress Corrosion Cracking of SomeAlloys Containing Nickel. In: Rhodin, T. N. (Ed.). Physical Metallurgy of Stress-Corrosion Fracture. New York: Interscience, pp. 247-272.
Coriou, H., Grall, L. & Vettier, S. 1960. Corrosion fissurante sous contrainte del'Inconel dans l'eau à haute temperature. In: Third Saclay Metallurgy Colloquium.North Holland, p. 161.
Cronvall, O. 2011. Structural Integrity Study Concerning LTCP Phenomenon. VTTResearch Report no. VTT-R-00055-11. 42 p.
Davis, J. R. (Ed.). 2000. ASM Speciality Handbook: Nickel, Cobalt, and TheirAlloys. USA: ASM, 442 p. ISBN 0-87170-685-7.
Demma, A., McIlree, A. & Herrera, M. 2005. Low Temperature Crack PropagationEvaluation in Pressurized Water Reactor Service. In: Allen, T.R. (Ed.) Proceedingsof the 12th International Symposium on Environmental Degradation of Materials inNuclear Power Systems – Water Reactors. Salt Lake City, Utah, August 14-18,2005. USA: TMS (CD-ROM).
DuPont, J. N., Robino, C. V., Mader, A. R., Notis, M. R. & Michael, J. R. 1988.Solidification of Nb-Bearing Superalloys: Part I. Reaction Sequences. Metallurgicaland Material Transactions A, 29A, pp. 2785-2796.
DuPont, J. N., Lippold J. C. & Kiser, S. D. 2009. Welding Metallurgy and Weldabil-ity of Nickel-Base Alloys. USA: John Wiley and Sons, Inc. Hobocken, N.J. ISBN987-0-470-08714-5. 440 p.
125
EPRI Technical Update Report: Materials Reliability Program, Resistance to Pri-mary Water Stress Corrosion Cracking of Alloys 690, 52, and 152 in PressurizedWater Reactors (MRP-111). 2004. EPRI Project managers Hickling, J. & King, C.Palo Alto, CA, USA.
Fish, J. S., Lewis, N., Yang, W. J. S., Perry, D. J. & Thompson, C. D. 1997. AEMInvestigations on Primary Water SCC in Nickel Alloys. In: McIlree, A. R. &Bruemmer, S. M. (Eds.) Proceedings of the 8th International Symposium on Envi-ronmental Degradation of Materials in Nuclear Power Systems – Water Reactors.Amelia Island, Florida, August 10-14, 1997. USA: ANS, pp. 266-273. ISBN 0-894488-626-8.
Grove, C. A. & Petzold, L. D. 1985. Mechanisms on Stress-Corrosion Cracking ofAlloy X-750 in High-Purity Water. J. Materials for Energy Systems, 7 (2), pp. 147-162.
Guerre, C., Duhamel, C., Sennour, M., Crépin, J. & Le Calvar, M. 2011. SCCCrack Growth Rate of Alloy 82 in PWR Primary Water Conditions – Effect of aThermal Treatment. In: Busby, J. T., Ilevbare, G. & Andresen, P. L. (Eds.). Pro-ceedings of the 15th International Symposium on Environmental Degradation ofMaterials in Nuclear Power Systems – Water Reactors. Colorado Springs, Colora-do, August 7-11, 2011. USA: TMS (CD-ROM).
Herms, E., Raquet, O., De Curières, I. & Joly, P. 2009. LTCP of Alloy 182/152Tested in PWR Primary Water. In: Proceedings of the 14th International Symposi-um on Environmental Degradation of Materials in Nuclear Power Systems - WaterReactors. Virginia Beach, Virginia, August 23-27, 2009. USA: ANS (CD-ROM).
Heubner, U., Kohler, M. & Prinz, B. 1988. Determination and the SolidificationBehavior of Some Selected Superalloys. In: Retchman, S., Duhl, D. N. Maurer, G.,Antolovich, S. & Lund, C. (Eds.). Superalloys 1988, Proceedings of the Sixth In-ternational Symposium on Superalloys. Champion, Pennsylvania, September 18-22, 1988. USA: ANS, pp. 437-447. ISBN 0-87339-076-8.
Hilkes, J., Neesen, F. & Caballero, S. 2004. Electrodes for Welding 9% NickelSteel. Welding Journal, 83 (1), pp. 30-37.
Honeycombe, R. W. K. & Bhadesia, H. K. D. H. 1995. Steels: Microstructure andProperties, 2nd edition. Great Britain: Edward Arnold, a member of the HodderHeadline PLC, 324 p. ISBN 0-304-58946-9.
126
Hosoi, K., Hattori, S., Urayama, Y., Masaoka, I & Sasaki, R. 1984. Relation be-tween Susceptibility to Stress Corrosion Cracking in High Temperature Water andMicrostructure of Inconel X-750. In: Roberts, J. T. A. & Berry, W. (Eds.). Proceed-ings of the International Symposium on Environmental Degradation of Materials inNuclear Power Systems – Water Reactors. Myrtle Beach, South Carolina, August22-24, 1983. USA: NACE, pp. 334-344. ISBN 0-915567-00-8.
Hosoya, K., Ballinger, R., Prybylowski, J. & Hwang, I. S. 1988. MicrostructuralRole in Environmentally Assisted Cracking of Ni-Base Alloys. Corrosion, 44 (11),pp. 838-852.
Hänninen, H., Brederholm, A., Saukkonen, T., Gripenberg, H., Toivonen, A.,Ehrnsten, U. & Aaltonen, P. 2007. Hot Cracking and Environment-assisted Crack-ing Susceptibility of Dissimilar Metal Welds. VTT Research Notes 2399. Espoo:VTT Technical Research Centre of Finland. 181 p.
Hänninen, H., Brederholm, A., Sarikka, T., Mouginot, R., Holmström, P., Saukko-nen, T., Toivonen, A., Karjalainen-Roikonen, P., Nevasmaa, P., Keinänen, H.,Leskelä, E., Ahonen, M., Ehrnstén, U. & Aaltonen, P. 2014. Structural Integrity ofNi-base Alloy Welds. VTT Technology 175. Espoo: VTT Technical Research Cen-tre of Finland. 257 p. ISBN 978-951-38-8259-4.
Jeng, S. L., Lee, H. T., Rehbach, W. P., Kuo, T. Y., Weirich, T. E. & Mayer, J. P.2005. Effects of Nb on the Microstructure and Corrosive Property in the Alloy 690–SUS 304L Weldments. Materials Science and Engineering A, 397 (1-2), pp. 229-238.
Joo, H. & Takeuchi, H. 1994. Cast Structure of Inconel 713C Alloy. Tokai DaigakuKiyo, 34 (1), pp. 203-209.
Kaneda, J., Horiuchi, T., Kuniya, J., Nagase, H. & Koshiishi, M. 2007. Investigationof Precipitation and Segregation on Grain Boundaries in Ni-Based Alloys andWelds. In: Proceedings of the 13th International Symposium on EnvironmentalDegradation of Materials in Nuclear Power Systems - Water Reactors, Whistler,Canada, April 19-23, 2007. Canada: CNS-SNC (CD-ROM).
Kekkonen, T., Aaltonen, P. & Hänninen, H. 1985. Metallurgical Effects on theCorrosion Resistance of a Low Temperature Sensitized Welded AISI Type 304Stainless Steel. Corrosion Science, 25 (8/9), pp. 821-836.
Kiser, S. 1990. Nickel-Alloy Consumable Selection for Severe Service Conditions.Welding Journal, 69(1), pp. 30-35.
Kou, S. 2003. Welding Metallurgy, 2nd Edition. 2003. USA: John Wiley & Sons,Inc., 461 p. ISBN 0-471-43491-4.
127
Lee, H. G. & Lee, J.-Y. 1984. Hydrogen Trapping by TiC Particles in Iron. ActaMetallurgica et Materialia, 32 (1), pp. 131-136.
Lee, H. T., Jeng, S. L., Yen, C. H. & Kuo, T. Y. 2004. Dissimilar Welding of Nickel-Based Alloy 690 to SUS 304L with Ti Addition. Journal of Nuclear Materials, 335(1), pp. 59-69.
Lippold, J., Clark, W. A. T. & Tumuluru, M. 1992. An Investigation of Weld MetalInterfaces. The Metal Science of Joining. The Metals, Minerals and MaterialsSociety, Warrendale, PA, pp. 141-146.
Lippold, J., Ramirez, A. & Sowards, J. 2004. New Insight into the Mechanism ofDuctility Dip Cracking in Nickel-Based Weld Metals. IIW Doc. No. IX-2123-04. 15 p.
Lippold, J. C. & Kotecki, D. J. 2005. Welding Metallurgy and Weldability of StainlessSteels. USA: John Wiley and Sons, Inc., Hobocken, N.J., ISBN 0-47147379-0.
Lundin, C. D. 1982. Dissimilar Metal Welds – Transition Joints Literature Review.Welding Journal, 61 (2), pp. 58-63.
McCracken, S. 2014. Weld Mockups for Characterization and CGR Testing. Pre-sented in: EPRI Alloy 690/52/152 Primary Water Stress Corrosion Cracking Re-search Collaboration Meeting, Tampa, California. December 2-4, 2014.
McIllree, A., Demma, A., Peng, J. & King, P. 2006. Effects of Hydrogen and Tem-perature on the Fracture Resistance of Weld Metals 182 and 152 in SimulatedPWR Shutdown Environment. Proceedings of the 6th Fontevraud Conference, 18-22 September 2006, Fontevraud Royal Abby, France (CD-ROM).
Mills, W. J. 1997. Fracture toughness of type 304 and 316 stainless steels andtheir welds. International Materials Reviews, 42 (2), pp. 45-82.
Mills, W. J., Lebo, M. R. & Kearns, J. J. 1999. Hydrogen Embrittlement, GrainBoundary Segregation, and Stress Corrosion Cracking of Alloy X-750 in Low- andHigh-Temperature Water. Metallurgical and Materials Transactions A, 30 A (6), pp.1579-1596.
Mills, W. J. & Brown, C. M. 1999. Fracture Behavior of Nickel-Based Alloys inWater. In: Bruemmer, S., Ford, P. & Was, G. (Eds.). Proceedings of the 9th Inter-national Symposium on Environmental Degradation of Materials in Nuclear PowerSystems – Water Reactors. Newport Beach, California, August 1-5, 1999. USA:TMS, pp. 279-296. ISBN 0-87339-475-5.
128
Mills, W. J. & Brown, C. M. 2001. Fracture Toughness of Alloy 600 and EN82HWeld in Air and Water. Metallurgical and Materials Transactions A, 32A (5), pp.1161-1174.
Mills, W. J., Brown, C. M. & Burke, M. G. 2001. Effect of Microstructure on LowTemperature Cracking Behavior of EN82H Welds. In: Proceedings of the 10th
International Symposium on Environmental Degradation of Materials in NuclearPower Systems - Water Reactors. Lake Tahoe, Nevada, August 5-9, 2001. USA:NACE International (CD-ROM).
Moody, N. R., Robinson, S. L. & Perra, M. W. 1993. Internal Hydrogen Effects ofThresholds for Crack Growth in the Iron-Based Superalloy IN930. EngineeringFracture Mechanics, 39 (6), pp. 941-954.
Morra, M., Othon, M., McCracken, S., Sutton, B. & Ahluwalia, A. 2014. Analysis ofNarrow Groove 52M Welds SA508 to 316L amd SA508 to Alloy 690. Presented in:EPRI Alloy 690/52/152 Primary Water Stress Corrosion Cracking Research Col-laboration Meeting, Tampa, California. December 2-4, 2014.
Mouginot, R. & Hänninen, H. 2013. Microstructures of nickel-base alloy dissimilarmetal welds. Aalto University publication series Science + Technology. Helsinki:Unigrafia Oy. 178 p. ISBN 978-952-60-5065-2.
Nelson, T. W., Lippold, J. C. & Mills, M. J. 1999. Nature and Evolution of the Fu-sion Boundary in Ferritic-Austenitic Dissimilar Metal Weld Metals, Part 1 – Nuclea-tion and Growth. Welding Journal, 78, pp. 329s-337s.
Nibur, K. A., Bahr, D. F. & Somerday, B. P. 2006. Hydrogen Effects on DislocationActivity in Austenitic Stainless Steel. Acta Materialia, 54, pp. 2677-2684.
Nibur, K. A., Somerday, B. P., Balch, D. K. & San Marchi, C. 2009. The Role ofLocalized Deformation in Hydrogen-Assisted Crack Propagation in 21Cr–6Ni–9MnStainless Steel. Acta Materialia, 57, pp. 3795-3809.
Oriani, R. A. 1993. The Physical and Metallurgical Aspects of Hydrogen in Metals.In: Passell, T. O. & McKubreI, M. C. H., ICCF4, Fourth International Conferenceon Cold Fusion. Lahaina, Maui, December 1993. USA: ANS.
Pasupathi, V., Perrin, J., Farmelo, D., Smith, G. & Weiss, S. 1980. Investigation ofInconel safe-end failure in Duane Arnold. Trans. ANS 34, pp. 232-233.
Peckner, D. & Bernstein, I. M. 1977. Handbook of Stainless Steels. USA: McGraw-Hill. 800 p. ISBN 0-07-049147-X.
129
Peng, Q. J., Hou, J., Yonezawa, T., Shoji, T., Zhang, Z.M., Huang, F., Han, E.-H. &Ke, W. 2012. Environmentally Assisted Crack Growth in One-Dimensionally ColdWorked Alloy 690TT in Primary Water. Corrosion Science, 57 (2012), pp. 81-88.
Peng, Q., Yamauchi, H. & Shoji, T. 2003. Dendrite Boundary Microchemistry inAlloy 182 Weld Metal. In: Proceedings of the 11th International Symposium onEnvironmental Degradation of Materials in Nuclear Power Systems - Water Reac-tors, Stevenson, Washington, August 10-14, 2003. USA: ANS (CD-ROM).
Pressoyre, G. M. 1983. Hydrogen Traps, Repellers, and Obstacles in Steel; Con-sequences on Hydrogen Diffusion, Solubility, and Embrittlement. MetallurgicalTransactions A, 14A (10), pp. 2189-2193.
Ramirez, A. J. & Lippold, J. C. 2004a. High Temperature Behavior of Ni-BaseWeld Metal: Part I – Ductility and Microstructural Characterization. Materials Sci-ence and Engineering A, 380, pp. 259-271.
Ramirez, A. J. & Lippold, J. C. 2004b. High Temperature Behavior of Ni-BaseWeld Metal: Part II – Insight into the Mechanism for Ductility-Dip Cracking. Materi-als Science and Engineering A, 380, pp. 245-258.
Rao, G., Moffatt, G. & McIlree, A. 2002. Metallurgical Investigation of Cracking inthe Reactor Vessel Alpha Loop Hot Leg Nozzle to Pipe Weld and the V. C. Sum-mer Station. In: Proceedings of Fontevraud 5, Contribution of Material Investiga-tion to the Resolution of Problems Encountered in Pressurized Water Reactors.Fontevraud, France, September 23-27, 2002. France: SFEN, pp. 29 - 41.
Richards, N. & Chaturvedi, M. 2000. Effect of Minor Elements on Weldability of Ni-Base Superalloys. International Metals Reviews, 45 (3), pp. 109-129.
Sakima, K., Suzuki, H. & Fujiwara, H. Research and Evaluation of Low Tempera-ture Crack Propagation of Ni Base Alloys in Actual Plants. In: Busby, J. T.,Ilevbare, G. & Andresen, P. L. (Eds.). Proceedings of the 15th International Sym-posium on Environmental Degradation of Materials in Nuclear Power Systems –Water Reactors. Colorado Springs, Colorado, August 7-11, 2011. USA: TMS (CD-ROM).
Shah, V. & MacDonald, P. (Eds.). 1993. Aging and Life Extension of Major LightWater Reactor Components. Netherlands: Elsevier, 941 p. ISBN 0-444-89448-9.
Shoji, T., Ito, Y., Lu, Z. & Yonezawa, T. 2007. Mechanistic Understanding of LowTemperature Crack Propagation for Alloy 690 in Hydrogenated Water. In: Pro-ceedings of the 13th International Symposium on Environmental Degradation ofMaterials in Nuclear Power Systems - Water Reactors, Whistler, Canada, April 19-23, 2007. Canada: CNS-SNC (CD-ROM).
130
Skeldon, P. & Hurst, P. 1988. Environmentally Assisted Cracking of Inconel X-750.Proceedings of 3rd International Conference on Environmental Degradation ofMaterials in Nuclear Power Systems – Water Reactors. Traverse City, Michigan,August 30-September 3, 1987. USA: The Metallurgical Society, Inc. pp. 703-710.ISBN 0-87339-030-X.
Sirois, E. & Birnbaum, H. K. 1992. Effects of Hydrogen and Carbon on ThermallyActivated Deformation in Nickel. Acta Metallurgica et Materialia, 40 (6), pp. 1377-1385.
Symons, D. M. & Thompson, A. W. 1997. The Effect of Hydrogen on the FractureToughness of Alloy X-750. Metallurgical and Materials Transactions A, 28A, pp.817-823.
Symons, D. M. 1999. The effect of hydrogen on the fracture toughness of alloy X-750 at elevated temperatures. Journal of Nuclear Materials, 265, pp. 225-231.
Symons, D. M. 2001. A comparison of internal hydrogen embrittlement and hydro-gen environment embrittlement of X-750. Engineering Fracture Mechanics, 68, pp.751-771.
Thomas, L. E., Olzsta, M. J., Johnson, B. R. & Bruemmer, S. M. 2009. Microstruc-tural Characterization of Primary Stress-Corrosion Cracks in Alloy 182 Welds fromPWR Components and Laboratory Tests. In: Proceedings of the 14th InternationalSymposium on Environmental Degradation of Materials in Nuclear Power Systems- Water Reactors. Virginia Beach, Virginia, August 23-27, 2009. USA: ANS (CD-ROM).
Troiano, A. R. 1960. The Role of Hydrogen and Other Interstitials in the Mechani-cal Behavior of Materials. Trans ASM, 52, pp. 54-80.
Wallin, K. 2011. Fracture Toughness of Engineering Materials: Estimation andApplication. UK: EMAS Publishing, 543 p. ISBN 0-9552994-6-2.
Webb, G. L. & Burke M. G. 1995. Stress Corrosion Cracking Behavior of Alloy 600in High Temperature Water. In: Airey, G. et al. (Ed.). Proceedings of the 7th Inter-national Symposium on Environmental Degradation of Materials in Nuclear PowerSystems – Water Reactors. Breckenridge, Colorado, August 7-10, 1995. USA:NACE International, pp. 41-56. ISBN 1-877914-95-9.
Wei, F. G. & Tsuzaki, K. 2006. Quantitative Analysis on Hydrogen Trapping of TiCParticles in Steel. Metallurgical and Materials Transactions A, 37A, pp. 331-353.
131
Welty, C. S. & Blomgren, J. C. 1990. Steam Generator issues. In: Cubicciotti, D.(Ed.). Proceedings of 4th International Conference on Environmental Degradationof Materials in Nuclear Power Systems – Water Reactors. Jekyll Island, Georgia,August 6-10, 1989. USA: NACE. pp. 1.27-1.36. ISBN 1-877914-04-5.
Yonezawa, T., Onimura, K, Sakamoto, N., Sasaguri, N., Nakata, H. & Susukida,H. 1984. Effect of Heat Treatment on Stress Corrosion Cracking Resistance ofHigh Nickel Alloys in High Temperature Water. Proceedings of the InternationalSymposium on Environmental Degradation of Materials in Nuclear Power Systems– Water Reactors. Myrtle Beach, South Carolina, August 22-24, 1983. USA:NACE, pp. 151-178. ISBN 0-915567-00-8.
Yonezawa, T. & Onimura, K. 1989. Effect of Chemical Compositions and Micro-structure on the Stress Corrosion Cracking Resistance of Nickel Base Alloys inHigh Temperature Water. Proceedings of the EVALMAT, Kobe, Japan, 89-1, pp.235-242.
Yonezawa, T., Yamaguchi, Y. & Iijima, Y. 1993. Electron Micro AutoradiographicObservations of Tritium Distribution on Alloy X750. In: Gold, R. E. & Simonen, E.P. (Eds.). Proceedings of 6th International Conference on Environmental Degrada-tion of Materials in Nuclear Power Systems – Water Reactors. San Diego, Califor-nia, August 1-5. USA: TMS. ISBN 0-87339-258-2.
Yonezawa, T. 2008. The Possibility of Metallurgical Effects on LTCP of Alloy 690and its Weld Metal in Hydrogenated Water. Presented in: EPRI MRP Expert PanelMeeting on Low Temperature Crack Propagation, Los Angeles, California. No-vember 14, 2008.
Yonezawa, T. 2012. Nickel Alloys: Properties and Characteristics. In: Konings, R.J. M. (Ed.). Comprehensive Nuclear Materials. Germany: Elsevier Science, 600 p.ISBN 9780080560335.
Yonezawa, T. 2013. The Effects of Fabrication Process and Cold Working onPWSCCGR of TT Alloy 690 in Simulated PWR Primary Water. Presented in: EPRIAlloy 690/52/152 Primary Water Stress Corrosion Cracking Research Collabora-tion Meeting, Tampa, Florida. December 3-6, 2013.
Yonezawa, T. 2014. Stress Corrosion Cracking Growth Rate of TT Alloy 690 andIts Weld Joint in Simulated PWR Primary Water. Presented in: EPRI Alloy690/52/152 Primary Water Stress Corrosion Cracking Research CollaborationMeeting, Tampa, Florida. December 2-5, 2014.
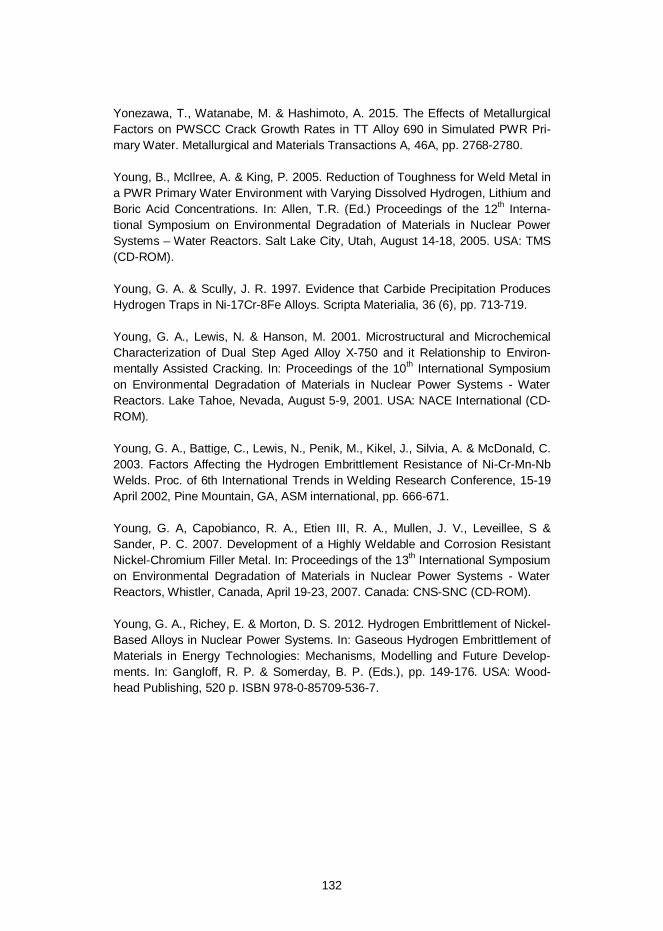
132
Yonezawa, T., Watanabe, M. & Hashimoto, A. 2015. The Effects of MetallurgicalFactors on PWSCC Crack Growth Rates in TT Alloy 690 in Simulated PWR Pri-mary Water. Metallurgical and Materials Transactions A, 46A, pp. 2768-2780.
Young, B., McIlree, A. & King, P. 2005. Reduction of Toughness for Weld Metal ina PWR Primary Water Environment with Varying Dissolved Hydrogen, Lithium andBoric Acid Concentrations. In: Allen, T.R. (Ed.) Proceedings of the 12th Interna-tional Symposium on Environmental Degradation of Materials in Nuclear PowerSystems – Water Reactors. Salt Lake City, Utah, August 14-18, 2005. USA: TMS(CD-ROM).
Young, G. A. & Scully, J. R. 1997. Evidence that Carbide Precipitation ProducesHydrogen Traps in Ni-17Cr-8Fe Alloys. Scripta Materialia, 36 (6), pp. 713-719.
Young, G. A., Lewis, N. & Hanson, M. 2001. Microstructural and MicrochemicalCharacterization of Dual Step Aged Alloy X-750 and it Relationship to Environ-mentally Assisted Cracking. In: Proceedings of the 10th International Symposiumon Environmental Degradation of Materials in Nuclear Power Systems - WaterReactors. Lake Tahoe, Nevada, August 5-9, 2001. USA: NACE International (CD-ROM).
Young, G. A., Battige, C., Lewis, N., Penik, M., Kikel, J., Silvia, A. & McDonald, C.2003. Factors Affecting the Hydrogen Embrittlement Resistance of Ni-Cr-Mn-NbWelds. Proc. of 6th International Trends in Welding Research Conference, 15-19April 2002, Pine Mountain, GA, ASM international, pp. 666-671.
Young, G. A, Capobianco, R. A., Etien III, R. A., Mullen, J. V., Leveillee, S &Sander, P. C. 2007. Development of a Highly Weldable and Corrosion ResistantNickel-Chromium Filler Metal. In: Proceedings of the 13th International Symposiumon Environmental Degradation of Materials in Nuclear Power Systems - WaterReactors, Whistler, Canada, April 19-23, 2007. Canada: CNS-SNC (CD-ROM).
Young, G. A., Richey, E. & Morton, D. S. 2012. Hydrogen Embrittlement of Nickel-Based Alloys in Nuclear Power Systems. In: Gaseous Hydrogen Embrittlement ofMaterials in Energy Technologies: Mechanisms, Modelling and Future Develop-ments. In: Gangloff, R. P. & Somerday, B. P. (Eds.), pp. 149-176. USA: Wood-head Publishing, 520 p. ISBN 978-0-85709-536-7.
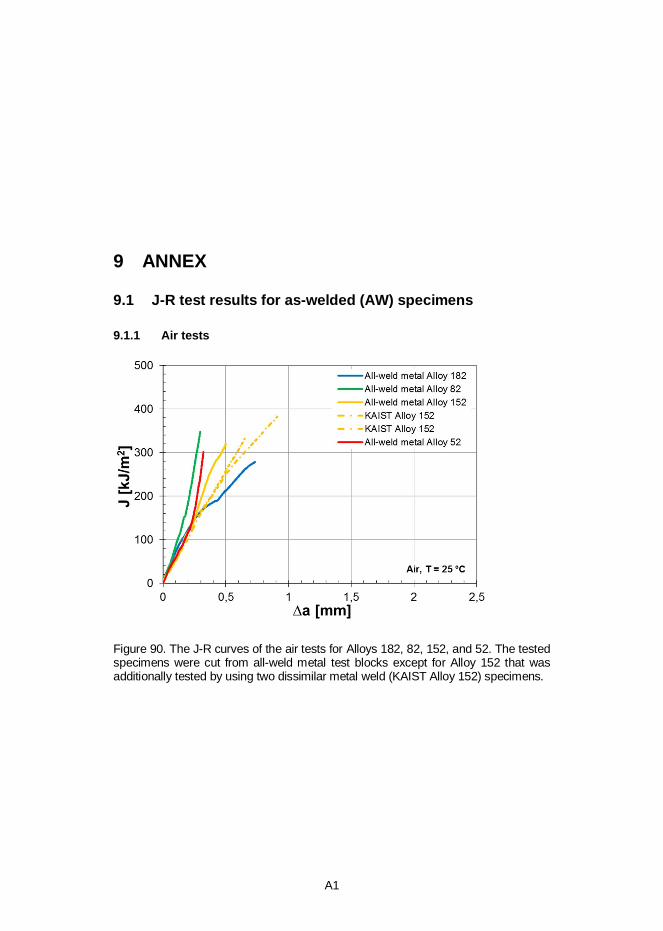
A1
9 ANNEX
9.1 J-R test results for as-welded (AW) specimens
9.1.1 Air tests
Figure 90. The J-R curves of the air tests for Alloys 182, 82, 152, and 52. The testedspecimens were cut from all-weld metal test blocks except for Alloy 152 that wasadditionally tested by using two dissimilar metal weld (KAIST Alloy 152) specimens.
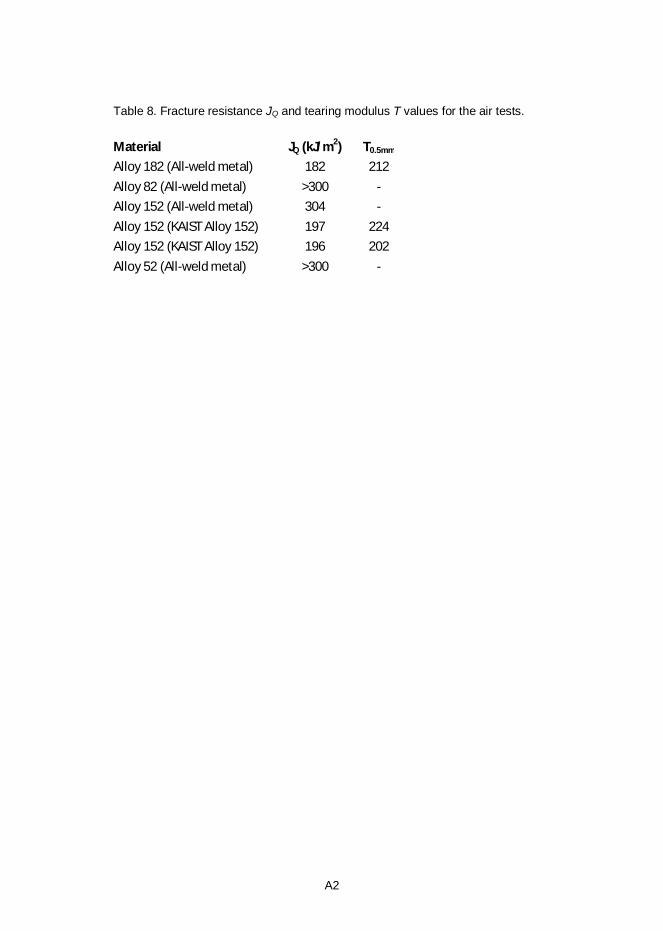
A2
Table 8. Fracture resistance JQ and tearing modulus T values for the air tests.
Material JQ (kJ/m2) T0.5mm
Alloy 182 (All-weld metal) 182 212Alloy 82 (All-weld metal) >300 -Alloy 152 (All-weld metal) 304 -Alloy 152 (KAIST Alloy 152) 197 224Alloy 152 (KAIST Alloy 152) 196 202Alloy 52 (All-weld metal) >300 -
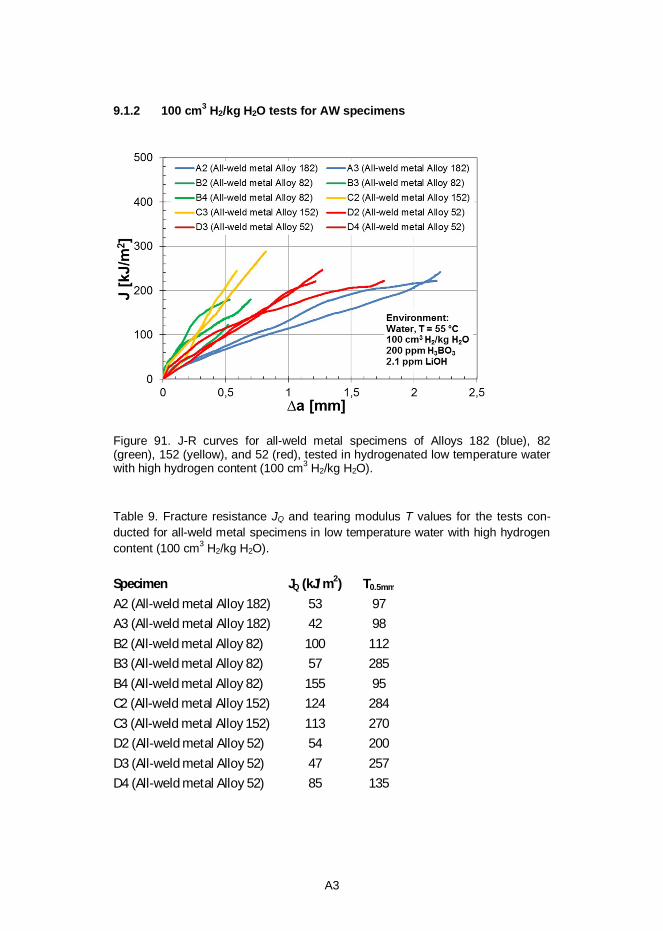
A3
9.1.2 100 cm3 H2/kg H2O tests for AW specimens
Figure 91. J-R curves for all-weld metal specimens of Alloys 182 (blue), 82(green), 152 (yellow), and 52 (red), tested in hydrogenated low temperature waterwith high hydrogen content (100 cm3 H2/kg H2O).
Table 9. Fracture resistance JQ and tearing modulus T values for the tests con-ducted for all-weld metal specimens in low temperature water with high hydrogencontent (100 cm3 H2/kg H2O).
Specimen JQ (kJ/m2) T0.5mm
A2 (All-weld metal Alloy 182) 53 97A3 (All-weld metal Alloy 182) 42 98B2 (All-weld metal Alloy 82) 100 112B3 (All-weld metal Alloy 82) 57 285B4 (All-weld metal Alloy 82) 155 95C2 (All-weld metal Alloy 152) 124 284C3 (All-weld metal Alloy 152) 113 270D2 (All-weld metal Alloy 52) 54 200D3 (All-weld metal Alloy 52) 47 257D4 (All-weld metal Alloy 52) 85 135
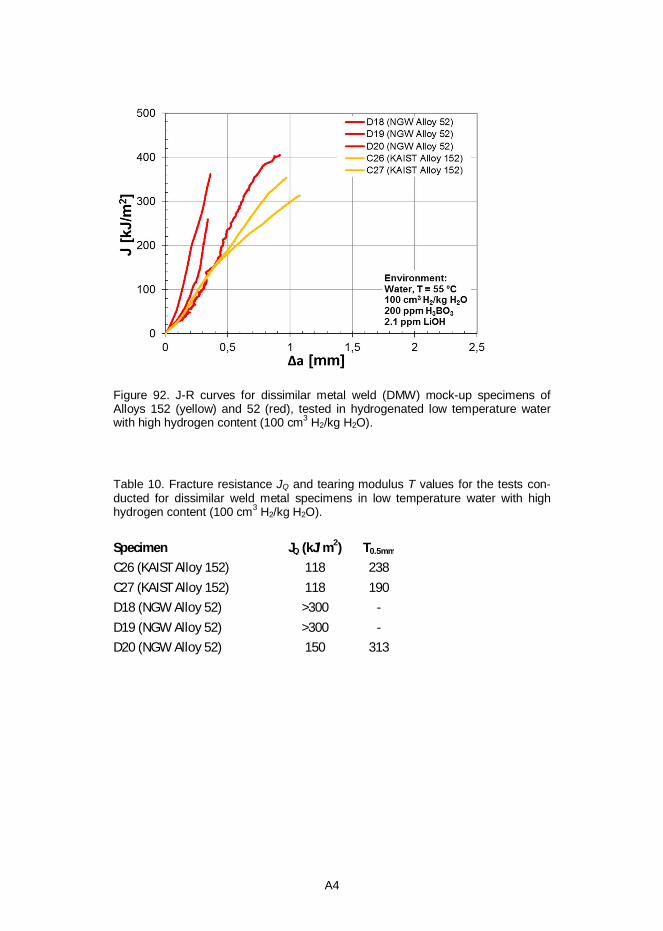
A4
Figure 92. J-R curves for dissimilar metal weld (DMW) mock-up specimens ofAlloys 152 (yellow) and 52 (red), tested in hydrogenated low temperature waterwith high hydrogen content (100 cm3 H2/kg H2O).
Table 10. Fracture resistance JQ and tearing modulus T values for the tests con-ducted for dissimilar weld metal specimens in low temperature water with highhydrogen content (100 cm3 H2/kg H2O).
Specimen JQ (kJ/m2) T0.5mm
C26 (KAIST Alloy 152) 118 238C27 (KAIST Alloy 152) 118 190D18 (NGW Alloy 52) >300 -D19 (NGW Alloy 52) >300 -D20 (NGW Alloy 52) 150 313
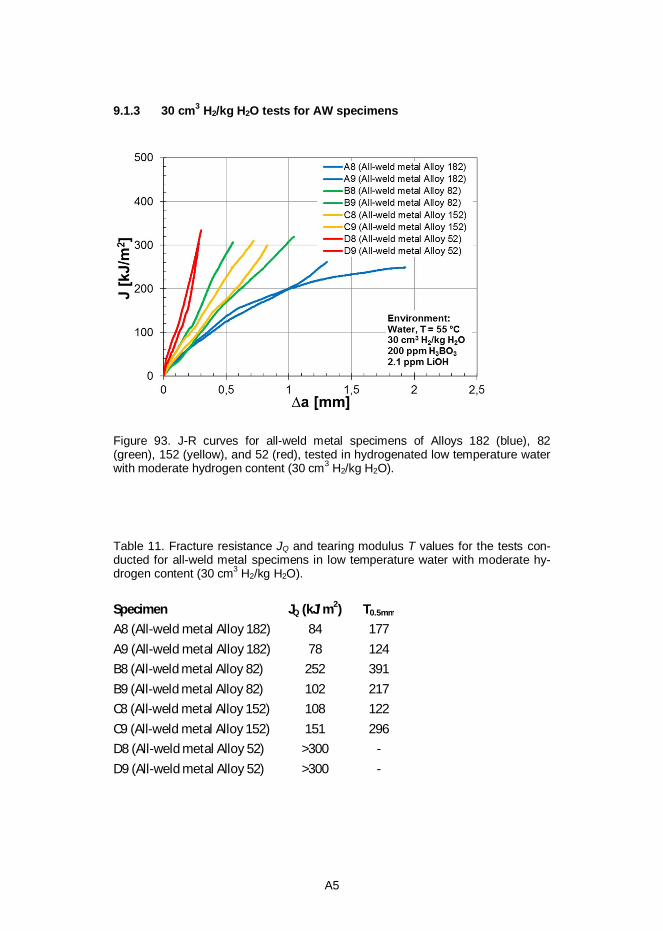
A5
9.1.3 30 cm3 H2/kg H2O tests for AW specimens
Figure 93. J-R curves for all-weld metal specimens of Alloys 182 (blue), 82(green), 152 (yellow), and 52 (red), tested in hydrogenated low temperature waterwith moderate hydrogen content (30 cm3 H2/kg H2O).
Table 11. Fracture resistance JQ and tearing modulus T values for the tests con-ducted for all-weld metal specimens in low temperature water with moderate hy-drogen content (30 cm3 H2/kg H2O).
Specimen JQ (kJ/m2) T0.5mm
A8 (All-weld metal Alloy 182) 84 177A9 (All-weld metal Alloy 182) 78 124B8 (All-weld metal Alloy 82) 252 391B9 (All-weld metal Alloy 82) 102 217C8 (All-weld metal Alloy 152) 108 122C9 (All-weld metal Alloy 152) 151 296D8 (All-weld metal Alloy 52) >300 -D9 (All-weld metal Alloy 52) >300 -
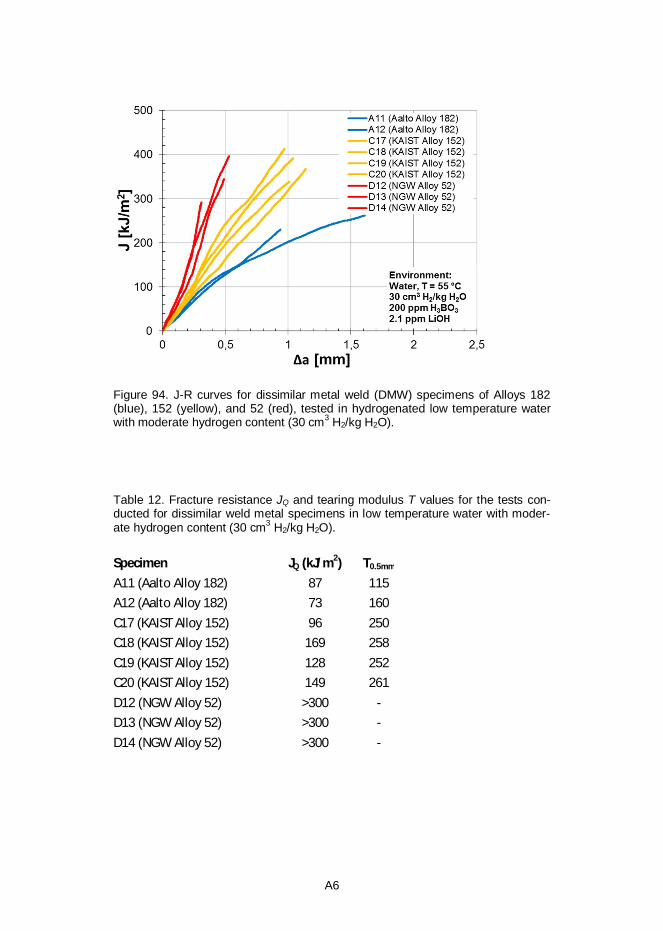
A6
Figure 94. J-R curves for dissimilar metal weld (DMW) specimens of Alloys 182(blue), 152 (yellow), and 52 (red), tested in hydrogenated low temperature waterwith moderate hydrogen content (30 cm3 H2/kg H2O).
Table 12. Fracture resistance JQ and tearing modulus T values for the tests con-ducted for dissimilar weld metal specimens in low temperature water with moder-ate hydrogen content (30 cm3 H2/kg H2O).
Specimen JQ (kJ/m2) T0.5mm
A11 (Aalto Alloy 182) 87 115A12 (Aalto Alloy 182) 73 160C17 (KAIST Alloy 152) 96 250C18 (KAIST Alloy 152) 169 258C19 (KAIST Alloy 152) 128 252C20 (KAIST Alloy 152) 149 261D12 (NGW Alloy 52) >300 -D13 (NGW Alloy 52) >300 -D14 (NGW Alloy 52) >300 -
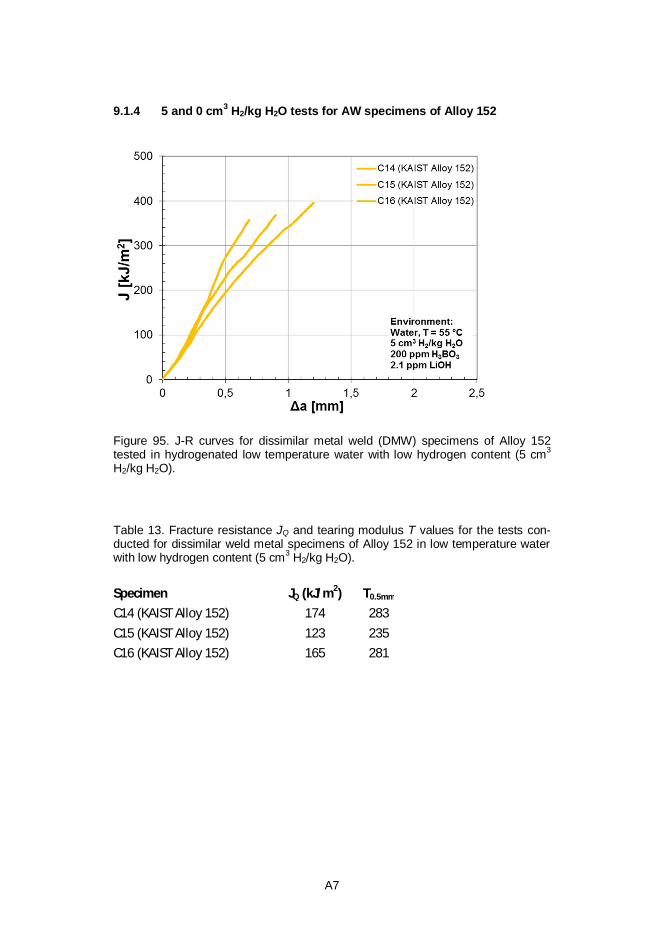
A7
9.1.4 5 and 0 cm3 H2/kg H2O tests for AW specimens of Alloy 152
Figure 95. J-R curves for dissimilar metal weld (DMW) specimens of Alloy 152tested in hydrogenated low temperature water with low hydrogen content (5 cm3
H2/kg H2O).
Table 13. Fracture resistance JQ and tearing modulus T values for the tests con-ducted for dissimilar weld metal specimens of Alloy 152 in low temperature waterwith low hydrogen content (5 cm3 H2/kg H2O).
Specimen JQ (kJ/m2) T0.5mm
C14 (KAIST Alloy 152) 174 283C15 (KAIST Alloy 152) 123 235C16 (KAIST Alloy 152) 165 281
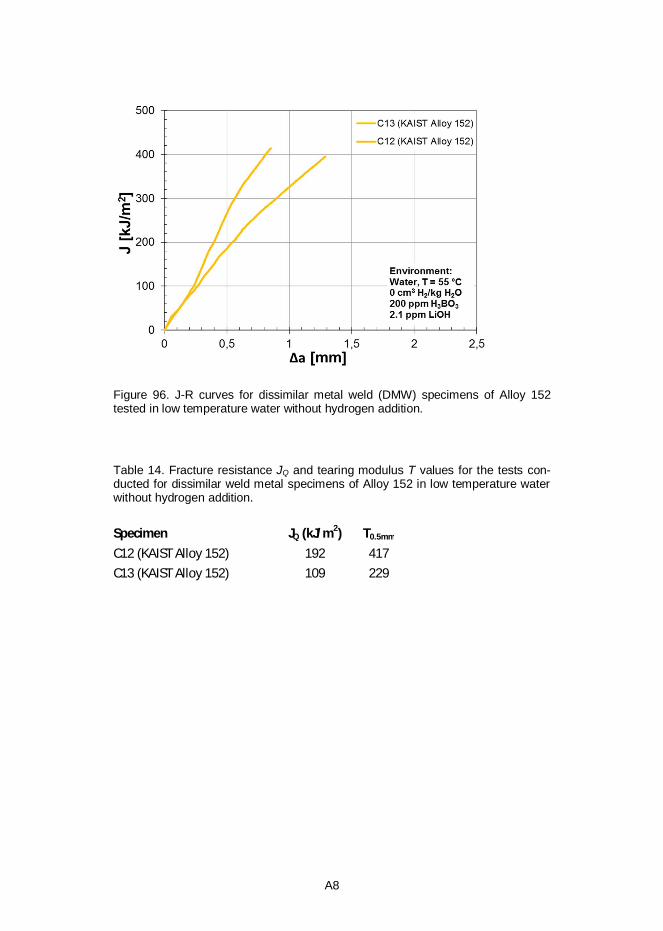
A8
Figure 96. J-R curves for dissimilar metal weld (DMW) specimens of Alloy 152tested in low temperature water without hydrogen addition.
Table 14. Fracture resistance JQ and tearing modulus T values for the tests con-ducted for dissimilar weld metal specimens of Alloy 152 in low temperature waterwithout hydrogen addition.
Specimen JQ (kJ/m2) T0.5mm
C12 (KAIST Alloy 152) 192 417C13 (KAIST Alloy 152) 109 229
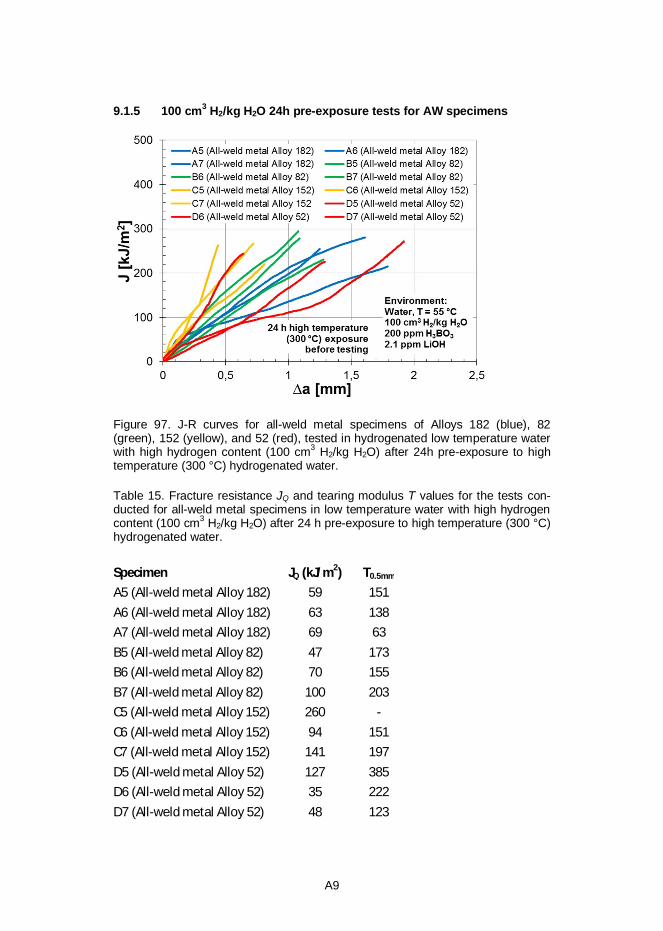
A9
9.1.5 100 cm3 H2/kg H2O 24h pre-exposure tests for AW specimens
Figure 97. J-R curves for all-weld metal specimens of Alloys 182 (blue), 82(green), 152 (yellow), and 52 (red), tested in hydrogenated low temperature waterwith high hydrogen content (100 cm3 H2/kg H2O) after 24h pre-exposure to hightemperature (300 °C) hydrogenated water.
Table 15. Fracture resistance JQ and tearing modulus T values for the tests con-ducted for all-weld metal specimens in low temperature water with high hydrogencontent (100 cm3 H2/kg H2O) after 24 h pre-exposure to high temperature (300 °C)hydrogenated water.
Specimen JQ (kJ/m2) T0.5mm
A5 (All-weld metal Alloy 182) 59 151A6 (All-weld metal Alloy 182) 63 138A7 (All-weld metal Alloy 182) 69 63B5 (All-weld metal Alloy 82) 47 173B6 (All-weld metal Alloy 82) 70 155B7 (All-weld metal Alloy 82) 100 203C5 (All-weld metal Alloy 152) 260 -C6 (All-weld metal Alloy 152) 94 151C7 (All-weld metal Alloy 152) 141 197D5 (All-weld metal Alloy 52) 127 385D6 (All-weld metal Alloy 52) 35 222D7 (All-weld metal Alloy 52) 48 123
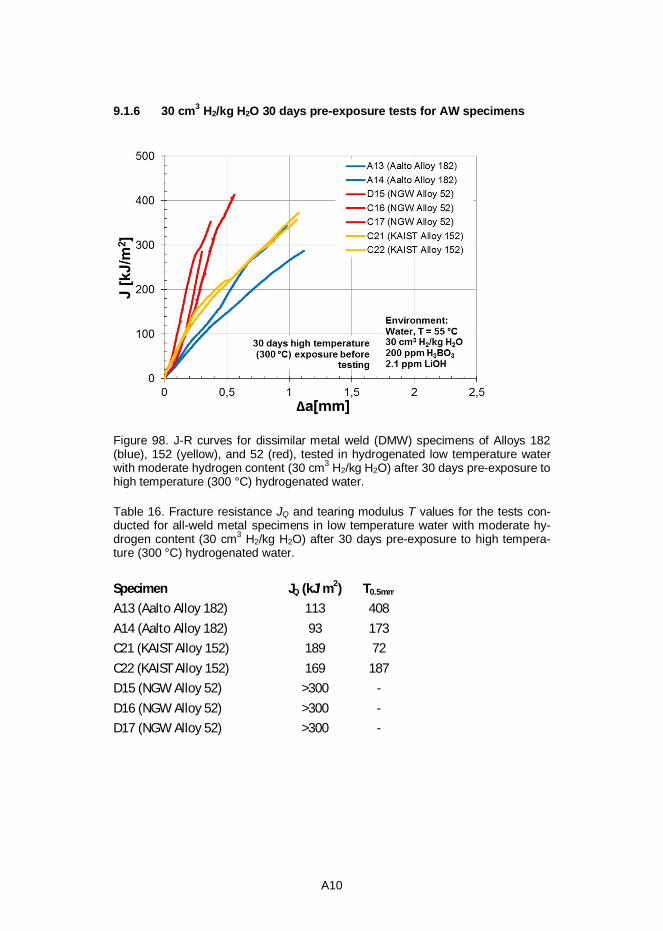
A10
9.1.6 30 cm3 H2/kg H2O 30 days pre-exposure tests for AW specimens
Figure 98. J-R curves for dissimilar metal weld (DMW) specimens of Alloys 182(blue), 152 (yellow), and 52 (red), tested in hydrogenated low temperature waterwith moderate hydrogen content (30 cm3 H2/kg H2O) after 30 days pre-exposure tohigh temperature (300 °C) hydrogenated water.
Table 16. Fracture resistance JQ and tearing modulus T values for the tests con-ducted for all-weld metal specimens in low temperature water with moderate hy-drogen content (30 cm3 H2/kg H2O) after 30 days pre-exposure to high tempera-ture (300 °C) hydrogenated water.
Specimen JQ (kJ/m2) T0.5mm
A13 (Aalto Alloy 182) 113 408A14 (Aalto Alloy 182) 93 173C21 (KAIST Alloy 152) 189 72C22 (KAIST Alloy 152) 169 187D15 (NGW Alloy 52) >300 -D16 (NGW Alloy 52) >300 -D17 (NGW Alloy 52) >300 -
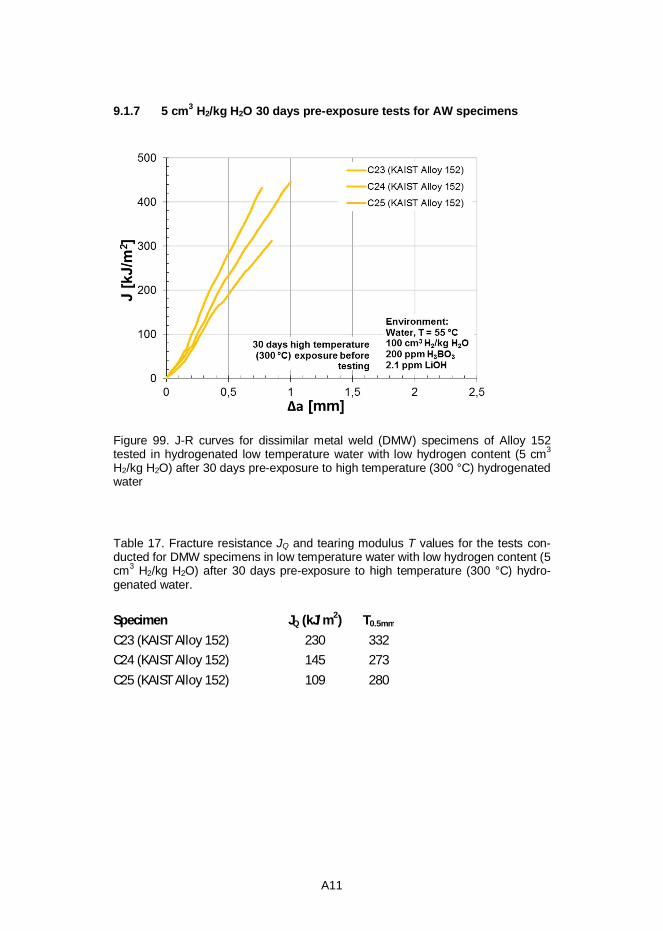
A11
9.1.7 5 cm3 H2/kg H2O 30 days pre-exposure tests for AW specimens
Figure 99. J-R curves for dissimilar metal weld (DMW) specimens of Alloy 152tested in hydrogenated low temperature water with low hydrogen content (5 cm3
H2/kg H2O) after 30 days pre-exposure to high temperature (300 °C) hydrogenatedwater
Table 17. Fracture resistance JQ and tearing modulus T values for the tests con-ducted for DMW specimens in low temperature water with low hydrogen content (5cm3 H2/kg H2O) after 30 days pre-exposure to high temperature (300 °C) hydro-genated water.
Specimen JQ (kJ/m2) T0.5mm
C23 (KAIST Alloy 152) 230 332C24 (KAIST Alloy 152) 145 273C25 (KAIST Alloy 152) 109 280
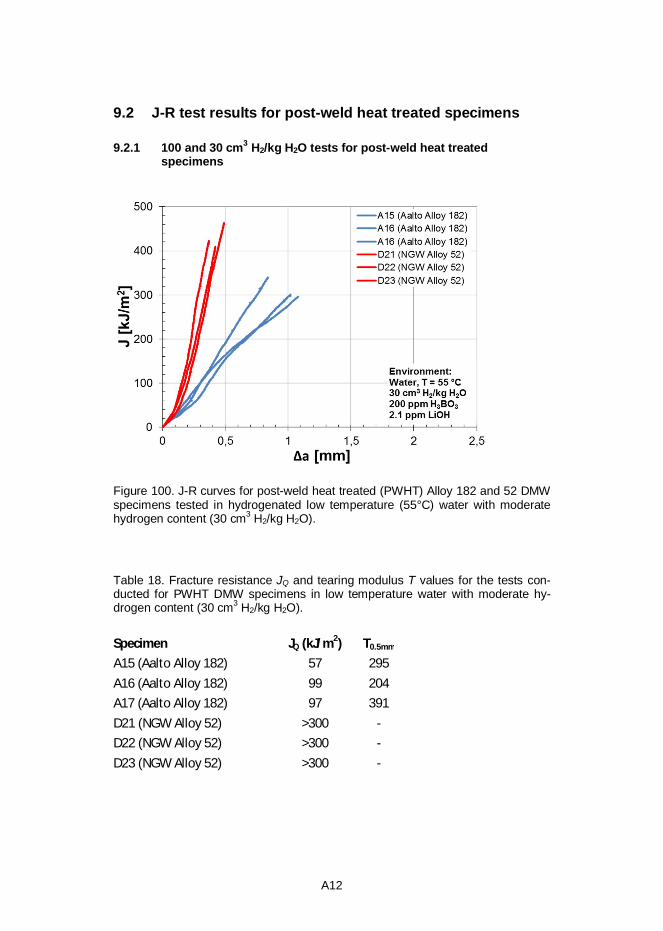
A12
9.2 J-R test results for post-weld heat treated specimens
9.2.1 100 and 30 cm3 H2/kg H2O tests for post-weld heat treatedspecimens
Figure 100. J-R curves for post-weld heat treated (PWHT) Alloy 182 and 52 DMWspecimens tested in hydrogenated low temperature (55°C) water with moderatehydrogen content (30 cm3 H2/kg H2O).
Table 18. Fracture resistance JQ and tearing modulus T values for the tests con-ducted for PWHT DMW specimens in low temperature water with moderate hy-drogen content (30 cm3 H2/kg H2O).
Specimen JQ (kJ/m2) T0.5mm
A15 (Aalto Alloy 182) 57 295A16 (Aalto Alloy 182) 99 204A17 (Aalto Alloy 182) 97 391D21 (NGW Alloy 52) >300 -D22 (NGW Alloy 52) >300 -D23 (NGW Alloy 52) >300 -
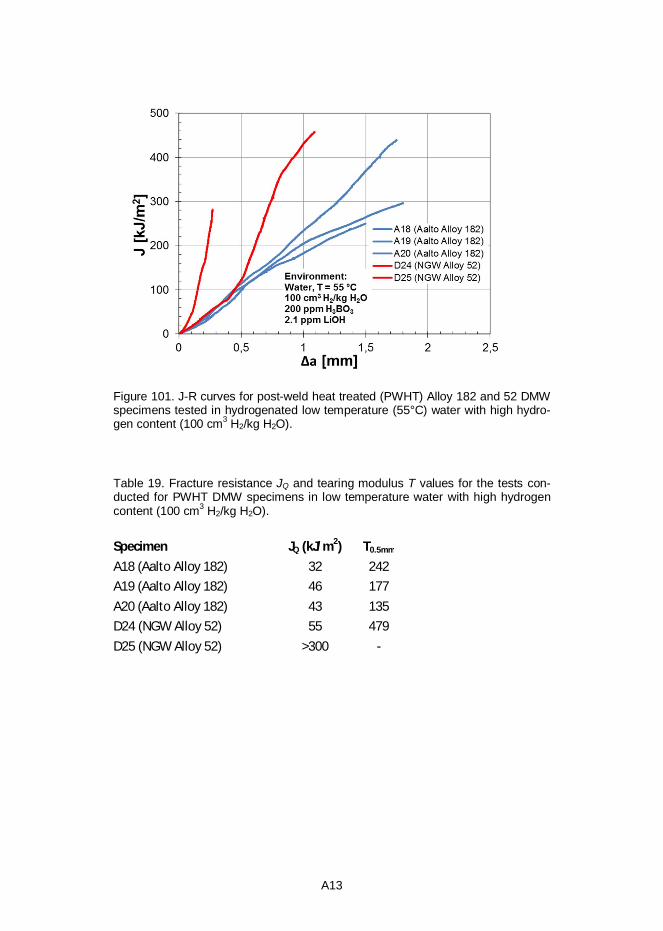
A13
Figure 101. J-R curves for post-weld heat treated (PWHT) Alloy 182 and 52 DMWspecimens tested in hydrogenated low temperature (55°C) water with high hydro-gen content (100 cm3 H2/kg H2O).
Table 19. Fracture resistance JQ and tearing modulus T values for the tests con-ducted for PWHT DMW specimens in low temperature water with high hydrogencontent (100 cm3 H2/kg H2O).
Specimen JQ (kJ/m2) T0.5mm
A18 (Aalto Alloy 182) 32 242A19 (Aalto Alloy 182) 46 177A20 (Aalto Alloy 182) 43 135D24 (NGW Alloy 52) 55 479D25 (NGW Alloy 52) >300 -
Series title and number
VTT Science 105
Title Effect of microstructure on low temperature hydrogen-induced cracking behaviour of nickel-based alloy weld metals
Author(s) Matias Ahonen
Abstract Various nickel-based materials are susceptible to low temperature crack propagation (LTCP) in simulated PWR (pressurized water reactor) water at a temperature range of about 50 to 150 °C. Experimental evidence from various sources shows that the hydrogen content of the water has a decreasing effect on the fracture resistance, thus LTCP is widely regarded as a hydrogen-induced phenomenon. This thesis concentrates on the LTCP phenomenon of Alloy 182, 82, 152 and 52 weld metals. The studied materials were both all-weld metals and dissimilar metal weld (DMW) mock-ups. The material conditions studied in this work were as-welded (AW), post-weld heat treated (PWHT) and high temperature water pre-exposed. The experimental work was divided in fracture mechanical testing in an environment, microstructural examination of fracture surfaces and hydrogen thermal desorption measurements. The obtained J-R test results show that Alloy 182 is the most susceptible nickel-based weld metal to LTCP, whereas Alloy 52 retains its high fracture resistance in hydrogenated water with moderate hydrogen content. The results obtained for all-weld metal Alloy 52 showed, however, a clear reduction of fracture resistance when tested at a high hydrogen content (100 cm3 H2/kg H2O), whereas narrow gap mock-up Alloy 52 DMW appeared to be less susceptible to LTCP in the corresponding environment. Hydrogen concentrations of Alloy 182 and 152 weld metal samples decrease during the high temperature water exposure, even when exposed to water containing 30 cm3 H2/kg H2O, and the fracture resistance values of Alloys 182 and 152 are improved. A clear relation between the low fracture resistance values and intergranular/interdendritic type of fracture was observed. The effect of grain boundary carbides and their hydrogen trapping properties are discussed based on the obtained SEM/EDS and thermal desorption spectroscopy results and a model was applied in order to determine the activation energies for hydrogen desorption of Alloys 182 and 52. The different LTCP behaviour of Alloy 182 and 52 weld metals is believed to be caused mainly by different types of carbides dominating the hydrogen-induced fracture. The carbides may have an effect on hydrogen distribution at the grain/dendrite boundaries and the availability of hydrogen close to the crack tip, by acting as trapping sites for hydrogen and by affecting the strain distribution at the grain boundary area.
ISBN, ISSN ISBN 978-951-38-8338-6 (Soft back ed.) ISBN 978-951-38-8339-3 (URL: http://www.vttresearch.com/impact/publications) ISSN-L 2242-119X ISSN 2242-119X (Print) ISSN 2242-1203 (Online)
Date August 2015
Language English, Finnish abstract
Pages 132 p. + app. 13 p.
Name of the project Environmental influence on cracking susceptibility and ageing of nuclear materials (ENVIS)
Commissioned by
Keywords Nickel-based weld metals, low temperature crack propagation, hydrogen trapping, fracture resistance
Publisher VTT Technical Research Centre of Finland Ltd P.O. Box 1000, FI-02044 VTT, Finland, Tel. 020 722 111
Julkaisun sarja ja numero
VTT Science 105
Nimeke Mikrorakenteen vaikutus nikkeliseoshitsien vedyn aiheuttamaan murtumiseen matalissa lämpötiloissa
Tekijä(t) Matias Ahonen
Tiivistelmä Useiden nikkeliseoshitsien on todettu olevan alttiita matalan lämpötilan särönkasvulle (eng., low temperature crack propagation, LTCP) simuloidussa painevesireaktoriympäristössä lämpötilavälillä 50-150 °C. Eri lähteissä esitetty kokeellinen tulosaineisto osoittaa, että vetypitoisuuden kasvaessa kyseisten materiaalien murtumisvastus alenee, joten LTCP:n uskotaan yleisesti olevan vedyn aiheuttama ilmiö. Tässä väitöstyössä keskitytään LTCP -ilmiöön nikkelivaltaisissa Alloy 182, 82, 152 ja 52 hitsiaineissa. Tutkittavat materiaalit koostuvat sekä puhtaista hitsiaineista sekä Alloy 182, 152 ja 52 hitsiaineiden tapauksessa myös eriparihitseistä. Näytteitä tutkittiin hitsauksen jälkeen, jälkilämpökäsiteltynä sekä korkealämpötilavedessä suoritetun altistuksen jälkeen. Työn kokeellinen osa jakautui murtumismekaaniseen testaukseen ympäristössä, murtopintojen ja poikkileikkausten mikroskopiatutkimuksiin sekä vedyn desorptiomittauksiin. J-R -kokeiden tulokset osoittavat Alloy 182 hitsiaineen olevan LTCP -herkin nikkelivaltainen hitsiaine, kun taas Alloy 52 säilyttää korkean murtumisvastuksen vetypitoisuudella 30 cm3 H2/kg H2O. Kuitenkin myös puhtaan Alloy 52 hitsiaineen murtumisvastuksessa havaittiin selkeä aleneminen korkealla vetypitoisuudella (100 cm3 H2/kg H2O). Toisaalta Alloy 52 kapearailohitsi säilytti useimpien koesauvojen tapauksessa korkean murtumisvastuksen vastaavassa runsasvetyisessä ympäristössä. Vetypitoisuusmittaukset osoittavat, että altistus korkealämpötilavedessä alentaa Alloy 182 ja 152 hitsiaineiden kokonaisvetypitoisuuksia veden vetypitoisuuden ollessa 30 cm3 H2/kg H2O. Kyseisten materiaalien murtumissitkeysarvot nousevat korkealämpötilavesialtistuksen myötä. Matalampien murtumissitkeysarvojen ja rae- tai dendriiittirajamurtuman välillä todettiin selvä yhteys. Raerajakarbidien toimimista vetyloukkuina arvioitiin saatujen mikroskopiatulosten pohjalta. Lisäksi työssä sovellettiin mallia vedyn desorption aktivaatioenergioiden määrittämiseksi Alloy 182 ja 52 hitsiaineissa. Kyseisten materiaalien erilaisen LTCP -käyttäytymisen uskotaan johtuvan pääasiassa niissä esiintyvistä erityyppisistä raerajakarbideista, jotka ovat keskeisessä asemassa vedyn aiheuttamassa murtumisessa. Erilaisilla karbideilla voi myös olla erilainen vaikutus vedyn jakautumiseen rae- tai dendriittirajoilla sekä vedyn saatavuuteen särön kärjen läheisyydessä, koska karbidit toimivat vetyloukkuina ja vaikuttavat raerajojen ja niiden lähialueiden deformaatiojakaumaan.
ISBN, ISSN ISBN 978-951-38-8338-6 (nid.) ISBN 978-951-38-8339-3 (URL: http://www.vtt.fi/julkaisut) ISSN-L 2242-119X ISSN 2242-119X (Painettu) ISSN 2242-1203 (Verkkojulkaisu)
Julkaisuaika Elokuu 2015
Kieli Englanti, suomenkielinen tiivistelmä
Sivumäärä 132 s. + liitt. 13 s.
Projektin nimi Ympäristön vaikutus ydinvoimalaitosmateriaalien murtumiseen ja vanhenemiseen (ENVIS)
Rahoittajat
Avainsanat Nikkeliseoshitsit, matalan lämpötilan särönkasvu, vedyn loukkuuntuminen, murtumisvastus
Julkaisija Teknologian tutkimuskeskus VTT Oy PL 1000, 02044 VTT, puh. 020 722 111
Effect of microstructure on low temperature hydrogen-induced cracking behaviour of nickel-based alloy weld metals Various nickel-based materials are susceptible to low temperature crack propagation (LTCP) in simulated PWR (pressurized water reactor) water at a temperature range of about 50 to 150 °C. Although no LTCP related incidents have been reported in open literature thus far, the understanding of the possible material degradation phenomena is of great importance in order to ensure safe operation of nuclear power plants. The experimental part of this work was focused on LTCP susceptibility of nickel-based Alloy 182, 82, 152 and 52 weld metals. Both all-weld metals and dissimilar metal weld (DMW) mock-ups were studied. The obtained J-R test results show that Alloy 182 is the most susceptible nickel-based weld metal to LTCP, whereas Alloy 52 retains its high fracture resistance in hydrogenated water with moderate hydrogen content. However, some specimens of Alloy 52 showed a dramatic reduction of fracture resistance with high dissolved hydrogen content. A clear relation between the low fracture resistance values and intergranular/interdendritic type of fracture was observed. The different LTCP behaviour of Alloy 182 and 52 weld metals is believed to be caused mainly by different types of carbides dominating the hydrogen-induced fracture. The carbides may have an effect on hydrogen distribution at the grain/dendrite boundaries and the availability of hydrogen close to the crack tip, by acting as trapping sites for hydrogen and by affecting the strain distribution at the grain boundary area.
ISBN 978-951-38-8338-6 (Soft back ed.) ISBN 978-951-38-8339-3 (URL: http://www.vttresearch.com/impact/publications) ISSN-L 2242-119X ISSN 2242-119X (Print) ISSN 2242-1203 (Online)
VT
T S
CIE
NC
E 1
05
Effe
ct o
f mic
rostru
ctu
re o
n lo
w te
mp
era
ture
...
•VIS
ION
S•SCIENCE•TEC
HN
OL
OG
Y•RESEARCHHIGHLI
GH
TS
Dissertation
105
Effect of microstructure on low temperature hydrogen-induced cracking behaviour of nickel-based alloy weld metals Matias Ahonen