CHAPTER - VI - Shodhganga : a reservoir of Indian theses...
44
CHAPTER - VI AN ASSESSMENT OF IMPACT OF I.T.D.A, PADERU The policies, programmes and schemes intended for the socio-economic empowerment of the tribals which are being implemented by the ITDA in Paderu in Paderu Agency Area are analyzed in detail in the previous chapter. In this chapter, the performance of ITDA, Paderu in the implementation those programmes and their impact on the socio-economic life standards of the tribals are assessed. Further knowledge levels of the tribals on the programmes, their utilization and their perceptions are clearly discussed in this chapter Education: Education is one of the social factors that determine the socioeconomic and cultural standards of the people. So, the governments, in view of improving the socio-economic, cultural and living standards of the Tribals have implemented various educational schemes and programmes to provide education to the tribals. In this regard, the researcher has made an effort to assess the performance of ITDA in providing education to the tribals. 241
Transcript of CHAPTER - VI - Shodhganga : a reservoir of Indian theses...

CHAPTER - VI
AN ASSESSMENT OF IMPACT OF I.T.D.A, PADERU
The policies, programmes and schemes intended for the
socio-economic empowerment of the tribals which are being
implemented by the ITDA in Paderu in Paderu Agency Area are
analyzed in detail in the previous chapter. In this chapter, the
performance of ITDA, Paderu in the implementation those programmes
and their impact on the socio-economic life standards of the tribals are
assessed. Further knowledge levels of the tribals on the programmes,
their utilization and their perceptions are clearly discussed in this
chapter
Education:
Education is one of the social factors that determine the
socioeconomic and cultural standards of the people. So, the governments,
in view of improving the socio-economic, cultural and living standards of
the Tribals have implemented various educational schemes and
programmes to provide education to the tribals. In this regard, the
researcher has made an effort to assess the performance of ITDA in
providing education to the tribals.
241
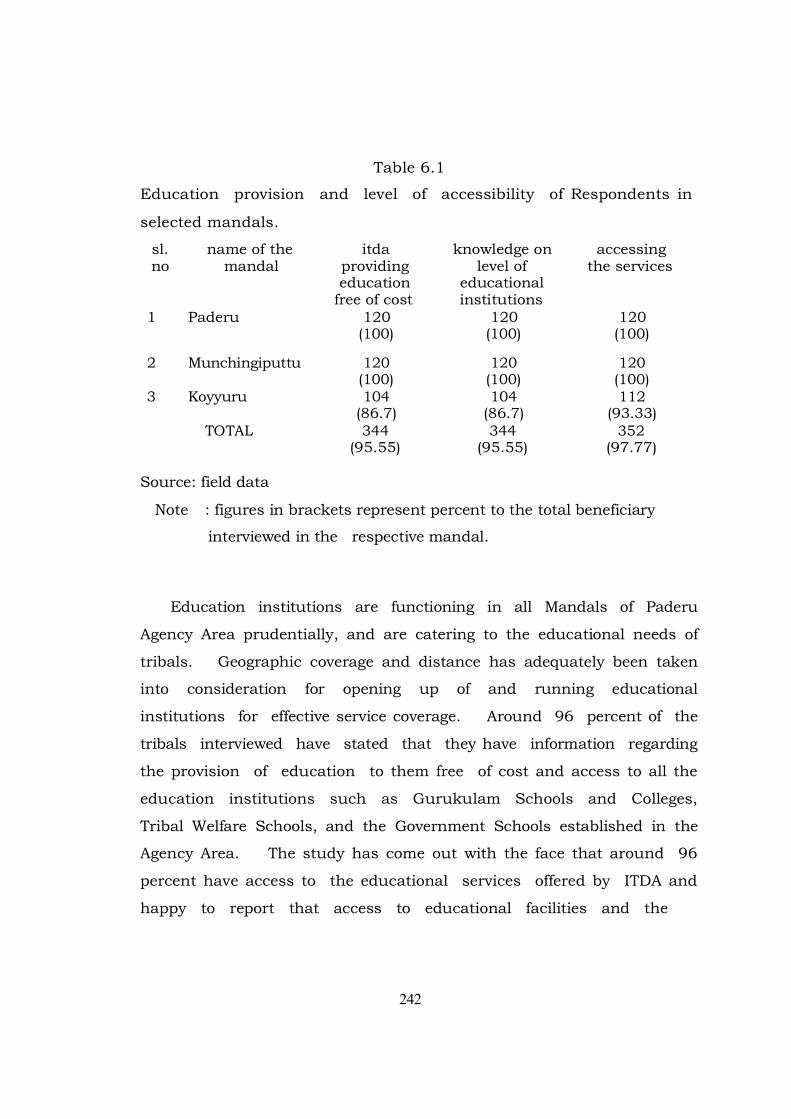
Table 6.1
Education provision and level of accessibility of Respondents in
selected mandals.
sl. name of the itda knowledge on accessing no mandal providing level of the services
education educational free of cost institutions
1 Paderu 120 120 120 (100) (100) (100)
2 Munchingiputtu 120 120 120 (100) (100) (100)
3 Koyyuru 104 104 112 (86.7) (86.7) (93.33)
TOTAL 344 344 352 (95.55) (95.55) (97.77)
Source: field data
Note : figures in brackets represent percent to the total beneficiary
interviewed in the respective mandal.
Education institutions are functioning in all Mandals of Paderu
Agency Area prudentially, and are catering to the educational needs of
tribals. Geographic coverage and distance has adequately been taken
into consideration for opening up of and running educational
institutions for effective service coverage. Around 96 percent of the
tribals interviewed have stated that they have information regarding
the provision of education to them free of cost and access to all the
education institutions such as Gurukulam Schools and Colleges,
Tribal Welfare Schools, and the Government Schools established in the
Agency Area. The study has come out with the face that around 96
percent have access to the educational services offered by ITDA and
happy to report that access to educational facilities and the
242
scholarships is quite comfortable and beneficial for continuing and
pursing desired level of education (see table: 6.1).
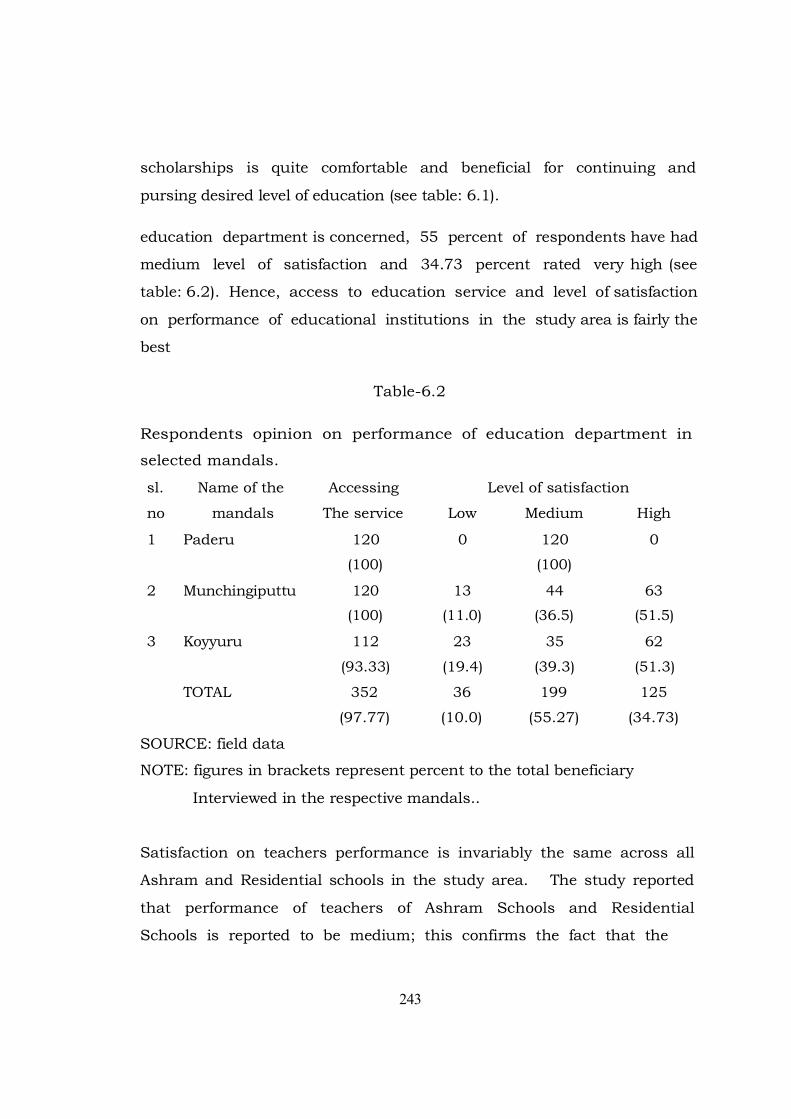
education department is concerned, 55 percent of respondents have had
medium level of satisfaction and 34.73 percent rated very high (see
table: 6.2). Hence, access to education service and level of satisfaction
on performance of educational institutions in the study area is fairly the
best
Table-6.2
Respondents opinion on performance of education department in
selected mandals.
sl. Name of the Accessing Level of satisfaction
no mandals The service Low Medium High
1 Paderu 120 0 120 0
(100) (100)
2 Munchingiputtu 120 13 44 63
(100) (11.0) (36.5) (51.5)
3 Koyyuru 112 23 35 62
(93.33) (19.4) (39.3) (51.3)
TOTAL 352 36 199 125
(97.77) (10.0) (55.27) (34.73)
SOURCE: field data
NOTE: figures in brackets represent percent to the total beneficiary
Interviewed in the respective mandals..
Satisfaction on teachers performance is invariably the same across all
Ashram and Residential schools in the study area. The study reported
that performance of teachers of Ashram Schools and Residential
Schools is reported to be medium; this confirms the fact that the
243

desired level of contribution as expected from the teachers has not
been provided. It is also pertinent to Note that 16.11per cent of
beneficiaries interviewed in koyyuru mandal have reported low level of
performance of teachers. Teachers’ performance is favorably rated by
28.62 percent of beneficiaries in and Paderu, Munchingputtu
mandals(see table: 6.3)
TABLE-6.3
Respondents opinion on teachers performance in Ashram
schools/Residential schools in selected mandals.
SL. name of the
NO mandals 1 Paderu 2 Munchingiputtu 3 Koyyuru
TOTAL
Level of satisfaction
Low Medium High
0 108 12
(90.9) (9.1)
0 35 85
(29.0) (71.0)
58 56 6
(48.3) (46.6) (5.1)
58 199 103
(16.11) (55.27) (28.62)
SOURCE: field data
NOTE: figures in brackets represent percent to the total
beneficiary Interviewed in the respective mandals..
Regarding the involvement of ITDA in imparting education to
the tribal races and the performance of the teachers on Ashram
schools and Gurukulam schools in the study area are assessed from
the opinions of the respondents and the data pertaining to their
responses is presented in the Table 6.4. It is interesting to Note that
the selected mandals have access to educational institutions
supported by the Tribal Welfare Department. The Ashram schools and
244
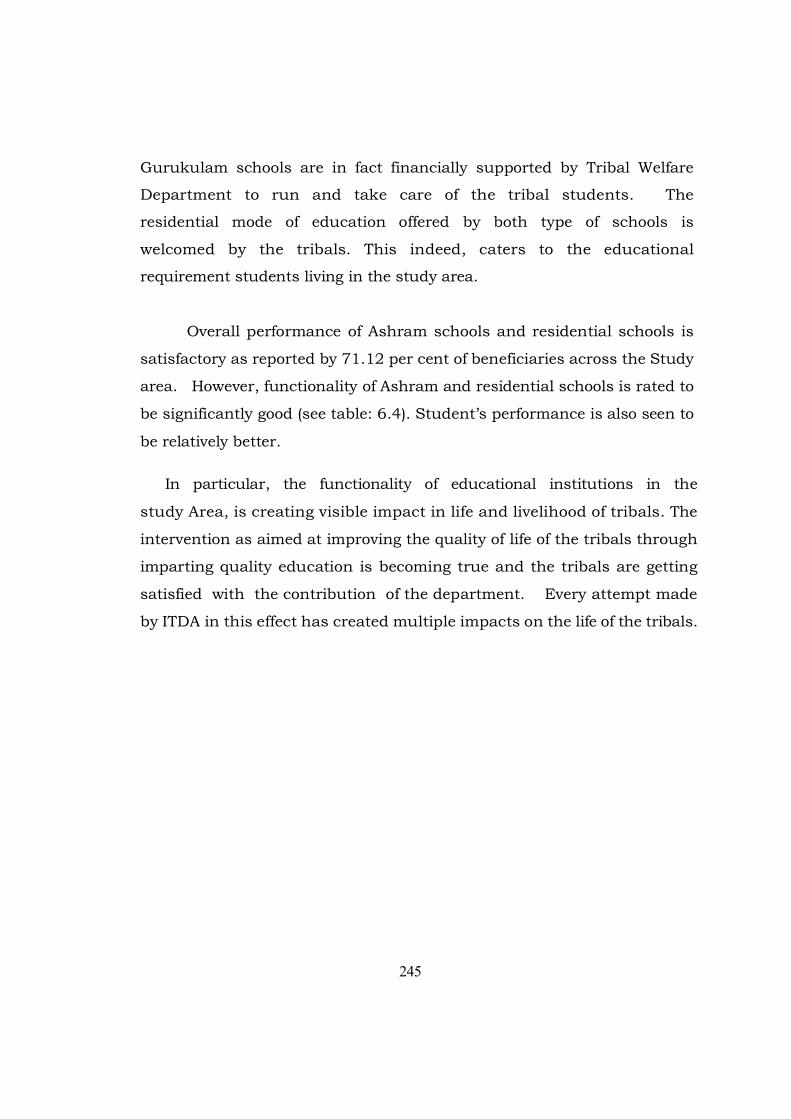
Gurukulam schools are in fact financially supported by Tribal Welfare
Department to run and take care of the tribal students. The
residential mode of education offered by both type of schools is
welcomed by the tribals. This indeed, caters to the educational
requirement students living in the study area.
Overall performance of Ashram schools and residential schools is
satisfactory as reported by 71.12 per cent of beneficiaries across the Study
area. However, functionality of Ashram and residential schools is rated to
be significantly good (see table: 6.4). Student’s performance is also seen to
be relatively better.
In particular, the functionality of educational institutions in the
study Area, is creating visible impact in life and livelihood of tribals. The
intervention as aimed at improving the quality of life of the tribals through
imparting quality education is becoming true and the tribals are getting
satisfied with the contribution of the department. Every attempt made
by ITDA in this effect has created multiple impacts on the life of the tribals.
245

TABLE-6.4
Respondents’ opinion on functioning of Ashram
schools/Residential schools in selected Mandals.
SL. Name of the
NO mandal
1 Paderu 2 Munchingiputtu 3 Koyyuru
TOTAL
Source: field data.
Level of satisfaction
Low Medium High
0 113 7
(94.16) (5.8)
0 42 78
(35) (65)
7 101 12
(5.8) (84.16) (10.08)
7 256 97
(1.94) (71.12) (26.94)
Note : figures in brackets represent percent to the total beneficiary
interviewed in the respective mandals..
Health:
The ITDA, Paderu with 33 primary Health Centers, 195 Sub-
centers and 3200 community health workers has been rendering
medical service to the tribal communities. As a special case and with
the support of Tribal Welfare Department required diet is being
provided to the in-house patients besides one attendant in every
community health center. Apart from this emergency health services
are also being offered with the support of ‘National Rural Health
Mission’. There are 10 EMRI (108) Ambulances to provide urgent
transportation facilities and first aid to the patients in the agency.
Area apart from this 10 mobile medical units -6 run by the
246
Government and 4 by local Non Government Organizations provide
emergency health services in the remote and interior villages of study
area.
The special provision of ITDA for opening up of ‘Drug Depots’ in the
remotest village is going a long way to address the medicine
requirements during rainy season and odd hours. The community
health workers are posted in strategic villages of the Agency to cater to
the odd time health service requirements besides providing regular
health services.
Analysis of physical presence of health institutions in Paderu study
area reveals that ITDA and health department in particular has
planned meticulously to position themselves for effective service
delivery. The efficiency and impact of all the activities taken up by the
Health Department is thoroughly examined in the following sections.
It is interesting to Note that awareness on health service availability
in study area is pretty well known to one and all. Almost 97 per cent of
beneficiaries reported of being aware of Primary Health Centers and
are utilizing the service. However, gaps in service accessibility and
awareness is evidenced due to the geographic spread out of the Agency
Area and due to the blind belief of the tribals on witchcrafts (see
table:6.5). Further, poor level of satisfaction is observed to be the
demotivating factor in accessing the services available at Primary
Health Centers.
247
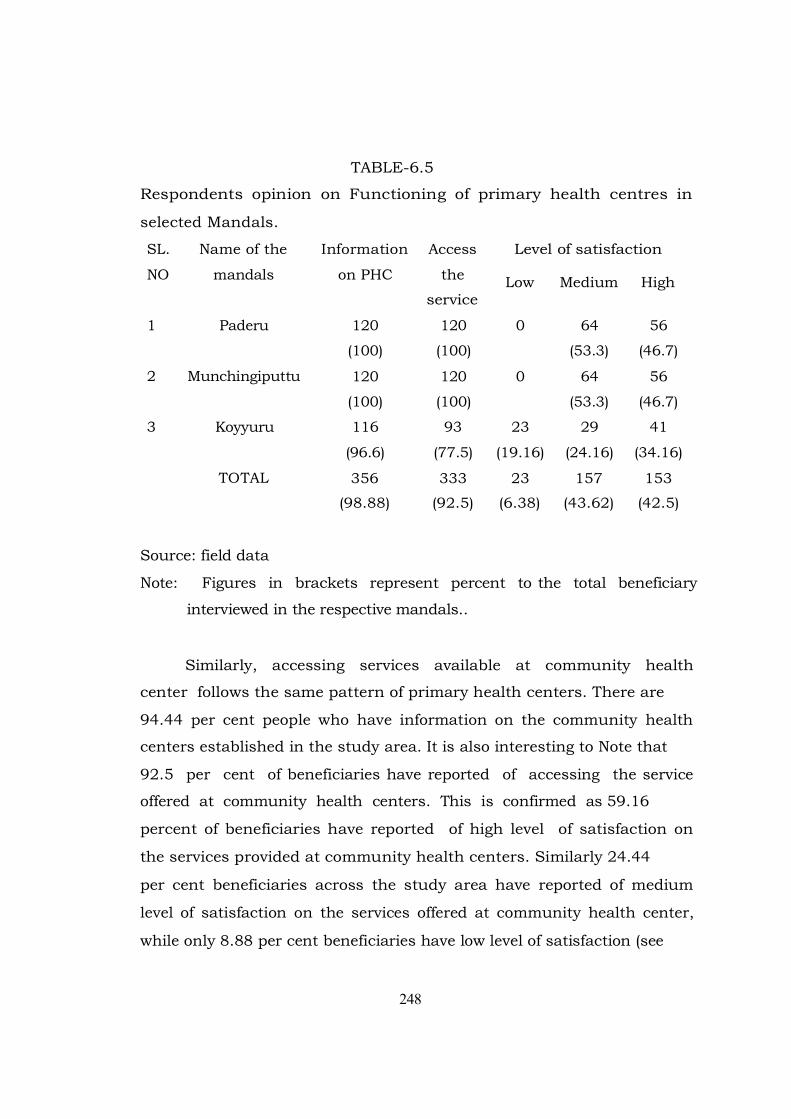
TABLE-6.5
Respondents opinion on Functioning of primary health centres in
selected Mandals.
SL. Name of the
NO mandals 1 Paderu 2 Munchingiputtu 3 Koyyuru
TOTAL
Source: field data
Information Access
on PHC the
service
120 120
(100) (100)
120 120
(100) (100)
116 93
(96.6) (77.5)
356 333
(98.88) (92.5)
Level of satisfaction
Low Medium High
0 64 56
(53.3) (46.7)
0 64 56
(53.3) (46.7)
23 29 41
(19.16) (24.16) (34.16)
23 157 153
(6.38) (43.62) (42.5)
Note: Figures in brackets represent percent to the total beneficiary
interviewed in the respective mandals..
Similarly, accessing services available at community health
center follows the same pattern of primary health centers. There are
94.44 per cent people who have information on the community health
centers established in the study area. It is also interesting to Note that
92.5 per cent of beneficiaries have reported of accessing the service
offered at community health centers. This is confirmed as 59.16
percent of beneficiaries have reported of high level of satisfaction on
the services provided at community health centers. Similarly 24.44
per cent beneficiaries across the study area have reported of medium
level of satisfaction on the services offered at community health center,
while only 8.88 per cent beneficiaries have low level of satisfaction (see
248

table:6.6). This is indeed, reflects that satisfaction of beneficiaries in the
selected mandals on the service delivery of community health centers
which is reported very high.
TABLE-6.6
Respondents Opinion on Functioning of Community Health
Centers in the Study Area
Sl.No Name of the Information Access Level of satisfaction
mandals on CHC the low medium High
service
1 Paderu 120 120 0 56 64
(100) (100) (46.7) (53.33)
2 Munchingiputtu 120 120 4 28 88
(100) (100) (3.33) (3.33) (73.34)
3 Koyyuru 118 93 28 4 61
(98.33) (77.05) (23.3) (3.45) (50.83)
TOTAL 358 333 32 88 213
(94.44) (92.5) (8.88) (24.44) (59.16) Source: field data
Note: Figures in brackets represent percent to the total beneficiary
Interviewed in the respective mandals.
Information on the provision of emergency service (EMRI-108) in the
study area is widely acknowledged by the beneficiary interviewed in the
study area Pertaining to the beneficiaries have reported to have access to
the accessing the 108 services. In fact all the selected mandals have
access to the service to the maximum extent possible, except Koyyuru
mandal.
249

Emergency health service in an agency is highly essential. The
available institutions are not able to perform to the best of ability due
to poor transportation and network connection. Under the stated
condition issues of health are closely dealt by EMRI-108 services. In
this regard the study shows that 49.72 per cent beneficiaries in
selected mandals have reported high level of satisfaction on the 108
services. Similarly 25.83 per cent reported medium level of
satisfaction (see table: 6.7). The overall opinion on the performance
of 108 services and its impact is highly positive.
Table-6.7
Respondents Opinion on 108 (EMRI) Services in the Study Area
SL. Name of the
NO mandals 1 Paderu 2 Munchingiputtu 3 Koyyuru
TOTAL
Source: field deta
Information Access
on 108 the
service
109 109
(90.8) (90.8)
120 119
(100) (99.)
118 52
(98.28) (43.3)
347 280
(96.38) (77.77)
Level of satisfaction
Low Medium High
0 63 46
(52.5) (38.3)
0 17 102
(14.3) (85.7)
8 13 31
(6.6) (10.8) (25.8)
08 93 179
(2.22) (25.83) (49.72)
Note : figures in brackets represent percent to the total beneficiary
interviewed in the respective mandals.
Despite easy accessibility of health services and facilities,
people from all three mandals are hampered from availing them at the
individual level, mostly either by lack of money or through lack of
250
through lack of transportation facilities. At the Health System level,
non-availability of medicines emerges as the main impediment as well as
demotivational factor to access the health services available.
Health Providers perception of Access to Services:
In keeping with the responses of the households, the health
service providers also perceive poverty (lack of money) and lack of
transportation as major barriers to easy accessibility of health services to
the people. In deed, there are host of factors like ignorance about the
disease, doctors or medicines not being available, lack of education and
their belief in traditional healers and folklore simultaneously works as
impediments to deliver services.
Roads:
Road connectivity is very poor in the agency area. There are 700
habitations which are still not connected by any road. Due to
various reasons people are in capable of doing anything to improve the
road connectivity and network services available. They are eagerly
waiting for (ITDAs) help to develop road and network facilities for
them; as opined by 91.11 per cent beneficiary in the study area.
People’s opinion on access to the roadwork shows that 71 per cent
beneficiaries are provided with road facilities. Quality of the
constructed road following the contractual mode of work execution is
bringing resentment among tribals. Around 52.5 per cent beneficiaries
interviewed have expressed medium level of satisfaction on the road
work carried out by the department. Similarly 14.16 per cent
beneficiaries reported of high level of satisfaction on the road works (see
table: 6.8).
251
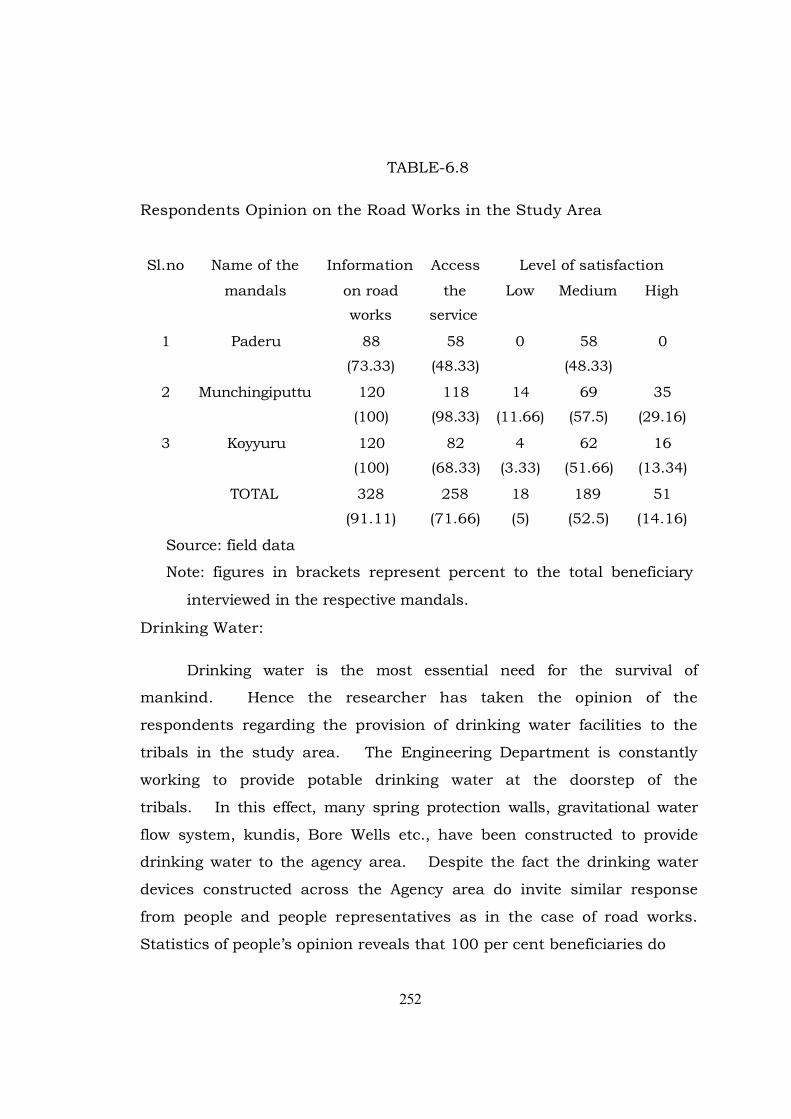
TABLE-6.8
Respondents Opinion on the Road Works in the Study Area
Sl.no Name of the Information Access Level of satisfaction
mandals on road the Low Medium High
works service
1 Paderu 88 58 0 58 0
(73.33) (48.33) (48.33)
2 Munchingiputtu 120 118 14 69 35
(100) (98.33) (11.66) (57.5) (29.16)
3 Koyyuru 120 82 4 62 16
(100) (68.33) (3.33) (51.66) (13.34)
TOTAL 328 258 18 189 51
(91.11) (71.66) (5) (52.5) (14.16)
Source: field data
Note: figures in brackets represent percent to the total beneficiary
interviewed in the respective mandals.
Drinking Water:
Drinking water is the most essential need for the survival of
mankind. Hence the researcher has taken the opinion of the
respondents regarding the provision of drinking water facilities to the
tribals in the study area. The Engineering Department is constantly
working to provide potable drinking water at the doorstep of the
tribals. In this effect, many spring protection walls, gravitational water
flow system, kundis, Bore Wells etc., have been constructed to provide
drinking water to the agency area. Despite the fact the drinking water
devices constructed across the Agency area do invite similar response
from people and people representatives as in the case of road works.
Statistics of people’s opinion reveals that 100 per cent beneficiaries do
252
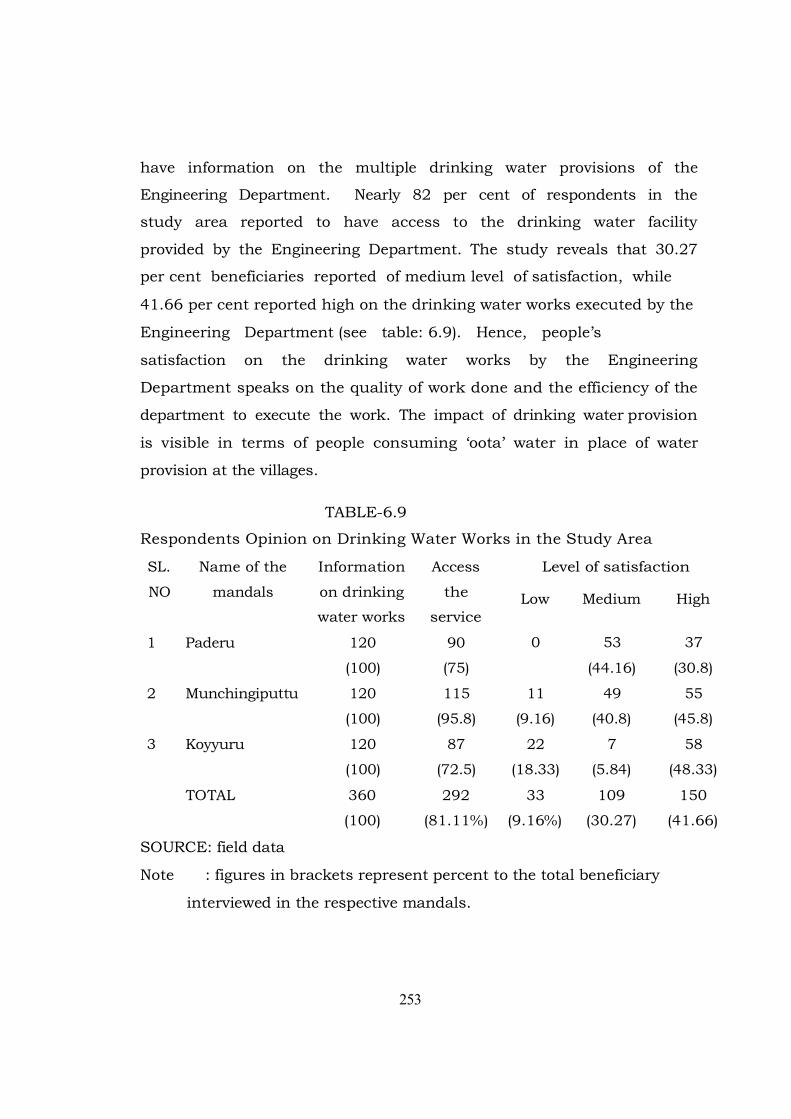
have information on the multiple drinking water provisions of the
Engineering Department. Nearly 82 per cent of respondents in the
study area reported to have access to the drinking water facility
provided by the Engineering Department. The study reveals that 30.27
per cent beneficiaries reported of medium level of satisfaction, while
41.66 per cent reported high on the drinking water works executed by the
Engineering Department (see table: 6.9). Hence, people’s
satisfaction on the drinking water works by the Engineering
Department speaks on the quality of work done and the efficiency of the
department to execute the work. The impact of drinking water provision
is visible in terms of people consuming ‘oota’ water in place of water
provision at the villages.
TABLE-6.9
Respondents Opinion on Drinking Water Works in the Study Area
SL. Name of the
NO mandals 1 Paderu 2 Munchingiputtu 3 Koyyuru
TOTAL
SOURCE: field data
Information Access
on drinking the
water works service
120 90
(100) (75)
120 115
(100) (95.8)
120 87
(100) (72.5)
360 292
(100) (81.11%)
Level of satisfaction
Low Medium High
0 53 37
(44.16) (30.8)
11 49 55
(9.16) (40.8) (45.8)
22 7 58
(18.33) (5.84) (48.33)
33 109 150
(9.16%) (30.27) (41.66)
Note : figures in brackets represent percent to the total beneficiary
interviewed in the respective mandals.
253
Minor Irrigation:
ITDA has persistently encouraged engineering Department to made
provision of assured irrigation facilities for taking up commercial
crops. In this effect. Minor irrigation though constructed with a noble
intension faces people’s criticism. The benefits received from Minor
Irrigation project are not very favorable to ensure sound life and
livelihood and provide assured irrigation for agriculture crops. More
than 89 percent beneficiaries reported have information on the Minor
Irrigation programme takenup by the Engineering department.
Statistics shows that 62.22 per cent of beneficiaries are utilizing the
Minor irrigation service for agriculture and allied economic activities in
the selected mandals. The dis-integrated picture of Minor irrigation
works over the agency shows that mandals like Muchingiputtu and
Paderu have better access to Minor irrigation in comparison to
koyyuru .
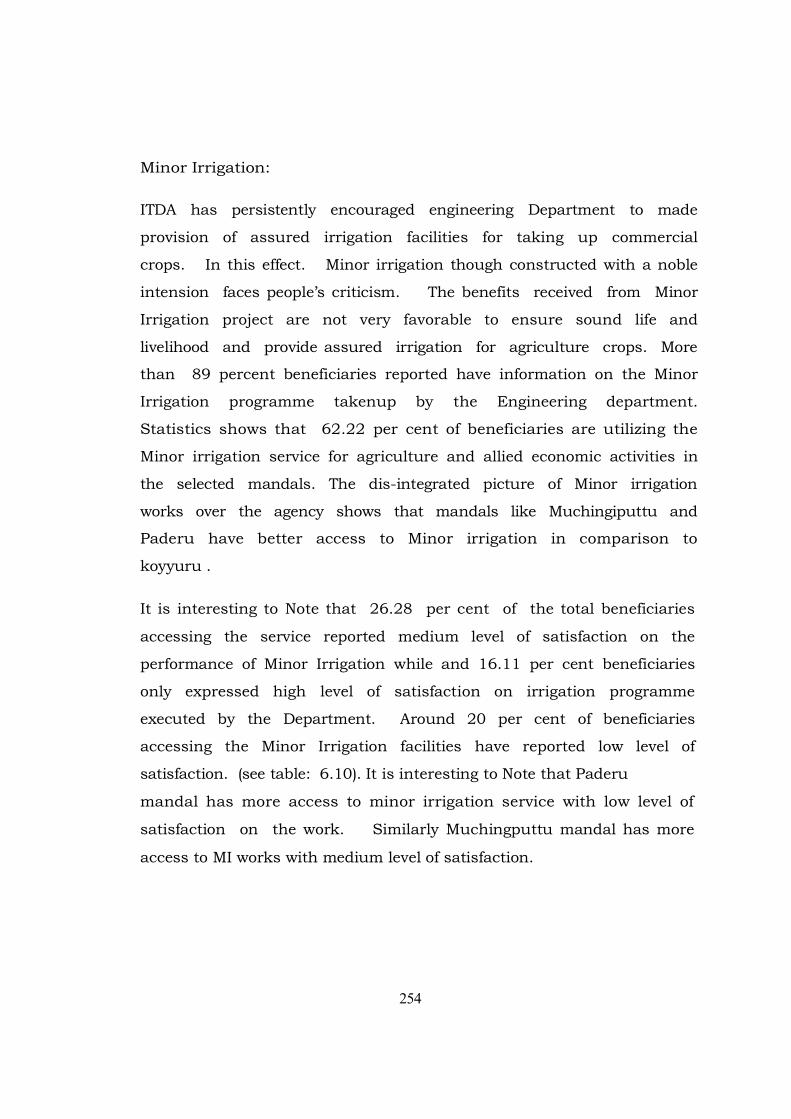
It is interesting to Note that 26.28 per cent of the total beneficiaries
accessing the service reported medium level of satisfaction on the
performance of Minor Irrigation while and 16.11 per cent beneficiaries
only expressed high level of satisfaction on irrigation programme
executed by the Department. Around 20 per cent of beneficiaries
accessing the Minor Irrigation facilities have reported low level of
satisfaction. (see table: 6.10). It is interesting to Note that Paderu
mandal has more access to minor irrigation service with low level of
satisfaction on the work. Similarly Muchingputtu mandal has more
access to MI works with medium level of satisfaction.
254

Hence, level of satisfaction on the programme is not very significant. Poor
level of satisfaction, indeed, questions the very intension, intensity
and objective of the project execution.
TABLE-6.10
Respondents Opinion on Minor Irrigation in the Study A
Sl. Name of the Information Accessed Level of satisfaction
No mandal on minor the Low Medium High
irrigation service
1 Paderu 86 86 54 32 0
(71.66) (71.66) (45.16) (26.66)
2 Munchingiputtu 120 113 9 56 48
(100) (94.51) (7.05) (46.66) (40.8)
3 Koyyuru 115 25 8 7 10
(95.83) (20.86) (6.7) (5.8) (8.33)
Source: field data
Note: figures in brackets represent percent to the total beneficiary
interviewed in the respective mandals.
Economic Support Schemes:
For the overall all upliftment and empowerment of the people
economic sustenance is the major factor and which is most essential. Hence
to improve and better the life conditions of the tribals, the governments
have been implementing various economic programmes and income
generating schemes for the benefit of tribals. In this view the researcher
has made an effort to assess the economic support schemes provided by
ITDA for the economic.
255
Economic support scheme has been executed in the agency area
with vigor and spirit. Coordinated effort has been made to ensure
provisioning enhanced economic gain to the tribals with sustainable
use of natural resources. As a result, activities like promotion of
Agriculture, Horticulture, Animal Husbandry, Sericulture, Fisheries,
and Individual sector business has been supported and promoted.
The scheme has meticulously planned to improve agricultural
productivity through mechanization of agriculture and using high
yielding variety (HYV) seeds in place of traditional method of
cultivation. Under the schemes tribal farmers are provided with
modern agriculture inputs and latest technical skills to experiment the
new commercial agriculture. In this effect, system of rice
intensification (SRI) has become popular among the tribal farmers and in
many places it is being followed in the place of the traditional method
of cultivation.
In order to enhance the income level of tribals, Horticultural
programmes have also been taken up in addition to agriculture. Tribals
are encouraged for group plantation/patch plantation of fruit bearing trees
in common places. Tribals are provided with saplings and latest art of
technology for Horticulture cultivation. Similarly tribals are also
provided with financial and technical aids to rear domestic animals.
The young and energetic tribal entrepreneurs are financially supported to
take up individual sector business suiting to the local need and
environment.
People’s opinion on the ESS service is conservative. Of the
beneficiaries interviewed 89.72 per cent reported of accessing the
Economic support scheme with degrees of variation in the study area
256
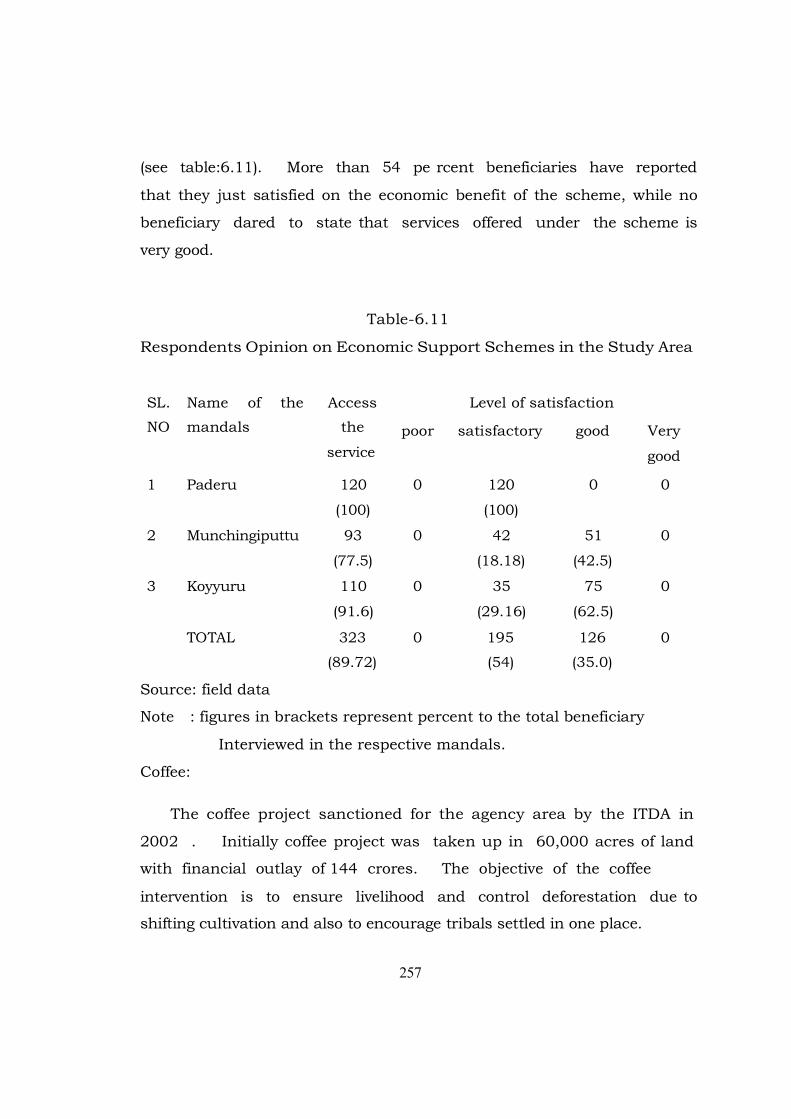
(see table:6.11). More than 54 pe rcent beneficiaries have reported
that they just satisfied on the economic benefit of the scheme, while no
beneficiary dared to state that services offered under the scheme is
very good.
Table-6.11
Respondents Opinion on Economic Support Schemes in the Study Area
SL. Name of the Access Level of satisfaction
NO mandals the poor satisfactory good Very
service good
1 Paderu 120 0 120 0 0
(100) (100)
2 Munchingiputtu 93 0 42 51 0
(77.5) (18.18) (42.5)
3 Koyyuru 110 0 35 75 0
(91.6) (29.16) (62.5)
TOTAL 323 0 195 126 0
(89.72) (54) (35.0)
Source: field data
Note : figures in brackets represent percent to the total beneficiary
Interviewed in the respective mandals.
Coffee:
The coffee project sanctioned for the agency area by the ITDA in
2002 . Initially coffee project was taken up in 60,000 acres of land
with financial outlay of 144 crores. The objective of the coffee
intervention is to ensure livelihood and control deforestation due to
shifting cultivation and also to encourage tribals settled in one place.
257
Currently the total area under coffee cultivation is 72,104 acres and is
approximately ensuring livelihood for 60,000 families across the
mandals of agency area.
Coffee plant requires shading. In this context, tribals of agency
area are encouraged to cultivate horticulture species as shade plant
material, which is also fetching additional income to the coffee
growers. The common Horticulture plants grown as shade material
include Mango. Orange, Nerudu, Seethaphal, Jafra and Pngamia.
Under the coffee initiative farmers are provided with the technical
knowledge and planting materials along with provision of support for
digging, pitting and maintenance. Coffee cultivation in the agency like
Paderu has addressed twin issues of ensuring sustainable livelihood to the
marginalized community as well as addressing environmental issues of
deforestation arising due to Podu cultivation.
The implementation of the unique coffee project is getting
momentum and scale up every season. Around 67 per cent
beneficiaries interviewed reported of their awareness on the coffee
project. It is also reported that ITDA has erected hoardings on shady
points and at Government Offices to create awareness on coffee
cultivation and the benefit there from. The percentile as reported
above is not important due to the fact that non-covered mandals are
too aware about the intervention and services offered. It is pertinent
to report that 63.88 per cent beneficiaries across the agency area
reported that coffee program is very useful for them. It confirms that
the program is bringing economic and ecological benefit of the farmers
(see table: 6.12) growing coffee 59.44 are supported by the ITDA.
258
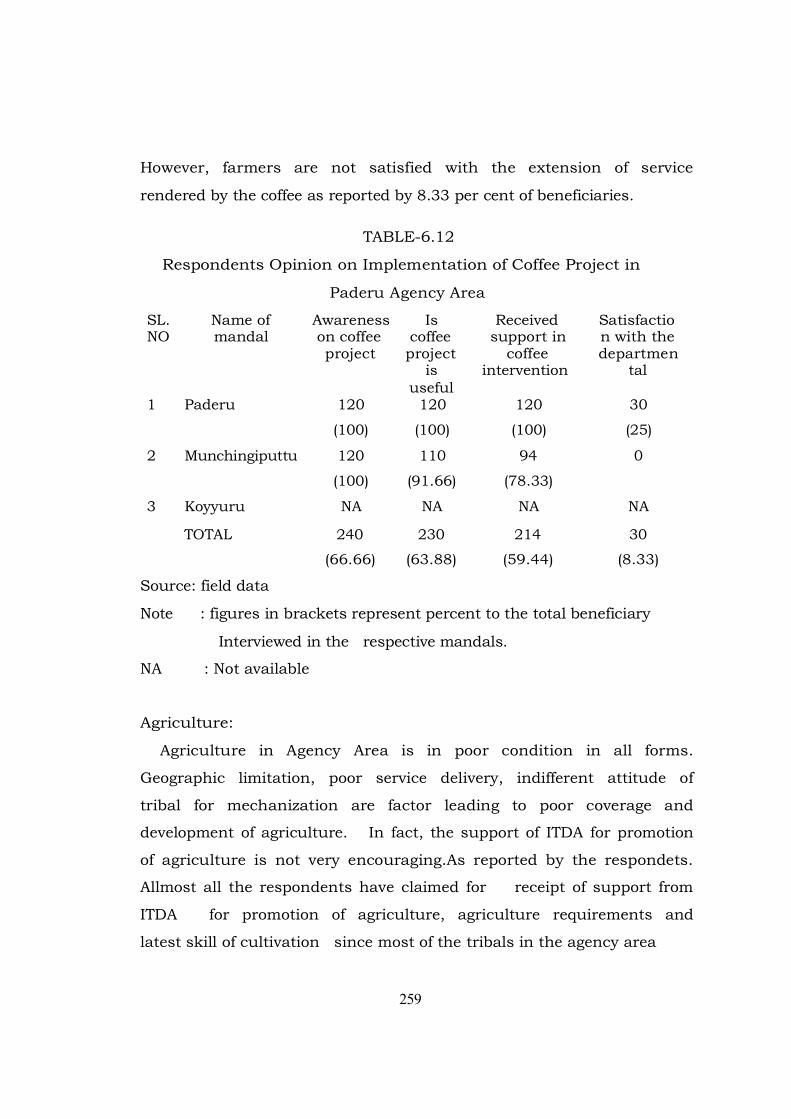
However, farmers are not satisfied with the extension of service
rendered by the coffee as reported by 8.33 per cent of beneficiaries.
TABLE-6.12
Respondents Opinion on Implementation of Coffee Project in
Paderu Agency Area
SL. Name of Awareness Is Received Satisfactio NO mandal on coffee coffee support in n with the
project project coffee departmen is intervention tal
useful 1 Paderu 120 120 120 30
(100) (100) (100) (25)
2 Munchingiputtu 120 110 94 0
(100) (91.66) (78.33)
3 Koyyuru NA NA NA NA
TOTAL 240 230 214 30
(66.66) (63.88) (59.44) (8.33)
Source: field data
Note : figures in brackets represent percent to the total beneficiary
Interviewed in the respective mandals.
NA : Not available Agriculture:
Agriculture in Agency Area is in poor condition in all forms.
Geographic limitation, poor service delivery, indifferent attitude of
tribal for mechanization are factor leading to poor coverage and
development of agriculture. In fact, the support of ITDA for promotion
of agriculture is not very encouraging.As reported by the respondets.
Allmost all the respondents have claimed for receipt of support from
ITDA for promotion of agriculture, agriculture requirements and
latest skill of cultivation since most of the tribals in the agency area
259

follow the traditional method of cultivation. Around 67 per cent
beneficiaries in tree mandals of the Paderu agency area reported of
receipt of training on promotion of agriculture. (see table: 6.13).
Extension of agriculture in Agency area is limited. Hence,
experimentation with latest agriculture production methodology and
technology has limited reach. Nearby 63 per cent beneficiary across
the agency area reported of receiving training support on “System of
Rice Intensification” method of agriculture development and
promotion.
There are 41.94 per cent beneficiaries who reported of low level
satisfaction on the overall support extended by the ITDA .
However, overall impact of agriculture service is satisfactory but not
economically beneficial.
Table-6.13
Respondents Opinion on Agriculture Activities in Selected Mandals
SL. Name of Support Receipt Specific Level of satisfaction NO the mandal received of Training
from ITDA training 0n SRI Low Medium High
1 Paderu 74 92 58 41 71 7 (61.66) (76.66) (48.33) (34.16) (59.16) (5.83)
2 Munchingip 32 64 54 29 46 22 uttu (26.6) (53.3) (54.65) (24.14) (38.38) (18.18)
3 Koyyuru 4 85 99 81 34 0 (3.33) (70.8) (82.5) (67.5) (32.3)
TOTAL 110 241 222 151 151 29 (30.55) (66.94) (61.66) (41.94) (41.94) (8.05)
Source: field data
Note: figures in brackets represent percent to the total beneficiary
interviewed in the respective mandal.
260

Indira Prabha (CLDP):
The Comprehensive Land Development Programme also reported
to have limited reach. The programme is very much restricted to of
few pockets of Agency area. Though three Mandals are utilizing the
scheme, the impact is not very much favourable to propagate itself for
scale up. In response to knowledge on the scheme, 76.66 per cent of
respondents only reported to have knowledge on the scheme.
So far as level of satisfaction of the beneficiaries is concerned,
21.94 percent of beneficiaries rated the level of satisfaction very good,
while 6.11 per cent only reported of poor level of satisfaction. Overall
satisfaction is in between 25.55 per cent to 23.06 per cent on the
economical contribution of the programme to restore the tribal
livelihood. Intra Mandal satisfaction level of satisfaction of
beneficiaries reflects that overall level of satisfaction is rated to be very
good in Paderu Mandal followed by Koyyuru. In contrast, satisfaction
level of beneficiaries interviewed on Comprehensive Land Development
Programme in Koyyuru mandal. This state of scenario established the
fact that Comprehensive land Development Programme has not given
equal weight age for implementation across the Mandals of the Agency
Area.
People’s opinion and level of satisfaction on the Comprehensive Land
Development Programme is fairly good. The Interior and Remote pockets of
the agencies are not covered under the programme and hence, the
programme has not got mileage. The Department therefore, needs to make
concerted efforts to bring in awareness and deepen the intensity of the
programme focus.(see table.6.14)
261
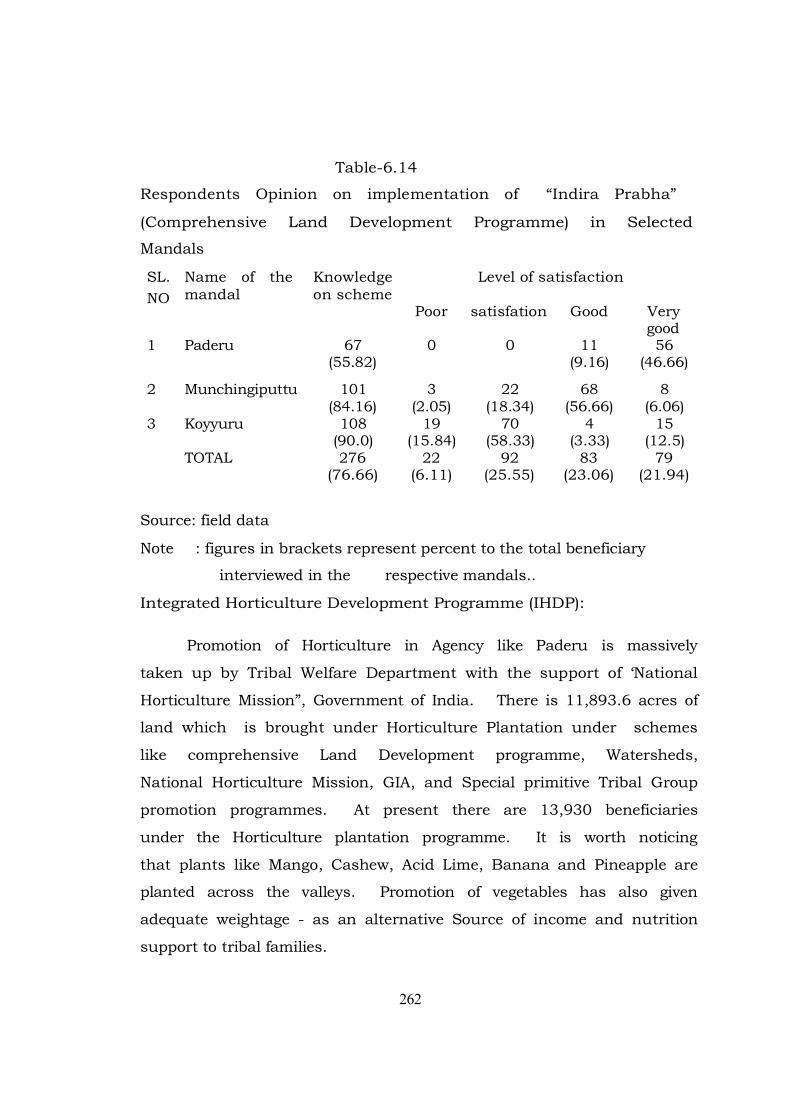
Table-6.14
Respondents Opinion on implementation of “Indira Prabha”
(Comprehensive Land Development Programme) in Selected
Mandals
SL. Name of the Knowledge Level of satisfaction
NO mandal on scheme Poor satisfation Good Very
good 1 Paderu 67 0 0 11 56
(55.82) (9.16) (46.66)
2 Munchingiputtu 101 3 22 68 8 (84.16) (2.05) (18.34) (56.66) (6.06)
3 Koyyuru 108 19 70 4 15 (90.0) (15.84) (58.33) (3.33) (12.5)
TOTAL 276 22 92 83 79 (76.66) (6.11) (25.55) (23.06) (21.94)
Source: field data
Note : figures in brackets represent percent to the total beneficiary
interviewed in the respective mandals..
Integrated Horticulture Development Programme (IHDP):
Promotion of Horticulture in Agency like Paderu is massively
taken up by Tribal Welfare Department with the support of ‘National
Horticulture Mission”, Government of India. There is 11,893.6 acres of
land which is brought under Horticulture Plantation under schemes
like comprehensive Land Development programme, Watersheds,
National Horticulture Mission, GIA, and Special primitive Tribal Group
promotion programmes. At present there are 13,930 beneficiaries
under the Horticulture plantation programme. It is worth noticing
that plants like Mango, Cashew, Acid Lime, Banana and Pineapple are
planted across the valleys. Promotion of vegetables has also given
adequate weightage - as an alternative Source of income and nutrition
support to tribal families.
262
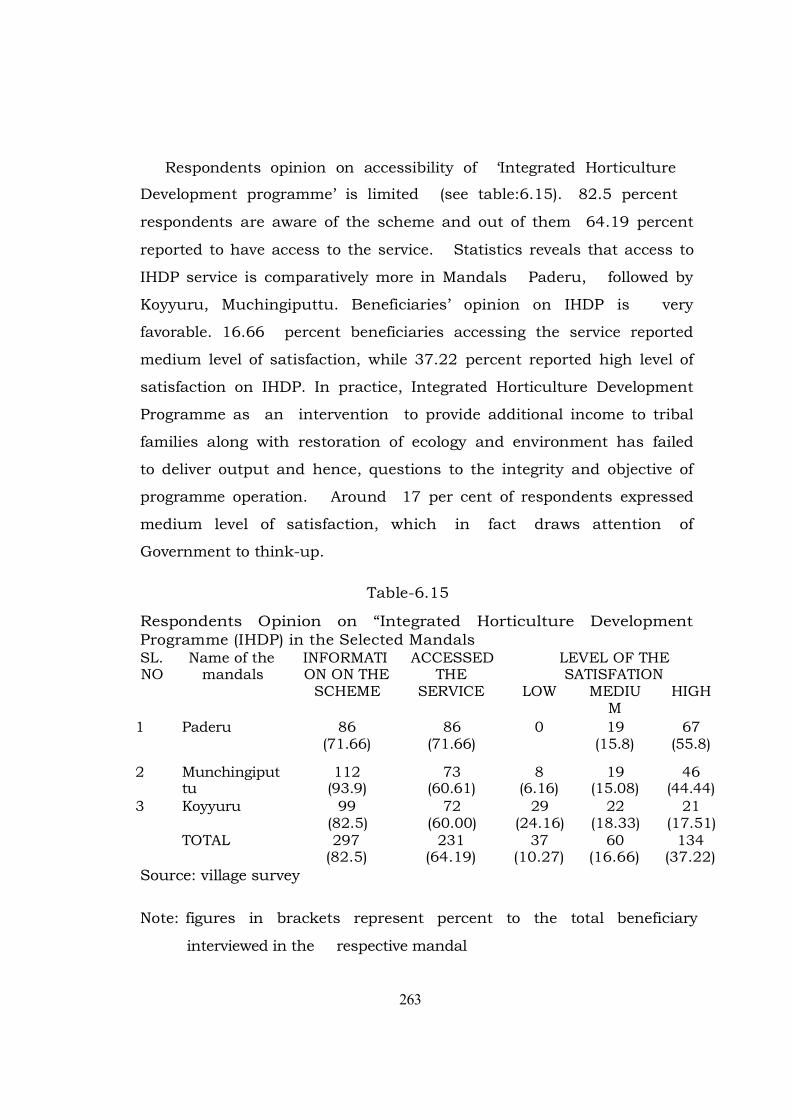
Respondents opinion on accessibility of ‘Integrated Horticulture
Development programme’ is limited (see table:6.15). 82.5 percent
respondents are aware of the scheme and out of them 64.19 percent
reported to have access to the service. Statistics reveals that access to
IHDP service is comparatively more in Mandals Paderu, followed by
Koyyuru, Muchingiputtu. Beneficiaries’ opinion on IHDP is very
favorable. 16.66 percent beneficiaries accessing the service reported
medium level of satisfaction, while 37.22 percent reported high level of
satisfaction on IHDP. In practice, Integrated Horticulture Development
Programme as an intervention to provide additional income to tribal
families along with restoration of ecology and environment has failed
to deliver output and hence, questions to the integrity and objective of
programme operation. Around 17 per cent of respondents expressed
medium level of satisfaction, which in fact draws attention of
Government to think-up.
Table-6.15
Respondents Opinion on “Integrated Horticulture Development Programme (IHDP) in the Selected Mandals SL. Name of the INFORMATI ACCESSED LEVEL OF THE NO mandals ON ON THE THE SATISFATION
SCHEME SERVICE LOW MEDIU HIGH M
1 Paderu 86 86 0 19 67 (71.66) (71.66) (15.8) (55.8)
2 Munchingiput 112 73 8 19 46 tu (93.9) (60.61) (6.16) (15.08) (44.44)
3 Koyyuru 99 72 29 22 21 (82.5) (60.00) (24.16) (18.33) (17.51)
TOTAL 297 231 37 60 134 (82.5) (64.19) (10.27) (16.66) (37.22)
Source: village survey
Note: figures in brackets represent percent to the total beneficiary
interviewed in the respective mandal
263
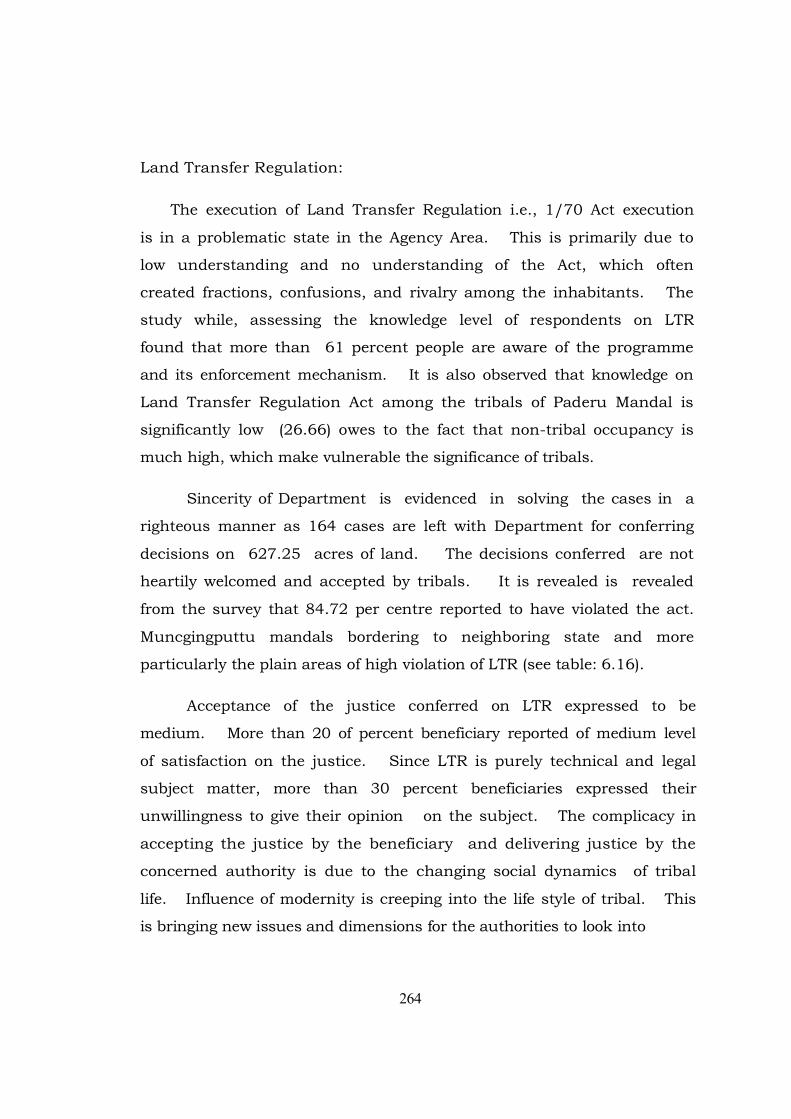
Land Transfer Regulation:
The execution of Land Transfer Regulation i.e., 1/70 Act execution
is in a problematic state in the Agency Area. This is primarily due to
low understanding and no understanding of the Act, which often
created fractions, confusions, and rivalry among the inhabitants. The
study while, assessing the knowledge level of respondents on LTR
found that more than 61 percent people are aware of the programme
and its enforcement mechanism. It is also observed that knowledge on
Land Transfer Regulation Act among the tribals of Paderu Mandal is
significantly low (26.66) owes to the fact that non-tribal occupancy is
much high, which make vulnerable the significance of tribals.
Sincerity of Department is evidenced in solving the cases in a
righteous manner as 164 cases are left with Department for conferring
decisions on 627.25 acres of land. The decisions conferred are not
heartily welcomed and accepted by tribals. It is revealed is revealed
from the survey that 84.72 per centre reported to have violated the act.
Muncgingputtu mandals bordering to neighboring state and more
particularly the plain areas of high violation of LTR (see table: 6.16).
Acceptance of the justice conferred on LTR expressed to be
medium. More than 20 of percent beneficiary reported of medium level
of satisfaction on the justice. Since LTR is purely technical and legal
subject matter, more than 30 percent beneficiaries expressed their
unwillingness to give their opinion on the subject. The complicacy in
accepting the justice by the beneficiary and delivering justice by the
concerned authority is due to the changing social dynamics of tribal
life. Influence of modernity is creeping into the life style of tribal. This
is bringing new issues and dimensions for the authorities to look into
264
before conferring verdict. Poor level of literacy is a factor also needs to be
considered while conferring the LTR verdict.
TABLE-6.16
Respondents Opinion on “Land Transfer Regulation” (1/70Act) in
Selected Mandals
SL. Name of the knowledge violation satisfaction on justice NO mandals on ltr act of ltr act conferred
low medium high
1 Paderu 94 14 9 53 0 (18.32) (26.66) (7.69) (44.16)
2 Munchingiputtu 115 101 4 11 5 (95.83) (84.16) (3.03) (9.16) (4.16)
3 Koyyuru 75 110 8 10 0 (62.05) (91.66) (6.66) (8.62)
TOTAL 284 225 21 74 05 (78.88) (62.5) (5.83) (20.55) (1.38)
Source: field data
Note: figures in brackets represent percent to the total beneficiary
interviewed in the respective mandal.
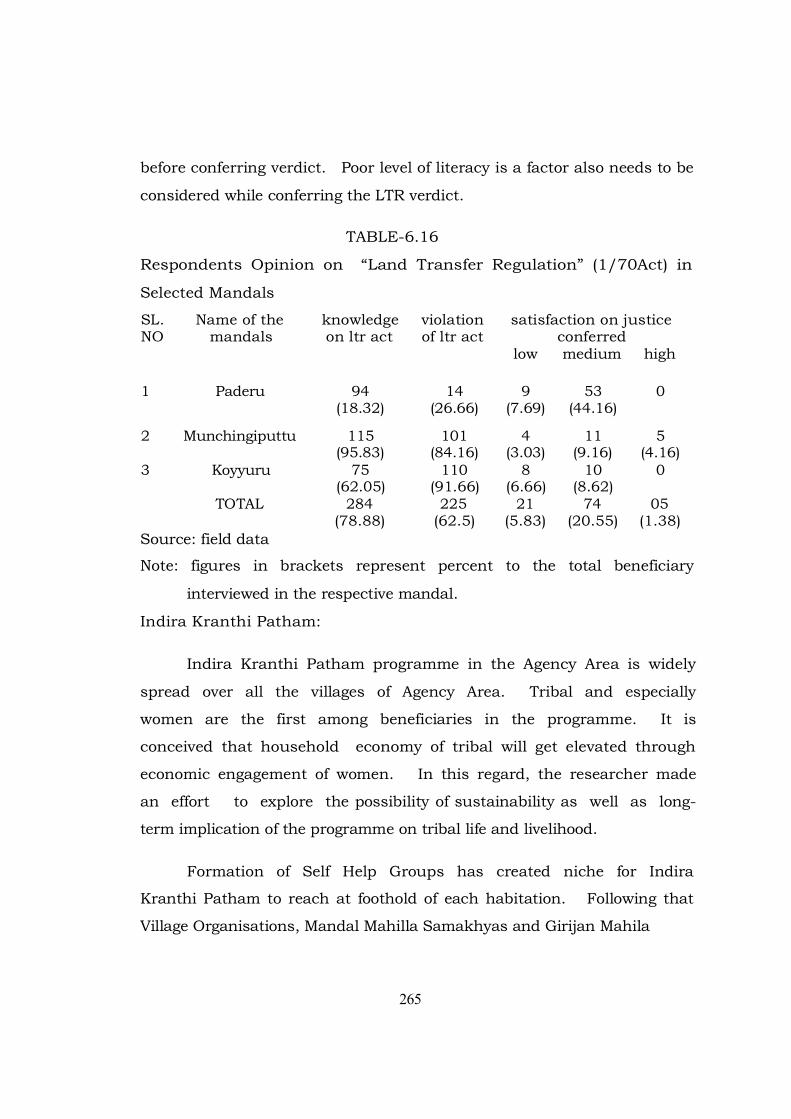
Indira Kranthi Patham:
Indira Kranthi Patham programme in the Agency Area is widely
spread over all the villages of Agency Area. Tribal and especially
women are the first among beneficiaries in the programme. It is
conceived that household economy of tribal will get elevated through
economic engagement of women. In this regard, the researcher made
an effort to explore the possibility of sustainability as well as long-
term implication of the programme on tribal life and livelihood.
Formation of Self Help Groups has created niche for Indira
Kranthi Patham to reach at foothold of each habitation. Following that
Village Organisations, Mandal Mahilla Samakhyas and Girijan Mahila
265
Samakhyas are subsequently formed as institutions at different levels for
formation and grounding of different income generating
programmes and livelihood programmes to ensure economic well-being of
families in this institutions. More than 80 pe rcent beneficiaries reported
to have deep knowledge on Indira Kranthi Patham and the activities
carried out. It is interesting to Note that all beneficiaries interviewed in
Munchingiputtu Mandal are comfortably awarded of the activities of IKP.
While, there are more than 90 per cent beneficiaries interview in in
Munchingiputtu and 75 per cent in paderu mandal are reported aware of
IKP activities.
The statistics shows that25 per cent of respondents in paderu
32.5 per cent in Munchingputtu and 70.83 per cent in Koyyuru
reported to have receipt of the benefit from IKP
TABLE-6.17
Respondents Opinion on Indira Kranthi Patham Programme’s
Sustainability in Selected Mandals.
SL. NAME OF THE KNOWLEDGE RECEPT NATURE PROGRAM NO MANDAL ON DIFFERENT OF OF SUSTAINABILLI
ACTIVITIES BENEFIT BENEFIT TY 1 Paderu 76 30 Food 30
(63.33) (25) security, (25) MCP’s etc.,
2 Munchingiputtu 120 39 Food 39 (100) (32.5) security, (32.5)
MCP’s etc., 3 Koyyuru 93 85 Food 85
(77.5) (70.83) security, (70.83) MCP’s etc.,
TOTAL 289 154 154 (80.27) (42.77) (42.77)
Source: field data
Note: figures in brackets represent percent to the total beneficiary
interviewed in the respective mandal
266

Clubbing together Pavala Vaddi(loan at 0.25paisa interest rate)
and bank linkages initiative of IKP are aiming at making tribal making
tribal women free from the clutches of money lender and soukars.
99.44 percent of the interviewed reported of having information on the
Pavala Vaddi/Bank linkage programme of IKP. There are 95.55
percent beneficiaries across the Agency areas who to have access to
reported the Pavala vaddi and bank linkage programme of IKP. It is
interesting to Note that minimums of 85 percent beneficiaries across
the mandals are utilizing the financial services under Pavala vaddi and
Bank linkage programme of IKP . Support of IKP through bank linkage
and Pavala Vaddi programme has brought in financial liquidation to
the SHGs, which in turn has caused greater impact in terms of
ensuring and assuring financial independence of the women at grass
root through SHGs (see table: 6.18). of the total beneficiaries
accessing the schemes, 60.55 percent beneficiaries reported of high
level of satisfaction on the performance of Pavala Vaddi and Bank
Linkage followed by 31.38 percent beneficiaries of medium level of
satisfaction. This shows impact of these programmes as observed
through the strength of SHG and low access to the money lenders and
traders.
267

TABLE-6.18
Respondents Opinion on Bank Linkage/Pavala Vaddi Programme
under IKP in Selected Mandals.
sl. Name of the informatio accessed level if satisfaction
No mandal n on the low medium high
scheme scheme
1 Paderu 120 120 0 53 67
(100) (100) (44.16) (55.84)
2 Munchingipu 120 120 0 0 120
ttu (100) (100) (100)
3 Koyyuru 118 104 13 60 31
(98.33) (86.66) (10.82) (50.0) (25.84)
TOTAL 358 344 13 113 218
(99.44) (95.55) (3.61) (31.38) (60.55)
Source: field data
Note : figures in brackets represent percent to the total beneficiary
interviewed in the respective mandal.
Youth Employment
Providing employment to tribal youths is an Endeavour as
reported favorably. RIAD and non-RAID villages together are getting
the benefit. More than 90 per cent tribal youth are getting
employment and thereby leading a dignified life with dignity (see table:
6.19). More than 91 percent of beneficiaries across the agency area
reported of Youth Employment programmes through IKP. Various
training Institutions have been opened up and technical skills are being
imparted to the tribal youths for self-employment. In addition, trained
tribal youths are linked up with various industries and corporations to
provide employment.
268
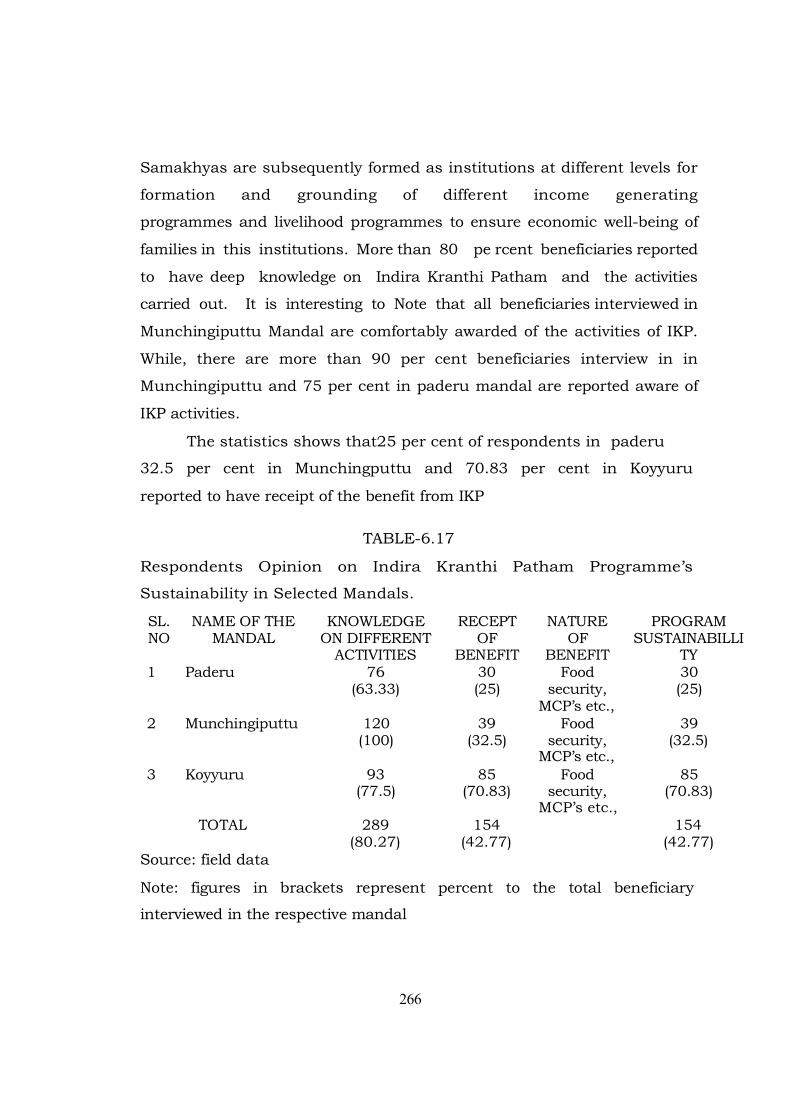
More than 90 percent of beneficiaries in the study area of
Paderu Agency reported to have access to Youth Employment service.
It is interesting to Note that access to the youth employment schemes
is relatively low in the Mandals located in remote areas and vice-
verse. The effectiveness of the programme is examined with the tribal
beneficiaries. Of the Total 65.0 per cent of beneficiaries across the
Mandals expressed high level of satisfaction on the youth employment
programme of IKP followed 23.33 percent beneficiaries reported
medium level of satisfaction. Village survey show that more number of
tribal youth is utilizing service from mandals with less proximity to
ITDA.
In totality the impact of IKP on life and livelihood of tribal women is
significantly experienced and reported. Ensuring food for poor and
vulnerable, use of natural resources to ensure and assure income and
livelihoods, broadening vision of women through Micro Credit Plans and
financial leverage through bank linkage and Pavala Vaddi are making
tribal satisfied and are sure of getting better standard of living and self
sufficiency.
TABLE-6.19
Respondents Opinion on Youth Employment in the Study Area
sl. name of the information accessed level of satisfaction no mandal on schemes the scheme
low medium high
1 Paderu 120 120 0 58 62 (100) (100) (48.34) (51.66)
2 Munchingiputtu 120 119 0 7 112 (100) (99.16) (5.83) (93.33)
3 Koyyuru 116 87 8 19 60 (96.6) (72.5) (6.66) (15.84) (50)
TOTAL 356 326 8 84 234 (98.88) (90.55) (2.22) (23.33) (65.0)
Source: field data Note: figures in brackets represent percent to the total beneficiary interviewed in the respective mandals..
269

Remote Interior Area Development(RAID):
Provisioning services in modular mode to the 390 villages in remote
areas of Paderu Agency Area has not gained mileage. From the
execution of programmes it appears that almost all basic services have
been provided in the remote and interior villages of the Paderu agency
area. Integrated tribal development agency Paderu has enlisted 18
major services namely roads, MI-Check Dams, Drinking water,
Livelihood Enhancement, Food security-Grain Banks, PHC buildings
and Ambulances, Housing, Mini-Anganwadi Centres, Provision Of
Direct To Home Units/ Mini Theaters, Electrification Of Villages,
Collage Building , Self-Employment and E-seva etc to the needy
remote and interior areas for their development. Tribals across agency
and remote and interior villages in particular are aware of the
developmental schemes available for their development. Of the total
beneficiaries interviewed in the selected mandals reported of having
information about the development programme. The study shows that
respondents awareness information on remote and interior area
development programme is more in RIAD mandals than in the non-
RAID mandals of the agency (see table: 6.20). It is surprising to Note
that only 30.83 per cent of beneficiaries interviewed across the agency
area reported accessing the services provided under remote and
interior area development program. The study also highlights the fact
that beneficiaries of Ananthagiri and Muchingput mandal though
aware of the programme and have villages falling under remote and
interior area development, have reported of non-accessibility of the
services offered under the scheme.
270

TABLE-6.20
Respondents Opinion on Implementation of RIAD Programme in
Selected Mandals
SL NAME OF THE PROGRAMME BENEFITE SUSTAINABILITY
NO MANDAL D UNDER OF PROGRAMME
RIAD
1 Paderu 56 41 41
(46.66) (34.16) (34.16)
2 Munchingiputtu 117 0 0
(97.5)
3 Koyyuru 116 70 29
(96.66) (58.33) (24.16)
TOTAL 289 111 70
(80.27) (30.83) (19.44)
Source: field data
Note: figures in parenthesis represent percent to the total beneficiary
interviewed in the respective mandal.
INDIRAMMA:
Provision of house under the INDIRAMMA programme in an agency
like Paderu has got maximum result. The programme using
resources from multiple schemes i.e., SPRH, RPH, IAY and
model colonies have constructed 94,843 houses for the tribals
across the agency area. It is also mentioned in the previous
chapter that almost 36,157 numbers of houses are still to be
provided to the people of the agency area.
People living and interior villages are aware of the scheme and
benefit offered 94.16 percent beneficiaries across the Mandals of
the agency areas reported of having information on the housing
271

under INDIRAMMA programme. Similarly 88.23 percent
beneficiaries interviewed in the agency are reported of being aware
of the schemes. So far accessing benefits is concerned, only31.33
percent beneficiaries reported receipt of benefits, while two
interior Mandals having remote area interior villages area falling
under the programme coverage have not accessed any benefit under
the scheme. Looking at geographic spread and number of people
living in Agency area, the benefit given to people are very meager
(see table: 6.21) and therefore, raises finger at its sustainability.
Overall response of beneficiary on housing initiative is very
positive and effective. More than 90 percent beneficiary
interviewed reported accessing the house, and no. of beneficiary
accessing RPH is more in relation to SPR. Satisfaction level on
housing programme is good(see table:6.22)
The novelty of the programme as visualized from the survey is
that more number of beneficiaries from remote Mandals have
accessed the scheme, which is proving the confirmed effort of
ITDA in execution of the programme. The housing schemes have
whole heartedly accepted by the tribal as well as by the public
representatives .The material benefit of the scheme is
acknowledged and reported of having far reaching implication on the
life and livelihood of the tribals of Paderu Agency Area
272
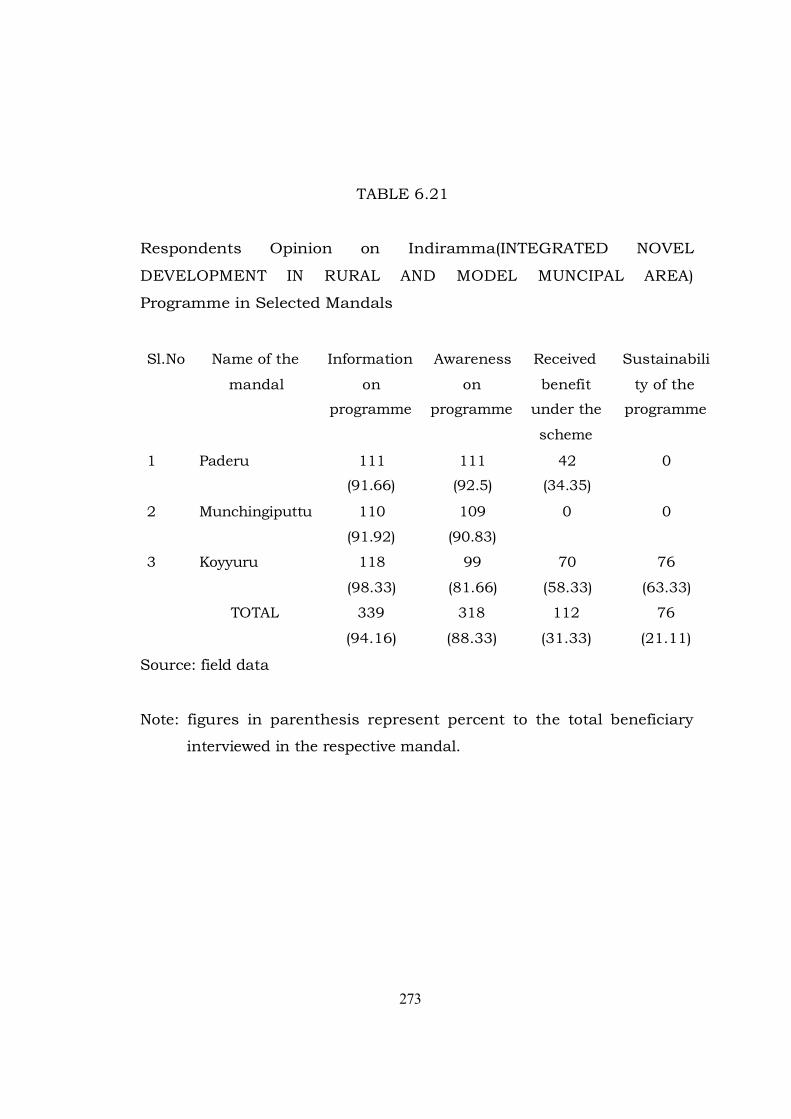
TABLE 6.21
Respondents Opinion on Indiramma(INTEGRATED NOVEL
DEVELOPMENT IN RURAL AND MODEL MUNCIPAL AREA)
Programme in Selected Mandals
Sl.No Name of the Information Awareness Received Sustainabili
mandal on on benefit ty of the
programme programme under the programme
scheme
1 Paderu 111 111 42 0
(91.66) (92.5) (34.35)
2 Munchingiputtu 110 109 0 0
(91.92) (90.83)
3 Koyyuru 118 99 70 76
(98.33) (81.66) (58.33) (63.33)
TOTAL 339 318 112 76
(94.16) (88.33) (31.33) (21.11)
Source: field data
Note: figures in parenthesis represent percent to the total beneficiary
interviewed in the respective mandal.
273

TABLE-6.22
Respondents Opinion on Housing Pattern under Indiramma
Programme in Selected Mandals
sl.
no 1
2
3
Name of the
mandal
Paderu
Munchingiputtu
Koyyuru
TOTAL
accessed
home
109
(90.8)
110
(91.66)
101
(84.16)
320
(88.88)
house type
rph spr
76 32
(63.33) (26.66)
76 34
(63.33) (28.33)
67 35
(55.83) (29.16)
219 101
(60.83) (28.05)
satisfaction level
low medium high
19 44 46
(15.8) (36.66) (38.33)
19 41 52
(15.8) (34.16) (43.33)
62 35 4
(51.66) (29.16) (3.33)
100 120 102
(36) (33.33) (28.33)
Source: field data
Note: figures in parenthesis represent percent to the total beneficiary
interviewed in the respective mandal
274
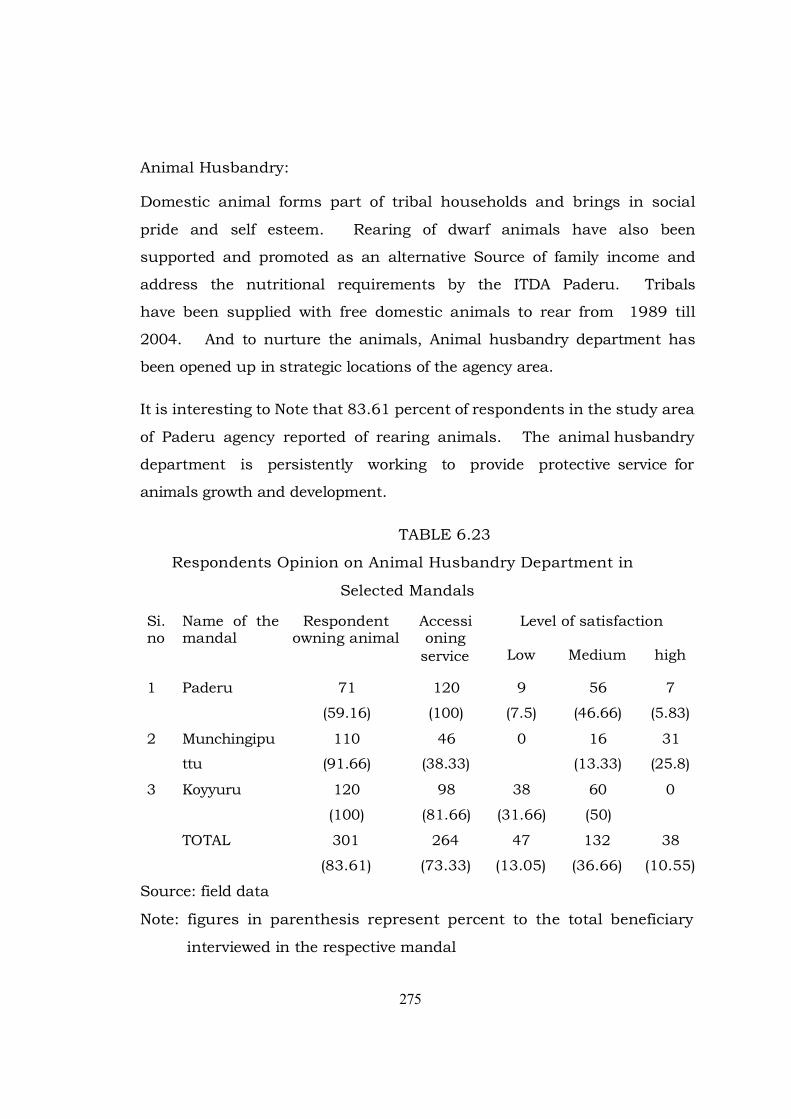
Animal Husbandry:
Domestic animal forms part of tribal households and brings in social
pride and self esteem. Rearing of dwarf animals have also been
supported and promoted as an alternative Source of family income and
address the nutritional requirements by the ITDA Paderu. Tribals
have been supplied with free domestic animals to rear from 1989 till
2004. And to nurture the animals, Animal husbandry department has
been opened up in strategic locations of the agency area.
It is interesting to Note that 83.61 percent of respondents in the study area
of Paderu agency reported of rearing animals. The animal husbandry
department is persistently working to provide protective service for
animals growth and development.
TABLE 6.23
Respondents Opinion on Animal Husbandry Department in
Selected Mandals
Si. Name of the Respondent Accessi Level of satisfaction no mandal owning animal oning
service Low Medium high
1 Paderu 71 120 9 56 7
(59.16) (100) (7.5) (46.66) (5.83)
2 Munchingipu 110 46 0 16 31
ttu (91.66) (38.33) (13.33) (25.8)
3 Koyyuru 120 98 38 60 0
(100) (81.66) (31.66) (50)
TOTAL 301 264 47 132 38
(83.61) (73.33) (13.05) (36.66) (10.55)
Source: field data
Note: figures in parenthesis represent percent to the total beneficiary
interviewed in the respective mandal
275
It is observed that around 74 per cent of beneficiaries reported to
have access the service. The satisfactory level of respondents on the animal
husbandry department is contrasting. More than 36 per cent of
beneficiaries reported of medium level of satisfaction on the Animal
Husband department, while 10.55 per cent Beneficiaries reported high level
Satisfaction (see 6.23 table)
GIRIJAN COOPERATIVE CORPORATION:
Performance of Girijan Co-operative as a commercial
organization in Agency Area is visibly observed and benefits accessed by
tribals. The DR depots in the remote and interior villages are serving
as points of food security as well as preventing exploitation. Off-season
food is generally accessed from the daily requirements depots. It also
to Note that GCC is selling the own brand products along with daily
requirements of the tribals.
Girijan Co-operative Corporation is working as a single player to
determine prices of almost all products produced in the agency area, duly
considering the prevailing market prices. In this effect, 94.72 percent of
beneficiaries stated that they are aware of the price fixation policy of GCC.
Similarity, procurement of Minor forest products is favorably opined by
91.38 percent beneficiaries. In fact, procurement of MFP is ensuring a
good remunerative price to the producer, and also making them hassle free
in disposing the MFP.
Seeking respondent’s opinion on the performance of GCC it is
observed that, 66 percent of tribal reported of medium level of
satisfaction, while 10 percent have reported full satisfaction. However,
GCC presence in Agency area and commitment to the tribal service is
visibly observed and appreciated (see table: 6.24).
276

TABLE-6.24
Respondents Opinion on Performance of Girijan Co-Operative
Corporation in Selected Mandals
SL. NAME OF THE MFP Procurement Performance of GCC
NO MANDAL price of MFP low medium high
fixation
1 Paderu 109 109 0 109 0
(90.83) (90.83) (90.83)
2 Munchingiputtu 112 100 0 40 17
(93.94) (83.33) (33.33) (14.16)
3 Koyyuru 120 120 4 89 19
(100) (100) (3.33) (74.16) (15.83)
TOTAL 341 329 4 238 36
(94.72) (91.38) (1.11) (66.11) (10.0)
Source: field data
Note: figures in brackets represent percent to the total beneficiary
interviewed in the respective mandal.
277

TABLE-6.25
Views of the Respondents on the Usefulness of ITDA
S.no Extent of usefulness No. of house holds
01 Highly useful 64
(17.78) 02 Moderately useful 177
(49.17)
03 Useful to limited extent 96
(26.67)
04 Can’t say 23
(6.38) TOTAL 360
(100)
Note: figures in brackets represent percentage to the total respondents
278

TABLE-6.26
Views of Respondents on the Usefulness of Different
Schemes
Sl.Mo Scheme Useful Not useful No TOTAL
No. of No. of Opinion
Respondents Respondents
01 Agricultural 248 97 15 360
schemes (68.88) (26.95) (4.17) (100)
02 Milchcattle 220 119 21 360
(61.12) (33.04) (5.84) (100)
03 sericulture 148 180 32 360
(41.11) (50) (8.89) (100)
04 sheep units & 114 205 41 360
poultry (31.66) (56.96) (11.38) (100)
05 self employment 85 218 57 360
(23.62) (60.55) (15.83) (100)
Note: figures in brackets represent percentage to the total
respondents
An examination of the views of the households on the usefulness of the
ITDA exposed that a majority of households constituting 67 per cent of
the sample households considered that the ITDA is a useful agency
which is helping them in several ways for their upliftment. Schemes -
wise analysis reveals that the agricultural schemes are considered as
279
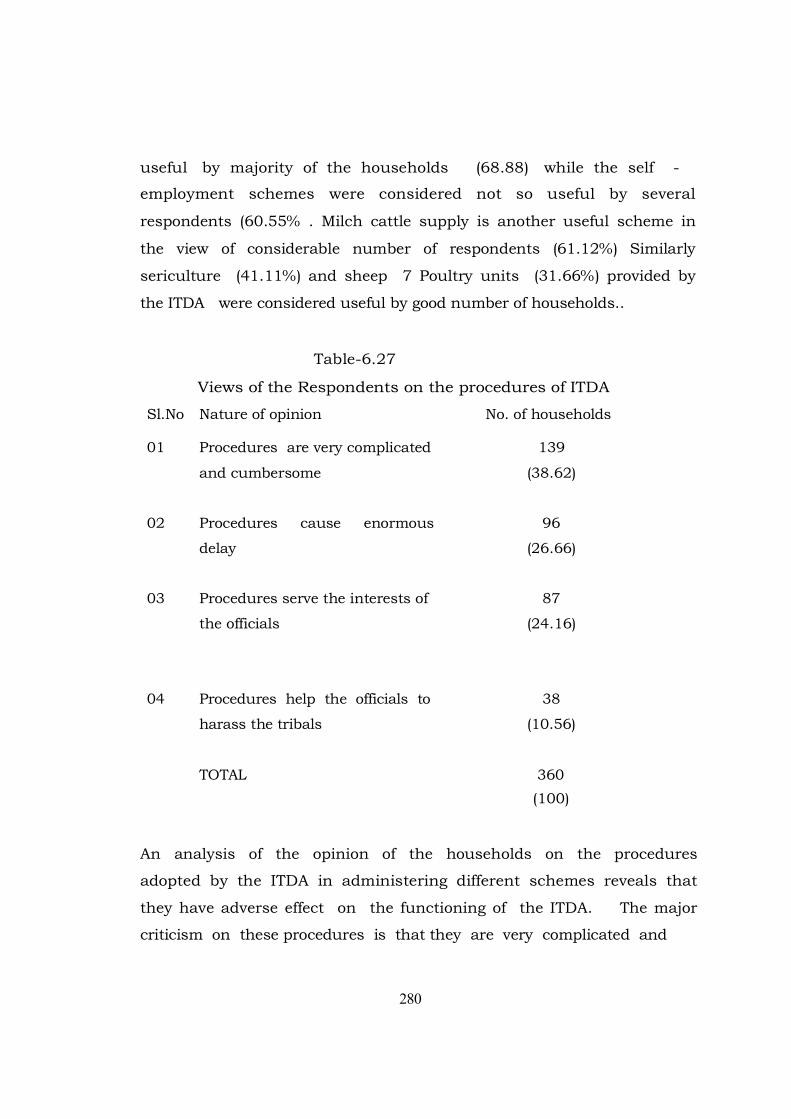
useful by majority of the households (68.88) while the self -
employment schemes were considered not so useful by several
respondents (60.55% . Milch cattle supply is another useful scheme in
the view of considerable number of respondents (61.12%) Similarly
sericulture (41.11%) and sheep 7 Poultry units (31.66%) provided by
the ITDA were considered useful by good number of households..
Table-6.27
Views of the Respondents on the procedures of ITDA
Sl.No Nature of opinion No. of households
01 Procedures are very complicated 139
and cumbersome (38.62)
02 Procedures cause enormous 96
delay (26.66)
03 Procedures serve the interests of 87
the officials (24.16)
04 Procedures help the officials to 38
harass the tribals (10.56)
TOTAL 360
(100)
An analysis of the opinion of the households on the procedures
adopted by the ITDA in administering different schemes reveals that
they have adverse effect on the functioning of the ITDA. The major
criticism on these procedures is that they are very complicated and
280

hence they are difficult to understand and follow. Thus the procedures
followed by the ITDA became dysfunctional and reduced the
effectiveness of the ITDA in serving the simple minded tribals. They have
also responsible for the low image of the ITDA among the households.
Like the procedures, the officials of the ITDA are also came under
the sharp criticism of the sample households. Only 28 per cent of the
households expressed a positive view on these officials. The remaining
households are dissatisfied with these officials for their impolite
behavior officials is yet another factor responsible for the low image of the
ITDA.
Table-6.28
Views of the Respondents on Officials of ITDA
Sl.No Views No. households
01 Officials are sincere and duty minded 103
(28.62)
02 87
Officials are dishonest (24.16)
03 04 76
Officials are impolite and harass the tribals (21.12)
05 Officials are friendly and helpful 65
(18.05) No opinion 29
(8.05)
TOTAL 360
(100)
281

Like the procedures, the officials of the ITDA also come under the
sharp criticism of the sample households. Only 28 per cent of the
households expressed a positive view on these officials. The remaining
households are dissatisfied with these officials for their impolite
behavior officials is yet another factor responsible for the low image of
the ITDA.
TABLE-6.29
Problems of the Households in Dealing with the ITDA
S.NO Problem No .of households
01 Prescribed procedures are complicated 159
and difficult to follow (44.16)
02 03 There is enormous delay in the 115
sanctioning of assistance (31.95)
04
The officials are indifferent and non co- 58
operative (16.12)
The head office of the ITDA is located at a 28
distant place (7.77)
TOTAL 360
(100)
Besides these two factors, these are several other problems confronted
by the households while dealing with the ITDA. the study reveals that
there is lot of delay in the supply of inputs of sanction of schemes by
the ITDA. The distance between the headquarters and the tribal village
282
has also become a problem to the households while dealing with the ITDA.
Besides these two factors, these are several other problems confronted
by the households while dealing with the ITDA. The study reveals that
there is lot of delay in the supply of inputs of sanction of schemes by
the ITDA. the distance between the headquarters and the tribal village
has also become a problem to the households while dealing with the
ITDA.
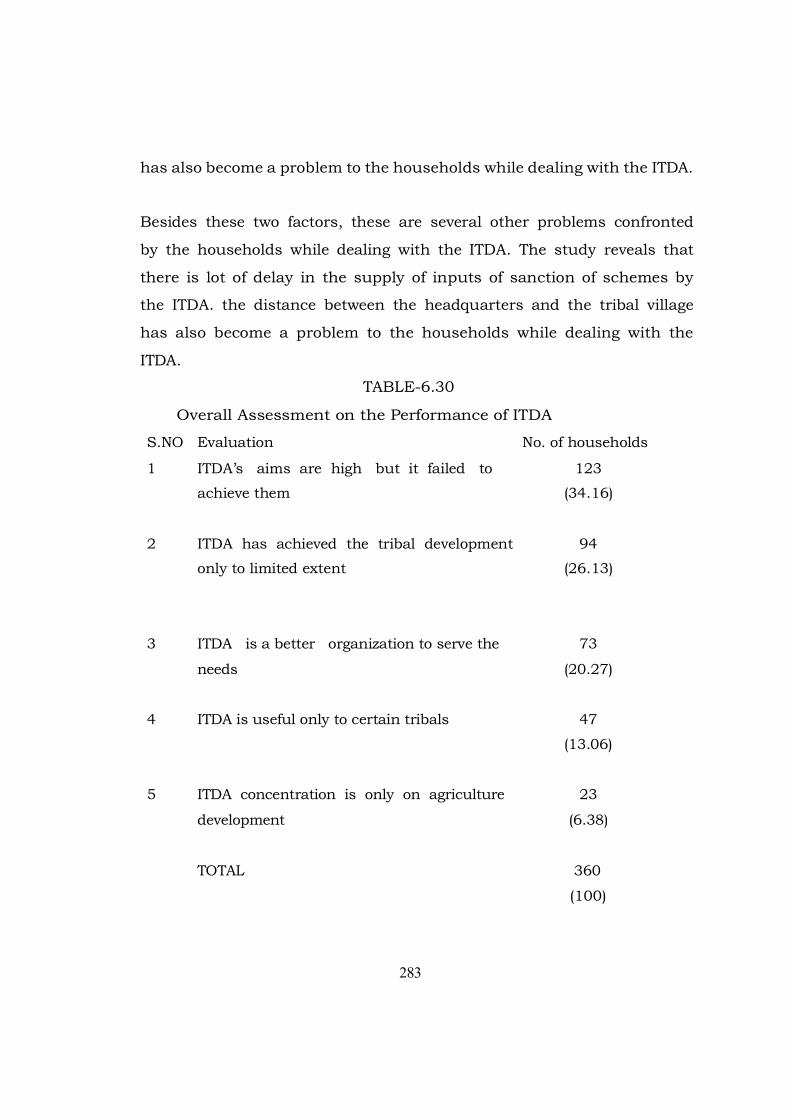
TABLE-6.30
Overall Assessment on the Performance of ITDA
S.NO Evaluation No. of households
1 ITDA’s aims are high but it failed to 123
achieve them (34.16) 2 ITDA has achieved the tribal development 94
only to limited extent (26.13)
3 ITDA is a better organization to serve the 73
needs (20.27)
4 ITDA is useful only to certain tribals 47
(13.06)
5 ITDA concentration is only on agriculture 23
development (6.38)
TOTAL 360
(100)
283

An examination of the views expressed by the households on the
services of ITDA reflects that the households are with the opinion that
the ITDA has succeeded only to a limited extent in achieving the
development of tribals which is its main objective. Further, they feel
that the ITDA is concentrating mainly on, agricultural sector and
paying little attention on other sector and at the same time its benefits
are reaped by only a limited number of tribals who are politically
influential and economically better off than other Tribals.
To sum up, thus the field data suggests that ITDA which is the
main instrument of tribal development has achieved only partial
success in achieving its goal of tribal development. In spite of the claim
made by the official agencies, the ITDA is not functioning efficiently
because of the various defects inherent in its delivery system. Mainly
its bureaucratic nature has become a great hurdle on the way of its
efficient functioning. After carrying out a comprehensive study to
assess the implementation of policies, programmes and schemes by
the ITDA Paderu intended for the socio-economic development and
sustainable empowerment of the Tribals, the researcher has
summarized the study and presented the findings derived from the
observations made as well as the suggestions in the final chapter, i.e.
chapter-VII.
284