CHAPTER – VI - Shodhgangashodhganga.inflibnet.ac.in/bitstream/10603/56374/13/13_chapter 6.pdfTypes...
55
274 CHAPTER – VI NON-PERFORMING ASSETS OF SCBs – AN ANALYSIS The economic reforms initiated in 1991 by the then Finance minister and present Prime Minister Dr.Manmohan Singh would have been remained incomplete without the overhaul of the Indian banking sector. The Narasimham committee reports (First report) recommendations are the basis for initiation of the process, which is still continuing, though many of the sick banks are able to come out of the red after repeated doses of fund infusion. But a few of the banks are still in the red and efforts are on to resuscitate them. The bigger challenge at the momentous to deal with the worsening financial health of the banking sector. The important financial institutions like Industrial Finance Corporation of India (IFCI) and Industrial Development Bank of India (IDBI) are also not in the pink of health, which require government support for revitalising themselves. The important aspect of the banking sector reforms is relating to liberalisation of norms and guidelines for making the whole sector vibrant and competitive. This was a gradual process undertaken with utmost care and least it should disrupt the banking sector. Slowly the Reserve Bank of India (RBI) has freed the interest rate, but marginally increased now, both on the deposit and lending spectrums at present. Simultaneously it has relaxed the Cash Reserve Ratio (CRR) and Statutory Liquidity Ratio (SLR) and also unlocking more and more funds in the financial markets. On the deposit side, the bank is free to offer any rate of interest depending upon their asset – liability position. But the RBI regulates the savings rate. Similarly the banks can charge the flexible rate on lending operations depending upon their risk perception. It is futile to say that there are no controls but they are much lesser as compared to the controls that was existed before the initiation of banking reforms. The other vibrant dimension of the banking sector is to reduce the Non-performing assets (NPA). During 1980 to 1996, there was a crisis in the banking sector World over. According to a study 73 percent of the member countries of the International Monetary Fund (IMF) have experienced serious banking problems but most of these member countries are developing nations only. One of the prominent reasons for the
Transcript of CHAPTER – VI - Shodhgangashodhganga.inflibnet.ac.in/bitstream/10603/56374/13/13_chapter 6.pdfTypes...
274
CHAPTER – VI
NON-PERFORMING ASSETS OF SCBs – AN ANALYSIS
The economic reforms initiated in 1991 by the then Finance minister and
present Prime Minister Dr.Manmohan Singh would have been remained incomplete
without the overhaul of the Indian banking sector. The Narasimham committee reports
(First report) recommendations are the basis for initiation of the process, which is still
continuing, though many of the sick banks are able to come out of the red after
repeated doses of fund infusion. But a few of the banks are still in the red and efforts
are on to resuscitate them. The bigger challenge at the momentous to deal with the
worsening financial health of the banking sector.
The important financial institutions like Industrial Finance Corporation of
India (IFCI) and Industrial Development Bank of India (IDBI) are also not in the pink
of health, which require government support for revitalising themselves. The
important aspect of the banking sector reforms is relating to liberalisation of norms
and guidelines for making the whole sector vibrant and competitive. This was a
gradual process undertaken with utmost care and least it should disrupt the banking
sector.
Slowly the Reserve Bank of India (RBI) has freed the interest rate, but
marginally increased now, both on the deposit and lending spectrums at present.
Simultaneously it has relaxed the Cash Reserve Ratio (CRR) and Statutory Liquidity
Ratio (SLR) and also unlocking more and more funds in the financial markets. On the
deposit side, the bank is free to offer any rate of interest depending upon their asset –
liability position. But the RBI regulates the savings rate. Similarly the banks can
charge the flexible rate on lending operations depending upon their risk perception. It
is futile to say that there are no controls but they are much lesser as compared to the
controls that was existed before the initiation of banking reforms. The other vibrant
dimension of the banking sector is to reduce the Non-performing assets (NPA).
During 1980 to 1996, there was a crisis in the banking sector World over.
According to a study 73 percent of the member countries of the International
Monetary Fund (IMF) have experienced serious banking problems but most of these
member countries are developing nations only. One of the prominent reasons for the
275
crisis is building up of Non-Performing Assets in the banking and financial sector.
India has also experienced the problem of raising NPA.
Apart from compromise on object credit assessment of borrowers due to
political economy considerations, laxities in legal system, accounting disclosure
practices, recession and willful default have lead to the accumulation of NPA.
Growth and Structural Changes in Banking Sector:
In order to have proper understanding of NPA menace, it is necessary to have
brief idea of growth and structural changes that have taken place in the banking
sector. The growth of the banking business can be assessed in five phases.
Preliminary phase: Series of births and deaths of banks in the first five
decades of twentieth Century.
Business phase: Laying of solid and sound foundation for banking business
which was taken place between 1949 and 1969 by enacting Banking
Companies’ Regulation Act 1949.
Branching out phase (1969 to 1985): When 19 major commercial banks
were nationalized in two phases and these banks have reached larger mass of
population through opening of branches and lead bank schemes.
Consolidation phase: During this phase (1985 –1991) weaknesses and
defects of mass branching were identified and attended through various
committees’ investigation.
Reforms and strengthening stage (1991 to till date): In fact first dose of
reforms started with Narasimham Committee report in 1991. Subsequently
there were series of reforms in SLR, CRR, new norms of assets classification
(NPA) and provisioning of capital adequacy norms, permission for entry of
new generation private banks and foreign banks regulation of interest rate,
setting up of Debt Recovery Tribunals and passage of Securitization and
Reconstruction of Financial Assets and Enforcement of Security Interest Act
(SARFAESI) 2002.
Banking Risks:
The problem of losses or lower profitability of NPAs, assets and liability
mismatch in banks and financial sector depend on the following risks are managed in
their businesses.

276
a) Credit risk
b) Interest rate risk
c) Exchange rate risk
d) Liquidity risk
e) Transfer risk
f) Operational risk
g) Market risk
h) Settlement risk
i) Counter partyrisk and
j) Country risks.
What is NPA?
NPA. The three letter Strike terror in banking sector and business circle today.
NPA is short form of “Non-Performing Asset”. The dreaded NPA rule says simply
this: when interest or other due to a bank remains unpaid for more than 90 days, the
entire bank loan automatically turns a non-performing asset. The recovery of loan has
always been problem for banks and financial institution. To come out of these first we
need to think is it possible to avoid NPA, no cannot be then left is to look after the
factor responsible for it and managing those factors.
Definitions
An asset, including a leased asset, becomes non-performing when it ceases to
generate income for the bank.
A ‘non-performing asset’ (NPA) was defined as a credit facility in respect of
which the interest and/or installment of principal has remained ‘past due’ for a
specified period of time.
With a view to moving towards, international best practices and to ensure
greater transparency, it has been decided to adopt the ‘90 days’overdue’ norm for
identification of NPAs, from the year ending March 31, 2004. Accordingly, with effect
from March 31, 2004, a non-performing asset (NPA) shall be a loan or an advance
where;
Interest and/or installment of principal remain overdue for a period of more
than 90 days in respect of a term loan,
277
The account remains ‘out of order’ for a period of more than 90 days, in
respect of Overdraft/Cash Credit (OD/CC),
The bill remains overdue for a period of more than 90 days in the case of
bills purchased and discounted,
Interest and/or installment of principal remains overdue for two harvest
seasons but for a period not exceeding two half years in the case of an
advance granted for agricultural purposes.
As a facilitating measure for smooth transition to 90 days norm, banks have
been advised to move over to charging of interest at monthly rests, by April 1, 2002.
However, the date of classification of an advance as NPA should not be changed on
account of charging of interest at monthly rests. Banks should, therefore, continue to
classify an account as NPA only if the interest charged during any quarter is not
serviced fully within 180 days from the end of the quarter with effect from April 1,
2002 and 90 days from the end of the quarter with effect from March 31, 2004.
NPAs: An Issue for Banks and FIs in India
To start with, performance in terms of profitability is a benchmark for any
business enterprise including the banking industry. However, increasing NPAs have a
direct impact on banks profitability as legally banks are not allowed to book income
on such accounts and at the sometime are forced to make provision on such assets as
per the RBI guidelines. Also, with increasing deposits made by the public in the
banking system, the banking industry cannot afford defaults by borrower since NPAs
affects the repayment capacity of banks.
Further, RBI successfully creates excess liquidity in the system through
various rate cuts and banks fail to utilise this benefit to its advantage due to the tear of
burgeoning non-performing assets.
Indian Economy and NPAs
Undoubtedly the world economy has slowed down, recession is at its peak,
globally stock markets have tumbled and business itself is getting hard to do. The
Indian economy has been much affected due to high fiscal deficit, poor infrastructure
facilities, sticky legal system, cutting of exposures to emerging markets by FIs, etc.
Further, international rating agencies like, Standard & Poor have lowered
India’s credit rating to sub-investment grade. Such negative aspects have often
278
outweighed positives such as increasing forex reserves and a manageable inflation
rate.
Under such a situation, it goes without saying that banks are no exception and
are bound to face the heat of a global downturn. One would be surprised to know that
the banks and financial institution in India hold non-performing assets worth Rs.
110000 crores . Bankers have realised that unless the level of NPAs is reduced
drastically, they will find it difficult to survive.
Global Developments and NPAs
The core banking business is of mobilising the deposits and utilising it for
lending to industry. Lending business is generally encouraged because it has the effect
of funds being transferred from the system to productive purposes, which results into
economic growth.
However, lending also carries credit risk, which arises from the failure of
borrower to fulfill its contractual obligations either during the course of a transaction
or on a future obligation.
A question that arises is how much risk can a bank afford to take? Recent
happenings in the business world – Enron, WorldCom, Xerox. Global Crossing do not
give much confidence to banks. In case after case, these giant corporate become
bankrupt and failed to provide investors with clearer and more complete information
thereby introducing a degree of risk that many investors could neither anticipate nor
welcome. The history of financial institutions also reveals the fact that the biggest
banking failures were due to credit risk. Due to this, banks are restricting their lending
operations to secured avenues only with adequate collateral on which to fall back
upon in a situation of default.
Problems Due to NPA
1. Owners do not receive a market return on their capital in the worst case, if
the banks fails, owners lose their assets. In modern times this may affect a
broad pool of shareholders.
2. Depositors do not receive a market return on saving. In the worst case if
the bank fails, depositors lose their assets or uninsured balance.
279
3. Banks redistribute losses to other borrowers by charging higher interest
rates, lower deposit rates and higher lending rates repress saving and
financial market, which hamper economic growth.
4. Non-performing loans epitomise bad investment. They misallocate credit
from good projects, which do not receive funding, to failed projects. Bad
investment ends up in misallocation of capital, and by extension, labour
and natural resources.
Non-performing asset may spill over the banking system and contract the money
stock, which may lead to economic contraction. This spillover effect can channelise
through liquidity or bank insolvency:
a) When many borrowers fail to pay interest, banks may experience
liquidity shortage. This can jam payment across the country.
b) Liquidity constraints bank in paying depositors
c) Undercapitalised banks exceed the bank’s capital base.
‘Out of order’ status
An account should be treated as ‘out of order’ if the outstanding balance
remains continuously in excess of the sanctioned limit/drawing power. In cases where
the outstanding balance in the principal operating account is less than the sanctioned
limit/drawing power, but there are no credits continuously for six months as on the
date of Balance Sheet or credits are not enough to cover the interest debited during the
same period, these accounts should be treated as ‘out of order’.
‘Overdue’
Any amount due to the bank under any credit facility is ‘overdue’ if it is not
paid on the due date fixed by the bank.
Types of NPA
Gross and Net NPA
Gross NPAs are the sum total of all loan assets that are classified as NPAs as
per RBI guidelines as on Balance Sheet date. Gross NPA reflects the quality of the
loans made by banks. It consists of all the non-standard assets like as sub-standard,
doubtful and loss assets.
It can be calculated with the help of following formula:
280
Gross NPAs Gross NPA Ratio = -------------------- Gross Advances Net NPAs are those type of NPAs in which the bank has deducted the
provision regarding NPAs. Net NPA shows the actual burden of banks. Since in
India, bank balance sheets contain a huge amount of NPAs and the process of
recovery and write off loans is very time consuming, the provisions the banks have to
make against the NPAs according to the central bank guidelines, are quite significant.
That is why the difference between gross and net NPA is quite high.
It can be calculated by following formula
Gross NPAs – Provisions Net NPA Ratio = ---------------------------------- Gross Advances - Provisions
Classification of Loans
Term Loans
A term loan account is to be treated as NPA as on balance sheet date if interest
or loan installment remains overdue for a period of:
Four quarters during the year ending 31st March 1993 (or)
Three quarters during the year ending 31st March 1994 (or)
More than 180 days during the year ending 31st March 1995-2003 and
More than 90 days during the year ending 31st March 2004 onwards.
Due Date
Due date is the ultimate date fixed or stipulated in the loan sanction letter for
repayment of loan installment or interest. In all term loans, at the time of original
sanction and at the time of re-schedulement, a repayment schedule is stipulated
indicating the due date for payment of interest and installment with or without any
moratorium period. The basis of installment fixation also varies depending on he
nature of estimated cash generation in the business. The periodicity of installment
repayment may be monthly, quarterly, half yearly, or yearly, beyond the moratorium
period, where provided. The quantum of installment may be equated, where the
interest component is included into the installment itself, or it may be principal
installment plus interest component.
281
Cash Credit/Overdraft Accounts
A running account such as cash credit or overdraft account is to be treated as
NPA if the account remains out of order for a period of four quarters during the year
ending 31st March 1993, three quarters during the year ending 31st March, 1994, two
quarters during the year ending 31st March, 199-2003 and one quarter with a view to
move towards international best practices and to ensure greater transparency from the
year ending 31st March, 2004.
Out of Order
An account should be treated as “out of order’:
(a) If the outstanding balance remains continuously in excess of the
sanctioned limit or drawing power (temporary deficiencies are not to be
considered);
(b) In cases where the outstanding balance in the principal operating account
is less than the sanctioned limit/drawing power, but there are no credit
continuously for the stipulated period; or
(c) Credits are not enough to cover the interest debited during the same
period.
Bills Purchased/Discounted Accounts
The bills purchased/discounted account is to be treated as NPA if the bill
remains overdue and unpaid for a period of 4 quarters during the year ending 31st
March, 1993, three quarters during the year ending 31st March, 1994, two quarters
between the years ending 31st March, 199 to 31st March, 2003 and one quarter during
the year ending 31st March, 2004 onward. Due dates of the bills purchased/discounted
should be ascertained as per accepted norms. Overdue
Any amount due to the bank under any credit facility is ‘overdue’ if it is not
paid on the due date fixed by the bank. Other Credit Facilities
Any other credit facilities should be treated as NPA if any amount to be
received in respect of that facility remains over due date for a period of four quarters
during the year ending 31st March, 1993, three quarters during the year ending 31st
March, 1994, two quarters from 31st March, 1995 to 31st March, 2003 and one quarter
282
from 31st March, 2004 onwards, in line with and international best practices and to
ensure greater transparency. The following action plan was interacted by banks, over a
period of time, for an appropriate transition path to the 90-day norm:
Banks moved over to charging of interest at monthly rates, from April 2002.
However, banks continued to classify an account as NPA only if the interest
charged during any quarter was not serviced fully within 180 days from the
end of the quarter with effect from April 1, 1995.
Banks commenced making additional provisions for such loans, starting
from the year ending March 31, 2002, which strengthened the balance sheet
and ensured smooth transition to the 90 days norms by March 31, 2004.
Banks gradually enhanced provisioning requirements and voluntarily
adopted practices of making provisions much above the minimum prudential
levels.
Since banks were making additional provision starting from March 31, 2002 to absorb
the impact due to reduction of the NPA period. Special emphasis was given to identify
the accounts that may turn NPA with 90 days period norm and 10 per cent additional
provision was made over a period of three years starting from the year 2001-02.
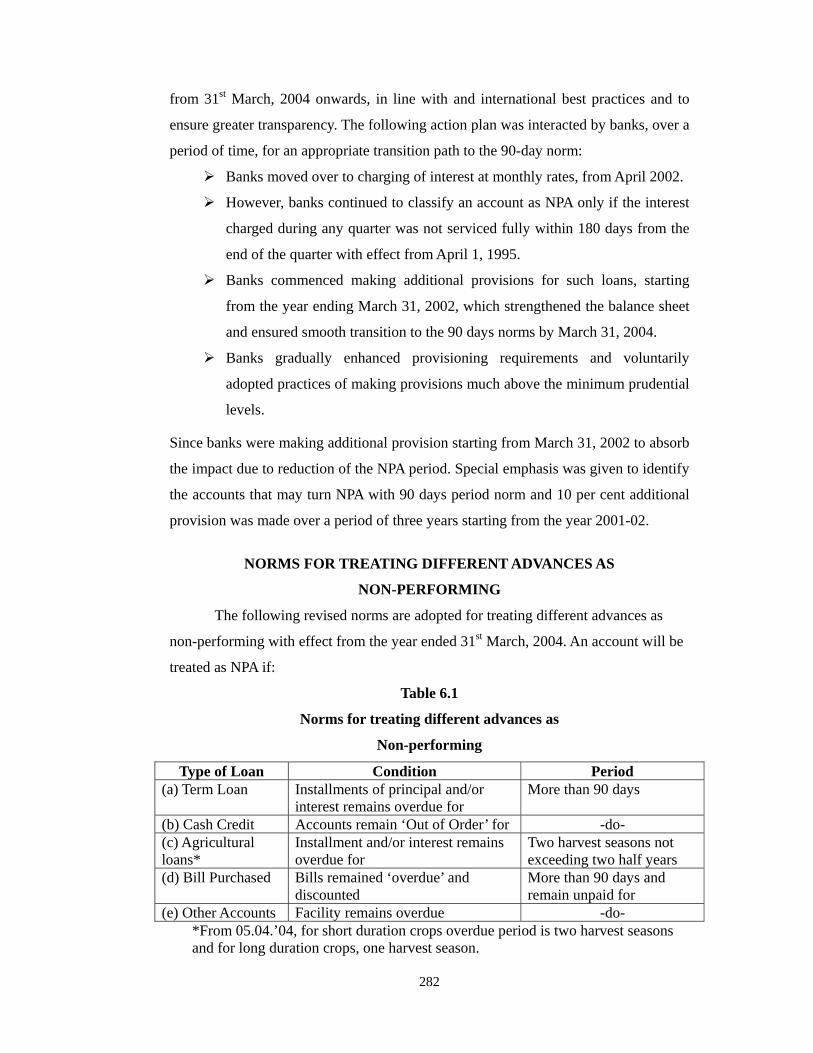
NORMS FOR TREATING DIFFERENT ADVANCES AS
NON-PERFORMING
The following revised norms are adopted for treating different advances as
non-performing with effect from the year ended 31st March, 2004. An account will be
treated as NPA if:
Table 6.1
Norms for treating different advances as
Non-performing
Type of Loan Condition Period (a) Term Loan Installments of principal and/or
interest remains overdue for More than 90 days
(b) Cash Credit Accounts remain ‘Out of Order’ for -do- (c) Agricultural loans*
Installment and/or interest remains overdue for
Two harvest seasons not exceeding two half years
(d) Bill Purchased Bills remained ‘overdue’ and discounted
More than 90 days and remain unpaid for
(e) Other Accounts Facility remains overdue -do- *From 05.04.’04, for short duration crops overdue period is two harvest seasons and for long duration crops, one harvest season.
283
Prudential Accounting Norms Prior to the financial sector reforms in the year 1992-’93, banks used to debit
interest to the loan account on accrual basis and recognised the same as income even
in accounts with prior record of recovery. Recognising income on accrual basis in
account where the realisation is in doubt is not a prudential practice. As per the
recommendation of the Narasimham Committee, as stated earlier, the RBI introduced
prudential accounting norms applicable from the financial year 1992-’93, interest is
not to be debited on the accrual basis but on the cash basis. The prudential accounting
norms are based on the N.P.A concept, N for No income, P for provisioning and A
for asset classification. The prudential accounting norms comprise of the following:
1. Income recognition
2. Asset classification
3. Provisioning.
INCOME RECOGNITION
Income Recognition Policy
The policy of income recognition has to be objective and based on the record
of recovery. Internationally income from nonperforming assets (NPA) is not
recognised on accrual basis but is booked as income only when it is actually received.
Therefore, the banks should not charge and take to income account interest on any
NPA.
However, interest on advances against term deposits, NSCs, IVPs, KVPs and
Life policies may be taken to income account on the due date, provided adequate
margin is available in the accounts.
(a) Fees and commissions earned by the banks as a result of renegotiations or
rescheduling of outstanding debts should be recognised on an accrual basis over the
period of time covered by the renegotiated or rescheduled extension of credit.
(b) If Government guaranteed advances become NPA, the interest on such
advances should not be taken to income account unless the interest has been realised.
Reversal of Income
If any advance, including bills purchased and discounted, becomes NPA as at
the close of any year, interest accrued and credited to income account in the
284
corresponding previous year, should be reversed or provided for if the same is not
realized. This will apply to Government guaranteed accounts also.
In respect of NPAs, fees, commission and similar income that have accrued
should cease to accrued in the current period and should be reversed or provided for
with respect to past periods, if uncollected.
Leased Assets
The net lease rentals (finance charge) on the leased asset accrued and credited
to income account before the asset became non-performing, and remaining unrealized,
should be reversed or provided for in the current accounting period.
The term ‘net lease rentals’ would mean the amount of financial charge taken
to the credit of Profit & Loss Account and would be worked out as gross lease rentals
adjusted by amount of statutory depreciation and lease equalization account.
As per the ‘Guidance Note on Accounting for Leases’ issued by the Council
of the Institute of Chartered Accountants of India (ICAI), a separate Lease
Equalisation Account should be opened by the banks with a corresponding debit or
credit to Lease Adjustment Account, as the case may be. Further, Lease Equalisation
Account should be transferred every year to the Profit & Loss Account and disclosed
separately as a deduction from/addition to gross value of lease rentals shown under
the head ‘Gross Income’.
Appropriation of recovery in NPAs
Interest realised on NPAs may be taken into income account provided the
credits in the accounts towards interest are not out of fresh/additional credit facilities
sanctioned to the borrower concerned.
In the absence of a clear agreement between the bank and the borrower for the
purpose of appropriation of recoveries in NPAs (i.e. towards principal or interest due),
banks should adopt an accounting principle and exercise the right of appropriation of
recoveries in a uniform and consistent manner.
Interest Application
There is no objection to the banks using their own discretion in debiting
interest to an NPA account taking the same to Interest Suspense Account or
maintaining only a record of such interest in proforma accounts.
285
Reporting of NPAs
Banks are required to furnish a Report on NPAs as on 31st March each year
after completion of audit. The NPAs would relate to the banks’ global portfolio,
including the advances at the foreign branches. The Report should be furnished as the
per the prescribed format.
While reporting NPA figures to RBI, the amount held in interest suspense
account, should be shown as a deduction from gross NPAs as well gross advances
while arriving at the net NPAs. Banks who does not maintain Interest Suspense
Account for parking interest due on non-performing advance accounts, may furnish
the amount of interest receivable on NPAs as a foot note to the Report.
Whenever NPAs are reported to RBI, the amount of technical write off, if any,
should be reduced from the outstanding gross advances and gross NPAs to eliminate
any distortion in the quantum of NPAs being reported.
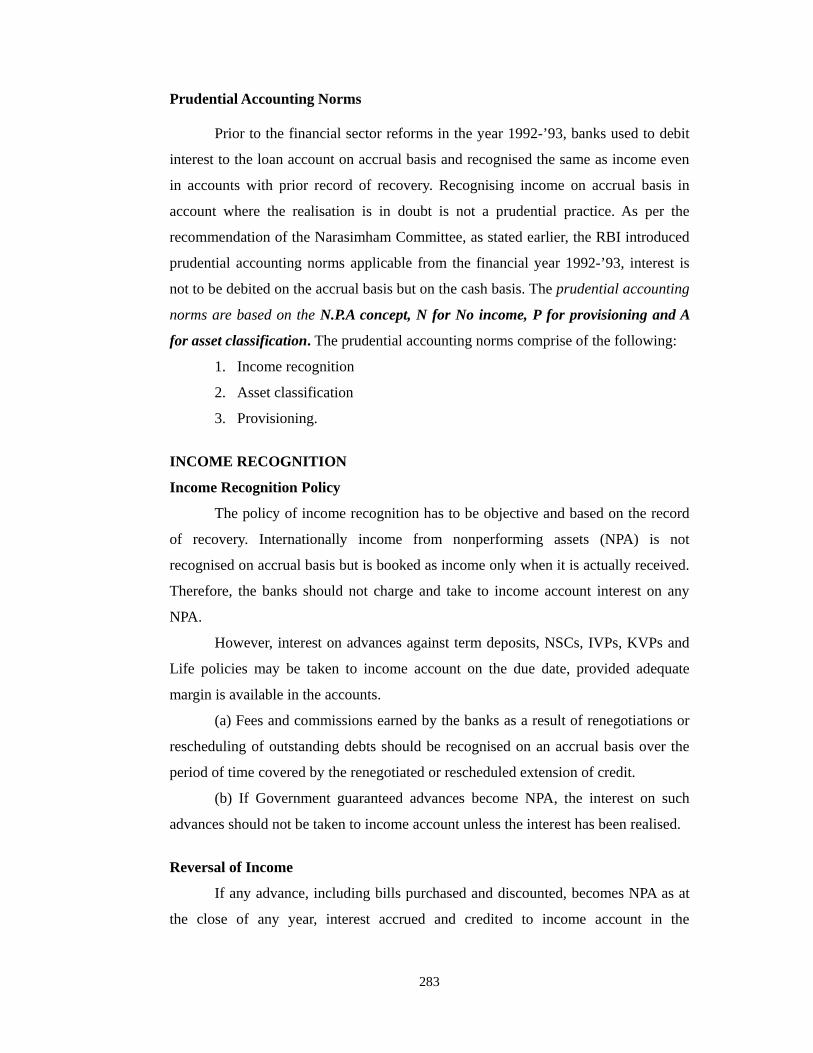
Reporting Format for NPA – Gross and Net NPA
Particulars
1. Gross Advanced*
2. Gross NPA
3. Gross NPA as Percentage of Gross Advances
4. Total Deduction (a+b+c+d)
a) Balance in Interest Suspense Account
b) DICGC/ECGC claims received and held pending adjustment.
c) Part Payment Received and kept in Suspense account
d) Total Provision held***
5. Net Advanced (1-4)
6. Net NPA (2-4)
7. Net NPA as a percentage of Net Advances.
*Excluding Technical Write-off of Rs.------------- crore.
** Banks which do not maintain an interest suspense account to park the accrued
interest on NPAs may furnish the amount of interest receivable on NPAs.
***Excluding amount of Technical Write-off (Rs.-------- crore) and provision on
standard assets. (Rs. ----------crore).
286
ASSET CLASSIFICATION
Categories of NPAs
Banks are required to classify nonperforming assets further into the following
three categories based on the period for which the asset has remained nonperforming
and the reliability of the dues:
i Substandard Assets
ii Doubtful Assets
iii Loss Assets
Substandard Assets With effect from 31 March 2005, a substandard asset
would be one, which has remained NPA for a period less than or equal to 12 months.
In such cases, the current net worth of the borrower/ guarantor or the current market
value of the security charged is not enough to ensure recovery of the dues to the banks
in full. In other words, such an asset will have well defined credit weaknesses that
jeopardise the liquidation of the debt and are characterised by the distinct possibility
that the banks will sustain some loss, if deficiencies are not corrected.
Doubtful Assets With effect from March 31, 2005, an asset would be
classified as doubtful if it has remained in the substandard category for a period of 12
months. A loan classified as doubtful has all the weaknesses inherent in assets that
were classified as sub-standard, with the added characteristic that the weaknesses
make collection or liquidation in full, – on the basis of currently known facts,
conditions and values – highly questionable and improbable.
Loss Assets a loss asset is one where loss has been identified by the bank or
internal or external auditors or the RBI inspection but the amount has not been written
off wholly. In other words, such an asset is considered uncollectible and of such little
value that its continuance as a bankable asset is not warranted although there may be
some salvage or recovery value.
287
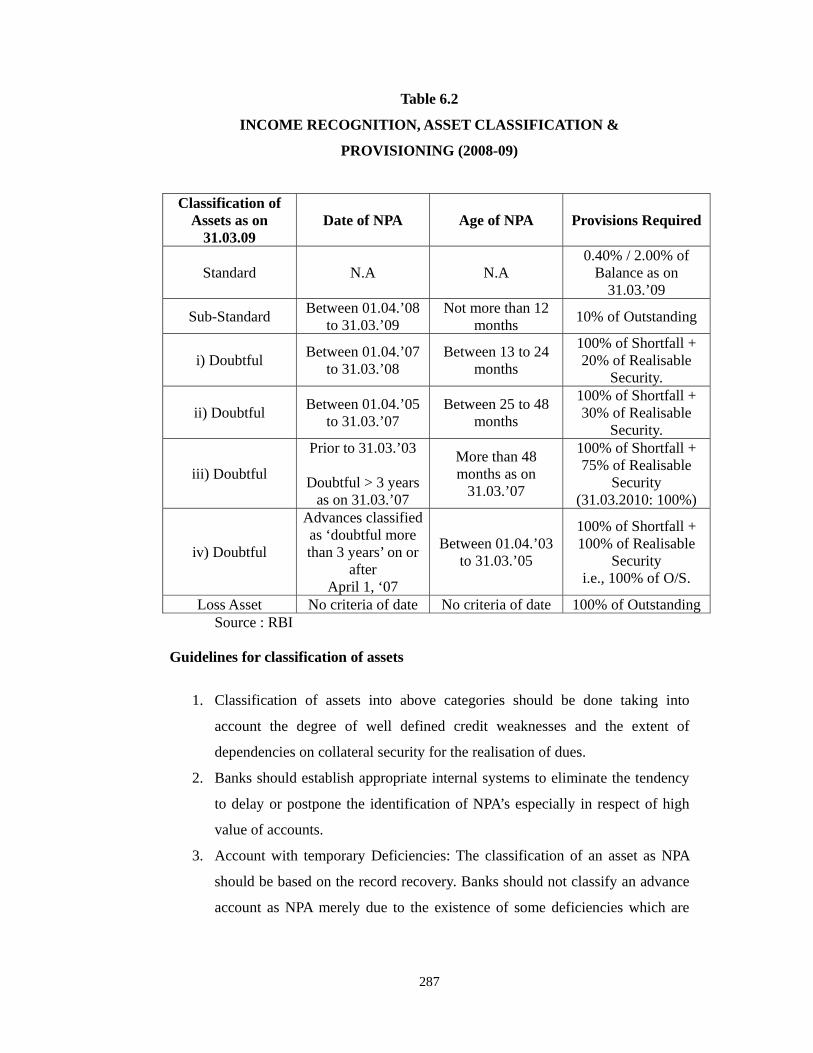
Table 6.2
INCOME RECOGNITION, ASSET CLASSIFICATION &
PROVISIONING (2008-09)
Classification of Assets as on
31.03.09 Date of NPA Age of NPA Provisions Required
Standard N.A N.A 0.40% / 2.00% of
Balance as on 31.03.’09
Sub-Standard Between 01.04.’08 to 31.03.’09
Not more than 12 months 10% of Outstanding
i) Doubtful Between 01.04.’07 to 31.03.’08
Between 13 to 24 months
100% of Shortfall + 20% of Realisable
Security.
ii) Doubtful Between 01.04.’05 to 31.03.’07
Between 25 to 48 months
100% of Shortfall + 30% of Realisable
Security.
iii) Doubtful
Prior to 31.03.’03
Doubtful > 3 years as on 31.03.’07
More than 48 months as on
31.03.’07
100% of Shortfall + 75% of Realisable
Security (31.03.2010: 100%)
iv) Doubtful
Advances classified as ‘doubtful more than 3 years’ on or
after April 1, ‘07
Between 01.04.’03 to 31.03.’05
100% of Shortfall + 100% of Realisable
Security i.e., 100% of O/S.
Loss Asset No criteria of date No criteria of date 100% of Outstanding Source : RBI
Guidelines for classification of assets
1. Classification of assets into above categories should be done taking into
account the degree of well defined credit weaknesses and the extent of
dependencies on collateral security for the realisation of dues.
2. Banks should establish appropriate internal systems to eliminate the tendency
to delay or postpone the identification of NPA’s especially in respect of high
value of accounts.
3. Account with temporary Deficiencies: The classification of an asset as NPA
should be based on the record recovery. Banks should not classify an advance
account as NPA merely due to the existence of some deficiencies which are
288
temporary in nature as such as non-availability of adequate drawing power
based on latest stock.
4. Asset classification to the borrower-wise and not facility-wise: It is difficult
envisage a situation when only one facility to a borrower becomes a problem
credit and not others. Therefore, all the facilities granted by a bank to a
borrower will have to be treated as NPA and not the particular facility or a part
thereof, which has become irregular.
5. Advances under consortium arrangements:
Asset classified under consortium should be based on the record of recovery of
the individual member bank and other aspects having bearing on the
recoverability of the advances.
6. Accounts where there is a erosion in the value of security can be reckoned as
significant when the realisable value of the security is less than 50 per cent of
the value assessed by the bank or accepted by RBI at the time of last
inspection, as the case may be. Such NPAs may be straightway classified
under doubtful category and provisioning should be made as applicable to
doubtful assets.
7. Agricultural Advances: In respect of advances granted for agricultural purpose
where interest and/or installment of prinicpal remain unpaid after it has
become past due for two harvest seasons but for a period not exceeding two
half years, such an advance should be treated as NPA.
a. Where the natural calamities impair the repaying capacity of
agricultural borrowers, banks may decide on their own as a relief
measure-conversion of the short-term production loan into a term or re-
schedulement of the repayment period.
b. In such cases of conversation or re-schedulement, the term loan as well
as fresh short-term loan may be treated as current dues and need not be
classified as NPA.
8. Restructuring/Rescheduling of Loans: A standard asset where the terms of the
loan arrangement regarding interest and principal have been renegotiated or
rescheduled after the commencement of production should be as sub-standard
and should remain in such category for at least one year of satisfactory
performance under the renegotiated or restructured terms. In case of
substandard assets and doubtful assets also, rescheduling does not entitle a
289
bank to upgrade the quality of advances automatically unless there is
satisfactory performance under the rescheduled-renegotiated terms.
9. Exceptions: As trading involves only buying and selling of commodities and
the problems associated with manufacturing units such as bottleneck in
commercial production, time and cost escalation, etc. are not applicable to
them, these guidelines to traders.
Factors Contributing NPAs: The factors contributing to NPAs are:
Diversification of funds for expansion, modernization undertaking of new
projects and also for helping associate concerns. This is coupled with
recessionary trends and failure to tap required funds in the capital and debt
market.
Business (Product, marketing, financial) failure, inefficient management,
strained labor relations, inappropriate technology, outmoded machinery,
technical problems and product obsolescence.
Recession, input and power shortage, price escalation, accidents, natural
calamities, external problems in other countries leading to non – payment of
over dues.
Time and cost overrun during project implementation stage.
Government policies like changes in excise duties, pollution control, poor
credit decisions, priority sector lending and outdated legal systems.
Willful default, siphoning off funds, fraud and misappropriation by promoters
and directors dispute.
Deficiencies on the part of banks like delay in release of funds and delay in
release of subsidies by government.
Delay in finalization of rehabilitation package by the board of Industrial and
Reconstruction (BIFR).
Absence of written policies.
The absence of portfolio concentration limits, poor industry analysis, cursory
financial analysis of borrowers.
Inadequate customers contract

290
Excessive reliance on collateral, absence of follow up action by banks, poor
control on loan documentation.
Absence of asset classification and loan loss provisioning standards and
The lack of co-ordination between the financial institutions and commercial
banks, which provide long-term needs of industry that, enables the industry to
misuse the funds.
Indian Banking Industry Saddled with High NPAs – The Reasons:
The liberalisation policies launched in 1991 opened the doors to the
entrepreneurs to setup industries and business, which are largely financed by loans
from the Indian banking systems. There is a shakeout with many businesses are
failing and loans have become bad. In the global economy prevailing today, the
vulnerability of Indian businesses has increased. A culture change is crept in where
repayment of bank loans is no longer assured. A constant follow up action and vigil
are to be exercised by the operating staff. Diversion of funds and willful default has
become more common. As per a study published in the RBI bulletin in July 1999,
diversion of funds and willful default are found to be the major contributing factors
for NPAs in public and private sector banks.
Today, the situation looks optimistic with the industry succeeding in
overcoming the hurdles faced earlier. The timely restructuring and rehabilitation
measures have helped to overcome setbacks and hiccups without seriously
jeopardising their future. The greater transparency and stricter corporate governance
methods have significantly raise the credibility of the corporate sector. The attrition
rate in corporate sector has come down. The challenges before the banks in India
today are the raising NPAs in the retail sector, propelled by high consumerism and
lowering of moral standards.
Impact of NPAs on Banking Operations: The efficiency of a bank is not reflected only by the size of its balance sheet
but also the level of return on its assets. The NPAs do not generate interest income for
banks but at the same time banks are required to provide provisions for NPAs from
their current profits.
The NPAs have deleterious impact on the return on assets in the following ways.
291
The interest income of banks will fall and it is to be accounted only on receipt
basis.
Banks profitability is affected adversely because of the providing of doubtful
debts and consequent to writing it off as bad debts.
Return on investments (ROI) is reduced.
The capital adequacy ratio is disturbed as NPAs are entering into its
calculation.
The cost of capital will go up.
The assets and liability mismatch will widen.
The economic value addition (EVA) by banks gets upset because EVA is equal
to the net operating profit minus cost of capital and
It limits recycling of the funds. It is due to above factors the public sector
banks are faced with bulging NPAs which results in lower income and higher
provisioning for doubtful debts and it will make a dent in their profit margin.
In this context of crippling effect on banks operation the slew asset quality is
placed as one of the most important parameters in the measurement of banks
performance under the Camel’s supervisory rating system of RBI.
Credit Risks of NPAs:
The most of the public sector banks are incapable of visualising the risk they
are going to face in the emerging global economic scenario. The risk management
machinery adopted requires a comprehensive overhaul of the system by the banks in
this changing condition. The second consultative document on the New Basle capital
accord on banking supervision has given a stress on the risk management aspect of the
banks by introducing a more risk sensitive standardised approach towards capital
adequacy. In spite of the stringent recommendations and RBIs apprehensions of the
adequate preparedness of the banking sector in adopting instructions, it is quite clear
about the willingness of the banks to vigorously pursue effective credit risk
management mechanism by visualising the magnitude of credit risk management to
curtail the growth of mounting NPAs.
The concept of recovering debts through Debt Recovery Tribunals has become
a grand failure.
The concept of establishing Asset Reconstruction Company (ARC) has greatly
benefited the banks in containing the NPAs at a manageable level. The ARC is to take
292
over the bad debts of the public sector banks. These banks have the option of either
liquidating the assets of defaulting companies or writing off these bad debts
altogether. The viable solution available to the public sector banks is to go for a better
credit risk management scheme, which may be considered as difficult preposition.
However a clear understanding of the concept of risk, availability of instruments to
curtail risk and the strategies required to be adopted for implementing a risk
management system are considered to be the call of the hour.
Credit Risk Concept:
The risk is inherent and absolutely unavoidable in banking sector. The risk is
considered to be potential loss of an asset and portfolio is likely to suffer due to
various reasons. It is around for centuries and thought to be the dominant financial
risk today. The risk can be defined as the risk of erosion of value due to simple default
and non-payment of the debt by the borrower. The degree of risk is reflected in the
borrower’s credit rating, the premium it pays for funds and market price of the debts.
Management of Credit Risk:
The credit risk is one of the most significant risk classes for financial
institutions and banks in India. There is no liquid market for trading the credit risk. In
such a situation the financial institutions may increase their net market exposure
sometimes at the expense of increasing the credit risk to certain parties. The credit
derivatives allow financial institutions to change their exposure to a range of credit
related risks. There are various structures that allow the transference of credit risk
from one party to another.
The credit risk management has two basic objectives
It manages the asset portfolio in a manner which ensures that the banks
have adequate capital to hedge their risks and
It matches the return to the risk. It is comprising of two basic steps
viz.,
Identification and Ascertainment of Credit Default Risk:
In order to assess the credit default risk the concerned bank has to check the
following five C’s from the borrower.
293
Cash flows - reflecting the earning capacity of the borrower.
Collateral - the tangible assets of the borrowers who intends to
mortgage.
Character - the management capabilities of the concerned party.
Conditions - the loan covenants to safeguard the lenders interest and
Capital - referring to the buffer to absorb earnings shocks.
Utilisation of credit default protection measures and instruments:
Once the credit default is ascertained and quantified, credit default protection
measures and instruments like credit default swaps, credit default options and credit
linked notes can be utilised.
Credit Default Swap:
It is a bilateral financial contract in which buyer pays a periodic fee expressed
in fixed basis points on the notional amount in return for a floating payment
contingent on the default of a third party reference credit. The floating payment is
designated to mirror the loss incurred by creditors of the reference credit in the event
of its default. The credit event varies from bank to bank and from transaction to
transaction. The credit events are pre defined in the agreement, which includes
1. Bankruptcy
2. Insolvency
3. Rating, and downgrading below agreed threshold
4. Failure to adjust for new payment obligation and
5. Debt Rescheduling.
The credit event triggers the obligation of the seller of default protection to the
purchaser of the same. The investors who need to protect themselves against default
but do not want to sell the at risk security for accounting, tax and regulatory reasons
can buy a credit default swap.
Credit Limited Notes (CLN):
These are known as credit swaps in which buyer makes periodic payments
of a fixed percentage of the reference asset to the seller over the life of the swap. Then
the seller promises a payment in the case of credit default for the reasons viz.,
294
bankruptcy, delinquency and credit rating down grade. The payments may be either a
pre - determined amount and also decrease in the market value of the reference
obligation that may cause the credit event. The seller calls the structure away from the
investor and delivers the defaulting notes against them on the happening of credit
event. The CLN are like bonds in character and are acceptable to certain banks. They
are not allowed to involve in credit default swap.
Impact of NPA
Profitability
NPA means booking of money in terms of bad asset, which occurred due to
wrong choice of client. Because of the money getting blocked the prodigality of bank
decreases not only by the amount of NPA but NPA lead to opportunity cost also as that
much of profit invested in some return earning project/asset. So, NPA doesn’t affect
current profit but also future stream of profit, which may lead to loss of some long-
term beneficial opportunity. Another impact of reduction in profitability is low ROI
(return on investment), which adversely affect current earning of bank.
Liquidity
Money is getting blocked, decreased profit lead to lack of enough cash at hand
which lead to borrowing money for shortest period of time which lead to additional
cost to the company. Difficulty in operating the functions of bank is another cause of
NPA due to lack of money, routine payments and dues.
Involvement of Management
Time and efforts of management is another indirect cost which bank has to
bear due to NPA. Time and efforts of management in handling and managing NPA
would have diverted to some fruitful activities, which would have given good returns.
Now-a-days banks have special employees to deal and handle NPAs, which is
additional cost of the bank.
Credit Loss
Bank is facing problem of NPA then it adversely affect the value of bank in
terms of market credit. It will lose it’s goodwill and brand image and credit which
have negative impact to the people who are putting their money in the banks.
295
Early Symptoms by which one can recognize a performing asset turning in to
non-performing asset:
Four Categories of early symptoms
Financial
Non-payment of the very first installment in case of term loan.
Bouncing of cheque due to insufficient balance in the account.
Irregularity of installment.
unpaid overdue bills.
Declining Current Ratio.
Payment which does not cover the interest and principal amount of that
installment.
While monitoring the accounts it is found that partial amount is diverted to
sister concern or parent company.
Operational and Physical
If information is received that the borrower has either initiated the process of
winding up or are not doing the business.
Overdue receivables.
Stock statement not submitted on time.
External non-controllable factor like natural calamities in the city where
borrower conduct his business.
Frequent changes in plan.
Non-payment of wages.
Attitudinal Changes
Avoidance of contact with bank and
Problem between partners.
Others
Changes in Government Policies.
Death of borrower.
Competition in the market.
Consequences of NPAs:
The contaminated portfolio is definitely a bane for any bank. It puts severe
dent on the liquidity and profitability of the bank where it is out of proportion. The
296
NPAs in the public sector banks are well above the normal level. The consequences
envisaged during the past several years are many.
It has become a difficult task for the banks to reduce the lending rate due to
the presence of large NPAs. Ultimately this is affecting the competitiveness of the
Indian banks. When the bank does not enjoy the market competitiveness naturally the
credit expansion would be slumped and when it happens, the profitability gets a
setback. In this way the vicious circle will go on and on.
Another important one is the reduction in the availability of funds for further
expansion due to the unproductiveness of the existing portfolio. Sometimes it is found
that the presence of large NPAs discourages banks to accept profitable but risky
proposal loan from the customers. The NPAs also affect the risk taking ability of the
banks. On the whole it affects the credibility of the bank and faces difficulty in raising
fresh capital from the market for future requirements.
Underlying Reasons for NPAs in India
An internal study conducted by RBI shows that in the order of prominence, the
following factors contribute to NPAs.
Internal Factors
Diversion of funds for
Expansion/diversification/modernisation
Taking up new projects
Helping/promoting associate concerns time/cost overrun during the
project implementation stage
Business (product, marketing, etc.) failure
Inefficiency in management
Slackless in credit management and monitoring
Inappropriate technology/technical problems
Lack of co-ordination among lenders
External Factors
Recession
Input/power shortage
Price escalation
Exchange rate fluctuation
297
Accidents and natural calamities, etc.
Changes in Government policies in excise/import duties, pollution control
orders, etc.
Other Factors
Liberlisation of economy/removal of restrictions/reduction of tariffs
A large number of NPA borrowers were unable to complete in a competitive
market in which lower prices and greater choices were available to consumers.
Further, borrowers operating in specific industries have suffered due to political, fiscal
and social compulsions, compounding pressures from liberlisation (e.g., sugar and
fertiliser industries)
Relax monitoring of credits and failure to recognise Early Warning Signals
It has been stated that approval of loan proposals is generally thorough and
each proposal passes through many levels before approval is granted. However, the
monitoring of sometimes-complex credit files has not received the attention it needed,
which meant that early warning signals were not recognised and standard assets
slipped to NPA category without banks being able to take proactive measures to
prevent this. Partly due to this reason, adverse trends in borrowers’ performance were
not noted and position further deteriorated before action was taken.
Over optimistic promoters
Promoters were often optimistic in setting up large projects and in some cases
were not fully above board in their intentions. Screening procedures did not always
highlight these issues. Often projects were set up with the expectation that part of the
funding would be arranged from the capital markets, which were booming at the time
of the project appraisal. When the capital markets subsequently crashed, the requisite
funds could never be raised, promoters often lost interest and lenders were left
stranded with incomplete/unviable projects.
Direct lending
Loans to some segments were dictated by Government’s policies rather than
commercial imperatives.
298
Highly leveraged borrowers
Some borrowers were under capitalised and over burdened with debt to absorb
the changing economic situation in the country. Operating within a protected market
resulted in low appreciation of commercial/market risk.
Funding mismatch
There are said to be many cases where loans granted for short terms were used
to fund long term transactions.
Willful Defaulters
There are a number of borrowers who have strategically defaulted on their
debt service obligations realising that the legal recourse available to creditors is slow
in achieving results.
Existing Systems/Procedures for NPA Identification and Resolution in India
Internal Checks and Control
Since high level of NPAs dampens the performance of the banks identification
of potential problem accounts and their close monitoring assumes importance.
Though most banks have EWS for identification of potential NPAs, the actual
processes followed, however, differ from bank to bank.
The EWS enable a bank to identify the borrower accounts which show signs
of credit deterioration and initiate remedial action. Many banks have evolved and
adopted an elaborate EWS, which allows them to identify potential distress signals
and plan their options beforehand, accordingly. The early warning signals, indicative
of potential problems in the accounts, viz, persistent irregularity in accounts, delays in
servicing of interest, frequent devolvement of L/Cs, units’ financial problems, market
related problems, etc. are captured by the system. In addition, some of these banks are
reviewing their exposure to borrower accounts every quarter based on published data
which also serves as an important additional warning system and asset classification
norms prescribed by RBI.
The major components/processes of a EWS followed by banks in India as
brought out by a study conducted by RBI at the instance of the Board of Financial
Supervision are as follows:
299
i) Designating Relationship Manager/Credit Officer for monitoring
accounts
ii) Preparation of ‘know your client’ profile
iii) Credit rating system
iv) Identification of watch-list/special mention category accounts
v) Monitoring of early warning signals.
Relationship Manager/Credit Officer
The Relationship Manager/Credit Officer is an official who is expected to
have complete knowledge of borrower, his business, his future plans, etc. The
Relationship Manager has to keep in constant touch with the borrower and report all
developments impacting the borrowal account. As a part of this contact he is also
expected to conduct scrutiny and activity inspections. In the credit monitoring a
corporate account is vested with Relationship Manager/Credit Officer.
‘Know your client’ profile (KYC)
Most banks in India have a system of preparing ‘know your client’ (KYC)
profile/credit report. As a part of ‘KYC’ system, visits are made on clients and their
places of business/units.
Credit Rating System
The credit rating system is essentially one point indicator of an individual
credit exposure and is used to identify measure and monitor the credit risk of
individual proposal. At the whole bank level, credit rating system enables tracking the
health of banks entire credit portfolio.
Most banks in India have put in place the system of internal credit rating.
While most of the banks have developed their own models, a few banks have adopted
credit rating models designed by rating agencies. Credit rating models take into
account various types of risks viz. financial, industry and management, etc. associated
with a borrowal unit. The exercise is generally done at the time of sanction of new
borrowal account at the same time of review/renewal of existing credit facilities.
300
Watch-list/Special Mention Category
The grading of the bank’s risk assets is an important internal control tool. It
serves the need of the Management to identify and monitor potential risks of a loan
asset. The purpose of identification of potential NPAs is to ensure that appropriate
preventive/corrective steps could be initiated by the bank to protect against the loan
asset becoming non-performing. Most of the banks have a system to put certain
borrowal accounts under watch list or special mention category if performing
advances operating under adverse business or economic conditions are exhibiting
certain distress signals. These accounts generally exhibit weaknesses which are
correctable but warrant banks’ closer attention. The categorisation of such accounts in
watch list or special mention category provides early warning signals enabling
Relationship Manager or Credit Officer to anticipate credit deterioration and take
necessary preventive steps to avoid their slippage into non performing advances.
Early Warning Signals
It is important in any early warning system, to be sensitive to signals of credit
deterioration. A host of early warning signals are used by different banks for
identification of potential NPAs. Most banks in India have laid down a series of
operational, financial, transactional indicators that could serve to identify emerging
problems in credit exposures at an early stage. Further, it is revealed that the
indicators which may trigger early warning system depend not only on default in
payment of installment and interest but also other factors such as deterioration in
operating and financial performance of the borrower, weakening industry
characteristics, regulatory changes, general economic conditions, etc.
EWS can be classified into five broad categories viz. (a) financial (b)
operational (c) banking (d) management and (e) external factors. Financial related
warning signals generally emanate from the borrowers’ balance sheet, income and
expenditure statement of cash flows, statement of receivables etc. following common
warning signals are captured by some of the banks having relatively developed EWS.
Financial warning signals
Persistent irregularity in the account
Default in repayment obligation
Devolvement of LC/invocation of guarantees
301
Substantial increase in long term debts in relation to equity
Declining sales
Operating losses/net losses
Rising sales and falling profits
Disproportionate increase in overheads relative to sale
Rising level of bad debt losses Operating warning signals
Low activity level in plant
Disorderly diversification/frequent changes in plan
Nonpayment of wages/power bills
Loss of critical customers
Frequent labour problems
Evidence of aged inventory/large level of inventory
Management related warning signals
Lack of co-operation from key personnel
Change in management, ownership, or key personnel
Desire to take undue risks
Family disputes
Poor financial controls
Fudging of financial statements
Diversion of funds.
Banking related signals
Declining bank balances/declining operations in the account
Opening of account with other bank
Return of outward bills/dishonoured cheques
Sales transactions not routed through the account
Frequent requests for loan
Frequent delays in submitting stock statements, financial data, etc.
Signals relating to external factors
Economic recession
Emergence of new competition
Emergence of new technology
Changes in government / regulatory policies
Natural calamities
302
NPA NORMS IN AGRICULTURAL FINANCE
As part of the prudential norms framework for banks, norms for income
recognition, classification of assets and provisioning for Non-Performing Assets
(NPA) were introduced by the Reserve Bank of India in the year 1992-93. These
norms are aimed at identifying nonperforming assets, which have ceased to earn
interest at the stipulated rates or in respect of which installments of principal which
have fallen due have not be repaid within the stipulated time, and ensuring that
unrealized income there from is not factored into the income stream of the bank for
the purpose of preparing the profit and loss account. Further, current prudential norms
on classification of non-performing loans track loan defaults not only to the specific
loan account, but, also to the borrowers; recognition of any single loan account of a
borrower as NPA automatically leads to classifying of all the other loans due from the
same borrower as NPA, even if repayment on other loans is regular.
The extant norms for classification of agricultural loans as NPA for the
commercial are as follows:
Commercial Banks
In respect of advances granted for agricultural purposes, where interest and/or
installment of principal remains unpaid after it has become overdue for two harvest
seasons but for a period not exceeding two half years, such an advance should be
treated as NPA. These norms are applicable to direct agricultural advances only.
Identification of NPAs would be done on the same basis as non-agricultural
advances. Such advances attract the 90 days delinquency norm with effect from
March 31, 2004.
Need for revisiting the current NPA guidelines
Agriculture as an economic activity suffers from uncertainties mainly on
account of fluctuations in rainfall, pest attacks, floods, droughts and other natural
calamities. Such uncertainties are particularly severe in rain-fed areas. Inadequate
rainfall, for example, results in restricted income flows to the farmer, leading to
impairment of capacity to repay. However, over a period of the cycle (which may be
different in different agro-climatic zones) the cash flow may get smoothened. While

303
during some years in the cycle the loans may not be repaid, there is always the
possibility of the dues being cleared over a period, provided of course, the farmer's
cash flow is not debilitated by successive droughts. Agricultural loans support
livelihood activities of the farmers. Normally, they would not behave in a manner
which would permanently jeopardize the credit support required to earn their
livelihood. Seen from this point of view, an agricultural loan, even if it is not repaid
on time in the same season on account of climate related problems, could eventually
be repaid out of income in subsequent seasons, if the borrower is able to sustain
himself during the intervening period and his overall debt burden does not financially
annihilate him. In this background, it is considered necessary to reckon the cash flows
of the borrower from farm activities and accord differential treatment for the purpose
of recognition as NPAs and the extant guidelines be revised to be in tune with the
ground realities and to capture the seasonal uncertainties.
The present norm of NPA of non-recovery of interest / principal up to two
crop seasons or covering two half years after the due date, does not fully mirror the
differing crop maturities, some of which may extend up to 18 months. There are also
regional disparities in the duration of the crops. The logic of fixing the repayment
dates in tune with harvesting is to link it with the cash flow of the farmer, coinciding
with the harvesting/marketing of the crop. In the case of longer duration crops, the
current prescription of two half years would not be adequate. It is, therefore,
recommended that while the current norm of default for "two crop seasons"
could be retained for classification of loan as a non-performing loan, the norm of
"two half years" be removed. The "crop season" for this purpose means the
period required for the crops to mature for harvesting. To avoid adoption of
arbitrary norm by any individual bank, the duration of the crop season for
different crops in a given area could be determined by the technical committee
appointed for the purpose of fixation of scales of finance, in consultation with
agricultural scientists and be ratified by DLCC/SLBC. For the purpose of
arriving at "two crop seasons after the due date", only those two consecutive
crop seasons may be reckoned during which the farmer borrower normally
undertakes crop production.
304
As regards the long duration crops, it is suggested that while the cap of
"two half years" may be removed, a loan may be treated as non-performing, if
interest or principal remains unpaid for one crop season after becoming due.
Both the crop loans and the agricultural term loans are repaid out of the
income generated from the crops grown. In the event of failure of crops due to natural
calamities like earth quake, floods and droughts if the crops are affected badly not
only the crop loan recovery gets affected but also that of the term loans. Therefore,
the relaxations suggested in respect of crop loans may also be, mutatis mutandis,
made applicable to the agricultural term loans.
The advances to allied agriculture activities at present are treated on par with
non-farm activities for the purpose of asset classification without any linkage to the
crop situation. The allied agriculture activities pursued by the farmers are closely
linked to the agriculture sector. Further, income from these activities is also not
evenly spread throughout the year. The income received from allied activities to
agriculture, which are taken as subsidiary activities to augment income of a
cultivating family may not be adequate to repay the bank loan and interest besides
sustaining the family, once the principal activity of the farmer is adversely affected.
Further, the uneven spread of surplus cash generation from these activities brings in
temporary distortions in cash flows at times leading to delayed repayment of loans.
The present 90 day norm for classification of NPA as applicable to these activities,
does not take into account such temporary disruptions in cash flows at the farmer
level. Therefore, it is suggested that the earlier delinquency norm of 180 days
default for classifying a loan as NPA may be continued in respect of loans for
activities allied to agriculture.
Generally, the farmers who avail of agricultural term loans also borrow for
crop production. As per prevailing guidelines on classification of assets, outstanding
amount of all the loan accounts of a borrower are classified as NPA even if there is a
default in one of these accounts. Distinguishing between crop loan account and term
loan account would facilitate the banks in ensuring availability of credit for
production process. It is recommended that in such cases, where farmer has
availed both production loans and investment loans, only that loan account in
305
which default has occurred may be considered for NPA classification and
outstanding in those loan accounts which are regular not be included as NPA.
The procedure of declaration of annawari by the State Government is
cumbersome and takes a long time. As a result, conversion of the existing loan and
sanction of fresh credit to the farmers also gets delayed and results in loans being
classified as NPA, even where it is possible to restructure these loans. To avoid such
delays, the Lead District Manager of the Lead Bank, should arrange to get timely
information on crop losses in the district due to flood / drought, etc. from the district
authorities. On the basis of such information, a committee headed by the District
Manager of the Lead Bank, with District Development Manager of NABARD,
District Agriculture Officer and a few major banks operating in the district may,
in consultation with agricultural scientists / local agricultural university,
consider the crop losses due to weather aberrations, e.g., deficit in rainfall, etc.,
in the district and take a decision on conversion / restructuring of agricultural
loans. All the banks operating in the district should be able to extend the facility
of restructuring of loans to the eligible farmers on this basis once such a decision
is made. Such a decision should be promptly reported to the convenor of the
SLBC and may be recorded in the proceedings of the immediate following
meeting of the SLBC. The banks may authorise their branches to take up
conversion / rescheduling of loans based on the recommendations of the above
mentioned district level committee.
Apart from large-scale calamities, some farmer-specific events beyond their
control impair the repayment capacity temporarily. Major ailments affecting any
member of the farm family, damage to house and agriculture assets through fire,
localised pests, etc., are some illustrations of such events that could temporarily
impair the repayment capacity. In such cases, the banks may have the freedom to
allow restructuring of loans on a case-to-case basis, ensuring that this does not
lead to ever greening. Such a restructuring of loans should be with the specific
approval of the controlling authority of the branch.
The conversion and restructuring of farm loans should be done at
reasonable rates of interest. Restructuring of any loans involves sacrifice of interest
on the part of banks to ensure that the units remain viable after restructuring.

306
Applying this logic in the case of restructuring of agricultural loans, banks need
to fix the rate of interest on restructured loans at a level lower than the original
loan. This would ensure that the farming operations continue to be viable and that the
farmers are able to service the restructured loans as well as the fresh loans that would
be extended by banks.
In this chapter researcher has made an attempt to analyses the non-performing
assets of SCBs.
Gross NPA
All the outstanding loans and advances including advances for which
refinance has been received but excluding re-discounted bills and advances written off
at head office level. Bank Group-wise Classification of Gross Non-Performing Assets
of SCBs in India from 1997-1998 to 2008-2009 is exhibited in Table 6.1.
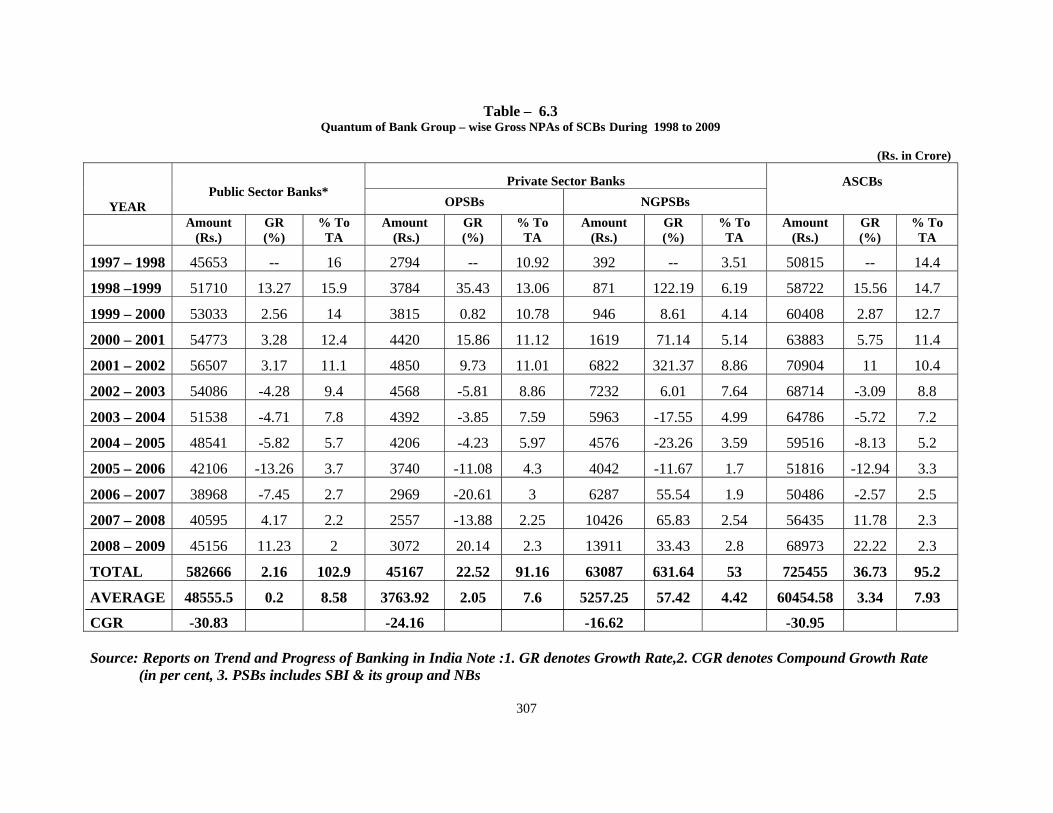
307
Source: Reports on Trend and Progress of Banking in India Note :1. GR denotes Growth Rate,2. CGR denotes Compound Growth Rate (in per cent, 3. PSBs includes SBI & its group and NBs
Table – 6.3 Quantum of Bank Group – wise Gross NPAs of SCBs During 1998 to 2009
(Rs. in Crore)
YEAR Public Sector Banks*
Private Sector Banks ASCBs OPSBs NGPSBs
Amount
(Rs.) GR (%)
% To TA
Amount (Rs.)
GR (%)
% To TA
Amount (Rs.)
GR (%)
% To TA
Amount (Rs.)
GR (%)
% To TA
1997 – 1998 45653 -- 16 2794 -- 10.92 392 -- 3.51 50815 -- 14.4
1998 –1999 51710 13.27 15.9 3784 35.43 13.06 871 122.19 6.19 58722 15.56 14.7
1999 – 2000 53033 2.56 14 3815 0.82 10.78 946 8.61 4.14 60408 2.87 12.7
2000 – 2001 54773 3.28 12.4 4420 15.86 11.12 1619 71.14 5.14 63883 5.75 11.4
2001 – 2002 56507 3.17 11.1 4850 9.73 11.01 6822 321.37 8.86 70904 11 10.4
2002 – 2003 54086 -4.28 9.4 4568 -5.81 8.86 7232 6.01 7.64 68714 -3.09 8.8
2003 – 2004 51538 -4.71 7.8 4392 -3.85 7.59 5963 -17.55 4.99 64786 -5.72 7.2
2004 – 2005 48541 -5.82 5.7 4206 -4.23 5.97 4576 -23.26 3.59 59516 -8.13 5.2
2005 – 2006 42106 -13.26 3.7 3740 -11.08 4.3 4042 -11.67 1.7 51816 -12.94 3.3
2006 – 2007 38968 -7.45 2.7 2969 -20.61 3 6287 55.54 1.9 50486 -2.57 2.5
2007 – 2008 40595 4.17 2.2 2557 -13.88 2.25 10426 65.83 2.54 56435 11.78 2.3
2008 – 2009 45156 11.23 2 3072 20.14 2.3 13911 33.43 2.8 68973 22.22 2.3
TOTAL 582666 2.16 102.9 45167 22.52 91.16 63087 631.64 53 725455 36.73 95.2
AVERAGE 48555.5 0.2 8.58 3763.92 2.05 7.6 5257.25 57.42 4.42 60454.58 3.34 7.93
CGR -30.83 -24.16 -16.62 -30.95
308
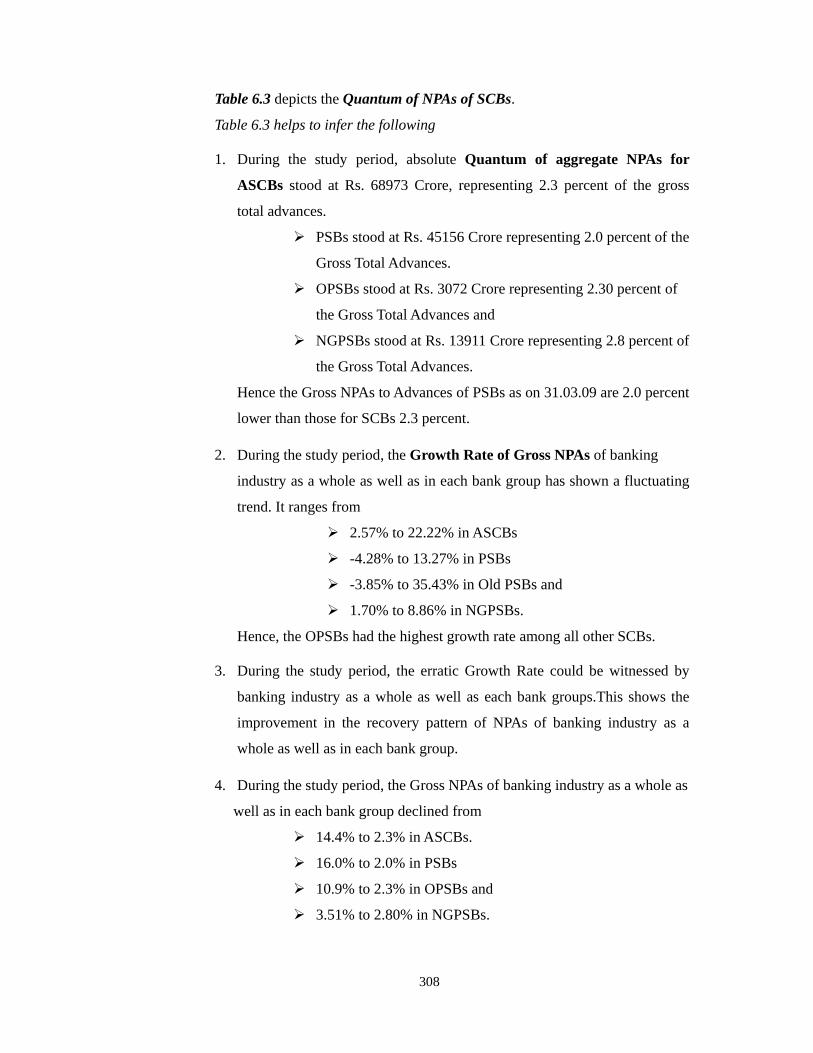
Table 6.3 depicts the Quantum of NPAs of SCBs.
Table 6.3 helps to infer the following
1. During the study period, absolute Quantum of aggregate NPAs for
ASCBs stood at Rs. 68973 Crore, representing 2.3 percent of the gross
total advances.
PSBs stood at Rs. 45156 Crore representing 2.0 percent of the
Gross Total Advances.
OPSBs stood at Rs. 3072 Crore representing 2.30 percent of
the Gross Total Advances and
NGPSBs stood at Rs. 13911 Crore representing 2.8 percent of
the Gross Total Advances.
Hence the Gross NPAs to Advances of PSBs as on 31.03.09 are 2.0 percent
lower than those for SCBs 2.3 percent.
2. During the study period, the Growth Rate of Gross NPAs of banking
industry as a whole as well as in each bank group has shown a fluctuating
trend. It ranges from
2.57% to 22.22% in ASCBs
-4.28% to 13.27% in PSBs
-3.85% to 35.43% in Old PSBs and
1.70% to 8.86% in NGPSBs.
Hence, the OPSBs had the highest growth rate among all other SCBs.
3. During the study period, the erratic Growth Rate could be witnessed by
banking industry as a whole as well as each bank groups.This shows the
improvement in the recovery pattern of NPAs of banking industry as a
whole as well as in each bank group.
4. During the study period, the Gross NPAs of banking industry as a whole as
well as in each bank group declined from
14.4% to 2.3% in ASCBs.
16.0% to 2.0% in PSBs
10.9% to 2.3% in OPSBs and
3.51% to 2.80% in NGPSBs.
309
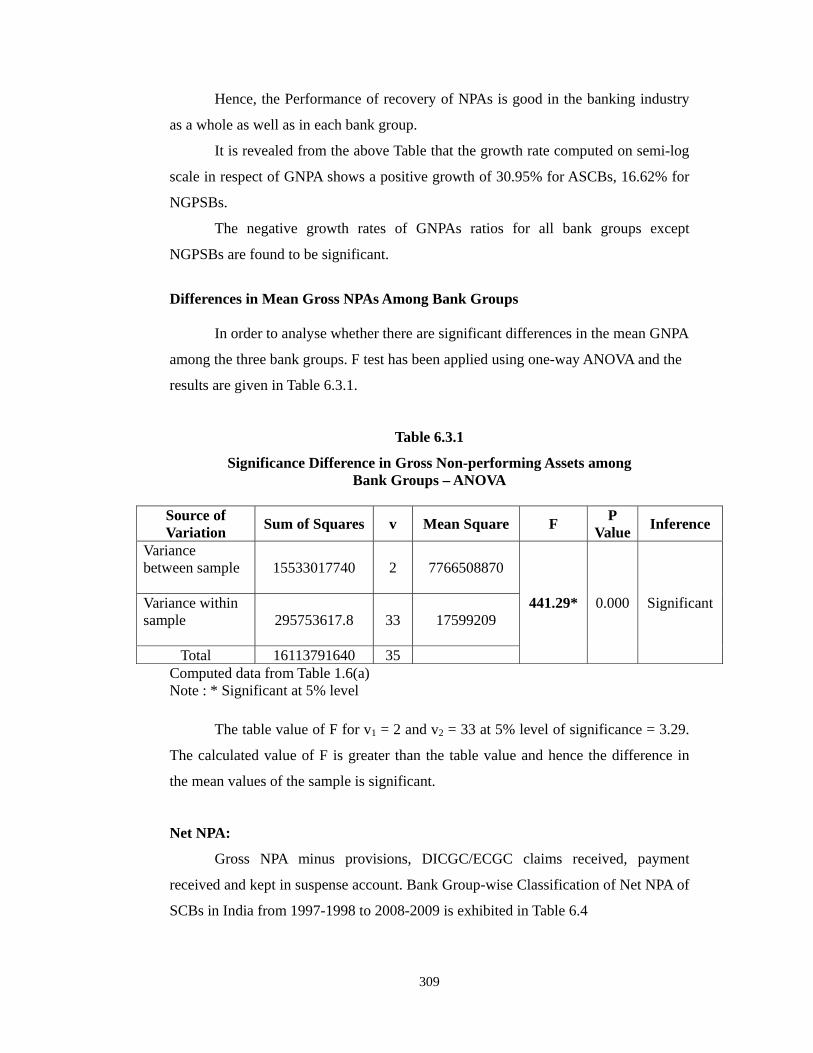
Hence, the Performance of recovery of NPAs is good in the banking industry
as a whole as well as in each bank group.
It is revealed from the above Table that the growth rate computed on semi-log
scale in respect of GNPA shows a positive growth of 30.95% for ASCBs, 16.62% for
NGPSBs.
The negative growth rates of GNPAs ratios for all bank groups except
NGPSBs are found to be significant.
Differences in Mean Gross NPAs Among Bank Groups In order to analyse whether there are significant differences in the mean GNPA
among the three bank groups. F test has been applied using one-way ANOVA and the
results are given in Table 6.3.1.
Table 6.3.1
Significance Difference in Gross Non-performing Assets among Bank Groups – ANOVA
Source of Variation Sum of Squares v Mean Square F P
Value Inference
Variance between sample
15533017740 2 7766508870
441.29* 0.000 Significant Variance within sample
295753617.8 33 17599209
Total 16113791640 35 Computed data from Table 1.6(a) Note : * Significant at 5% level
The table value of F for v1 = 2 and v2 = 33 at 5% level of significance = 3.29.
The calculated value of F is greater than the table value and hence the difference in
the mean values of the sample is significant.
Net NPA:
Gross NPA minus provisions, DICGC/ECGC claims received, payment
received and kept in suspense account. Bank Group-wise Classification of Net NPA of
SCBs in India from 1997-1998 to 2008-2009 is exhibited in Table 6.4
310
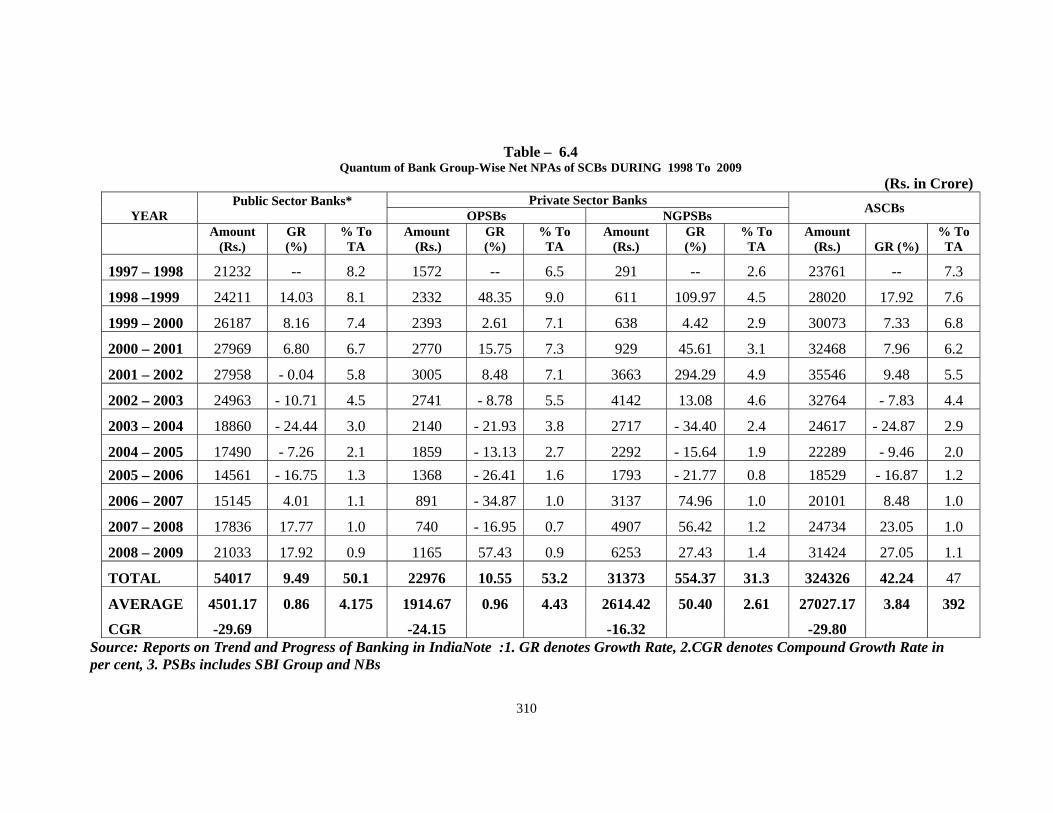
Table – 6.4 Quantum of Bank Group-Wise Net NPAs of SCBs DURING 1998 To 2009
(Rs. in Crore)
YEAR Public Sector Banks*
Private Sector Banks ASCBs OPSBs NGPSBs
Amount
(Rs.) GR (%)
% To TA
Amount (Rs.)
GR (%)
% To TA
Amount (Rs.)
GR (%)
% To TA
Amount (Rs.) GR (%)
% To TA
1997 – 1998 21232 -- 8.2 1572 -- 6.5 291 -- 2.6 23761 -- 7.3
1998 –1999 24211 14.03 8.1 2332 48.35 9.0 611 109.97 4.5 28020 17.92 7.6
1999 – 2000 26187 8.16 7.4 2393 2.61 7.1 638 4.42 2.9 30073 7.33 6.8
2000 – 2001 27969 6.80 6.7 2770 15.75 7.3 929 45.61 3.1 32468 7.96 6.2
2001 – 2002 27958 - 0.04 5.8 3005 8.48 7.1 3663 294.29 4.9 35546 9.48 5.5
2002 – 2003 24963 - 10.71 4.5 2741 - 8.78 5.5 4142 13.08 4.6 32764 - 7.83 4.4
2003 – 2004 18860 - 24.44 3.0 2140 - 21.93 3.8 2717 - 34.40 2.4 24617 - 24.87 2.9
2004 – 2005 17490 - 7.26 2.1 1859 - 13.13 2.7 2292 - 15.64 1.9 22289 - 9.46 2.0 2005 – 2006 14561 - 16.75 1.3 1368 - 26.41 1.6 1793 - 21.77 0.8 18529 - 16.87 1.2
2006 – 2007 15145 4.01 1.1 891 - 34.87 1.0 3137 74.96 1.0 20101 8.48 1.0
2007 – 2008 17836 17.77 1.0 740 - 16.95 0.7 4907 56.42 1.2 24734 23.05 1.0
2008 – 2009 21033 17.92 0.9 1165 57.43 0.9 6253 27.43 1.4 31424 27.05 1.1
TOTAL 54017 9.49 50.1 22976 10.55 53.2 31373 554.37 31.3 324326 42.24 47
AVERAGE 4501.17 0.86 4.175 1914.67 0.96 4.43 2614.42 50.40 2.61 27027.17 3.84 392
CGR -29.69 -24.15 -16.32 -29.80 Source: Reports on Trend and Progress of Banking in IndiaNote :1. GR denotes Growth Rate, 2.CGR denotes Compound Growth Rate in per cent, 3. PSBs includes SBI Group and NBs
311
Table 6.4 depicts the Quantum of Net NPAs of SCBs– Bank Group-Wise.
Table 6.4 helps to infer the following
1. During the study period, absolute Quantum of aggregate NPAs of SCBs
stood at Rs. 31424 crore, representing 1.1% of the net total advances.
PSBs stood at Rs.21033 crore representing 0.9% of the net total
advances
OPSBs stood at Rs. 1165 crore representing 0.9% of the net total
advances
NGPSBs stood at Rs. 6253 crore representing 1.4% of the net total
advances
Hence the Net NPAs to advances of PSBs as on 31.03.’09 are 0.9% lower
than those for SCBs 1.1% .
2. During the study period, the Growth Rate of Net NPAs of banking
industry as a whole as well as in each bank group has shown a fluctuating
trend. It ranges from
- 7.83 % to 27.05 % in ASCBs
- 0.04 % to 17.92 % in PSBs
-8.78 % to 57.43 % in Old PSBs and
-15.64 % to 294.29 % in NGPSBs.
Hence, the NGPSBs had the highest growth rate among all other SCBs.
3. During the study period, the erratic Growth Rate could be witnessed by
banking industry as a whole as well as each bank groups. This shows the
improvement in the recovery pattern of NPAs of banking industry. Hence
the RBI has taken an effective measure for reducing NPA and also
increasing their profitability.
It is revealed from the above Table that the growth rate computed on semi-
log scale in respect of NNPA shows a positive growth of 29.80% for
ASCBs, 29.69% for PSBs, 24.15% for OPSBs and 16.32% for NGPSBs.
The positive growth rates of NNPAs ratios for all bank groups are found to
be significant.
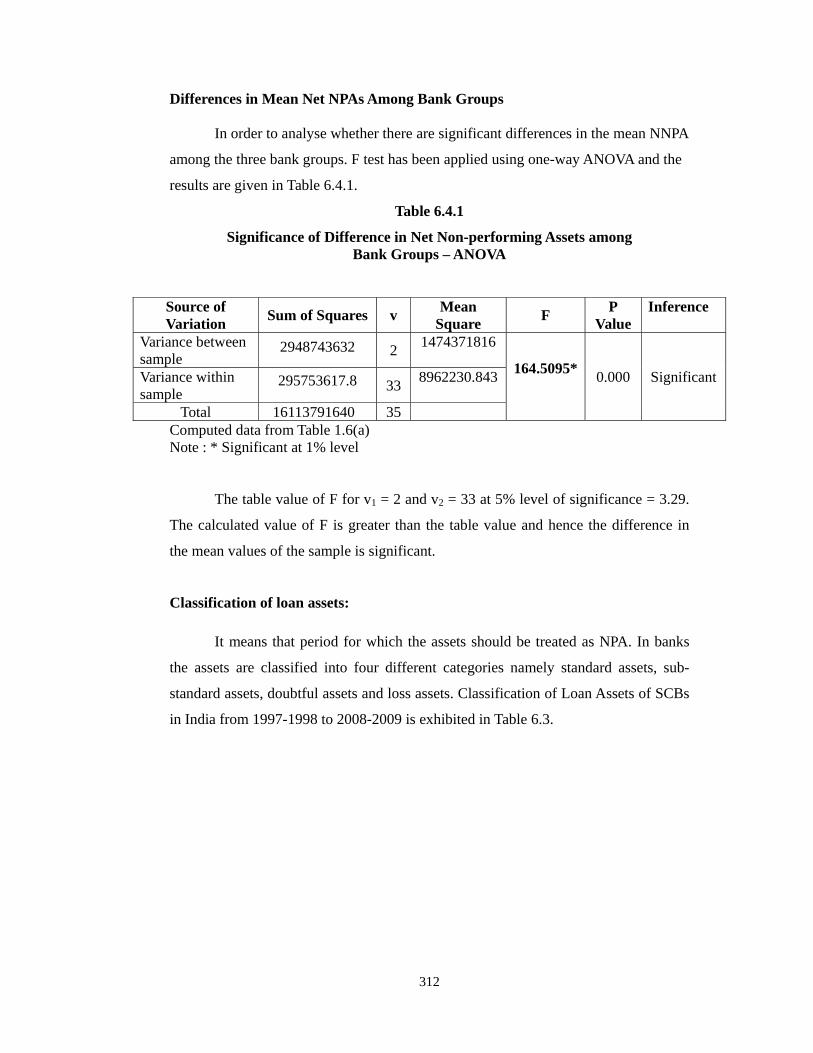
312
Differences in Mean Net NPAs Among Bank Groups In order to analyse whether there are significant differences in the mean NNPA
among the three bank groups. F test has been applied using one-way ANOVA and the
results are given in Table 6.4.1.
Table 6.4.1
Significance of Difference in Net Non-performing Assets among Bank Groups – ANOVA
Source of Variation Sum of Squares v Mean
Square F P Value
Inference
Variance between sample
2948743632
2 1474371816 164.5095*
0.000 Significant Variance within sample
295753617.8
33 8962230.843
Total 16113791640 35 Computed data from Table 1.6(a) Note : * Significant at 1% level
The table value of F for v1 = 2 and v2 = 33 at 5% level of significance = 3.29.
The calculated value of F is greater than the table value and hence the difference in
the mean values of the sample is significant.
Classification of loan assets:
It means that period for which the assets should be treated as NPA. In banks
the assets are classified into four different categories namely standard assets, sub-
standard assets, doubtful assets and loss assets. Classification of Loan Assets of SCBs
in India from 1997-1998 to 2008-2009 is exhibited in Table 6.3.
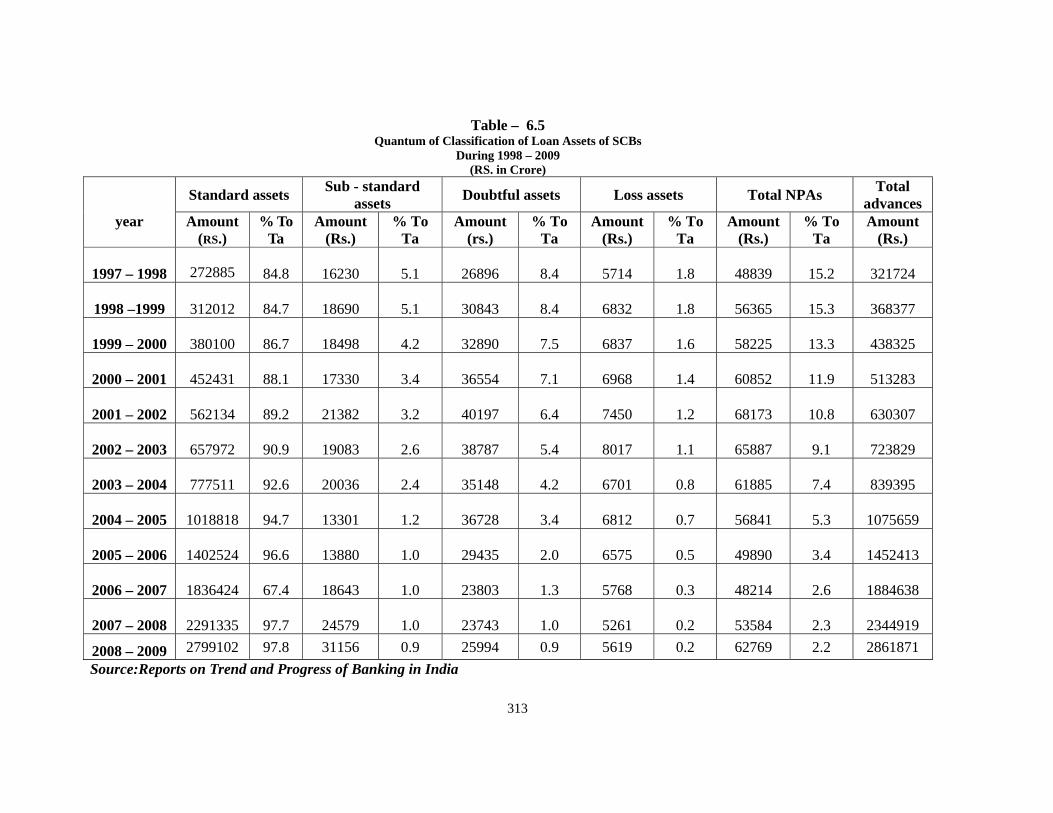
313
Source:Reports on Trend and Progress of Banking in India
Table – 6.5 Quantum of Classification of Loan Assets of SCBs
During 1998 – 2009 (RS. in Crore)
year
Standard assets Sub - standard assets Doubtful assets Loss assets Total NPAs Total
advancesAmount
(RS.) % To
Ta Amount
(Rs.) % To
Ta Amount
(rs.) % To
Ta Amount
(Rs.) % To
Ta Amount
(Rs.) % To
Ta Amount
(Rs.)
1997 – 1998
272885
84.8 16230 5.1 26896 8.4 5714 1.8 48839 15.2 321724
1998 –1999
312012
84.7 18690 5.1 30843 8.4 6832 1.8 56365 15.3 368377
1999 – 2000
380100
86.7 18498 4.2 32890 7.5 6837 1.6 58225 13.3 438325
2000 – 2001
452431
88.1 17330 3.4 36554 7.1 6968 1.4 60852 11.9 513283
2001 – 2002
562134
89.2 21382 3.2 40197 6.4 7450 1.2 68173 10.8 630307
2002 – 2003
657972
90.9 19083 2.6 38787 5.4 8017 1.1 65887 9.1 723829
2003 – 2004
777511
92.6 20036 2.4 35148 4.2 6701 0.8 61885 7.4 839395
2004 – 2005
1018818
94.7 13301 1.2 36728 3.4 6812 0.7 56841 5.3 1075659
2005 – 2006
1402524
96.6 13880 1.0 29435 2.0 6575 0.5 49890 3.4 1452413
2006 – 2007
1836424
67.4 18643 1.0 23803 1.3 5768 0.3 48214 2.6 1884638
2007 – 2008
2291335
97.7 24579 1.0 23743 1.0 5261 0.2 53584 2.3 2344919
2008 – 2009 2799102 97.8 31156 0.9 25994 0.9 5619 0.2 62769 2.2 2861871
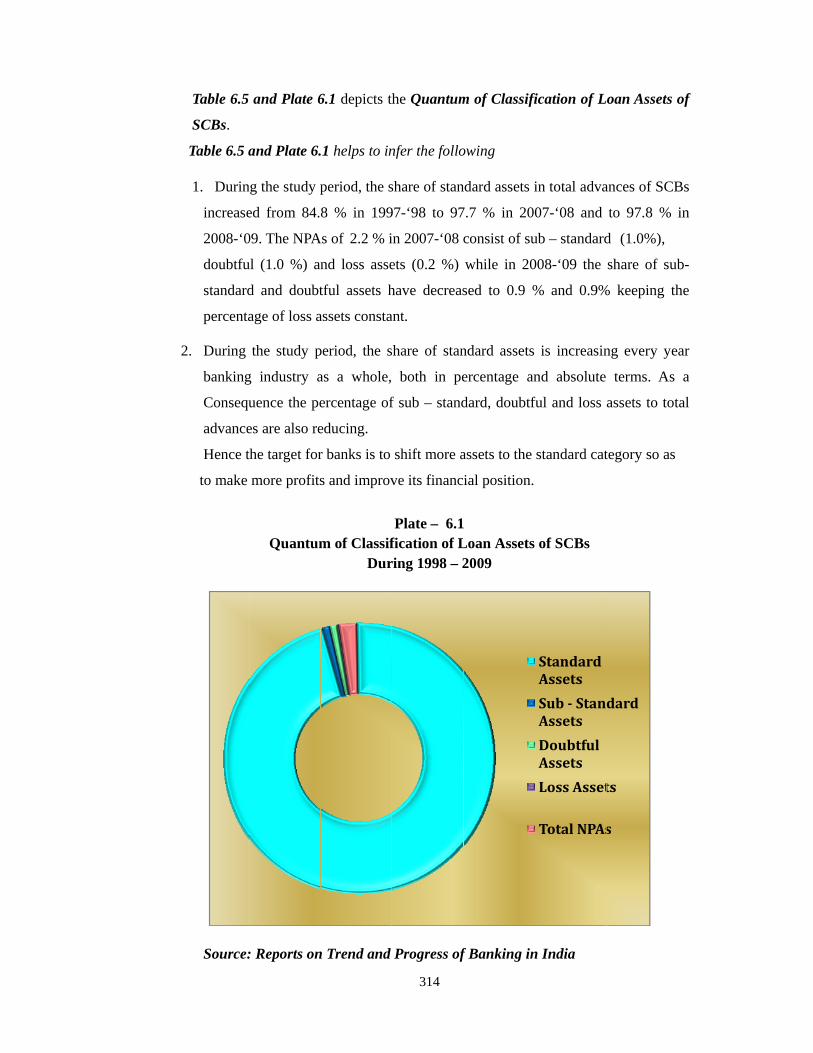
Table 6.5
SCBs.
Table 6.5 a
1. Durin
increase
2008-‘0
doubtfu
standard
percenta
2. During
banking
Consequ
advance
Hence t
to make
Source:
and Plate 6
and Plate 6.
ng the study p
ed from 84.
09. The NPA
ul (1.0 %) an
d and doubt
age of loss a
the study p
g industry a
uence the pe
es are also re
the target for
more profits
Quantum
: Reports on
6.1 depicts th
1 helps to in
period, the s
8 % in 199
As of 2.2 % i
nd loss asse
tful assets h
assets consta
period, the s
as a whole,
ercentage of
educing.
r banks is to
s and improv
m of ClassifDur
n Trend and
314
he Quantum
nfer the follo
share of stan
97-‘98 to 97
in 2007-‘08 c
ets (0.2 %)
have decreas
ant.
hare of stan
both in pe
f sub – stand
shift more a
ve its financ
Plate – 6.1fication of Lring 1998 – 2
Progress of
m of Classifi
owing
ndard assets i
7.7 % in 200
consist of su
while in 20
sed to 0.9 %
ndard assets
ercentage an
dard, doubtfu
assets to the
ial position.
Loan Assets 2009
f Banking in
fication of L
in total adva
07-‘08 and
ub – standard
008-‘09 the
% and 0.9%
is increasin
nd absolute
ful and loss
standard cat
of SCBs
n India
Standard Assets
Sub StanAssets
Doubtful Assets
Loss Asset
Total NPAs
oan Assets o
ances of SCB
to 97.8 % i
d (1.0%),
share of sub
% keeping th
ng every yea
terms. As
assets to tot
tegory so as
dard
ts
s
of
Bs
in
b-
he
ar
a
tal

S
se
in
ector-wise N
Banks
ector underta
n India from
Source: R
0
10
20
30
40
50
60
70
19919
NPAs of SC
s Provide cr
aking and n
1997-1998
Comp
Reports on T
97 –998
1998 –1999
19920
Priority
Bs:
redit facility
on-priority s
to 2008-200
position of N
Trend and P
99 –000
2000 –2001
200200
Sector N
315
y to various
sector segme
09 is exhibite
Plate 6.2
NPAs of Pub
Progress of B
1 –02
2002 –2003
2003200
Non – Priority
s sectors viz
ents. Bank G
ed in Plate 6
blic Sector B
Banking in I
3 –04
2004 –2005
20052006
Sector
z., priority s
Group-wise
6.2 and Tabl
Banks
India
5 –62006 –2007
2007 2008
Public Sector
sector, publ
NPA of PSB
le 6.4.
–82008 –2009
ic
Bs
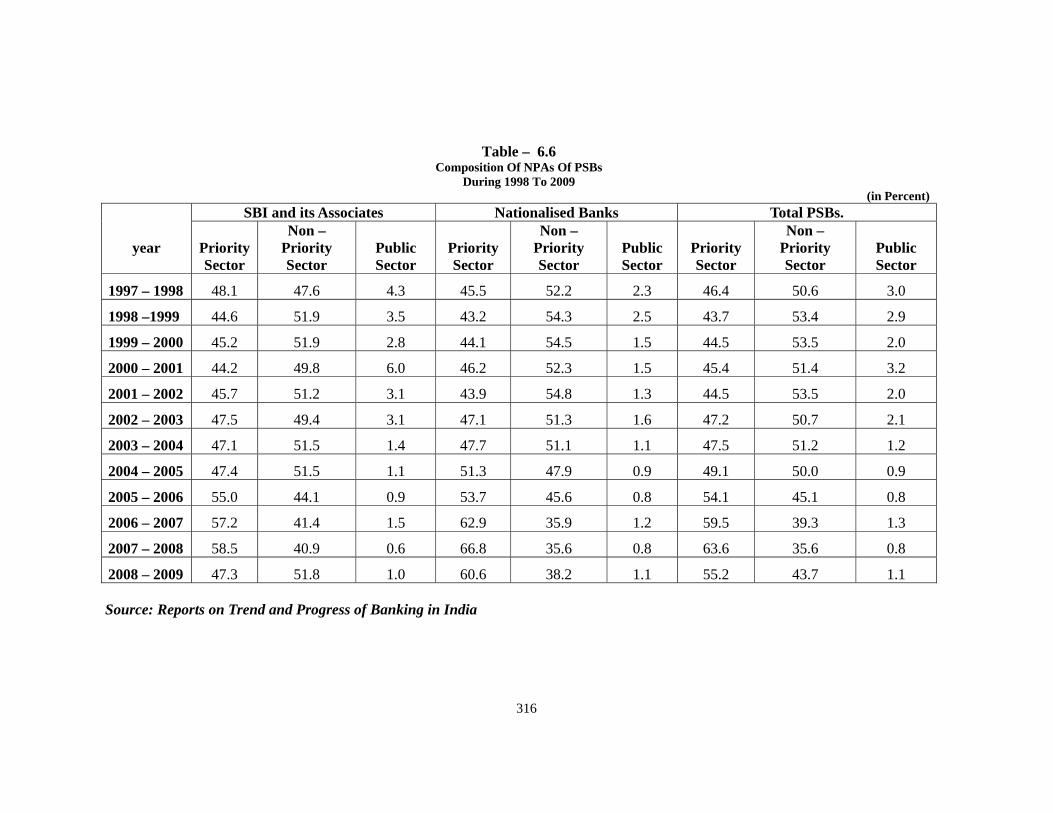
316
Table – 6.6 Composition Of NPAs Of PSBs
During 1998 To 2009 (in Percent)
year
SBI and its Associates Nationalised Banks Total PSBs.
Priority Sector
Non – Priority Sector
Public Sector
Priority Sector
Non – Priority Sector
Public Sector
Priority Sector
Non – Priority Sector
Public Sector
1997 – 1998 48.1 47.6 4.3 45.5 52.2 2.3 46.4 50.6 3.0
1998 –1999 44.6 51.9 3.5 43.2 54.3 2.5 43.7 53.4 2.9
1999 – 2000 45.2 51.9 2.8 44.1 54.5 1.5 44.5 53.5 2.0
2000 – 2001 44.2 49.8 6.0 46.2 52.3 1.5 45.4 51.4 3.2
2001 – 2002 45.7 51.2 3.1 43.9 54.8 1.3 44.5 53.5 2.0
2002 – 2003 47.5 49.4 3.1 47.1 51.3 1.6 47.2 50.7 2.1
2003 – 2004 47.1 51.5 1.4 47.7 51.1 1.1 47.5 51.2 1.2
2004 – 2005 47.4 51.5 1.1 51.3 47.9 0.9 49.1 50.0 0.9
2005 – 2006 55.0 44.1 0.9 53.7 45.6 0.8 54.1 45.1 0.8
2006 – 2007 57.2 41.4 1.5 62.9 35.9 1.2 59.5 39.3 1.3
2007 – 2008 58.5 40.9 0.6 66.8 35.6 0.8 63.6 35.6 0.8
2008 – 2009 47.3 51.8 1.0 60.6 38.2 1.1 55.2 43.7 1.1
Source: Reports on Trend and Progress of Banking in India
317
Table 6.6 depicts the Compositions of NPAs of PSBs..
Table 6.6 helps to infer the following
During the study period, the Compositions of NPAs of Public Sector Banks brings to
light certain interesting aspects.
It shows that in 1997-‘98 for SBI Group, the shares of NPAs was
48.1 % for the Priority Sector.
47.6 % for the Non – Priority Sector.
4.3 % for the Public Sector.
These Percentages were
47.3% for the Priority Sector.
57.8 % for the Non – Priority Sector and
1.0 5 for the Public Sector.
Similarly, in the case of NBs also, the NPAs composition for Non-Priority Sector has
increased, whereas, that for Priority Sector and Public Sector, there is a marginal
reduction.
It shows that not only advances to the Priority Sector are going Non-Performing, but
more than that, Non - Priority Sector lending is the area where the bankers need to
continuously examine the possibilities of loans becoming Non-Performing.
Gross NPA and Net NPA to Total Advances Ratio:
It is the ratio use to judge the actual burden of holding NPAs to banks. Bank Group-
wise Percentage Distribution Of Gross & NetNPAs To Total Advances Of SCBs in India
from 1997-1998 to 2008-2009 exhibited in Table 6.6 and Plate 6.3.
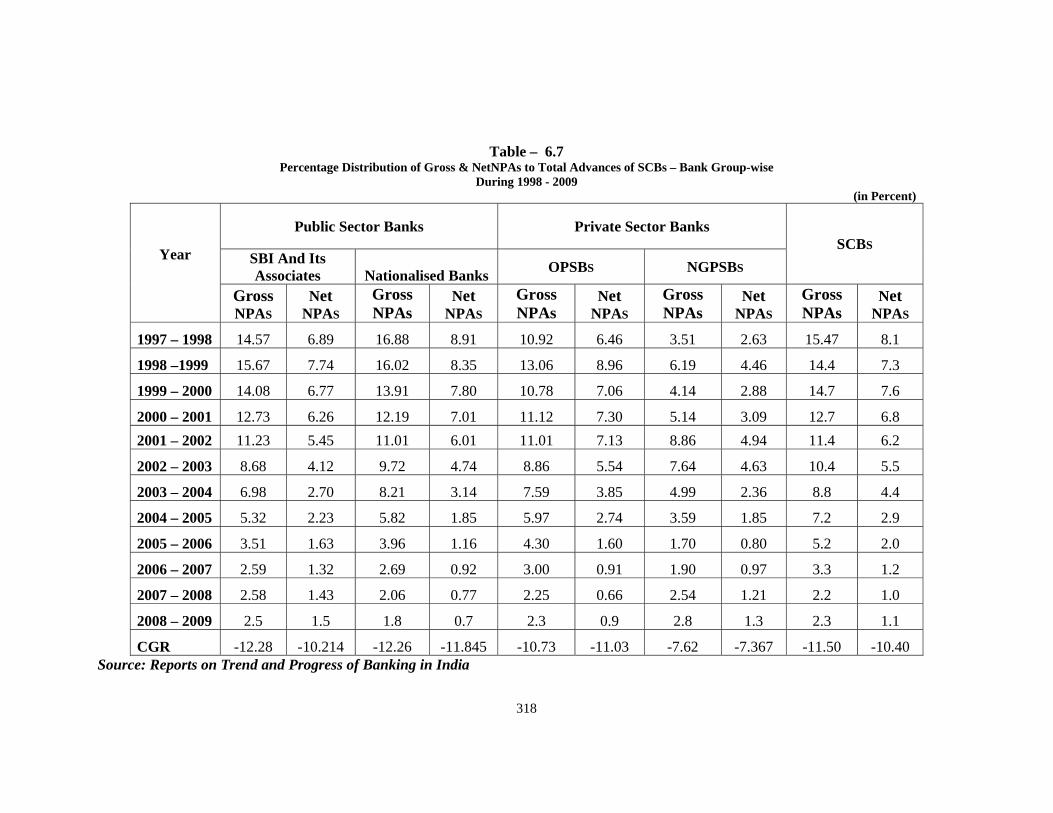
318
Table – 6.7 Percentage Distribution of Gross & NetNPAs to Total Advances of SCBs – Bank Group-wise
During 1998 - 2009 (in Percent)
Year
Public Sector Banks Private Sector Banks SCBS
SBI And Its Associates Nationalised Banks OPSBS NGPSBS
Gross NPAS
Net NPAS
Gross NPAs
Net NPAS
Gross NPAs
Net NPAS
Gross NPAs
Net NPAS
Gross NPAs
Net NPAS
1997 – 1998 14.57 6.89 16.88 8.91 10.92 6.46 3.51 2.63 15.47 8.1
1998 –1999 15.67 7.74 16.02 8.35 13.06 8.96 6.19 4.46 14.4 7.3
1999 – 2000 14.08 6.77 13.91 7.80 10.78 7.06 4.14 2.88 14.7 7.6
2000 – 2001 12.73 6.26 12.19 7.01 11.12 7.30 5.14 3.09 12.7 6.8 2001 – 2002 11.23 5.45 11.01 6.01 11.01 7.13 8.86 4.94 11.4 6.2
2002 – 2003 8.68 4.12 9.72 4.74 8.86 5.54 7.64 4.63 10.4 5.5
2003 – 2004 6.98 2.70 8.21 3.14 7.59 3.85 4.99 2.36 8.8 4.4
2004 – 2005 5.32 2.23 5.82 1.85 5.97 2.74 3.59 1.85 7.2 2.9
2005 – 2006 3.51 1.63 3.96 1.16 4.30 1.60 1.70 0.80 5.2 2.0
2006 – 2007 2.59 1.32 2.69 0.92 3.00 0.91 1.90 0.97 3.3 1.2
2007 – 2008 2.58 1.43 2.06 0.77 2.25 0.66 2.54 1.21 2.2 1.0
2008 – 2009 2.5 1.5 1.8 0.7 2.3 0.9 2.8 1.3 2.3 1.1
CGR -12.28 -10.214 -12.26 -11.845 -10.73 -11.03 -7.62 -7.367 -11.50 -10.40 Source: Reports on Trend and Progress of Banking in India
319
Table 6.7 and Plate 6.2 depicts the Percentage Distribution of Gross and Net
NPAs to Total Advances of SCBs , Bank Group-wise.
Table 6.7 and Plate 6.2 helps to infer the following
1. During the study period, the Ratio of Gross NPAs to Gross Advances of
ASCBs decreased from 15.7% in 1997-‘98 to 2.3 % in 2008-‘09.
Hence Bank Group-wise analysis shows the across the bank groups there has
been a significant reduction in the gross Non – Performing Assets.
With respect to Public Sector Banks Gross NPA have decreased from
14.5 % to 2.5 % in SBI group and
16.88 % to 1.8 % in NBs.
With regard to domestic Private Sector Banks, Gross NPA decreased from
10.92 % to 2.3 % in OPSBs and
3.51 % to 2.8 % in NGPSBs.
2. During the study period, the Ratio of Net NPAs to Net Advances of SCBs
decreased from 8.1 % in 1997-‘98 to 1.1 % in 2008-‘09. The ratio of net NPAs
to Net Advances of different Bank Groups also exhibited similar declining
trend during the period from 1997-‘98 to 2008-‘09.
3. The decline in NPAs is more evidenced across bank groups. This reflects on
the Positive impact of the measures taken by the Reserve Bank towards NPA
reduction and specifically due to the enactment of Securitisation and
Reconstruction of Financial Assets and Enforcement of Security Interest
(SARFAESI) Act, ensuring speedier recovery without intervention of courts or
tribunal.
4. It is revealed from Table – 6.7that the growth rate computed on semi-log scale
in respect of GNPA and NNPA shows a negative growth for ASCBs. The
negative growth rates of GNPAs and NNPAs for all bank groups are found to
be significant.
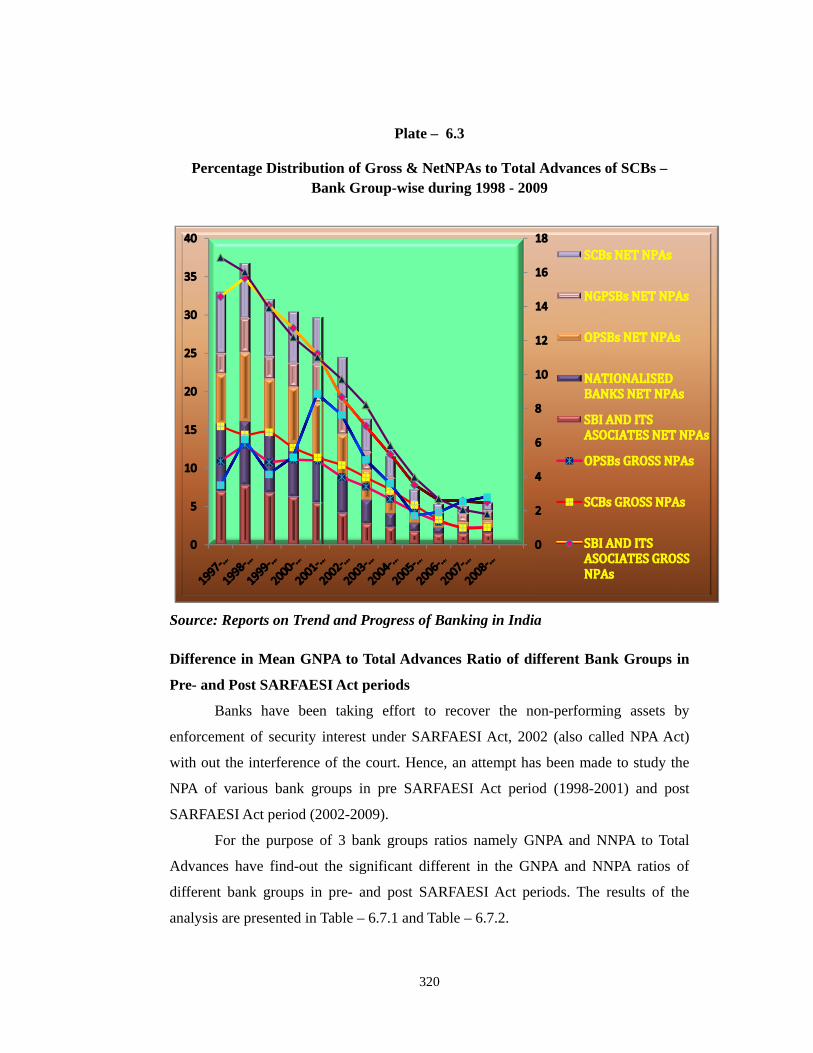
S
D
P
en
w
N
S
A
di
an
Percentag
Source: Repo
Difference in
Pre- and Pos
Banks
nforcement
with out the i
NPA of vario
ARFAESI A
For th
Advances ha
ifferent ban
nalysis are p
ge DistributB
orts on Tren
n Mean GN
st SARFAES
s have been
of security
interference
ous bank gr
Act period (2
he purpose o
ave find-out
nk groups in
presented in T
tion of GrosBank Group-
nd and Progr
NPA to Total
SI Act perio
n taking ef
interest und
of the cour
roups in pre
2002-2009).
of 3 bank g
the signific
n pre- and p
Table – 6.7.
320
Plate – 6.3
ss & NetNP-wise durin
ress of Bank
l Advances
ods
ffort to rec
der SARFAE
rt. Hence, an
e SARFAES
groups ratios
cant differen
post SARFA
1 and Table
PAs to Totalg 1998 - 200
king in India
Ratio of di
over the no
ESI Act, 200
n attempt ha
SI Act perio
s namely GN
nt in the GN
AESI Act pe
– 6.7.2.
l Advances o09
a
ifferent Ban
on-performin
02 (also call
as been made
od (1998-20
NPA and N
NPA and NN
eriods. The r
of SCBs –
nk Groups i
ng assets b
led NPA Ac
e to study th
001) and po
NNPA to Tot
NPA ratios o
results of th
in
by
ct)
he
ost
tal
of
he
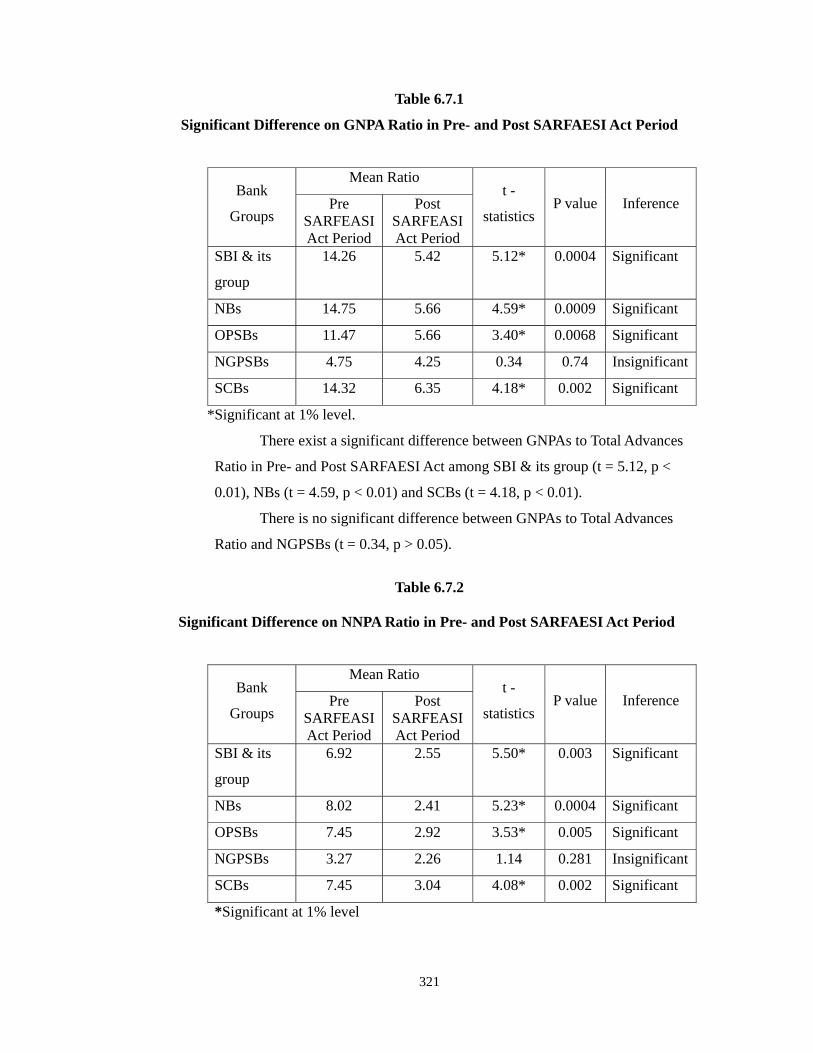
321
Table 6.7.1
Significant Difference on GNPA Ratio in Pre- and Post SARFAESI Act Period
Bank
Groups
Mean Ratio t -
statistics P value Inference Pre
SARFEASI Act Period
Post SARFEASI Act Period
SBI & its
group
14.26 5.42 5.12* 0.0004 Significant
NBs 14.75 5.66 4.59* 0.0009 Significant
OPSBs 11.47 5.66 3.40* 0.0068 Significant
NGPSBs 4.75 4.25 0.34 0.74 Insignificant
SCBs 14.32 6.35 4.18* 0.002 Significant
*Significant at 1% level.
There exist a significant difference between GNPAs to Total Advances
Ratio in Pre- and Post SARFAESI Act among SBI & its group (t = 5.12, p <
0.01), NBs (t = 4.59, p < 0.01) and SCBs (t = 4.18, p < 0.01).
There is no significant difference between GNPAs to Total Advances
Ratio and NGPSBs (t = 0.34, p > 0.05).
Table 6.7.2
Significant Difference on NNPA Ratio in Pre- and Post SARFAESI Act Period
Bank
Groups
Mean Ratio t -
statistics P value Inference Pre
SARFEASI Act Period
Post SARFEASI Act Period
SBI & its
group
6.92 2.55 5.50* 0.003 Significant
NBs 8.02 2.41 5.23* 0.0004 Significant
OPSBs 7.45 2.92 3.53* 0.005 Significant
NGPSBs 3.27 2.26 1.14 0.281 Insignificant
SCBs 7.45 3.04 4.08* 0.002 Significant
*Significant at 1% level
322
There exist a significant difference between NNPAs to Total Advances
Ratio in Pre- and Post SARFAESI Act among SBI & its associates (t = 5.50, p
< 0.01), NBs (t=5.23, p < 0.01), OPSBs (t = 3.53, p < 0.01) and SCBs (t =
4.08, p < 0.01).
There is no significant difference between NNPAs to Total advances
ratio in NGPSBs (t = 1.14, p > 0.05)
Gross and Net NPA to Total Assets Ratio:
Gross NPA to total assets reflects the portfolio of non-standard assets to total
assets of the bank while net NPA to total assets reflects the actual assets scenario after
making provisions. Bank Group-wise Percentage Distribution of Gross and Net NPAs
to Total Assets of SCBs in India from 1997-1998 to 2008-2009 is exhibited in Table
6.8 and Plate 6.4.
323
Table – 6.8 Percentage Distribution of Gross & Net NPAs to Total Assets of SCBs – Bank Group-wise
During 1998-2009 (in Percent)
Year
Public Sector Banks Private Sector Banks ASCBS SBI And Its
Associates Nationalised Banks OPSBS NGPSBS
Gross NPAs
Net NPAS
Gross NPAs
Net NPAS
Gross NPAs
Net NPAS
Gross NPAs
Net NPAS
Gross NPAs
Net NPAS
1997 – 1998 6.67 2.89 7.24 3.48 5.06 2.84 1.52 1.12 6.4 3
1998 –1999 6.52 2.94 6.83 3.26 5.78 3.56 2.26 1.59 6.2 2.9
1999 – 2000 5.88 2.60 6.00 3.15 5.22 3.27 1.60 1.08 5.5 2.7
2000 – 2001 5.11 2.34 5.45 2.95 5.22 3.27 2.06 1.18 4.9 2.5
2001 – 2002 4.39 2.00 5.21 2.69 5.20 3.23 3.90 2.10 4.60 2.30
2002 – 2003 3.48 1.58 4.66 2.16 4.34 2.61 3.76 2.16 4.00 1.90
2003 – 2004 2.91 1.09 3.86 1.40 3.64 1.77 2.42 1.10 3.30 1.20
2004 – 2005 2.49 1.01 2.96 0.91 3.15 1.39 1.56 0.80 2.52 0.92
2005 – 2006 1.92 0.88 2.24 0.64 2.50 0.91 0.96 0.43 1.86 0.66
2006 – 2007 1.57 0.79 1.64 0.53 1.24 0.54 1.07 0.54 1.46 0.58
2007 – 2008 1.53 0.84 1.25 0.44 1.38 0.60 1.40 1.10 1.30 0.57
2008 – 2009 1.4 0.8 1.1 0.4 1.3 0.5 1.8 0.8 1.3 0.6
CGR -8.979 -6.40 -9.06 -8.30 -8.28 -7.80 -3.92 -3.54 -8.86 -7.33 Source :Reports on Trend and Progress of Banking in India

324
Table 6.8 and Plate 6.3 depicts the Percentage Distribution of Gross and Net
NPAs to Total Assets of SCBs – Banks Group-Wise.
Table 6.8 and Plate 6.3 helps to infer the following 1. During the study period, the Ratio of NPAs to Total Assets of ASCBs
decreased from
6.4 % in 1997-‘98 to 1.3 % in 2008-‘09.
Hence Banks group-wise analysis shows that across the bank groups there has
been a significant reduction in the gross non-performing assets.
With respect to Public Sector Banks Gross NPAs has decreased from
- 6.67 % to 1.4 % in SBI Groups and
- 7.24 % to 1.1 % in NBs.
With regard to domestic Private Sector Banks, Gross NPA decreased from
- 7.24 % to 1.1 % in OPSBs and
- 1.52 % to 1.8 % in NGPSBs.
2. During the study period, the Ratio of Net NPAs to Net Assets of SCBs
decreased
from 3 % in 1997-‘98 to 0.6 % in 2008-‘09. The ratio of Net NPAs to Total
Assets of different bank groups also exhibited similar declining trend during
the period from 1997-’98 to 2008-‘09.
D
a
en
w
N
S
A
di
an
Percenta
Sourc
Difference in
nd Post SAR
Banks
nforcement
without the in
NPA of vario
ARFAESI A
For th
Assets have
ifferent ban
nalysis are p
0
2
4
6
8
10
12
14
16
age Distribu
B
ce:Reports o
n Mean GNP
RFAESI Ac
s have been
of security
nterference
ous bank gr
Act period (2
he purpose o
find-out th
nk groups in
presented in T
ution of Gro
Bank Group
on Trend and
PA to Total
ct periods
n taking ef
interest und
of the court
roups in pre
2002-2009).
of 3 bank g
he significan
n pre- and p
Table – 6.7(
325
Plate – 6.4
oss & Net N
p-wise durin
d Progress o
Assets Rati
ffort to rec
der SARFAE
t. Hence, an
e SARFAES
groups ratios
nt different
post SARFA
a).
4
NPAs to Tot
ng 1998-200
of Banking i
io of differe
over the no
ESI Act, 200
n attempt has
SI Act perio
s namely GN
in the GNP
AESI Act pe
0
1
2
3
4
5
6
7
tal Assets of
09
in India
ent Bank Gr
on-performin
02 (also call
s been made
od (1998-20
NPA and N
PA and NN
eriods. The r
ASCBs NE
NGPSBs N
OPSBs NE
NATIONABANKS NE
SBI AND IASOCIATENPAsSBI AND IASOCIATENPAsNATIONABANKS GR
NGPSBs G
f SCBs –
roups in Pre
ng assets b
led NPA Ac
e to study th
001) and po
NNPA to Tot
NPA ratios o
results of th
ET NPAs
NET NPAs
ET NPAs
ALISED ET NPAs
ITS ES NET
ITS ES GROSS
ALISED ROSS NPAs
GROSS NPAs
e-
by
ct)
he
ost
tal
of
he

326
Table 6.8.1
Significant Difference on GNPA Ratio in Pre- and Post SARFAESI Act Period
Bank Groups
Mean Ratio t -
statistics P
value Inference Pre SARFEASI Act Period
Post SARFEASI Act Period
SBI & its group 6.05 2.46 5.99* 0.0001 Significant
NBs 6.38 2.87 4.13* 0.0020 Significant
OPSBs 5.32 2.84 3.19* 0.0095 Significant
NGPSBs 1.86 2.11 -0.41 0.6889 Insignificant
SCBs 5.75 2.54 4.58* 0.0010 Significant
*Significant at 1% level.
There exist a significant difference between GNPAs to Total Assets Ratio in
Pre- and Post SARFAESI Act among SBI & its group (t = 5.99, p < 0.01), NBs (t =
4.13, p < 0.01) , OPSBs (t = 3.19, p < 0.01) and SCBs (t = 3.19, p < 0.01).
There is no significant difference between GNPAs to Total Advances Ratio
and NGPSBs (t = -0.41, p > 0.05).
Table 6.8.2
Significant Difference on NNPA Ratio in Pre- and Post SARFAESI Act Period
Bank Groups
Mean Ratio t -
statistics P value Inference Pre SARFEASI Act Period
Post SARFEASI Act Period
SBI & its group 2.69 1.12 6.45* 0.00007 Significant
NBs 3.21 1.15 4.60* 0.0009 Significant
OPSBs 3.23 1.44 3.35* 0.00738 Significant
NGPSBs 1.24 1.13 0.33 0.75036 Insignificant
SCBs 2.78 1.09 4.81* 0.00071 Significant
*Significant at 1% level
There exist a significant difference between NNPAs to Total Assets Ratio in
Pre- and Post SARFAESI Act among SBI & its associates (t = 6.45, p < 0.01), NBs (t
= 4.60, p < 0.01), OPSBs (t = 3.35, p < 0.01) and SCBs (t = 4.81, p < 0.01).
There is no significant difference between NNPAs to Total advances ratio in
NGPSBs (t = 0.33, p > 0.05).

327
Table – 6.9 Percentage Distribution of SCBs by Ratio of Net NPA to Net Advances
(in Percent)
Year
Public Sector Banks Private Sector Banks OPSBS NGPSBS
Total no. of
Banks
Upto 10%
Above 10% &
Upto 20%
Above 20%
Total no.of banks
Upto 10%
Above 10% &
upto 20%
Above 20%
Total No. of Banks
Upto 10%
Above 10% & Up to 20%
Above 20%
1997 – 1998 27 17 9 1 25 21 4 NIL 9 9 NIL NIL
1998 –1999 27 18 8 1 25 17 5 3 9 9 NIL NIL
1999 – 2000 27 22 5 NIL 24 18 5 1 8 8 NIL NIL
2000 – 2001 27 22 5 NIL 23 16 4 3 8 8 NIL NIL
2001 – 2002 27 24 3 NIL 22 17 3 2 8 8 NIL NIL
2002 – 2003 27 25 2 NIL 21 19 1 1 9 8 1 NIL
2003 – 2004 27 27 NIL NIL 20 18 2 NIL 10 9 NIL 1
Total No.Of Banks
Up To 2%
Above 2% &
Up To 5%
Above 5% & Up To 10%
Total No.Of Banks
Up To 2%
Above 2% &
Up To 5%
Above 5% & Up To 10%
Total No.Of Banks
Up To 2%
Above 2% &
Up To 5%
Above 5% & Up To 10%
2004 – 2005 28 19 7 2 20 4 12 4 9 5 3 1
2005 – 2006 28 23 5 NIL 20 11 7 2 8 6 2 NIL
2006 – 2007 28 27 1 NIL 17 15 1 1 8 7 1 NIL
2007 – 2008 28 28 0 NIL 15 15 NIL NIL 8 7 1 NIL
2008 – 2009 27 27 0 NIL 15 14 1 NIL 7 4 3 NIL Source : Reports on Trend and Progress of Banking in India

328
Table 6.9 gives the breakup of distribution of SCBs by ratio of Net NPAs to
net advances, indicating that PSBs have shown the maximum improvement
in containing and bringing down the NPAs.
During the study period, an analysis of the distribution of public
sector banks by ratio of net NPAs to net advances indicates that during the
year 2003-’04, no of PSBs with net NPAs up to 10% increased to 27 as
opposed to 17% in 1997-’98 and the number of banks with net NPAs in the
range of 10% to 20% declined to as opposed to 9 in 1997-’98. This shows
that the PSBs are trying to approach the international benchmark of 2% to
3% as the number of banks in the category of 10% and above are
continuously decreasing.
An analysis of the distribution of new private sector banks by net
NPAs to net advances indicate that during the year 2003-’04, number of
banks with net NPAs up to 10% decreased marginally from 9 in 1997-’98 to
9 in 2004-’05. No bank has net NPAs to net advances of over 10% since
1997-’98 but in the year 2002-’03 one bank has fallen in this category.
Similarly no bank has net NPAs to net advances of over 20% since 1997-’98
but in the year 2003-’04 one bank has fallen in this category.
An analysis of distribution of OPSBs by ratio of net NPAs to net
advances indicate that during the year 2003-’04 number of banks with net
NPAs up to 10% decreased by 3 to 18 as opposed to 21 in 1997-’98 and the
number of banks with net NPAs in the range of 10% to 20% and in the range
of 20% and above had decreased to 2, though the number of banks kept on
fluctuating in the intervening period.
During the period under study, the net NPAs to net advances of each
of the public sector banks as at end-March, 2009 was less than 2%. The
distribution of this ratio in case of other bank groups was also skewed, with
only 10 banks in the above 2% and below 5% category and only one bank in
the above 5% and below 10% category.
In sharp contrast to the distribution of the ratio during 2004-’05, no
bank had the net NPA to net advances ratio more than 10%. This suggests
that overall improvement in the financial health of Indian banks in the recent
year.