
PDF(97K) - Wiley Online Library
33
The Developing Economies, XXXIX-4 (December 2001): 333–65 GROWTH AND HUMAN DEVELOPMENT: COMPARATIVE LATIN AMERICAN EXPERIENCE GUSTAV RANIS FRANCES STEWART I. INTRODUCTION I T may not be necessary to dwell at great length on the basic notion that human development should be viewed as the bottom-line or basic objective of human activity, and that economic growth should be viewed as a contributor to it, rather than as the end product. The intellectual antecedents of this notion are well established in both the original “basic needs” approach of the International Labour Organization (ILO), later taken up by the World Bank, as well as Amartya Sen’s concept of capabilities. 1 In its broadest sense we define human development as permitting people to lead longer, healthier, and fuller lives. More narrowly, we can interpret human development as reflected in the status of people’s levels of health and education. This paper focuses on the two-way relationship between economic growth and human development, focused on Latin America. The intention here is to try and understand this relationship by discussing interesting and relevant regional case studies. Section II discusses the conceptual framework relating growth and human development. 2 Section III begins by outlining some of the relevant comparative international evidence, discussing the results and their implications for economic growth as related to human development. It then turns to the situation facing indi- vidual Latin American countries, focusing on differential trends over the past few decades. Section IV provides brief conclusions for policy. II. CONCEPTUAL FRAMEWORK Obviously there exists a strong two-way relationship between economic growth (EG) and human development (HD). On the one hand, EG provides the resources to –––––––––––––––––––––––––– The authors wish to acknowledge the contribution of Alejandro Ramirez to the earlier, global version of this paper (Ranis, Stewart, and Ramirez 2000). The research assistance of Tavneet Suri and Michael Wang is appreciated. 1 See, for example, Sen (1984), Streeten et al. (1981), and Fei, Ranis, and Stewart (1985). 2 Section II draws heavily on Ranis, Stewart, and Ramirez (2000).
Transcript of PDF(97K) - Wiley Online Library

The Developing Economies, XXXIX-4 (December 2001): 333–65
GROWTH AND HUMAN DEVELOPMENT: COMPARATIVELATIN AMERICAN EXPERIENCE
GUSTAV RANISFRANCES STEWART
I. INTRODUCTION
I T may not be necessary to dwell at great length on the basic notion that humandevelopment should be viewed as the bottom-line or basic objective of humanactivity, and that economic growth should be viewed as a contributor to it,
rather than as the end product. The intellectual antecedents of this notion are wellestablished in both the original “basic needs” approach of the International LabourOrganization (ILO), later taken up by the World Bank, as well as Amartya Sen’sconcept of capabilities.1 In its broadest sense we define human development aspermitting people to lead longer, healthier, and fuller lives. More narrowly, we caninterpret human development as reflected in the status of people’s levels of healthand education.
This paper focuses on the two-way relationship between economic growth andhuman development, focused on Latin America. The intention here is to try andunderstand this relationship by discussing interesting and relevant regional casestudies. Section II discusses the conceptual framework relating growth and humandevelopment.2 Section III begins by outlining some of the relevant comparativeinternational evidence, discussing the results and their implications for economicgrowth as related to human development. It then turns to the situation facing indi-vidual Latin American countries, focusing on differential trends over the past fewdecades. Section IV provides brief conclusions for policy.
II. CONCEPTUAL FRAMEWORK
Obviously there exists a strong two-way relationship between economic growth(EG) and human development (HD). On the one hand, EG provides the resources to
––––––––––––––––––––––––––The authors wish to acknowledge the contribution of Alejandro Ramirez to the earlier, global versionof this paper (Ranis, Stewart, and Ramirez 2000). The research assistance of Tavneet Suri and MichaelWang is appreciated.
1 See, for example, Sen (1984), Streeten et al. (1981), and Fei, Ranis, and Stewart (1985).2 Section II draws heavily on Ranis, Stewart, and Ramirez (2000).

THE DEVELOPING ECONOMIES334
permit sustained improvements in HD; on the other, sustained improvements in thequality of human capital are an important contributor to EG. Yet, while this symbi-otic two-way relationship is easily accepted, the specific factors linking them havenot been systematically explored. Nor has the question of priorities in the phasingof development policy. The customary assumption has been that growth must pre-cede progress in human development.
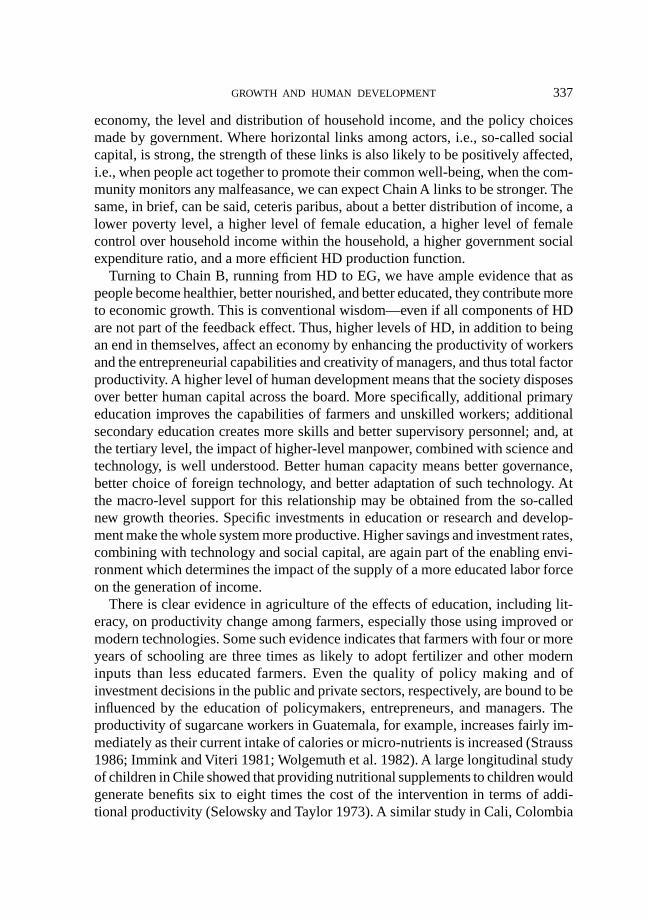
In Figure 1 we present two causal chains linking growth and human develop-
Fig. 1. The HD-GNP Cycle
HUMAN DEVELOPMENTCapability Enhancement
includingEmployment, Health, Education,
and Nutrition Attainments
Education Enrollment Ratios,Health Service Coverage,
Water and Sanitation
Capabilities ofEntrepreneurs,
Managers,Workers,Farmers
Organization ofProduction, R&D,
Technology Importsand Adaptation
HouseholdExpenditure on
Basic Needs andAllocation within
Households
GovernmentRevenue
andExpenditure
Ratios
HouseholdIncome
andPovertyRates
Socialand
PriorityRatios
Composition ofOutput and Exports
NGOsand
CommunityOrganizations
GNP
Distribution ofIncome
Social Capital
Policy EnvironmentForeignSavings
DomesticSavings
PhysicalCapital Stockand Additions
to It
Cha
in B
Cha
in A

335GROWTH AND HUMAN DEVELOPMENT
ment. Human development is featured “at the top,” in recognition of its status as thefundamental objective. With respect to Chain A, running from EG to HD, we maynote that, from a given level of income generated by past growth, we can trace theexpenditure of households, governments, and civil society, including NGOs, oninputs which serve to enhance human development, as defined above. The impactof given aggregate levels of average household income on HD, of course, dependsnot only on the average level but also on the distribution of that income and on theextent to which societal poverty has been alleviated. Thus, the nature of the growthprocess, i.e., how growth is generated, how employment sensitive, and how incomedistribution friendly it is, as well as how well it has succeeded in reducing poverty,will have an effect on how households spend their income. When income per capitais low or when it is badly distributed, the total expenditure of many households onHD, of course, is bound to be low. But, in general, lower-income households spenda higher proportion of their income on HD items than those with higher incomes. Itis also important to know who controls the allocation of expenditures within house-holds. Ceteris paribus, female-headed households spend more than male-headedhouseholds on health, education, food, potable water, etc. Latin American empiri-cal evidence, including for Bolivia, Brazil, Chile, Nicaragua, and Peru, indicatesthe effects of a positive income change on household demand for HD-related items.For example, in the case of Brazil it is estimated that, if the distribution of incomewere as equal as Malaysia’s, school enrollments of poor children would be 40 percent higher than they currently are (Birdsall, Ross, and Sabot 1995). While theevidence on the relationship between income and health is less extensive, studies inBrazil and Nicaragua suggest that household income has a significant effect on thedemand for health, but showing again a much higher response for low- than forhigh-income households. Symmetrically, while HD levels are negatively affectedby reductions in economic growth, the extent of the impact varies greatly with thedistribution of income and its change over time.
Health and education, of course, are also important public goods. The allocationof resources out of GNP for HD-improving public goods investments by variouslevels of government is partly a function of the relative size of public expenditures,partly a function of what proportion of these expenditures flow to the HD sectorsand, finally, partly a function of how they are allocated within each of the sectors.All this can be expressed in the form of three ratios:3 the public expenditure ratio,i.e., the proportion of GNP spent by various levels of government; the HD alloca-tion ratio, defined as the proportion of government expenditures going to the HDsectors; and, finally, the HD “priority ratio,” defined as the proportion of total HDexpenditures going to “priority areas,” e.g., primary versus tertiary education, asone example. This last concept is, of course, somewhat arbitrary, depending on a
3 Also see UNDP (1991).

THE DEVELOPING ECONOMIES336
country’s stage of development, e.g., in the early stages of development primaryeducation is more likely to be productive in terms of achieving advances in HD,while it is generally recognized that vocational and secondary education are likelyto have a larger impact on HD later on, with tertiary education still later, as thesystem moves into a leadership role in science and technology, yielding higherlevels of human development.
The underlying determinants of these three ratios, of course, include the tax ca-pacity of the system, the strength of the demand for military expenditures and othernon-HD priorities of government, each influenced by the interplay between bu-reaucratic forces and populist pressures. All three ratios are affected by the extentof decentralization, which tends to increase the total revenues available, is likely toraise the HD allocation ratio, and usually improves the HD priority ratio.4
Finally, the expenditures of civil society or NGO activity, on which informationis more scattered, are mostly heavily oriented towards HD objectives. Resourcesare primarily derived from private donations and governments, both foreign anddomestic. In most contexts, NGOs play a supplemental or even marginal role in afew areas, but occasionally, e.g., the case of the comedores populares in Peru, theyappear to represent a significant source of HD enhancement.
How expenditures in the direction of enhancing HD levels are allocated, and howeffective they are in raising HD levels is, of course, another central issue. This linkin the chain between expenditure inputs and HD outputs may be called the HDproduction function. The relationships embodied in this production function arecomplex, depending on both individual family and community behavior, the exist-ence of local knowledge about relevant technologies, and the complementarity orcompetitiveness among various inputs, such as preventive health, nutrition, educa-tion, etc. While, as noted above, some aspects of that production function have beenelucidated by detailed empirical work, it is generally still poorly understood. None-theless, there exists abundant evidence that female education tends to improve childnutrition and survival levels. A study of Brazil indicates that an increase in thenonlabor income of women increases the probability of child survival by twentytimes that of an equivalent increase in the nonlabor income of men (Thomas1990).5
It should be clear that the strength of the various links in Chain A is critical, thatit varies according to a large number of factors, including the structure of the
4 Decentralization of publicly provided services has recently been introduced in a wide range ofcountries. Tentative conclusions about its effectiveness are mixed, with apparent relative success inpromoting efficiency and contributing to HD in Indonesia, Malaysia, Chile, and Karnataka in In-dia, but less so in Argentina, Bangladesh, and Brazil. Mostly, local governments have been severelyconstrained in their ability to raise taxes as well as in the freedom of allocative decision making,and full democratic devolution has been rare. See Behrman (1995a, 1995b), Prud’homme (1995),Klugman (1994), and Ranis and Stewart (1994).
5 Also see Ainsworth, Beegle, and Nyamete (1995), Behrman (1990), and Behrman and Wolfe (1987).
337GROWTH AND HUMAN DEVELOPMENT
economy, the level and distribution of household income, and the policy choicesmade by government. Where horizontal links among actors, i.e., so-called socialcapital, is strong, the strength of these links is also likely to be positively affected,i.e., when people act together to promote their common well-being, when the com-munity monitors any malfeasance, we can expect Chain A links to be stronger. Thesame, in brief, can be said, ceteris paribus, about a better distribution of income, alower poverty level, a higher level of female education, a higher level of femalecontrol over household income within the household, a higher government socialexpenditure ratio, and a more efficient HD production function.
Turning to Chain B, running from HD to EG, we have ample evidence that aspeople become healthier, better nourished, and better educated, they contribute moreto economic growth. This is conventional wisdom—even if all components of HDare not part of the feedback effect. Thus, higher levels of HD, in addition to beingan end in themselves, affect an economy by enhancing the productivity of workersand the entrepreneurial capabilities and creativity of managers, and thus total factorproductivity. A higher level of human development means that the society disposesover better human capital across the board. More specifically, additional primaryeducation improves the capabilities of farmers and unskilled workers; additionalsecondary education creates more skills and better supervisory personnel; and, atthe tertiary level, the impact of higher-level manpower, combined with science andtechnology, is well understood. Better human capacity means better governance,better choice of foreign technology, and better adaptation of such technology. Atthe macro-level support for this relationship may be obtained from the so-callednew growth theories. Specific investments in education or research and develop-ment make the whole system more productive. Higher savings and investment rates,combining with technology and social capital, are again part of the enabling envi-ronment which determines the impact of the supply of a more educated labor forceon the generation of income.
There is clear evidence in agriculture of the effects of education, including lit-eracy, on productivity change among farmers, especially those using improved ormodern technologies. Some such evidence indicates that farmers with four or moreyears of schooling are three times as likely to adopt fertilizer and other moderninputs than less educated farmers. Even the quality of policy making and ofinvestment decisions in the public and private sectors, respectively, are bound to beinfluenced by the education of policymakers, entrepreneurs, and managers. Theproductivity of sugarcane workers in Guatemala, for example, increases fairly im-mediately as their current intake of calories or micro-nutrients is increased (Strauss1986; Immink and Viteri 1981; Wolgemuth et al. 1982). A large longitudinal studyof children in Chile showed that providing nutritional supplements to children wouldgenerate benefits six to eight times the cost of the intervention in terms of addi-tional productivity (Selowsky and Taylor 1973). A similar study in Cali, Colombia
THE DEVELOPING ECONOMIES338
found that a health/nutrition program increased the lifetime earnings of individualsfrom two and a half to nine times those of an illiterate worker (Selowsky 1981).The impact of education on the nature and growth of exports and of being able totake advantage of export opportunities, which, in turn, affects the aggregategrowth rate, is another way in which HD influences EG. Even so-called unskilledand semi-skilled workers normally need a literacy/numeracy-related discipline, ac-quired in primary and secondary school environments, to be effective in a factorycontext.
It should be noted that income distribution plays an important role once again inChain B. For example, while improvements in human development can affect in-come distribution, Alesina, Tabellini, and others6 have pointed out that an improvedincome distribution can mean faster growth as the median voter is satisfied anddoes not agitate for unwise macro-economic expansionary policies. A more un-equal distribution of income is likely to be associated with greater political instabil-ity and, therefore, more likely to interfere with growth. For example, a study of therelationship between schooling, income inequality, and poverty in eighteen LatinAmerican countries in the 1980s found that one-fourth of the variation in workers’incomes was accounted for by variations in schooling attainment. The study con-cluded that “clearly, education is the variable with the strongest impact on incomeequality” (Psacharopoulos et al. 1997). Education may also affect per capita in-come growth through its impact on the denominator, i.e., population growth. Thehigher the level of schooling, especially female schooling, the lower the levels offertility, often working their way through infant mortality rates. Just as in Chain A,the strength of the links in Chain B varies substantially across countries. For ex-ample, the increased supply of more educated people, by themselves, will notdo the job. One must also have the requisite demand, i.e., opportunities for employ-ing these same people, depending on investment levels, technology choices made,etc.
III. RELEVANT EMPIRICAL FINDINGS
A. Cross-Country Study
This section draws heavily on Ranis, Stewart, and Ramirez (2000). The reason-ing and inductive evidence discussed above led us to a set of hypotheses about thelinks between HD and EG in both causal directions. In the attempt to test thesehypotheses, we ran cross-country regressions including thirty-five to seventy-sixdeveloping countries (depending on data availability) for the years 1960–92, theresults of which we outline here. The intent was to identify the more significantvariables in Chain A affecting improvements in HD, using life expectancy shortfall
6 For example, Alesina and Rodrik (1994).

339GROWTH AND HUMAN DEVELOPMENT
reduction between 1970 and 1992 as the shorthand indicator of such improvement.7
Below are some of our key findings from this earlier work:1. GDP growth per capita was significant in all cases. Our results indicate that a 1
per cent increase in the growth rate would lead to a reduction in the life expect-ancy shortfall of 3 per cent.
2. The social expenditure ratio, i.e., the percentage of government expendituredevoted to HD-related activities, was significant in all equations; a 1 per centincrease in this ratio resulted in a 1.75 per cent reduction in the life expectancyshortfall.
3. Even more interesting was the finding that the social expenditure ratio’s impacton the level of human development seems to work through the female primaryeducational enrollment ratio, i.e., when the female primary enrollment ratio isadded in our equations the social expenditure ratio coefficient, while still of theright sign, ceases to be significant.
Turning to our empirical findings on Chain B, with GDP per capita income growthbetween 1970 and 1992 as the dependent variable, we found:1. The initial level of human development as summarized by life expectancy was
consistently highly significant.2. Adult literacy and life expectancy, as well as a more comprehensive definition
of human development (i.e., one including education), were significant in sev-eral equations.
3. The investment rate was consistently significant.4. A better distribution of income was associated with a higher rate of growth,
except in the case where regional dummies were introduced. This agrees withthe findings of Alesina and Perotti (1994) and Alesina and Rodrik (1994).
5. The initial level of GDP per capita was significant, carrying a negative sign,thus indicating the existence of some convergence among developing coun-tries, i.e., the lower that initial level, the more catch-up can be expected, pre-sumably through technology borrowing by latecomers.
Given these findings of positive links between EG and HD, we may note that anindividual country may find itself in a virtuous cycle, with vigorous growth leadingto improved human development, and improved levels of human development inturn leading to vigorous growth, i.e., especially if the links in both these chains arestrong. But it is also true that if these links are strong weak growth will lead to weakhuman development and weak human development in turn will lead to weak growth,which would be tantamount to a vicious cycle. On the other hand, we may also note
7 Shortfall reduction refers to the closing of the gap with the longest country life expectancy onrecord (see UNDP 1995). We also tried regressions with changes in adult literacy rates and a com-bined, equally weighted, measure of the two. The results were similar but the number of observa-tions more limited.
THE DEVELOPING ECONOMIES340
that there may exist two types of “lopsidedness” if the linkages between HD andEG happen to be weak. One could, for example, encounter good growth but poorhuman development (EG-lopsidedness), e.g., because there is a low public expen-diture ratio, or one could encounter good human development and poor growth(HD-lopsidedness), e.g., because the investment rate is low. We may also hypoth-esize that such lopsided cases are unlikely to persist for very long, but turn intoeither vicious or virtuous cycle cases over time.
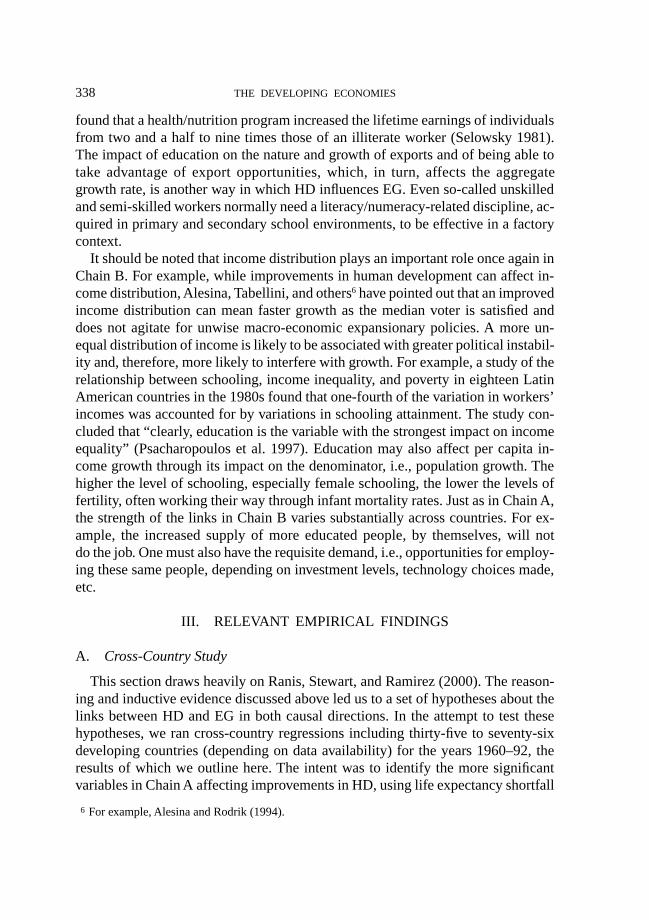
In order to examine these various categories of performance more closely, wecompared all developing countries for which we have data between 1960 and 1992.Figure 2 illustrates this, with each country compared to the average, weighted bypopulation, with respect to their human development and economic growth perfor-mance. We note the existence of four quadrants: virtuous and vicious cycles in thenortheast and southwest quadrants, respectively, and the two different types of lop-sidedness in the northwest and southeast quadrants. Seven out of the eight virtuousquadrant countries are in East Asia, while twenty-five out of forty-one in the vi-cious cycle category are in sub-Saharan Africa, with ten in Latin America. More-over, there are a substantial number of HD-lopsided cases but very few EG-lop-
HD-Lopsided Virtuous
Vicious EG-Lopsided
AfricaEast AsiaLatin AmericaMiddle EastSouth Asia
60
50
40
30
20
10
−3 −2 −1 0 1 2 3 4 5 6 7 8(%)�
GDP per capita growth
HD
I* s
hort
fall
redu
ctio
n
(%)�
Fig. 2. Economic Growth and Human Development, 1960–92
Source: Ranis, Stewart, and Ramirez (2000).Notes: 1. The horizontal and vertical lines defining the four quadrants represent devel-
oping country averages, weighted by population.2. HDI* pertains to the component of the Human Development Index (HDI) con-
taining life expectancy, school enrollment, and literacy rates.
341GROWTH AND HUMAN DEVELOPMENT
sided cases. Eleven of the fourteen HD-lopsided countries are in Latin America,while the four EG-lopsided cases are Egypt, Pakistan, Mauritius, and Lesotho. Fromthe point of view of policy, of course, an important question is how a country iscapable of transiting over time, presumably with the objective of ending up in avirtuous cycle at the end of the day. By examining the location of our countries ona global basis, described in Table I, in each of the three decades between 1960 and1992, we are in a position to make the following observations:1. Eighteen of the thirty-four countries that were in a vicious cycle in the 1960s
remained in that category throughout. Most of these are sub-Saharan Africancountries, which started with very low HD levels, handicapping their growth.Their subsequent low growth rates, followed by the debt crisis, prevented themfrom generating the necessary resources to improve their HD levels.
2. Between the 1960s and 1970s, six countries moved from vicious to EG-lop-sided positions. But, of these six, four fell back to the vicious cycle category inthe 1980s. Three moved from vicious to HD-lopsided, including Honduras,Algeria, and Madagascar, of which only Madagascar returned to the viciouscycle. Kenya moved from vicious to virtuous in the 1970s, and subsequentlyfell back to vicious. Sri Lanka and Botswana were the only two countries thatmanaged to move from the vicious to virtuous category on a sustained basis.
3. Seven countries were EG-lopsided in 1960 to 1970, but none stayed in thatcategory throughout. They all moved into the vicious category, and one—Paki-stan—reverted to EG-lopsided in the 1980s. Brazil and Egypt enjoyed rela-tively fast growth of over 3 per cent in the 1960s and about 6 per cent in the1970s, but did not utilize this opportunity to improve their HD levels substan-tially. In Pakistan and Egypt, public expenditures on health and education werelow, partly due to high military expenditures. Pakistan’s human developmentsuffered especially from discrimination against females. In the case of Brazil,the highly unequal income distribution, a Gini of 0.634, was one reason whyreasonably good growth did not translate into HD improvements.
4. Costa Rica was the only one of the thirteen HD-lopsided countries in the 1960sto stay in that cycle throughout. Of these thirteen, four—Chile, China, Colom-bia (later falling back to HD-lopsided), and Indonesia—moved into the virtu-ous cycle. In these cases, early HD progress enabled them to take advantage ofeconomic policy reforms to help generate and reinforce economic growth. Egali-tarian income distribution also assisted the movement towards a virtuous cycle.Three, Myanmar, Peru, and El Salvador,8 moved initially from HD-lopsidedinto the vicious category, with the latter two moving back into HD-lopsided-
8 Iraq made the same move between the 1960s and 1970s, but data are not available for the laterperiod, when conflict is likely to have damaged both HD and EG.

THE DEVELOPING ECONOMIES342
TABLE I
VIRTUOUS, VICIOUS, AND LOPSIDED PERFORMANCE, 1960–92
Country 1960–70 1970–80 1980–92
AfricaBenin Vicious Vicious ViciousBotswana Vicious Virtuous VirtuousBurkina Faso Vicious Vicious ViciousBurundi Vicious Vicious ViciousCameroon Vicious EG-lopsided ViciousCentral African Republic Vicious Vicious ViciousChad Vicious Vicious ViciousCongo Vicious EG-lopsided ViciousCôte d’Ivoire EG-lopsided Vicious ViciousGabon EG-lopsided Vicious ViciousGhana Vicious Vicious ViciousKenya Vicious Virtuous ViciousLesotho Virtuous EG-lopsided ViciousMadagascar Vicious HD-lopsided ViciousMalawi Vicious EG-lopsided ViciousMali Vicious Vicious ViciousMauritius HD-lopsided EG-lopsided EG-lopsidedNiger Vicious Vicious ViciousNigeria Vicious Vicious ViciousRwanda Vicious Vicious ViciousSenegal Vicious Vicious ViciousSierra Leone EG-lopsided Vicious ViciousSouth Africa Virtuous Vicious ViciousSudan Vicious Vicious ViciousTanzania Vicious Vicious ViciousTogo EG-lopsided Vicious ViciousZaire Vicious Vicious ViciousZimbabwe Vicious Vicious Vicious
Latin America & CaribbeanArgentina Vicious Vicious HD-lopsidedBarbados Virtuous HD-lopsided HD-lopsidedBolivia Vicious Vicious HD-lopsidedBrazil EG-lopsided EG-lopsided ViciousChile HD-lopsided HD-lopsided VirtuousColombia HD-lopsided Virtuous HD-lopsidedCosta Rica HD-lopsided HD-lopsided HD-lopsidedDominican Republic HD-lopsided EG-lopsided ViciousEl Salvador HD-lopsided Vicious HD-lopsidedGuatemala HD-lopsided EG-lopsided ViciousHaiti Vicious Vicious ViciousHonduras Vicious HD-lopsided HD-lopsidedJamaica Virtuous Vicious ViciousMexico Virtuous Virtuous HD-lopsidedNicaragua Virtuous Vicious HD-lopsidedPanama Virtuous Virtuous HD-lopsidedParaguay Vicious EG-lopsided Vicious
. . . . . . . . . . . . . . . . . . . . . . . . . . . . . . . . . . . . . . . . . . . . . . . . . . . . . . . . . . . . . . . . . . . . . . . . . . . . . . . . . . . . . . . . . . . . . . . . . . . . . . . . . . . . . . . . . . . . . . . . . . . . . . .. . . . . . . . . . . . . . . . . . . . .

343GROWTH AND HUMAN DEVELOPMENT
TABLE I (Continued)
Country 1960–70 1970–80 1980–92
Peru HD-lopsided Vicious HD-lopsidedTrinidad & Tobago Vicious EG-lopsided HD-lopsidedUruguay Vicious Vicious HD-lopsidedVenezuela HD-lopsided HD-lopsided Vicious
South AsiaIndia Vicious Vicious EG-lopsidedNepal Vicious Vicious ViciousPakistan EG-lopsided Vicious EG-lopsidedSri Lanka Vicious Virtuous VirtuousBangladesh Vicious Vicious Vicious
East AsiaChina HD-lopsided Virtuous VirtuousHong Kong Virtuous Virtuous VirtuousIndonesia HD-lopsided Virtuous VirtuousKorea, Republic of Virtuous Virtuous VirtuousMalaysia Virtuous Virtuous VirtuousMyanmar HD-lopsided Vicious ViciousPhilippines HD-lopsided EG-lopsided ViciousSingapore Virtuous Virtuous VirtuousThailand Virtuous Virtuous Virtuous
Middle EastAlgeria Vicious HD-lopsided HD-lopsidedEgypt EG-lopsided EG-lopsided ViciousMorocco Vicious EG-lopsided HD-lopsidedTurkey Virtuous HD-lopsided HD-lopsided
Source: Ranis, Stewart, and Ramirez (2000).
. . . . . . . . . . . . . . . . . . . . . . . . . . . . . . . . . . . . . . . . . . . . . . . . . . . . . . . . . . . . . . . . . . . . . . . . . . . . . . . . . . . . . . . . . . . . . . . . . . . . . . . . . . . . . . . . . . . . . . . . . . . . . . .. . . . . . . . . . . . . . . . . . . . .
. . . . . . . . . . . . . . . . . . . . . . . . . . . . . . . . . . . . . . . . . . . . . . . . . . . . . . . . . . . . . . . . . . . . . . . . . . . . . . . . . . . . . . . . . . . . . . . . . . . . . . . . . . . . . . . . . . . . . . . . . . . . . . .. . . . . . . . . . . . . . . . . . . . .
. . . . . . . . . . . . . . . . . . . . . . . . . . . . . . . . . . . . . . . . . . . . . . . . . . . . . . . . . . . . . . . . . . . . . . . . . . . . . . . . . . . . . . . . . . . . . . . . . . . . . . . . . . . . . . . . . . . . . . . . . . . . . . .. . . . . . . . . . . . . . . . . . . . .
ness in the 1980s. Venezuela, initially in the HD-lopsided sector, stayed therefor two decades, before moving into the vicious cycle category by the 1980s.The Dominican Republic, Guatemala, and the Philippines initially moved toEG-lopsided, but subsequently fell back into the vicious cycle. The reasons forthe failure to move into high economic growth included the debt situation, pooreconomic policies, and internal disturbances. Consequently, these countries werenot able to maintain progress in HD.
5. In the 1960s, thirteen countries were in the virtuous cycle category. Of thesethirteen, five remained in this category throughout. Five fell into the HD-lop-sided and three into the vicious categories.9 Mostly, the countries that fell backwere subject to the depressing effects of the 1980s debt crisis on economicgrowth.
6. Note, importantly, that lopsidedness was only a temporary condition in all cases,
9 Lesotho moved from virtuous to vicious by way of EG-lopsidedness.

THE DEVELOPING ECONOMIES344
except Costa Rica.10 The most significant finding here is that HD-lopsidednesspermitted movement towards a virtuous cycle—this occurred about a third ofthe time. However, in the case of EG-lopsidedness, all the cases reverted to avicious cycle. Very few countries indeed managed to go directly from vicious tovirtuous. Some countries succeeded in moving to a virtuous cycle, by first movinginto HD-lopsidedness, from where it was possible to move into the virtuouscategory. Our analysis therefore suggests that it is not possible to move to virtu-ous via EG-lopsidedness, but more likely via HD-lopsidedness.
The significance of all this may now be summarized. It seems clear that lopsid-edness, as mentioned earlier, proved to be a temporary condition for all but onecountry, i.e., Costa Rica. One-third of the HD-lopsided became virtuous; all theEG-lopsided became vicious. An important conclusion flowing from this is that thebest path from vicious to virtuous is to attempt to move through HD-lopsidedness.In common sense terms this means a system should first strengthen the links in itsChain A by shifting resources to education and health in order to improve its humandevelopment; only then will it be able to move from HD-lopsided, through a strength-ening of links in Chain B, to further enhance growth. While all this is basically aniterative process, the phasing of policy change does appear to be critical. Thus theoften held position that we should first “get the fundamentals right” to ensure goodeconomic growth, while human development has to wait, is in error. Human devel-opment improvement must precede or at least accompany the improvement in growth.What was intuitively seen as correct by only a few observers11 generally holds upwell empirically in this very simple framework.
B. Case Studies of Some Latin American Countries
Figure 2 clearly shows the relationship between the Human Development Index(HDI) and per capita GDP growth. As can be seen, this primarily is driven by theinter-group variations among the various regional groups that we consider. Analyz-ing each region individually becomes more difficult statistically due to the fact thatthe intra-group variation is naturally much smaller. A large time series would prob-ably have provided more variation, but is not available. Latin America, in this sense,is no exception in terms of the lack of sufficient variation across the member coun-tries of this group to formally test our hypotheses, as we can see from Figure 2.However, we can demonstrate many interesting cases of Latin American countries,cited extensively in various country studies, which conceptually illustrate the rela-tionship between human development and economic growth posited above.
10 One of the explanations of why Costa Rica was able to sustain HD achievements despite loweconomic growth resides in its early, strong, and sustained commitment to HD, exemplified byabolition of its army in 1948 and its heavy investment (at 10 per cent of GDP) on health andeducation between 1970 and 1992.
11 For example, Adelman and Morris (1967).

345GROWTH AND HUMAN DEVELOPMENT
Let us thus now focus more explicitly on Latin America and the Caribbean, withthe help of Table II.
We chose these ten Latin American countries as case studies or examples ofgood, poor, and questionable performance. The poor performers are Brazil, Haiti,Jamaica, and Venezuela; the good performers Barbados, Chile, Colombia, andMexico;12 and the questionable performers Argentina and Peru. We placed these tencountries into these three performance groups, given the “virtuous cycle” as theultimate aim of a country and chose the countries in each group as typologicalrepresentative group.
It should be noted that we are not concerned with the “level” of per capita in-come or the “level” of human development, but with “changes” in per capita in-come and its two-way relationship with “changes” in human development, i.e., HDprogress as measured by life expectancy shortfall reduction. Of all the Latin Ameri-can countries listed, Brazil, Jamaica, Venezuela, and Haiti are the worst perform-ers; Chile, Mexico, Colombia, and Barbados are the best, with Argentina and Perugiving signs of moving towards a virtuous cycle. In what follows, we present thumb-nail sketches of the performance of some of these countries over the three decades.
1. Poor performersBrazil (EG-lopsided, EG-lopsided, vicious). More so than perhaps any other coun-
try in Latin America, Brazil typifies the case where a development approach, fo-cused primarily on rapid economic growth, with insufficient regard for the linksbetween growth and human development, eventually led to poor performance inboth dimensions.
TABLE II
1960–70 1970–80 1980–92
Argentina Vicious Vicious HD-lopsidedBarbados Virtuous HD-lopsided HD-lopsidedBrazil EG-lopsided EG-lopsided ViciousChile HD-lopsided HD-lopsided VirtuousColombia HD-lopsided Virtuous HD-lopsidedHaiti Vicious Vicious ViciousJamaica Virtuous Vicious ViciousMexico Virtuous Virtuous HD-lopsidedPeru HD-lopsided Vicious HD-lopsidedVenezuela HD-lopsided HD-lopsided Vicious
12 Costa Rica is also a good performer in this region. However, it was not included in this study as theaim was to pick typical performers. Costa Rica remained in the HD-lopsided quadrant throughoutthe period in question, while Barbados, Chile, Colombia, and Mexico were in the virtuous cycle atleast once over this time period.

THE DEVELOPING ECONOMIES346
For much of the past three decades, Brazil posted one of the more remarkablegrowth rates in the developing world. An ambitious modernization program in the1960s and 1970s premised on capital accumulation, import-substituting industrial-ization, and a rapidly growing labor force, helped produce average annual GDPgrowth rates in excess of 9 per cent between 1960 and 1985 (Barros, Mendonca,and Rocha 1995, p. 237).
Nevertheless, this quite spectacular growth did not produce a commensurateimpact on human development. Brazil’s educational indicators are considerablyworse than those of Latin America’s seven other upper-middle-income countries(Argentina, Chile, Colombia, Costa Rica, Mexico, Uruguay, and Venezuela): theilliteracy rate for the population aged fifteen years and older in Brazil is approxi-mately 10 per cent higher than the average of those countries; the school attendancerate for children six to eleven years old is 15 percentage points lower; and theproportion of repeaters in the first grade is 10 percentage points higher.13 Healthindicators are also relatively weak. While Brazil experienced quite a notable de-cline in its infant mortality rate (IMR) over the last fifty years—decreasing in abso-lute terms by more than 100 deaths per 1,000 live births—infant mortality is stillhigher than in almost every other Latin American country (Barros, Mendonca, andRocha 1995, p. 262).
The chief culprit in Brazil’s relatively disappointing HD record appears to be ahighly unequal income distribution. Having inherited a very unequal distribution ofpower and land from its colonial past, Brazil did little to modify these patternsthrough two decades of quite spectacular growth. For example, it has never at-tempted any serious program of land reform (Maddison et al. 1992, p. 12). As aresult, Brazil has one of the poorest distributions of income.
While the rather unequal income distribution adversely affected household ex-penditure on human development, Brazil’s poor HD allocation and priority ratiosalso affected the quantity and quality of public spending on social sectors. Throughoutthe 1960–92 period, HD-allocation ratios were comparatively low. Brazil’s com-bined expenditure on education and health as a proportion of total government ex-penditure was between one-fourth and one-half that of Argentina and Chile (IMF,various years). Furthermore, Brazil’s social spending declined at the end of the1970s, with education particularly affected. The share of total expenditure devotedto education decreased from about 6.5 per cent in the 1970s to only about 3 per centin the 1980s (IMF, various years) and was geared largely to higher education, whileneglecting technical schools.
Brazil’s priority ratios in health were also deficient. Although large numbers stilldie as a result of infectious diseases, public expenditure on health has been charac-terized by a large and growing emphasis on curative and a corresponding decline
13 See Amadeo et al. (1993).

347GROWTH AND HUMAN DEVELOPMENT
on preventive medicine. The portion of public expenditure on curative services in-creased from 35.8 per cent in 1965 to 84.6 per cent in 1982, while that for preven-tion decreased from 64.1 per cent to 15.4 per cent over the same time period(Maddison et al. 1992, p. 104). Sophisticated treatments in São Paulo, includingheart surgery and organ transplants, are estimated to consume 40 per cent of allpublic resources allocated to health, while benefiting only 3 per cent of the popula-tion (EIU 1998a, p. 19).
Haiti (vicious, vicious, vicious). Due to strong links, Haiti has found itself on atrajectory of low growth and poor human development for most of the past threedecades. Although growth was moderate during the 1960s and 1970s, averaging5.3 per cent during the second half of the 1970s (World Bank, Trends in DevelopingEconomies, 1991, p. 254), improvements in real per capita income failed to trans-late into widespread gains in human development due to a highly unequal distribu-tion of income. While there is disagreement about the magnitude of inequality,14 itis clear that income was (and still is) concentrated within urban areas, a significantresult considering that three-quarters of the population lives in rural areas and thatagricultural production has declined on a per capita basis since the 1970s (WorldBank, Trends in Developing Economies, 1991, p. 254).
Haiti’s tax system served to weaken both expenditure ratios and increased in-come inequality, with collection weak and the structure highly regressive. Publicexpenditure on primary education as a per cent of GNP, for example, decreasedfrom approximately 0.9 per cent a year in 1965 to 0.6 per cent a year by 1985(World Bank 1993, p. 70, Table 4.11). Per capita public health expenditures havealso declined more than 15 per cent from 1980 to 1985 (World Bank 1987, Statisti-cal Appendix, Table 11.4).
The priority ratios were also unfavorable, especially in the health sector. Overhalf of the physicians employed by the Ministry of Public Health and Populationreside in the capital, leaving only 1.4 physicians per 10,000 people in rural areas(World Bank 1987, p. 103). This has worsened the efficiency of the HD productionfunction, leading to a high incidence of malnutrition and morbidity. About 30 percent of rural children and 48 per cent of urban children are anemic, while 90 percent of deaths among one-to-four-year-old children are associated with malnutri-tion and diarrheal diseases (World Bank 1987, p. 103).
As for Chain B, rampant corruption leading to highly inefficient public invest-ment decisions have continuously dampened growth. Negative reinforcement be-tween the two chains has also worsened over time, i.e., during 1980 to 1991, realGNP per capita fell by about 2 per cent per annum (World Bank 1996, p. 225). Thisdecline further deteriorated living standards so that Haiti’s growth and HD record
14 See, for example, Lundahl (1996).

THE DEVELOPING ECONOMIES348
today resemble those of sub-Saharan African countries rather than those of its Car-ibbean neighbors.15
Jamaica (virtuous, vicious, vicious). Jamaica found itself in a virtuous cycle dur-ing the 1960s, largely as a result of rapid economic growth, combined with a stronggovernment commitment to HD. Development of the bauxite and alumina indus-tries stimulated development, with GDP increasing at an average of 6.3 per cent peryear during the 1952–72 boom period (Stone and Wellisz 1993, p. 161). This, inturn, increased public expenditure on HD goods, with social expenditure increasingfrom 5.6 per cent in 1960 to 12.1 per cent of GDP in 1975 (Stone and Wellisz 1993,p. 171). The policy setting during the 1960s clearly favored human development.The two major political parties sharing power at the time were committed to socialreform, expanding education and health services, constructing low-income hous-ing, and supporting small farmers through extension services. Primary school en-rollment expanded from 65 to 85 per cent, and secondary enrollment from 15 to 58per cent from 1960 to 1970, while life expectancy increased and infant mortalitydeclined.
During the 1970s severe external terms of trade shocks led to sustained eco-nomic contraction, with sharp cutbacks in public expenditure and increases in thepoverty rate (World Bank, Trends in Developing Economies, 1991, p. 286). Thiswas followed by severe adjustment policies in the 1980s. Real spending on educa-tion and health fell about 30 per cent between 1980 and 1986 (World Bank, Trendsin Developing Economies, 1994, p. 240). This decline in social spending was fur-ther accentuated by the adjustment policies of the 1980s, leading to a deteriorationin nutrition, education, and health levels, although debate surrounds the exact mag-nitude of such effects.16 The quality of public education has declined not only be-cause of reduced public expenditure, but also because of a poor HD priority ratiopartly due to the top-down allocation of resources. Expenditure per head on ter-tiary-level students was excessively high compared with spending on secondaryand primary students (EIU 1997a, p. 16). The neglect of primary education hasresulted in serious literacy problems among the student population, with some 30per cent of those leaving the primary school system thought to be functionally illit-erate (EIU 1997a, p. 16).
Links in both chains were consequently weakened. The retreat into a viciouscycle, however, was not due entirely to external factors. On the one hand, duringthe 1970s populist domestic policies eroded investor confidence, further weaken-ing the links in Chain B. Jamaica’s increased economic dualism also meant thatincome distribution worsened, especially in the rural areas, with a negative impacton EG. Indeed, Jamaica’s already extremely unequal distribution of income wors-
15 See World Bank (1987).16 See, for example, Behrman and Deolalikar (1991) and Cornia and Stewart (1987).

349GROWTH AND HUMAN DEVELOPMENT
ened during the 1960s and 1970s. By 1971/72, the bottom 58 per cent of house-holds earned less than 16 per cent of total income, while the top 10 per cent earned50 per cent (Boyd 1988, p. 135). On the other hand, the adjustment policies of the1980s involved substantial reductions in public expenditure on HD, weakening thelinks in Chain A.
Venezuela (HD-lopsided, HD-lopsided, vicious). Along with Jamaica, Venezuelarepresents a case where natural resource abundance has led to “boom and bust”cycles reminiscent of the Dutch Disease. During times of high oil revenue, HDprogress has typically been very good, largely as a result of expansionary spendingprograms, only to deteriorate drastically once oil prices have weakened and thepublic expenditure ratio declined. But, growth is harmed by the overvaluation ofthe currency and the negative effect on policy reform when oil prices are high.
Social spending on priority HD sectors kept pace during the first two decades.The share of the central government budget going to education and health increasedthroughout, with education spending rising from 6 per cent of government expendi-ture in the 1950s to nearly 15 per cent in 1971 (Marquez 1995, p. 409). The literacyrate increased rapidly, with primary and secondary school enrollment growing muchfaster than the population (Marquez 1995, p. 409), helping to explain Venezuela’shuman development bias during this period.
Interestingly, though educational and health indicators suffered during the 1980s,expenditure on social services did not appear to suffer disproportionately large cuts.For example, the share of the central government budget devoted to education de-creased from 14.4 per cent in 1981 to only 12 per cent in 1990 (Marquez 1995, p.409). Rather, what seemed to be at issue was poor resource use, that is, a worseningof the HD production function linking inputs to outputs. During the 1980s, therewas a shift in the composition of social service expenditures, with increasing sharesdevoted to support planning and administration, and decreasing shares to opera-tional programs and inputs, leading to marked inefficiencies in the delivery of edu-cation and health outputs (Marquez 1995, p. 412). Partly as a consequence, teach-ing quality has declined, while school dropout rates have increased. Only one-thirdof the student population continues in education past the ninth grade (EIU 1997b,p. 20). Similarly, decaying infrastructure and shrinking budgets in the health sectorhave led to a situation where in 1990, 46 per cent of Venezuela’s three hundredpublic hospitals were in need of repair (EIU 1997b, p. 20).
Poor priority ratios in education have further weakened the two-way links be-tween human development and growth. Universities receive over 50 per cent ofeducation spending in Venezuela, compared with about 25 per cent in the rest ofLatin America (EIU 1997b, p. 19). The structure of Venezuela’s education systemhas, moreover, focused excessively on academic and philosophical rather than vo-cational and scientific subjects (EIU 1997b, p. 19).

THE DEVELOPING ECONOMIES350
Links in Chain B were relatively weak. When Venezuela found itself in a boomfollowing increases in oil prices in the 1970s, rather than investing in sectors whichmight have generated more broad-based employment opportunities and taking ad-vantage of higher HD levels, the government instead encouraged capital-intensiveimport substitution industries in steel, aluminum, and petrochemicals (Nissen andWelsch 1994, p. 95). Such policies enhanced the structural rigidities in the economy,thereby increasing Venezuela’s vulnerability to external shocks, worsening incomedistribution, and reducing growth (World Bank 1989, p. 479). As a result, once theexternal situation deteriorated in the 1980s, Venezuela found itself in a very difficultsituation. A large rise in real interest rates in international financial markets in theearly 1980s, coupled with the sharp drop in oil prices in 1986, triggered an eco-nomic crisis, plunging Venezuela into a low-growth and poor-HD decade: per capitaincome declined every year between 1979 and 1985 while poverty rapidly increased(World Bank, Trends in Developing Economies, 1996, p. 541).
As with most developing countries during the 1980s, external shocks generatedreal costs in human development as a result of declining per capita income. Sucheffects were particularly severe in Venezuela. Between 1981 and 1990 the numberof people living in poverty doubled from 24 to 59.2 per cent, while the Gini coeffi-cient rose from 0.39 to 0.44 (Marquez et al. 1993, p. 146).
2. Good performersBarbados (virtuous, HD-lopsided, HD-lopsided). In contrast to Jamaica, which
started out in the virtuous category but subsequently moved into vicious develop-ment, Barbados began the 1960s in a virtuous cycle and managed to stay in HD-lopsidedness afterwards, continually improving its HD record over the past twentyyears.
Such sustained improvements were the result of strong links in Chain A whichallowed Barbados’ steady economic growth—averaging 3.2 per cent per year from1966 to 1996 (World Bank, Trends in Developing Economies, 1996, p. 30)—totranslate into real gains for human development. On the household side, a sustainedimprovement in income distribution helped to increase household resources forhuman development. While income distribution became more unequal during the1950s, this trend was reversed, with the Gini coefficient decreasing from 0.4 in1960 to 0.28 in 1981 (Holder and Prescod 1989, p. 105, Table 9).
Improvements in female education and female participation in the labor marketalso contributed to improving household HD expenditure patterns. The number ofwomen entering formal sector employment increased 21.6 per cent over the 1970 to1993 period (Coppin 1995, p. 107), helping to explain the substantial reduction inincome inequality.
On the public sector side, HD expenditure ratios were favorable and increasing.During the 1970s and 1980s, the health sector accounted for between 15 and 20 per
351GROWTH AND HUMAN DEVELOPMENT
cent of current expenditures, and 5 to 15 per cent of capital outlays, while the com-parable figures for education were in excess of 20 per cent of the current budget,and about 10 per cent of the capital budget (Baker 1997, p. 89). In comparison,Brazil’s outlays as a per cent of total expenditures for the same period ranged be-tween 3–5 per cent for education and 6–10 per cent for health (IMF, various years).
The portion of public expenditure earmarked for “priority” areas also improved,with health funds devoted to improving sewage services, water quality, and thedevelopment of community health centers providing dental, maternal, and childcare, and out-patient medical and psychiatric services (Inter-American Economicand Social Council 1974, p. 14). Active family planning programs introduced in the1950s were particularly important, helping to reduce the fertility rate from 2.8 in1970 to 1.7 in 1991, undoubtedly contributing to both the rise in female employ-ment and GDP per capita (Coppin 1995, p. 108, footnote 14).
Over the same period, improvements in the HD production function also helpedoverall HD performance. In health, the government targeted funds more efficientlyby providing school meal programs, while, in education, the government increasedaccess, resulting in a favorable situation, with less than 5 per cent of the total enroll-ment in primary and secondary schools in the private sector (Baker 1997, p. 90).
With regard to Chain B, Barbados also took important steps to utilize the im-provements in human development by diversifying the economy. Starting in the1970s, the Barbados became less dependent on primary (i.e., sugar) exports, withthe share of manufactured exports and tourism gradually increasing to comprisetwo-thirds of exports by the 1980s (World Bank, Trends in Developing Economies,1996, p. 30). Not only did this make the economy more dynamic, but it also fedback into the HD-EG cycle and improved human development by increasing em-ployment opportunities, particularly for women. The government further strength-ened links in Chain B by developing a number of vocational schools in response tothe changing employment demand, developing a hotel school and teacher trainingcenter (Inter-American Economic and Social Council 1974, p. 14).
The oil shocks of the 1970s and early 1980s did generate recessions in the Barba-dian economy, reducing growth. What is significant, however, is that such declinesin economic growth did not severely affect Barbados’s social programs or its HDprogress, permitting it to improve its HD record throughout.
Chile (HD-lopsided, HD-lopsided, virtuous). What makes Chile an interestingcase from our perspective is that, even when faced with economic crisis and majorstructural reforms, it managed to safeguard the HD improvements achieved in pre-vious decades which eventually allowed it to move into a virtuous cycle.
Chile has had a long tradition of a balanced development orientation. From the1920s onwards, successive governments have made substantial investments in thesocial sectors, with the state playing a very prominent role in the provision of edu-

THE DEVELOPING ECONOMIES352
cation, health, housing, and social security (Raczynski 1988, p. 57). By the end ofthe 1960s the links in Chain A were very well developed: social expenditure com-prised 20 per cent of GDP; registration in primary education covered 95 per cent ofthe six-to-fourteen-year olds; and 81 per cent of births were delivered by profes-sionals (Raczynski 1988, p. 66).
When hit by recessions in the late 1970s and early 1980s, Chile’s post-1973military government undertook substantial adjustment programs characterized by areduction in the state’s economic role. This resulted in a decline in both the publicexpenditure and HD-allocation ratios, with social spending as a share of GDP de-clining every year from 1984 to 1990 (Riveros 1998, p. 128, Table 4.4). Despite thisreduction, Chile’s HD was largely left intact, due mainly to improvements in thetargeting and effectiveness of its existing social expenditure, that is, the HD priorityratio and production function. The government developed a number of special pro-grams and subsidies designed to protect the most vulnerable strata of society, espe-cially mothers and children, during the adjustment period. These included a familysubsidy for those in extreme poverty, supplementary feeding program for mothersand preschoolers (two to five years old), as well as programs for nutritionally defi-cient children and a school feeding program designed to help reduce dropout andrepetition problems.17
Other measures designed to strengthen the allocative efficiency of social ser-vices included the decentralization of education and health to the municipalities,focusing restricted health budgets on disease prevention rather than curative medi-cine, and an increase in the collaboration between private and public health careproviders (World Bank, Trends in Developing Economies, 1996, p. 102; EIU 1998b,p. 21; Raczynski and Romaguera 1995, p. 313).
The observed pattern of HD indicators suggests that government actions to main-tain the strength of the links in Chain A during times of crisis were successful. Forexample, the prevalence of moderate and advanced malnutrition declined to theirlowest rates since the mid-1970s in 1987 (World Bank, Trends in Developing Econo-mies, 1991, p. 81). Infant mortality also fell, from 73 per 1,000 live births in 1972 to17.1 per 1,000 in 1989 (EIU 1998b, p. 20), while dropout rates in primary educa-tion among public schools declined from 7.1 per cent in 1977 to 5.1 per cent in1984 (Raczynski 1988, p. 78). Admittedly, there were some real costs of adjust-ment, as unemployment increased a great deal, from 6 per cent in the 1960s to morethan 16 per cent during 1974–81, and income distribution worsened, with theSantiago Gini coefficient increasing from 0.47 in the 1960s to 0.51 in 1978–82(Riveros 1998, p. 127). Poverty rates rose sharply in the 1980s, but extensive emer-gency employment schemes were deployed to prevent excessive deterioration.
17 See Raczynski (1988).
353GROWTH AND HUMAN DEVELOPMENT
In some important respects, Chile’s adjustment programs have also contributedto better HD by strengthening the links between HD and EG. Chile’s reform of thelabor market increased its flexibility and eventually the availability of employmentopportunities, while its trade liberalization measures improved the deployment ofChile’s substantial factor endowments and increased investment from abroad.18 Asa result, Chile developed into quite a dynamic economy in the 1990s, with goodprogress in human development along with respectable growth.
Colombia (HD-lopsided, virtuous, HD-lopsided). Sustained improvements in anot very equitable income distribution have played a key role in Colombia’s verygood human development record. Labor’s increasing share of income since the1970s—a function of economic policies that made the labor market more flexibleand increased labor-intensive minor industrial exports, i.e., strengthening the linksin Chain B—help to explain some of these sustained improvements in income dis-tribution (Berry and Tenjo 1998, p. 160). The production and trade in drugs mayalso have contributed. Both the quantity and quality of public expenditure, how-ever, also contributed. During the period under consideration, HD-allocation ratiosconsistently rose: per capita public social expenditure grew by 4 per cent per yearin real terms between 1970 and 1995, doubling its share of GDP from 6.7 per centto 12.5 per cent (Londoño de la Cuesta 1997, p. 29). More importantly, priorityratios also improved steadily, with the allocation of public expenditures becomingmore progressive between 1975 and 1995 and the coefficients of concentration forpublic expenditure on education and health indicating that a larger proportion reachedthe poor (Londoño de la Cuesta 1997, p. 30). According to some estimates, theredistributive effect of social spending from 1975 to 1995 helped to reduce the Ginicoefficient by 1.6 points (Londoño de la Cuesta 1997, p. 31).
Increasing levels of education among women point to the role of another impor-tant link. Significantly, by 1992, female enrollment rates were higher than malerates at all levels of schooling in both rural and urban areas and across incomegroups (World Bank 1994b, p. 58). This decrease in gender bias helped to increasefemale participation rates in the labor force and reduce earning differentials be-tween men and women (Berry and Tenjo 1998, p. 165). For example, the averagehourly wage differential favoring men by 30 per cent in 1976 disappeared by 1992(Berry and Tenjo 1998, p. 166).
As a result of strong links in Chain A, Colombia was able to take advantage of itsvery stable GDP growth—which averaged 4.5 per cent from 1970 to 1993 (WorldBank, Trends in Developing Economies, 1996, p. 112)—to improve HD in everydecade. Almost all indicators showed sustained progress: basic literacy rose from57 per cent to approximately 90 per cent from 1959 to 1993; infant mortality rates
18 See Riveros (1998, pp. 112–19).
THE DEVELOPING ECONOMIES354
decreased from the 1960s when it was 15 per cent above to about 25 per cent belowinternationally expected level for countries with Colombia’s national income; andpoverty, using unmet basic needs as the criterion, decreased between 1970 and1995, in marked contrast with the situation in the rest of Latin America (Londoñode la Cuesta 1997, pp. 34–35).
There are also indications that improvements in HD helped economic growthwith the help of a strong Chain B. An increased flexibility in the labor market per-mitted the composition of exports to change significantly during the 1970s and1980s, with a gradual move from labor intensive to more skill-intensive manufac-tured exports (Berry and Tenjo 1998, p. 159). Partly as a consequence, total factorproductivity grew during the 1970s, helping to explain Colombia’s move into thevirtuous cycle category (Berry and Tenjo 1998, p. 160). The links in Chain B, how-ever, weakened towards the end of the 1970s, the result of stagnation in the growthof total factor productivity, and a lack of dynamism in investment. When combinedwith the deterioration in the external economic environment, Colombia’s growthrate slowed, but remained positive, explaining its retreat back to HD-lopsided de-velopment in the 1980s. The sustained success of Colombia may more recently,however, be coming under threat from a combination of macroeconomic mistakesand a rising level of domestic violence weakening both chains.
Mexico (virtuous, virtuous, HD-lopsided). Along with Chile, Mexico has comeclosest in Latin America to achieving virtuous development throughout the 1960 to1992 period. The 1960s and 1970s were times of virtuous development as a resultof earlier reforms which reinforced the connection between growth and HD im-provements in Chain A. Unlike Brazil, Mexico instituted major land reforms earlierthis century. Absolute poverty declined during the 1960s and 1970s, with somestudies suggesting the number of poor families dropping by as much as 40 per centbetween 1950 and 1975.19 There is less certainty, though, regarding the level andchanges in income distribution, which appear to have remained at rather unfavor-able levels, i.e., Ginis between 0.5 and 0.6 (Maddison et al. 1992, p. 185).
The general policy setting and prevailing political ideology seem to have con-tributed to strong links in Chain A. A central pillar of post-revolutionary govern-ments has been a strong commitment to social development. In the 1960s, this tookthe form of an “Alliance for Progress” framework, which sought to enhance landreform, health, sanitation, education, and food production (Maddison et al. 1992, p.129). In the 1970s, the Echeverría and Portillo governments developed the strategyfor “shared development” (desarrollo compartido) focused on redistributing eco-nomic growth through higher social expenditure ratios (EIU 1991, p. 9). Educa-tional expenditure averaged around 18 per cent of total government spending in the1970s, while health averaged around 5 per cent (IMF, various years). Good priority
19 See van Ginneken (1980).
355GROWTH AND HUMAN DEVELOPMENT
ratios also contributed to improvements, with primary education and vaccinationprograms receiving the bulk of social spending (Maddison et al. 1992, pp. 196,201).
As a result of favorable spending patterns and a reduction in poverty, HD im-proved substantially between 1960 and 1980. Life expectancy increased from fifty-nine years to sixty-six years; infant mortality decreased from 74.2 per 1,000 birthsto 53.1; literacy among fifteen-year olds and older increased from 66 per cent to 83per cent; and educational enrollment as a percentage of the population almostdoubled, from 16 per cent to 30 per cent (Maddison et al. 1992, p. 187, Table 7-2).Such HD improvements, moreover, fed back into the HD-GNP cycle as total factorproductivity increased in the 1960s and 1970s, contributing to Mexico’s very ro-bust growth rates (Maddison et al. 1992, p. 149). Over the 1950–70 period, Mexico’sannual GDP grew at 6.6 per cent, resulting in an average increase of 3.3 per cent inGDP per capita (Maddison et al. 1992, p. 131) and helping to produce a virtuouscycle of development.
The story in the 1980s was different, as macroeconomic imbalances and the debtcrisis produced a contraction in growth. Mexico cut its public expenditure ratio,with a corresponding decline in HD spending, which contracted by 6.2 per cent ayear between 1983 and 1988 (Friedmann, Lustig, and Legovini 1995, p. 344). Thesecuts especially affected education, which saw its share of total expenditure drop by29.6 per cent, with most of the reduction absorbed by primary education (Friedmann,Lustig, and Legovini 1995, p. 348). HD indicators have resultingly been affected.Student-teacher and student-school ratios, proxies for the quality of education, bothdeclined between 1983 and 1988, while per capita medical units, hospital beds, anddoctors available in the “formal” health sector also fell (Friedmann, Lustig, andLegovini 1995, pp. 359–61).
Nevertheless, like Chile, Mexico attempted to address the weakening of its ChainA links through a more efficient use of public funds. While the government cut itsprogram of general transfers, it attempted to target existing food subsidies specifi-cally to the poor through the Programa Nacional de Alimentación (PRONAL)(Friedmann, Lustig, and Legovini 1995, p. 365). At a more general level, an impor-tant policy mitigating the impact of adjustment, its macroeconomic consequencesnotwithstanding, was the temporary expansion of public sector employment. An-other development which has helped Mexico to remain in HD-lopsided develop-ment despite economic decline has been the improving gender situation in Mexico.Women’s rights have gradually been institutionalized in Mexico’s legal frameworkduring the 1980s (Duarte y N. 1996, p. 325). Female participation rates in formalsector employment have increased, the schooling gap between men and women hasdeclined, and there now appears to be no difference between male and female ratesof infant mortality, a sensitive measure of discrimination in access to health care(Langer and Lozano 1996, p. 336).

THE DEVELOPING ECONOMIES356
3. Questionable performersArgentina (vicious, vicious, HD-lopsided). Argentina, like Peru, has exhibited an
ambiguous record of development, experiencing low growth and human develop-ment for two decades before moving into HD-lopsidedness in recent years. Growthrates in the 1960s began to slow due to the increasing unsustainability of importsubstitution policies implemented in previous decades (Marshall 1998, p. 81). WhileArgentina’s human development record during the 1940s and 1950s had been rela-tively good, by Latin American standards, it began to slacken as a result. Neverthe-less, successive military regimes introduced measures aimed at improving livingstandards, including retirement benefits for domestic servants; family allowances;health insurance for retired workers; and a social housing fund (Fondo Nacional deVivienda, FONAVI) (Golbert and Fanfani 1994, p. 4). Despite such efforts, humandevelopment actually worsened in the 1970s. Three factors conspired to weakenChain A. First, income distribution became more uneven and poverty increased.Between 1970 and 1980, the upper decile of households enlarged their share oftotal income by almost 5 percentage points, while the lower strata lost almost 3percentage points (Altimir 1998, p. 62). Real wages also fell by 30 per cent after the1976 wage freeze, increasing the portion of the population falling into poverty(Marshall 1998, p. 99). Second, HD allocations as a share of the public expenditureratio declined due to increased security expenditures which crowded out the socialsectors. As a per cent of GDP, expenditure on education fell from 4 per cent in 1973to 2.6 per cent in 1977, indicating a decline in real terms as GDP also fell over thesame period (Lo Vuolo 1995, Table 5). Third, the HD production function weak-ened, as the lack of coordination between private and public HD providers, particu-larly in health care, reduced the relative efficiency of HD inputs (Beccaria andCarciofi 1995, p. 213).
Several weaknesses in Chain B also contributed to the vicious cycle of the 1970s.Labor force participation rates started to fall quite sharply; the activity rate of adultmale household heads of working age decreased from 53.6 per cent in 1960 to 50.3per cent in 1980, while that of females stagnated after substantial growth in theprevious decade (Marshall 1998, p. 106, footnote 14). Obviously, the substantialslowdown of economic activity after 1974 contributed to the underutilization oflabor. However, economic policy implemented after 1976 exacerbated the situa-tion. An overvalued currency led to a contraction in manufacturing employment, asdid the very rapid liberalization of trade and the privatization of public enterprises,further dampening labor demand (Marshall 1998, p. 92). To make things worse,Argentina’s educational curricula did not keep pace with changes in the type oflabor demanded (Beccaria and Carciofi 1995, p. 207).
Surprisingly, however, just as the debt crisis exacerbated macroeconomic dis-equilibrium and GDP contracted by 9.4 per cent between 1980 and 1990 (Beccariaand Carciofi 1995, p. 187), Argentina managed to move into the HD-lopsided cat-
357GROWTH AND HUMAN DEVELOPMENT
egory. This occurred due to a strengthening of Chain A after 1982. Even thoughpublic expenditures fell in the 1980s, HD spending did not suffer disproportionatecuts. In fact, total public social spending measured in constant prices was almost 30per cent higher on average during the 1980s than during the 1970s while, in percapita terms, it was 8 per cent higher on average than in the previous decade (Beccariaand Carciofi 1995, pp. 201–2).
Not only did higher HD expenditure ratios strengthen Chain A, but the moreefficient use of HD inputs also contributed. For example, public health funds be-came more progressive. During the 1980s there was a rise in the number of patientsfrom lower-middle class households using public hospitals, while an estimated 44per cent of expenditures on public hospitals went to the poorest quintile of house-holds in 1986 (Beccaria and Carciofi 1995, p. 215). There is also some evidencethat the steady decentralization of social services to provincial and municipal au-thorities, beginning with primary education in 1978, has gradually improved thequantity and effectiveness of their delivery.20 Moreover, the government also beganto improve priority ratios by attempting to target the poor through the NationalFood Program (PAN) begun in 1984, providing food subsidies to poor householdsfor the first time (Beccaria and Carciofi 1995, p. 220).
As a result of the increase in HD-allocation ratios and improvements in the HDproduction function, HD performance during the 1980–92 adjustment period ap-pears to have been better than in the previous two decades, with improvements inmany indicators. Infant mortality, for example, dropped from 33.2 to 25.6 per 1,000births between 1980 and 1990 (Beccaria and Carciofi 1995, p. 229). Similarly, pov-erty, while increasing at the very beginning and end of the decade, appears to havedecreased from 1991 onwards due to increases in real wages (Beccaria and Carciofi1995, p. 195). Given the social sector reforms of the early 1990s—with furtherdecentralization and reform of pension and tax systems—only the combination ofArgentina’s currency board and Brazil’s devaluation, plus Argentina’s heavy debtburden stand in the way of Argentina’s eventual move into the virtuous cycle ofdevelopment.
Peru (HD-lopsided, vicious, HD-lopsided). The 1960s were a relatively gooddecade for Peru, as it managed to advance its HD performance. Income distributionwas not favorable, with some studies showing that the concentration of incomeactually increased during the 1960s.21 Nevertheless, absolute living standards didimprove because economic growth managed to increase workers’ real incomes aswell as public expenditure on education (Figueroa, Altamirano, and Sulmont 1996,p. 35). Between 1958 and 1968 primary education enrollments doubled, while thatfor secondary education tripled (Alcalde 1991, p. 172). Similarly, the rate of illit-
20 See World Bank (1988) and Habibi et al. (1999).21 See, for example, Webb (1977).
THE DEVELOPING ECONOMIES358
eracy shrank from 57 per cent in 1940 to 28 per cent by the end of the 1960s (Alcalde1991, p. 172).
Chain B results worsened in the 1970s as a result of sharp declines in publicinvestment which had serious consequences for capital accumulation. The declinein Peru’s ratio of investment to GDP was three times as great as elsewhere in LatinAmerica between 1975 and 1985 (World Bank 1994a, p. 4). Growth rates sufferedalso as a result of the debt crisis, sparking a protracted recession in the 1975 to 1990period, leading to a one-third decline in per capita income (Figueroa, Altamirano,and Sulmont 1996, p. 42).
The decline in EG, in turn, tended to reduce private as well as public outlays onHD inputs. For example, expenditure on education, health, housing, and employ-ment fell, starting in 1975, both in absolute and per capita terms and as a proportionof total government expenditure (Figueroa, Altamirano, and Sulmont 1996, p. 41,Table 5). A worsening pattern of income distribution and poverty also affected ChainA adversely. Although the Velasco regime attempted some redistributive programs,they proved largely ineffective (Figueroa, Altamirano, and Sulmont 1996, p. 35).Consequently, HD indicators fell somewhat during the next two decades, althougha massive expansion of the informal and NGO sector may have helped mitigate theproblem.
Peru’s performance in the 1980s highlights the importance of income distribu-tion for both chains. The worsening of income distribution in the 1970s led to in-creased social unrest and internal disturbances. Kidnappings, bombings, and actsof sabotage have increased rapidly, while the number of violent deaths per capitarose substantially after 1987 (World Bank 1994a, p. 16). All this has weakenedChain B, depressing the growth rate by damaging infrastructure, increasing secu-rity costs, and discouraging foreign investment. It has also had an effect on humandevelopment not only as a result of direct physical violence, but also because thegovernment has had to divert public funds away from essential social services.
Nevertheless, Peru moved back into HD-lopsidedness in the 1980s, partly be-cause of improvements in the efficiency of the HD production function. Both edu-cation and health expenditures appear to have become more progressive: in 1985–86, approximately 46 per cent of students enrolled in public school were in thebottom two quintiles of the distribution, whereas only 40 per cent were in the toptwo (Figueroa 1995, p. 382). Evidence also indicates that the poor made relativelygreater use of public health services, particularly health centers and clinics, ratherthan hospitals (Figueroa 1995, p. 383). A number of compensatory social policiestargeted at the poor also proliferated during the 1980s, with employment programsappearing focused particularly on adult women (Figueroa 1995, p. 385). Civil soci-ety activity also rose considerably, with a number of NGOs initiating their ownfood, health, and employment programs, partly compensating for the decline inHD-related public expenditures (Figueroa 1995, p. 388).

359GROWTH AND HUMAN DEVELOPMENT
IV. SUMMARY AND CONCLUSIONS
While generalizing too much from individual country experiences may be risky,given their diverse initial conditions and historical legacies, certain instructive pat-terns do emerge from this comparative Latin American performance.
First, the observed patterns appear to suggest the general observation that humandevelopment must precede or accompany economic growth in order for virtuouspatterns of development to result. Additional quantitative analysis is required for afuller confirmation of the hypotheses posited in Ranis, Stewart, and Ramirez (2000),once more points of observation become available. The four countries that man-aged to cross into the virtuous category for one or more decades—Barbados, Chile,Colombia, and Mexico—either started out with relatively good growth and humandevelopment (Barbados and Mexico), or initiated rapid improvements in HD whicheventually reinforced both chains (Chile and Colombia). It also appears that coun-tries which made early progress in human development stood a better chance ofsustaining, if not improving, their HD record during difficult economic downturnsand adjustment periods (e.g., Barbados, Chile, Colombia, Mexico). In contrast, thefour poor performers which ended up in the vicious category in the 1980s—Brazil,Haiti, Jamaica, and Venezuela—did not commit to HD improvements early on (Haitiand Brazil), or failed to protect HD sectors during times of economic downturn(Jamaica and Venezuela). In contrast to either of these scenarios, Argentina andPeru were questionable performers, with Argentina remaining in the vicious cyclefor two decades and then moving to the HD-lopsided cycle. Peru, on the other hand,started off in the HD-lopsided cycle in the 1960s, moved to the vicious category inthe 1970s and then back to the HD-lopsided cycle.
Second, income distribution appears to be an important variable in explainingdifferences in performance, via its impact in both chains. In all countries with oneor more decades of vicious cycle development, worsening distributions of incomeappear to have preceded the move to the vicious category, e.g., Brazil, Jamaica, andPeru. Peru’s experience, in particular, highlights the concomitant effects incomedistribution can have on both chains, not only in reducing the effects of economicgrowth on human development, but also in depressing growth through political andeconomic instability, eventually also depressing HD improvements. All countriesthat moved into a virtuous cycle, in contrast, witnessed prior improvements in theirdistribution of income. This was particularly the case with Colombia which man-aged to reduce income inequality in every decade and, as a result, to improve its HDperformance.
Third, the relative effectiveness of expenditures on HD inputs appears to be animportant mechanism for sustaining improvements in human development. Althoughalmost all the countries examined reduced the absolute and relative value of HD
THE DEVELOPING ECONOMIES360
expenditures in the aftermath of the 1980s debt crisis, the majority of those thatmanaged to remain in HD-lopsidedness did so by improving the priority ratios andthe efficiency of the HD production function. Chile and Mexico, for example, com-pensated for reduced social sector outlays by rendering existing expenditure pat-terns more efficient through ensuring better access to lower-income groups. In Peru,improvements in the HD production function eventually helped the country moveback from the vicious into the HD-lopsided category. Increased female educationand employment probably also played an important role, e.g., in Colombia.
Last, it may be particularly important for countries with natural resource abun-dance to adopt a balanced approach to development, one which generates broademployment opportunities during times of economic boom and which thereforemay help to redress the problems created during economic downturns. Both Ja-maica and Venezuela initially strengthened links in Chain A, but neglected those inChain B. This disregard not only further depressed growth during economic de-clines, but it also worsened the HD situation by exacerbating unemployment andreal wages, leading eventually to Jamaica’s and Venezuela’s perverse movementfrom virtuous and HD-lopsided development into the vicious cycle category. Theirexperience underlines the iterative, mutually reinforcing nature of the HD-GDPcycle.
From the policy point of view, the transitions we clearly need to examine moreclosely are those from vicious to HD-lopsided, from HD-lopsided to virtuous, orthe very unusual case, undoubtedly difficult, of taking the direct route from viciousto virtuous.
As we discussed earlier, vis-à-vis the links in the two chains between economicgrowth and human development, in order to move from the vicious cycle to HD-lopsidedness, an economy needs to focus on the Chain A links. These links can bestrengthened through the following types of policies:—More resources being allocated towards education and health services, especially
those serving the majority of the people, as occurred in Argentina with enhanceddecentralization. In tandem with such policies are also those that would aim toincrease female school enrollment rates.
—Policies that generate more equal distributions of income. Examples of such poli-cies include land reform, tax reform, a more employment-intensive pattern ofoutput generation.
—Providing more opportunity for the unemployed. Extremely relevant examplesof this include Chile’s Emergency Employment Scheme and Bolivia’s SocialFund in the 1980s, both of which received substantial donor support.This movement from a vicious to a HD-lopsided position would then, ideally be
followed by a movement into the virtuous category. This transition from HD-lop-sidedness to the virtuous cycle requires strengthening the links in Chain B by, forexample:

361GROWTH AND HUMAN DEVELOPMENT
—Taking advantage of the improved levels of HD to promote economic growththrough country specific macro- and micro-level policy reforms.
—Policies to increase the investment rate.—Policies improving the distribution of income.—Policies to select appropriate technologies and adaptation of technology.
The aim of this paper is not to argue that any particular set of policies can bringabout the movement among the cycles/categories discussed above. Rather, we em-phasize the importance of the sequencing of policy change. By this we mean thatHD must be strengthened before a virtuous cycle can be attained and thereforepolicies aimed at solely improving economic growth, without thought to HD, areunlikely to succeed. This also implies that any countries in the virtuous cycle cat-egory may well slip back. If, for some reason, say growth slows down, but HD assuch stays high, then such cases have a good chance of resuming their virtuouscycle pattern. However, without this high HD, the country may well slip even fur-ther into the vicious cycle category. So, ultimately for sustained virtuous cycle per-formance, high HD levels are important.
Countries are in either the lopsided or vicious cycle position due to one or bothChains A and B being weak. In such situations, it is extremely important to identifywhere exactly the weak links lie and therefore what policies are necessary tostrengthen these links. Such policies must, moreover, be viewed in an evolutionarycontext. Even those countries that are initially successful in both HD and EG willhave to change their policies as development proceeds to sustain success. We canpresent an example here. Say that priority is initially given to primary educationand some comprehensive health interventions, with the aim of improving both HDand economic growth. Later, the policy emphasis will need to shift towards scienceand technology institutions and higher education.
In summary, given that improvements in HD are the ultimate objective of aneconomy, we have demonstrated the importance of an iterative process betweenthese ultimate objectives and economic growth. We have also investigated the rela-tive importance of links connecting HD and EG and identified policy directionsthat economies might take to strengthen such links by looking at some Latin Ameri-can case studies. The important conclusions that remain concern the phasing ofpolicy change. We do not deny the importance of economic reforms, but emphasizethat a focus on HD must be included from the beginning of any reform program.

THE DEVELOPING ECONOMIES362
REFERENCES
Adelman, Irma, and Cynthia Taft Morris. 1967. Society, Politics and Economic Develop-ment: A Quantitative Approach. Baltimore, Md.: Johns Hopkins Press.
Ainsworth, Martha; Kathleen Beegle; and Andraw Nyamete. 1995. “The Impact of FemaleSchooling on Fertility and Contraceptive Use: A Study of Fourteen Sub-Saharan Afri-can Countries.” World Bank LSMS Working Paper no. 110. Washington, D.C.: WorldBank.
Alcalde, Javier Gonzalo. 1991. Development, Decay, and Social Conflict: An Internationaland Peruvian Perspective. Lanham, Md.: University Press of America.
Alesina, Alberto, and Roberto Perotti. 1994. “The Political Economy of Growth: A CriticalSurvey of the Recent Literature.” World Bank Economic Review 8, no. 3: 351–71.
Alesina, Alberto, and Dani Rodrik. 1994. “Distributive Politics and Economic Growth.”Quarterly Journal of Economics 109, issue 2: 465–90.
Altimir, Oscar. 1998. “Income Distribution and Poverty through Crisis and Adjustment.” InPoverty, Economic Reforms and Income Distribution in Latin America, ed. Albert Berry.Boulder, Colo.: Lynne Rienner Publishers.
Amadeo, Edward, et al. 1993. Human Resources in the Adjustment Process. Inter-AmericanDevelopment Bank Working Paper no. 137. Washington, D.C.: Inter-American Devel-opment Bank.
Baker, Judy L. 1997. Poverty Reduction and Human Development in the Caribbean: ACross-Country Study. World Bank Discussion Paper no. 366. Washington, D.C.: WorldBank.
Barros, Ricardo; Rosane Mendonca; and Sonia Rocha. 1995. “Brazil: Welfare, Inequality,Poverty, Social Indicators, and Social Programs in the 1980s.” In Coping with Austerity:Poverty and Inequality in Latin America, ed. Nora Lustig. Washington, D.C.: BrookingsInstitution.
Beccaria, Luis, and Ricardo Carciofi. 1995. “Argentina: Social Policy and Adjustment dur-ing the 1980s.” In Coping with Austerity: Poverty and Inequality in Latin America, ed.Nora Lustig. Washington, D.C.: Brookings Institution.
Behrman, Jere. 1990. “Women’s Schooling and Nonmarket Productivity: A Survey and aReappraisal.” Philadelphia, Pa.: University of Pennsylvania. Mimeographed.
———. 1995a. “Intra-Household Allocation of Resources: Is There a Gender Bias?” In SexDifferentials in Infant and Child Mortality. New York: Population Division, United Na-tions.
———. 1995b. “The Impact of Distributive Policies, Governmental Expenditure Patternsand Decentralization on Human Resources.” Philadelphia, Pa.: University of Pennsyl-vania. Mimeographed.
Behrman, Jere, and Anil Deolalikar. 1991. “The Poor and the Social Sectors during a Periodof Macroeconomic Adjustment: Empirical Evidence for Jamaica.” World Bank Eco-nomic Review 3, no. 2: 291–313.
Behrman, Jere, and Barbara Wolfe. 1987. “How Does Mother’s Schooling Affect the Family’sHealth, Nutrition, Medical Care Usage and Household?” Journal of Econometrics 36,nos. 1–2: 185–204.
Berry, Albert, and Jaime Tenjo G. 1998. “Trade Liberalization, Labor Reform, and IncomeDistribution in Colombia.” In Poverty, Economic Reforms and Income Distribution inLatin America, ed. Albert Berry. Boulder, Colo.: Lynne Rienner Publishers.
363GROWTH AND HUMAN DEVELOPMENT
Birdsall, Nancy. 1985. “Public Inputs and Child Schooling in Brazil.” Journal of Develop-ment Economics 18, no. 1: 67–86.
Birdsall, Nancy; David Ross; and Richard Sabot. 1995. “Inequality and Growth Reconsid-ered: Lessons from East Asia.” World Bank Economic Review 9, no. 3: 477–508.
Boyd, Derick. 1988. “The Impact of Adjustment Policies on Vulnerable Groups: The Caseof Jamaica, 1973–85.” In Adjustment with a Human Face, ed. Giovanni Andrea Cornia,Richard Jolly, and Frances Stewart. Vol. 2, Country Case Studies. Oxford: ClarendonPress.
Coppin, Addington. 1995. “Women, Men and Work in a Caribbean Economy: Barbados.”Social and Economic Studies 44, nos. 2 & 3: 103–24.
Cornia, Giovanni Andrea, and Frances Stewart. 1987. “Country Experience with Adjust-ment.” In Adjustment with a Human Face, ed. Giovanni Andrea Cornia, Richard Jolly,and Frances Stewart. Vol. 1, Protecting the Vulnerable and Promoting Growth. Oxford:Clarendon Press.
Duarte y N., A. E. P. 1996. “Legal Reform in Mexico and Its Effects on Women, 1984–94.”In Changing Structure of Mexico: Political, Social, and Economic Prospects, ed. LauraRandall. New York: M.E. Sharpe.
Economist Intelligence Unit (EIU). 1991. Country Profile: Mexico, 1991–92. London: EIU.———. 1997a. Country Profile: Jamaica, Barbados, 1997–98. London: EIU.———. 1997b. Country Profile: Venezuela, 1997–98. London: EIU.———. 1998a. Country Profile: Brazil, 1998–99. London: EIU.———. 1998b. Country Profile: Chile, 1998–99. London: EIU.Fei, J. C. H.; Gustav Ranis; and Frances Stewart. 1985. “Towards Viable Balanced Growth
Strategies: A Locational Perspective.” Paper prepared for the United Nations IndustrialDevelopment Organization.
Figueroa, Adolfo. 1995. “Peru: Social Policies and Economic Adjustment in the 1980s.” InCoping with Austerity: Poverty and Inequality in Latin America, ed. Nora Lustig. Wash-ington, D.C.: Brookings Institution.
Figueroa, Adolfo; Teofilo Altamirano; and Denis Sulmont. 1996. Social Exclusion and In-equality in Peru. Geneva: International Institute for Labor Studies.
Friedmann, Santiago; Nora Lustig; and Arianna Legovini. 1995. “Mexico: Social Spendingand Food Subsidies during Adjustment in the 1980s.” In Coping with Austerity: Povertyand Inequality in Latin America, ed. Nora Lustig. Washington, D.C.: Brookings Institu-tion.
Golbert, Laura, and Emilio Tenti Fanfani. 1994. “Poverty and Social Structure in Argentina:Outlook for the 1990s.” Democracy and Social Policy Series, Kellog Institute, WorkingPaper no. 6. Notre Dame, Ind.: University of Notre Dame. Spring.
Habibi, N. C.; D. Miranda Huang; V. Murillo; and Gustav Ranis. 1999. Decentralization inArgentina. YCIAS Working Paper. New Haven, Conn.: Yale University.
Holder, Carlos, and Ronald Prescod. 1989. “The Distribution of Personal Income in Barba-dos.” Social and Economic Studies 38, no. 1: 87–113.
Immink, M., and F. Viteri. 1981. “Energy Intake and Productivity of Guatemalan SugarcaseCutters: An Empirical Test of the Efficiency Wage Hypothesis.” Journal of Develop-ment Economics 9, no. 2: 251–87.
Inter-American Economic and Social Council. 1974. Situation, Principal Problems andPerspectives for the Economic and Social Development of Barbados. Washington, D.C.:Organization of American States General Secretariat.
International Monetary Fund (IMF). Various years. Government finance Statistics Yearbook.Washington, D.C.: International Monetary Fund.

THE DEVELOPING ECONOMIES364
Klugman, Jeni. 1994. “Decentralization: A Survey of the Literature from a Human Devel-opment Perspective.” Human Development Report Office Occasional Papers no. 13.New York: United Nations Development Programme.
Langer, Ana, and Rafael Lozano. 1996. “The Health of Women in Mexico: Current Pan-orama and Future Prospects.” In Changing Structure of Mexico: Political, Social, andEconomic Prospects, ed. Laura Randall. New York: M.E. Sharpe.
Londoño de la Cuesta, Juan Luis. 1997. “Social Rifts in Colombia.” CEPAL Review, no. 61:19–40.
Lo Vuolo, Rubén. 1995. “The Welfare State in Contemporary Argentina.” Democracy andSocial Policy Series, Kellog Institute, Working Paper no. 2. Notre Dame, Ind.: Univer-sity of Notre Dame. Spring.
Lundahl, Mats. 1996. “Income and Land Distribution in Haiti: Some Remarks on AvailableStatistics.” Journal of Interamerican Studies and World Affairs 38, no. 2/3: 109–26.
Maddison, Angus, et al. 1992. The Political Economy of Poverty, Equity and Growth: Braziland Mexico. New York: Oxford University Press, published for the World Bank.
Marquez, Gustavo. 1995. “Venezuela: Poverty and Social Policies in the 1980s.” In Copingwith Austerity: Poverty and Inequality in Latin America, ed. Nora Lustig. Washington,D.C.: Brookings Institution.
Marquez, Gustavo, et al. 1993. “Fiscal Policy and Income Distribution in Venezuela.” InGovernment Spending and Income Distribution in Latin America, ed. Ricardo Hausmannand Roberto Rigobon. Washington, D.C.: Inter-American Development Bank.
Marshall, Adriano. 1998. “State Intervention, the Labor Market, and Inequality in Argen-tina.” In Poverty, Economic Reforms and Income Distribution in Latin America, ed.Albert Berry. Boulder, Colo.: Lynne Rienner Publishers.
Nissen, Hans-Peter, and Friedrich Welsch. 1994. “Part 2—Venezuela.” In The Political Fea-sibility of Adjustment in Ecuador and Venezuela, by Alain de Janvfy, et al. Paris:Organisation for Economic Co-operation and Development.
Prud’homme, Rémy. 1995. “The Dangers of Decentralization.” World Bank Research Ob-server 10, no. 2: 201–20.
Psacharopoulos, George; Samuel Morley; Ariel fiszbein; Haeduck Lee; and Bill Wood. 1997.Poverty and Income Distribution in Latin America: The Story of the 1980s. Washington,D.C.: World Bank.
Raczynski, Dagmar. 1988. “Social Policy, Poverty, and Vulnerable Groups: Children inChile.” In Adjustment with a Human Face, ed. Giovanni Andrea Cornia, Richard Jolly,and Frances Stewart. Vol. 2, Country Case Studies. Oxford: Clarendon Press.
Raczynski, Dagmar, and Pilar Romaguera. 1995. “Chile: Poverty, Adjustment, and SocialPolicies in the 1980s.” In Coping with Austerity: Poverty and Inequality in Latin America,ed. Nora Lustig. Washington, D.C.: Brookings Institution.
Ranis, Gustav, and Frances Stewart. 1994. “Decentralization in Indonesia.” Bulletin of In-donesian Economic Studies 30, no. 3: 41–72.
Ranis, Gustav; Frances Stewart; and Alejandro Ramirez. 2000. “Economic Growth andHuman Development.” World Development 28, no. 2: 197–219.
Riveros, Luis A. 1998. “Chile’s Structural Adjustment: Relevant Policy Lesson’s for LatinAmerica.” In Poverty, Economic Reforms and Income Distribution in Latin America,ed. Albert Berry. Boulder, Colo.: Lynne Rienner Publishers.
Selowsky, Marcelo. 1981. “Nutrition, Health and Education: The Economic Significance ofComplementarities at an Early Age.” Journal of Development Economics 9, no. 3: 331–46.
365GROWTH AND HUMAN DEVELOPMENT
Selowsky, Marcelo, and Lance Taylor. 1973. “The Economics of Malnourished Children:An Example of Disinvestment in Human Capital.” Economic Development and Cul-tural Change 22, no. 1: 17–30.
Sen, Amartya. 1984. “Rights and Capabilities.” In Resources, Values, and Development byAmartya Sen. Cambridge, Mass.: Harvard University Press.
Stone, C., and Stanislaw Wellisz. 1993. “Jamaica.” In Five Small Open Economies, ed.Ronald Findlay and Stanislaw Wellisz. Oxford: Oxford University Press.
Strauss, John. 1986. “Does Better Nutrition Raise Farm Productivity?” Journal of PoliticalEconomy 94, no. 2: 297–320.
Streeten, Ptreeten; Shahid Javed Burki; Mahbub ul Haq; Norman Hicks; and Frances Stewart.1981. First Things First: Meeting Basic Needs in the Developing Countries. New York:Oxford University Press.
Thomas, Duncan. 1990. “Intrahousehold Resource Allocation: An Inferential Approach.”Journal of Human Resources 25, no. 4: 635–64.
United Nations Development Programme (UNDP). 1991. Human Development Report, 1991.New York: Oxford University Press.
———. 1995. Human Development Report, 1995. New York: Oxford University Press.van Ginneken, Wouter. 1980. Socio-Economic Groups and Income Distribution in Mexico.
London: Croom Helm.Webb, Richard Charles. 1977. Government Policy and the Distribution of Income in Peru,
1963–1973. Cambridge, Mass.: Harvard University Press.Wolgemuth, J. C.; M. C. Latham; A. Hall; and D. Crompton. 1982. “Worker Productivity
and Nutritional Status of Kenyan Road Construction Laborers.” American Journal ofClinical Nutrition 36, no. 1: 68–78.
World Bank. 1987. Haiti: Public Expenditure Review. Washington, D.C.: World Bank.———. 1988. Argentina: Social Sectors in Crisis. Washington, D.C.: World Bank.———. 1993. Caribbean Region: Access, Quality and Efficiency in Education. Washing-
ton, D.C.: World Bank.———. 1994a. Peru—At the Crossroads: Building a Modern State. Economic Report no.
11943-PE. Washington, D.C.: World Bank.———. 1994b. Poverty in Colombia. Washington, D.C.: World Bank.———. Various years. Trends in Developing Economies. Washington, D.C.: World Bank.


![Basic Search and Full Text Access from Wiley Online Library · Wiley online library [electronic resource]. Hoboken, N.J. : Wiley 1997 Provides full access to journals, reference works,](https://static.fdocuments.net/doc/165x107/5ec13497fdb248731e644647/basic-search-and-full-text-access-from-wiley-online-library-wiley-online-library.jpg)


