PDF (843 KB) - IOPscience
7
Journal of Physics: Conference Series OPEN ACCESS GStat 2.0: Grid Information System Status Monitoring To cite this article: Laurence Field et al 2010 J. Phys.: Conf. Ser. 219 062045 View the article online for updates and enhancements. You may also like Application of universal kriging for prediction pollutant using GStat R Annisa Nur Falah, Betty Subartini and Budi Nurani Ruchjana - Monitoring the EGEE/WLCG grid services A Duarte, P Nyczyk, A Retico et al. - GOCDB, a topology repository for a worldwide grid infrastructure Gilles Mathieu, Dr Andrew Richards, Dr John Gordon et al. - Recent citations Deploying LiveWN Grids in the Greek School Network Michael N. Kalochristianakis et al - Towards a federated Metropolitan Area Grid environment: The SCoPE network- aware infrastructure Francesco Palmieri and Silvio Pardi - This content was downloaded from IP address 219.70.22.161 on 29/11/2021 at 09:36
Transcript of PDF (843 KB) - IOPscience
Journal of Physics Conference Series
OPEN ACCESS
GStat 20 Grid Information System StatusMonitoringTo cite this article Laurence Field et al 2010 J Phys Conf Ser 219 062045
View the article online for updates and enhancements
You may also likeApplication of universal kriging forprediction pollutant using GStat RAnnisa Nur Falah Betty Subartini andBudi Nurani Ruchjana
-
Monitoring the EGEEWLCG grid servicesA Duarte P Nyczyk A Retico et al
-
GOCDB a topology repository for aworldwide grid infrastructureGilles Mathieu Dr Andrew Richards DrJohn Gordon et al
-
Recent citationsDeploying LiveWN Grids in the GreekSchool NetworkMichael N Kalochristianakis et al
-
Towards a federated Metropolitan AreaGrid environment The SCoPE network-aware infrastructureFrancesco Palmieri and Silvio Pardi
-
This content was downloaded from IP address 2197022161 on 29112021 at 0936
GStat 20 Grid Information System StatusMonitoring
Laurence FieldCERN Geneva Switzerland
E-mail LaurenceFieldcernch
Joanna HuangASGC Taipei Taiwan
E-mail joannatwgridorg
Min TsaiASGC Taipei Taiwan
E-mail min17502gatesinicaedutw
Abstract Grid Information Systems are mission-critical components in todayrsquos productiongrid infrastructures They enable users applications and services to discover which servicesexist in the infrastructure and further information about the service structure and state Itis therefore important that the information system components themselves are functioningcorrectly and that the information content is reliable Grid Status (GStat) is a tool that monitorsthe structural integrity of the EGEE information system which is a hierarchical system built outof more than 260 site-level and approximately 70 global aggregation services It also checks theinformation content and presents summary and history displays for Grid Operators and SystemAdministrators A major new version GStat 20 aims to build on the production experienceof GStat and provides additional functionality which enables it to be extended and combinedwith other tools This paper describes the new architecture used for GStat 20 and how it canbe used at all levels to help provide a reliable information system
1 IntroductionThe Grid Information System is a mission-critical component of the EGEE [9] productioninfrastructure It is a hierarchical system built out of more than 260 site-level and 70 globalaggregation services Users applications and services use the system to discover which servicesexist and further information about their structure and state To reliably fulfill these goalsthe information system components must be functioning correctly and the information contentshould be correct
Grid Status (GStat) [10] is the current monitoring component for the EGEE informationsystem It presents different overviews of the content found in the information system andperforms various sanity checks on it The results are used to identify potential problems withthe information system and the Grid itself The problems found can be brought to the attentionof Grid Operators and System Administrators via an alert mechanism
17th International Conference on Computing in High Energy and Nuclear Physics (CHEP09) IOP PublishingJournal of Physics Conference Series 219 (2010) 062045 doi1010881742-65962196062045
ccopy 2010 IOP Publishing Ltd 1
GStat evolved from a simple display showing the current status of the Grid into a morecomplex information monitoring and validation tool Due to the increasing size and complexityof the EGEE infrastructure it is necessary to re-evaluate the design of GStat In additionGStat was designed as a centralized operations tool and due to the European Grid Initiative [1]proposing a more decentralized model it must be ensured that GStat can continue to operatein such an environment
Section 2 of this paper outlines the general approach taken by Gstat with respect toinformation system monitoring and content validation An alternative architecture for GStat 20is presented in section 3 and the resulting implementation and initial feedback from deploymentis discussed in section 4
2 An Approach to Information System Monitoring and ValidationThe initial approach used by GStat to validate the information system was to visualize theinformation content The site-level aggregation points contain information representing asnapshot of the existence and state of the services running at that site By visualizing thisinformation from all sites it is possible to identify problems manually though observation Thisapproach is also useful during troubleshooting whereby information can easily be found relatingto an issue under investigation
Experience gained through observation and troubleshooting can be used to identify commonissues In addition to increased understanding of the information model automated checks canbe defined The primary check is validating that the information conforms to the informationmodel Although this is mainly covered by the information system components themselves thetolerance level of the components may be higher than is required by certain use cases Forexample the component may check that a value is a string however the use case may dictatethat the string has a specific format Another example is that in the information model attributesmay be defined as mandatory or optional The supported use cases may require attributes to bepresent and such additional requirements on the information model will also require validation
A common issue is with missing information and the ambiguity between entities disappearingand not existing The two approaches that can be used to overcome this ambiguity is to eitherrecord the entities that have been seen in the information or to compare the entities in theinformation system with an external source Both approaches will identify situations whichwould require further investigation however they both have drawbacks Recording entities willmiss the condition where there is an initial problem with information being published into theinformation system In addition when a service is decommissioned this approach would falselygenerate an error Comparison with another source will depend on the accuracy of that sourcehowever each additional source will improve the confidence in that value Any errors generatedwill require further investigation to identify the reason for the inconsistency and hence the exactlocation of the error
Even when it can be confirmed that the information is in the correct format and shouldexist is the information reported valid Although it is difficult to prove that a value is correctthere are four types of checks that can be employed to improve the confidence in a particularvalue The first type of check that can be carried out is a logical test on the value An examplewould be to check that the total number of cores in a computing cluster is negative or too largeThe second type of check is a self consistency check on the value for example is the amountof free storage space larger than the total available storage space The third type of check isa comparison with an external source Finally as issues are discovered and solved a resultingcheck should be produced to detect if that situation occurs again in the future
When contacting the site-level aggregation points metrics such as the number of entriesfound and the time taken can be gathered These metrics can be gathered periodically andtheir change monitored over time This approach can give an indication of the health of the
17th International Conference on Computing in High Energy and Nuclear Physics (CHEP09) IOP PublishingJournal of Physics Conference Series 219 (2010) 062045 doi1010881742-65962196062045
2
componentIn summary the checks described above can be categorized into Visualization Content
Validation and Infrastructure Monitoring Using these checks any anomalies can be reportedto the Grid operations team by means of an alarm mechanism These alarms can be integratedin to the day-to-day procedures used to operate the infrastructure
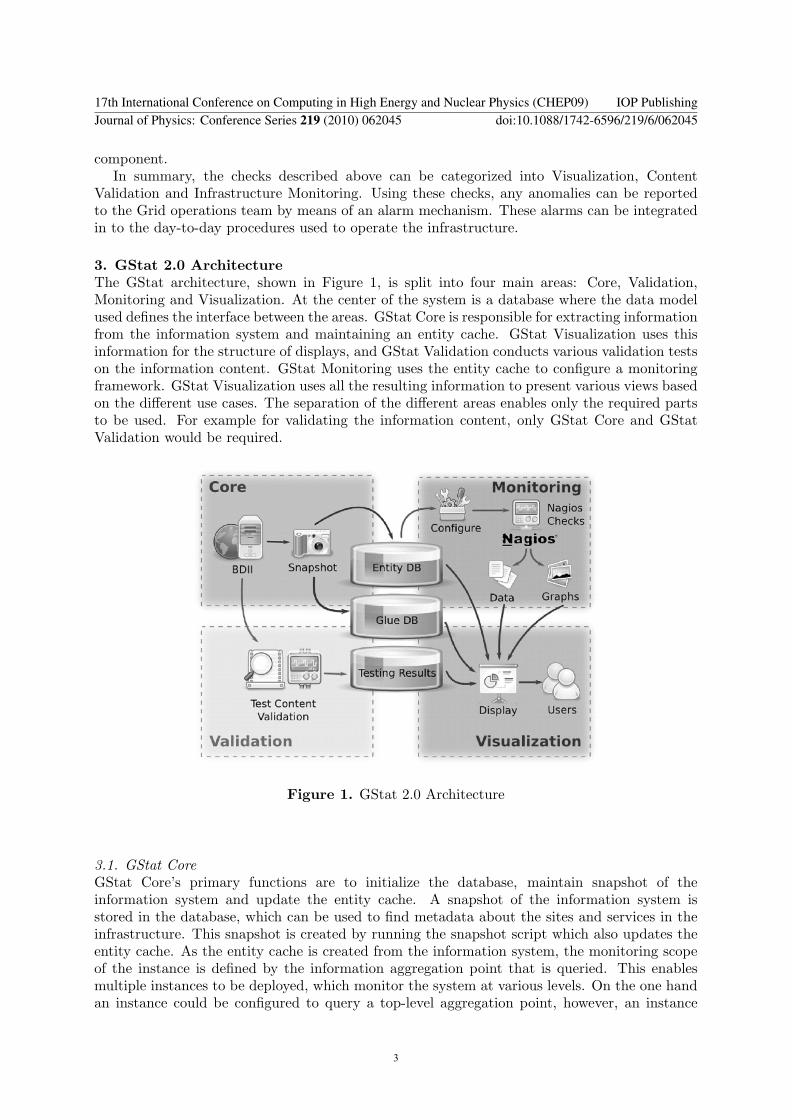
3 GStat 20 ArchitectureThe GStat architecture shown in Figure 1 is split into four main areas Core ValidationMonitoring and Visualization At the center of the system is a database where the data modelused defines the interface between the areas GStat Core is responsible for extracting informationfrom the information system and maintaining an entity cache GStat Visualization uses thisinformation for the structure of displays and GStat Validation conducts various validation testson the information content GStat Monitoring uses the entity cache to configure a monitoringframework GStat Visualization uses all the resulting information to present various views basedon the different use cases The separation of the different areas enables only the required partsto be used For example for validating the information content only GStat Core and GStatValidation would be required
Figure 1 GStat 20 Architecture
31 GStat CoreGStat Corersquos primary functions are to initialize the database maintain snapshot of theinformation system and update the entity cache A snapshot of the information system isstored in the database which can be used to find metadata about the sites and services in theinfrastructure This snapshot is created by running the snapshot script which also updates theentity cache As the entity cache is created from the information system the monitoring scopeof the instance is defined by the information aggregation point that is queried This enablesmultiple instances to be deployed which monitor the system at various levels On the one handan instance could be configured to query a top-level aggregation point however an instance
17th International Conference on Computing in High Energy and Nuclear Physics (CHEP09) IOP PublishingJournal of Physics Conference Series 219 (2010) 062045 doi1010881742-65962196062045
3
could also be configured to only query one region if an aggregation point existed that containedinformation from that region This approach enables GStat to be used in a decentralized mannerwhere each region is able to manage its own instance GStat Core also contains the commonlibraries and scripts that are shared amongst many other areas
32 GStat ValidationThe GStat Validation contains a set of scripts that are used to validate an information sourceThese scripts use a common library to ensure that they all have the same rdquolook and feelrdquo andbehave in a consistent manner The source for the tests can either be an LDAP server or anLDIF file The results of testing can be directed to different output channels the main two beingstandard out and the GStat database This mechanism has been designed so that it can also beexecuted on the command line and as such can be used directly by System Administrators andautomated testing suites
33 GStat MonitoringGStat Monitoring ensures the integrity of the information system by monitoring each componentin the information system As each component is published in the information system thecomponents which need to be monitored can be found by querying the entity cache Thisinformation can be used to configure a monitoring framework to configure monitoring probeswhich monitor the individual information system components
34 GStat VisualizationGStat Visualization is a framework which can be used visualize the resulting information Its aimis to simplify various tasks by providing common functions for obtaining the data and providea common rdquolook and feelrdquo for the resulting web application The visualizations fall into fourmain categories the information in the information system the information system componentsexperimental displays and error resulting from validation Together they allow a user to browsethe topology of the infrastructure and locate possible problems The experimental displaysprovide different ways to present the information which are useful for dissemination activitiesThis goal is achieved by providing a common visualization library along with a number of specificvisualizations
4 Initial Deployment ResultsThe main function of GStat Core package is provided by the snapshot script This script queriesan information aggregation point and stores the result in the GStat database Aggregationpoints in the EGEE infrastructure are implemented using the Berkely Database InformationIndex (BDII) [8] which is based on LDAP [11] and the information is described by the GLUE[6] schema Therefore the snapshot script is required to translate the GLUE schema from anLDAP data model into a relational data model Errors during this translation due to problemswith the implementation of the GLUE schema in the EGEE information system are recordedin the GStat database In addition the script extracts the main entities from this model andupdates the entity cache GStat Core can be deployed in a stand alone mode that can be usedfor the purpose of maintaining a relational snapshot of the information in the information systemand resulting topology of the infrastructure
A common validation library was created for the validation scripts The validation librarycontains common functions for obtaining information from LDAP sources and managing thetesting results Various validation scripts have been written to validate the information fromthese LDAP sources Many of the scripts check for compliance with the GLUE schema andconformance to the common use cases found in the EGEE infrastructure It is envisaged that
17th International Conference on Computing in High Energy and Nuclear Physics (CHEP09) IOP PublishingJournal of Physics Conference Series 219 (2010) 062045 doi1010881742-65962196062045
4
these scripts will be used in many different ways System Administrators can use them to checktheir own installations they can provide additional testing for software development processesand be integrated into other infrastructure monitoring tools
GStat Monitoring leverages the Nagios [4] monitoring framework and Nagios probes have beencreated to monitor the information system components These probes are common to GStat andthe Nagios-based Multi-Level Monitoring Framework from the Operations Automation Team[7] This not only reduces the development and maintenance effort for both projects but alsoenables the information system monitoring probes to be easily integrated into any Nagios-baseddeployments The size and momentum of the Nagios community can be leveraged to provideadditional tools for GStat such as graphing and alarms
The visualization library prototype was developed around the Yahoo User Interface library[5] however there are on going investigations into the use of ExtJS [2] The visualizationlibrary provides a common header and footer for the GStat 20 web applications Functionssuch as dynamic tables are also included in the library which simplifies the use of such tables Afunction for accessing data from both the GStat database and Nagios is provided by GStat CoreThese simplify the mechanism for obtaining data for the web applications Initial applicationsinclude an information system content browser an infrastructure browser and an informationsystem browser Each enables the user to drill down on information and highlights possibleerrors with the information system and its content A Google Earth [3] application was createdto demonstrate features of the GStat 20 framework This application dynamically creates aembedded Google Earth view which show the sites participating in the EGEE infrastructure
5 ConclusionsGrid Status (GStat) has been successfully used as the monitoring component in the EGEEproject for over four years Due to the increasing size and complexity of the EGEE infrastructureit was necessary to re-evaluate the design of GStat taking into consideration new requirementsraised by EGI
The approach used to validate the information system and its content is split into threecategories Visualization Content Validation and Infrastructure Monitoring InformationContent Validation is further split into four categories logical tests self-consistency external-constancy and regression tests
The GStat 20 architecture has been defined with these concepts in mind It is split intofour main areas Core Validation Monitoring and Visualization This split enables componentsto be re-used and integrated into other tools and procedures A single information systemaggregation point is used for the bootstrapping process This enables GStat to function in adecentralized mode Different instances of GStat can be deployed to monitor sites regions ordifferent infrastructures by configuration alone
The use of a stand-alone validation script enables them to be used in many different waysLeveraging the Nagios framework has not only simplified the development and enabled the richcontent of the Nagios community to be leveraged it has also simplified the integration of GStatinto the Multi-Level Monitoring Framework from the EGEE OAT The visualization frameworkprovides a foundation for building web applications tailored to specific use cases Informationfrom the information system is available for visualization and the results from the validationand monitoring are also at hand Further investigation into improved methods of visualizationare able to build upon this foundation
The new architecture for GStat 20 has enabled it to address the requirement for decentralizedoperations tools and in addition the separated areas provide building blocks for other operationstools Together they provide a powerful tool for information system monitoring and validation
17th International Conference on Computing in High Energy and Nuclear Physics (CHEP09) IOP PublishingJournal of Physics Conference Series 219 (2010) 062045 doi1010881742-65962196062045
5
6 References[1] European grid initiative httpwebeu-egieu 2008[2] Extjs httpextjscom 2009[3] Google earth httpearthgooglecom 2009[4] Nagios httpwwwnagiosorg 2009[5] Yahoo user interface httpdeveloperyahoocomyui 2009[6] S Andreozzi S Burke L Field and B Konya Glue schema specification version 13
httpglueschemaforgecnafinfnitSpecV13 2004[7] J Casey Operations automation team httpsespacecernchsa1-shareoatdefaultaspx 2009[8] L Field and M W Schulz Grid deployment experiences The path to a production quality ldap based grid
information system In Proceedings of the International Conference on Computing in High Energy andNuclear Physics (CHEP 2004) 2004
[9] B Jones and F Gagliardi Building an infrastructure for scientific grid computing status and goals of theegee project Royal Society of London Transactions Series pages 1729ndash42 2005
[10] M Tsai Gstat httpgocgridsinicaedutwgstat 2004[11] K Zeilenga Lightweight Directory Access Protocol version 2 (LDAPv2) to Historic Status RFC 3494
(Informational) March 2003
17th International Conference on Computing in High Energy and Nuclear Physics (CHEP09) IOP PublishingJournal of Physics Conference Series 219 (2010) 062045 doi1010881742-65962196062045
6
GStat 20 Grid Information System StatusMonitoring
Laurence FieldCERN Geneva Switzerland
E-mail LaurenceFieldcernch
Joanna HuangASGC Taipei Taiwan
E-mail joannatwgridorg
Min TsaiASGC Taipei Taiwan
E-mail min17502gatesinicaedutw
Abstract Grid Information Systems are mission-critical components in todayrsquos productiongrid infrastructures They enable users applications and services to discover which servicesexist in the infrastructure and further information about the service structure and state Itis therefore important that the information system components themselves are functioningcorrectly and that the information content is reliable Grid Status (GStat) is a tool that monitorsthe structural integrity of the EGEE information system which is a hierarchical system built outof more than 260 site-level and approximately 70 global aggregation services It also checks theinformation content and presents summary and history displays for Grid Operators and SystemAdministrators A major new version GStat 20 aims to build on the production experienceof GStat and provides additional functionality which enables it to be extended and combinedwith other tools This paper describes the new architecture used for GStat 20 and how it canbe used at all levels to help provide a reliable information system
1 IntroductionThe Grid Information System is a mission-critical component of the EGEE [9] productioninfrastructure It is a hierarchical system built out of more than 260 site-level and 70 globalaggregation services Users applications and services use the system to discover which servicesexist and further information about their structure and state To reliably fulfill these goalsthe information system components must be functioning correctly and the information contentshould be correct
Grid Status (GStat) [10] is the current monitoring component for the EGEE informationsystem It presents different overviews of the content found in the information system andperforms various sanity checks on it The results are used to identify potential problems withthe information system and the Grid itself The problems found can be brought to the attentionof Grid Operators and System Administrators via an alert mechanism
17th International Conference on Computing in High Energy and Nuclear Physics (CHEP09) IOP PublishingJournal of Physics Conference Series 219 (2010) 062045 doi1010881742-65962196062045
ccopy 2010 IOP Publishing Ltd 1
GStat evolved from a simple display showing the current status of the Grid into a morecomplex information monitoring and validation tool Due to the increasing size and complexityof the EGEE infrastructure it is necessary to re-evaluate the design of GStat In additionGStat was designed as a centralized operations tool and due to the European Grid Initiative [1]proposing a more decentralized model it must be ensured that GStat can continue to operatein such an environment
Section 2 of this paper outlines the general approach taken by Gstat with respect toinformation system monitoring and content validation An alternative architecture for GStat 20is presented in section 3 and the resulting implementation and initial feedback from deploymentis discussed in section 4
2 An Approach to Information System Monitoring and ValidationThe initial approach used by GStat to validate the information system was to visualize theinformation content The site-level aggregation points contain information representing asnapshot of the existence and state of the services running at that site By visualizing thisinformation from all sites it is possible to identify problems manually though observation Thisapproach is also useful during troubleshooting whereby information can easily be found relatingto an issue under investigation
Experience gained through observation and troubleshooting can be used to identify commonissues In addition to increased understanding of the information model automated checks canbe defined The primary check is validating that the information conforms to the informationmodel Although this is mainly covered by the information system components themselves thetolerance level of the components may be higher than is required by certain use cases Forexample the component may check that a value is a string however the use case may dictatethat the string has a specific format Another example is that in the information model attributesmay be defined as mandatory or optional The supported use cases may require attributes to bepresent and such additional requirements on the information model will also require validation
A common issue is with missing information and the ambiguity between entities disappearingand not existing The two approaches that can be used to overcome this ambiguity is to eitherrecord the entities that have been seen in the information or to compare the entities in theinformation system with an external source Both approaches will identify situations whichwould require further investigation however they both have drawbacks Recording entities willmiss the condition where there is an initial problem with information being published into theinformation system In addition when a service is decommissioned this approach would falselygenerate an error Comparison with another source will depend on the accuracy of that sourcehowever each additional source will improve the confidence in that value Any errors generatedwill require further investigation to identify the reason for the inconsistency and hence the exactlocation of the error
Even when it can be confirmed that the information is in the correct format and shouldexist is the information reported valid Although it is difficult to prove that a value is correctthere are four types of checks that can be employed to improve the confidence in a particularvalue The first type of check that can be carried out is a logical test on the value An examplewould be to check that the total number of cores in a computing cluster is negative or too largeThe second type of check is a self consistency check on the value for example is the amountof free storage space larger than the total available storage space The third type of check isa comparison with an external source Finally as issues are discovered and solved a resultingcheck should be produced to detect if that situation occurs again in the future
When contacting the site-level aggregation points metrics such as the number of entriesfound and the time taken can be gathered These metrics can be gathered periodically andtheir change monitored over time This approach can give an indication of the health of the
17th International Conference on Computing in High Energy and Nuclear Physics (CHEP09) IOP PublishingJournal of Physics Conference Series 219 (2010) 062045 doi1010881742-65962196062045
2
componentIn summary the checks described above can be categorized into Visualization Content
Validation and Infrastructure Monitoring Using these checks any anomalies can be reportedto the Grid operations team by means of an alarm mechanism These alarms can be integratedin to the day-to-day procedures used to operate the infrastructure
3 GStat 20 ArchitectureThe GStat architecture shown in Figure 1 is split into four main areas Core ValidationMonitoring and Visualization At the center of the system is a database where the data modelused defines the interface between the areas GStat Core is responsible for extracting informationfrom the information system and maintaining an entity cache GStat Visualization uses thisinformation for the structure of displays and GStat Validation conducts various validation testson the information content GStat Monitoring uses the entity cache to configure a monitoringframework GStat Visualization uses all the resulting information to present various views basedon the different use cases The separation of the different areas enables only the required partsto be used For example for validating the information content only GStat Core and GStatValidation would be required
Figure 1 GStat 20 Architecture
31 GStat CoreGStat Corersquos primary functions are to initialize the database maintain snapshot of theinformation system and update the entity cache A snapshot of the information system isstored in the database which can be used to find metadata about the sites and services in theinfrastructure This snapshot is created by running the snapshot script which also updates theentity cache As the entity cache is created from the information system the monitoring scopeof the instance is defined by the information aggregation point that is queried This enablesmultiple instances to be deployed which monitor the system at various levels On the one handan instance could be configured to query a top-level aggregation point however an instance
17th International Conference on Computing in High Energy and Nuclear Physics (CHEP09) IOP PublishingJournal of Physics Conference Series 219 (2010) 062045 doi1010881742-65962196062045
3
could also be configured to only query one region if an aggregation point existed that containedinformation from that region This approach enables GStat to be used in a decentralized mannerwhere each region is able to manage its own instance GStat Core also contains the commonlibraries and scripts that are shared amongst many other areas
32 GStat ValidationThe GStat Validation contains a set of scripts that are used to validate an information sourceThese scripts use a common library to ensure that they all have the same rdquolook and feelrdquo andbehave in a consistent manner The source for the tests can either be an LDAP server or anLDIF file The results of testing can be directed to different output channels the main two beingstandard out and the GStat database This mechanism has been designed so that it can also beexecuted on the command line and as such can be used directly by System Administrators andautomated testing suites
33 GStat MonitoringGStat Monitoring ensures the integrity of the information system by monitoring each componentin the information system As each component is published in the information system thecomponents which need to be monitored can be found by querying the entity cache Thisinformation can be used to configure a monitoring framework to configure monitoring probeswhich monitor the individual information system components
34 GStat VisualizationGStat Visualization is a framework which can be used visualize the resulting information Its aimis to simplify various tasks by providing common functions for obtaining the data and providea common rdquolook and feelrdquo for the resulting web application The visualizations fall into fourmain categories the information in the information system the information system componentsexperimental displays and error resulting from validation Together they allow a user to browsethe topology of the infrastructure and locate possible problems The experimental displaysprovide different ways to present the information which are useful for dissemination activitiesThis goal is achieved by providing a common visualization library along with a number of specificvisualizations
4 Initial Deployment ResultsThe main function of GStat Core package is provided by the snapshot script This script queriesan information aggregation point and stores the result in the GStat database Aggregationpoints in the EGEE infrastructure are implemented using the Berkely Database InformationIndex (BDII) [8] which is based on LDAP [11] and the information is described by the GLUE[6] schema Therefore the snapshot script is required to translate the GLUE schema from anLDAP data model into a relational data model Errors during this translation due to problemswith the implementation of the GLUE schema in the EGEE information system are recordedin the GStat database In addition the script extracts the main entities from this model andupdates the entity cache GStat Core can be deployed in a stand alone mode that can be usedfor the purpose of maintaining a relational snapshot of the information in the information systemand resulting topology of the infrastructure
A common validation library was created for the validation scripts The validation librarycontains common functions for obtaining information from LDAP sources and managing thetesting results Various validation scripts have been written to validate the information fromthese LDAP sources Many of the scripts check for compliance with the GLUE schema andconformance to the common use cases found in the EGEE infrastructure It is envisaged that
17th International Conference on Computing in High Energy and Nuclear Physics (CHEP09) IOP PublishingJournal of Physics Conference Series 219 (2010) 062045 doi1010881742-65962196062045
4
these scripts will be used in many different ways System Administrators can use them to checktheir own installations they can provide additional testing for software development processesand be integrated into other infrastructure monitoring tools
GStat Monitoring leverages the Nagios [4] monitoring framework and Nagios probes have beencreated to monitor the information system components These probes are common to GStat andthe Nagios-based Multi-Level Monitoring Framework from the Operations Automation Team[7] This not only reduces the development and maintenance effort for both projects but alsoenables the information system monitoring probes to be easily integrated into any Nagios-baseddeployments The size and momentum of the Nagios community can be leveraged to provideadditional tools for GStat such as graphing and alarms
The visualization library prototype was developed around the Yahoo User Interface library[5] however there are on going investigations into the use of ExtJS [2] The visualizationlibrary provides a common header and footer for the GStat 20 web applications Functionssuch as dynamic tables are also included in the library which simplifies the use of such tables Afunction for accessing data from both the GStat database and Nagios is provided by GStat CoreThese simplify the mechanism for obtaining data for the web applications Initial applicationsinclude an information system content browser an infrastructure browser and an informationsystem browser Each enables the user to drill down on information and highlights possibleerrors with the information system and its content A Google Earth [3] application was createdto demonstrate features of the GStat 20 framework This application dynamically creates aembedded Google Earth view which show the sites participating in the EGEE infrastructure
5 ConclusionsGrid Status (GStat) has been successfully used as the monitoring component in the EGEEproject for over four years Due to the increasing size and complexity of the EGEE infrastructureit was necessary to re-evaluate the design of GStat taking into consideration new requirementsraised by EGI
The approach used to validate the information system and its content is split into threecategories Visualization Content Validation and Infrastructure Monitoring InformationContent Validation is further split into four categories logical tests self-consistency external-constancy and regression tests
The GStat 20 architecture has been defined with these concepts in mind It is split intofour main areas Core Validation Monitoring and Visualization This split enables componentsto be re-used and integrated into other tools and procedures A single information systemaggregation point is used for the bootstrapping process This enables GStat to function in adecentralized mode Different instances of GStat can be deployed to monitor sites regions ordifferent infrastructures by configuration alone
The use of a stand-alone validation script enables them to be used in many different waysLeveraging the Nagios framework has not only simplified the development and enabled the richcontent of the Nagios community to be leveraged it has also simplified the integration of GStatinto the Multi-Level Monitoring Framework from the EGEE OAT The visualization frameworkprovides a foundation for building web applications tailored to specific use cases Informationfrom the information system is available for visualization and the results from the validationand monitoring are also at hand Further investigation into improved methods of visualizationare able to build upon this foundation
The new architecture for GStat 20 has enabled it to address the requirement for decentralizedoperations tools and in addition the separated areas provide building blocks for other operationstools Together they provide a powerful tool for information system monitoring and validation
17th International Conference on Computing in High Energy and Nuclear Physics (CHEP09) IOP PublishingJournal of Physics Conference Series 219 (2010) 062045 doi1010881742-65962196062045
5
6 References[1] European grid initiative httpwebeu-egieu 2008[2] Extjs httpextjscom 2009[3] Google earth httpearthgooglecom 2009[4] Nagios httpwwwnagiosorg 2009[5] Yahoo user interface httpdeveloperyahoocomyui 2009[6] S Andreozzi S Burke L Field and B Konya Glue schema specification version 13
httpglueschemaforgecnafinfnitSpecV13 2004[7] J Casey Operations automation team httpsespacecernchsa1-shareoatdefaultaspx 2009[8] L Field and M W Schulz Grid deployment experiences The path to a production quality ldap based grid
information system In Proceedings of the International Conference on Computing in High Energy andNuclear Physics (CHEP 2004) 2004
[9] B Jones and F Gagliardi Building an infrastructure for scientific grid computing status and goals of theegee project Royal Society of London Transactions Series pages 1729ndash42 2005
[10] M Tsai Gstat httpgocgridsinicaedutwgstat 2004[11] K Zeilenga Lightweight Directory Access Protocol version 2 (LDAPv2) to Historic Status RFC 3494
(Informational) March 2003
17th International Conference on Computing in High Energy and Nuclear Physics (CHEP09) IOP PublishingJournal of Physics Conference Series 219 (2010) 062045 doi1010881742-65962196062045
6