
PDF (1161 K)
59
This PDF is a selection from an out-of-print volume from the National Bureau of Economic Research Volume Title: Trade and Employment in Developing Countries, Volume 1: Individual Studies Volume Author/Editor: Anne O. Krueger, Hal B. Lary, Terry Monson, and Narongchai Akrasanee, eds. Volume Publisher: University of Chicago Press Volume ISBN: 0-226-45492-4 Volume URL: http://www.nber.org/books/krue80-1 Publication Date: 1980 Chapter Title: Alternative Trade Strategies and Employment in Indonesia Chapter Author: Mark Pitt Chapter URL: http://www.nber.org/chapters/c8734 Chapter pages in book: (p. 181 - 238)
Transcript of PDF (1161 K)

This PDF is a selection from an out-of-print volume from the National Bureauof Economic Research
Volume Title: Trade and Employment in Developing Countries, Volume 1:Individual Studies
Volume Author/Editor: Anne O. Krueger, Hal B. Lary, Terry Monson, andNarongchai Akrasanee, eds.
Volume Publisher: University of Chicago Press
Volume ISBN: 0-226-45492-4
Volume URL: http://www.nber.org/books/krue80-1
Publication Date: 1980
Chapter Title: Alternative Trade Strategies and Employment in Indonesia
Chapter Author: Mark Pitt
Chapter URL: http://www.nber.org/chapters/c8734
Chapter pages in book: (p. 181 - 238)

5 Alternative Trade Strategies and Employment in Indonesia Mark M. Pitt
Introduction
The trade-employment relationship in Indonesia is of particular interest for a number of reasons. First, Indonesia is a large country. With a pop- ulation of approximately 140 million (1978), it is the third largest de- veloping country in the world after China and India. The sheer size of its domestic market would allow it to produce a wide range of commodi- ties if the state intervened sufficiently in trade. Second, Indonesia has a rapidly expanding labor force. It is projected to increase by nearly 12 million (or 29 percent) over the decade 1971-81 (BPS, Statistical Pocketbook, 1974-75, p. 68). By the year 2000 the total labor force will more than double, and the urban labor force may quadruple relative to 1970 levels (Speare 1978, p. 99). Providing productive employment for this burgeoning labor force presents Indonesia with difficult chal- lenges over the coming decades, and employment creation is given high- est priority in planning documents. Third, real gross domestic product increased at a relatively rapid pace (7.2 percent per annum) from 1968 to 1976. Much of this growth was due to recovery from a lengthy period of economic mismanagement and stagnation and to the rapid growth of the petroleum sector and other extractive sectors. Over the same pe- riod, manufacturing value added grew at an average rate of l l .1 percent and increased its share of GDP to 11.1 percent in 1976. Fourth, the dearth of prior research evaluating the Indonesian trade regime and its
Mark M. Pitt is associated with the University of Minnesota.
The comments of Anne 0. Krueger, Narongchai Akrasanee, and Hal Lary on drafts of this paper are greatly appreciated. This research would not have been possible without the assistance of the Biro Pusat Statistik in Jakarta. Competent re- search assistance was provided by Paitoon Wiboonchutikula, Jacob Shemer, Makio Suura, and Abdessatar Ouanes. Any errors are my responsibility.
181

182 Mark M. Pitt
effect on resource allocation has heretofore precluded comparison of the Indonesian experience with that of other developing countries.
Finally, the nature of the trade-employment relationship is of particu- lar policy relevance in the Indonesian case. Indonesia appears to be approaching a key juncture in its trade regime. Since the dramatic trade liberalization of the late 1960s, Indonesia has had a relatively open foreign sector with full exchange convertibility and the complete absence of foreign exchange licensing. Attracted in part by the wide array of fiscal and tariff incentives offered to domestic and foreign investment, new investment has played an important role in postliberalization growth. In manufacturing, foreign investment contributed nearly half of all new investment between 1967 and 1973. Much of this investment took place in activities where protection was greatest or where entry of new firms was controlled. Recent events indicate that the growth of manufacturing investment and output may be expected to slow in coming years. Excess capacity has already become a significant problem in many industries and has led to calls for increased protection. The government’s response has been to increase quantitative restrictions on imports and to state publicly that it believes imports should not be permitted unless domestic production is fully utilized (Grenville 1977, p. 25). Another sign of a future slowdown in the growth of manufacturing is the decline in the rates of both new foreign and private domestic investment. The recent economic climate has prompted some observers to deem Indonesia “one of the least attractive foreign investment sites of Asia, particularly out- side of the extractive sector” (Arndt 1977, p. 13) . Nevertheless, public- sector enterprises seem to be enjoying vigorous growth. Hopes of in- creased exports of manufactures, however, have not materialized. In spite of a higher rate of inflation relative to its trading partners (includ- ing the United States), large oil earnings have permitted the rupiah exchange rate vis-8-vis the dollar to remain unchanged since 1971, thereby raising the relative costs of actual and potential manufactured exports. Thus, the seeds for a more inward-oriented manufacturing de- velopment strategy exist. The trade-employment relationship examined here for the year 1971 is for an economy whose trade regime may be entering a new phase.
5.1 The Indonesian Economy since 1950
5.1.1 Phases in Indonesian Economic Growth
From 1950,l when Indonesians took complete control of their govern- ment from the Dutch, until the present time the Indonesian economy has gone through four phases, roughly delineated by the years 1950-57, 1958-65, 1966-71, and 1972 to the present.

183 Alternative Trade Strategies and Employment in Indonesia
1950-57
1950 marked the end of a decade during which Indonesia was first subject to Japanese occupation and then engaged in a struggle for inde- pendence. The next seven years were a period of reconstruction. Rates of real per capita income growth were low but positive. The end of the commodity price boom after the Korean War necessitated a dramatic reduction of imports from their heady levels of 1951-52. This was accomplished by imposing quantitative restrictions and by introducing a number of trade devices that were to be employed again and again over the next dozen years : import entitlement schemes, prepayment require- ments, and import surcharges. The government relied heavily on taxes on trade, which contributed an average of more than 40 percent of net gov- ernment revenue over the period. At the same time, rising government budget deficits led to inflation, which reached double-digit levels by 1955.
Although good data are unavailable, manufacturing value added probably grew somewhat faster than GDP over this period. High levels of protection were provided by quotas and high tariff rates on finished consumer goods and by low duty rates on raw materials and capital goods. Industries regarded as essential received priority in the allocation of foreign exchange. Government agencies were established to distribute some raw materials, such as weaving yarns, at subsidized prices. One result was an expansion of capacity in the presence of its underutilization because raw material allocation among firms was based on their pro- ductive capacity (Suhadi 1967, p. 225). The “essential” industries that received priority in the allocation of foreign exchange utilized only 60 percent of capacity in 1958, less essential industries operated at only 20 percent of capacity, and manufacturing as a whole operated at about 40 percent (Suhadi 1967, p. 225).
1958-65
The period 1950-57 came to an end after the last and broadest of several short liberalization attempts that characterized the period. Tem- porary liberalization of the highly restrictive import-licensing system was achieved through the Bukti Ekspor (literally, “proof of export”) system (BE), an import entitlement scheme, introduced in June 1957. The BE system was ended when President Sukarno set out to implement his con- cept of “guided economy” based on an aversion to foreign capital and the market process. Because of economic mismanagement, 195 8-65 was economically dismal by any measure. Per capita national product was below its 1958 level in all the succeeding years of this phase. Inflation intensified to three-digit magnitudes by 1 962.2 Import restrictions con- tinued, and exports suffered since the effective exchange rate (EER)

184 Mark M. Pitt
was not adjusted as rapidly as domestic prices were rising. With export receipts falling, cuts in imports were necessary. Food shortages man- dated the use of much of the available foreign exchange for food imports. As a result, imports of raw materials were cut back drastically.
At the end of this period of trade restriction and economic misman- agement, Indonesia found herself in desperate economic straits. The average price level in 1966 was more than 1,000 percent of that in 1965. Total foreign debt at the end of 1965 was almost $2.4 billion, much of it owed to the Soviet Union for military equipment. Debt repayment due in 1966 was $530 million-78 percent of the value of exports in that year. Recorded values of imports and exports were below the aver- age levels of the ten previous years. Domestic manufacturing was operat- ing at only 20-30 percent of capacity, and government rice godowns (storage) were empty following the prohibition of further rice imports decreed by President Sukarno in 1964.
1966-71
After an abortive coup on 30 September 1965, a new government emerged, headed by General (later President) Suharto, which relied heavily on a group of Western-trained economists. Beginning in 1966, they embarked on a successful program of stabilization and trade liberal- ization and achieved remarkable economic growth in spite of the ob- stacles present when the program began.
Indonesian national product data for the decade of the 1950s and early 1960s are notoriously poor. The available data indicate that per capita rates of growth turned negative in the late 1950s. It is estimated that per capita product in 1963 was 7 percent less than it was five years earlier (Nugroho 1967, p. 450). It was not until at least 1968 that per capita product reached the levels achieved in the 1950s. Thereafter, as noted above, real GDP grew relatively rapidly, with growth most pro- nounced in exports and manufacturing. During the early 1960s manu- facturing’s share of GDP had actually fallen marginally (see table 5.1), and real manufacturing value added in 1966 was less than it was in 1961. After 1968 manufacturing value added grew two-thirds fasteI than GDP.
During the late 1950s and early 1960s, restrictions on imports of raw materials resulted in excess capacity and a declining share of total manufacturing value added for those sectors dependent on imported inputs and spare parts. As table 5.2 illustrates, the share of manufactur- ing value added originating in importable activities (defined simply as all sectors except the manufacture of food, beverages, tobacco, wood, and rubber) declined dramatically throughout the period of import stringency but increased after liberalization began.

185 Alternative Trade Strategies and Employment in Indonesia
Table 5.1 Gross Domestic Product by Industrial Origin and by Expenditure Category, 1960-76
GDP by Industrial Origin 19608 19658 1971a 1971b 1976b.c
Agriculture Farm crops Others
Mining Manufacturing Electricity, gas, water Construction Transportation Services
53.9% (34.3) (19.6)
3.7 8.4 0.3 2.0 3.7
28.2
52.4% (33.1) (19.3)
3.7 8.3 0.4 1.7 3.5
30.0
45.9% (29.7) (16.2)
5.6 9.4 0.5 3.0 3.6
32.0
43.6% (25.6) (18.0)
9.8 8.8 0.4 3.0 3.8
30.6
36.1% (21.5) (14.6) 11.6 11.1 0.6 4.7 4.2
31.7
GDP by Expenditure Category (Current Market Prices)
Private consumption expenditure General government
Gross domestic capital formation Exports Imports Gross domestic product
consumption expenditure
1960-64 1965-69
83.4% 90.4%
8.7 7.3 8.8 8.0 9.9 9.3
- 10.8 - 15.0 100.0 100.0
1970-74 1975-76
73.6% 68.4%
9.6 10.1 16.5 20.5 18.2 22.3
-17.9 -21.3 100.0 100.0
Source: Biro Pusat Statistik (1969, 2:519); Biro Pusat Statistik, Statistical Pocker- book of Indonesia, 1974-75, p. 512; Arndt (1977, p. 31). Note: There are no comparable figures before 1958. "At 1960 prices. "At 1973 prices. ~Prelirninary.
The low rate of growth during the 1960s can be attributed in part to the low rate of gross domestic capital formation. Data on GDP by type of expenditure, given in table 5.1, show that gross domestic capital formation was only 8.8 percent of GDP in 1960-64 and 8.0 percent in 1965-69. Spurred by the economy's new health and the growth of the extractive sectors, the rate of capital formation more than doubled in 1970-74 over the preceding period and rose even further in 1975-76.
1972 to the Present
Indonesia's high rate of growth has continued since 1972, thanks in large part to a continuation of its relatively liberal policies. As I men- tioned above, real GDP grew at a relatively rapid rate of 7.2 percent annually from 1968 to 1976 while manufacturing grew at an even faster annual rate of about 11 percent. Consequently its share in GDP rose from 9 to 11 percent from 1971 to 1976.
Nonetheless, policies in recent years have regressed from their rela- tive liberalness in the prior period. For example, recent studies (e.g.,

186 Mark M. Pitt
Table 5.2 Share of Import-Competing Sectors in Total Manufacturing Value Added and Employment
1958 1961 1963 1966 1971 1972
Value Added
Large establishmentsa 48.7% 47.5% 28.4% 12.6% 26.5% - Large and medium establishments - - 31.9 18.8 35.9 37.1
Employment
Large and medium establishments - - 41.8 40.2 32.2 34.7
Source: Biro Pusat Statistik, Pendapatan nasional Indonesia 1958-62; Biro Pusat Statistik, Pendapatan nasional Indonesia 1960-68; Biro Pusat Statistik, Statistik industri (1971 and 1972). Note: “Import-competing sectors” here includes all manufacturing except food products, beverages, tobacco, wood products, and rubber products. These products account for the remainder of manufacturing value added and employment. aLarge establishments are defined as enterprises without mechanical power employ- ing 100 or more persons or with mechanical power employing 50 or more persons. Medium establishments are defined as enterprises without mechanical power em- ploying 10-99 persons or with mechanical power employing 5-49 persons.
Large establishments 54.5% 68.9% 36.5% 36.8% 26.0% -
Grenville 1977, p. 25) report that there have been substantial increases in import duty collections. Quantitative restrictions, duty prepayment, and restricted credit access now apply to imports of textiles and some other commodities. Thus, as I suggested in the introduction, Indonesia is at a crucial juncture in its development.
5.1.2 International Trade
Trade Patterns
Table 5.3 shows the changing composition of Indonesia’s exports and highlights the importance of two commodities, rubber and petroleum, in totaI exports. Rubber was dominant in the 1950s, when it constituted more than 50 percent of export returns. With dramatically higher pro- duction and prices, petroleum has recently dominated exports, account- ing for almost three-quarters of export proceeds in 1975. By 1972 rub- ber had fallen to third among export commodities, overtaken by rapidly growing exports of forest products. Table 5.4 presents greater detail on the commodity composition of Indonesian exports in 1960-62 and 1970- 72. The table also shows the contributions of different manufacturing sectors broadly defined to include all HOS exportables (as classified below in section 5.3).3 (This breakdown is confined to 1971, being de- rived from the input-output table for that year.) So defined, exports of manufactures consisted mainly of processed agricultural and forestry products, among which smoked and remilled rubber was the dominant item.

Table 5.3 Composition of Exports and Imports, 1950-76 (in Millions of Dollars and in Percent)
Exports Imports
Year Rubber
1950-53
1958-61 1962-65 1966-69 1970-73 1974-76
1954-57 421.3 (45) 348.9 (38) 341.2 (41) 250.3 (36) 198.5 (27) 263.9 (14) 457.4 (6)
Petroleum
174.1 (18) 247.3 (27) 262.4 (32) 255.9 (36) 280.8 (38) 861.5 (47)
5,534.0 (72)
Other
351.7 (37) 316.9 (35) 225.2 (27) 196.7 (28) 252.8 (35) 707.1 (39)
1,671.3 (22)
Total Consumer Goods
947.1 913.1 828.8 702.9 732.1
1,832.5 7,662.7
358.6 (48) 259.0 (35) 198.1 (33) 215.6 (34) 236.1 (35) 340.5 (21) 766.8 (16)
Raw Capital Materials Goods
266.5 (35) 131.2 (17) 328.4 (45) 142.7 (20) 266.8 (44) 135.2 (23) 219.8 (35) 200.4 (31) 249.6 (38) 182.3 (27) 593.9 (37) 664.5 (42)
1,855.8 (39) 2,140.6 (45)
Total
756.4 731.1 600.1 635.8 668.0
1,598.8 4,763.2
Source: Biro Pusat Xtatistik, Ekspor (various issues). Note: Figures are annual averages for the years indicated.

Table 5.4 Composition of Exports
Composition of Total Exports by Main Commodities
commodity
1960-62 1970-72
Millions Millions of $ % of $ %
Rubber Petroleum and derivatives Tin ore concentrate Copra and copra cakes Tea Palm oil and kernels Tobacco Coffee Pepper Wood Hard cordage fibers Edible crustaceans Others
Total
327.0 232.2 42.2 30.8 24.7 23.3 23.2 13.3 18.1 1.5 2.5
29.9 768.7
-
43 30 6 4 3 3 3 2 2 * *
4
221.5 612.5 74.3 25.8 25.9 45.1 16.4 67.2 16.0
161.6 0.1
16.4 107.7
1,390.6
16 44
5 2 2 3 1 5 1
12
1 8
*
Composition of Manufacturing Sector Exports by Industry of Origina
1971
Sector Millions of $ %
Smoking and remilling of rubber (94) 262.1 57 Coffee grinding (58) 55.3 1 Vegetable and animal oils and fats (50) 51.4 1
Processed tobacco (64) 15.2 4 Dried cassava and tapioca flour (53) 15.0 3 Coconut oil and cooking oil (49) 12.1 3 Tanneries and leather finishing (74) 5.7 1
Batik industries (69) 1.1 4:
Other manufacturing industries 7.1 2
Tea processing (59) 28.9 6
Sawmills, planing, and other wood processing (77) 1.9 * Canning and preserving of fish and other seafoods (48) * 1.7
Total 457.4
Sources: Commodity exports: Biro Pusat Statistik, Ekspor (various issues) ; sector exports: unpublished 197 1 input-output table for Indonesia constructed by Biro Pusat Statistik. (See also note 14.) *Less than 0.5 percent. LIncludes only exports of sectors classified as HOS exportables (see Section 5.3). Numbers in parentheses refer to input-output code, as in table 5.A.1. Trade data from the input-output table are not always consistent with official trade figures. For example, the table indicates that exports from the rubber milling sector exceed official commodity exports of all rubber. No explanation for this discrepancy is available.

189 Alternative Trade Strategies and Employment in Indonesia
Indonesia’s import composition (see table 5.3) has reflected the orien- tation of the trade regime. During the 1950s raw materials were more than 45 percent of total imports, reflecting the priority in foreign ex- change allocation given the sheltered manufacturing sector. However, raw material imports suffered most when imports had to be reduced because of decreased export earnings in the early 1960s. They fell from an average annual level of $328 million in 1954-57 to $220 million in 1962-65. With increased availability of foreign exchange in the 1970s, all imports grew, but capital goods imports grew the fastest, reflecting in part the high level of capital formation. Capital goods imports in 1974-76 made up 45 percent of total imports and were nearly twelve times their dollar volume in 1966-69.
The pattern of commodity trade by country has also altered substan- tially in recent years. Of particular note is the increased importance of Japan as a trading partner. Japan’s share of Indonesia’s exports rose from 6 to 46 percent from 1960-62 to 1970-72. Much of this increase is due to Japan’s position as the major importer of Indonesia’s crude petroleum; nevertheless, Japan’s share of nonoil exports in 1970-72 was more than 22 percent. Japan also became Indonesia’s largest source of imports, accounting for almost one-third of the total in 1970-72. The share of imports from LDCs (including Singapore and Malaysia) doubled between 1960-62 and 1970-72 to account for a quarter of the import total.
Balance of Payments
Table 5.5 gives data on Indonesia’s balance of payments for selected years over the period 1960-76. In these years the trade balance was always in surplus, while the goods and services balance was always in deficit. Much of the recent growth in the services deficit is due to in- creased profit remittances of foreign-owned firms. Private capital inflows became substantial in the early 1970s and were almost $500 million in 1973. The 1975-76 net private capital outflow principally represents short-term debt repayment by PERTAMINA (the state-owned oil com- pany) , balanced to some extent by loans that appear on the official trans- fers and capital account.
The Trade Regime
Here I attempt to summarize salient features of Indonesia’s highly complex trade policies. A longer discussion is found in section 5.2.
In the 1960s Indonesia’s trade regime was characterized by (1) a system equivalent to legal underinvoicing designed to subsidize exports; (2) foreign exchange allocation based upon the degree of their “neces- sity” of imports, either as consumption goods (e.g., rice, pharmaceuti-

190 MarkM.Pitt
Table 5.5 Indonesia’s Balance of Payments, Selected Years 1960 to 1975-76 (Millions of U.S. Dollars)
1960 1965 1971 1975-76a
Exports, f.0.b. Imports, f.0.b. Trade balance Services Goods and services balance Special drawing rights Private capital Official transfers and capital Errors and omissions Monetary movements
88 1 749 132
-216 - 84
0 20
163 - 3 - 96
634 610
24 -272 -248
0 18
253 - 35
12
1,307 1,226
81 -511 -430
28 156 285
- 96 57
5,011b 4,479c
532 - 1,386 - 854
0 - 131
57 1 - 353
364
Sources: Bank Indonesia, Indonesian Financial Statistics (various issues). “Fiscal year 1 April to 31 March. bNet of oil imports. cNon-oil imports.
cals) or as intermediate inputs; (3) chronic overvaluation of the ex- change rate because of the high rate of inflation; and (4) the existence of widespread smuggling. In the late 1960s the system was simplified, foreign exchange controls were lifted, the exchange rate structure was unified, and legal underinvoicing was eliminated. Thus, by the early 1970s (the focus of the study) the trade regime had become relatively liberal. Foreign exchange controls no longer existed and, in general, protection was moderate. The structure of protection had a definite import substitution bias. ERPs were highest for importables and low, if not negative, for exportables. Since the early 1970s, policies have be- come more restrictive (as mentioned earlier) although not enough to eliminate their general open and liberal character.
Exchange Rates
The existence of chronic inflation has meant that exchange rates have been chronically overvalued and that a substantial share of international trade occurred through illegal channels (see section 5.2 for details). From 1950 to 1972, prices rose by a factor of 42,000; that is, in 1972 prices were 42,000 times greater than they were in 1950! The black market exchange rate has been consistently above the effective rate, with differentials ranging from 10 to over 1,100 percent. Currency de- valuations have occurred only infrequently (except for a period of float- ing rates from 1967 to 1970), causing wide variation in price level de- flated effective exchange rates. However, since liberalization in the late 1960s, the degree of overvaluation has been small relative to that of the 1950s and early 1960s.

191 Alternative Trade Strategies and Employment in Indonesia
5.1.3 The Structure of Production
Like most developing countries, Indonesia is heavily dependent upon NRB production. Close to 50 percent of GDP originates in NRB pro- duction, and about 80 percent of the population is found in rural areas. However, the relative importance of NRB production has decreased while that of manufacturing has increased, especially since the late 1960s. In 1971 manufacturing produced about 9 percent of GDP and employed 6 percent of the labor force.
Most manufacturing activities are located in import substitution activities. Activities categorized as importables (see section 5.3 for de- tails) generated nearly 60 percent of domestic value added (DVA) in manufacturing (excluding petroleum refining). Exportables generated 40 percent of DVA, and production that did not compete with imports generated about 1 percent of DVA. Most importable activities could be classified as processed food and consumer goods industries. Major ex- portables consist of processed NRB goods, for example, canned fish, sawmill products, and milled rubber.
5.1.4 The lndonesian Labor Market
Growth and Structure
Indonesia’s population growth rate is not high in comparison with that of other large developing countries. It averaged 2.1 percent per annum over the period 1961-71, substantially less than Brazil’s and Pakistan’s 2.9 percent and Thailand’s 3.0 percent but only slightly less than India’s 2.3 percent. The labor force growth rate of 1.8 percent has been less than that of population. The share of population under fifteen years of age stood at 44 percent in 1971, and 61 percent of those ten years of age or older were literate.
As I mentioned above, the Indonesian labor force is still primarily rural and agricultural. According to the 197 1 population census (Pen- duduk Indonesia), only 14.7 percent of the 1971 labor force was urban, and 6.2 percent of the total labor force was engaged in manufacturing compared with 60 percent in agriculture. The manufacturing labor force in urban areas was only 23 percent of the total manufacturing labor force in 1971. Indeed, according to official figures, the urban manufac- turing labor force declined in absolute terms from 1961 to 1971 while the rural manufacturing labor force nearly doubled. Sundrum (1975, pp. 60-62) has adjusted this population census data to reflect differ- ences in the definition of an “urban area” between 1961 and 1971. His adjusted figures reveal an absolute increase in the urban manufacturing labor force (of 46 percent compared with rural’s 59 percent); however, the share of the manufacturing labor force in urban areas still declined (from 36.9 to 33.9 percent). This may be a reflection of the decline

192 Mark M. Pitt
of import-competing sectors during the 1960s (see table 5 . 2 ) , since these sectors were composed of firms that were more urban than the agricultural processing sectors that composed the remainder of manu- facturing. Most evidence indicates that this trend has been halted and probably reversed during the 1970s.
Over the period 1961-71, manufacturing employment grew at a 3.3 percent annual rate and increased its share in total employment from 5.7 to 6.8 p e r ~ e n t . ~ Table 5.6 provides the data. This rate of growth was not constant over time. During the period of greatest economic decline
Table 5.6 Labor Market Conditions in Indonesia
Rates of Growth
1961 1965 1971 1961-65 1965-71 1961-71
1. 2. 3. 4.
5.
6.
7. 8.
Population (millions) 97.4 105.4 120.1 1.97 2.18 Labor force (thousands) 34,578 36,543 41,261 1.38 2.02 Employment (thousands) 32.709 35,698 37,628 2.19 0.88 - - . . Manufacturing employ- ment (thousands) 1,856 Manufacturing value- added (Rp billion, con- stant 1960 prices) Large and medium
enterprises 24.5
Total 36.6 Small enterprises 12.1
Real annual wage in manu- facturing (thousands of 1973 rupiahs) : Large enterprises 69.5 Medium enterprises 35.0 Rate of unemployment (%) 5.4 Elasticity of manufac- turing employment (with respect to value added)
2,059 2,573 2.59 3.71
22.7 12.7 35.6
51.4 23.5 2.3
41.8 -1.91 10.18 15.8 1.21 3.64 57.6 -0.69 8.02
74.1 -7.54 6.10 37.6 -9.96 7.83 8.8
-4.00 0.40
2.09 1.77 1.40
3.27
5.34 2.67 4.53
0.64 0.72
0.67
Sources: Row 1 : Biro Pusat Statistik, Statistical Pocketbook of Indonesia, 1974- 75, p. 23. Row 2: 1961: Biro Pusat Statistik (1963), p. 12; 1965: Biro Pusat Statistik (1967), p. 1; 1971: Biro Pusat Statistik (1975), p. 218. Row 3: 1961: Biro Pusat Statistik (1963), p. 12; 1965: Biro Pusat Statistik (1967), p. 1; 1971: Biro Pusat Statistik (1975), p. 166. Row 4: 1961: Biro Pusat Statistik (1963), p. 32; 1965: Biro Pusat Statistik (1967), p. 37; 1971: Biro Pusat Statistik (1975), pp. 218-19. Row 5 : Biro Pusat Statistik, Statistical Pocketbook of Indonesia, various issues. Row 6: Table 5.7. Row 7: (Row 2 - row 3) f (row 2) . Figures are not comparable over time. Row 8: Calculated as the change in manufacturing employment (row 4) divided by the change in manufacturing value added (row 5 ) over the same time period.

193 Alternative Trade Strategies and Employment in Indonesia
( 1961-65), the growth rate of manufacturing employment was some- what slower than in the succeeding period of economic advance (1965- 71 ). However, the increase in manufacturing employment during 1961- 65 coincided with an absolute decline in manufacturing employment. This phenomenon may be explained by a number of factors. First, labor productivity tends to fall as excess capacity rises because firms find it more difficult to lay off labor relative to capital. Second, the 26 percent fall in real manufacturing wages paid by large-scale firms over this period may have led to factor substitution. Third, employment may have risen because the composition of output shifted dramatically toward more labor-intensive sectors. Table 5.2 indicates that the share of import- competing sectors in total large firm value added and employment declined from 47.5 to 28.4 percent and from 68.9 to 36.8 percent re- spectively between 1961 and 1966. It would be expected that import- competing sectors would have a smaller labor requirement per unit of domestic value added than other sectors. The evidence presented in sec- tion 5.4 bears out the validity of this assertion for 1971. Also note that the fall in manufacturing value added is entirely attributable to large and medium-size firms and that small firm output actually increased. Small firms in Indonesia are substantially more labor-intensive than larger firms.5
Wage Behavior
The Indonesian labor market has operated in the absence of signifi- cant government intervention. It was not until 1975 that ,minimum wage regulations were enacted, and even these regulations covered a limited set of industries in certain regions. A law enacted in 1964 required pri- vate firms to obtain government approval before dismissing more than ten workers and to pay indemnity. The number of employees covered by this act was relatively small, and according to Arndt and Sundrum (1975, p. 377) enforcement was of doubtful effectiveness. However, the government encouraged the use of capital by subsidizing credit, provid- ing customs duty exemptions, and tax holidays, and offering other in- centives to new investment.
The behavior of real wages over the past twenty-five years suggests that wage determination occurs in an undistorted labor market. Every indication is that real wages fell by at least half from the early 1950s to the mid-l960s, then rebounded just as dramatically by 1971.6 Table 5.7 provides time-series data on wage rates in different types of employment. In column 1, note that the real annual wage in 1973 rupiahs in all large- scale manufacturing fell from the initial level of Rp 110,300 in 1954 to Rp 46,000 in 1962. This represents nearly a 60 percent fall in real wages over eight years. Real wages remained near this level until 1967, and by 1973 had returned to 77 percent of their 1954 level^.^

194 MarkM.Pitt
Table 5.7 Real Wages in Indonesia, 1951-73
Average Yearly Average Yearly Wage in Wage in Large-Scale Medium-Scale Average Monthly Manufacturing Manufacturing Wage on Estates (1973 Rupiahs) (1973 Rupiahs) (1966 Rupiahs)
Year (1) (2) (3)
1951 1952 1953 1954 1955 1956 1957 1958 1959 1960 1961 1962 1963 1964 1965 1966 1967 1968 1969 1970 1971 1972
- 110,300 102,600 100,400 97,600 80,500 78,400 7 1,600 69,500 46,000 50,400 46,800 5 1,400 55,200 67,800
- 74,100 83,700
- -
27,500 35,000 33,300 35,000 20,700 20,800
23,500 18,700
-
- 37,600 43,200
413 524 545 43 1 3 67 3 84 394 344 309 314 278
202 -
- - 268 275 238 29 1 348 348 353
Source: Cols. 1 and 2: Biro Pusat Statistik, Statistical Pock- etbook of Indonesia (various issues, 1956-63) ; Pendaparun nasional Indonesia (various issues) ; Statistik industri (issues of 1971-73); and unpublished data from Biro Pusat Statistik. Col. 3: Papanek (1974), pp. 16-17.
Real wage data for some nonmanufacturing sectors demonstrate a pattern similar to that of manufacturing. Data on the average monthly wage (including payments in kind) paid on estates in constant 1966 rupiahs indicate a trend similar to that of the other time series.s Real wages in large-scale manufacturing and on estates fell by almost equal percentages (54 percent) between 1954 and 1963, then by 1973 they both regained a real wage of about 75 percent of that of 1954.
Two other characteristics of the movement of real wages are worth noting. First, real wages in medium-scale manufacturing seem to have increased faster from the mid-1960s until 1973 than large-scale manu- facturing wages, closing some of the wide gap between them. Second, during the period when real wages were falling, skilled workers (defined here as employees paid by the month) suffered a greater loss in real

195 Alternative Trade Strategies and Employment in Indonesia
wages than unskilled workers (employees paid by the day or week). The 1961 annual real wage of unskilled workers in 1973 rupiahs was 41 per- cent lower than its 1954 level of Rp 79,500, while the skilled wage fell 5 1 percent from its 1954 level of Rp 295,700.
That real wages fell during a period of two- and three-digit inflation and falling per capita income is not unexpected. That they fell by the magnitude indicated by the data of table 5.7 is surprising. Apparently the fall and subsequent rebound of the real manufacturing wage was due to the absence of government policies that might distort wages.
5.1.5 Summary
Indonesia’s economic performance has been relatively impressive in the last decade. After a disastrous period in which GDP and manufac- turing output fell, both have increased substantially since 1968. One factor affecting this performance has been a gradual easing of foreign exchange and trade restrictions. However, Indonesia’s trade regime still must be characterized as having an overall import substitution bias.
5.2 The Foreign Trade Regime and Effective Exchange Rates
5.2.1 Trade Liberalization: 1966-71
The six-year process of trade liberalization began in February 1966 with the introduction of yet another import entitlement certificate known as Bonus Ekspor (export bonus), which had the same acronym, BE, as the Bukti Ekspor of 1957-58, mentioned in section 5.1. Exporters were granted certain percentages of their surrendered export receipts in the form of BE certificates. The remainder of their surrendered export re- ceipts were exchanged at the official rate of Rp 10 = $1. Initially, the BE certificate represented a nonsalable right to foreign exchange for the import of certain goods on the “BE list.” The share of export receipts that were exchanged for BE certificates was increased twice in 1966 alone, and with the last increase BEs were made freely salable. After July 1967, all surrendered export receipts were exchanged for BE certificates.
Other elements of the foreign trade regime during this period included legal underinvoicing (the check-price overprice system), exchange con- trols, and a unification of the exchange system. Each is discussed below.
The Check-Price Overprice System:
A system called check-price overprice (identical to legal underinvoic- ing) played an important role by subsidizing exports in the 1960s. Over- price is the foreign exchange retained when actual export receipts exceed a stated surrender price or check-price. Although this foreign ex-

196 MarkM.Pitt
change retention had been tacitly recognized earlier, it was given legiti- mate status by the Foreign Exchange Law of 1964 and became known as Devisa Pelangkap (Complementary Foreign Exchange), or DP ex- change .
Regulations enacted in 1965 permitted DP exchange earned as over- price to be used for importing or to be sold once. Sale of DP exchange could be legally accomplished only through foreign exchange banks at agreed prices. Imports using DP exchange did not require a license, but they bore additional import duties. Because of these restrictions on its sale and use, only a small part of the overprice (DP) was surrendered by most exporters. Unreported overprice was kept as cash abroad or used as free foreign exchange (Siahaan 1969, p. 26). In 1967 re- strictions on the use and sale of DP exchange were greatly loosened, and a market for DP exchange was established in Jakarta.
In table 5.8, the overprice for natural rubber sheets (RSS I ) has been calculated quarterly for the period 1965 I through 1970 I. The overprice margin (or the degree of legal underinvoicing) , defined as the share of overprice in total realized price, varied widely over the period. After a severe reduction in mid-1967, the overprice was restored in 1968 and remained at a comparatively high level until the check-price overprice system was terminated in April 1970. After April 1970, illegal underin- voicing of exports may still have continued, although there was only a small incentive to do so.
The importance of overprice in exporter receipts is demonstrated by the large share of overprice earnings in the effective exchange rate (EER). At the time the check-price overprice system was terminated, overprice accounted for nearly half of the rupiah earnings per dollar of rubber export. For example, the Bank Indonesia officially estimated that, in the 1969-70 fiscal year, the overprice margin of nonoil exports was 26.4 percent. Thus, these overprice margins varied over time and over commodities that depended to a large degree upon the administrative ability of the Ministry of Trade to reset check-prices in line with world price movements. The use of this overprice system also meant that ex- port data at the commodity level were undervalued for the years when the system operated (1965-70), since exports were recorded at their check-prices rather than their realized prices.
Regulation of Imports
as follows:
books, pharmaceuticals.
and capital goods that are foreign exchange earning or saving.
In 1966, imports were classified into five categories, officially described
Category I : Essential commodities; for example, rice, fertilizers, text-
Category 11: Raw materials and auxiliary goods, semifinished products

197 Alternative Trade Strategies and Employment in Indonesia
Category I11 : Raw materials, auxiliary goods, and semifinished prod-
Category IV: Other goods (mostly finished consumer goods). Category V: Prohibited goods.
ucts intended for domestic consumption.
Table 5.8 Check-Price Overprice System for Rubber, 1965-70
Average Overprice Average New York Overpricea Earnings as Check-Price Spot Price (Legal Under- Overprice Percentage of Rubber of Rubber invoicing) Marginb of EER (CentdLb.) (Cents/Lb.) (Cents/Lb.) (Percent) for Rubber ( 1 ) (2) (3) (4) (5)
I965 I I1 I11 IV
I966 I I1 I11 IV
1967 I I1 111 IV
1968 I I1 111 IV
I969 I I1 I11 IV
I970 I
18.02 20.45 21.83 19.37
26.05 27.57 24.97 24.17
5.83 4.92 0.94 2.60
24.4 19.4 4.1
11.8
50.4 42.5 11.2 36.3
36.2 38.0 28.3 23.3
20.00 18.92 18.21 17.25
25.37 23.93 22.90 22.07
3.17 2.8 1 2.49 2.62
13.7 12.9 12.0 13.2
15.45 13.97 14.86 14.42
21.10 21.20 19.27 18.07
3.45 5.03 2.21 1.45
18.3 26.5 12.9 9.1
31.9 42.1 19.9 12.9
13.53 13.88 13.12 13.17
17.10 19.27 20.63 22.37
1.37 3.19 5.3 1 7.00
9.2 18.7 28.8 34.7
12.9 26.0 37.8 45.5
13.58 14.33 15.00 15.38
23.70 26.60 24.27 25.10
7.92 10.07 12.07 7.52
36.8 41.3 44.4 32.8
45.4 49.1 52.2 40.0
37.2 44.7 13.88 24.30 8.22
Sources: Check prices: Warta Perdagangan and Business News (Jakarta) ; New York spot prices: Commodity Yearbook; effective exchange rates: Pitt (1977),
Note: Calculations are for rubber smoked sheet I (RSS I) . Calculated as (col. 2 - 2.2) - col. 1; deduction of 2.2 cents/lb. corrects New York spot price to f.0.b. net. bcalculated as col. 3/(col. 2 - 2.2).
p. 53.

198 MarkM.Pitt
The differing types of exchange were restricted to the import of com- modities from certain import categories as outlined below:
Eligible Types of Exchange Import Categories
BE certificates Commodities from the “BE list” (composed of a restricted set of commodities)
Provincial foreign exchange
DP (Complementary Exchange)
Foreign exchange from the Foreign Exchange Fund
I, 11, and I11
I, 11,111, and IV
Subject to license
allocations
Aid-BEs Aid-BE lists, usually more restric- tive than the ordinary BE list
Aid-BEs were foreign credits and grants sold by the government to importers in the form of BE certificates. The Aid-BEs were sold at a substantial discount from export BEs because their use was restricted to imports from the donor country, lists of commodities eligible for im- port were usually more restrictive, and delivery lags were longer.
In 1967 the BE list was revised, and imports paid with provincial for- eign exchange were restricted to the commodities on the BE list. In addition, a DP list was formulated that included all items importable with DP exchange that were not on the BE list. Special Aid-BE lists re- mained for each donor country. The relative importance of these types of import financing is evident in table 5.9. Note the large share of im- ports financed by foreign aid, almost 30 percent in 1967 and 1968.
Imports were also subject to special licensing, varying degrees of pre- payment, import duties, surtaxes, luxury taxes, and “excess profits” tax.
Exchange Rate Unification
In May 1968 the special Aid-BE rate was abolished. However, since Aid-BE credits were tied to donor countries, and since lists of goods that could be imported with Aid-BE exchange were more restrictive than ordinary BE exchange, special credit inducements were provided to en- courage their use.
In April 1970 the dual exchange rate system was ended and the check-price overprice system was ab~ l i shed .~ The markets for BEs and DP exchange were merged, and the exchange rate was set at Rp 378 = $1. This was the DP exchange rate before exchange rate unification.

199 Alternative Trade Strategies and Employment in Indonesia
Table 5.9 Total Import Financing, 1966-71/72 (in Millions of U.S. Dollars)
Financed by 1966 1967 1968 1969 1970/718 19711728
Export BEs/general foreign exchange
Aid-BEs Program aid Food aid PL 480 Project aid
DP and free foreign exchange
Direct investment Merchants L/C
Imports of oil companies Subtotal
Total
68 114 1
0 0 536 737
68 68 604 805
- 94
1 0
75 1 80
831
125 21
0 906
87 993
32 65
146 1,008
94 1,102
42 121 23 8
1,155 132
1,287
Source : Bank Indonesia Report, various years. aFiscal year.
While this rate was nominally floating, the Bank Indonesia intervened in the market to support it.
The exchange rate unification meant that the more essential com- modities on the BE list no longer enjoyed a more favorable exchange rate than other imports that could previously be financed only with DP exchange. When credit costs are taken into account, imports with BE exchange may have actually been more expensive than imports with DP exchange. Importing with BE exchange was relatively more expensive because cheap foreign credit was available only to DP exchange financed imports. At one time, commodities on the BE list made up more than half of the value of imports financed with DP exchange (Simpkin 1970, p. 6).
The devaluation of 23 August 1971 to Rp 415 per dollar was Indo- nesia’s last official devaluation. It marked the end of a liberalization phase that had transformed Indonesia’s trade regime from one of the more restrictive among LDCs to one in which there was full exchange convertibility and a complete absence of foreign exchange licensing.
5.2.2 Effective Exchange Rates
To determine the effects of this complicated succession of foreign ex- change policies on returns from exporting, the effective exchange rate (EER,)for rubber exports has been calculated. Although there were periods when literally dozens of EERs for various exports existed, for the purpose of this research the rubber exchange rate is an adequate

200 MarkM.Pitt
proxy for an average EER, weighted by the value of exports. One reason this is true is that rubber would carry an enormous weight in such an average calculation. From 1950 to 1969, rubber exports contributed on the average about 57 percent of all nonmineral exports. In addition, rubber’s EER over that period usually lay somewhere near the middle of a ranking of the EERs of major agricultural exports. Pepper, tea, and kapok had somewhat higher EER,s, while copra and coffee often had lower EER,s. Other less important exports often had the highest EER,s, but they would carry very little weight in a weighted average.
The EER,s presented in table 5.10 were calculated by summing the values of all trade policy instruments, including such things as the value of import entitlement certificates, foreign exchange retention, and export taxes and premiums. The EER, thus calculated may differ, however, from the rate actually realized, because of illegal transactions.
The importance of the export incentive schemes meant that changes in the official registered exchange rates did not significantly alter the EER,. For example, the gross devaluation of 200 percent in 1952 (from Rp 3.8 to Rp 11.40) resulted in a net devaluation of 12.5 percent. Like- wise, gross devaluations of 294 percent, 22,000 percent, 16 percent, and 10 percent in 1959, 1965, 1970, and 1971 resulted in net devaluations of 19 percent, 300 percent, 8 percent, and 10 percent respectively.
Table 5.10 also presents an index of the estimated annual average price level deflated effective exchange rate (PLD-EER,) for natural rubber.1° The tremendous variance in the PLD-EER, index shows the effects of a consistently rapid rise in domestic prices countered from time to time by devaluation.
Notes to Table 5.10 Source: Pitt 1977, pp. 56, 66. Note: Col. 1: Effective exchange rate for (rubber) exports expressed in old rii-
piahs through 1965 and thereafter in new rupiahs resulting from the thousand-to- one currency conversion of December 1965. Col. 2: Cost-of-living index for a government worker in Jakarta linked with the sixty-two-item Jakarta cost-of-living index (expressed in old rupiah equivalent after 1965). Col. 3: Col. 1 deflated by col. 2 (and, from 1966 on, multiplied by 1,000 to adjust for currency conversion in December 1965) and converted to index series with 1971 as base year. Col. 4: See text (and, for currency conversion, see note on col. 1). Col. 5: Percentage excess of domestic price over world price (less transportation costs), latter being converted at rates given in col. 1. As explained in text, the term “disparity” is no longer appropriate for differentials after 1965. Col. 6: Realized effective exchange rate for exports; i.e., col. 1 increased by per- centage in col. 5. Col. 7: Col. 6 adjusted in same way as col. 1 in col. 3. Col. 8: Effective exchange rate for imports adjusted like col. 1 in col. 3. For further explanatiori of concepts, see text and chapter 1.

Table 5.10 Exchange Rates, Variously Defined and Adjusted, Annual Averages, 1950-72
cost of Free Price Living Index of Exchange Disparity Index of Index of Index PLD-EER, Rate for Rubber REER, PLD-REER, PLD-EER, EER,
(Rpper$ ) (1953 = 100) (1971 = 100) (Rpper$ ) (%) (Rp per $) (1971 = 100) (1971 = 100) Year (1) (2 1 (3 1 (4 (5 1 (6 (7 1 (8 1
1950 1951 1952 1953 1954
1955 1956 1957 1958 1959
1960 1961 1962 1963 1964
1965 1966 1967 1968 1969
1970 1971 1972
7.08 7.60 9.41
11.60 12.52
11.07 11.84 17.33 29.55 32.21
37.52 40.50
136.50 320.55 788.35
2,683.00 36.00
103.38 269.03 318.23
333.65 353.88 373.50
60 85 92
100 103
127 142 159 225 280
367 487
1,324 2,927 6,106
24,7 15 283,166 763,222
1,719,762 2,020,089
2,262,000 2,321,500 2,562,600
77.4 58.7 67.1 76.1 79.7
57.2 54.7 71.5 86.1 75.5
67.1 54.6 67.6 71.8 84.7
71.3 82.8 88.9
102.6 92.3
98.6 100.0 95.6
24.65 16.17 19.63 27.32 31.98
39.13 33.33 43.65 71.74
130.82
285.17 186.67 760.42
1,456.00 3,004.00
14,083.00 105.67 172.25 386.67 408.42
388.59 397.33 418.00
20.34 11.31 13.71 2.33
13.10
42.01 21.71 16.96 27.24 49.92
100.21 58.59 32.75 30.42 18.29
33.85 - 4.66 -12.17
.04 2.80
.54 - 3.26 - .02
8.52 8.46
10.70 11.87 14.16
15.72 14.41 20.27 37.60 48.29
75.12 64.23
181.21 418.05 932,52
3,591.18 34.32 90.80
270.12 327.13
335.44 342.34 372.89
96.24 67.46 79.06 80.48 93.21
83.94 68.82 86.47
113.33 116.95
107.40 89.44 92.81 96.85
103.57
98.54 82.20 80.68
106.51 109.8 1
100.56 100.00 98.68
244.6 119.5 102.2 123.3 158.5
203.7 140.8 142.4 170.6 250.6
270.4 199.2 217.6 201.2 205.4
256.9 182.7 132.6 133.8 131.9
113.6 100.0 86.6

202 Mark M. Pitt
In addition to the PLD-EER,, the ratio of the EER to the black- market or free-market rate of exchange gives some indication, albeit uncertain, of the rupiah’s overvaluation.ll Illegal transactions in inter- national trade characterized the 1950s and 1 9 6 0 ~ ~ with substantial quan- tities of foreign exchange being traded through black markets. In many years the black-market rate of exchange was many times greater than the effective rate. At its peak in early 1960, the black-market rate was almost eleven times the EER,, and over the five years 1960-64 it aver- aged more than five times as great. Since the black-market rate repre- sents the exchange rate for foreign exchange earned in smuggling, these disparities indicate that there were enormous incentives to smuggle.
It is well known that the smuggling of agricultural exports-rubber and copra in particular-was widespread. Because smuggling was a significant share of export trade, the EER, calculations for rubber that have been presented may not be good measures of the returns from export trade; logically it might be expected that smuggled rubber earned a greater rupiah return per dollar of export than legally exported rubber. And, indeed, one phenomenon that characterized Indonesian trade in the presence of smuggling was the existence of price disparity that is defined as the positive difference between the domestic price and the world price of an exported commodity converted at the legal ef- fective exchange rate. The existence of price disparity indicates that some of the higher returns from smuggling vis-8-vis legal trade are passed back to producers in the form of higher domestic prices.12
In table 5.10 annual estimates of price disparity caused by smuggling of rubber are presented, with price disparity being measured as a per- centage:
Pa - (EER, Pw) EER, P x 100,
where Pd = domestic price of rubber in rupiahs at Jakarta
Pw = international trade price of rubber; here it is based on the f.0.b. price of rubber at Singapore less transporta- tion costs.
EER, = legal effective exchange rate for rubber
The effect of smuggling on the domestic price of rubber over much of the 1950s and 1960s is demonstrated by these calculations. Over 1959-65, smuggling increased the domestic price of rubber by more than 46 percent on the average beyond the price that would have existed in its absence. In the year 1960 the domestic price was about double the legal trade price. Kenneth Thomas (1966, p. 102) claims that price disparity exceeded 160 percent in September 1965. After the reforms of 1966, price disparity fell markedly, as can be seen from column 5 of

203 Alternative Trade Strategies and Employment in Indonesia
table 5.10. Indeed, in some years the domestic price was slightly below the world price.
It is clear that over a number of years smuggling, working through the mechanism of price disparity, counterbalanced a significant amount of the price distorting effects of government trade policy. The effective exchange rate for all exports that was actually realized, REER,, was (EER,) X (1 + price disparity). The REER, for rubber is presented in table 5.10. The REER,s imply a level of price distortion considerably less than is implied by the EER,s. In addition, in table 5.10 there is also an index of PLD-REER,. These calculations suggest that, during 1958- 65, generally regarded as the period of greatest government intervention in the trade sector, the realized rupiah return to a dollar’s worth of rub- ber export was, surprisingly, on the average slightly greater, in real terms, than it was at the end of the liberalization period in 1971.
The PLD-EER for imports presented as an index in table 5.10 is calculated by comparing domestic and international import price indexes and deflating by the increase in domestic prices. Keeping in mind the potential error in such a calculation owing to aggregation and smuggling, note that the calculated PLD-EER, was at its highest level in 1959-65, when the value of total imports was lowest and subject to the greater restrictions. It was low in 1951-53, reflecting the freeing of imports as a result of the Korean War commodity price boom, but it leaped in 1955 when foreign exchange allotments for consumer goods were sharply curtailed. As the trade regime was liberalized, the PLD-EER, fell sharply, dropping nearly two-thirds from 1965 to 1972. Thus the esti- mated PLD-EER, seems to have moved in accordance with the nature of the trade regime.
5.2.3
As I mentioned earlier, there has been a definite movement toward increased protection of import-competing industries since 1972. How- ever Indonesia’s trade policies remain generally more liberal than those in other large LDCs. Examination of tariff schedules imposed since 1971 cannot provide information on whether protection from tariffs has increased without information on tariff collection rates, which tend to differ markedly from scheduled rates. Although a sectoral breakdown of tariff collections is unavailable for the years since 1971, it has re- cently been reported that there have been substantial increases in import duty collections (Grenville 1977, p. 25). In addition, the use of check- prices on imported commodities on which customs duties and import sales taxes are calculated has recently emerged as a protective device. For example, the check-prices on some textiles were raised by as much as 75 percent in 1975 alone. Imports of textiles and other commodities have also faced increased quantitative restrictions, import duty prepay-
The Current Phase: 1972 to the Present

204 MarkM. Pitt
ment, and restricted access to credit. On the other hand, exports have benefited from the reduction of the 10 percent export tax.
The government has also had a growing influence on factor markets. Minimum wage regulations have been enacted for a limited set of indus- tries in certain regions, and more are promised. The government has further encouraged the use of capital-intensive technologies by subsi- dizing credit and providing customs duty exemptions, tax holidays, and other incentives to new investment. On the other hand, it has acted to protect small-scale firms by exempting from sales and excise taxes weaving, knitting, and cigarette products originating from factories using nonmechanized technologies. Nevertheless, most observers agree that the recent new investment in manufacturing is very capital-intensive relative to existing ~ 1 a n t s . l ~ This is particularly true for the increasingly large public sector (including PERTAMINA) investments. After exam- ining public sector investments, McCawley and Manning (1976, p. 27) conclude that “it would be difficult to prepare a more capital intensive set of projects. Thus, despite the official emphasis that is given to the need to create jobs, in practice the goal of employment creation has re- ceived low priority.” In brief, current trade strategy seems to be moving away frum a liberslized foreign scctor and the express goal of employ- ment creation.
5.3 Effective Protection in Indonesian Manufacturing
5.3.1 Procedures
The 1971 input-output table for Indonesia provides much of the basic data necessary for the ERP estimates.14 The table includes 32 agricul- ture, livestock, forestry, and fishing activities, and 12 mining, 82 manu- facturing, and 45 service or other activities. Four of the 171 activities had no domestic production in 1971, so there were 167 producing in- dustries. For this study 2 activities were disaggregated to bring the total number of producing activities to 169, of which 83 were in manufactur- ing. The bulk of cottage and small-scale agricultural processing such as hand pounding of rice and peasant sugar refining were treated as manu- facturing value-added activities and included with similar processes oc- curring in larger-scale production units.
To estimate nominal protection, I relied heavily upon vectors of cus- toms duty and import sales tax collections and the c.i.f. value of imports included in the input-output table. These provide appropriate measures as long as tariffs are the only trade restriction and domestic taxes are not a factor. However, price comparisons were used to measure nominal protection in activities where imports were prohibited.16 In addition, goods whose import is performed solely by or for government agencies

205 Alternative Trade Strategies and Employment in Indonesia
have also had their nominal protection estimated in this manner. In 197 1 these government-imported commodities were rice, cloves,16 wheat flour, fertilizer, pesticides and inputs into pesticide production, and sugar.
Besides tariffs, I had to consider a variety of other protective devices in making my ERP calculations. These included an import sales tax, a withholding tax on corporate income, special exchange rates, export taxes, and, finally, the existence of illegal transactions. Each is discussed below.
Imported commodities are exempt from the domestic sales tax, and thus the import sales tax is not entirely protective. Collected at the same time as the customs duty and using the same tariff nomenclature, the import sales tax differs from the customs duty by both its rate of levy (and collection) and its base, which is the c.i.f. price of the import plus the customs duty and a 5 percent markup to cover presumptive storage, transport, and other costs. The domestic sales tax is not harmonized with the import sales tax. Only rarely does the domestic sales tax completely offset its import counterpart. The computation of the extent of the offset is complicated by a change in the tax schedule that went into effect in July and August of 197 1 .
Another complication in computing ERPs arises because of the MPO tax, a withholding tax on corporation income.17 It is paid to the govern- ment, at an ad valorem rate by the MPO collector on behalf of the pur- chaser, who can credit this amount against his corporation income tax liability. On domestic sales, the MPO rate was 2 percent in 1971, with the seller usually acting as MPO collector. For imported goods, the MPO rate was 3 percent except for commodities imported with a mer- chant’s letter of credit (L/C), for which the rate was 6 percent. The tax was not collected on exports. In the 1971-72 fiscal year, imports with a merchant’s L/C were 20 percent of all imports and 37 percent of all imports excluding those financed by foreign aid and direct invest- ment. For imports, banks usually act as collector, probably making evasion more difficult than for domestic sales. About one-half of all MPO revenue is collected from imports.
While the MPO increases the price of a commodity to a firm by its rate of collection, it may not affect a firm’s decision-making if the levy is merely treated as an advance payment on its profits tax. In that case the only protective effect of the discriminatory MPO rate on imports would be the relatively minor cost of additional tax prepayment.
However, because of the presumptive nature of the base of the corpo- ration income tax, the firm may choose not to claim an MPO tax credit.18 For tax collection purposes, profits are presumptively determined as a margin on sales, which in turn are a presumptive markup on cost. The total MPO credit claimed by the firm presumably indicates the firm’s

206 Mark M. Pitt
cost and thus, up the chain of margins, the firm’s presumed profit. It may be to a firm’s advantage to underreport MPO tax credits and thus reduce presumptive profit. Therefore the MPO tax is considered a sales tax and, for sectors subject to MPO tax, nominal protection in the esti- mates presented here includes a 1 percent MPO protective effect. This is a low estimate because the 4 percent protective effect of MPO on imports with merchants’ L/C has been ignored. This is somewhat offset by ex- emptions on MPO payment given firms under tax holiday and other special cases.
Special exchange rates took two forms in 1971 : fixed subsidized rates of exchange to import weaving yarns under the PL-480 program and raw cotton; and special rates of exchange for the import of restricted lists of commodities from certain origins with aid foreign exchange (Devisu Kredit) . On average during 1971 , these special exchange rates represented a subsidy of 46.7 percent for raw cotton and 68.0 percent for PL-480 weaving yarns.19 These are taken into account in the ERP estimates below.
Incentives for the use of aid foreign exchange beginning January 1971 included a reduced prefinancing requirement for aid exchange imports from most origins and an interest rate discount for credit. Concurrent with the official devaluation of 23 August 1971, a system of rebates to the official exchange rate of Rp 415 varying by country of origin was instituted for the import of goods with aid foreign exchange.20 Although nearly 24 percent of all imports in 1971 were paid for with aid foreign exchange (excluding imports under food and project aid) , it was ignored in calculating ERPs for two reasons. First, it was not possible to deter- mine the rate of subsidization by sector, and, second, the aid exchange rebates probably only offset the additional cost of their use.
In 1971 exporters were required to surrender 10 percent of their ex- port proceeds as an export tax. Exempted were the export of “finished goods and handicrafts” as defined by commodity lists. The lists do not seem entirely consistent; for example, tea was considered a finished good, while coffee, rubber, vegetable oils, and almost all other NRB and processed NRB goods were not. In addition, rubber, coffee, copra, and pepper exports were subject to a cess and rehabilitation levy on a per kilogram basis. These levies were substantially reduced in mid-1971. In addition, copra was also subject to regional levies, and coffee needed International Coffee Agreement stamps in order to be exported to Inter- national Coffee Organization (ICO) member nations. Finally, certain exports were prohibited with protective intent, namely, lower grades of rubber and chinchona bark, the raw material of quinine. All the above have been incorporated into the protection estimates.
Under Indonesia’s Sales Tax Act, export shipments are exempt from paying the domestic sales tax. In addition, the minister of finance can

207 Alternative Trade Strategies and Employment in Indonesia
exempt from sales tax commodities that by nature are destined for ex- port, although they may be utilized locally in intermediate stages. Never- theless, according to Cnossen ( 1973, p. 3 1 ) these provisions are not ob- served in practice. Therefore, in the ERP computations it is assumed that domestic sales taxes are levied on exports.
Illegal transactions, traditionally an important facet of Indonesian foreign trade, are potentially the most troublesome source of error in calculating protection rates. Two aspects of illegal import transactions may be important: importers may pay less than the listed tariff rate on the true value of the import, or they may pay the listed tariff on an un- derinvoiced import value.
Richard Cooper ( 1974) has verified the quantitative importance of the first aspect (paying less than the stated tariff rate) through a com- parison of actual tariff collections and the listed legal tariffs. Not all of the difference between theoretical and actual tariff collections can be attributed to illegal transactions. There are a number of legal tariff exemptions, including imports for direct investment by both foreign and domestic firms, imports for aid projects, and numerous special exemp- tions by the Ministries of Finance and Trade.21 Nevertheless, exempt imports explain only a small part of the difference between theoretical and actual tariff collections.
Even if importers pay the listed tariff, there may still be evasion of tariffs if the commodity is underinvoiced. Recall that actual tariff col- lections are the starting point for most of the nominal protection calcu- lations. Thus underinvoicing can create a real problem because tariff collections are divided by the listed (underinvoiced) c.i.f. values of imports to obtain tariff rates and therefore protection is overestimated. However, the computed estimates will be reliable if all imports are cor- rectly valued at customs and if illegal transactions occur only via the underpayment of trade taxes. That is, the actual tariff collections, al- though underpaid (less than implied by the listed tariff) would measure protection on the actual c.i.f. price.
Using data on foreign and domestic prices for a number of imported commodities for the years 1969 and 1971, Cooper econometrically esti- mated the relationship between observed domestic prices and scheduled tariff rates. Employing his results and the observed relationship between actual tariff collections and scheduled tariff rates, I performed an analy- sis to determine if the use of tariff collection data and declared import values results in a systematic underestimate (or overestimate) of actual domestic prices. There was no evidence that nominal rates of protection calculated with tariff collections data would be systematically biased, only that the error of the estimates may be large.22
Finally, adjustments had to be made in activities where intermediate inputs were commodities in the same sector as the final output but with

208 MarkM.Pitt
differing nominal rates of protection. This was particularly important in assembly industries, where commodities in a completely knocked down (CKD) condition enter with a tariff discount.
5.3.2 The Structure of Protection
Estimates of nominal and effective protection for Indonesian manu- facturing activities for the year 1971 are given in the Appendix (along with their input-output code numbers and names). Aggregates for trad- able categories are presented in table 5.11, and values for major ex- portables and importables are given in table 5.12.
Classification of Activities
Forty-six activities were classified as home goods. Most of these were service activities, but also included are sugarcane (1-0 code no. 1 1 ) , cof- fee (16), tea (17), dairy products (23), poultry products (26), stone quarrying (40), and repairing of motor vehicles (118). A few service activities in which trade was substantial were not considered home goods. Paddy ( 1 ) and cassava (3 ) , which enter trade in small amounts, might marginally be considered home goods but were classified as natural resource based (NRB) tradables in the following analysis.23
All agriculture, forestry, livestock, fishing, mining, and quarrying activ- ities not considered home goods were classified as NRB tradables, as was nonferrous metal refining ( 103).
Table 5.11 Distribution of Effective Protection in Indonesian Manufacturing, 1971
HOS Manufacturing Tradable Group Effective Rates of Protection
1. Exportables 2. Importables (excluding negative IVA activities)
Activities with lowest protection Excluding processed NRBs
Activities with medium protection Excluding processed NRBs
Activities with highest protection Excluding processed NRBs
3. All importables (including negative IVA activities) 4. Noncompeting importables 5. All importable sectors (3 and 4)
All HOS tradable sectors (1, 3, and 4)
- 1 1 % 46
-13 26 55
132 279 473
66 15 65 33
Source: Appendix table 5.A.1.
Note: Calculated as x 100, where i indexes the activities in a tradable group.

209 Alternative Trade Strategies and Employment in Indonesia
Table 5.12 Characteristics of Major HOS Exportables and Importables, 1971
Industry
~ ~
with Nominal Effective DCs Protection Protection T, Tradea
Exporta bies Canned and preserved fish
Coconut oil and cooking oil and seafoods 0%
- 10 Vegetable oils, animal oils. and fats - 10 Dried cassava and tapioca flour Coffee grinding Tea processing Processed tobacco Tanneries and leather finishing Sawmills Smoking and remilling of rubber
Importables Canned and preserved meat Rice milling and polishing Sugar refining Soybean products Cigarettes Spinning industries Weaving industries Wearing apparel Printing, publishing Soap Motor vehicles
- 10 -15
0 - 10
0 0
-11
5 - 13
30 0
82 - 8
44 55 25 41
110
1% 68
- 12 - 19 - 19
0 - 27 - 4
1 -11
50 - 15 154 25
556 134
199 42
701 526
Neg. IVA
- .oo - .06 - .83 - .22 - .60 - .66 - .13 - 1.08 - .oo - 104.8”
98 % 100 98
100 95 99 98 93 95 96
.oo 80
.05 69
.08 15
.03 62
.OO 96
.40 49
.19 75
.02 79
.30 97
.03 78 S 2 99
Source: Appendix table 5.A.1, 5.A.2. Note: Activities with production in excess of 25,000 million rupiahs. nTrade refers to exports for exportables and imports for importables. bowing to a fall in inventories, export exceeded production, and therefore the cal- culated value for T is positive. A sector is exportable if T c < 0 or T > l ; the latter values can occur only if inventories are reduced.
All activities classified as NOS tradables were manufacturing activi- ties. These industries were further classified as either exportable, import- able, or noncompeting, following the T statistic methodology described in chapter 1. Exportables had a negative Ti, importables had Tis be- tween 0 and 0.8, and noncompeting had Tis greater than 0.8.
These values are calculated only for the year 1971. For those activi- ties whose value of T was close to 0 or 0.8 or where there was a priori knowledge of significant trade fluctuations, reference was made to the trade data of succeeding and preceding years in making the ultimate classification. Thus the fertilizer (84), railroad equipment ( 11 5 ) , and

210 Mark M. Pitt
aircraft (119) industries were classified differently than the 1971 T statistic would indicate.24
HOS tradables were further subdivided into those considered to process NRB goods and those that do not. The processed NRB sub- group as used here covers certain manufacturing activities that, with the input-output information available at the time of preparing this analysis, could not be clearly separated between the NRB stages neces- sary to turn a raw material into a tradable product and further HOS stages of processing. Coffee provides a good illustration on the side of Indonesia’s exports. Although the coffee growing activity (1-0 code num- ber 16) is properly categorized as NRB, the value added in the coffee roasting and grinding activity (58) embraces certain additional NRB states such as the sorting and drying needed to make the product trad- able and further HOS processing beyond that point. A similar mixture of NRB and HOS stages is found in tapioca (53) and tea processing (59) among export industries and in rice milling (51) and sugar refin- ing ( 5 6 ) among importable industries. These industries are accordingly classified as processed NRBs in the following analysis. Given the im- portance of the smoking and remilling of rubber (1-0 code 94) as an export industry, it should be noted that this industry is not here classi- fied as a processed NRB but rather as “other HOS.” The reason is that natural rubber can be exported in cruder form, processed just sufficiently to allow it to be traded, and as such would be considered an export from the rubber-tapping activity ( 10) .25
In analyzing the structure of protection and factor proportions in various classes of HOS tradables, two activities were excluded (“petro- leum refining” [91] and “other petroleum and coal products” [92]) be- cause of a lack of data on factor requirements (except for the wages and salaries data of the input-output table). With their huge value added (almost 15 percent of total value added in HOS industries), any error in estimating their factor requirements would lead to a correspondingly large error in the aggregate results.26
The Distribution of ERPs over Commodity Categories
The distribution of average ERPs by commodity category is presented in table 5.1 1. Importable activities excluding those with negative inter- national value added were ranked by ERPs. This ranking was then di- vided into three groups of equal domestic value added, and the groups were labeled as “lowest protection,” “medium protection,” and “highest protection” sectors.
Eight activities had negative value added at international prices, all of them HOS importables. Four of them were textile industries, including the large weaving sector. This is somewhat surprising, since other Asian

211 Alternative Trade Strategies and Employment in Indonesia
LDCs have efficient textile industries, often with large export volume. For the Indonesian weaving industry, nominal protection was not extra- ordinarily high (44.3 percent); it was largely the subsidy given cotton yarn imports that resulted in the finding of negative IVA. Of course there may be some components of this sector with positive IVA.
Negative ERPs were found to occur in fifteen of the manufacturing activities reported in table 5.A.1. Of these fifteen activities, eleven were HOS exportables, three were noncompeting importables, and one was a processed NRB HOS importable (rice milling). The large number of HOS exportables with negative protection indicates the lack of attention to exports, and the consequent disincentives for them, that characterized the Indonesian trade strategy in 1971.
Since eleven out of fifteen exportable industries had negative rates of protection, it is not surprising that, as a group, exportables had negative effective protection of -1 1 percent. The trade regime quite definitely favored importables, with their overall rate of protection of 66 percent. Indonesia, like many other countries in this study, did not provide high levels of protection to noncompeting importables, particularly if they produced capital goods. These industries had a relatively low 15 percent ERP.
The least-protected activities in the importable group had negative effective protection. This is due mainly to the negative protection af- forded the large rice milling sector. When rice milling and the other processed NRB importables (sugar refining) were excluded, protection was positive. The protection afforded the most-protected industries in the importable group was six times that afforded all nonnegative IVA importable industries. These results indicate the wide range of incentives given to the various manufacturing sectors.
5.4 Factor Proportions in Indonesian Trade in Manufactures
5.4.1 The Measurement of Factor Inputs
For HOS importable and exportable activities, nine measures of factor use were employed: four types of labor, one measure of skills, and four measures of capital.
Four surveys were drawn upon to estimate labor coefficients. The total labor requirements per million rupiahs of DVA in importable and export industries were calculated from a 1973 industrial survey carried out by the Biro Pusat Statistik of Indonesia covering large and medium- size firms.27 These data were augmented by a 1973 sample survey of small firms (Biro Pusat Statistik 1974) in a limited number of industries and a new 1974-75 industrial census of household and cottage indus-

212 MarkM.Pitt
tries (Biro Pusat Statistik 1976-77). The data permitted measurement of labor requirements in terms of man-days and are believed superior to data derived from the input-output table.
Labor requirements were disaggregated into manager, other white- collar, male operative, and female operative man-days on the basis of a 1971 industrial survey (BPS, Statistik Zndustri 1971). The 1971 survey contained information on the number of employees of each of these four types by sector. The proportion of each type of employee in the total employees of each sector was then multiplied by the total labor require- ments in man-days obtained from the 1973 data to yield the final man- days disaggregations. For this purpose it is assumed that man-days per employee did not differ across the various employee types and that the employee composition did not change from 1971 to 1973.28
The measure of skills used is based on estimates of the average wage per man-day calculated from the 1973 industrial survey of large- and medium-size firms. The wage for unskilled labor was taken to be the average wage of the five HOS tradable sectors reporting the lowest aver- age wage-Rp 125 per man-day. Pure skill-days per million rupiahs of value added for sector i was then computed as the ratio of the wage in the ith industry to the unskilled labor wage times total man-days per million rupiahs of domestic value added. Other measures of skill in- tensity can be derived from the labor requirement disaggregation, for example, the ratio of white-collar to blue-collar man-days.
There are four capital requirement measures, two based on the horse- power of installed machinery and two on energy utilization. The horse- power measures are for prime movers and electric motors. Horsepower of prime movers-that is, machines that use nonelectrical sources of energy-may represent a less sophisticated type of capital. Such ma- chinery is prevalent in food processing and other activities located in rural areas where electricity is unavailable. For example, prime-mover horsepower predominates in the large rice milling and tapioca sectors. The two energy-related measures of capital are electricity consumption in kilowatt-hours and the value of all energy consumed.
For noncompeting importables, factor requirements were taken from the 1973 United States Annual Survey of Manufactures (United States 1976). Labor requirements in man-days are the only measure of factor requirements available from United States data that are comparable to the Indonesian data. Because domestic factor proportions differ between the United States and Indonesia, using the United States data directly would underestimate labor requirements. Therefore the data are ad- justed by the ratio of the labor input in a set of industries in Indonesia to the labor input in the same set of industries in the United States. Most of the industries chosen in calculating this correction factor are indus-

213 Alternative Trade Strategies and Employment in Indonesia
tries classified as noncompeting in which some domestic production nonetheless exists.
5.4.2 Factor Proportions: Direct Requirements
Table 5.13 presents data on direct factor requirements per unit of value added in HOS exportable and importable activities. Table 5.14 gives estimates for major exportables and importables (a complete listing is found in appendix table 5.A.2.) For aggregating the exportable indus- tries, the value-added content of production is used as a weight; for the import-competing sectors, each sector is weighted by domestic value added of domestic production plus the domestic value-added con- tent of imports.29 The table also presents data with HOS processed NRB activities excluded.
The data in table 5.13 indicate that exportable industries use twice as much labor per unit of DVA as importables. Exportables use more of each type of labor, but ratios vary markedly over labor types. White- collar labor is a greater share of total labor requirements in importable industries than in exportable industries. Since white-collar labor typically embodies more human capital than operative labor, the indication is that importables are more skill-intensive. This is borne out by the skill- day requirement data.
All four measures of capital use indicate a greater capital requirement by importables than by exportables. Importables use nearly two and one- half times the horsepower, twice the energy expenditure, and one and one-half times the electricity consumption per unit of domestic value added as exportables.
These results are basically unchanged if processed NRB industries are excluded from the analysis. As might be expected with her relative abundance of unskilled labor, Indonesia’s exportables are clearly more labor-intensive and less skill-intensive than her importable industries.
5.4.3 Factor Requirements by Trade Origin and Destination
Trade flows were disaggregated among seven origin/destinations: Japan; Singapore and Hong Kong; other developed countries; member countries of the Association of South-East Asian Nations (ASEAN) except Singapore; South Korea and Taiwan; socialist countries; and other less developed countries. A serious problem centers on the role of Singapore and Hong Kong as an entrepht for Indonesian exports. Al- though some of the Indonesian exports they receive are reprocessed, most are merely reexported, primarily to developed countries. By far the most important commodity to enter this trade is milled natural rubber. Thus, for purposes of aggregating the seven origin/destinations into two-developed countries and less developed countries-trade with

Table 5.13 Summary Table: Direct Factor Requirements, Exportable and Import-Competing HOS Manufacturing Sectors (Requirements per Million Rupiahs of Value Added)
Factor
Import- Exportable Competing Exportable
Import- Competing
Sectors Sectors Sectors Sectors per Unit of DVA per Unit of DVA per Unit of IVA per Unit of IVA
(a) (b) (a) (b) (a) (b) (a) (b)
Total man-days Manager man-days Other white-collar man-days Male operative man-days Female operative man-days S kill-days Prime mover (horsepower) Electric motor (horsepower) Total horsepower Electricity used (kwh) Energy consumed (Rp 000)
2,175 55
214 1,118
787 1,175
4.77 2.46 7.23
44.59 2,386
1,644 33
152 843 617
1,263 6.30 2.33 8.63
45.45 2,448
1,038 50
150 636 203
1,45 1 9.67 7.99
17.66
9 1.42 3,886
950 35
144 536 235
1,576 6.07
10.50 16.58
96.90 5,130
2,230 57
273 1,292
608 1,809
4.46 2.53 6.99
29.97 4,367
1,754 29
228 1,016
48 1 1,929
3.14 1.52 4.61
20.96 6,133
1,159 54
201 750 154
2,983 13.91 23.39 37.30
214.45 12,639
1,116 50
207 698 161
3,314 13.43 27.22 40.65
237.00 14,724
Source: Author’s computations as described in text. Note: Col. a: All sectors in tradable classification; col. b: Processed NRB sectors excluded.

215 Alternative Trade Strategies and Employment in Indonesia
Table 5.14 Direct Factor Requirements in Major HOS Importables and Exportables Labor (Man-Days/Million Rupiahs of DVA)
Man- Skill- Total Industry Total agers Days Horsepower
Importables Canned and preserved meat 514 21 1,069 5.93 Rice milling and polishing 1,150 105 2,383 24.83 Sugar refining 1,571 37 2,438 8.08 Soybean products 3,253 88 3,695 8.59 Cigarettes 52 0 490 .35
Spinning industries Weaving industries Wearing apparel Printing and publishing Soap Motor vehicles
304 5 1,398 15.01 870 14 1,802 10.13
1,990 63 5,508 1.75 102 3 266 95.58 468 16 2,134 1.85 440 25 2,893 7.26
Expor tables Canned and preserved fish and seafood 1,335 41 1,324 4.78 Coconut oil and cooking oil 792 23 2,281 6.50 Vegetable oil, animal fats and oils 600 17 2,400 6.50 Dried cassava and tapioca flour 2,462 128 2,796 37.25 Coffee grinding 3,876 196 6,822 15.61
Tea processing 3,715 40 4,012 7.59 Processed tobacco 4,057 46 2,953 .77 Tanneries and leather finishing 940 38 2,218 22.32 Sawmills 1,023 38 3,396 28.13 Smoking and remilling of rubber 2,300 35 4,968 3.72
Source: See text.
Singapore and Hong Kong is considered trade with developed countries. The quantitative importance of considering export trade via Singapore and Hong Kong trade with developed countries is highlighted by the fact that, if they were considered an LDC destination, then only 3.7 percent of HOS exports (and 36.6 percent of HOS exports excluding rubber) to LDCs would be to destinations besides Singapore and Hong Kong. The value of all HOS exports to LDCs excluding Singapore and Hong Kong in 197 1 was $16.75 million.30
Table 5.15 shows that labor requirements for exports to developed countries are virtually the same as labor requirements for exports to less developed countries. Exports to less developed countries also require 22 percent more skill-days and more capital (by two out of three measures) than exports to developed countries. If processed NRB in- dustries are excluded, as also shown in table 5.15, exports to developed countries require less labor, skills, and capital (by every measure) than exports to less developed countries.

Table 5.15 Direct Factor Requirements per Unit of DVA by Trade Destination or Origin (per Million Rupiahs of Domestic Value Added)
Total Electricity Energy Man-Days Skill-Days Horsepower ( Kwh 1 ( RP 000 1
Trade Origin or Destination (a) (b) (a) (b) (a) ( b ) (a) (b) (a) ( b )
Exportable HOS Manufacturing lndustries
Developed countries 2,176 1,630 1,166 1,256 7.14 8.52 2,384 2,434 45.11 45.22 Japan 1,398 1,359 434 400 4.05 3.85 2,432 2,434 44.72 44.93 Singapore and Hong Kong 2,259 2,085 1,460 1,723 5.35 9.33 5,822 4,261 49.63 42.41 Other DCs 2,327 1,541 1,250 1,316 8.31 9.45 1,448 1,796 43.97 46.28
Less developed countries 2,149 2,105 1,421 1,472 9.72 12.42 2,427 2,892 30.73 52.90 ASEAN except Singapore 3,233 2,501 726 913 5.65 10.59 1,475 1,705 48.90 60.75 South Korea and Taiwan 3,197 1,368 484 2,073 5.45 24.53 681 1,402 26.18 73.99 Socialist countries 2,492 2,139 2,558 2,478 7.88 5.96 7,310 9,168 15.08 15.84 Other LDCs 1,392 2,305 1,449 629 12.77 3.88 1,338 758 26.86 40.98
Import-Competing HOS Manufacturing Industries
89.61 94.10 Japan 793 716 1,454 1,502 16.36 14.54 4,176 4,983 98.89 105.17 Singapore and Hong Kong 1,164 1,162 1,538 1,541 11.69 11.71 7,650 7,680 68.81 68.66 Other DCs 1,066 1,017 1,562 1,706 22.64 22.41 3,200 4,246 90.55 97.66
Less developed countries 1,177 921 1,202 1,413 14.24 11.18 2,617 4,842 89.30 95.82 ASEAN except Singapore 1,124 1,028 1,294 1,505 21.95 13.01 1,359 4,364 85.61 136.84
1,225 1,303 10.34 10.83 5,951 6,899 122.82 127.90 South Korea and Taiwan 889 741 Socialist countries 1,281 945 1,117 1,406 8.95 9.96 2,278 3,061 87.23 72.98
76.48 71.88 Other LDCs 1,201 1,038 1,253 1,535 18.05 14.21 3,142 8,283
Developed countries 994 946 1,523 1,603 18.76 17.54 4,264 5,211
Source: Author’s computations as described in text. Note: (a) All sectors in tradable classification; (b) processed NRB industries excluded.
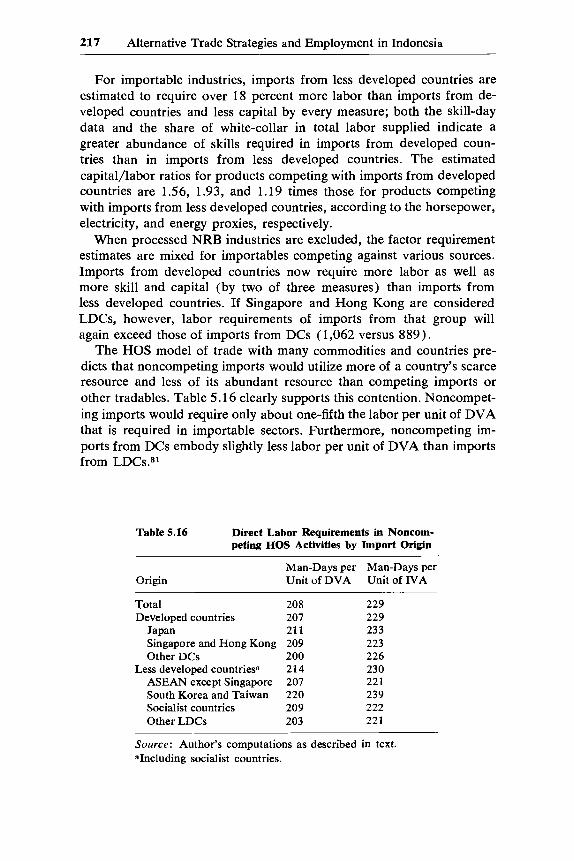
217 Alternative Trade Strategies and Employment in Indonesia
For importable industries, imports from less developed countries are estimated to require over 18 percent more labor than imports from de- veloped countries and less capital by every measure; both the skill-day data and the share of white-collar in total labor supplied indicate a greater abundance of skills required in imports from developed coun- tries than in imports from less developed countries. The estimated capital/labor ratios for products competing with imports from developed countries are 1.56, 1.93, and 1.19 times those for products competing with imports from less developed countries, according to the horsepower, electricity, and energy proxies, respectively.
When processed NRB industries are excluded, the factor requirement estimates are mixed for importables competing against various sources. Imports from developed countries now require more labor as well as more skill and capital (by two of three measures) than imports from less developed countries. If Singapore and Hong Kong are considered LDCs, however, labor requirements of imports from that group will again exceed those of imports from DCs ( 1,062 versus 889).
The HOS model of trade with many commodities and countries pre- dicts that noncompeting imports would utilize more of a country’s scarce resource and less of its abundant resource than competing imports or other tradables. Table 5.16 clearly supports this contention. Noncompet- ing imports would require only about one-fifth the labor per unit of DVA that is required in importable sectors. Furthermore, noncompeting im- ports from DCs embody slightly less labor per unit of DVA than imports from L D C S . ~ ~
Table 5.16 Direct Labor Requirements in Noncom- peting HOS Activities by Import Origin
Origin Man-Days per Man-Days per Unit of DVA Unit of IVA
Total Developed countries
Japan Singapore and Hong Kong Other DCs
ASEAN except Singapore South Korea and Taiwan Socialist countries Other LDCs
Less developed countriesa
208 207 21 1 209 200 214 207 220 209 203
229 229 233 223 226 230 22 1 239 222 22 1
Source: Author’s computations as described in text. aIncluding socialist countries.

218 MarkM.Pitt
5.4.4
For computing direct and home goods indirect factor requirements for Indonesian HOS tradable classifications, total man-day labor require- ments are the only measure of factor use available. Even if data on horsepower or energy consumption were available for home goods activi- ties, they would be poor measures of the capital services provided in these predominantly service and agricultural sectors. Direct and home goods indirect labor requirements per million rupiahs of direct and home goods indirect value added for various classifications of Indonesian HOS tradables are presented in table 5.17. There is only a minor differ- ence between the direct and the direct plus indirect results. Exportable labor requirements fall slightly, while those of importable activities re- main practically constant. This implies that home goods labor require- ments are close to those of importables. In summary, these estimates provide results that mirror those from the analysis of direct requirements only.
Direct Plus Indirect Home Goods Requirements
5.4.5
The HOS factor proportions explanation of trade predicts, among other things, that a labor-abundant country like Indonesia will import commodities with a higher capital/labor ratio than those it exports. In particular, with balanced trade, it predicts that Indonesia will be a net exporter of labor and a net importer of capital. The net factor con- tent of trade, the statistic necessary to test this proposition, measures the net factor content of a representative basket of exports and competing imports leaving the trade balance unchanged. To correctly test the HOS proposition, trade flows should be partitioned between less labor- abundant and more labor-abundant areas. Since Indonesia probably lies near the bottom of a ranking of all countries by capital/labor ratios, it might be expected that the Indonesian net factor content of trade to every broad grouping of countries will reflect a net export of labor.
The conversion of factor requirements per unit of DVA into interna- tional value-added terms for reasons explained in chapter l was accom- plished by applying the calculated ER Ps. In aggregating exportable and importable industries for the net factor content of trade calculation, the weighting system used is the actual international value-added content of the 1971 basket of competing imports and exports. The resulting statis- tic thus differs from the calculated factor requirements at domestic prices by both the prices used and the system of weights.
An examination of the IVA columns of table 5.13 reveals that, with balanced trade, Indonesia is clearly a net exporter of labor and a net importer of capital and skills. The capital/labor ratio of her imports is from six to fourteen times that of her exports, depending on the capital
Net Factor Content of Trade

Table 5.17 Direct and Home Goods Indirect Labor Requirements by Trade Destination or Origin (Total Man-Days per Million Rupiahs of Direct and Home Goods Indirect Domestic Value Added)
Developed Countries Less Developed Countriesa
South Social- Total, Singapore ASEAN Korea ist
HOS Manufacturing All and Other Except and Coun- Other Sectors Countries Total Japan Hong Kong DCs Total Singapore Taiwan tries LDCs
All Sectors in Tradable Classification Exportable sectors
Per DVA 1,990 1,989 1,270 2,092 2,129 1,975 2,865 2,864 2,234 1,221 Per N A 2,060 2,056 1,175 1,937 2,188 2,093 2,240 1,676 1,894 2,154
Per DVA 1,038 998 816 1,142 1,057 1,171 1,122 964 1,276 1,184 Per IVA 1,245 1,208 1,103 1,699 1,183 1,447 1,213 1,318 1,744 1,264
Import-competing sectors
Processed NRB Sectors Excluded Exportable sectors
Per DVA 1,514 1,503 1,241 1,916 1,425 1,932 2,242 1,295 1,978 2,081 Per IVA 1,623 1,625 1,057 1,847 1,533 1,711 1,588 1,528 1,811 1,378
Per DVA 960 961 749 1,140 1,016 924 1,108 835 951 1,036 Per IVA 1,222 1,224 1,115 1,696 1,194 1,143 1,731 1,188 1,231 1,099
Import-competing sectors
Source: Same as table 5.11. *Including socialist countries.

220 MarkM.Pitt
measure used. With processed NRB industries excluded, the estimated capital/labor ratios of imports range from four to eighteen times that of exports. Imports also embody 65 percent more skill-days than exports and more than three times as many skill-days per man-day of direct labor, a result not significantly altered by the exclusion of processed NRB sectors.
Table 5.18 provides the data needed for bilateral tests of the HOS propositions with respect to the net factor content of trade. There it is seen that for all nine trade destinations and origins specified Indonesia is a net exporter of labor. For all three measures of capital Indonesia is a net importer of capital in trade with all nine destinations, with the sole exception of the electricity consumption measure in trade with socialist countries. In addition, Indonesia is a net importer of skill-days from eight of nine trading areas, socialist countries again being the exception. When processed NRB industries are excluded from the calculations, the results are nearly the same as those based on the full set of HOS tradable sectors; however, the two exceptions noted above disappear.
The results including both direct and indirect labor requirements and value added at international prices are found in table 5.17. There it may be seen that exports embody more labor than competing imports regardless of the inclusion or exclusion of processed NRB sectors. Bi- lateral tests using all HOS manufacturing sectors yield similar results for trade with both developed and less developed countries but, if raw- material-based sectors are excluded, not for trade with Japan and ASEAN countries except Singapore.
5.5 Factor Proportions and the Height of Protection
In this section the influence of the trade regime on the commodity composition of trade is examined. If the levels of protection provided vary among industries, the commodity composition of trade, and hence its factor composition, are likely to be affected.
To test this proposition, we again aggregate importable industries by three levels of protection. It would be expected that, the closer an in- dustry lies to Indonesia’s comparative advantage, the less protection is needed to enable it to produce domestically. Thus it is expected that least-protected industries would be the least capital- and skill-intensive.
Factor requirements data for each of the three groups are presented in table 5.19, weighted in the same manner as direct factor requirements. Note that the only direct absolute factor requirement that changes monotonically over the three groups is skill-days. But two capital-labor ratios, electricity per man-day and energy per man-day, rise mono- tonically. It is interesting that industries with medium protection have the greatest absolute labor and capital requirements (by every measure).

Table 5.18 Direct Factor Requirements per Unit of IVA by Trade Destination or Origin (per Million Rupiahs of International Value Added)
Developed countries Japan Singapore and Hong Kong Other DCs
ASEAN except Singapore South Korea and Taiwan Socialist countries Other LDCs
Less developed countries
Developed countries Japan Singapore and Hong Kong Other DCs
ASEAN except Singapore South Korea and Taiwan Socialist countries Other LDCs
Less developed countries
2,229 1,273 2,077 2,372 2,257 2,494 1,792 2,082 2,528
1,124 983
1,624 1,130 1,345 1,081
998 1,669 1,211
1,750 1,119 2,003 1,653 1,856 1,737 1,624 1,962 1,486
1,127 982
1,620 1,129 1,015 1,268
825 1,074
968
Exportable HOS Manufacturing Sectors
1,800 1,928 6.99 4.65 4,352 6,113 1,693 1,639 6.33 5.77 3,038 3,274
8,351 8,517 2,174 2,255 3.72 3.65 1,653 1,730 8.41 5.23 2,832 4,759 2,043 1,961 6.98 5.03 4,762 6,648 1,627 1,366 7.88 5.28 1,612 2,848
746 1,108 6.33 11.17 721 903 2,286 2,280 5.20 4.39 7,771 8,628 1,899 1,106 10.30 6.25 615 1,589
Import-Competing HOS Manufacturing Sectors
13,069 14,398 3,172 3,395 39.71 41.75 3,231 3,411 33.02 34.00 15,409 16,650 3,851 3,863 43.31 43.46 15,725 15,788 3,018 3,292 43.40 46.69 11,105 12,596 1,960 2,594 24.25 30.75 10,309 17,652 1,814 3,446 25.12 33.76 5,455 16,336 2,164 2,268 26.91 28.70 20,141 22,319 1,950 2,459 21.35 28.66 7,710 11,988 1,976 2,823 27.84 37.57 13,661 26,463
30.47 25.43 17.95 36.13 16.81 30.08 13.58 13.16 16.57
215.41 256.64 233.45 185.72 209.28 187.36 343.13 192.07 152.55
21.06 26.56 13.90 25.50 18.50 30.28 28.99 13.51 30.54
231.14 272.90 233.83 202.20 292.61 460.11 366.65 224.68 216.04
Source: Author’s computations as described in text. Note: Col. a: All sectors in tradable classification. col. b: Processed NRB sectors excluded.

222 MarkM. Pitt
Table 5.19 Direct Factor Requirements per Unit of DVA and Height of Protection
Importables ~~~ ~
All With With With Export- HOS Lowest Medium Highest
Factor Requirements ables Imports Protection Protection Protection
Per Million Rupiahs of Domestic Value Added Total man-days 2,175 1,038 1,130 1,326 752 Skill-days 1,175 1,451 1,225 1,200 1,958 Total horsepower 7.23 17.66 27.20 24.74 6.26
Electric motor horsepower 2.46 7.99 7.35 17.43 2.05 Electricity (kwh) 2,386 3,886 3,105 5,524 3,791 Energy (Rp 000) 44.59 91.42 81.85 103.19 90.84 Electricity per man-day 1.10 3.74 2.75 4.17 5.04 Skill-days per man-day 0.54 1.40 1.08 1.02 2.60 Energy (Rp) per man-day 20.50 88.07 72.43 77.82 120.80
Ratios of LDC to DC Factor Requirement@ Total man-days 1.184 1.024 1.104 1.115 Skill-days 0.789 0.999 0.711 0.863 Total horsepower 0.759 0.928 0.343 1.137
Electric motor horsepower 0.366 0.288 0.198 1.237 Electricity (kwh) 0.614 0.182 0.343 1.819 Energy (Rp 000) 0.996 0.859 0.985 1.157
Source: Author's computations as described in text. aMore precisely, ratios of factor requirements of products competing with imports from LDCs to factor requirements of products competing with imports from DCs.
Most-protected industries, which might be expected to be inefficient, nevertheless seem to use both less labor and less capital to produce one million rupiahs of DVA than do the other groups.32 However, the cor- rect measure of efficiency would be in terms of factor requirements per unit of IVA, because otherwise the inefficiency of highly protected in- dustries is disguised by their inflated domestic value added. Using this measure (see table 5.20), note that the most-protected industries use more labor, skills, and capital (by two out of the three measures) than do other import-competing sectors. Exportables use by far the most labor, but they use much smaller inputs of capital than any importable group.
An explanation is possible for the odd behavior of some of the factor proportions data of table 5.19. The least-protected group is composed of only six industries, which include two capital goods industries, electrical machinery and apparatus ( 109) and shipbuilding, boatbuilding, and repairing (1 14), as well as one activity on the margin of being non- competing, fertilizer (84). These industries are very capital-intensive according to our capital proxy measures and, because their volume of trade is large, they carry a heavy weight in the factor requirement

223 Alternative Trade Strategies and Employment in Indonesia
computation. It also seems likely that in the case of electrical machinery and shipbuilding imported commodities may differ substantially from domestically produced commodities. Therefore the data for the least- protected group should be viewed with caution. For the most-protected group, it appears likely that the capital measures, particularly horse- power, are poor measures of real capital services provided to the activi- ties involved. For example, the horsepower (and other capital) require- ments in the drug, motor vehicle assembly, cosmetics, cigarettes, and storage and dry battery industries are very low compared with their rela- tive capital intensity in other countries. Probably the capital require- ments data available do not adequately measure the more complex types of capital used in these industries. The same may be true for all activi- ties; thus my capital requirements estimates generally should be viewed with some caution.
As would be expected, table 5.19 shows that capital requirements of products competing with LDCs are lower than capital requirements of products competing with DCs for both medium- and least-protected sectors. The difference is particularly striking for the electric motor horsepower and electricity consumption measures, which represent more sophisticated capital than the other measures. The contrary results for the most-protected industries are perhaps also due to the inadequacy of the capital proxies used in measuring the flow of real capital services to these sectors.
It is also of interest to check whether new investment by activity is related to the height of protection. Table 5.21 presents data on fixed capital formation obtained from manufacturing surveys, which, though limited to two years, permit some tentative observations to be made. The data indicate that in 1972-73 fixed capital formation per unit of DVA in import-competing sectors was 24 percent higher than in ex- portable sectors. The difference in capital formation between least-
Table 5.20 Direct Factor Requirements per Unit of WA and Height of Protection (per Million Rupiahs of International Value Added)
Factor Requirements
Total man-days Skill-days Total horsepower
Electricity (kwh) Energy (RP 000)
Electric motor horsepower
Export- able Sectors
2,230 1,809 6.99 2.53
4,367 29.97
All HOS Import- Com- peting Sectors
1,159 2,983 37.30 23.39
12,639 214.45
Import-Competing Sectors
With With With Lowest Medium Highest Protection Protection Protection
~~
373 1,565 1,794 721 2,250 7,780
28.59 49.22 32.77 17.83 37.63 10.15
10,139 10,673 19,746 85.46 185.14 468.54
Source: Author's computations as described in text.

224 MarkM.Pitt
Table 5.21 Fixed Capital Formation, 1972-73, and Height of Protection
Tradable Group
Exportables
Import-competing Excluding rubber milling (94).
Sectors with lowest protection
Sectors with medium protection Sectors with highest protection
Excluding cigarettes (65) Negative IVA sectors
Excluding fertilizer (84) and electrical machinery (109)
New Fixed Capital Formation per Unit of Domestic Value Added
2 5 0 .216 .310 .300 .I94 .303 .228 284 .498
Source: Biro Pusat Statistik, Statistik industri (1972, 1973). aNurnbers refer to input-output code.
protected and medium-protected sectors is not very striking. If the fer- tilizer (84) and electrical machinery ( 109) industries are excluded from least-protected groups, the rate of capital formation falls markedly. Rice milling predominates in the remaining figure. Most-protected in- dustries have a lower rate of capital formation than both least- and medium-protected industries. Since they are unable to export, growth in these industries is constrained by the size of the domestic market. Some of the largest industries in the group-cigarettes and motor vehicles, for example-also have new capital formation strictly controlled or pro- hibited by the government investment board.
Industries with negative IVA are found to have the highest rate of fixed capital formation among all groups investigated. Since negative IVA implies that domestic production is absolutely inefficient, the indi- cation is that the trade regime is providing above-average incentives to the least desirable activities.
5.6 Summary and Conclusions
In examining the factor requirements of bundles of manufactured tradables containing one million rupiahs of DVA, it was found that HOS exportable manufacturing industries required twice as much labor as importable industries but substantially less capital and skills. When trade was partitioned between developed and less developed countries for origins and destinations, it was not possible to conclude definitively that Indonesian exportable production destined for DCs had a lower capital-labor ratio than that bound for LDCs, although the evidence

225 Alternative Trade Strategies and Employment in Indonesia
pointed in that direction. The reason for the ambiguity hinged on inade- quate proxies for capital and the question of how trade with Hong Kong and Singapore should be treated. However, in every case skill-labor ratios were lower for exports to DCs than to LDCs. Second, my results did indicate that the capital-labor ratio of imports from developed coun- tries exceeded that of imports from less developed countries.
In comparing the factor requirements of baskets of tradables contain- ing equal quantities of value added at international prices, it was found that Indonesia was clearly a net exporter of labor and net importer of capital and skills in her trade in HOS manufactures; when trade was partitioned between developed and less developed countries, the above result still held in every case.
The results above hold irrespective of whether factor requirements are measured by direct or direct plus home goods indirect coefficients.
An examination of the height of protection and factor proportions found that when importable activities were partitioned into three groups based on their effective protection, capital/labor ratios were higher (by two of three measures) the greater the effective protection afforded the group. The most-protected industries used only 61 percent of the labor of all least-protected industries, though industries with medium protec- tion used more labor than least-protected industries.
Eleven out of fifteen HOS manufacturing sectors that had negative rates of protection were exportable sectors, and on average HOS ex- portables received negative effective protection. On the other hand, substantial protection was afforded importable industries. Indeed, eight HOS importable industries were found to have negative international value added. Noncompeting importables had low ERPs. Thus the in- centive system was definitely biased against exports and favored import- able industries.
An important result of this research is an estimate of the employment trade-off implicit in Indonesia’s choice of trade strategy. It has been noted that, since the conclusion of a period of dramatic trade liberaliza- tion in 1971, the Indonesian trade regime has tended to become more restrictive. In particular, levels of protection seem to have increased recently in response to emerging excess capacity in certain industries. The employment cost of following an import substitution strategy in Indonesia is severe. One million dollars of increased value added from manufactured exports generates 57 percent more employment than an equivalent reduction in competing imports. If manufactured exports were to increase by 15 percent per year, a rate of growth that should be readily attainable,33 the employment necessary to produce these exports would rise from its 1971 level of 374,000 full-time equivalents to almost 1.7 million by 1981. This increase would be enough to employ about 1 1 percent of the projected growth in the labor force over that period.

Appendix
Table 5.A.1 Protection in Indonesian Manufacturing, 1971
Input- output Code Sector
Nominal Protection Effective Protection Trade (pd/pw - 1) x 100 (DVA/ZVA - 1) x 100 Classification
45 46 47 48 49
50 51 52 53 54
55 56 57 58 59
60 61 62 63 64
Canning and preserving of meat Dairy products Canning and preserving of fruits and vegetables Canning and preserving of fish and other seafoods Coconut oil and cooking oil
Vegetable and animal oils and fats Rice milling, cleaning, and polishing Wheat flour and other grain mill products Dried cassava and tapioca flour Bread and bakery products
Noodles, macaroni, and similar products Sugar refining Cocoa, chocolate, and sugar confectionery Coffee grinding Tea processing
Soybean products Other food products n.e.c. Alcoholic beverages Soft drinks and carbonated water Processed tobacco
5.0% 74.0 80.0 0
- 10.0
- 10.0 -13.0 - 18.0 - 10.0
89.1
0 26.0 29.8
- 15.0 0
0 10.9 38.1 67.0
- 10.0
50.0% Neg. IVA 5,400.0
1 .o 67.8
- 12.3 - 14.7 471.8 - 19.0 Neg. IVA
35.4 52.7
154.3
0.4
24.9 35.8 92.6
1,172.7
-18.7
-27.0
HOS-MC HOS-MC HOS-MC HOS-X HOS-X
HOS-X HOS-MC HOS-MC HOS-X HOS-MC
HOS-MC HOS-MC HOS-MC HOS-X HOS-X
HOS-MC HOS-MC HOS-MC HOS-MC HOS-X

Table 5.A.l-continued
hput- output Code Sector
Nominal Protection Effective Protection Trade (pd/pw - 1) x 100 (DVA/IVA - 1) x 100 Classification
65 66 67 68 69
70 71 72 73 74
75 76 77 78 79
80 81 82 83 84
85 86 87
Cigarettes Spinning industries Weaving industries Textile bleaching, printing, dyeing, and finishing, excluding batik Batik industries
Knitting industries Made-up textile goods, excluding wearing apparel Wearing apparel, excluding footwear Carpets, rugs, ropes, and other Tanneries and leather finishing
Leather products, excluding footwear industries Footwear of leather Sawmills, planing, and other wood processing Wood and cork products Furniture and fixtures, excluding those primarily of metal
Pulp, paper, and cardboard Paper products Printing, publishing, and allied industries Basic industrial chemicals, excluding fertilizers Fertilizers and pesticides
Paints, varnishes, and lacquers Drugs and medicines Soap and cleaning preparations
81.7 - 7.6
44.3 10.0 0
75.0 78.3 55.3 34.9 0
0 63.4 0 0
32.2
30.4 44.1 25.0
8.1 0
65.0 37.4 41.3
555.8 134.3
Neg. IVA 22.2
-37.9
Neg. IVA Neg. IVA
198.6 Neg. IVA - 4.4
- 9.6 180.8
.5 - 1.9 353.3
67.0 72.2 42.1 18.6
- 8.9
297.4 107.2 701.0
HOS-MC HOS-MC HOS-MC HOS-MC HOS-X
HOSMC HOS-MC HOS-MC HOS-MC HOS-X
HOS-X HOS-MC HOS-X HOS-X HOS-MC
HOS-MC HOS-MC HOS-MC HOS-NC HOS-MC
HOS-MC HOS-MC HOS-MC
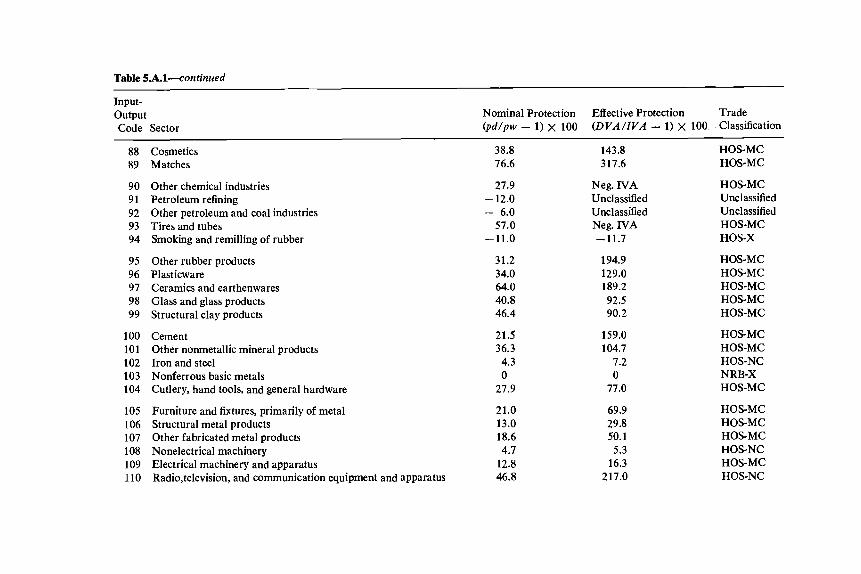
Table 5.A.l-continued
Input- output Code Sector
Nominal Protection Effective Protection Trade (pd/pw - 1) x 100 (DVA/ lVA - 1) x 100 Classification
~~~~~
88 89
90 91 92 93 94
95 96 97 98 99
100 101 102 103 104
105 106 107 108 109 110
Cosmetics Matches
Other chemical industries Petroleum refining Other petroleum and coal industries Tires and tubes Smoking and remilling of rubber
Other rubber products Plasticware Ceramics and earthenwares Glass and glass products Structural clay products
Cement Other nonmetallic mineral products Iron and steel Nonferrous basic metals Cutlery, hand tools, and general hardware
Furniture and fixtures, primarily of metal Structural metal products Other fabricated metal products Nonelectrical machinery Electrical machinery and apparatus Radio,television, and communication equipment and apparatus
38.8 76.6
27.9 - 12.0 - 6.0
57.0 -11.0
31.2 34.0 64.0 40.8 46.4
21.5 36.3 4.3 0
27.9
21.0 13.0 18.6 4.7
12.8 46.8
143.8 317.6
Neg. IVA Unclassified Unclassified Neg. N A -11.7
194.9 129.0 189.2 92.5 90.2
159.0 104.7
7.2 0
11.0
69.9 29.8 50.1 5.3
16.3 217.0
HOS-MC HOS-MC
HOS-MC Unclassified Unclassified HOS-MC HOS-X
HOS-MC HOS-MC HOS-MC HOS-MC HOS-MC
HOS-MC HOS-MC HOS-NC NRB-X HOS-MC
HOS-MC HOS-MC HOS-MC HOS-NC HOS-MC HOS-NC

Table S.A.1-continued
Input- output Nominal Protection Effective Protection Trade Code Sector ( p d / p w - 1) x loo ( D V A / Z Y A - 1) x 100 Classification
11 1 Electrical appliances and housewares 44.8 96.4 HOS-NC 112 Accumulator and dry battery industries 47.0 193.1 HOS-MC 113 Other electrical apparatus and supplies and repairing 12.7 10.3 HOS-NC 114 Ship and boat building and repairing 4.7 1.5 HOS-MC
115 Railroad equipment .2 - 3.5 HOS-NC 116 Motor vehicles 110.0 525.7 HOS-MC 117 Motorcycles, bicycles, and other vehicles 55.8 204.3 HOS-MC
119 Aircraft 9.6 - 1.9 HOS-NC
120 Professional and scientific equipment 8.3 18.4 HOS-NC 121 Photographic and optical goods 13.8 16.1 HOS-NC 122 Watches and clocks 59.1 Nonproduced HOS-NC 123 Jewelry and related articles 21.5 101.2 HOS-MC 124 Musical instruments 41.0 151.1 HOS-NC
125 Sporting and athletic goods 48.4 419.9 HOS-MC 126 Other manufacturing industries 0 -13.3 HOS-X 172 Kretek (clove cigarettes) 0 -23.1 HOS-X 173 Other nonproduced manufacturing 38.0 Nonproduced HOS-NC
118 Repairing of motorized and nonrnotorized vehicles Home good Home good Home good
Note : HOS-MC = Heckscher-Ohlin-Samuelson import-competing tradable. HOS-NC = Heckscher-Ohlin-Samuelson noncompeting importable. HOS-X = Heckscher-Ohlin-Samuelson exportable. NRB-X = Natural resource based exportable.

Table 5.A.2 Labor Reqairements, Trade Pattern, and Wages in Indonesian Manufacturing, 1971
Labor Requirements (Man-Days per Million
Rupiahs of DVA) Wages Tradeb with Tradeb per DCs with
Industry Direct plus Man-Day (Millions DCs Codea Direct Indirect (Rupiahs) of Rupiahs) ("lo 1
Exporiables 48 49 50 53 58
59 64 69 74 75
77 78 94
126 172
Imporiables 45 46 47 51 52
54 55 56 57 60
61 62 63 65 66
67 68 70 71 72
73 76
1,335 792 600
2,462 3,876
3,715 4,057 3,261
940 2,161
1,023 5,000 2,300 2,235
715
514 128
1,615 1,150
104
2,066 2,688 1,571
626 3,253
1,747 156 245
52 304
870 825
2,105 1,358 1,990
1,546 845
1,256 788 602
2,149 3,212
4,008 3,624 2,920
919 2,028
999 4,33 1 2,119 2,109
708
516 178
1,510 1,123
243
2,150 2,606 1,556
627 3,085
1,631 235 294 104 3 75
847 792
1,910 1,334 1,95 1
1,440 840
124 360 500 142 220
135 91
160 295 195
415 125 270 160 184
260 73 1 296 259 768
235 210 194 294 142
196 1,086
609 1,179
575
259 29 1 162 213 346
253 295
667 4,713
19,633 5,861
20,496
1 1,227 5,810
392 2,086
24
69 1 357
98,263 2,179
4
180 8,147
214 20,083 4,782
295 0
1,317 171 948
1,490 1,004
268 48
8,712
14,915 0
324 1,070
960
2,670 134
98 100 98
100 95
99 98 91 93
100
95 83 96 94
100
80 99 38 69
100
83 0
15 62 95
97 91 89 96 49
75 0
81 82 79
56 89

Table 5 . A . k o n t i n u e d
Labor Requirements (Man-Days per Million
Rupiahs of DVA) wages Tradeb with Tradeb per DCs with
Industry Direct plus Man-Day (Millions DCs Codea Direct Indirect (Rupiahs) of Rupiahs) (% )
79 80 81
82 84 85 86 87
88 89 90 93 95
96 97 98 99
100
101 104 105 106 107
109 112 114 116 117 123 125
3,894 290 178
1,406 116 517 243 468
504 2,566
806 241
1,067
1,902 452 650
3,240 133
2,840 1,149 1,200
170 1,115
132 526 488 440 134
3,000 1,546
3,669 313 196
1,362 209 3 19 315 475
522 2,433
778 297
1,045
1,752 799
1,064 3,139
833
2,817 1,108 1,145
20 1 1,092
208 537 491 457 157
2,796 1,429
225 698 994
326 943 537 390 570
69 1 157 28 1 713 180
200 56 1 340 160 920
195 244 319 56 1 329
910 445
1,016 822 492 160 210
227 1 1,549
741
12,984 13,824
6,556 73 1
1,599 4
6,122 3,485 1,802
3,045 1,379 2,860
857 5,355
1,298 2,252 1,657 8,866
11,835
23,014 1,892
606 65,016 7,916
459 257
*
76 79 87
97 99
100 92 78
82 83 96 97 96
89 61 72 92 66
98 87 94 99 89
95 64 98 99 76
100 97
Source: Pitt 1977. *Less than 0.5 million rupiahs. S e e table 5.A.1 for name of each industry. bTrade refers to exports for exportables and imports for importables.
Notes 1. For a complete review of Indonesian economic development, see Booth and
McCawley ( 1980) and the “Survey of Recent Developments” found in each issue of the Bulletin of Indonesian Economic Studies.
2. The Jakarta cost-of-living index is presented in table 5.10.

232 MarkM.Pitt
3. Determining the value of Indonesia’s manufactured exports is complicated by the probkm of defining a “manufactured” export and by the problem of re- export. A recent analysis by Arndt (1977) of the Indonesian trade minister’s claim that 1976 industrial exports totaled $220 million is an enlightening exam- ple. After eliminating processed goods such as sawn timber, vegetable oils, and crumb rubber, Arndt noted that much of the SITC classification “manufactured goods” was accounted for by tin, unwrought and in bars, and most of the $53.2 million of “machinery and transportation equipment” consisted of reexport. The items that he claims can plausibly be considered manufactured exports totaled only $9.6 million out of $2.4 billion in nonoil exports in 1976.
4. The data also indicate that females accounted for most of the increase in manufacturing employment over this period.
5. There are some serious pitfalls in comparing Indonesian census data over time. Gavin Jones (1978) provides a number of alternative measures of employ- ment growth by making various corrections to the census data.
6. This phenomenon was first examined by Papanek (1974). 7. The data suffer from a number of weaknesses. First, average manufacturing
wages may have changed because the commodity composition of manufacturing changed somewhat over this period. Second, because of the highly variable rates of capacity utilization over the period, the data may not represent “payment per year of labor services,” since employees may have worked part time. The problem of payment in kind does not appear important because the data supposedly include such payment valued at market prices. The problem of manufacturing’s changing commodity mix was partially resolved by calculating real wages for one manu- facturing subsector (textiles). As a whole, the textile real wage demonstrates the same downward slide as manufacturing except for a larger decline in textile wages in 1965-67. This drop may represent the extremely low levels of capacity utiliza- tion of those years.
8. This is also true for a time series on household servant wages in Jakarta. Papanek (1974, p. 12) notes that real wages on estates in 1938 were probably 15 percent higher than in any subsequent year.
9. However, aid foreign exchange (Devisa Kredit) continued to receive a special rate of Rp 326 until December 1970.
10. The price-level deflator is the cost-of-living index for a government worker in Jakarta linked with the sixty-two-item Jakarta cost-of-living index.
11. The ratio of the black-market rate to the EER, may not be a good indicator of the EER,’s overvaluation for at least two reasons. For one thing, pressure on the black-market rate may come from a desire to export capital abroad when it is legally prohibited. In the case of Indonesia, the leaps in the black-market rate in late 1959 and early 1960 were in part due to severe government actions against Chinese entrepreneurs, which resulted in a surge of Indo-Chinese capital out of the country. Second, the black-market rate reflects exchange restrictions not only on exports but also on imports. Given an EER for exports, the black-market rate would be higher the greater the restrictions on imports.
12. A theory of smuggling that explains the simultaneous existence of legal trade, smuggling, and price disparity is found in Pitt (1978). The theory pre- sented there considers legal trade and smuggling as activities carried out by the same firms. A large share of smuggling takes the form of misinvoiced, misgraded, and misweighed legal trade. The greater the legal export, the easier it is to hide smuggling from enforcement agencies and therefore the less costly smuggling will be. Thus legal trade can be viewed as an input into the smuggling activity. Price
233 Alternative Trade Strategies and Employment in Indonesia
disparity exists because firms will bid the price of the smuggled commodity above its legal trade return as long as profit can be made in combined smuggling and legal trade.
13. Lee and Pitt (1978) found that new weaving firms in Indonesia are much more capital-intensive than older firms. The newest quintile of firms in their sample had a capital/labor ratio two and one-half times as great as the oldest quintile of firms and 31 percent greater than average.
14. The table also serves as the basis for the sectoral disaggregation of the employment calculations that follow. It should be noted that the 171-sector input-output table for Indonesia used in this research is not identical to that pub- lished by the Biro Pusat Statistik (1976). In the published 175-sector table, small- scale agriculture processing activities are considered separate sectors or are ag- gregated into the NRB agricultural activity.
15. Had the data been available, price comparisons would have been used to check nominal protection estimates in all sectors.
16. Large quantities of cloves ($30.4 million in 1971) are imported for use in the kretek (clove cigarette) industry.
17. MPO is the acronym for menghitung pajak orang-lain, literally, “to count the tax of another person.” The name is derived from the fact that the seller of a taxed commodity usually withholds the tax on behalf of the purchaser.
18. Richard and Peggy Musgrave, in an unpublished memorandum, provide the following analysis: “Assume that for a firm the only cost is the price of merchandise purchased. The profits tax T equals:
where P is profits, t the profit tax rate, and Z the MPO credit claimed. Further- more, assume that profits are estimated by a margin m on sales S, so
and that sales are determined as a markup u on cost C, so
Cost can be presumptively determined on the basis of 2, so that
where g is the MPO tax rate. Thus, substituting and solving for T , one obtains
T = t P - Z
P = mS,
S = ( l + u ) C .
c = z/g
and since - 7
I m ( l + “8’ - m, - u x - IM then T = t
1 - m - When g = .02, the term in the brackets is positive when rn exceeds 1.96 percent. Since rn would typically be above that, the tax increases with Z and the firm would decrease its tax liability by underreporting Z its MPO credit.”
19. The special exchange rates for cotton and weaving yarn have been adjusted since 1970 as follows: Beginning Raw Cotton Exchange Exchange Rate of General Date Rate per U S . $1 Foreign Exchange per U.S. $1
3 July 1969 Rp 170 23 Feb. 1971 Rp 215 18 Jan. 1972 Rp 271
Rp 326 Rp 378 Rp 415

234 Mark M. Pitt
Weaving Yarn Ex-PL 480 Beginning Exchange Rate Exchange Rate of General Date per U.S. $ I Foreign Exchange per U.S. $1 5 July 1969 Rp 125 Rp 326 3 May 1972 Rp 150 Rp 415
20. The rebate schedule was as follows: Country of Origin Rebate per US. $ I United States and Canada Rp 60 Netherlands, West Germany, Rp 40 France, Belgium, and the United Kingdom Australia and New Zealand Rp 30 Untied aid foreign exchange Rp 30 from United States Japan Rp 20
21. These categories accounted for nearly 20 percent of imports (excluding imports of oil companies) in fiscal year 1971/72.
22. This does not imply that underinvoicing does not occur, only that it does not seem to bias the estimates. Special costs associated with illegal transactions, such as side payments to customs officials, may be offsetting the benefits of undervalu- ation.
23. Textile bleaching, printing, dyeing, and finishing except batik (68), a sector for which there is no trade attributed by the 1971 input-output table, is nonetheless considered a tradable. The absence of any reported trade in the sector is attributable to the inflexibility of the trade statistics. All textiles, printed and dyed or not, enter as weaving sector imports with no attribution of the printing and dyeing activity to that sector. The sector is considered import-competing be- cause it is protected both by higher tariffs on the import of dyed and printed textiles relative to undyed and unprinted textiles and because there are prohibi- tions on the import of certain varieties of textiles only if they are printed.
24. Examination of trade data for years adjacent to 1971 indicates that railroad and aircraft equipment imports in 1971 were less than average and that those sectors should be classified as noncompeting imports rather than import-competing. Fertilizer had a 1971 value of T that was borderline, 0.81, and in light of rapidly growing productive capacity in this sector, fertilizer was classified as import- competing.
25. Traditionally, a substantial share of of crudely milled Indonesian rubber has been exported to Singapore for remilling and reexport. However, prohibitions on the export of lower grades of rubber, in effect in 1971, diverted most rubber ex- ports through the smoking and remilling sector.
26. It is not clear to which trade classification petroleum refining would belong. Most exports are refined by-products for which sufficient market does not exist in Indonesia, while imports consist of more basic products such as kerosene. According to Johnson (1977, p. 43) , most of the refined exports consist of low- sulfur waxy residue. With trade in petroleum products under the control of the state petroleum monopoly, PERTAMINA, it may be that, under an efficient pat- tern of resource allocation, the value of T might be positive rather than mar- ginally negative.
27. The survey is the Survey Perusahaan lndustri 1973. Man-days were calcu- lated in the following manner: firms reported the number of days they were in operation during each quarter and the number of employees at the middle of each

235 Alternative Trade Strategies and Employment in Indonesia
quarter, and the two figures were multiplied and summed over the four quarters. The detailed employment data were coded from firm questionnaires for this re- search. Aggregated data from the survey were published as Biro Pusat Statistik Statistik Zndustri 1973 (2 vols.), Jakarta 1975.
28. Because part-time operatives may be more prevalent than part-time white- collar employees, the first assumption may not be strictly true and operative man- days may be overestimated, but not consequentially.
29. These weights are chosen because it is felt that increments in manufactur- ing value added would be more in proportion to the sectoral composition of con- sumption than production. The factor requirements calculations therefore repre- sent requirements for incremental units of domestic value added.
30. Even if trade via Singapore and Hong Kong were not of an entrepBt nature, it would not be a misspecification to label them developed countries, since only the correct ranking of countries by factor endowments is of concern. Classified as LDCs, Singapore and Hong Kong would likely be the best capital-endowed among them; if classified as DCs they would be among the least well-endowed. Since Indonesia is near the bottom of a capital-intensity ranking, its position is of no importance here. Therefore Singapore and Hong Kong can be considered devel- oped countries for both import and export trade. Any significant change in the results for imports that would come about by considering them as LDCs will be noted.
31 . Although this difference is small, the variance of these sectoral labor coeffi- cients is also small.
32. This might possibly be explained by the presence of large economic profits earned by firms in these oligopolistic sectors.
33. A IS percent rate of growth of manufactured exports is small relative to the rate of growth projected by “The Study of Long-Term Growth Perspectives” supervised by the Indonesian minister of state for research and reported in Sumitro Djojohadikusumo (1977, p. 26) . They estimated a growth rate of manu- factured exports of 39.2 percent per annum over the period 1974-80 and 25.2 percent over 1980-85. Since they define manufactured exports much more nar- rowly than here, their projections are not applicable.
References
Arndt, H. W. 1977. Survey of recent developments. Bulletin of Zndo- nesian Economic Studies 13 (3) : 1-33.
Arndt, H. W., and Sundrum, R. M. 1975. Wage problems and policies in Indonesia. International Labour Review 112 ( 5 ) : 369-87.
Bank Indonesia. Bank Indonesia report. Annual. Jakarta. . Indonesian financial statistics. Monthly. Jakarta. . Report for the financial year. Annual. Jakarta.
Biro Pusat Statistik (BPS). 1963. Sensus penduduk 1961 (Series S, P. 11). Jakarta.
. 1967. Angkatan kerdja penduduk Indonesia (Ringkasan) (Sur- vey Social Ekonomi Nasional Tahap Kedua Laporan no. 2A) . Jakarta.

236 Mark M. Pitt
. 1969. Almanak Indonesia Z968. 2 vols. Jakarta: BPS.
. 1974. Survey industri kecil dan kerajinan rumah tangga,
. 1975. Penduduk Indonesia (series D) . Jakarta.
. 1976. Tabel input-output Indonesia. 2 vols. Jakarta: BPS.
. 1976-77. Industri/kerajinan rumah tangga (Sensus industri
. N.d. Impor: Menurut jenis barang dan negeri asal. Annual; title
. N.d. Ekspor: Menurut jenis barang, negeri asal dan pelabuhan
. N.d. Pendapatan nasional Indonesia. Serial; irregular. Jakarta:
. N.d. Statistik industri. Annual since 1970. Jakarta: BPS.
. N.d. Statistical pocketbook of Indonesia. Annual. Jakarta: BPS. Booth, Anne, and McCawley, Peter. 1980. The Indonesian economy
during the Soeharto era. Kuala Lumpur: Oxford University Press. Business News (also known as Business News Analisa) . Newspaper.
Jakarta. Cnossen, Sijbren. 1973. The Indonesian sales tax. Deventer, Nether-
lands: Kluwer. Commodity yearbook. Annual New York: Commodity Research Bureau,
Inc. Cooper, Richard N. 1974. Tariffs and smuggling in Indonesia. In Illegal
transactions in international trade, ed. Jagdish Bhagwati. Amsterdam: North-Holland.
Grenville, S. A. 1977. Survey of recent developments. Bulletin of Zn- donesian Economic Studies 13 ( 1 ) : 1-32.
Johnson, Mark. 1977. Oil I: Recent developments. Bulletin of Indo- nesian Economic Studies 13 (3 ) : 34-48.
Jones, Gavin. 1978. Sectoral employment-output coefficients in Indo- nesia since 196 1. Bulletin of Indonesian Economic Studies 14 ( 1 ) : 80- 92.
Lee, Lung-Fei, and Pitt, Mark M. 1978. Pooling cross section and time series data in the estimation of stochastic frontier production function models. Discussion paper no. 78-98, Center for Economic Research, Department of Economics, University of Minnesota.
McCawley, Peter, and Manning, Chris. 1976. Survey of recent develop- ments. Bulletin of Zndonesian Economic Studies 13 (3) : 1.
Nugroho. 1967. Indonesia facts and figures. Jakarta. Papanek, Gustav. 1974. Real wages: The effect of growth and inflation
on workers income, income distribution and labor costs. Typescript dated 10 December, n.p.
Januari-Aprill973. Jakarta: BPS.
1974-75). 4 vols. Jakarta: BPS.
varies. Jakarta: BPS.
ekspor. Annual; title varies. Jakarta: BPS.
BPS.
Pitt, Mark M. 1977. Foreign trade regime. In manuscript.

237 Alternative Trade Strategies and Employment in Indonesia
. 1978. A theory of smuggling with application to Indonesia. Mimeographed.
Siahaan, Luckman. 1969. Export problems of Indonesia: A n evaluation of the October 3, I966 regulations. Jakarta: National Institute of So- cial and Economic Research (LEKNAS) , Indonesian Institute of Science (LIPI) .
Simkin, C. G. F. 1970. Survey of recent developments. Bulletin of Zn- donesian Economic Studies 6( 1 ) : 1-16.
Speare, Alden, Jr. 1978. Alternative population distribution policies. Bulletin of Indonesian Economic Studies 14( 1 ) : 93-106.
Suhadi Mangkusuwondo. 1967. Industrialization eflorts in Indonesia. The role of agriculture and foreign trade in the development of the industrial sector. Ph.D. diss., University of California, Berkeley.
Sumitro Djojohadikusumo. 1977. Strategic variables in Indonesia’s long- term growth. Ekonomi dun Keuangan Indonesia 25( 1) : 17-33.
Sundrum, R. M. 1975. Manufacturing employment 1969-71. Bulletin of Indonesian Economic Studies 12 ( 1 ) : 58-65.
Thomas, Kenneth. 1966. “Price disparity” in export trade. Bulletin of Indonesian Economic Studies 2(4) : 101-2.
United States Department of Commerce, Bureau of Census. 1976. An- nual survey of manufactures 1973. Washington, D.C.: U.S. Govern- ment Printing Office.
Wurta Perdagangan. Monthly magazine. Jakarta.

This Page Intentionally Left Blank


