PDC ENERGY, INC.
174
UNITED STATES SECURITIES AND EXCHANGE COMMISSION Washington, D.C. 20549 FORM 10-K ☒ ANNUAL REPORT PURSUANT TO SECTION 13 OR 15(d) OF THE SECURITIES EXCHANGE ACT OF 1934 For the fiscal year ended December 31, 2019 or ☐ TRANSITION REPORT PURSUANT TO SECTION 13 OR 15(d) OF THE SECURITIES EXCHANGE ACT OF 1934 For the transition period from __________ to _________ Commission File Number 001-37419 PDC ENERGY, INC. (Exact name of registrant as specified in its charter) Delaware 95-2636730 (State of incorporation) (I.R.S. Employer Identification No.) 1775 Sherman Street, Suite 3000 Denver, Colorado 80203 (Address of principal executive offices) (Zip code) Registrant's telephone number, including area code: (303) 860-5800 Securities registered pursuant to Section 12(b) of the Act: Title of each class Ticker Symbol Name of each exchange on which registered Common Stock, par value $0.01 per share PDCE NASDAQ Global Select Market Securities registered pursuant to Section 12(g) of the Act: None Indicate by check mark if the registrant is a well-known seasoned issuer, as defined in Rule 405 of the Securities Act. Yes T No £ Indicate by check mark if the registrant is not required to file reports pursuant to Section 13 or Section 15(d) of the Act. Yes £ No T Indicate by check mark whether the registrant (1) has filed all reports required to be filed by Section 13 or 15(d) of the Securities Exchange Act of 1934 during the preceding 12 months (or for such shorter period that the registrant was required to file such reports) and (2) has been subject to such filing requirements for the past 90 days. Yes T No £ Indicate by check mark whether the registrant has submitted electronically every Interactive Data File required to be submitted pursuant to Rule 405 of Regulation S-T (§232.405 of this chapter) during the preceding 12 months (or for such shorter period that the registrant was required to submit such files). Yes T No £ Indicate by check mark whether the registrant is a large accelerated filer, an accelerated filer, a non-accelerated filer, a smaller reporting company or an emerging growth company. See definitions of "large accelerated filer," "accelerated filer," "smaller reporting company" and "emerging growth company" in Rule 12b-2 of the Exchange Act. Large Accelerated Filer ☒ Accelerated filer ☐ Non-accelerated filer ☐ Smaller reporting company ☐ Emerging growth company ☐ If an emerging growth company, indicate by check mark if the registrant has elected not to use the extended transition period for complying with any new or revised financial accounting standards provided pursuant to Section 13(a) of the Exchange Act. £ Indicate by check mark whether the registrant is a shell company (as defined in Rule 12b-2 of the Act). Yes ☐ No T The aggregate market value of our common stock held by non-affiliates on June 30, 2019 was $2.3 billion (based on the closing price of $36.06 per share as of the last business day of the fiscal quarter ending June 30, 2019). As of February 18, 2020, there were 100,121,539 shares of our common stock outstanding. DOCUMENTS INCORPORATED BY REFERENCE We hereby incorporate by reference into this document the information required by Part III of this Form, which will appear in our definitive proxy statement filed pursuant to Regulation 14A for our 2020 Annual Meeting of Stockholders.
Transcript of PDC ENERGY, INC.

UNITED STATESSECURITIES AND EXCHANGE COMMISSION
Washington, D.C. 20549
FORM 10-K
☒ ANNUAL REPORT PURSUANT TO SECTION 13 OR 15(d) OF THE SECURITIES EXCHANGE ACT OF 1934
For the fiscal year ended December 31, 2019
or
☐ TRANSITION REPORT PURSUANT TO SECTION 13 OR 15(d) OF THE SECURITIES EXCHANGE ACT OF 1934
For the transition period from __________ to _________
Commission File Number 001-37419
PDC ENERGY, INC.(Exact name of registrant as specified in its charter)
Delaware 95-2636730(State of incorporation) (I.R.S. Employer Identification No.)
1775 Sherman Street, Suite 3000Denver, Colorado 80203
(Address of principal executive offices) (Zip code)
Registrant's telephone number, including area code: (303) 860-5800
Securities registered pursuant to Section 12(b) of the Act:
Title of each class Ticker Symbol Name of each exchange on which registered
Common Stock, par value $0.01 per share PDCE NASDAQ Global Select Market
Securities registered pursuant to Section 12(g) of the Act: None
Indicate by check mark if the registrant is a well-known seasoned issuer, as defined in Rule 405 of the Securities Act. Yes T No £
Indicate by check mark if the registrant is not required to file reports pursuant to Section 13 or Section 15(d) of the Act. Yes £ No T
Indicate by check mark whether the registrant (1) has filed all reports required to be filed by Section 13 or 15(d) of the Securities Exchange Act of 1934 during the preceding 12 months (or for such shorter period that the registrant was required to file such reports)and (2) has been subject to such filing requirements for the past 90 days. Yes T No £
Indicate by check mark whether the registrant has submitted electronically every Interactive Data File required to be submitted pursuant to Rule 405 of Regulation S-T (§232.405 of this chapter) during the preceding 12 months (or for such shorter period that theregistrant was required to submit such files). Yes T No £
Indicate by check mark whether the registrant is a large accelerated filer, an accelerated filer, a non-accelerated filer, a smaller reporting company or an emerging growth company. See definitions of "large accelerated filer," "accelerated filer," "smaller reportingcompany" and "emerging growth company" in Rule 12b-2 of the Exchange Act.
Large Accelerated Filer ☒ Accelerated filer ☐
Non-accelerated filer ☐ Smaller reporting company ☐
Emerging growth company ☐
If an emerging growth company, indicate by check mark if the registrant has elected not to use the extended transition period for complying with any new or revised financial accounting standards provided pursuant to Section 13(a) of the Exchange Act. £
Indicate by check mark whether the registrant is a shell company (as defined in Rule 12b-2 of the Act). Yes ☐ No T
The aggregate market value of our common stock held by non-affiliates on June 30, 2019 was $2.3 billion (based on the closing price of $36.06 per share as of the last business day of the fiscal quarter ending June 30, 2019).
As of February 18, 2020, there were 100,121,539 shares of our common stock outstanding.
DOCUMENTS INCORPORATED BY REFERENCE
We hereby incorporate by reference into this document the information required by Part III of this Form, which will appear in our definitive proxy statement filed pursuant to Regulation 14A for our 2020 Annual Meeting of Stockholders.

PDC ENERGY, INC.2019 ANNUAL REPORT ON FORM 10-K
TABLE OF CONTENTS
PART I Page
Items 1. and 2. Business and Properties 3
Item 1A. Risk Factors 20
Item 1B. Unresolved Staff Comments 37
Item 3. Legal Proceedings 37
Item 4. Mine Safety Disclosures 37
PART II
Item 5. Market for the Registrant's Common Equity, Related Stockholder Matters and Issuer Purchases of Equity Securities 38
Item 6. Selected Financial Data 40
Item 7. Management's Discussion and Analysis of Financial Condition and Results of Operations 41
Item 7A. Quantitative and Qualitative Disclosures About Market Risk 64
Item 8. Financial Statements and Supplementary Data 66
Item 9. Changes in and Disagreements with Accountants on Accounting and Financial Disclosure 125
Item 9A. Controls and Procedures 125
Item 9B. Other Information 125
PART III
Item 10. Directors, Executive Officers and Corporate Governance 126
Item 11. Executive Compensation 126
Item 12. Security Ownership of Certain Beneficial Owners and Management and Related Stockholder Matters 126
Item 13. Certain Relationships and Related Transactions and Director Independence 126
Item 14. Principal Accounting Fees and Services 126
PART IV
Item15. Exhibits, Financial Statement Schedules 126
Item 16. Form 10-K Summary 112
Signatures 130
Glossary of Units of Measurements and Industry Terms 131

PART I
REFERENCES TO THE REGISTRANT
Unless the context otherwise requires, references in this report to "PDC," the "Company," "we," "us," "our" or "ours" refer to the registrant, PDC Energy, Inc. and our wholly-owned subsidiaries consolidated for the purposes of ourfinancial statements. PDC Energy, Inc. is a Delaware corporation, having reincorporated from Nevada in 2015.
GLOSSARY OF UNITS OF MEASUREMENTS AND INDUSTRY TERMS
Units of measurements and industry terms are defined in the Glossary of Units of Measurements and Industry Terms, included at the end of this report.
SPECIAL NOTE REGARDING FORWARD-LOOKING STATEMENTS
This report contains forward-looking statements within the meaning of Section 27A of the Securities Act of 1933 ("Securities Act") and Section 21E of the Securities Exchange Act of 1934 ("Exchange Act") regarding ourbusiness, financial condition, results of operations and prospects. All statements other than statements of historical fact included in and incorporated by reference into this report are "forward-looking statements." Words such as expect,anticipate, intend, plan, believe, seek, estimate, schedule and similar expressions or variations of such words are intended to identify forward-looking statements herein. Forward-looking statements include, among other things, statementsregarding future: production, costs and cash flows; drilling locations, zones and growth opportunities; commodity prices and differentials; capital expenditures and projects, including the number of rigs employed; cash flows fromoperations relative to future capital investments; our stock repurchase program, which may be modified or discontinued at any time; potential additional payments from the sale of our midstream assets; financial ratios and compliance withcovenants in our revolving credit facility and other debt instruments; impacts of certain accounting and tax changes; timing and adequacy of infrastructure projects of our midstream providers and the related impact on our midstreamcapacity and related curtailments; fractionation capacity; impacts of Colorado political matters and expected timing of rulemakings; ability to meet our volume commitments to midstream providers; ability to obtain permits from theColorado Oil and Gas Conservation Commission ("COGCC") in a timely manner; ongoing compliance with our consent decree and expected timing of certain litigation; and reclassification of the Denver Metro/North Front Range NAAozone classification to serious.
The above statements are not the exclusive means of identifying forward-looking statements herein. Although forward-looking statements contained in this report reflect our good faith judgment, such statements can only be basedon facts and factors currently known to us. Forward-looking statements are always subject to risks and uncertainties, and become subject to greater levels of risk and uncertainty as they address matters further into the future. Throughoutthis report or accompanying materials, we may use the term “projection” or similar terms or expressions, or indicate that we have “modeled” certain future scenarios. We typically use these terms to indicate our current thoughts on possibleoutcomes relating to our business or the industry in periods beyond the current fiscal year. Because such statements relate to events or conditions further in the future, they are subject to increased levels of uncertainty.
Important factors that could cause actual results to differ materially from the forward-looking statements include, but are not limited to:
• changes in global production volumes and demand, including economic conditions that might impact demand and prices for products we produce;• volatility of commodity prices for crude oil, natural gas and natural gas liquids ("NGLs") and the risk of extended periods of depressed prices;• volatility and widening of differentials;• reductions in the borrowing base under our revolving credit facility;• impact of governmental policies and/or regulations, including changes in environmental and other laws, the interpretation and enforcement related to those laws and regulations, liabilities arising thereunder and the costs to
comply with those laws and regulations;• impact of recent regulatory developments in Colorado with respect to additional permit scrutiny;• declines in the value of our crude oil and natural gas properties resulting in impairments;• changes in estimates of proved reserves;• inaccuracy of estimated reserves and production rates;• potential for production decline rates from our wells being greater than expected;• timing and extent of our success in discovering, acquiring, developing and producing reserves;
1

• availability of sufficient pipeline, gathering and other transportation facilities and related infrastructure to process and transport our production and the impact of these facilities and regional capacity on the prices we receivefor our production;
• timing and receipt of necessary regulatory permits;• risks incidental to the drilling and operation of crude oil and natural gas wells;• difficulties in integrating our operations as a result of any significant acquisitions, including the merger with SRC Energy, Inc. ("SRC"), or acreage exchanges;• increases or changes in costs and expenses;• limitations in the availability of supplies, materials, contractors and services that may delay the drilling or completion of our wells;• potential losses of acreage due to lease expirations or otherwise;• future cash flows, liquidity and financial condition;• competition within the oil and gas industry;• availability and cost of capital;• our success in marketing crude oil, natural gas and NGLs;• effect of crude oil, natural gas and NGLs derivatives activities;• impact to our operations, personnel retention, strategy, stock price and expenses caused by the actions of activist shareholders;• impact of environmental events, governmental and other third-party responses to such events and our ability to insure adequately against such events;• cost of pending or future litigation;• effect that acquisitions we may pursue have on our capital requirements;• our ability to retain or attract senior management and key technical employees; and• success of strategic plans, expectations and objectives for our future operations.
Further, we urge you to carefully review and consider the cautionary statements and disclosures, specifically those under Item 1A, Risk Factors, made in this report and our other filings with the U.S. Securities and Exchange
Commission ("SEC") for further information on risks and uncertainties that could affect our business, financial condition, results of operations and cash flows. We caution you not to place undue reliance on forward-looking statements,which speak only as of the date of this report. We undertake no obligation to update any forward-looking statements in order to reflect any event or circumstance occurring after the date of this report or currently unknownfacts or conditions or the occurrence of unanticipated events. All forward-looking statements are qualified in their entirety by this cautionary statement.
2

ITEMS 1. AND 2. BUSINESS AND PROPERTIES
The Company
We are a domestic independent exploration and production company that acquires, explores and develops properties for the production of crude oil, natural gas and NGLs, with operations in the Wattenberg Field in Colorado andthe Delaware Basin in Texas. Our operations in the Wattenberg Field are focused in the horizontal Niobrara and Codell plays and our Delaware Basin operations are primarily focused in the Wolfcamp zones.
The following map presents the general locations of our development and production activities as of December 31, 2019:
The following table presents selected information regarding our results of operations for the periods presented:
Year Ended/As of
December 31, Percent Change
2019 2018 2019-2018
(production and reserves in MMBoe, dollars in millions) Wells:
Gross productive wells 2,649 2,876 (7.9)%
Net productive wells 2,101 2,284 (8.0)%
Horizontal percentage 48% 39% 23 %
Gross operated wells turned-in-line 135 165 (18.2)%
Net operated wells turned-in-line 125 151 (17.2)%
Production: Wattenberg Field 38.0 30.7 23.9 %
Delaware Basin 11.4 9.4 22.1 %
Utica Shale (1) — 0.1 *
Total 49.4 40.2 23.0 %
Reserves: Proved reserves 610.9 544.9 12.1 %
Proved developed reserves percentage 35% 33% 6 %
Standardized measure $ 3,310 $ 4,448 (25.6)%
PV-10 (2) $ 3,837 $ 5,321 (27.9)%
Liquidity $ 1,291.0 $ 1,268.9 1.7 %
Leverage ratio 1.4 1.4 — % (1) In March 2018, we completed the disposition of our Utica Shale properties.
(2) PV-10 is a non-U.S. GAAP financial measure. It is not intended to represent the current market value of our estimatedreserves. PV-10 should not be considered in isolation or as a substitute for the standardized measure reported inaccordance with U.S. GAAP, but rather should be considered in addition to the standardized measure. See Part II,Item 7, Management's Discussion and Analysis of Financial Condition and Results of Operations - Reconciliation ofNon-U.S. GAAP Financial Measures, for a definition of PV-10 and a reconciliation of our PV-10 value to thestandardized measure.
3

Acquisition In January 2020, we merged with SRC in a transaction valued at $1.7 billion, inclusive of SRC's net debt (the “SRC Acquisition”). We issued approximately 39 million shares of our common stock to SRC shareholders and holders
of SRC equity awards, reflecting the issuance of 0.158 of a share of our common stock in exchange for each outstanding share of SRC common stock and the cancellation of outstanding SRC equity awards pursuant to the mergeragreement that we entered into with SRC (the "Merger Agreement").
The following table presents selected information regarding our and SRC's operations as of and for the year ended December 31, 2019:
Year Ended/As of December 31, 2019
PDC SRC Combined
(production in MBoe, reserves in MMBoe and dollars in millions)
Wells: Gross productive wells 2,649 1,529 4,178
Net productive wells 2,101 958 3,059
Production: Crude oil (MBbls) 19,166 9,813 28,979
Natural gas (MMcf) 115,950 49,471 165,421
NGLs (MBbls) 10,923 4,526 15,449
Crude oil equivalent (MBoe) 49,414 22,584 71,998
Average Boe per day (Boe) 135,381 61,874 197,255
Crude oil production percentage 38.8% 43.5% 40.2%
Reserves: Proved reserves (1) 610.9 295.0 905.9
Proved developed reserves percentage 35% 42% 37%
Crude oil and condensate percentage 32% 27% 31%
(1) Estimated reserve information for SRC is based on assumed realized prices of $50.17 per Bbl of crude oil, $1.69 per Mcf of natural gasand $9.67 per Bbl of NGLs and SRC's development plan for the related properties. The estimates are not included in the Ryder ScottCompany, L.P. ("Ryder Scott") or Netherland, Sewell, & Associates, Inc. ("NSAI") reports for our properties described below in "Properties -Proved Reserves" and are subject to the risks and uncertainties described in "Risk Factors - Risks Relating to Our Business and Industry - Ourestimated reserves are based on many assumptions that may turn out to be inaccurate. Any material inaccuracies in these reserve estimates or
underlying assumptions may materially affect the quantities and present value of our reserves."
2020 Strategic Focus Our planned 2020 capital investments in crude oil and natural gas properties, which we expect to be between $1.0 billion and $1.1 billion, are focused on continued execution of our development plans in the Wattenberg Field,
including acreage received in the SRC Acquisition, and Delaware Basin. In allocating our planned expenditures, we consider, among other things, cost efficiencies, midstream capacities and netback pricing, expected future cash flows andrates of return, the political environment and our remaining drilling location inventory in order to best meet our short- and long-term corporate strategy. We are committed to our disciplined approach to managing our development plans.Should commodity pricing or the operating environment deteriorate, we may determine that an adjustment to our development plan is appropriate.
Based on our current production forecast for 2020 and assumed average New York Mercantile Exchange (“NYMEX”) prices of $52.50 per Bbl of crude oil and $2.00 per Mcf of natural gas and an assumed average composite priceof $11.00 per Bbl for NGLs, we expect 2020 adjusted cash flows from operations, a non-U.S. GAAP financial measure, to exceed our capital investments in crude oil and natural gas properties by approximately $250 million. Assumingconsistent realization percentages, we estimate that for every:
4

• $2.50 change in the NYMEX crude oil price from $52.50, our adjusted cash flows from operations would increase or decrease by approximately $30 million;• $0.25 change in the NYMEX natural gas price from $2.00, our adjusted cash flows from operations would increase or decrease by approximately $20 million; and• $1.00 change in the composite price for NGLs from $11.00, our adjusted cash flows from operations would increase or decrease by approximately $20 million.
We may revise our 2020 capital investment program during the year as a result of, among other things, changes in commodity prices and/or our internal long-term outlook for commodity prices, the cost of services for drilling andwell completion activities, requirements to hold acreage, drilling results, changes in our borrowing capacity, a significant change in cash flows, regulatory issues, availability of midstream infrastructure and services, requirements tomaintain continuous activity on leaseholds or acquisition and/or divestiture opportunities.
Long-Term Business Strategy and Key Strengths
Our long term business strategy focuses on creating shareholder value by delivering attractive returns from responsible development of our crude oil and natural gas properties, maintaining financial strength, generating sustainablecash flows from operations in excess of our capital investments in crude oil and natural gas properties and returning capital to shareholders. We seek to create long-term shareholder value through the following:
• Strong financial position. We maintain a disciplined financial strategy that focuses on strong liquidity, low leverage ratios and an active commodity derivative program to help mitigate a portion of the risk associated withcommodity price fluctuations. We believe that execution of this strategy will allow us to deliver strong corporate returns year-over-year, even through challenging commodity price environments. As of December 31, 2019, we hadtotal liquidity of $1.3 billion, a leverage ratio, as defined in our revolving line of credit facility agreement, of 1.4 and commodity derivative positions covering approximately 10.8 MMBbls and 3.2 MMBbls of crude oil productionfor 2020 and 2021, respectively. As of the same date, we had hedged approximately 4.0 Bcf of natural gas production for 2020.
• Focus on generating sustainable cash flows from operations in excess of capital investments. We are focused on generating multi-year sustainable cash flows from operations in excess of our capital investments throughmanaging capital spending and growth rates, adjusting the timing of completion of our inventory of drilled uncompleted wells ("DUCs"), utilizing commodity derivative instruments, focusing on margin improvement fromreductions in our cost structure and through increased capital efficiency from technological innovation.
• Return of capital to shareholders. We are focused on returning capital to shareholders through our ongoing share repurchase program and a focus on debt reduction. Through February 24, 2020, we have repurchased an aggregate5.3 million shares of our outstanding common stock for a total cost of $166.9 million. Through successful execution of our business plan, our projected cash flows are expected to position us to deliver on our commitment to returncapital to shareholders.
• Significant operational control in our core areas. We have, and expect to continue to have, a substantial degree of operational control over our properties. As a result of successfully executing our strategy of acquisitions andacreage trades in our core areas of operations, we have built multiple concentrated acreage positions with high working interests that we believe will allow us to enhance the value of our assets and replenish our drilling inventory.Including wells that we received in the SRC Acquisition, we currently operate approximately 78 percent of all the wells in which we have an interest. This operational control allows us to better manage our drilling, production,operating and administrative costs and to leverage our technical expertise in our core operating areas. Our leaseholds that are held by production further enhance our operational control by providing us with additional flexibility onthe timing of drilling of those locations.
• Project inventory in two premier crude oil, natural gas and NGL plays. We have a substantial multi-year inventory of high-quality horizontal drilling opportunities across two premier U.S. onshore basins: the Wattenberg Field inWeld County, Colorado and the Delaware Basin in Reeves County, Texas. Our portfolio has a proven record of delivering strong and repeatable economic returns and provides us the ability to allocate capital investments andmanage risk as each basin has its own operating and competitive dynamic in terms of commodity price markets, service costs, takeaway capacity and regulatory and political considerations. We have a disciplined developmentprogram that seeks to expand our project inventory through testing new intervals and considering various spacing configurations. We believe our project inventory will allow us to achieve attractive rates of return and grow ourproved reserves and
5

production in a sustainable fashion. Such expected returns on drilling can vary well by well and are based upon many factors, including but not limited to, commodity prices and well development and operating costs.
• Efficiency through technology and consolidation. Technological innovation has led to continued improvement in our drilling and completion times. We are utilizing technology to improve the efficiency of our horizontal drillingand completion operations in the Wattenberg Field. In the Delaware Basin, we continue to make progress towards improved capital efficiency through various drilling initiatives and completion designs. The technology associatedwith our completions process continues to improve as we design wellbore placement and stage spacing and, in the Wattenberg Field, increase the completed lateral length of our wells. In addition, completion equipment,perforation clusters, fluid and sand type and concentration decisions continue to result in more efficient recoveries of crude oil and natural gas reserves. As with our drilling operations, we are currently working toward using theexpertise we have developed in the Wattenberg Field to increase the efficiency of our Delaware Basin completions activities. Additionally, acreage consolidation, particularly in the Wattenberg Field, increases our ability to drilllonger length lateral wells. Longer laterals allow us to develop our properties with a smaller number of wells and less truck traffic, with resulting benefits for our operations and for the communities in which we operate.
• Strong environmental, health and safety compliance programs and community outreach. We have focused on establishing effective environmental, health and safety programs that are intended to promote safe working practicesfor our employees and contractors and to help earn the trust and respect of land owners, regulatory agencies and public officials. This is an important part of our strategy in effectively operating in today’s intensive regulatoryclimate. For the year ended December 31, 2019, we achieved our strategic priorities around our environment, health and safety programs. We are also dedicated to being an active and contributing member of the communities inwhich we operate. We share our success with these communities in various ways, including charitable giving and community event sponsorships.
• Experienced management team with proven track record. We have a strong executive management team that has an average of 25 years of experience in the oil and gas industry. Collectively, this experience includes technical,operational, commercial, financial and strategic aspects of the oil and gas industry. This team has a proven track record of executing on value-added capital investment programs that have been implemented with a focus onfinancial discipline and improving on an already strong balance sheet, while growing production and proved reserves. Additionally, our team's experience has helped us continue to achieve our strategic objectives through periodsof commodity price volatility, cost inflation and other challenging operating environments.
Operating Areas
Wattenberg Field. In the Wattenberg Field, we have identified a gross operated inventory of approximately 1,600 horizontal drilling locations (including locations received as part of the SRC Acquisition) that we expect to generateacceptable rates of return based on forward strip pricing, with an average lateral length of approximately 8,300 feet. In addition to these drilling locations, we entered 2020 with approximately 230 gross operated DUCs, including 88 grossoperated DUCs received as part of the SRC Acquisition. Our Wattenberg Field horizontal drilling locations have been substantially de-risked through multiple years of successful development in the field. We continue to analyze and testvarious wellbore spacing configurations in areas of the field that we believe have the potential to increase our gross operated inventory. Substantially all of our Wattenberg Field acreage is held by production. Wells in the Wattenberg Fieldtypically have productive horizons at depths of approximately 6,500 to 7,500 feet below the surface.
Delaware Basin. In the Delaware Basin, we have identified a gross operated inventory of approximately 190 horizontal drilling locations that we expect to generate acceptable rates of return based on forward strip pricing,primarily targeting the Wolfcamp A and Wolfcamp B zones, within the oilier eastern and north central portions of our acreage. The average lateral length of these locations is approximately 8,600 feet, compared to an average lateral lengthof approximately 7,900 feet as of year-end 2018. Some of these locations are within untested target zones that may be subject to a higher degree of uncertainty or may depend upon additional delineation and testing. Our gross operatedinventory in the Delaware Basin decreased from year-end 2018, primarily due to the removal of several standard-reach lateral, higher gas-to-oil ratio locations that were negatively impacted by decreased NYMEX natural gas pricing andhigher Waha natural gas differentials. We continue to pursue various business development initiatives, with a focus on acreage swaps and joint development projects, designed to increase our Delaware Basin project inventory byestablishing longer lateral drilling units capable of delivering attractive economic returns. In addition to these drilling locations, we entered 2020 with approximately 27 gross operated DUCs. Wells in the Delaware Basin typically haveproductive horizons at depths of approximately 8,000 to 11,500 feet below the surface.
6

Midstream Asset Divestitures
In the second quarter of 2019, we sold Delaware Basin produced water gathering and disposal, crude oil gathering and natural gas gathering assets (the "Midstream Asset Divestitures") for an aggregate cash purchase price of$345.6 million, subject to certain customary post-closing adjustments, plus potential future long-term incentive payments. We do not currently expect to meet the conditions to receive these incentive payments. Concurrent with theMidstream Asset Divestitures, we entered into agreements with the purchasers which provide us with certain gathering, processing, transportation and water disposal services. Proceeds were allocated first to the assets sold based upon thefair values of the tangible assets, with $179.6 million allocated to the acreage dedication agreements. Significant Customers
Our most significant customers are Occidental Marketing, Inc., DCP Midstream, LP ("DCP"), Mercuria Energy Trading, Inc. and United Energy Trading, LLC. Sales to each of these customers contributed more than 10 percent ofour 2019 revenues. However, given the liquidity in the market for the sale of hydrocarbons, we believe that the loss of any single purchaser, or the aggregate loss of several purchasers, could be managed by selling to alternative purchasers.
Properties
Productive Wells
The following table presents our productive wells:
Productive Wells
As of December 31, 2019
Crude Oil Natural Gas Total
Operating Region/Area Gross Net Gross Net Gross Net
Wattenberg Field (1) 1,163 809.7 1,385 1,212.8 2,548 2,022.5
Delaware Basin 48 27.6 53 50.7 101 78.3
Total productive wells 1,211 837.3 1,438 1,263.5 2,649 2,100.8
(1) Amounts do not include 950 gross (516 net) productive crude oil wells or 579 gross (442 net) productive natural gas wells received in theSRC Acquisition.
Proved Reserves
The following table presents our proved reserve estimates as of December 31, 2019, based on reserve reports prepared by our independent petroleum engineering consulting firms, Ryder Scott and NSAI and related information:
Proved Reserves at December 31, 2019
ProvedReserves(MMBoe)
% of TotalProved
Reserves % ProvedDeveloped % Liquids
ProvedReserves toProduction
Ratio (in years)(2)
2019Production
(MBoe)
Wattenberg Field 492.1 (1) 81% 33% 55% 13.0 37,984
Delaware Basin 118.8 19% 44% 69% 10.4 11,430
Total 610.9 100% 35% 57% 12.4 49,414
(1) Amount does not include 295.0 MMBoe of proved reserves received in the SRC Acquisition.(2) Based on 2019 PDC production.
Our proved reserves are sensitive to future crude oil, natural gas and NGLs sales prices and the related effect on the economic productive life of producing properties. Increases in commodity prices may result in a longer economicproductive life of a property or the recognition of more economically viable proved undeveloped ("PUD") reserves, while decreases in commodity prices may result in corresponding negative impacts. All of our proved reserves are locatedin the U.S.
Controls Over Reserve Report Preparation. Our proved reserve estimates are prepared using the definitions for proved reserves set forth in SEC Regulation S-X, Rule 4-10(a) and other applicable SEC rules. Inputs and majorassumptions related to
7

our proved reserves are reviewed annually by an internal team composed of reservoir engineers, geologists, land and management for adherence to SEC guidelines through a detailed review of land and accounting records, availablegeological and reservoir data and production performance data. The internal team compiles the reviewed data and forwards the applicable data to Ryder Scott or NSAI. Our proved reserves in the Wattenberg Field as of December 31, 2019were estimated by Ryder Scott and our proved reserves in the Delaware Basin as of that date were estimated by NSAI.
When preparing our reserve estimates, neither Ryder Scott nor NSAI independently verifies the accuracy and completeness of information and data furnished by us with respect to ownership interests, production volumes, well testdata, historical costs of operations and development, product prices or any agreements relating to current and future operations of properties or sales of production. Ryder Scott and NSAI prepare estimates of our reserves in conjunctionwith an ongoing review by our engineers. A final comparison of data is performed to ensure that the reserve estimates are complete, determined pursuant to acceptable industry methods and with a level of detail we deem appropriate. Thefinal estimated reserve reports are prepared by Ryder Scott and NSAI and reviewed by our engineering staff and management prior to issuance by those firms.
Letters which identify the professional qualifications of the individuals at Ryder Scott and NSAI who are responsible for overseeing the preparation of our reserve estimates as of December 31, 2019 have been filed as Exhibits99.1 and 99.2 to this report.
Internally, the professional qualifications of our lead engineer primarily responsible for overseeing the preparation of our reserve estimates, as defined in the Standards Pertaining to the Estimating and Auditing of Oil and Gas
Reserves Information as promulgated by the Society of Petroleum Engineers, qualifies this individual as a Reserve Estimator. This person holds a Masters of Petroleum Engineering from the Colorado School of Mines and a Bachelors ofGeology from the University of Colorado and has over 19 years of oil and gas experience.
In determining our proved reserves estimates, we used a combination of performance methods, including decline curve analysis and other computational methods, offset analogies and seismic data and interpretation. All of ourproved undeveloped reserves conform to the SEC five-year rule requirement as all proved undeveloped locations are scheduled, according to an adopted development plan, to be drilled within five years of the location’s initial booking date.
Commodity Pricing. Per SEC rules, the pricing used to prepare the proved reserves is based on the unweighted arithmetic average of the first of the month prices for the preceding 12 months. The NYMEX prices used in preparingthe reserves are then adjusted based on energy content, location and basis differentials and other marketing deductions to arrive at the net realized price.
The indicated index prices for our reserves, by commodity, are presented below.
Average Benchmark Prices (1)
As of December 31, Crude Oil
(per Bbl) (2) Natural Gas(per Mcf) (2)
NGLs(per Bbl) (3)
2019 $ 55.69 $ 2.58 $ 55.69
2018 65.56 3.10 65.56
2017 51.34 2.98 51.34
The netted back price used to estimate our reserves, by commodity, are presented below.
Price Used to Estimate Reserves (4)
As of December 31, Crude Oil(per Bbl)
Natural Gas(per Mcf)
NGLs(per Bbl)
2019 $ 52.63 $ 1.50 $ 12.21
2018 61.14 2.15 23.04
2017 48.68 2.31 20.21(1)Per SEC rules, the pricing used to prepare the proved reserves is based on the unweighted arithmetic average of the first of the month prices for the preceding 12 months.(2) Our benchmark prices for crude oil and natural gas are West Texas Intermediate ("WTI") and Henry Hub, respectively.(3)For NGLs, we use the NYMEX crude oil price as a reference for presentation purposes.(4)These prices are based on the index prices and are net of basin differentials, transportation fees, contractual adjustments and Btu adjustments we experienced for the respective commodity.
8

Commodities and Standardized Measure. Reserve estimates involve judgments and reserves cannot be measured exactly. The estimates must be reviewed periodically and adjusted to reflect additional information gained fromreservoir performance, new geologic and geophysical data and economic changes. Neither the estimated future net cash flows nor the standardized measure of discounted future net cash flows ("standardized measure") is intended torepresent the current market value of our proved reserves. For additional information regarding both of these measures, as well as other information regarding our proved reserves, see the Supplemental Information Unaudited - Crude Oiland Natural Gas Information provided with our consolidated financial statements included elsewhere in this report.
The following tables provide information regarding our estimated proved reserves:
As of December 31,
2019 2018 2017
Proved reserves Crude oil and condensate (MMBbls) 197 190 155
Natural gas (Bcf) 1,558 1,336 1,154
NGLs (MMBbls) 154 132 106
Total proved reserves (MMBoe) 611 545 453
Proved developed reserves (MMBoe) 214 180 143
Estimated undiscounted future net cash flows (inmillions) (1) $ 5,896 $ 7,735 $ 5,453
Standardized measure (in millions) $ 3,310 $ 4,448 $ 2,880
PV-10 (in millions) (2) $ 3,837 $ 5,321 $ 3,212
(1) Amount represents aggregate undiscounted future net cash flows, before income taxes, estimated by Ryder Scott and NSAI, of approximately $6.8 billion, $9.1 billion and $6.2 billion as of December 31, 2019, 2018 and 2017, respectively, less an internally-estimated undiscounted future income tax expense of approximately $0.9 billion, $1.4 billion and $0.7 billion, respectively.
(2) PV-10 is a non-U.S. GAAP financial measure. It is not intended to represent the current market value of our estimated reserves. PV-10 should not be considered in isolation or as a substitute for the standardized measure reported in accordance with U.S. GAAP,but rather should be considered in addition to the standardized measure. See Part II, Item 7, Management's Discussion and Analysis of Financial Condition and Results of Operations - Reconciliation of Non-U.S. GAAP Financial Measures, for a definition ofPV-10 and a reconciliation of our PV-10 value to the standardized measure.
The additions to our proved reserves at December 31, 2019 as compared to December 31, 2018 were primarily a result of an extended reserve life in the Delaware Basin due to an improved operating cost structure, increasedproduction forecasts for Wattenberg Field proved developed wells due to improved line pressures and an addition of proved undeveloped locations in the Wattenberg Field.
9

The following table presents our estimated proved developed and undeveloped reserves by category and area:
As of December 31, 2019
Operating Region/Area
Crude Oiland
Condensate(MMBbls)
NaturalGas(Bcf)
NGLs(MMBbls)
Crude OilEquivalent(MMBoe) Percent
Proved developed Wattenberg Field 47.1 443.4 40.7 161.7 26%
Delaware Basin 19.1 110.8 14.7 52.3 9%
Total proved developed 66.2 554.2 55.4 214.0 35%
Proved undeveloped Wattenberg Field 94.6 891.7 87.2 330.4 54%
Delaware Basin 36.4 111.9 11.4 66.5 11%
Total proved undeveloped 131.0 1,003.6 98.6 396.9 65%
Total proved reserves Wattenberg Field 141.7 1,335.1 127.9 492.1 81%
Delaware Basin 55.5 222.7 26.1 118.8 19%
Total proved reserves 197.2 1,557.8 154.0 610.9 100%
Proved Reserves Sensitivity Analysis. We have performed an analysis of our proved reserve estimates as of December 31, 2019 to present sensitivity associated with a lower crude oil price as the value of crude oil influences the
value of our proved reserves and PV-10 most significantly. Replacing the 2019 NYMEX price for crude oil used in estimating our reported proved reserves with $50.00 as shown on the table below, and leaving all other parametersunchanged, results in changes to our estimated proved reserves as shown.
Pricing Scenario - NYMEX
Crude Oil(per Bbl)
Natural Gas(per MMBtu)
ProvedReserves(MMBoe)
% Change fromDecember 31,
2019 EstimatedReserves
PV-10 (inMillions)
PV-10 % Changefrom December
31, 2019EstimatedReserves
2019 SEC Reserve Report(1) $ 55.69 $ 2.58 610.9 — $ 3,837.0 —
Alternate Price Scenario $ 50.00 $ 2.58 604.6 (1)% $ 3,201.8 (17)%
(1) These prices are the SEC NYMEX prices applied to the calculation of the PV-10 value. Such prices have been applied consistently in the alternate pricing scenario to include the impact of adjusting for deductions for any basin differentials,transportation fees, contractual adjustments and Btu adjustments we experienced for the relevant commodity.
Developed and Undeveloped Acreage
The following table presents our developed and undeveloped lease acreage:
As of December 31, 2019
Developed Undeveloped Total
Operating Region/Area Gross Net Gross Net Gross Net
Wattenberg Field (1) (2) 101,400 95,900 42,900 40,600 144,300 136,500
Delaware Basin 28,100 25,500 2,400 300 30,500 25,800
Total acreage 129,500 121,400 45,300 40,900 174,800 162,300
(1) Of the amounts shown, 78,800 gross (74,200 net) developed lease acres and 23,000 gross (22,100 net) undeveloped lease acres are associated with our approximately 1,600 operated horizontal Wattenberg Field drilling locations targeting theNiobrara or Codell plays. The remaining acres are associated with other zones within the field that we do not currently believe to be economic to develop; therefore, we have not currently identified any potential drilling locations on these acres.
(2) Amounts do not include approximately 65,000 gross (61,000 net) developed lease acres and 27,000 gross (22,000 net) undeveloped lease acres received in the SRC Acquisition.
10
Substantially all of our undeveloped acreage in the Wattenberg Field is related to leaseholds that are held by production. Our Wattenberg Field leaseholds at risk to expire in 2020, 2021 and 2022 are not material. In the DelawareBasin, there are drilling obligations or continuous drilling clauses associated with the majority of our acreage. We believe that our current Delaware Basin drilling plan should provide sufficient development to meet these obligations in ourcore areas over the next few years. In the event that we do not meet the obligations for certain leases, we plan to make any necessary bonus extension payments, changes to our drilling schedule or seek to renew or re-lease the relevantproperties. However, we may not be successful in such efforts and may in some cases elect to allow the lease to expire. Our Delaware Basin leaseholds at risk to expire in 2020, 2021 and 2022 are not material. See Item 1A. Risk Factors -Our undeveloped acreage must be drilled before lease expiration to hold the acreage by production. In highly competitive markets for acreage, failure to drill sufficient wells to hold acreage could result in substantial lease renewal costsor, if renewal is not feasible, loss of our lease and prospective drilling opportunities.
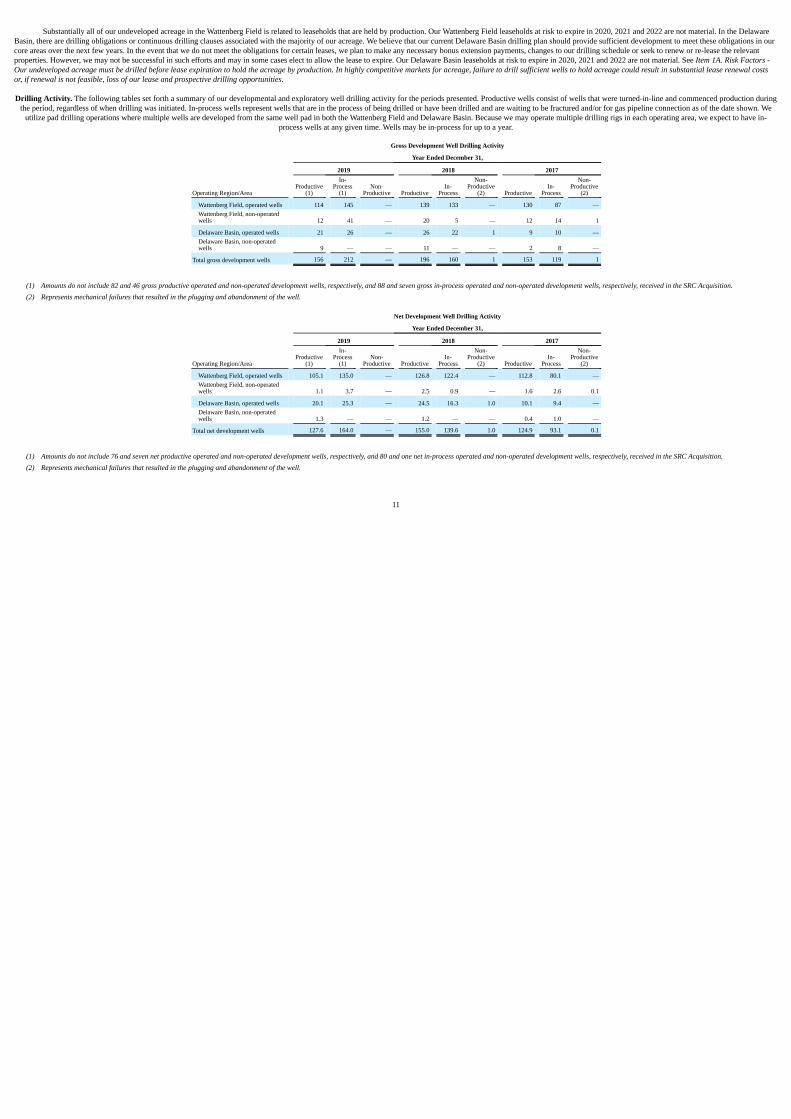
Drilling Activity. The following tables set forth a summary of our developmental and exploratory well drilling activity for the periods presented. Productive wells consist of wells that were turned-in-line and commenced production duringthe period, regardless of when drilling was initiated. In-process wells represent wells that are in the process of being drilled or have been drilled and are waiting to be fractured and/or for gas pipeline connection as of the date shown. We
utilize pad drilling operations where multiple wells are developed from the same well pad in both the Wattenberg Field and Delaware Basin. Because we may operate multiple drilling rigs in each operating area, we expect to have in-process wells at any given time. Wells may be in-process for up to a year.
Gross Development Well Drilling Activity
Year Ended December 31,
2019 2018 2017
Operating Region/Area Productive
(1) In-
Process(1)
Non-Productive Productive
In-Process
Non-Productive
(2) Productive In-
Process Non-
Productive(2)
Wattenberg Field, operated wells 114 145 — 139 133 — 130 87 —Wattenberg Field, non-operatedwells 12 41 — 20 5 — 12 14 1
Delaware Basin, operated wells 21 26 — 26 22 1 9 10 —Delaware Basin, non-operatedwells 9 — — 11 — — 2 8 —
Total gross development wells 156 212 — 196 160 1 153 119 1
(1) Amounts do not include 82 and 46 gross productive operated and non-operated development wells, respectively, and 88 and seven gross in-process operated and non-operated development wells, respectively, received in the SRC Acquisition.(2) Represents mechanical failures that resulted in the plugging and abandonment of the well.
Net Development Well Drilling Activity
Year Ended December 31,
2019 2018 2017
Operating Region/Area Productive
(1) In-
Process(1)
Non-Productive Productive
In-Process
Non-Productive
(2) Productive In-
Process Non-
Productive(2)
Wattenberg Field, operated wells 105.1 135.0 — 126.8 122.4 — 112.8 80.1 —Wattenberg Field, non-operatedwells 1.1 3.7 — 2.5 0.9 — 1.6 2.6 0.1
Delaware Basin, operated wells 20.1 25.3 — 24.5 16.3 1.0 10.1 9.4 —Delaware Basin, non-operatedwells 1.3 — — 1.2 — — 0.4 1.0 —
Total net development wells 127.6 164.0 — 155.0 139.6 1.0 124.9 93.1 0.1
(1) Amounts do not include 76 and seven net productive operated and non-operated development wells, respectively, and 80 and one net in-process operated and non-operated development wells, respectively, received in the SRC Acquisition.(2) Represents mechanical failures that resulted in the plugging and abandonment of the well.
11

Gross Exploratory Well Drilling Activity
Year Ended December 31,
2019 2018 2017
Operating Region/Area Productive In-
Process Non-
Productive Productive In-
Process Non-
Productive Productive In-
Process Non-
Productive
Wattenberg Field, operated wells — — — — — — — — —Wattenberg Field, non-operatedwells — — — — — — — — —
Delaware Basin 2 4 — 3 2 — 5 3 2
Total gross development wells 2 4 — 3 2 — 5 3 2
Net Exploratory Well Drilling Activity
Year Ended December 31,
2019 2018 2017
Operating Region/Area Productive In-
Process Non-
Productive Productive In-
Process Non-
Productive Productive In-
Process Non-
Productive
Wattenberg Field, operated wells — — — — — — — — —Wattenberg Field, non-operatedwells — — — — — — — — —
Delaware Basin 2.0 3.9 — 2.8 2.0 — 3.1 2.8 2.0
Total gross development wells 2.0 3.9 — 2.8 2.0 — 3.1 2.8 2.0
Title to Properties
We believe that we hold good and defensible leasehold title to substantially all of our crude oil and natural gas properties, in accordance with standards generally accepted in the industry. A preliminary title examination is typicallyconducted at the time the undeveloped properties are acquired. Prior to the commencement of drilling operations, a title examination is conducted and remedial curative work is performed, as necessary, with respect to discovered defectswhich we deem to be significant, in order to procure division order title opinions. Title examinations have been performed with respect to substantially all of our producing properties.
The properties we own are subject to royalty, overriding royalty and other outstanding interests. The properties may also be subject to additional burdens, liens or encumbrances customary in the industry, including items such asoperating agreements, current taxes, development obligations under crude oil and natural gas leases, farm-out agreements and other restrictions. We do not believe that any of these burdens will materially interfere with our use of theproperties.
Substantially all of our crude oil and natural gas properties have been mortgaged or pledged as security for our revolving credit facility.
Governmental Regulation
The U.S. crude oil and natural gas industry is extensively regulated at the federal, state and local levels. The following is a summary of certain laws, rules and regulations currently in force that apply to us. The regulatoryenvironment in which we operate changes frequently and we cannot predict the timing or nature of such changes or their effects on us.
Regulation of Crude Oil and Natural Gas Exploration and Production. Our exploration and production activities are subject to a variety of rules and regulations concerning drilling permits, location, spacing and density of wells,water discharge and disposal, prevention of waste, bonding requirements, surface use and restoration, public health and environmental protection and well plugging and abandonment. The primary state-level regulatory authority regardingthese matters in Colorado is the COGCC and the primary authority in Texas is the Texas Railroad Commission. Prior to preparing a surface location and commencing drilling operations on a well, we must procure permits and/or approvalsfor the various stages of the drilling process from the relevant state and local agencies. In addition, our operations must comply with rules governing the size of drilling and spacing units or proration units and the unitization or pooling oflands and leases. Some states, such as
12

Colorado, allow the forced pooling or integration of tracts to facilitate exploration while other states, such as Texas, rely primarily or exclusively on voluntary pooling of lands and leases.
In states such as Texas where pooling is primarily or exclusively voluntary, it may be more difficult to form units and therefore to drill and develop our leases in circumstances where we do not own all of the leases in the proposedunit. These risks also exist in Colorado, where a recent rule change has imposed new limits on forced pooling. State laws may also prohibit the venting or flaring of natural gas, which may impact rates of production of crude oil and naturalgas from our wells. Leases covering state or federal lands often include additional laws, regulations and conditions which can limit the location, timing and number of wells we can drill and impose other requirements on our operations, allof which can increase our costs.
Regulation of Transportation of Commodities. We move natural gas through pipelines owned by other entities and sell natural gas to other entities that also utilize common carrier pipeline facilities. Natural gas pipeline interstatetransmission and storage activities are subject to regulation by the Federal Energy Regulatory Commission ("FERC") under the Natural Gas Act of 1938 ("NGA") and under the Natural Gas Policy Act of 1978 ("NGPA"). Rates and chargesfor the transportation of natural gas in interstate commerce, and the extension, enlargement or abandonment of jurisdictional facilities, among other things, are subject to regulation. Natural gas pipeline companies hold certificates of publicconvenience and necessity issued by FERC authorizing ownership and operation of certain pipelines, facilities and properties.
In addition to regulation of natural gas pipeline interstate transmission and storage activities, under the Energy Policy Act of 2005 (the “EPAct 2005”) it is unlawful for “any entity” to use any deceptive or manipulative device orcontrivance in connection with the purchase or sale of gas or the purchase or sale of transportation services subject to regulation by FERC. The EPAct 2005 provides FERC with substantial enforcement authority to prohibit suchmanipulation of natural gas markets and enforce its rules and orders, including the ability to assess substantial civil penalties.
FERC Order 704 requires that any market participant, including natural gas producers, gatherers and marketers, that engaged in wholesale sales or purchases of natural gas that equaled or exceeded 2.2 MMBtus of physical naturalgas in the previous calendar year to report to FERC the aggregate volumes of natural gas produced or sold at wholesale in such calendar year. Order 704 applies only to those transactions that utilize, contribute to or may contribute to theformation of price indices. It is the responsibility of the market participant to determine which individual transactions are to be reported under the guidance of Order 704. Additional information that must be reported includes whether theprice in the relevant transaction was reported to any index publisher, and if so, whether such reporting complied with FERC’s policy statement on price reporting. To the extent that we engage in wholesale sales or purchases of natural gasthat equal or exceed 2.2 MMBtus of physical natural gas in a calendar year pursuant to transactions utilizing, contributing or having the potential to contribute to the formation of price indices, we may be subject to the reportingrequirements of Order 704.
Gathering is exempt from regulation under the NGA, thus allowing gatherers to charge negotiated rates. Gathering lines are, however, subject to state regulation, which includes various safety, environmental and, in somecircumstances, nondiscriminatory take requirements and rate regulation on a complaint basis. We own certain pipeline facilities in the Delaware Basin that we believe are exempt from regulation under the NGA as “gathering facilities,” butwhich may in some cases be subject to state regulation.
Although FERC has set forth a general test to determine whether facilities are exempt from regulation under the NGA as “gathering” facilities, FERC’s determinations as to the classification of facilities are performed on a case-by-case basis. With respect to facilities owned by third parties and on which we move natural gas, to the extent that FERC subsequently issues an order reclassifying facilities previously thought to be subject to FERC jurisdiction as non-jurisdictional gathering facilities, and depending on the scope of that decision, our costs of moving natural gas to the point of sale may be increased. Further, to the extent that FERC issues an order reclassifying facilities that we own thatwere previously thought to be non-jurisdictional gathering facilities as subject to FERC jurisdiction, we could be subject to additional regulatory requirements under the NGA and the NGPA.
Transportation and safety of natural gas is also subject to regulation by the U.S. Department of Transportation, through the Pipeline and Hazardous Materials Safety Administration (“PHMSA”), under the Natural Gas PipelineSafety Act of 1968, as amended, which imposes safety requirements in the design, construction, operation and maintenance of interstate natural gas transmission facilities, the Pipeline Inspection, Protection, Enforcement and Safety Act of2006 (the “PIPES Act 2006”), and the Pipeline Safety, Regulatory Certainty and Job Creation Act of 2011 (the “PIPES Act 2011”). We own certain pipeline facilities in the Delaware Basin that are subject to such regulation by PHMSA.
In addition to natural gas, we move crude oil, condensate and natural gas liquids (collectively, “liquids”) through pipelines owned by other entities and sell such liquids to other entities that also utilize pipeline facilities that may besubject to
13

regulation by FERC. FERC regulates the rates and terms and conditions of service for the interstate transportation of liquids under the Interstate Commerce Act, as it existed on October 1, 1977 (the “ICA”), and the rules and regulationspromulgated thereunder. This includes movements of liquids through any pipelines, including those located solely within one state, that are providing part of the continuous movement of such liquids in interstate commerce for a shipper.The ICA requires that pipelines providing jurisdictional movements maintain a tariff on file with FERC, setting forth established rates and the rules and regulations governing transportation service, which must be “just and reasonable.”The ICA also requires that services be provided in a manner that is not unduly discriminatory or unduly preferential; in some cases, this may result in the proration of capacity among shippers in an equitable manner.
The intrastate transportation of crude oil and NGLs is subject to regulation by state regulatory commissions, which in some cases require the provision of intrastate transportation on a nondiscriminatory basis and the prorationingof capacity on such pipelines under policies set forth in published tariffs. These state-level regulations may also impose certain limitations on the rates that the pipeline owner may charge for transportation.
Transportation of liquids by pipeline is subject to regulation by PHMSA pursuant to the Hazardous Liquids Pipeline Safety Act of 1979, as well as the PIPES Act 2006 and the PIPES Act 2011, which govern the design,installation, testing, construction, operation, replacement and management of liquids pipeline facilities. Liquids that are transported by rail may also be subject to additional regulation by PHMSA.
The availability, terms and cost of transportation affect the amounts we receive for our commodities. Historically, producers were able to flow supplies into interstate pipelines on an interruptible basis; however, recently we haveseen an increased need to acquire firm transportation on pipelines in order to avoid curtailments or shut-in gas, which could adversely affect cash flows from the affected area.
Environmental Matters
Our operations are subject to numerous laws and regulations relating to environmental protection. These laws and regulations change frequently, and the effect of these changes is often to impose additional costs or otherrestrictions on our operations. We cannot predict the occurrence, timing, nature or effect of these changes. We also operate under a number of environmental permits and authorizations. The issuing agencies may take the position that someor all of these permits and authorizations are subject to modification, suspension, or revocation under certain circumstances, but any such action would have to comply with applicable procedures and requirements.
Hazardous Substances and Wastes
We generate wastes that may be subject to the Federal Resource Conservation and Recovery Act (“RCRA”) and comparable state statutes. The U.S. Environmental Protection Agency (“EPA”) and various state agencies haveadopted requirements that limit the approved disposal methods for certain hazardous and non-hazardous wastes. Furthermore, certain wastes generated by our operations that are currently exempt from treatment as “hazardous wastes” mayin the future be designated as hazardous wastes, and therefore may subject us to more rigorous and costly operating and disposal requirements. In December 2016, the U.S. District Court for the District of Columbia approved a consentdecree between the EPA and a coalition of environmental groups. The consent decree requires the EPA to review and determine whether it will revise the RCRA regulations for exploration and production waste to treat such waste ashazardous waste. In April 2019, the EPA, pursuant to the consent decree, determined that revision of the regulations is not necessary. Information comprising the EPA’s review and decision is contained in a document entitled Managementof Exploration, Development and Production Wastes: Factors Informing a Decision on the Need for Regulatory Action. The EPA indicated that it will continue to work with states and other organizations to identify areas for continuedimprovement and to address emerging issues to ensure that exploration, development and production wastes continue to be managed in a manner that is protective of human health and the environment. Environmental groups, however,expressed dissatisfaction with the EPA’s decision and will likely continue to press the issue at the federal and state levels.
We currently own or lease numerous properties that have been used for the exploration and production of crude oil and natural gas for many years. If hydrocarbons or other wastes have been disposed of or released on or under theproperties that we own or lease or on or under locations where such wastes have been taken for disposal by us or prior owners or operators of such properties, we could be subject to liability under the Comprehensive EnvironmentalResponse, Compensation and Liability Act (“CERCLA”), RCRA and analogous state laws, as well as state laws governing the management of crude oil and natural gas wastes. CERCLA and similar state laws impose liability, withoutregard to fault or the legality of the original conduct, on certain classes of persons that are considered to have contributed to the release of a “hazardous substance” into the environment. These persons include the owner or operator of thedisposal site or sites where the release occurred and companies
14

that disposed of, transported or arranged for the disposal of the hazardous substances found at the site. Parties who are or were responsible for release of hazardous substances under CERCLA may be subject to full liability for the costs ofcleaning up the hazardous substances that have been released into the environment or remediation to prevent future contamination and for damages to natural resources. In addition, under state laws, it is not uncommon for neighboringlandowners and other third parties to file claims for personal injury and property damage allegedly caused by the hazardous substances released into the environment.
Hydraulic Fracturing
Hydraulic fracturing is commonly used to stimulate production of crude oil and/or natural gas from dense subsurface rock formations. We consistently utilize hydraulic fracturing in our crude oil and natural gas developmentprograms. The process involves the injection of water, sand and additives under pressure into a targeted subsurface formation. The water and pressure create fractures in the rock formations which are held open by the grains of sand,enabling the crude oil or natural gas to more easily flow to the wellbore. The process is generally subject to regulation by state oil and gas commissions, but is also the subject of various other regulatory initiatives at the federal, state andlocal levels.
Federal Regulation
Beginning in 2012, the EPA implemented Clean Air Act (“CAA”) standards (New Source Performance Standards and National Emission Standards for Hazardous Air Pollutants) applicable to hydraulically fractured natural gaswells and certain storage vessels. The standards require, among other things, use of reduced emission completions, or “green” completions, to reduce volatile organic compound emissions during well completions as well as new controlsapplicable to a wide variety of storage tanks and other equipment, including compressors, controllers and dehydrators.
In February 2014, the EPA issued permitting guidance under the Safe Drinking Water Act ("SDWA") for the underground injection of liquids from hydraulically fractured and other wells where diesel is used. Depending upon howit is implemented, this guidance may create duplicative requirements in certain areas, further slow the permitting process in certain areas, increase the costs of operations and result in expanded regulation of hydraulic fracturing activities bythe EPA, and may therefore adversely affect even companies, such as us, that do not use diesel fuel in hydraulic fracturing activities.
In May 2014, the EPA issued an advance notice of proposed rulemaking under the Toxic Substances Control Act pursuant to which it will collect extensive information on the chemicals used in hydraulic fracturing fluid, as well asother health-related data, from chemical manufacturers and processors.
The U.S. Department of the Interior, through the Bureau of Land Management (the “BLM”), finalized a rule in 2015 requiring the disclosure of chemicals used, mandating well integrity measures and imposing other requirementsrelating to hydraulic fracturing on federal lands. The BLM rescinded the rule in December 2017; however, the BLM’s rescission of the rule has been challenged in the United States District Court for the Northern District of California.
In June 2016, the EPA finalized pretreatment standards for indirect discharges of wastewater from the oil and gas extraction industry. The regulation prohibits sending wastewater pollutants from onshore unconventional oil and gasextraction facilities to publicly-owned treatment works.
In December 2016, the EPA released a report titled “Hydraulic Fracturing for Oil and Gas: Impacts from the Hydraulic Fracturing Water Cycle on Drinking Water Resources.” The report concluded that activities involved inhydraulic fracturing can have impacts on drinking water under certain circumstances. These and similar studies, depending on their degree of development and nature of results obtained, could spur initiatives to further regulate hydraulicfracturing under the SDWA or other regulatory mechanisms.
In November 2018, the EPA and the non-profit organization known as the State Review of Oil and Natural Gas Environmental Regulations (“STRONGER”) entered into a Memorandum of Understanding pursuant to which theEPA has affirmed its commitment to meaningful participation in STRONGER’s efforts to develop guidelines for state oil and natural gas environmental regulatory programs, conduct reviews of such programs and publish reports of thosereviews.
15

State Regulation
The states in which we currently operate have adopted or are considering adopting laws and regulations that impose or could impose, among other requirements, stringent permitting or air emission control, chemical disclosure,wastewater disposal, baseline sampling, seismic monitoring, well monitoring and materials handling requirements on hydraulic fracturing and/or well construction and well location requirements and more stringent notification orconsultation processes that relate to hydraulic fracturing. Similarly, some states, including Texas, have implemented rules requiring the submission of detailed information related to seismicity in connection with injection well permitapplications for the disposal of wastewater.
In 2019, Colorado enacted Senate Bill 19-181 (“SB 19-181”), which changes the mission of the COGCC from fostering responsible and balanced development to regulating development to protect public health and theenvironment and directs the COGCC to undertake rulemaking on various operational matters including environmental protection, facility siting and wellbore integrity. Pursuant to this direction, in December 2019 the COGCC proposednew regulatory requirements to enhance safety and environmental protection during hydraulic fracturing and to enhance wellbore integrity.
Colorado and Texas require that chemicals used in the hydraulic fracturing of a well be reported in a publicly searchable registry website developed and maintained by the Ground Water Protection Council and Interstate Oil andGas Compact Commission.
Concerns about hydraulic fracturing have contributed to support for ballot initiatives in Colorado that would dramatically limit the areas of the state in which drilling would be permitted to occur. See Item 1A. Risk Factors-RisksRelating to Our Business and the Industry-Changes in laws and regulations applicable to us could increase our costs, impose additional operating restrictions or have other adverse effects on us.
Local Regulation
Various local and municipal bodies in each of the states in which we operate have sought to impose prohibitions, moratoria and other restrictions on hydraulic fracturing activities. In Colorado, the Colorado Supreme Court ruled in2016 that the cities of Fort Collins and Longmont did not have the authority to prohibit or impose five-year moratoria on hydraulic fracturing. SB 19-181 gives local governmental authorities increased authority to regulate oil and gasdevelopment. The authors of the legislation were clear that SB 19-181 was not intended to allow an outright ban on oil and gas development. However, anti-industry activists in Longmont, Colorado, have argued in court that SB 19-181permits a local governmental authority to impose such a ban. We primarily operate in the rural areas of the core Wattenberg Field in Weld County, a jurisdiction in which there has historically been significant support for the oil and gasindustry. In Texas, legislation enacted in 2015 generally prohibits political subdivisions from banning, limiting or otherwise regulating oil and gas operations. See Item 1A. Risk Factors-Risks Relating to Our Business and the Industry-Changes in laws and regulations applicable to us could increase our costs, impose additional operating restrictions or have other adverse effects on us.
Private Lawsuits
Lawsuits have been filed against other operators in several states, including Colorado, alleging contamination of drinking water as a result of hydraulic fracturing activities.
Greenhouse Gases
The EPA has published findings that emissions of carbon dioxide, methane and other greenhouse gases (“GHGs”) present an endangerment to public health and the environment because such emissions are, according to the EPA,contributing to warming of the earth’s atmosphere and other climatic changes. These findings provide the basis for the EPA to adopt and implement regulations that would restrict emissions of GHGs under existing provisions of the CAA.In June 2010, the EPA began regulating GHG emissions from stationary sources.
In the past, Congress has considered proposed legislation to reduce emissions of GHGs. To date, Congress has not adopted any such significant legislation, but could do so in the future. In addition, many states and regions havetaken legal measures to reduce emissions of GHGs, primarily through the planned development of GHG emission inventories and/or regional GHG cap and trade programs. In February 2014, November 2017 and December 2019, Coloradoadopted rules regulating methane emissions from the oil and gas sector.
The Obama administration reached an agreement during the December 2015 United Nations climate change conference in Paris pursuant to which the U.S. initially pledged to make a 26 percent to 28 percent reduction in its GHG
16

emissions by 2025 against a 2005 baseline and committed to periodically update this pledge every five years starting in 2020 (the "Paris Agreement"). In June 2017, President Trump announced that the U.S. would initiate the formalprocess to withdraw from the Paris Agreement. In November 2019, the U.S. formally notified the United Nations of its intentions to withdraw from the Paris Agreement. The notification begins a one-year process to complete thewithdrawal.
Regulation of methane and other GHG emissions associated with oil and natural gas production could impose significant requirements and costs on our operations. Air Quality
Our operations are subject to the CAA and comparable state and local requirements. The CAA contains provisions that may result in the gradual imposition of certain pollution control requirements with respect to air emissionsfrom our operations. The EPA and state governments continue to develop regulations to implement these requirements. We may be required to make certain capital investments in the next several years for air pollution control equipment inconnection with maintaining or obtaining operating permits and approvals addressing other air emission-related issues. See the footnote titled Commitments and Contingencies - Litigation and Legal Items to our consolidated financialstatements included elsewhere in this report for further information regarding the Clean Air Act Section 114 Information Request that we received from the EPA.
In June 2016, the EPA implemented new requirements focused on achieving additional methane and volatile organic compound reductions from the oil and natural gas industry. The rules imposed, among other things, newrequirements for leak detection and repair, control requirements for oil well completions, replacement of certain pneumatic pumps and controllers and additional control requirements for gathering, boosting and compressor stations. InSeptember 2018, the EPA proposed revisions to the 2016 rules. The proposed amendments address certain technical issues raised in administrative petitions and include proposed changes to, among other things, the frequency of monitoringfor fugitive emissions at well sites and compressor stations. In September 2019, the EPA proposed certain policy amendments to the 2016 rules that would remove all sources in the transmission and storage segment of the oil and naturalgas industry from regulation. The proposed amendments would also rescind the methane requirements in the 2016 rules that apply to sources in the production and processing segments of the industry. The EPA is also proposing, in thealternative, to rescind the methane requirements that apply to all sources in the oil and natural gas industry, without removing any sources from the current source category.
In November 2016, the BLM finalized rules to further regulate venting, flaring and leaks during oil and natural gas production activities on onshore federal and Indian leases. The rules require additional controls and impose newemissions and other standards on certain operations on applicable leases, including committed state or private tracts in a federally approved unit or communitized agreement that drains federal minerals. In September 2018, the BLMpublished a final rule that revises the 2016 rules. The new rule, among other things, rescinds the 2016 rule requirements related to waste-minimization plans, gas-capture percentages, well drilling, well completion and related operations,pneumatic controllers, pneumatic diaphragm pumps, storage vessels and leak detection and repair. The new rule also revised provisions related to venting and flaring. Environmental groups and the States of California and New Mexicohave filed challenges to the 2018 rule in the United States District Court for the Northern District of California.
In 2016, the EPA increased the state of Colorado’s non-attainment ozone classification for the Denver Metro North Front Range Ozone Eight-Hour Non-Attainment ("Denver Metro/North Front Range NAA") area from“marginal” to “moderate” under the 2008 national ambient air quality standard (“NAAQS”). This increase in non-attainment status triggered significant additional obligations for the state under the CAA and resulted in Colorado adoptingnew and more stringent air quality control requirements in November 2017 that are applicable to our operations. In 2019, the EPA increased the state of Colorado’s non-attainment ozone classification for the Denver Metro/North FrontRange NAA area from “moderate” to “serious” under the 2008 NAAQS. This “serious” classification will trigger significant additional obligations for the state under the CAA and could result in new and more stringent air quality controlrequirements, which may in turn result in significant costs, and delays in obtaining necessary permits applicable to our operations.
SB 19-181 also requires, among other things, that the Air Quality Control Commission (“AQCC”) adopt additional rules to minimize emissions of methane and other hydrocarbons and nitrogen oxides from the entire oil and gasfuel cycle. The AQCC anticipates holding several rulemakings over the next several years to implement the requirements of SB 19-181, including a rulemaking to require continuous emission monitoring equipment at oil and gas facilities.In December 2019, the AQCC held the first of several rulemakings that are anticipated as a result of SB 19-181. As part of that rulemaking, the AQCC adopted significant additional and new emission control requirements applicable to oiland gas operations, including, for example, hydrocarbon liquids unloading control requirements and increased LDAR frequencies for facilities in certain proximity to occupied areas.
17

State-level rules applicable to our operations include regulations imposed by the Colorado Department of Public Health and Environment's ("CDPHE") Air Quality Control Commission, including stringent requirements relating tomonitoring, recordkeeping and reporting matters. In October 2019, the CDPHE published a human health risk assessment for oil and gas operations in Colorado, which used oil and gas emission data to model possible human exposure andfound a possibility of negative health impacts at distances up to 2,000 feet away under worst case conditions. In response, the COGCC announced that it will more rigorously scrutinize permit applications for wells within 2,000 feet of abuilding unit, work with CDPHE to obtain better site-specific data on oil and gas emissions, and consider the resulting data for possible future rulemaking.
Water Quality
The federal Clean Water Act (“CWA”) and analogous state laws impose strict controls concerning the discharge of pollutants and fill material, including spills and leaks of crude oil and other substances. The CWA also requiresapproval and/or permits prior to construction, where construction will disturb certain wetlands or other waters of the U.S. In June 2015, the EPA issued a final rule that attempted to clarify the CWA’s jurisdictional reach over “waters of theUnited States” (“2015 Clean Water Rule”) and replace the pre-existing 1986 rule and guidance. In February 2018, the EPA issued a rule to delay the applicability of the 2015 Clean Water Rule until February 2020, but this delay rule wasstruck following a court challenge. Other federal district courts, however, issued rulings temporarily enjoining the applicability of the 2015 Clean Water Rule itself in several states. Taken together, the 2015 Clean Water Rule has been ineffect in 22 states, including Colorado, and temporarily stayed in 27 states (the 2015 Clean Water Rule was in effect in certain counties in New Mexico and not in others). In those remaining states, the 1986 rule and guidance remained ineffect. In October 2019, the EPA and the USACE issued a final rule to repeal the 2015 Clean Water Rule (the “2019 Repeal Rule”). With the 2019 Repeal Rule, the agencies report that they will implement the pre-2015 Clean Water Ruleregulations and guidance nationwide. The 2019 Repeal Rule became effective on December 23, 2019; accordingly, the 2015 Clean Water Rule is no longer in effect in any state. However, numerous legal challenges to the 2019 Repeal Rulehave already been filed in federal court.
In February 2019, the EPA and the USACE published a proposed new rule that would differently revise the definition of “waters of the United States” and essentially replace both the 1986 rule and the 2015 Clean Water Rule. OnJanuary 23, 2020, the EPA and USACE announced the final new rule, titled the Navigable Waters Protection Rule (“2020 Rule”). The 2020 Rule will go into effect sixty days after publication in the Federal Register. The 2020 Rule willgenerally regulate four categories of “jurisdictional” waters: (i) territorial seas and traditional navigable waters (i.e., large rivers); (ii) perennial and intermittent tributaries of these waters; (iii) certain lakes, ponds and impoundments; and(iv) wetlands to jurisdictional waters. The 2020 Rule also includes 12 categories of exclusions, or “non-jurisdictional” waters, including groundwater, ephemeral features and diffuse stormwater run-off over upland areas. In particular, the2020 Rule will likely regulate fewer wetlands areas than were regulated under the 1986 rule and the 2015 Clean Water Rule because it does not regulate wetlands that are not adjacent to jurisdictional waters. Following publication, this newdefinition of “waters of the United States” will likely be challenged and sought to be enjoined in federal court. If and when the 2020 Rule goes into effect, it will change the scope of the CWA’s jurisdiction, which could result in increasedcosts and delays with respect to obtaining permits for discharges of pollutants or dredge and fill activities in waters of the U.S., including regulated wetland areas.
In January 2017, the Army Corps of Engineers issued revised and renewed streamlined general nationwide permits that are available to satisfy permitting requirements for certain work in streams, wetlands and other waters of theU.S. under Section 404 of the CWA and the Rivers and Harbors Act. The new nationwide permits took effect in March 2017, or when certified by each state, whichever was later. The oil and gas industry broadly utilizes nationwide permits12, 14 and 39 for the construction, maintenance and repair of pipelines, roads and drill pads, respectively, and related structures in waters of the U.S. that impact less than a half-acre of waters of the U.S. and meet the other criteria of eachnationwide permit.
The CWA also regulates storm water run-off from crude oil and natural gas facilities and requires storm water discharge permits for certain activities. Spill Prevention, Control and Countermeasure (“SPCC”) requirements of theCWA require appropriate secondary containment, load out controls, piping controls, berms and other measures to help prevent the contamination of navigable waters in the event of a petroleum hydrocarbon spill, rupture or leak.
Endangered Species
The Endangered Species Act restricts activities that may affect endangered or threatened species or their habitats. Similar protections are offered to migratory birds under the Migratory Bird Treaty Act and bald and golden eaglesunder the Bald and Golden Eagle Protection Act. Some of our operations may be located in areas that are or may be designated as habitats for endangered or threatened species or that may attract migratory birds, bald eagles or goldeneagles.
18

Other
In October 2015, the U.S. Department of Transportation Pipeline and Hazardous Materials Safety Administration proposed to expand its regulations in a number of ways, including increased regulation of gathering lines, even inrural areas, and proposed additional standards to revise safety regulations applicable to onshore gas transmission and gathering pipelines in 2016.
Crude oil production is subject to many of the same operating hazards and environmental concerns as natural gas production, but is also subject to the risk of crude oil spills. In addition to SPCC requirements, the Oil Pollution Actof 1990 (“OPA”) subjects owners of facilities to strict joint and several liability for all containment and cleanup costs and certain other damages arising from crude oil spills. Noncompliance with OPA may result in varying civil andcriminal penalties and liabilities. Historically, we have not experienced any significant crude oil discharge or crude oil spill problems.
In May 2015, the U.S. Department of Transportation issued a final rule regarding the safe transportation of flammable liquids by rail. The final rule imposes certain requirements on “offerors” of crude oil, including sampling,testing and certification requirements.
In February 2018, the COGCC comprehensively amended its regulations for oil, gas and water flowlines to expand requirements addressing flowline registration and safety, integrity management, leak detection and other matters.
In November 2019, the COGCC further amended its flowline regulations pursuant to SB 19-181 to impose additional requirements regarding flowline mapping, operational status, certification and abandonment, among other things. TheCOGCC has also adopted or amended numerous other rules in recent years, including rules relating to safety, flood protection and spill reporting.
We are also subject to rules regarding worker safety and similar matters promulgated by the U.S. Occupational Safety and Health Administration (“OSHA”) and other governmental authorities. OSHA has established workplacesafety standards that provide guidelines for maintaining a safe workplace in light of potential hazards, such as employee exposure to hazardous substances. To this end, OSHA adopted a new rule governing employee exposure to silica,including during hydraulic fracturing activities, in March 2016. Employees
As of December 31, 2019, we had approximately 540 full-time employees. Our employees are not covered by collective bargaining agreements. We consider relations with our employees to be positive.
WHERE YOU CAN FIND ADDITIONAL INFORMATION
We file annual, quarterly and current reports, proxy statements and other information with the SEC. Our SEC filings are available free of charge from our website at www.pdce.com as soon as reasonably practicable after suchmaterial is filed with, or furnished to, the SEC. We also make available free of charge any of our SEC filings by mail. For a mailed copy of a report, please contact PDC Energy, Inc., Investor Relations, 1775 Sherman Street, Suite 3000,Denver, CO 80203, or call (303) 860-5800.
We recommend that you view our website for additional information, as we routinely post information that we believe is important for investors. Our website can be used to access such information as our recent news releases,committee charters, code of business conduct and ethics, stockholder communication policy, director nomination procedures and our whistle blower hotline. While we recommend that you view our website, the information available on ourwebsite is not part of this report and is not incorporated by reference.
19
ITEM 1A. RISK FACTORS
You should carefully consider the following risk factors in addition to the other information included in this report. Each of these risk factors could adversely affect our business, operating results and financial condition, as well asthe value of an investment in our common stock or other securities.
Risks Relating to SRC Acquisition
We may not achieve the anticipated benefits of the SRC Acquisition.
The success of the SRC Acquisition will depend, in part, on our ability to realize the anticipated benefits and cost savings from combining our and SRC’s businesses, and there can be no assurance that we will be able tosuccessfully integrate SRC or otherwise realize the anticipated benefits of the SRC Acquisition. Difficulties in integrating SRC into our company may result in the combined company performing differently than expected, in operationalchallenges or in the failure to realize anticipated expense-related efficiencies. Potential difficulties that may be encountered in the integration process include, among others:
• the inability to successfully integrate SRC into our company in a manner that permits us to achieve the anticipated benefits and cost savings from the SRC Acquisition;• complexities associated with managing a larger, more complex, integrated business;• not realizing anticipated operating synergies;• integrating personnel from the two companies and the loss of key employees;• potential unknown liabilities and unforeseen expenses associated with the SRC Acquisition;• integrating relationships with customers, vendors and business partners;• performance shortfalls as a result of the diversion of management’s attention caused by the SRC Acquisition and the integration of SRC’s operations into our company;• managing expanded environmental and other regulatory compliance obligations related to SRC's facilities and operations;• consolidating information technology systems; and• the disruption of, or the loss of momentum in, our business or inconsistencies in standards, controls, procedures and policies.
Our results may suffer if we do not effectively manage our expanded operations following the SRC Acquisition.
Following completion of the SRC Acquisition, the size of our business has increased significantly. Our future success will depend, in part, on our ability to manage this expanded business, which poses numerous risks anduncertainties, including the need to integrate the operations and business of SRC into our existing business in an efficient and timely manner, to combine systems and management controls and to integrate relationships with variousbusiness partners. Failure to successfully manage the combined company may have an adverse effect on our financial condition, results of operations or cash flows.
Sales of substantial amounts of our common stock in the open market, by former SRC shareholders or otherwise, could depress our stock price.
Former SRC shareholders may not wish to continue to invest in our common stock, or for other reasons may wish to dispose of some or all of their interests in our common stock, and as a result may seek to sell their shares of ourcommon stock. Shares of our common stock that were issued to former holders of SRC common stock in the SRC Acquisition are freely tradable by such stockholders without restrictions or further registration under the Securities Act,provided, however, that any stockholders who are our affiliates will be subject to certain resale restrictions under the Securities Act. These sales (or the perception that these sales may occur), coupled with the increase in the outstandingnumber of shares of our common stock, may affect the market for, and the market price of, our common stock in an adverse manner. We issued approximately 39 million shares of our common stock to SRC shareholders. As ofFebruary 18, 2020, we had approximately 100 million shares of common stock outstanding and approximately 1.7 million shares of common stock subject to outstanding stock-based compensation arrangements and other rights to purchaseor acquire our shares.
If our stockholders, including former SRC shareholders, sell substantial amounts of PDC common stock in the public market, the market price of our common stock may decrease. These sales might also make it more difficult forus to raise capital by selling equity or equity-related securities at a time and price that we otherwise would deem appropriate.
20

Following the SRC Acquisition, we are proportionately more exposed to regulatory and operational risks associated with oil and gas operations in Colorado and other risks associated with a more geographically-concentrated assetbase.
All of SRC’s properties, production and reserves immediately prior to the SRC Acquisition were located in Colorado. As a result of the SRC Acquisition, the percentage of our properties, production and reserves that are located inColorado have increased and our exposure to the risk of unfavorable regulatory developments in the state have therefore increased as well. Similarly, the operations of both our company and SRC have been adversely affected in recentyears by limitations in the availability of adequate midstream infrastructure in the Wattenberg Field. The increased percentage of our combined production located in the Wattenberg Field following the SRC Acquisition has proportionatelyincreased our exposure to this risk, as well as other risks associated with operating in a more concentrated geographic area.
The market price of our common stock will continue to fluctuate, and may decline if the benefits of the SRC Acquisition do not meet the expectations of financial analysts.
The market price of our common stock may fluctuate significantly, including if we do not achieve the anticipated benefits of the SRC Acquisition as rapidly, or to the extent anticipated by, financial analysts or if the effect of theSRC Acquisition on our financial results is not consistent with the expectations of financial analysts.
Risks Relating to Our Business and the Industry
Crude oil, natural gas and NGL prices fluctuate and declines in these prices, or an extended period of low prices, can significantly affect the value of our assets and our financial results and may impede our growth.
Our revenue, profitability, cash flows and liquidity depend in large part upon the prices we receive for our crude oil, natural gas and NGLs. Changes in prices affect many aspects of our business, including:
• our revenue, profitability and cash flows;• our liquidity;• the quantity and present value of our reserves;• the borrowing base under our revolving credit facility and access to other sources of capital; and• the nature and scale of our operations.
The markets for crude oil, natural gas and NGLs are often volatile, and prices may fluctuate in response to, among other things:
• relatively minor changes in regional, national or global supply and demand;• regional, national or global economic conditions, and perceived trends in those conditions;• geopolitical factors, such as events that may reduce or increase production from particular oil-producing regions and/or from members of the Organization of Petroleum Exporting Countries ("OPEC"), and global events, such
as the ongoing COVID-19 outbreak; and• regulatory changes.
The price of oil has historically been volatile, due in recent years to a combination of factors including increased U.S. supply and global economic concerns. In 2019, oil prices ranged from highs of over $65 per barrel to lows ofapproximately $45 per barrel. Prices for natural gas and NGLs have also experienced substantial volatility. If we reduce our capital expenditures due to low prices, natural declines in production from our wells will likely result in reducedproduction and therefore reduced cash flow from operations, which would in turn further limit our ability to make the capital expenditures necessary to replace our reserves and production.
In addition to factors affecting the price of crude oil, natural gas and NGLs generally, the prices we receive for our production are affected by factors specific to us and to the local markets where the production occurs. The pricesthat we receive for our production are generally lower than the relevant benchmark prices that are used for calculating commodity derivative positions. These differences, or differentials, are difficult to predict and may widen or narrow inthe future based on market forces. Differentials can be influenced by, among other things, local or regional supply and demand factors and the terms of our sales contracts. Over the longer term, differentials will be significantly affected byfactors such as investment decisions made by providers of midstream facilities and services, refineries and other industry participants and the overall regulatory and economic climate. For example, increases in U.S. domestic oil productiongenerally, or in production from particular basins, may result in widening differentials. We may be materially and adversely impacted by widening differentials on our production and decreasing commodity prices.
21

The marketability of our production is dependent upon transportation and processing facilities, the capacity and operation of which we do not control. Market conditions or operational impediments affecting midstream facilities andservices could hinder our access to crude oil, natural gas and NGL markets, increase our costs or delay production. Our efforts to address midstream issues may not be successful.
Our ability to market our production depends in substantial part on the availability, proximity and capacity of gathering systems, pipelines and processing facilities owned and operated by third parties. If adequate midstreamfacilities and services are not available to us on a timely basis and at acceptable costs, our production and results of operations will be adversely affected. For example, in recent periods, due to ongoing drilling activities by us and thirdparties and seasonal changes in temperatures, our principal third-party provider in the Wattenberg Field for midstream facilities and services has experienced significantly increased gathering system pressures. The resulting capacityconstraints have restricted our production in the area and reduced our revenue. Similarly, rapid production growth in the Permian Basin has strained the available midstream infrastructure there, at times presenting the potential for adverseeffects on our operations. The use of alternative forms of transportation for oil production, such as trucks or rail, involves risks, including the risk that increased regulation could lead to increased costs or shortages of trucks or rail-cars. Inaddition to causing production curtailments, capacity constraints can also reduce the price we receive for the crude oil, natural gas and NGLs we produce.
We rely on third parties to continue to construct additional midstream facilities and related infrastructure to accommodate our growth, and the ability and willingness of those parties to do so is subject to a variety of risks. Forexample:
• Decreases in commodity prices in recent years have resulted in reduced investment in midstream facilities by some third parties;• Various interest groups have protested the construction of new pipelines, and particularly pipelines near water bodies, in various places throughout the country, and protests have at times physically interrupted pipeline
construction activities;• Some upstream energy companies have sought to reject volume commitment agreements with midstream providers in bankruptcy proceedings, and the risk that such efforts will succeed, or that upstream energy company
counterparties will otherwise be unable or unwilling to satisfy their volume commitments, may have the effect of reducing investment in midstream infrastructure; and• The possibility that new or amended regulations, including regulations that increase mandatory setbacks or enhance local control of oil and gas development, could result in severely curtailed drilling activities in Colorado may
discourage investment in midstream facilities.
Like other producers, we from time to time enter into volume commitments with midstream providers in order to induce them to provide increased capacity. If our production falls below the level required under these agreements,we could be subject to substantial penalties.
We have pursued a variety of strategies to alleviate some of the risks associated with the midstream services and facilities upon which we rely. There can be no assurance that the strategies we pursue will be successful or adequateto meet our needs. For example, our principal midstream provider in the Wattenberg Field commenced operation of a new facility in the third quarter of 2019 and the benefits to us of that facility were less than we expected.
Changes in laws and regulations applicable to us could increase our costs, impose additional operating restrictions or have other adverse effects on us.
The regulatory environment in which we operate changes frequently, often through the imposition of new or more stringent environmental and other requirements. We cannot predict the nature, timing, cost or effect of suchadditional requirements, but they may have a variety of adverse effects on us. The types of regulatory changes that could impact our operations vary widely and include, but are not limited to, the following:
• From time to time ballot initiatives have been proposed in Colorado that would adversely affect our operations. For example, Proposition 112, a voter initiative that qualified for the ballot for the general election in November2018, would have effectively prohibited the vast majority of our planned drilling activity in Colorado by imposing mandatory 2,500 foot setbacks between new oil and gas wells and any occupied structure or designated"vulnerable area." Although Proposition 112 was defeated at the polls, subsequent legislation significantly amended existing state law to, among other things, require the COGCC to prioritize public health and environmentalconcerns in its decisions, instruct the COGCC to adopt rules to minimize emissions of methane and other air contaminants, and authorize local governmental authorities to impose limitations on oil and gas developmentactivities more stringent than those imposed at the state level. In October 2019, the CDPHE released a study of potential health risks that modeled certain exposure scenarios at distances up to 2,000 feet, based on
22

data collected at oil and gas development and production sites. The study concluded that modeling results “support increased concern for short-term adverse effects” in a very narrow set of hypothetical circumstancesassociated with the development phase of oil and gas operations. As a result, the COGCC has determined that permit applications for locations and wells up to 2,000 feet from building units will be subject to additional agencyreview to ensure that the application complies with the new legislation. We may therefore experience significant delays in obtaining permits and approvals for some wells and drilling locations. As a result of the SRCAcquisition, the percentage of our combined properties, production and reserves located in Colorado have increased and our exposure to the risk of unfavorable regulatory developments in the state has therefore increased aswell.
• Substantially all of our drilling activities involve the use of hydraulic fracturing, and proposals are made from time to time at the federal, state and local levels to further regulate, or to ban, hydraulic fracturing practices.Additional laws or regulations regarding hydraulic fracturing could, among other things, increase our costs, reduce our inventory of economically viable drilling locations and reduce our reserves.
• Federal and various state, local and regional governmental authorities have implemented, or considered implementing, regulations that seek to limit or discourage the emission of carbon, methane and other GHGs. Forexample, the EPA has made findings and issued regulations that require us to establish and report an inventory of greenhouse gas emissions, and the state of Colorado has adopted rules regulating methane emissions from oiland gas operations. In addition, the Obama administration reached an agreement during the December 2015 United Nations climate change conference in Paris pursuant to which the U.S. initially pledged to make a 26 percentto 28 percent reduction in its GHG emissions by 2025 against a 2005 baseline (although President Trump subsequently announced that the U.S. is withdrawing from the Paris Agreement). Additional laws or regulationsintended to restrict the emission of GHGs could require us to incur additional operating costs and could adversely affect demand for the oil, natural gas and NGLs that we sell. These new laws or rules could, among otherthings, require us to install new emission controls on our equipment and facilities, acquire allowances to authorize our GHG emissions, pay taxes related to our emissions and administer and manage a GHG emissionsprogram. In addition, like other energy companies, we could be named as a defendant in GHG-related lawsuits.
• Proposals are made from time to time to amend U.S. federal and state tax laws in ways that would be adverse to us, including by eliminating certain key U.S. federal income tax preferences currently available with respect tocrude oil and natural gas exploration and production. The changes could include (i) the repeal of the percentage depletion deduction for crude oil and natural gas properties, (ii) the elimination of current deductions forintangible drilling and development costs, (iii) the elimination of the deduction for certain U.S. production activities and (iv) an extension of the amortization period for certain geological and geophysical expenditures. Also,state severance taxes may increase in the states in which we operate. This could adversely affect our existing operations in the relevant state and the economic viability of future drilling.
• The development of new environmental initiatives or regulations related to the acquisition, withdrawal, storage and use of surface water or groundwater or treatment and discharge of water waste, may limit our ability to usetechniques such as hydraulic fracturing, increase our development and operating costs and cause delays, interruptions or termination of our operations, any of which could have an adverse effect on our operations and financialcondition.
See Items 1 and 2, Business and Properties - Governmental Regulation for a summary of certain laws and regulations that currently apply to us. Any of such laws and regulations could be amended, and new laws or regulationscould be implemented, in a way that adversely affects our operations.
Our undeveloped acreage must be drilled before lease expiration to hold the acreage by production. In highly competitive markets for acreage, failure to drill sufficient wells to hold acreage could result in substantial lease renewalcosts or, if renewal is not feasible, loss of our lease and prospective drilling opportunities.
Unless production is established within the spacing units covering our undeveloped acreage, our leases for such acreage will expire. The cost to renew such leases may increase significantly and we may not be able to renew suchleases on commercially reasonable terms or at all. Unexpected lease expirations could occur if our actual drilling activities differ materially from our current expectations, and this could result in impairment charges. The risk of leaseexpiration is greater at times and in areas where the pace of our exploration and development activity slows. Our ability to drill and develop the locations necessary to maintain our leases depends on a number of uncertainties, including oiland natural gas prices, the availability and cost of capital, drilling and production costs, availability of drilling services and equipment, drilling results, gathering system and pipeline transportation constraints, access to and availability ofwater sourcing and distribution systems, regulatory approvals and other factors.
23

A substantial part of our crude oil, natural gas and NGLs production is located in the Wattenberg Field, making us vulnerable to risks associated with operating primarily in a single geographic area. In addition, we have a largeamount of proved reserves attributable to a small number of producing formations.
Although we have significant leasehold positions in the Delaware Basin in Texas, our current production is primarily located in the Wattenberg Field in Colorado. Because our production is not as diversified geographically asmany of our competitors, the success of our operations and our profitability may be disproportionately exposed to the effect of any regional events, including:
• fluctuations in prices of crude oil, natural gas and NGLs produced from the wells in the area;• natural disasters;• restrictive governmental regulations; and• curtailment of production or interruption in the availability of gathering, processing or transportation infrastructure and services and any resulting delays or interruptions of production from existing or planned new wells.
For example, bottlenecks in processing and transportation that have occurred in some recent periods in the Wattenberg Field have negatively affected our results of operations, and these adverse effects may be disproportionatelysevere to us compared to our more geographically diverse competitors. Similarly, the concentration of our producing assets within a small number of producing formations exposes us to risks, such as changes in field-wide rules that couldadversely affect development activities or production relating to those formations. Such an event could have a material adverse effect on our results of operations and financial condition. In addition, in areas where exploration andproduction activities are increasing, as has been the case in recent years in the Wattenberg Field and the Delaware Basin, the demand for, and cost of, drilling rigs, equipment, supplies, chemicals, personnel and oilfield services oftenincrease as well. Shortages or the high cost of drilling rigs, equipment, supplies, chemicals, personnel or oilfield services could delay or adversely affect our development and exploration operations or cause us to incur significantexpenditures that are not provided for in our capital forecast, which could have a material adverse effect on our business, financial condition or results of operations. All of the producing properties and reserves we acquired in the SRCAcquisition are located in the Wattenberg Field. As a result, the transaction increased the risks we face with respect to the geographic concentration of our properties.
Certain of our properties are subject to land use restrictions, which could limit the manner in which we conduct our business.
Certain of our properties are subject to land use restrictions, including city ordinances, which could limit the manner in which we conduct our business. Such restrictions could affect, among other things, our access to and thepermissible uses of our facilities as well as the manner in which we produce oil and natural gas, and may restrict or prohibit drilling in general. The costs we incur to comply with such restrictions may be significant, and we mayexperience delays or curtailment in the pursuit of development activities and may be precluded from drilling wells in some areas.
We may incur losses as a result of title defects in the properties in which we invest or acquire.
It is our practice in acquiring oil and gas leases or interests not to incur the expense of retaining lawyers to examine the title to the mineral interest at the time of acquisition. Rather, we rely upon the judgment of oil and gas leasebrokers or landmen who perform record title examinations before we acquire oil and gas leases and related interests. The existence of a material title deficiency can render a lease worthless and can adversely affect our results of operationsand financial condition. While we typically obtain title opinions prior to commencing drilling operations on a lease or in a unit, the failure of title may not be discovered until after a well is drilled, in which case we may lose the lease andthe right to produce all or a portion of the minerals under the property.
24

We are subject to complex federal, state, local and other laws and regulations that adversely affect the cost and manner of doing business.
Our exploration, development, production and marketing operations are regulated extensively at the federal, state and local levels. Environmental and other governmental laws and regulations have increased the costs of planning,designing, drilling, installing, operating and abandoning crude oil and natural gas wells and associated facilities. Under these laws and regulations, we could also be liable for personal injuries, property damage and natural resource or otherdamages, and could be required to change, suspend or terminate operations. Similar to our competitors, we incur substantial operating and capital costs to comply with such laws and regulations. These costs may put us at a competitivedisadvantage compared to larger companies in the industry which can more easily capture economies of scale with respect to compliance. A summary of certain laws and regulations that apply to us is set forth in Items 1 and 2 - Businessand Properties - Governmental Regulation.
From time to time, we have been subject to sanctions and lawsuits relating to alleged noncompliance with regulatory requirements. For example, in October 2017, in order to settle a lawsuit brought against us by the U.S.Department of Justice, on behalf of the EPA and the State of Colorado, we entered into a consent decree pursuant to which we paid a fine and agreed to implement certain operational changes. The lawsuit claimed that we failed to operateand maintain certain equipment in compliance with applicable law. In addition, as a result of the SRC Acquisition, we are subject to the obligations and requirements of a 2018 Compliance Order on Consent (“COC”) entered into by SRCwith CDPHE, applicable to certain SRC oil and gas production facilities. That COC resolved SRC’s alleged violations related to storage tank emissions and contains requirements similar to those contained in our consent decree. TheCDPHE has agreed to revise the COC to make the inspection and monitoring requirements, among others, consistent with those contained in our consent decree. This COC will apply only to those facilities formerly subject to the SRCCOC.
In May 2019, WildEarth Guardians filed a complaint against several oil and gas operators, including us, in the U.S. District Court for the District of Colorado. The complaint seeks civil penalties and injunctive relief and alleges,among other things, that we failed to obtain a major source air quality permit for two of our production facilities. We have filed a motion to dismiss the complaint.
A major risk inherent in our drilling plans is the possibility that we will be unable to obtain needed drilling permits from relevant governmental authorities in a timely manner. Our ability to obtain the permits needed to pursue ourdevelopment plans may be impacted by a variety of factors, including opposition by landowners or interest groups. Delays in obtaining regulatory approvals or drilling permits, the failure to obtain a drilling permit for a well, the receipt ofa permit with unreasonable or unexpected conditions or costs or the revocation of a previously granted permit, could have a material adverse effect on our ability to explore or develop our properties.
Our ability to produce crude oil, natural gas and NGLs economically and in commercial quantities could be impaired if we are unable to acquire adequate supplies of water for our drilling and completion operations or are unable todispose of or recycle the water we use at a reasonable cost, in a timely manner and within applicable environmental rules.
Drilling and development activities such as hydraulic fracturing require the use of water and result in the production of wastewater. Our operations could be adversely impacted if we are unable to locate sufficient amounts of wateror dispose of or recycle water used in our exploration and production operations. The quantity of water required in certain completion operations, such as hydraulic fracturing, and changing regulations governing usage may lead to waterconstraints, supply concerns and regulatory issues, particularly in relatively arid climates such as eastern Colorado and western Texas. For example, increased drilling activity in the Delaware Basin in recent years has led to heightenedconcerns about water supply issues in the area and this may lead to regulatory actions, including rules providing local governments greater authority over water use, that adversely impact our operations.
Our operations depend on being able to reuse or dispose of wastewater in a timely and economic fashion. Wastewater from oil and gas operations is often disposed of through underground injection. Wells in the Delaware Basintypically produce relatively large amounts of water that require disposal and an increased number of earthquakes have been detected in the Delaware Basin in recent years. Some studies have linked earthquakes, or induced seismicity, incertain areas to underground injection, which is leading to increased public and regulatory scrutiny of injection safety.
25

Reduced commodity prices could result in significant impairment charges and significant downward revisions of proved reserves.
Commodity prices are volatile. Significant and rapid declines in prices have occurred in the past and may occur in the future. Low commodity prices could result in, among other things, significant impairment charges. The cashflow model we use to assess properties for impairment includes numerous assumptions, such as management’s estimates of future oil and gas production and commodity prices, the outlook for forward commodity prices and operating anddevelopment costs. All inputs to the cash flow model must be evaluated at each date the estimate of future cash flows for each producing basin is calculated. However, a significant decrease in long-term forward prices alone could result ina significant impairment for our properties that are sensitive to declines in prices. We have incurred impairment charges in a number of recent periods, including charges of $38.5 million and $458.4 million in 2019 and 2018, respectively,to write down assets. Similar charges could occur in the future.
Our estimated reserves are based on many assumptions that may turn out to be inaccurate. Any material inaccuracies in these reserve estimates or underlying assumptions may materially affect the quantities and present value of ourreserves.
Calculating reserves for crude oil, natural gas and NGLs requires subjective estimates of remaining volumes of underground accumulations of hydrocarbons. Assumptions are also made concerning commodity prices, productionlevels and operating and development costs over the economic life of the properties. As a result, estimated quantities of proved reserves and projections of future production rates and the timing of development expenditures may beinaccurate. Independent petroleum engineers prepare our estimates of crude oil, natural gas and NGLs reserves using pricing, production, cost, tax and other information that we provide. The reserve estimates are based on assumptionsregarding commodity prices, production levels and operating and development costs that may prove to be incorrect. Any significant variance from these assumptions to actual results could greatly affect:
• the economically recoverable quantities of crude oil, natural gas and NGLs attributable to any particular group of properties;• future depreciation, depletion and amortization (“DD&A”) rates and amounts;• impairments in the value of our assets;• the classifications of reserves based on risk of recovery;• estimates of future net cash flows;• timing of our capital expenditures; and• the amount of funds available for us to borrow under our revolving credit facility.
Some of our reserve estimates must be made with limited production histories, which renders these estimates less reliable than those based on longer production histories. Further, reserve estimates are based on the volumes ofcrude oil, natural gas and NGLs that are anticipated to be economically recoverable from a given date forward based on economic conditions that exist at that date. The actual quantities of crude oil, natural gas and NGLs recovered will bedifferent than the reserve estimates, in part because they will not be produced under the same economic conditions as are used for the reserve calculations. In addition, quantities of probable and possible reserves by definition are inherentlymore risky than proved reserves, in part because they have greater uncertainty associated with the recoverable quantities of hydrocarbons.
At December 31, 2019, approximately 65 percent of our estimated proved reserves were undeveloped. These reserve estimates reflect our plans to make significant capital expenditures to convert our PUDs into proved developedreserves, including approximately $3.3 billion during the five years ending December 31, 2024, as estimated in the calculation of our standardized measure of oil and gas activity. The estimated development costs may not be accurate,development may not occur as scheduled and results may not be as estimated. If we choose not to develop PUDs, or if we are not otherwise able to successfully develop them, we will be required to remove the associated volumes from ourreported proved reserves. In addition, under the SEC’s reserve reporting rules, PUDs generally may be booked only if they relate to wells scheduled to be drilled within five years of the date of initial booking, and we may therefore berequired to downgrade any PUDs that are not developed within this five-year time frame.
The present value of the estimated future net cash flows from our proved reserves is not necessarily the same as the current market value of those reserves. Pursuant to SEC rules, the estimated discounted future net cash flowsfrom our proved reserves, and the estimated quantity of those reserves, are based on the prior year’s first day of the month 12-month average crude oil and natural gas index prices. However, factors such as actual prices we receive forcrude oil and natural gas and hedging instruments, the amount and timing of actual production, the amount and timing of future development costs, the supply of and demand for crude oil, natural gas and NGLs and changes ingovernmental regulations or taxation, also affect our actual future net cash flows from our properties. The timing of both our production and incurrence of expenses in connection with the development and production of crude oil andnatural gas properties will affect the timing of actual future net cash
26
flows from proved reserves, and thus their actual present value. In addition, the 10 percent discount factor we use when calculating discounted future net cash flows (the rate required by the SEC) may not be the most appropriate discountfactor based on interest rates currently in effect and risks associated with our properties or the industry in general.
Unless reserves are replaced as they are produced, our reserves and production will decline, which would adversely affect our future business, financial condition and results of operations. We may not be able to develop our identifieddrilling locations as planned.
Producing crude oil, natural gas and NGL reservoirs are generally characterized by declining production rates that vary depending upon reservoir characteristics and other factors. The rate of decline may change over time and mayexceed our estimates. Our future reserves and production and, therefore, our cash flows and income, are highly dependent on our ability to efficiently develop and exploit our current reserves and to economically find or acquire additionalrecoverable reserves. We may not be able to develop, discover or acquire additional reserves to replace our current and future production at acceptable costs. Our failure to do so would adversely affect our future operations, financialcondition and results of operations.
We have identified a number of well locations as an estimation of our future multi-year drilling activities on our existing acreage. These well locations represent a significant part of our growth strategy. Our ability to drill anddevelop these locations depends on a number of uncertainties, including:
• crude oil, natural gas and NGL prices;• the availability and cost of capital;• drilling and production costs;• availability of drilling services and equipment;• drilling results;• lease expirations or limitations as to depth;• midstream constraints;• access to and availability of water sourcing and distribution systems;• regulatory approvals; and• other factors.
Because of these factors, we do not know if the numerous potential well locations we have identified will ever be drilled or if we will be able to produce crude oil, natural gas or NGLs from these or any other potential welllocations. In addition, the number of drilling locations available to us will depend in part on the spacing of wells in our operating areas. An increase in well density in an area could result in additional locations in that area, but a reducedproduction performance from the area on a per-well basis. Further, certain of the horizontal wells we intend to drill in the future may require pooling of our lease interests with the interests of third parties. Some states, including Colorado,allow the involuntary pooling of tracts in a relatively broad number of circumstances in order to facilitate exploration, though Colorado now requires applicants to own or secure consent from the owners of more than 45 percent of theminerals to be pooled. Other states, notably Texas, restrict involuntary pooling to a much narrower set of circumstances and consequently these states rely primarily on voluntary pooling of lands and leases. In states such as Texas wherepooling is accomplished primarily on a voluntary basis, or in states such as Colorado if we cannot meet the minimum requirement for ownership and consent, it may be more difficult to form units and, therefore, more difficult to fullydevelop a project if we own less than all (or cannot secure the ownership or consent of the required minimum amount) of the leasehold in the proposed units or one or more of our leases in the proposed units does not provide the necessarypooling authority. If third parties in the proposed units are unwilling to pool their interests with ours, we may be unable to require such pooling on a timely basis or at all, which would limit the total horizontal wells we can drill. Further, thenumber of available locations will depend in part on the expected lateral lengths of the horizontal wells we drill. Because the intended lateral length of a horizontal well is subject to change for a variety of reasons, our estimated drillinglocations will change over time. For this or numerous other reasons, our actual drilling activities may materially differ from those presently identified.
Our inventory of drilling projects includes locations in addition to those that we currently classify as proved, probable and possible. The development of and results from these additional projects are more uncertain than thoserelating to probable and possible locations, and significantly more uncertain than those relating to proved locations. We have generally accelerated the pace of our development activities in the Wattenberg Field over the past several years,and this has reduced our related inventory of drilling locations. In addition, our Wattenberg Field inventory was further reduced by recent acreage exchange transactions in which we received, among other things, increased workinginterests in certain locations in exchange for our right to develop other locations. We anticipate that our remaining locations in the field will not, on average, be as productive or as economic as many those we have drilled in recent years,due to lower anticipated overall production or higher gas-to-oil ratios.
27

In the Delaware Basin, our inventory is subject to, among other things, lease expiration issues and our continued analysis of geologic issues in certain areas.
The wells we drill may not yield crude oil, natural gas or NGLs in commercially viable quantities and productive wells may be less successful than we expect.
A prospect is a property on which our geologists have identified what they believe, based on available information, to be indications of hydrocarbon-bearing rocks. However, given the limitations of available data and technology,our geologists cannot know conclusively prior to drilling and testing whether crude oil, natural gas or NGLs will be present in sufficient quantities to repay drilling or completion costs and generate a profit. Furthermore, even whenproperly used and interpreted, 2-D and 3-D seismic data and visualization techniques do not enable our geologists to be certain as to the quantity of the hydrocarbons in those structures. In addition, the use of 3-D seismic and otheradvanced technologies requires greater pre-drilling expenditures than traditional drilling strategies, and we could incur greater drilling and testing expenses as a result of such expenditures, which may result in a reduction in our returns. Asa result, our drilling activities may not be successful or economical, and our overall drilling success rate or our drilling success rate for activities in a particular area could decline. If a well is determined to be dry or uneconomic, which canoccur even though it contains some crude oil, natural gas or NGLs, it is classified as a dry hole and must be plugged and abandoned in accordance with applicable regulations. This generally results in the loss of the entire cost of drillingand completion to that point, the cost of plugging and lease costs associated with the prospect. Even wells that are completed and placed into production may not produce sufficient crude oil, natural gas and NGLs to be profitable, or theymay be less productive and/or profitable than we expected. For example, the data we use to model anticipated results from wells in a particular area may prove to be not representative of actual results from typical wells in the area, and thiscould result in production that falls short of estimates reflected in our internal business plans and/or guidance, "type curve" or other disclosures we make to the public. This risk is higher for us in certain areas in the Delaware Basin thathave relatively complex geological characteristics and correspondingly greater variability in well results. If we drill a dry hole or unprofitable well on a current or future prospect, or if drilling or completion costs increase, the profitabilityof our operations will decline and the value of our properties will likely be reduced. Exploratory drilling is typically subject to substantially greater risk than development drilling. In addition, initial results from a well are not necessarilyindicative of its performance over a longer period.
Drilling for and producing crude oil, natural gas and NGLs are high risk activities with many uncertainties that could adversely affect our business, financial condition and results of operations.
Drilling activities are subject to many risks, including the risk that we will not discover commercially productive reservoirs. Drilling can be unprofitable, not only due to dry holes, but also due to curtailments, delays orcancellations as a result of other factors, including:
• unusual or unexpected geological formations;• pressures;• fires;• floods;• loss of well control;• loss of drilling fluid circulation;• title problems;• facility or equipment malfunctions;• unexpected operational events;• shortages or delays in the delivery of equipment and services;• unanticipated environmental liabilities;• compliance with environmental and other governmental requirements; and• adverse weather conditions.
Any of these risks can cause substantial losses, including personal injury or loss of life, damage to or destruction of property, natural resources and equipment, pollution, environmental contamination or loss of wells and regulatorypenalties. For example, a loss of containment of hydrocarbons during drilling activities could potentially subject us to civil and/or criminal liability and the possibility of substantial costs, including for environmental remediation. Wemaintain insurance against various losses and liabilities arising from our operations; however, insurance against certain operational risks may not be available or may be prohibitively expensive relative to the perceived risks presented. Forexample, we may not have coverage with respect to a pollution event if we are unaware of the event while it is occurring and are therefore unable to report the occurrence of the event to our insurance company within the time framerequired under our insurance policy. Thus, losses could occur for uninsurable or uninsured risks or for amounts in excess of existing insurance coverage. The occurrence of an event that is not
28
fully covered by insurance and/or governmental or third-party responses to an event could have a material adverse effect on our business activities, financial condition and results of operations. We are currently involved in various remedialand investigatory activities at some of our wells and related sites.
In addition, certain technical risks relating to the drilling of horizontal wells - including those relating to our ability to fracture stimulate the planned number of stages and to successfully run casing the length of the well bore - haveincreased in recent years because we have increased the average lateral length of the horizontal wells we drill. Longer-lateral wells are also typically more expensive and require more time for preparation. In addition, we have transitionedto the use of multi-well pads instead of single-well sites. The use of multi-well pad drilling increases some operational risks because problems affecting the pad or a single well could adversely affect production from all of the wells on thepad. Pad drilling can also make our overall production, and therefore our revenue and cash flows, more volatile, because production from multiple wells on a pad will typically commence simultaneously. While we believe that we will bebetter served by using multi-well pads with longer lateral wells, the risk component involved in such drilling will be increased in some respects, with the result that we might find it more difficult to achieve economic success in our drillingprogram.
The inability of one or more of our customers or other counterparties to meet their obligations may adversely affect our financial results.
Substantially all of our accounts receivable result from our crude oil, natural gas and NGLs sales or joint interest billings to a small number of third parties in the energy industry. This concentration of customers and joint interestowners may affect our overall credit risk in that these entities may be similarly affected by changes in economic and other conditions. In addition, our commodity derivatives expose us to credit risk in the event of nonperformance bycounterparties. Nonperformance by our customers or derivative counterparties may adversely affect our financial condition and profitability. We face similar risks with respect to our other counterparties, including the lenders under ourrevolving credit facility and the providers of our insurance coverage.
Seasonal weather conditions and lease stipulations can adversely affect our operations.
Seasonal weather conditions and lease stipulations designed to prohibit or limit operations during crop-growing seasons and to protect wildlife affect operations in some areas. In certain areas drilling and other activities may berestricted or prohibited by lease stipulations, or prevented by weather conditions, for significant periods of time. This limits our operations in those areas and can intensify competition during the active months for drilling rigs, equipment,supplies, chemicals, personnel and oilfield services, which may lead to additional or increased costs or periodic shortages. These constraints, and the resulting high costs or shortages, could delay our operations and materially increaseoperating and capital costs and therefore adversely affect our profitability. Similarly, extreme temperatures during some recent periods adversely impacted the operation of certain midstream facilities, and therefore our production. Similarevents could occur in the future and could negatively impact our results of operations and cash flows.
We have limited control over activities on properties in which we own an interest but we do not operate, which could reduce our production and revenues.
Including wells that we received in the SRC Acquisition, we currently operate approximately 78 percent of all the wells in which we have an interest. If we do not operate a property, we do not have control over normal operatingprocedures, expenditures or future development of the property. The success and timing of drilling and development activities on properties operated by others therefore depends upon a number of factors outside of our control, includingthe operator’s timing and amount of capital expenditures, expertise (including safety and environmental compliance) and financial resources, inclusion of other participants in drilling wells and use of technology. The failure of an operatorto conduct drilling activities properly, or its breach of the applicable agreements, could reduce production and revenues and adversely affect our profitability. These risks may be heightened during periods of depressed commodity prices asoperators may propose activities that we believe to be economically unattractive, leading us to incur non-consent penalties. Our lack of control over non-operated properties also makes it more difficult for us to forecast capital expenditures,production and related matters.
We participate in oil and gas leases with third parties who may not be able to fulfill their commitments to our projects.
We frequently own less than all of the working interest in the oil and gas leases on which we conduct operations. Financial risks are inherent in any operation where the cost of drilling, equipping, completing and operating wells isshared by more than one person. We could be held liable for joint activity obligations of other working interest owners, such as nonpayment of costs and liabilities, arising from the actions of the other owners. In addition, declines in oil,natural gas and NGL prices may increase the likelihood that some of these working interest owners, particularly those that are smaller and less established, are not able to fulfill their joint activity obligations. A partner may be unable orunwilling to pay its share of project costs, and, in some cases, may declare bankruptcy. In the event any of our project partners does not pay its share of such costs,
29

we would likely have to pay those costs, and we may be unsuccessful in any efforts to recover the costs from the partner. This could materially adversely affect our financial position.
We may not be able to keep pace with technological developments in our industry.
Our industry is characterized by rapid and significant technological advancements. As our competitors use or develop new technologies, we may be placed at a competitive disadvantage, and competitive pressures may force us toimplement those or other new technologies at substantial cost. In addition, our competitors may have greater financial, technical and personnel resources that allow them to enjoy technological advantages and may in the future allow themto implement new technologies before we can. We may not be able to respond to these competitive pressures and implement new technologies on a timely basis or at an acceptable cost. If one or more of the technologies we use now or inthe future were to become obsolete or if we were unable to use the most advanced technology, our business, financial condition and results of operations could be materially adversely affected.
Competition in our industry is intense, which may adversely affect our ability to succeed.
Our industry is intensely competitive, and we compete with other companies that have greater resources. Many of these companies not only explore for and produce crude oil, natural gas and NGLs, but also carry on refiningoperations and market petroleum and other products on a regional, national or worldwide basis. These companies may be able to pay more for productive properties and exploratory prospects or define, evaluate, bid for and purchase agreater number of properties and prospects than we can. Our ability to acquire additional properties and to discover reserves in the future will be dependent upon our ability to evaluate and select suitable properties and to consummatetransactions in a highly competitive environment. In addition, larger companies may have a greater ability to continue exploration activities during periods of low commodity prices. Larger competitors may also be able to absorb the burdenof present and future federal, state, local and other laws and regulations more easily than we can, which could adversely affect our competitive position. These factors could adversely affect our operations and our profitability.
Our success depends on key members of our management and our ability to attract and retain experienced technical and other professional personnel.
Our future success depends to a large extent on the services of our key employees. The loss of one or more of these individuals could have a material adverse effect on our business. Uncertainties created by the SRC Acquisitionmay make it more challenging for us to retain some employees. Furthermore, competition for experienced technical and other professional personnel remains strong. If we cannot retain our current personnel or attract additionalexperienced personnel, our ability to compete could be adversely affected. Also, the loss of experienced personnel could lead to a loss of technical expertise.
A failure to complete successful acquisitions would limit our growth.
Because our crude oil and natural gas properties are depleting assets, our future reserves, production volumes and cash flows depend on our success in developing and exploiting our current reserves efficiently and finding oracquiring additional recoverable reserves economically. In addition, we continue to strive to achieve greater efficiencies in our drilling program, and our ability to do so is dependent in part on our ability to complete asset exchanges andother acquisitions that allow us to increase our working interests in particular properties. When attractive opportunities arise, acquiring additional crude oil and natural gas properties, or businesses that own or operate such properties, is asignificant component of our strategy. We may not be able to identify attractive acquisition opportunities. If we do identify an appropriate acquisition candidate, we may be unable to negotiate mutually acceptable terms with the seller,finance the acquisition or obtain the necessary regulatory approvals. It may be difficult to agree on the economic terms of a transaction, as a potential seller may be unwilling to accept a price that we believe to be appropriately reflective ofprevailing economic conditions. If we are unable to complete suitable acquisitions, it will be more difficult to replace our reserves, and an inability to replace our reserves would have a material adverse effect on our financial condition andresults of operations.
Acquisitions of properties are subject to the uncertainties of evaluating recoverable reserves and potential liabilities, including environmental uncertainties.
Acquisitions of producing and undeveloped properties, including the SRC Acquisition, have been an important part of our growth over time. We expect acquisitions will also contribute to our future growth. Successful acquisitionsrequire an assessment of a number of factors, many of which are beyond our control. These factors include recoverable reserves, development potential, future commodity prices, operating costs, title issues and potential environmental andother liabilities. Such assessments are inexact and their accuracy is inherently uncertain. In connection with our assessments, we generally perform engineering, environmental, geological and geophysical reviews of the acquired propertiesthat we believe are generally consistent with customary industry practices. However, such reviews are not likely to permit us to become sufficiently
30

familiar with the properties to fully assess their deficiencies and capabilities. We do not inspect every well prior to an acquisition and our ability to evaluate undeveloped acreage is inherently imprecise. Even when we inspect a well, wemay not always discover structural, subsurface and environmental problems that may exist or arise. In some cases, our review prior to signing a definitive purchase agreement may be even more limited. In addition, we often acquireacreage without any warranty of title except as to claims made by, through or under the transferor.
When we acquire properties, we will generally have potential exposure to liabilities and costs for environmental and other problems existing on the acquired properties, and these liabilities may exceed our estimates. We may notbe entitled to contractual indemnification associated with acquired properties. We often acquire interests in properties on an “as is” basis with no or limited remedies for breaches of representations and warranties. Therefore, we could incursignificant unknown liabilities, including environmental liabilities or losses due to title defects, in connection with acquisitions for which we have limited or no contractual remedies or insurance coverage. In addition, the acquisition ofundeveloped acreage is subject to many inherent risks and we may not be able to realize efficiently, or at all, the assumed or expected economic benefits of acreage that we acquire.
Additionally, significant acquisitions can change the nature of our operations depending upon the character of the acquired properties, which may have substantially different operating and geological characteristics or may be indifferent geographic locations than our existing properties. These factors can increase the risks associated with an acquisition. Acquisitions also present risks associated with the additional indebtedness that may be required to finance thepurchase price and any related increase in interest expense or other related charges.
The SRC Acquisition presents a number of the foregoing risks - for example, because closing has occurred, we will have no recourse if we subsequently discover unanticipated liabilities or other problems with the properties weacquired in the transaction. In addition, those risks are greater than they were in the case of most of our previous acquisitions given the larger size of the SRC Acquisition.
Some of our acquisitions are structured as asset trades or exchanges. These transactions may give rise to any or all of the foregoing risks. In addition, transactions of this type create a risk that we will undervalue the properties wetransfer to the counterparty in the trade or exchange or overvalue the properties we receive. Such an undervaluation or overvaluation would result in the transaction being less favorable to us than we expected.
Complications with the design of our new enterprise resource planning system could adversely impact our business and operations.
We rely extensively on information systems and technology to manage our business and summarize operating results. We implemented a new Enterprise Resource Planning ("ERP") system at the beginning of 2020 to replace ourexisting operating and financial systems. The ERP system is designed to enhance the maintenance of our financial records, improve operational functionality and provide timely information to our management team related to the operationof the business. The ERP system implementation process has required, and will continue to require, the investment of significant personnel and financial resources. We may not be able to continue to successfully implement the ERP systemwithout experiencing delays, increased costs and other difficulties. If we are unable to successfully manage the new ERP system as planned, our financial position, results of operations and cash flows could be negatively impacted.Additionally, if we do not effectively manage the ERP system as planned or the ERP system does not operate as intended, the effectiveness of our internal control over financial reporting could be adversely affected or our ability to assessthose controls adequately could be delayed.
We operate in a litigious environment. The cost of defending any suits brought against us, and any judgments or settlements resulting from such suits, could have an adverse effect on our results of operations and financial condition.
Like many oil and gas companies, we are from time to time involved in various legal and other proceedings, such as title, royalty or contractual disputes, employment litigation, regulatory compliance matters and personal injury orproperty damage matters, in the ordinary course of our business. For example, in recent years, we have been subject to lawsuits regarding royalty practices and payments, matters relating to certain of our affiliated partnerships and ourenvironmental compliance programs. The outcome of legal proceedings is inherently uncertain. Regardless of the outcome, such proceedings could have an adverse impact on us because of legal costs, diversion of management attentionand other factors. In addition, the resolution of such a proceeding could result in penalties or sanctions, settlement costs and/or judgments, consent decrees or orders requiring a change in our business practices, any of which couldmaterially and adversely affect our business, operating results and financial condition. Accruals for such liability, penalties, sanctions or costs may be insufficient. Judgments and estimates to determine accruals or the anticipated range ofpotential losses related to legal and other proceedings could change from one period to the next, and such changes could be material. Information regarding legal proceedings can found in the
31
footnote titled Commitments and Contingencies - Litigation and Legal Items to our consolidated financial statements included elsewhere in this report.
Our business could be negatively impacted by security threats, including cybersecurity threats and other disruptions.
We face various security threats, including attempts by third parties to gain unauthorized access to competitive information or to render data or systems unusable; threats to the safety of our employees; threats to the security of ourinfrastructure or third-party facilities and infrastructure, such as processing plants and pipelines; and threats from terrorist acts. There can be no assurance that the procedures and controls we use to monitor these threats and mitigate ourexposure to them will be sufficient to prevent them from materializing.
Our industry has become increasingly dependent on digital technologies to conduct day-to-day operations, including certain exploration, development and production activities. We depend on digital technology, includinginformation systems and related infrastructure, as well as cloud applications and services, to store, transmit, process and record sensitive information (including but not limited to trade secrets, employee information and financial andoperating data), communicate with our employees and business partners, and for many other activities related to our business. In addition, computer systems control the oil and gas production and processing equipment that are necessary todeliver our production to market. A disruption or failure of these systems, or of the networks and infrastructure on which they rely, may cause damage to critical production, distribution and/or storage assets, delay or prevent delivery tomarkets, or make it difficult to accurately account for production and settle transactions.
As dependence on digital technologies has increased in our industry, cyber incidents, including deliberate attacks and unintentional events, have also increased. Our systems and infrastructure are subject to damage or interruption
from a number of potential sources including natural disasters, software viruses or other malware, power failures, cyber-attacks and other events. We also face various other cyber-security threats from criminal hackers, state-sponsoredintrusion, industrial espionage and employee malfeasance, including threats to gain access to sensitive information or to render data or systems unusable.
Our business partners, including vendors, service providers, operating partners, purchasers of our production and financial institutions, are also dependent on digital technology. A vulnerability in the cybersecurity of one or moreof our vendors could facilitate an attack on our systems.
Our technologies, systems and networks, and those of our business partners, may become the target of cyber-attacks or information security breaches that could result in the unauthorized release, gathering, monitoring, misuse, lossor destruction of proprietary and other information, theft of property or other disruption of our business operations. In addition, certain cyber incidents, such as surveillance, may remain undetected for an extended period. Although we havenot suffered material losses related to cyber-attacks to date, if we were successfully attacked, we could incur substantial remediation and other costs or suffer other negative consequences, such as a loss of competitive information, criticalinfrastructure, personnel or capabilities essential to our operations. Events of this nature could have a material adverse effect on our reputation, financial condition, results of operations or cash flows. Moreover, as the sophistication ofcyber-attacks continues to evolve, we may be required to expend significant additional resources to further enhance our digital security or to remediate vulnerabilities.
The physical effects of climate change could disrupt our production and cause us to incur significant costs in preparing for or responding to those effects.
Many scientists believe that increasing concentrations of carbon dioxide, methane and other GHGs in the Earth's atmosphere are changing global climate patterns. One consequence of climate change could be increased severity ofextreme weather, such as increased hurricanes and floods. If such events were to occur, or become more frequent, our operations could be adversely affected in various ways, including through damage to our facilities or from increasedcosts for insurance.
Another possible consequence of climate change is increased volatility in seasonal temperatures. The market for natural gas is generally improved by periods of colder weather and impaired by periods of warmer weather, so anychanges in climate could affect the market for the fuels that we produce. Despite the use of the term “global warming” as a shorthand for climate change, some studies indicate that climate change could cause some areas to experiencetemperatures substantially colder than their historical averages. As a result, it is difficult to predict how the market for our production could be affected by increased temperature volatility, although if there is an overall trend of warmertemperatures, it would be expected to have an adverse effect on our business.
32

Risks Relating to Financial Matters
Our development and exploration operations require substantial capital, and we may be unable to obtain needed capital or financing on satisfactory terms, which could lead to a loss of properties and a decline in our production andreserves, and ultimately our profitability.
Our industry is capital intensive. We expect to continue to make substantial capital expenditures for the exploration, development, production and acquisition of crude oil, natural gas and NGL reserves. To date, we have financedcapital expenditures primarily with bank borrowings under our revolving credit facility, cash generated by operations and proceeds from capital markets transactions and the sale of properties. We intend to finance our future capitalexpenditures utilizing similar financing sources. Our cash flows from operations and access to capital are subject to a number of variables, including:
• our proved reserves;• the amount of crude oil, natural gas and NGLs we are able to produce from existing wells;• the prices at which crude oil, natural gas and NGLs are sold;• the costs to produce crude oil, natural gas and NGLs; and• our ability to acquire, locate and produce new reserves.
If our revenues or the borrowing base under our revolving credit facility decrease as a result of lower commodity prices, operating difficulties or for any other reason, our need for capital from other sources could increase, andthere can be no assurance that such other sources of capital would be available at that time on reasonable terms or at all. If we raise funds by issuing additional equity securities, this would have a dilutive effect on existing shareholders. Ifwe raise funds through the incurrence of debt, the risks we face with respect to our indebtedness would increase and we would incur additional interest expense. Our inability to obtain sufficient financing on acceptable terms wouldadversely affect our financial condition and profitability.
We have a substantial amount of debt and the cost of servicing, and risks related to refinancing, that debt could adversely affect our business. Those risks could increase if we incur more debt.
We have a substantial amount of indebtedness outstanding, and have recently increased our indebtedness as part of the SRC Acquisition, including through the assumption of $550 million aggregate principal amount of 6.25%Senior Notes issued by SRC due December 2025 (the “SRC Senior Notes”). On January 17, 2020, we commenced an offer to repurchase the SRC Senior Notes at 101 percent of the principal amount of the notes, together with any accruedand unpaid interest to the date of purchase. If the SRC Senior notes are tendered to us in full or in part, a significant portion of our liquidity would be required to pay interest and principal on our indebtedness, and we may not generatesufficient cash flows from operations, or have future borrowing capacity available, to enable us to repay our indebtedness or to fund other liquidity needs.
Servicing our indebtedness and satisfying our other obligations will require a significant amount of cash. Our cash flow from operating activities and other sources may not be sufficient to fund our liquidity needs. Our ability topay interest and principal on our indebtedness and to satisfy our other obligations will depend on our future operating performance, our financial condition and the availability of refinancing indebtedness, which will be affected byprevailing economic conditions and financial, business and other factors, many of which are beyond our control. We cannot assure you that our business will generate sufficient cash flow from operations, or that sufficient future borrowingswill be available to us under our revolving credit facility or otherwise, to fund our liquidity needs.
A substantial decrease in our operating cash flow or an increase in our expenses could make it difficult for us to meet debt service requirements and could require us to modify our operations, including by curtailing our explorationand drilling programs, selling assets, reducing our capital expenditures, refinancing all or a portion of our existing debt or obtaining additional financing. These alternative measures may not be successful and may not permit us to meet ourscheduled debt service obligations. Our ability to restructure or refinance our debt will depend on the condition of the capital markets and our financial condition at such time. Any refinancing of our debt could be at higher interest rates andmay require us to comply with more onerous covenants, which could further restrict our business operations. In addition, the terms of our debt agreements could restrict us from implementing some of these alternatives.
In the absence of adequate cash from operations and other available capital resources, we could face substantial liquidity problems and might be required to dispose of material assets or operations to meet our debt service andother obligations. We may not be able to consummate these dispositions for fair market value, in a timely manner or at all. Furthermore, any proceeds that we could realize from any dispositions may not be adequate to meet our debtservice obligations then due.
33

Covenants in our debt agreements currently impose, and future financing agreements may impose, significant operating and financial restrictions.
Our current debt agreements contain restrictions, and future financing agreements may contain additional restrictions, on our activities, including covenants that restrict our and our restricted subsidiaries’ ability to:
• incur additional debt;• pay dividends on, redeem or repurchase stock;• create liens;• make specified types of investments;• apply net proceeds from certain asset sales;• engage in transactions with our affiliates;• engage in sale and leaseback transactions;• merge or consolidate;• restrict dividends or other payments from restricted subsidiaries;• sell equity interests of restricted subsidiaries; and• sell, assign, transfer, lease, convey or dispose of assets.
Our revolving credit facility is secured by substantially all of our oil and gas properties as well as a pledge of all ownership interests in our operating subsidiaries. The restrictions contained in our debt agreements may prevent usfrom taking actions that we believe would be in the best interest of our business, and may make it difficult for us to successfully execute our business strategy or effectively compete with companies that are not similarly restricted. We mayalso incur future debt obligations that subject us to additional restrictive covenants.
Our revolving credit facility has substantial restrictions and financial covenants and our ability to comply with those restrictions and covenants is uncertain. Our lenders can unilaterally reduce our borrowing availability based onanticipated commodity prices.
We expect to depend on our revolving credit facility for part of our future capital needs. The terms of the credit agreement require us to comply with certain financial covenants. Our ability to comply with these covenants in thefuture is uncertain and will be affected by the levels of cash flows from operations and events or circumstances beyond our control. Our failure to comply with any of the restrictions and covenants under the revolving credit facility or otherdebt agreements could result in a default under those agreements, which could cause all of our existing indebtedness to become immediately due and payable.
The revolving credit facility limits the amounts we can borrow to a borrowing base amount, determined by the lenders in their sole discretion based upon projected revenues from the properties securing their loan. Decreases in theprice of crude oil, natural gas or NGLs can be expected to have an adverse effect on the borrowing base. The lenders can unilaterally adjust the borrowing base and the borrowings permitted to be outstanding under the revolving creditfacility. Outstanding borrowings in excess of the borrowing base must be repaid immediately unless we pledge other crude oil and natural gas properties as additional collateral. We do not currently have any substantial unpledgedproperties, and we may not have the financial resources in the future to make any mandatory principal prepayments required under the revolving credit facility. Our inability to borrow additional funds under our revolving credit facilitycould adversely affect our operations and our financial results.
If we are unable to comply with the restrictions and covenants in our debt agreements, the resulting default could lead to an acceleration of payment of funds that we have borrowed and we may not have or be able to obtain the fundsnecessary to repay those amounts.
Any default under the agreements governing our indebtedness, including a default under our revolving credit facility that is not waived by the required lenders, and the remedies sought by the holders of any such indebtedness,could make us unable to pay principal and interest on our indebtedness and satisfy our other obligations. If we are unable to generate sufficient cash flows and are otherwise unable to obtain the funds necessary to meet required paymentsof principal and interest on our indebtedness, or if we otherwise fail to comply with the various covenants, including financial and operating covenants, in the instruments governing our indebtedness, we could be in default under the termsof the agreements governing such indebtedness. In the event of such a default, the holders of such indebtedness could elect to declare all the funds borrowed thereunder to be due and payable, together with accrued and unpaid interest, thelenders under our revolving credit facility could elect to terminate their commitments, cease making further loans and institute foreclosure proceedings against our assets, and we could be forced into bankruptcy or liquidation. In addition,the default could result in a cross-default under other debt agreements. If our operating performance declines, we may in the future need to seek waivers from the required lenders under our revolving
34

credit facility to avoid being in default and we may not be able to obtain such a waiver. If this occurs and no waiver is obtained, we would be in default under our revolving credit facility, the lenders could exercise their rights as describedabove, and we could be forced into bankruptcy or liquidation. We cannot assure you that we will be granted waivers or amendments to our debt agreements if for any reason we are unable to comply with these agreements, or that we willbe able to refinance our debt on terms acceptable to us, or at all.
Our variable rate indebtedness subjects us to interest rate risk, which could cause our debt service obligations to increase significantly.
Borrowings under our revolving credit facility bear interest at variable rates and expose us to interest rate risk. If interest rates increase, our debt service obligations on the variable rate indebtedness would increase although theamount borrowed remained the same, and our net income and cash available for servicing our indebtedness and for other purposes would decrease.
We may be adversely affected by the phaseout of the London Interbank Offered Rate ("LIBOR") or the replacement of LIBOR with a different reference rate.
On July 27, 2017, the Financial Conduct Authority (the authority that regulates LIBOR) announced that it would phase out LIBOR by the end of 2021. It is unclear whether new methods of calculating LIBOR will be establishedsuch that it continues to exist after 2021, or if alternative rates or benchmarks will be adopted. Changes in the method of calculating LIBOR, or the replacement of LIBOR with an alternative rate or benchmark, may adversely affect interestrates and result in higher borrowing costs. This could materially and adversely affect our results of operations, cash flows and liquidity. We cannot predict the effect of the potential changes to LIBOR or the establishment and use ofalternative rates or benchmarks. If LIBOR becomes unavailable, our revolving credit facility requires us to work with the administrative agent to establish an alternate rate of interest and amend our credit agreement to reflect that new rateof interest, and until any such amendment is effective, all loans outstanding under the credit facility will be priced at the alternate base rate set forth in the credit agreement. We will continue to monitor the phaseout of LIBOR and ifchanges are made to the method of calculating LIBOR or LIBOR ceases to exist, we may also need to amend certain other contracts and cannot predict what alternative rate or benchmark would be negotiated. The phaseout of LIBOR andany amendments to our credit facility or other contracts may result in an increase to our interest expense. In addition, the discontinuance of LIBOR could also cause disruptions to the credit or derivatives markets that would be harmful toour business.
Notwithstanding our current indebtedness levels and restrictive covenants, we may still be able to incur substantial additional debt, which could exacerbate the risks described above.We may be able to incur additional debt in the future. Although our debt agreements contain restrictions on our ability to incur indebtedness, those restrictions are subject to a number of exceptions. In particular, we may borrow
under the revolving credit facility. We may also consider investments in joint ventures or acquisitions that may increase our indebtedness. Adding new debt to current debt levels could intensify the related risks that we and our subsidiariesnow face.
Under the “successful efforts” accounting method that we use, unsuccessful exploratory wells must be expensed in the period in which they are determined to be non-productive, which reduces our net income in such periods.
We conduct exploratory drilling in order to identify additional opportunities for future development. Under the “successful efforts” method of accounting that we use, the cost of unsuccessful exploratory wells must be charged toexpense in the period in which the wells are determined to be unsuccessful. In addition, lease costs for acreage condemned by the unsuccessful well must also be expensed. In contrast, unsuccessful development wells are capitalized as apart of the investment in the field where they are located. The costs of unsuccessful exploratory wells could result in a significant reduction in our profitability in periods in which the costs are required to be expensed.
Our commodity derivative activities could result in financial losses or reduced income from failure to perform by our counterparties, could limit our potential gains from increases in prices and could result in volatility in our netincome.
We use commodity derivatives for a portion of the production from our own wells and for natural gas purchases and sales by our marketing subsidiary to achieve more predictable cash flows, to reduce exposure to adversefluctuations in commodity prices, and to allow our natural gas marketing company to offer pricing options to natural gas sellers and purchasers. These arrangements expose us to the risk of financial loss in some circumstances, includingwhen purchases or sales are different than expected or the counterparty to the commodity derivative contract defaults on its contractual obligations. In addition, many of our commodity derivative contracts are based on WTI or anothercrude oil or natural gas index price. The risk that the differential between the index price and the price we receive for the relevant production may change unexpectedly
35

makes it more difficult to hedge effectively and increases the risk of a hedging-related loss. Also, commodity derivative arrangements may limit the benefit we would otherwise receive from increases in the prices for the relevantcommodity.
At December 31, 2019, we had hedged a total of 10.8 MMBbls and 3.2 MMBbls of crude oil through 2020 and 2021, respectively, and 4.0 Bcf of natural gas through 2020. Additionally, we assumed hedges covering 3.9 MMBblsof crude oil through 2020 in the SRC Acquisition. These hedges may be inadequate to protect us from continuing and prolonged declines in crude oil and natural gas prices.
Since we do not designate our commodity derivatives as cash flow hedges, we do not currently qualify for use of hedge accounting; therefore, changes in the fair value of commodity derivatives are recorded in our incomestatements and our net income is subject to greater volatility than it would be if our commodity derivative instruments qualified for hedge accounting. For instance, if commodity prices rise significantly, this could result in significant non-cash charges during the relevant period, which could have a material negative effect on our net income.
Our insurance coverage may not be sufficient to cover some liabilities or losses that we may incur.
The occurrence of a significant accident or other event that is not fully covered by insurance, not properly or timely noticed to our carrier, or that is in excess of our insurance coverage, could have a material adverse effect on ouroperations and financial condition. Insurance does not protect us against all operational risks. We do not carry business interruption insurance at levels that would provide enough funds for us to continue operating without access to otherfunds. In addition, pollution and environmental risks are generally not fully insurable. The cost of obtaining insurance has increased as a result of the SRC Acquisition because of our asset base.
The price of our common stock has been and may continue to be highly volatile, which may make it difficult for shareholders to sell our common stock when desired or at attractive prices.
The market price of our common stock is highly volatile and we expect it to continue to be volatile for the foreseeable future. Adverse events could trigger declines in the price of our common stock, including, among others:
• changes in production volumes, worldwide demand and prices for crude oil and natural gas;• inability to hedge future production at the same pricing level as our current or prior hedges;• changes in securities analysts’ estimates of our financial performance;• fluctuations in stock market prices and volumes, particularly among securities of energy companies;• changes in market valuations and valuation multiples of similar companies;• changes in interest rates;• announcements regarding adverse timing or lack of success in discovering, acquiring, developing and producing crude oil and natural gas resources;• announcements by us or our competitors of significant contracts, new acquisitions, discoveries, commercial relationships, joint ventures or capital commitments;• decreases in the amount of capital available to us, including as a result of borrowing base reductions and/or lenders ceasing to participate in our revolving credit facility syndicate;• operating results that fall below market expectations or variations in our quarterly operating results;• loss of a major customer;• loss of a relationship with a partner;• regulatory developments• the occurrence and severity of environmental events and governmental and other third-party responses to the events; or• additions or departures of key personnel.
External events, such as news concerning economic conditions, counterparties to our natural gas or crude oil derivatives arrangements, changes in government regulations impacting the crude oil and natural gas exploration andproduction industry or the movement of capital into or out of our industry, are also likely to affect the price of our common stock, regardless of our operating performance. For example, there have been recent efforts by some investmentadvisers, sovereign wealth funds, public pension funds, universities and other investment groups to divest themselves from investments in companies involved in fossil fuel extraction, and these efforts could reduce the trading prices of oursecurities. Similarly, our stock price could be adversely affected by changes in the way that analysts and investors assess the geological and economic characteristics of the basins in which we operate or the upstream industry in general.Furthermore, general market conditions, including the level of, and fluctuations in, the trading prices of stocks generally could affect the price of our common stock. The stock markets regularly experience price and volume volatility thataffects many companies’ stock prices without regard to the
36

operating performance of those companies. Volatility of this type may affect the trading price of our common stock. Similar factors could also affect the trading prices of our senior notes.
Our certificate of incorporation, bylaws and Delaware law contain provisions that may have an anti-takeover effect and may delay, defer or prevent a tender offer or takeover attempt, which may adversely affect the market price ofour common stock.
Our certificate of incorporation and bylaws, and certain provisions of Delaware law, may have anti-takeover effects.For example, our certificate of incorporation authorizes our board of directors (the "Board") to issue preferred stock without shareholder approval. If our Board elects to issue preferred stock, it could be more difficult for a third party toacquire us, including in circumstances where the acquisition is supported by the holders of a majority of our stock. In addition, other provisions of our certificate of incorporation, bylaws and Delaware law could make it more difficult for athird party to acquire control of us against the wishes of our Board, including:
• the organization of our Board as a classified board, which provides that approximately one-third of our directors are subject to election each year;• bylaw provisions that require advance notice of some types of shareholder proposals; and• Delaware law provisions which prohibit us from engaging in any business combination with any "interested stockholder," meaning generally that a stockholder who beneficially owns more than 15% of our stock cannot
acquire us for a period of three years from the date this person became an interested stockholder, unless various conditions are met.
In addition, shareholder activism in our industry has been increasing. If we are unable to work productively with activist or other shareholders, any resulting disagreements or disputes could require substantial management timeand attention and could adversely affect our results of operations.
Derivatives legislation and regulation could adversely affect our ability to hedge crude oil and natural gas prices and increase our costs and adversely affect our profitability.
In July 2010, the Dodd-Frank Wall Street Reform and Consumer Protection Act (the “Dodd-Frank Act”) was enacted into law. The Dodd-Frank Act regulates derivative transactions, including our commodity hedging swaps, andcould have a number of adverse effects on us, including the following:
• The Dodd-Frank Act may limit our ability to enter into hedging transactions, thus exposing us to additional risks related to commodity price volatility; commodity price decreases would then have an increased adverse effecton our profitability and revenues. Reduced hedging may also impair our ability to have certainty with respect to a portion of our cash flows, which could lead to decreases in capital spending and, therefore, decreases in futureproduction and reserves.
• If, as a result of the Dodd-Frank Act or its implementing regulations, we are required to post cash collateral in connection with our derivative positions, this would likely make it impracticable to implement our current hedgingstrategy.
The above factors could also affect the pricing of derivatives and make it more difficult for us to enter into hedging transactions on favorable terms.
ITEM 1B. UNRESOLVED STAFF COMMENTS
None.
ITEM 3. LEGAL PROCEEDINGS
Information regarding our legal proceedings can found in the footnote titled Commitments and Contingencies - Litigation and Legal Items to our consolidated financial statements included elsewhere in this report.
ITEM 4. MINE SAFETY DISCLOSURES Not applicable.
37

PART II
ITEM 5. MARKET FOR THE REGISTRANT'S COMMON EQUITY, RELATED STOCKHOLDERS MATTERS AND ISSUER PURCHASES OF EQUITY SECURITIES Our common stock, par value $0.01 per share, is traded on the NASDAQ Global Select Market under the symbol PDCE.
As of February 18, 2020, we had approximately 433 stockholders of record. Since inception, no cash dividends have been declared on our common stock. Cash dividends are restricted under the terms of our revolving creditfacility, as well as the indentures governing our 6.125% senior notes due September 15, 2024 (the "2024 Senior Notes"), our 5.75% senior notes due May 15, 2026 (the "2026 Senior Notes") and the SRC Senior Notes.
The following table presents information about our purchases of our common stock during the three months ended December 31, 2019:
Period Total Number of
Shares Purchased (1) Average PricePaid per Share
Total Number of Shares
Purchased as Part of Publicly
Announced Plansor Programs (2)
Approximate DollarValue of Shares That
May Yet Be Purchased Under the Plansor Programs (in
millions) (3)
October 1 - 31, 2019 346,080 $ 26.02 341,423 $ 45.6
November 1 - 30, 2019 — — — —
December 1 - 31, 2019 173 23.87 — —
Total fourth quarter 2019 purchases 346,253 26.02 341,423 $ 45.6
(1) Certain purchases represent shares withheld from employees for the payment of their tax liabilities related to the vesting of securities issued pursuant to our stock-based compensation plans. The withheld shares are not issued or considered common stockrepurchased under the Stock Repurchase Program described in the footnote titled Common Stock to our accompanying consolidated financial statements included elsewhere in this report.
(2) In April 2019, the Board approved a program to acquire up to $200 million of our outstanding common stock and in August 2019, effective with the closing of the SRC Acquisition, increased such amount to $525 million. The Stock Repurchase Program doesnot require any specific number of shares to be acquired, and can be modified or discontinued by the Board at any time.
(3) Subsequent to December 31, 2019, we repurchased $12.5 million of our outstanding common stock as part of the Stock Repurchase Program. As of February 24, 2020, $358.2 million of our outstanding common stock remained available for repurchase underthe Stock Repurchase Program.
38

STOCKHOLDER PERFORMANCE GRAPH
The performance graph below compares the cumulative total return of our common stock over the five-year period ended December 31, 2019 with the cumulative total returns for the same period for the Standard and Poor's("S&P") 500 Index and the Standard Industrial Code ("SIC") Index. The SIC Index is a weighted composite of 233 crude petroleum and natural gas companies. The cumulative total stockholder return assumes that $100 was invested,including reinvestment of dividends, if any, in our common stock on December 31, 2014, and in the S&P 500 Index and the SIC Index on the same date. The results shown in the graph below are not necessarily indicative of futureperformance.
39

ITEM 6. SELECTED FINANCIAL DATA
Year Ended/As of December 31,
2019 2018 2017 2016 (1) 2015
(in millions, except per share data and as noted)
Statement of Operations: Crude oil, natural gas and NGLs sales $ 1,307.3 $ 1,390.0 $ 913.1 $ 497.4 $ 378.7
Commodity price risk management gain (loss), net (162.8) 145.2 (3.9) (125.7) 203.2
Total revenues 1,156.1 1,548.7 921.6 382.9 595.3
Net income (loss) (56.7) 2.0 (127.5) (245.9) (68.3)
Earnings per share:
Basic $ (0.89) $ 0.03 $ (1.94) $ (5.01) $ (1.74)
Diluted (0.89) 0.03 (1.94) (5.01) (1.74)
Statement of Cash Flows:
Net cash flows from: Operating activities $ 858.2 $ 889.3 $ 597.8 $ 486.3 $ 411.1
Investing activities (677.8) (1,087.9) (717.0) (1,509.1) (604.3)
Financing activities (188.9) 18.1 65.0 1,266.1 178.0Capital expenditures for development of crude oil and naturalgas properties (2) (855.9) (946.4) (737.2) (436.9) (599.5)
Acquisition of crude oil and natural gas properties (13.2) (180.0) (15.6) (1,073.7) —
Balance Sheet:
Total assets $ 4,448.7 $ 4,544.1 $ 4,420.4 $ 4,485.8 $ 2,370.5
Working capital (deficit) (57.2) (166.6) (16.4) 129.2 30.7
Total debt, net of unamortized discount and debt issuance costs 1,177.2 1,194.9 1,151.9 1,044.0 642.4
Total stockholders' equity 2,335.5 2,526.7 2,507.6 2,622.8 1,287.2
Average Pricing and Production Expenses (per Boe and as apercent of sales for production taxes):
Sales price (excluding net settlements on derivatives) $ 26.46 $ 34.61 $ 28.69 $ 22.43 $ 24.64
Lease operating expenses 2.88 3.26 2.82 2.70 3.71
Production taxes 1.63 2.25 1.91 1.42 1.20
Production taxes (as a percent of sales) 6.2% 6.5% 6.6% 6.3% 4.9%
Transportation, gathering and processing 0.94 0.93 1.04 0.83 0.66
Total production 49,414 40,160 31,830 22,176 15,369
Total proved reserves (MMBoe) 610.9 544.9 452.9 341.4 272.8
(1) In 2016, we closed an acquisition in the Delaware Basin for aggregate consideration of approximately $1.76 billion. (2) Includes impact of change in accounts payable related to capital expenditures.
40

ITEM 7. MANAGEMENT'S DISCUSSION AND ANALYSIS OF FINANCIAL CONDITION AND RESULTS OF OPERATIONS
The following discussion and analysis should be read in conjunction with our consolidated financial statements and related notes thereto included elsewhere in this report. A discussion of changes in our results of operations from2017 to 2018 has been omitted from this report, but may be found in Item 7, Management's Discussion and Analysis, of our Annual Report on Form 10-K for the year ended December 31, 2018, filed with the SEC on February 28, 2019.Further, we encourage you to revisit the Special Note Regarding Forward-Looking Statements in Part I of this report.
EXECUTIVE SUMMARY
2019 Financial Overview of Operations and Liquidity
Production volumes increased 23 percent to 49.4 MMBoe in 2019 compared to 2018. The increase in production volumes was primarily attributable to the continued success of our horizontal Niobrara and Codell drilling programin the Wattenberg Field and growing production from our horizontal Wolfcamp drilling program in our Delaware Basin properties. Total liquids production of crude oil and NGLs comprised 61 percent of production in 2019. For the monthended December 31, 2019, we maintained an average production rate of approximately 139,000 Boe per day, up from approximately 129,000 Boe per day for the month ended December 31, 2018.
Crude oil, natural gas and NGLs sales decreased to $1.3 billion in 2019 compared to $1.4 billion in 2018, driven by a 24 percent decrease in weighted-average realized commodity prices, partially offset by the 23 percent increasein production. We had negative net settlements from commodity derivative contracts of $17.6 million for 2019 as compared to negative net settlements of $115.5 million for 2018. The combined revenue from crude oil, natural gas andNGLs sales and net settlements received on our commodity derivative instruments was $1.3 billion in both 2019 and 2018.
In 2019, we generated a net loss of $56.7 million or, $0.89 per diluted share, compared to net income of $2.0 million, or $0.03 per diluted share, in 2018. Adjusted EBITDAX, a non-U.S. GAAP financial measure, was $882.7million in 2019, up two percent from $868.7 million in 2018.
Net cash flows from operating activities in 2019 and 2018 were $858.2 million and $889.3 million, respectively, and adjusted cash flows from operations, a non-U.S. GAAP financial measure, were $825.4 million and $808.4million, respectively. Free cash flow, a non-U.S. GAAP financial measure, was $37.7 million for 2019 as compared to a deficit of $174.3 million for 2018.
See Reconciliation of Non-U.S. GAAP Financial Measures below for a more detailed discussion of these non-U.S. GAAP financial measures and a reconciliation of these measures to the most comparable U.S. GAAP measures.
Acquisition
In January 2020, we merged with SRC in a transaction valued at $1.7 billion, inclusive of SRC's net debt. Upon closing, we issued approximately 39 million shares of our common stock to SRC shareholders, reflecting issuance of0.158 of a share of our common stock in exchange for each share of SRC common stock held.
Liquidity
Available liquidity as of December 31, 2019 was $1.3 billion, primarily due to $1.3 billion available for borrowing under our revolving credit facility. In October 2019, as part of our semi-annual redetermination, the borrowingbase on our revolving credit facility was reaffirmed at $1.6 billion and we elected to retain our commitment amount at $1.3 billion.
41

Pursuant to closing the SRC Acquisition, the borrowing base on our revolving credit facility increased to $2.1 billion and we elected to increase the aggregate commitment amount under the facility to $1.7 billion. As part of theSRC Acquisition, we assumed $550 million in 6.25% Senior Notes due December 2025 and paid off and terminated SRC's revolving credit facility, which had an outstanding balance of $165 million at closing. The indenture governing theSRC Senior Notes has a change of control provision and on January 17, 2020, we commenced an offer to repurchase the SRC Senior Notes at 101 percent of the principal amount of the notes, together with any accrued and unpaid interestto the date of purchase. Upon expiration of the repurchase offer on February 18, 2020, holders of $447.7 million of the outstanding SRC Senior Notes accepted our redemption offer for a total redemption price of approximately $452.2million, plus accrued and unpaid interest of $6.2 million. We funded the repurchase with proceeds from our revolving credit facility.
Had we closed the SRC Acquisition in 2019 with our new commitment level, we estimate that our available liquidity as of December 31, 2019 would have been approximately $1.6 billion, comprised of approximately $66.6million of cash and cash equivalents and approximately $1.5 billion available for borrowing under our revolving credit facility.
Stock Repurchase Program
In April 2019, the Board approved the acquisition of up to $200 million of our outstanding common stock, dependent on market conditions (the "Stock Repurchase Program"). Effective with the closing of the SRC Acquisition, the
Board approved an increase and extension of the Stock Repurchase Program from $200 million to $525 million with a target completion date of December 31, 2021. Pursuant to the Stock Repurchase Program, we repurchased 4.7 millionshares of outstanding common stock at a cost of $154.4 million during 2019. Subsequent to December 31, 2019, we repurchased approximately 0.6 million shares of our outstanding common stock at a cost of $12.5 million. As ofFebruary 24, 2020, $358.2 million of our outstanding common stock remained available for repurchase under the Stock Repurchase Program.
Midstream Asset Divestitures
In the second quarter of 2019, we completed the Midstream Asset Divestitures for an aggregate cash purchase price of $345.6 million ($263.6 million of which was paid upon closing with $82.0 million to be paid in June 2020),subject to certain customary post-closing adjustments, plus potential future long-term incentive payments. We do not currently expect to meet the conditions to receive these incentive payments. Proceeds were allocated first to the assetssold based upon the fair values of the tangible assets, with $179.6 million allocated to the acreage dedication agreements.
42

2019 Drilling Overview
During 2019, we ran three drilling rigs in the Wattenberg Field through mid-September and then dropped to a two-rig pace through the remainder of the year. In the Delaware Basin, we ran three rigs through May 2019 and thendropped to a two-rig pace through the remainder of the year.
The following tables summarizes our drilling and completion activity for the year ended December 31, 2019:
Wells Operated by PDC
Wattenberg Field Delaware Basin Total
Gross Net Gross Net Gross Net
In-process as of December 31, 2018 133 122.4 18 17.4 151 139.8
Wells spud 126 117.0 33 31.7 159 148.7
Wells turned-in-line (114) (105.1) (21) (20.0) (135) (125.1)
In-process as of December 31, 2019 145 134.3 30 29.1 175 163.4
Wells Operated by Others
Wattenberg Field Delaware Basin Total
Gross Net Gross Net Gross Net
In-process as of December 31, 2018 5 2.0 6 0.9 11 2.9
Wells spud 55 4.4 3 0.4 58 4.8
Wells turned-in-line (19) (1.1) (9) (1.3) (28) (2.4)
In-process as of December 31, 2019 41 5.3 — — 41 5.3
Our in-process wells represent wells that are in the process of being drilled and/or have been drilled and are waiting to be fractured and/or for gas pipeline connection. Our drilled uncompleted wells are generally completed and
turned-in-line within a year of drilling.
2020 Operational and Financial Outlook
We anticipate that our total production for 2020 will range between 205,000 Boe to 215,000 Boe per day, approximately 78,000 Bbls to 82,000 Bbls of which are expected to be crude oil. Our planned 2020 capital investments incrude oil and natural gas properties, which we expect to be between $1.0 billion and $1.1 billion, are focused on continued execution of our development plans in the Wattenberg Field, including acreage received in the SRC Acquisition,and the Delaware Basin.
We believe that we maintain a degree of operational flexibility to control the pace of our capital spending. As we execute our capital investment program, we continually monitor, among other things, expected rates of return, thepolitical environment and our remaining inventory in order to best meet our short- and long-term corporate strategy. Should commodity pricing or the operating environment deteriorate, we may determine that an adjustment to ourdevelopment plan is appropriate.
Wattenberg Field. We are drilling in the horizontal Niobrara and Codell plays in the rural areas of the core Wattenberg Field, which is further delineated between the Kersey, Prairie and Plains development areas, as well as the mixof rural and municipal acreage received in the SRC Acquisition. Our 2020 capital investment program for the Wattenberg Field is approximately 75 percent of our expected total capital investments in crude oil and natural gas properties, ofwhich approximately 95 percent is expected to be invested in operated drilling and completion activity. The majority of the wells we plan to drill in 2020 in the Wattenberg Field are standard-reach lateral (“SRL”), mid-reach lateral(“MRL”) and extended-reach lateral (“XRL”) wells. In 2020, we anticipate spudding approximately 150 to 175 operated wells and turning-in-line approximately 200 to 225 operated wells. We expect to drill at a three-rig pace in 2020 withan average development cost per well of between $2.7 million and $4.5 million, depending upon the lateral length of the well. The remainder of the Wattenberg Field capital investment program is expected to be used for non-operateddrilling, land, capital workovers and facilities projects.
Delaware Basin. Our 2020 capital investment program for the Delaware Basin contemplates operating a single rig into the third quarter, with a second rig planned for the remainder of the year. Total capital investments in crude oil
and natural gas properties in the Delaware Basin for 2020 are expected to be approximately 25 percent of our total capital investments in crude oil and natural gas properties, of which approximately 90 percent is expected to be invested inoperated drilling and completion
43

activity. In 2020, we anticipate spudding approximately 15 to 20 operated wells and turn-in-line approximately 20 to 25 operated wells. The majority of the wells we plan to drill in 2020 in the Delaware Basin are MRL and XRL wells. Weexpect average development costs per well of between $9.5 million and $11.0 million, depending upon the lateral length of the well. We do not plan to drill any SRL wells in the Delaware Basin in 2020.
Financial Guidance. We are committed to our disciplined approach to managing our development plans. Based on our current production forecast for 2020 and assumed average NYMEX prices of $52.50 per Bbl of crude oil and$2.00 per Mcf of natural gas and an assumed average composite price of $11.00 per Bbl for NGLs, we expect 2020 adjusted cash flows from operations, a non-U.S. GAAP financial measure, to exceed our capital investments in crude oiland natural gas properties by approximately $250 million. Assuming consistent realization percentages, we estimate that for every:
• $2.50 change in the NYMEX crude oil price from $52.50, our adjusted cash flows from operations would increase or decrease by approximately $30 million;• $0.25 change in the NYMEX natural gas price from $2.00, our adjusted cash flows from operations would increase or decrease by approximately $20 million; and• $1.00 change in the composite price for NGLs from $11.00, our adjusted cash flows from operations would increase or decrease by approximately $20 million.
We may revise our 2020 capital investment program during the year as a result of, among other things, changes in commodity prices or our internal long-term outlook for commodity prices, requirements to hold acreage, the cost ofservices for drilling and well completion activities, drilling results, changes in our borrowing capacity, a significant change in cash flows, regulatory issues, requirements to maintain continuous activity on leaseholds or acquisition and/ordivestiture opportunities.
The following table provides projected financial guidance for 2020:
Low High
Operating Expenses
Lease operating expenses ($/Boe) $ 2.70 $ 2.90
Transportation, gathering and processing expenses ("TGP") ($/Boe) $ 0.95 $ 1.15
Production taxes (percent of crude oil, natural gas and NGL sales) 6.5% 7.5%
Estimated Price Realizations
Crude oil (percent of NYMEX, excluding TGP) 93% 97%
Natural gas (percent of NYMEX, excluding TGP) 50% 55%
NGLs ($/Bbl, excluding TGP) $ 10.00 $ 12.00
On a per unit basis and excluding transaction costs incurred related to the SRC Acquisition of approximately $30 million, we expect our general and administrative expense to be in the range of $1.90 to $2.10 per Boe for 2020.
Ballot Initiative Update
Certain interest groups in Colorado opposed to oil and natural gas development generally, and hydraulic fracturing in particular, have advanced various alternatives for ballot initiatives which would result in significantly limitingor preventing oil and natural gas development in the state. Proponents of such initiatives have begun the process of attempting to qualify six initiatives to appear on the ballot in November 2020. Five of the initiatives are focused onincreased setbacks, with differing distances and criteria, and one is focused on bonding requirements.
These initiatives will undergo a review by the Colorado Legislative Council, and will be the subject of other procedural requirements. If those requirements are satisfied, proponents of the initiatives can begin the process ofcollecting the signatures needed to qualify them for the November 2020 ballot. We do not know what the outcome of this process will be; however, a similar setback ballot initiative, Proposition 112, qualified for the ballot but failed to passin 2018.
Because approximately 81 percent of our proved reserves are located in Colorado, the risks we face with respect to these proposals, and possible similar future proposals, are greater than those of our competitors with moregeographically
44

diverse operations. We cannot predict the outcome of the potentially pending initiatives or possible future regulatory developments.
See Part I, Item1A, Risk Factors, for additional information regarding the ballot initiatives.
45

Results of Operations
Summary Operating Results
The following table presents selected information regarding our operating results:
Year Ended December 31,
Percent Change
2019 2018 2017 2019-2018 2018-2017
(dollars in millions, except per unit data) Production:
Crude oil (MBbls) 19,166 16,963 12,902 13.0 % 31.5 %
Natural gas (MMcf) 115,950 88,017 71,689 31.7 % 22.8 %
NGLs (MBbls) 10,923 8,527 6,981 28.1 % 22.1 %
Crude oil equivalent (MBoe) 49,414 40,160 31,830 23.0 % 26.2 %
Average Boe per day (Boe) 135,381 110,027 87,206 23.0 % 26.2 %
Crude Oil, Natural Gas and NGLs Sales: Crude oil $ 1,020.7 $ 1,038.0 $ 625.0 (1.7)% 66.1 %
Natural gas 151.0 163.2 158.3 (7.5)% 3.1 %
NGLs 135.6 188.8 129.8 (28.2)% 45.5 %
Total crude oil, natural gas and NGLs sales $ 1,307.3 $ 1,390.0 $ 913.1 (5.9)% 52.2 %
Net Settlements on Commodity Derivatives: Crude oil $ (18.3) $ (124.4) $ (2.7) (85.3)% *
Natural gas 0.7 13.9 23.3 (95.0)% (40.3)%
NGLs — (5.0) (7.3) * (31.5)%
Total net settlements on derivatives $ (17.6) $ (115.5) $ 13.3 (84.8)% *
Average Sales Price (excluding net settlements onderivatives):
Crude oil (per Bbl) $ 53.26 $ 61.19 $ 48.45 (13.0)% 26.3 %
Natural gas (per Mcf) 1.30 1.85 2.21 (29.7)% (16.3)%
NGLs (per Bbl) 12.41 22.14 18.59 (43.9)% 19.1 %
Crude oil equivalent (per Boe) 26.46 34.61 28.69 (23.5)% 20.6 %
Average Costs and Expenses (per Boe): Lease operating expenses $ 2.88 $ 3.26 $ 2.82 (11.7)% 15.6 %
Production taxes 1.63 2.25 1.91 (27.6)% 17.8 %
Transportation, gathering and processing expenses 0.94 0.93 1.04 1.1 % (10.6)%
General and administrative expense 3.27 4.25 3.78 (23.1)% 12.4 %
Depreciation, depletion and amortization 13.04 13.94 14.74 (6.5)% (5.4)%
Lease Operating Expenses by Operating Region (per Boe): Wattenberg Field $ 2.50 $ 2.99 $ 2.48 (16.4)% 20.6 %
Delaware Basin 4.15 4.14 5.16 0.2 % (19.8)%
Utica Shale (1) — 3.46 1.66 * 108.4 %
* Percentage change is not meaningful.
Amounts may not recalculate due to rounding.
(1) In March 2018, we completed the disposition of our Utica Shale properties.
46

Crude Oil, Natural Gas and NGLs Sales
The year-over-year change in crude oil, natural gas and NGLs sales revenue were primarily due to the following:
Year Ended December 31,
2019 2018
(in millions)
Change in: Production $ 239.6 $ 261.6
Average crude oil price (152.0) 216.1
Average natural gas price (64.0) (31.1)
Average NGLs price (106.3) 30.3
Total change in crude oil, natural gas and NGLs sales revenue $ (82.7) $ 476.9
Crude Oil, Natural Gas and NGLs Production
The following table presents crude oil, natural gas and NGLs production.
Year Ended December 31, Percent Change
Production by Operating Region 2019 2018 2017 2019-2018 2018-2017
Crude oil (MBbls) Wattenberg Field 14,489 12,809 10,922 13.1% 17.3 %
Delaware Basin 4,677 4,108 1,699 13.9% 141.8 %
Utica Shale (1) — 46 281 * (83.6)%
Total 19,166 16,963 12,902 13.0% 31.5 %
Natural gas (MMcf) Wattenberg Field 91,785 68,326 60,106 34.3% 13.7 %
Delaware Basin 24,165 19,277 9,410 25.4% 104.9 %
Utica Shale (1) — 414 2,173 * (80.9)%
Total 115,950 88,017 71,689 31.7% 22.8 %
NGLs (MBbls) Wattenberg Field 8,198 6,455 5,876 27.0% 9.9 %
Delaware Basin 2,725 2,038 917 33.7% 122.2 %
Utica Shale (1) — 34 188 * (81.9)%
Total 10,923 8,527 6,981 28.1% 22.1 %
Crude oil equivalent (MBoe) Wattenberg Field 37,984 30,652 26,815 23.9% 14.3 %
Delaware Basin 11,430 9,359 4,184 22.1% 123.7 %
Utica Shale (1) — 149 831 * (82.1)%
Total 49,414 40,160 31,830 23.0% 26.2 %
Average crude oil equivalent per day (Boe) Wattenberg Field 104,066 83,978 73,466 23.9% 14.3 %
Delaware Basin 31,315 25,641 11,463 22.1% 123.7 %
Utica Shale (1) — 408 2,277 * (82.1)%
Total 135,381 110,027 87,206 23.0% 26.2 %
* Percentage change is not meaningful.
Amounts may not recalculate due to rounding.
(1) In March 2018, we completed the disposition of our Utica Shale properties.
47

The following table presents our crude oil, natural gas and NGLs production ratio by operating region:
Year Ended December 31,
Production Ratio by Operating Region 2019 2018 2017
Wattenberg Field Crude oil 38% 42% 41%
Natural gas 40% 37% 37%
NGLs 22% 21% 22%
Total 100% 100% 100%
Delaware Basin Crude oil 41% 44% 41%
Natural gas 35% 34% 37%
NGLs 24% 22% 22%
Total 100% 100% 100%
Utica Shale (1) Crude oil —% 31% 34%
Natural gas —% 46% 43%
NGLs —% 23% 23%
Total —% 100% 100%
(1) In March 2018, we completed the disposition of our Utica Shale properties.
Midstream Capacity
Our ability to market our production depends substantially on the availability, proximity and capacity of gathering systems, pipelines and processing facilities owned and operated by third parties. If adequate midstream facilitiesand services are not available to us on a timely basis and at acceptable costs, our production and results of operations could be adversely affected. In recent years, there has been substantial development drilling in our current areas ofoperation, and this has made it more challenging for providers of midstream infrastructure and services to keep pace with the corresponding increases in field-wide production. The ultimate timing and availability of adequate infrastructureis not within our control and we could experience capacity constraints for extended periods of time that could negatively impact our ability to meet our production targets. Weather, regulatory developments and other factors also affect theadequacy of midstream infrastructure. Like other producers, we from time to time enter into volume commitments with midstream providers in order to incentivize them to provide increased capacity to sufficiently meet our projectedvolume growth from our areas of operation. If our production falls below the level required under these agreements, we could be subject to transportation charges or aid in construction payments for commitment shortfalls. Wattenberg Field. Elevated line pressures on gas gathering facilities operated by DCP have adversely affected production from our Wattenberg Field operations from mid-2017 to the early fourth quarter of 2019. However,beginning in the mid-fourth quarter of 2019, through the combination of DCP’s continued system expansions and the availability of additional NGLs takeaway capacity out of the basin, DCP was able to more meaningfully reduce linepressures through most of our operated areas of the Wattenberg Field. As a result of the decreased line pressures, we experienced increased production volumes in the Wattenberg Field in the fourth quarter of 2019 from incremental NGLtakeaway expansion projects and increased firm residue gas space obtained by DCP. As we exited 2019, DCP was able to utilize the full capacity of the O’Connor II plant.
As midstream development continues in the field, we anticipate having the ability to move additional volumes on DCP’s system with the start-up of the Cheyenne Connector residue pipeline planned for mid-second quarter of 2020and the completion of DCP in-basin infrastructure designed to deliver gas volumes to the Latham II plant, which is expected in mid-2020.
Our production in the Wattenberg Field is significantly dependent on DCP's gathering system, and this reliance increased considerably when we closed the SRC Acquisition. We continue to work with our midstream serviceproviders in an effort to ensure all of the existing in-basin infrastructure is fully utilized and that all options for system expansion are evaluated and implemented to the extent possible to accommodate projected future volume growth fromthe field.
48

NGL fractionation on the Gulf Coast and Conway continues to operate at or near full capacity and this could potentially impact the operation of gas plants in the Wattenberg Field. Our Wattenberg Field operations are notcurrently being impacted by NGL fractionation capacity constraints; however, limitations on downstream fractionation capacity could limit the ability of our service providers to adjust ethane and propane recoveries to optimize the plantproduct mix to maximize revenue. Additional fractionation capacity came online during 2019 and additional capacity is expected to become available throughout 2020.
Delaware Basin. Our production from the Delaware Basin was not materially affected by midstream or downstream capacity constraints during 2019. However, despite the completion and start-up of a new natural gas residuepipeline, natural gas takeaway capacity downstream of in-field gathering and processing facilities in the basin continues to operate close to capacity and near-term production constraints, and lower natural gas netback pricing, are likelyuntil at least the first quarter of 2021, when the next natural gas residue pipeline out of the basin is scheduled to be commissioned.
As discussed above, NGL fractionation on the Gulf Coast and at Conway is running at or near full capacity, and this could potentially impact the operation of gas plants in the Delaware Basin. Two new crude oil pipelines out ofthe Permian Basin were recently completed and are now operational. As a result, we believe the crude oil takeaway constraints that were experienced in 2018 and early 2019 have been somewhat alleviated for the near future.
49

Crude Oil, Natural Gas and NGLs Pricing
Our results of operations depend upon many factors. Key factors include market prices of crude oil, natural gas and NGLs and our ability to market our production effectively. Crude oil, natural gas and NGLs prices have a highdegree of volatility and our realizations can change substantially. Our realized sales prices for crude oil, natural gas and NGLs decreased during 2019 as compared to 2018. NYMEX average daily crude oil and NYMEX first-of-the-monthnatural gas prices decreased 12 percent and 15 percent, respectively, as compared to 2018.
The following tables present weighted-average sales prices of crude oil, natural gas and NGLs for the periods presented:
Year Ended December 31, Weighted-Average Realized Sales Price byOperating Region Percent Change
(excluding net settlements on derivatives) 2019 2018 2017 2019-2018 2018-2017
Crude oil (per Bbl) Wattenberg Field $ 52.99 $ 61.14 $ 48.48 (13.3)% 26.1 %
Delaware Basin 54.08 61.37 48.68 (11.9)% 26.1 %
Utica Shale (1) — 58.10 45.63 * 27.3 %
Weighted-average price 53.26 61.19 48.45 (13.0)% 26.3 %
Natural gas (per Mcf) Wattenberg Field 1.49 1.90 2.19 (21.6)% (13.2)%
Delaware Basin 0.57 1.66 2.26 (65.7)% (26.5)%
Utica Shale (1) — 2.68 2.40 * 11.7 %
Weighted-average price 1.30 1.85 2.21 (29.7)% (16.3)%
NGLs (per Bbl) Wattenberg Field 11.51 20.58 17.75 (44.1)% 15.9 %
Delaware Basin 15.12 27.06 22.64 (44.1)% 19.5 %
Utica Shale (1) — 24.29 25.06 * (3.1)%
Weighted-average price 12.41 22.14 18.59 (43.9)% 19.1 %
Crude oil equivalent (per Boe) Wattenberg Field 26.31 34.13 28.55 (22.9)% 19.5 %
Delaware Basin 26.95 36.25 29.80 (25.7)% 21.6 %
Utica Shale (1) — 30.98 27.36 * 13.2 %
Weighted-average price 26.46 34.61 28.69 (23.5)% 20.6 %
* Percentage change is not meaningful.
Amounts may not recalculate due to rounding.
(1) In March 2018, we completed the disposition of our Utica Shale properties. Crude oil, natural gas and NGLs revenues are recognized when we transfer control of crude oil, natural gas or NGLs production to the purchaser. We consider the transfer of control to occur when the purchaser has the ability to
direct the use of, and obtain substantially all of the remaining benefits from, the crude oil, natural gas or NGLs production. We record sales revenue based on an estimate of the volumes delivered at estimated prices as determined by theapplicable sales agreement. We estimate our sales volumes based on company-measured volume readings. We then adjust our crude oil, natural gas and NGLs sales in subsequent periods based on the data received from our purchasers thatreflects actual volumes delivered and prices received.
Our crude oil, natural gas and NGLs sales are recorded using either the “net-back” or "gross" method of accounting, depending upon the related purchase agreement. We use the net-back method when control of the crude oil,natural gas or NGLs has been transferred to the purchasers of these commodities that are providing transportation, gathering or processing services. In these situations, the purchaser pays us based on a percent of proceeds or a sales pricefixed at index less specified deductions. The net-back method results in the recognition of a net sales price that is lower than the index on which the production is based because the operating costs and profit of the midstream facilities areembedded in the net price we are paid. We use the gross method of accounting when control of the crude oil, natural gas or NGLs is not transferred to the purchaser and the purchaser does not provide transportation, gathering or processingservices as a function of the price we receive. Rather, we contract separately with midstream providers for the applicable transportation and processing on a per unit basis. Under this
50

method, we recognize revenues based on the gross selling price and recognize transportation, gathering and processing expenses.
As discussed above, we enter into agreements for the sale and transportation, gathering and processing of our production, the terms of which can result in variances in the per unit realized prices that we receive for our crude oil,natural gas and NGLs. Information related to the components and classifications in the consolidated statements of operations is shown below. For crude oil, the average NYMEX prices shown below are based on average daily pricesthroughout each month and, for natural gas, the average NYMEX pricing is based on first-of-the-month index prices, as in each case this is the method used to sell the majority of these commodities pursuant to terms of the relevant salesagreements. For NGLs, we use the NYMEX crude oil price as a reference for presentation purposes. The average realized price both before and after transportation, gathering and processing expenses shown in the table below representsour approximate composite per barrel price for NGLs.
2019
AverageNYMEX
Price
Average RealizedPrice Before
Transportation,Gathering and
ProcessingExpenses
Average RealizationPercentage Before
Transportation,Gathering and
Processing Expenses
AverageTransportation,Gathering and
ProcessingExpenses
Average RealizedPrice After
Transportation,Gathering and
ProcessingExpenses
AverageRealization
Percentage AfterTransportation,Gathering and
ProcessingExpenses
Crude oil (perBbl) $ 57.03 $ 53.26 93% $ 1.24 $ 52.02 91%Natural gas(per MMBtu) 2.63 1.30 49% 0.17 1.13 43%NGLs (perBbl) 57.03 12.41 22% 0.10 12.31 22%Crude oilequivalent(per Boe) 40.95 26.46 65% 0.90 25.56 62%
2018
AverageNYMEX
Price
Average RealizedPrice Before
Transportation,Gathering and
ProcessingExpenses
Average RealizationPercentage Before
Transportation,Gathering and
Processing Expenses
AverageTransportation,Gathering and
ProcessingExpenses
Average RealizedPrice After
Transportation,Gathering and
ProcessingExpenses
AverageRealization
Percentage AfterTransportation,Gathering and
ProcessingExpenses
Crude oil (perBbl) $ 64.77 $ 61.19 94% $ 0.94 $ 60.25 93%Natural gas(per MMBtu) 3.09 1.85 60% 0.22 1.63 53%NGLs (perBbl) 64.77 22.14 34% 0.21 21.93 34%Crude oilequivalent(per Boe) 47.87 34.61 72% 0.93 33.68 70%
2017
AverageNYMEX
Price
Average RealizedPrice Before
Transportation,Gathering and
ProcessingExpenses
Average RealizationPercentage Before
Transportation,Gathering and
Processing Expenses
AverageTransportation,Gathering and
ProcessingExpenses
Average RealizedPrice After
Transportation,Gathering and
ProcessingExpenses
AverageRealization
Percentage AfterTransportation,Gathering and
ProcessingExpenses
Crude oil (perBbl) $ 50.95 $ 48.45 95% $ 1.41 $ 47.04 92%Natural gas(per MMBtu) 3.11 2.21 71% 0.17 2.04 66%NGLs (perBbl) 50.95 18.59 36% 0.30 18.29 36%Crude oilequivalent(per Boe) 38.83 28.69 74% 1.04 27.65 71%
Our average realization percentages for crude oil in 2019 were consistent with those for 2018. The realization percentage for our natural gas sales decreased as compared to 2018, primarily due to widening of the basis betweenNYMEX and the indices upon which we sell our natural gas production. In the Delaware Basin, we experienced certain months during 2019 when the transportation, gathering and processing cost to deliver our natural gas to marketexceeded the price we received. The realization percentages for our NGLs sales also decreased as compared to 2018, primarily due to reductions in prices for the individual NGLs components for 2019 as compared to the same periods in2018. As noted above, average
51

NYMEX prices for both crude oil and natural gas during 2019 decreased as compared to 2018, resulting in lower average realizations. Based on our current pricing projections, we expect realizations in 2020 to decrease relative to 2019.
Commodity Price Risk Management
We use commodity derivative instruments to manage fluctuations in crude oil and natural gas prices, including fixed-price swaps, collars and basis protection swaps on a portion of our estimated crude oil and natural gasproduction. For our commodity swaps, we ultimately realize the fixed price value related to the swaps. See the footnote titled Commodity Derivative Financial Instruments to our accompanying consolidated financial statements includedelsewhere in this report for a summary of our derivative positions as of December 31, 2019.
Commodity price risk management, net, includes cash settlements upon maturity of our derivative instruments, as well as the change in fair value of unsettled commodity derivatives related to our crude oil and natural gasproduction.
Net settlements of commodity derivative instruments are based on the difference between the crude oil and natural gas index prices at the settlement date of our commodity derivative instruments compared to the respective strikeprices contracted for the settlement months that were established at the time we entered into the commodity derivative transaction. The net change in fair value of unsettled commodity derivatives is comprised of the net increase or decreasein the beginning-of-period fair value of commodity derivative instruments that settled during the period and the net change in fair value of unsettled commodity derivatives during the period or from inception of any new contracts enteredinto during the applicable period. The net change in fair value of unsettled commodity derivatives during the period is primarily related to shifts in the crude oil and natural gas forward curves and changes in certain differentials.
The following table presents net settlements and net change in fair value of unsettled derivatives included in commodity price risk management, net:
Year Ended December 31,
2019 2018 2017
(in millions)
Commodity price risk management gain (loss), net: Net settlements of commodity derivative instruments:
Crude oil fixed price swaps and collars $ (18.3) $ (139.7) $ (2.7)
Crude oil basis protection swaps — 15.2 —
Natural gas fixed price swaps and collars 8.8 (7.0) 19.5
Natural gas basis protection swaps (8.1) 21.0 3.8
NGLs fixed price swaps — (5.0) (7.3)
Total net settlements of commodity derivative instruments (17.6) (115.5) 13.3
Change in fair value of unsettled commodity derivative instruments: Reclassification of settlements included in prior period changes in fair value of commodity derivative instruments (81.1) 64.9 44.8
Crude oil fixed price swaps, collars and rollfactors (62.1) 197.0 (77.9)
Natural gas fixed price swaps and collars 0.1 1.4 14.7
Natural gas basis protection swaps (2.1) (2.6) 5.7
NGLs fixed price swaps — — (4.6)
Net change in fair value of unsettled commodity derivative instruments (145.2) 260.7 (17.3)
Total commodity price risk management gain (loss), net $ (162.8) $ 145.2 $ (4.0)
Lease Operating Expenses
Lease operating expenses increased nine percent to $142.2 million in 2019 compared to $131.0 million in 2018, primarily due to wells turned-in-line during 2019. Significant changes in lease operating expenses included increasesof $10.5 million related to produced water disposal expense, $4.7 related to additional compressor and equipment rental, $2.4 million related to expense for non-operated wells, $2.1 million for payroll and employee benefits related toincreases in headcount and $1.4 million related to chemical treatments. The increases were partially offset by decreases of $6.3 million related to workover projects and $4.7 million related to midstream expense resulting from the sale ofDelaware Basin midstream assets during the second quarter of 2019. Lease operating expense per Boe decreased by 12 percent to $2.88 for 2019 from $3.26 for 2018.
52

Production Taxes
Production taxes, which are comprised mainly of severance tax and ad valorem tax, are directly related to crude oil, natural gas and NGLs sales and are generally assessed as a percentage of net revenues. From time to time, thereare adjustments to the statutory rates for these taxes based upon certain credits that are determined by activity levels and relative commodity prices from year-to-year.
Production taxes decreased 11 percent to $80.8 million in 2019 compared to $90.4 million in 2018, primarily due to the six percent decrease in crude oil, natural gas and NGLs sales for 2019 compared to 2018, refunds of advalorem tax related to high-cost natural gas wells and a decrease in ad valorem tax rates in the Delaware Basin.
Transportation, Gathering and Processing Expenses
Transportation, gathering and processing expenses are primarily impacted by the volumes delivered through pipelines and for natural gas gathering and transportation operations. Transportation, gathering and processing expensesincreased 24 percent to $46.4 million in 2019 compared to $37.4 million in 2018, primarily due to an increase in production. Transportation, gathering and processing expenses per Boe remained consistent at $0.94 for 2019 compared to$0.93 for 2018.
Exploration, Geologic and Geophysical Expense
Geological and geophysical costs. Geological and geophysical costs of $4.1 million in 2019 compared to $6.2 million in 2018 were primarily for the purchase of seismic data related to unproved acreage in the Delaware Basin.
Impairment of Properties and Equipment The following table sets forth the major components of our impairment of properties and equipment:
Year Ended December 31, 2019 2018 2017
(in millions)
Impairment of proved and unproved properties $ 10.6 $ 458.4 $ 285.5
Amortization of individually insignificant unproved properties — — 0.4
Impairment of infrastructure and other 27.9 — —
Impairment of properties and equipment $ 38.5 $ 458.4 $ 285.9
During 2019 and 2018, we recorded impairment charges totaling $10.6 million and $458.4 million, respectively, related to the divestiture of leaseholds and then-current and anticipated near-term leasehold expirations within ournon-focus areas of the Delaware Basin that we determined not to develop. We determined the fair value of the properties based upon estimated future discounted cash flow, a Level 3 input, using estimated production and prices at which wereasonably expect the crude oil and natural gas will be sold. During 2019, we also recorded impairments of $27.9 million related to certain midstream facility infrastructure in the Delaware Basin. Upon closing of the Midstream AssetDivestitures, it was determined that the net book value of these assets was not recoverable.
General and Administrative Expense
General and administrative expense decreased five percent to $161.8 million in 2019 compared to $170.5 million in 2018. The decrease was primarily attributable to decreases of $17.9 million in legal-related fees and $8.2 millionin government relations costs. The decreases were partially offset by increases of $7.8 million in costs related to the SRC Acquisition, $6.0 million related to shareholder activism, $3.4 million for the allowance adjustment for royaltyowner payments and $1.0 million in payroll and related benefits.
53

Depreciation, Depletion and Amortization
Crude oil and natural gas properties. During 2019 and 2018, we invested $787.7 million and $982.7 million, exclusive of changes in accounts payable related to capital expenditures, in the development of our crude oil and naturalgas properties, respectively. DD&A expense related to crude oil and natural gas properties is directly related to proved reserves and production volumes. DD&A expense related to crude oil and natural gas properties was $638.5 million,$551.3 million and $462.5 million in 2019, 2018 and 2017, respectively. The year-over-year change in DD&A expense for 2019 compared to 2018 related to crude oil and natural gas properties was primarily due to the following:
Year Ended December 31,
2019
(in millions)
Increase in production $ 128.9
Decrease in weighted-average depreciation, depletion and amortization rates (41.7)
Total increase in DD&A expense related to crude oil and natural gas properties $ 87.2
The following table presents our per Boe DD&A expense rates for crude oil and natural gas properties:
Year Ended December 31,
Operating Region/Area 2019 2018 2017
(per Boe)
Wattenberg Field $ 11.82 $ 12.58 $ 14.67
Delaware Basin 16.87 17.70 14.89
Total weighted-average 13.04 13.73 14.53
Loss on sale of properties and equipment
In 2019, we exchanged acreage located in Reeves County, Texas with a third party. As additional consideration for the acreage acquired, we paid $2.7 million in cash and recognized a loss of $45.6 million based on the carryingvalue of the acreage sold.
Interest Expense
Interest expense increased by $0.4 million to $71.2 million in 2019 compared to $70.7 million in 2018. The increase was primarily related to a $4.2 million increase in interest related to our revolving credit facility, partially offsetby a $4.1 million increase in capitalized interest.
Interest costs capitalized in 2019 and 2018 were $13.4 million and $9.2 million, respectively.
Provision for Income Taxes
Current income tax benefit in 2019 and 2018 was $1.1 million and $0.7 million, respectively. Current income taxes generally relate to the cash that is paid or recovered for income taxes associated with the applicable period. Theremaining portion of the total income tax provision is comprised of deferred income taxes, which are a result of differences in the timing of deductions from our U.S. GAAP presentation of financial statements and the income taxregulations.
Our effective income tax rates for 2019 and 2018 were 5.5 percent and 72.8 percent, respectively, on income/(loss) from operations.
The 2019 rate differs from the federal statutory tax rate primarily due to state taxes, valuation allowance for state tax attributes, stock compensation detriments and nondeductible expenses that consist primarily of officers'compensation, acquisition costs and government lobbying expenses.
54

The 2018 rate differs from the federal statutory tax rate primarily due to state taxes, federal tax credits, valuation allowance for state tax attributes and nondeductible expenses that consist primarily of officers' compensation costand government lobbying expenses.
As of the date of this report, we are current with our income tax filings in all applicable state jurisdictions. The Internal Revenue Service ("IRS") partially accepted our 2018 tax return. The 2018 tax return is in the IRS ComplianceAssurance Program (the "CAP Program") post-filing review process, with no significant tax adjustments currently proposed. We continue to voluntarily participate in the IRS CAP Program for the 2019 and 2020 tax years.
Net Income (Loss)/Adjusted Net Income (Loss)
The factors resulting in changes in net income (loss) in 2019 and 2018 are discussed above. These same reasons similarly impacted adjusted net income (loss), a non-U.S. GAAP financial measure, with the exception of the netchange in fair value of unsettled derivatives, adjusted for taxes, of $110.0 million and $198.3 million in 2019 and 2018, respectively. Adjusted net income was $53.3 million in 2019 and adjusted net loss was $196.3 million in 2018. SeeReconciliation of Non-U.S. GAAP Financial Measures below for a more detailed discussion of these non-U.S. GAAP financial measures and a reconciliation of these measures to the most comparable U.S. GAAP measures. Financial Condition, Liquidity and Capital Resources
Our primary sources of liquidity are cash flows from operating activities, our revolving credit facility, proceeds raised in debt and equity capital market transactions and asset sales. In 2019, our net cash flows from operatingactivities were $858.2 million.
Our primary source of cash flows from operating activities is the sale of crude oil, natural gas and NGLs. Fluctuations in our operating cash flows are principally driven by commodity prices and changes in our productionvolumes. Commodity prices have historically been volatile and we manage a portion of this volatility through our use of derivative instruments. We enter into commodity derivative instruments with maturities of no greater than five yearsfrom the date of the instrument. Our revolving credit facility imposes limits on the amount of our production we can hedge, and we may choose not to hedge the maximum amounts permitted. Therefore, we may still have fluctuations inour cash flows from operating activities due to the remaining non-hedged portion of our future production.
We may use our available liquidity for operating activities, capital investments, working capital requirements, acquisitions and for general corporate purposes. We maintain a significant capital investment program to execute our
development plans, which requires capital expenditures to be made in periods prior to initial production from newly developed wells.
From time to time, these activities may result in a working capital deficit; however, we do not believe that our working capital deficit as of December 31, 2019 is an indication of a lack of liquidity. We had working capital deficitsof $57.2 million and $166.6 million at December 31, 2019 and December 31, 2018, respectively. We intend to continue to manage our liquidity position by a variety of means, including through the generation of cash flows fromoperations, investment in projects with favorable rates of return, protection of cash flows on a portion of our anticipated sales through the use of an active commodity derivative hedging program, utilization of the borrowing capacity underour revolving credit facility and, if warranted, capital markets transactions from time to time.
Our cash and cash equivalents were $1.0 million at December 31, 2019 and availability under our revolving credit facility was $1.3 billion, providing for total liquidity of $1.3 billion as of December 31, 2019. In October 2019, aspart of our semi-annual redetermination, the borrowing base on our revolving credit facility was reaffirmed at $1.6 billion and we elected to retain our commitment amount at $1.3 billion. Based on our current production forecast for 2020and assumed average NYMEX prices of $52.50 per Bbl of crude oil and $2.00 per Mcf of natural gas and an assumed average composite price of $11.00 per Bbl for NGLs, we expect 2020 adjusted cash flows from operations, a non-U.S.GAAP financial measure, to exceed our capital investments in crude oil and natural gas properties by approximately $250 million.
Pursuant to closing the SRC Acquisition, the borrowing base on our revolving credit facility increased to $2.1 billion and we elected to increase the aggregate commitment amount under the facility to $1.7 billion. Had we closedthe SRC Acquisition in 2019 with our new commitment level, we estimate that our available liquidity as of December 31, 2019 would have been approximately $1.6 billion, comprised of approximately $66.6 million of cash and cashequivalents and approximately $1.5 billion available for borrowing under our revolving credit facility.
55

In the second quarter of 2019, we completed the Midstream Asset Divestitures for an aggregate cash purchase price of $345.6 million ($263.6 million of which was paid upon closing with the remaining $82.0 million to be paid inJune 2020), subject to certain customary post-closing adjustments, plus potential future long-term incentive payments. We do not currently expect to meet the conditions to receive these incentive payments. Proceeds were allocated first tothe assets sold based upon the fair values of the tangible assets, with $179.6 million allocated to the acreage dedication agreements.We used the proceeds from these divestitures for our capital investment program.
As a result of merging with SRC, we assumed the SRC Senior Notes and paid off and terminated SRC's revolving credit facility. On January 17, 2020, we commenced an offer to repurchase the outstanding SRC Senior Notes at101 percent of the principal amount. Upon expiration of the repurchase offer on February 18, 2020, holders of $447.7 million of the outstanding SRC Senior Notes accepted our redemption offer for a total redemption price ofapproximately $452.2 million, plus accrued and unpaid interest of $6.2 million. We funded the repurchase with proceeds from our revolving credit facility.
In April 2019, the Board approved the acquisition of up to $200 million of our outstanding common stock, depending on market conditions. Pursuant to the Stock Repurchase Program, we repurchased 4.7 million shares ofoutstanding common stock at a cost of $154.4 million during 2019. Subsequent to December 31, 2019, we repurchased approximately 0.6 million shares of our outstanding common stock at a cost of $12.5 million. Additionally, in August2019, contingent on the closing of the SRC Acquisition, our Board approved an increase and extension to the Stock Repurchase Program from $200 million to $525 million with a target completion date of December 31, 2021. As ofFebruary 24, 2020, $358.2 million of our outstanding common stock remained available for repurchase under the Stock Repurchase Program.
We currently project that we will generate a sufficient level of cash flow through December 2021 to fund the Stock Repurchase Program, while maintaining the ability to pursue additional future return of capital programs,depending on market conditions. Repurchases under the Stock Repurchase Program can be made in open markets at our discretion and in compliance with safe harbor provisions, or in privately negotiated transactions. The StockRepurchase Program does not require any specific number of shares to be acquired, and can be modified or discontinued by the Board at any time.
Based on our expected cash flows from operations, our cash and cash equivalents and availability under our revolving credit facility, we believe that we will have sufficient capital available to fund our planned activities through
the 12-month period following the filing of this report.
Our revolving credit facility is available for working capital requirements, capital investments, acquisitions, to support letters of credit and for general corporate purposes. The borrowing base is primarily based on the loan valueassigned to the proved reserves attributable to our crude oil and natural gas interests. In August 2019, we entered into a First Amendment to the Restated Credit Agreement. The First Amendment primarily modifies certain sections of theRestated Credit Agreement to permit the consummation of the SRC Acquisition and provides for certain borrowings in connection with the SRC Acquisition.
The revolving credit facility contains covenants customary for agreements of this type, with the most restrictive being certain financial tests on a quarterly basis. The financial tests, as defined per the revolving credit facility,include requirements to: (i) maintain a minimum current ratio of 1.0:1.0 and (ii) not exceed a maximum leverage ratio of 4.0:1.0. At December 31, 2019, we were in compliance with all covenants in the revolving credit facility with acurrent ratio of 4.4:1.0 and a leverage ratio of 1.4:1.0. We expect to remain in compliance throughout the 12-month period following the filing of this report.
The indentures governing our 2024 Senior Notes, our 2026 Senior Notes and the SRC Senior Notes contain customary restrictive covenants that, among other things, limit our ability and the ability of our restricted subsidiaries to:(i) incur additional debt including under our revolving credit facility, (ii) make certain investments or pay dividends or distributions on our capital stock or purchase, redeem or retire capital stock, (iii) sell assets, including capital stock ofour restricted subsidiaries, (iv) restrict the payment of dividends or other payments by restricted subsidiaries to us, (v) create liens that secure debt, (vi) enter into transactions with affiliates and (vii) merge or consolidate with anothercompany.
56

Cash Flows
Operating Activities. Our net cash flows from operating activities are primarily impacted by commodity prices, production volumes, net settlements from our commodity derivative positions, operating costs and general andadministrative expenses. Cash flows from operating activities decreased by $31.1 million to $858.2 million in 2019 as compared to $889.3 million in 2018, primarily due to a decrease in crude oil, natural gas and NGLs sales of $82.7million and a decrease in changes in assets and liabilities of $48.1 million, primarily attributable to $95.5 million in deferred midstream gathering credits related to our Midstream Asset Divestitures. These changes were partially offset byan increase in commodity derivative settlements of $97.9 million.
Adjusted cash flows from operations, a non-U.S. GAAP financial measure, increased by $17.0 million in 2019 to $825.4 million from $808.4 million in 2018. The increase was primarily due to the factors mentioned above forchanges in cash flows provided by operating activities, without regard to timing of cash payments and receipts of assets and liabilities. Free cash flow, a non-U.S GAAP financial measure, increased by $212.0 million in 2019 to $37.7million from a free cash flow deficit of $174.3 million in 2018. The increase was due to the increase in adjusted cash flows from operations, combined with a decrease in capital investments in crude oil and natural gas properties.
See Reconciliation of Non-U.S. GAAP Financial Measures, below, for a more detailed discussion of these non-U.S. GAAP financial measures and a reconciliation of these measures to the most comparable U.S. GAAP measures. Investing Activities. Because crude oil and natural gas production from a well declines rapidly in the first few years of production, we need to continue to commit significant amounts of capital in order to maintain and grow our
production and replace our reserves. If capital is not available or is constrained in the future, we will be limited to our cash flows from operations and liquidity under our revolving credit facility as the sources for funding our capitalinvestments.
Cash flows from investing activities primarily consist of the acquisition, exploration and development of crude oil and natural gas properties, net of dispositions of crude oil and natural gas properties. Net cash used in investingactivities of $677.8 million during 2019 was primarily related to our drilling and completion activities of $855.9 million. Partially offsetting these investing activities was net cash received from the Midstream Asset Divestitures and certainDelaware Basin crude oil and natural gas properties of $199.4 million. Net cash used in investing activities of $1.1 billion during 2018 was primarily related to cash utilized toward property acquisitions of $180.0 million and our drillingand completion activities of $946.4 million. Partially offsetting these investments was the receipt of approximately $43.5 million, primarily related to the sale of our Utica Shale assets in March 2018.
Financing Activities. Net cash from financing activities in 2019 of $188.9 million was primarily due to the repurchase and retirement of shares of our common stock totaling $154.4 million pursuant to the Stock RepurchaseProgram, net borrowings from our credit facility of $28.5 million and $4.0 million related to purchases of our stock for employee stock-based compensation tax withholding obligations.
Net cash from financing activities in 2018 of $18.1 million was comprised of net borrowings from our credit facility of $32.5 million, partially offset by $7.7 million of debt issuance costs and $5.1 million related to purchases ofour stock.
57

Contractual Obligations and Contingent Commitments
The following table presents our contractual obligations and contingent commitments as of December 31, 2019:
Payments due by period
Less than 1-3 3-5 Contractual Obligations and Contingent Commitments Total 1 year years years Thereafter
(in millions)
Long-term liabilities reflected on the consolidated balance sheet (1) Long-term debt (2) $ 1,204 $ — $ 200 $ 404 $ 600
Commodity derivative contracts (3) 4 3 1 — —
Production tax liability 144 76 68 — —
Deferred oil gathering credit 20 2 5 4 9
Deferred midstream gathering credits 176 7 23 29 117
Asset retirement obligations 127 32 30 30 35
Operating and finance leases 22 6 11 3 2
Other liabilities (4) 4 — 2 1 1
1,701 126 340 471 764
Commitments, contingencies and other arrangements (5)
Interest on long-term debt (6) 386 67 130 120 69
Firm transportation and processing agreements (7) 581 85 207 147 142
967 152 337 267 211
Total $ 2,668 $ 278 $ 677 $ 738 $ 975
(1) Table does not include net deferred income tax liability to taxing authorities of $195.8 million due to the uncertainty surrounding the ultimate settlement of amounts and timing of these obligations.(2) Amount presented does not agree with the consolidated balance sheets in that it excludes $14.8 million of unamortized debt discounts and $12.0 million of unamortized debt issuance costs.(3) Represents our gross liability related to the fair value of derivative positions.(4) Includes deferred compensation to former executive officers and deferred payments related to firm transportation agreements.(5) The table does not include termination benefits related to employment agreements with our executive officers, due to the uncertainty surrounding the ultimate settlement of amounts and timing of these obligations.(6) Amounts presented include $241.5 million to the holders of our 2026 Senior Notes, $122.5 million to the holders of our 2024 Senior Notes and $4.5 million payable to the holders of our 2021 Convertible Notes. Amounts also include interest of $16.7 million
related to unutilized commitments at a rate of 0.375 percent per annum.(7) Represents our gross commitment which includes volumes produced by us and purchased from third parties and produced by other third-party working, royalty and overriding royalty interest owners whose volumes we market on their behalf.
From time to time, we are a party to various legal proceedings in the ordinary course of business. We are not currently a party to any litigation that we believe would have a materially adverse effect on our business, financialcondition, results of operations or liquidity. Information regarding our legal proceedings can be found in the footnote titled Commitments and Contingencies - Litigation and Legal Items to our consolidated financial statements includedelsewhere in this report.
Off-Balance Sheet Arrangements
At December 31, 2019, we had no off-balance sheet arrangements, as defined under SEC rules, which have or are reasonably likely to have a material current or future effect on our financial condition, revenues or expenses, resultsof operations, liquidity, capital investments or capital resources.
Critical Accounting Policies and Estimates
We have identified the following policies as critical to business operations and the understanding of our results of operations. This is not a comprehensive list of all of the accounting policies. In many cases, the accountingtreatment of a particular transaction is specifically dictated by U.S. GAAP, with no need for our judgment in the application. There are also areas in which our judgment in selecting available alternatives would not produce a materiallydifferent result. However, certain of our accounting policies are particularly important to the presentation of our financial position and results of operations and we may use significant judgment in their application. As a result, they aresubject to an inherent degree of uncertainty. In
58
applying those policies, we use our judgment to determine the appropriate assumptions to be used in the determination of certain estimates. Those estimates are based on historical experience, observation of trends in the industry andinformation available from other outside sources, as appropriate. For a more detailed discussion on the application of these and other accounting policies, see the footnote titled Summary of Significant Accounting Policies to ourconsolidated financial statements included elsewhere in this report.
Crude Oil and Natural Gas Properties. We account for our crude oil and natural gas properties under the successful efforts method of accounting. Costs of proved developed producing properties, successful exploratory wells anddevelopmental dry hole costs are capitalized and depleted by the unit-of-production method based on estimated proved developed producing reserves. Property acquisition costs are depleted on the unit-of-production method based onestimated proved reserves.
Annually, we engage independent petroleum engineers to prepare reserve and economic evaluations of all our properties on a well-by-well basis as of December 31. We adjust our crude oil and natural gas reserves for majoracquisitions, new drilling and divestitures during the year as needed. The process of estimating and evaluating crude oil and natural gas reserves is complex, requiring significant decisions in the evaluation of available geological,geophysical, engineering and economic data. The data for a given property may also change substantially over time as a result of numerous factors, including additional development activity, evolving production history and a continualreassessment of the viability of production under changing economic conditions. As a result, revisions in existing reserve estimates occur. Although every reasonable effort is made to ensure that reserve estimates reported represent ourmost accurate assessments possible, the subjective decisions and variances in available data for various properties increase the likelihood of significant changes in these estimates over time. Because estimates of reserves significantly affectour DD&A expense, a change in our estimated reserves could have an effect on our net earnings.
Exploration costs, including geological and geophysical expenses, the acquisition of seismic data covering unproved acreage and delay rentals, are charged to expense as incurred. Exploratory well drilling costs, including the costof stratigraphic test wells, are initially capitalized, but are charged to expense if the well is determined to be nonproductive. The status of each in-progress well is reviewed quarterly to determine the proper accounting treatment under thesuccessful efforts method of accounting. Exploratory well costs continue to be capitalized as long as the well has found a sufficient quantity of reserves to justify completion as a producing well and we are making sufficient progressassessing our reserves and economic and operating viability. If an in-progress exploratory well is found to be unsuccessful prior to the issuance of the financial statements, the costs incurred prior to the end of the reporting period arecharged to exploration expense. If we are unable to make a final determination about the productive status of a well prior to issuance of the financial statements, the well is classified as a "suspended well" until we have had sufficient timeto conduct additional completion or testing operations to evaluate the pertinent geological and engineering data obtained. At the time when we are able to make a final determination of a well’s productive status, the well is removed fromsuspended well status and the proper accounting treatment is applied.
Acquisition costs of unproved properties are capitalized when incurred until such properties are transferred to proved properties or charged to expense. Unproved crude oil and natural gas properties with individually significantacquisition costs are periodically assessed, and any impairment in value is charged to impairment of crude oil and natural gas properties. The amount of impairment recognized on unproved properties which are not individually significantis determined by amortizing the costs of such properties within appropriate fields based on our historical experience, acquisition dates and average lease terms, with the amortization recognized in impairment of properties and equipment.The valuation of unproved properties is subjective and requires us to make estimates and assumptions which, with the passage of time, may prove to be materially different from actual realizable values.
We assess our crude oil and natural gas properties for possible impairment annually, or upon a triggering event, by comparing carrying value to estimated undiscounted future net cash flows on a field-by-field basis using estimatedproduction and prices at which we reasonably estimate the commodities will be sold. Significant inputs and assumptions to the valuation of proved crude oil and natural gas properties include estimates of reserve volumes, future operatingand development costs, future commodity prices and estimated future cash flows. Any impairment in value is charged to impairment of properties and equipment. The estimates of future prices may differ from current market prices ofcrude oil and natural gas. Any downward revisions in estimates to our reserve quantities, expectations of falling commodity prices or rising operating costs could result in a triggering event, and therefore, a reduction in undiscounted futurenet cash flows and an impairment of our crude oil and natural gas properties. Although our cash flow estimates are based on the relevant information available at the time the estimates are made, estimates of future cash flows are, by nature,highly uncertain and may vary significantly from actual results.
Crude Oil, Natural Gas and NGLs Sales Revenue Recognition. Crude oil, natural gas and NGLs revenues are recognized when we have transferred control of crude oil, natural gas or NGLs production to the purchaser. Weconsider the
59
transfer of control to have occurred when the purchaser has the ability to direct the use of, and obtain substantially all of the remaining benefits from, the crude oil, natural gas or NGLs production. We record sales revenue based on anestimate of the volumes delivered at estimated prices as determined by the applicable sales agreement. We estimate our sales volumes based on company-measured volume readings. We then adjust our crude oil, natural gas and NGLs salesin subsequent periods based on the data received from our purchasers that reflects actual volumes delivered and prices received. We receive payment for sales one to two months after actual delivery has occurred. The differences in salesestimates and actual sales are recorded one to two months later. Historically, these differences have not been material.
Fair Value of Financial Instruments. Our fair value measurements are estimated pursuant to a fair value hierarchy that requires us to maximize the use of observable inputs and minimize the use of unobservable inputs whenmeasuring fair value. The valuation hierarchy is based upon the transparency of inputs to the valuation of an asset or liability as of the measurement date, giving the highest priority to quoted prices in active markets (Level 1) and thelowest priority to unobservable data (Level 3). In some cases, the inputs used to measure fair value might fall in different levels of the fair value hierarchy. The lowest level input that is significant to a fair value measurement in its entiretydetermines the applicable level in the fair value hierarchy. Assessing the significance of a particular input to the fair value measurement in its entirety requires judgment, considering factors specific to the asset or liability and may affect thevaluation of the assets and liabilities and their placement within the fair value hierarchy levels. The three levels of inputs that may be used to measure fair value are defined as:
Level 1 – Quoted prices (unadjusted) for identical assets or liabilities in active markets.
Level 2 – Inputs other than quoted prices included within Level 1 that are either directly or indirectly observable for the asset or liability, including quoted prices for similar assets or liabilities in active markets, quoted prices foridentical or similar assets or liabilities in inactive markets, inputs other than quoted prices that are observable for the asset or liability and inputs that are derived from observable market data by correlation or other means.
Level 3 – Unobservable inputs for the asset or liability, including situations where there is little, if any, market activity.
Commodity Derivative Financial Instruments. We measure the fair value of our commodity derivative instruments based on a pricing model that utilizes market-based inputs, including but not limited to the contractual price ofthe underlying position, current market prices, crude oil and natural gas forward curves, discount rates such as the LIBOR curve for a similar duration of each outstanding position, volatility factors and nonperformance risk.Nonperformance risk considers the effect of our credit standing on the fair value of commodity derivative liabilities and the effect of our counterparties' credit standings on the fair value of commodity derivative assets. Both inputs to themodel are based on published credit default swap rates and the duration of each outstanding commodity derivative position.
We validate our fair value measurement by corroborating the original source of inputs, monitoring changes in valuation methods and assumptions and through the review of counterparty statements and other supportingdocumentation.
Net settlements on our commodity derivative instruments are initially recorded to accounts receivable or payable, as applicable, and may not be received from or paid to counterparties to our commodity derivative contracts withinthe same accounting period. Such settlements typically occur the month following the maturity of the commodity derivative instrument. We have evaluated the credit risk of the counterparties holding our commodity derivative assets,which are primarily financial institutions who are also major lenders in our revolving credit facility, giving consideration to amounts outstanding for each counterparty and the duration of each outstanding commodity derivative position.Based on our evaluation, we have determined that the potential impact of nonperformance of our counterparties on the fair value of our commodity derivative instruments is not significant.
Deferred Income Tax Asset Valuation Allowance. Deferred income tax assets are recognized for deductible temporary differences, net operating loss carry-forwards and credit carry-forwards if it is more likely than not that the
tax benefits will be realized. To the extent a deferred tax asset is not expected to be realized under the preceding criteria, we establish a valuation allowance. The factors which we consider in assessing whether we will realize the value ofdeferred income tax assets involve judgments and estimates of both amount and timing. The judgments used in applying these policies are based on our evaluation of the relevant facts and circumstances as of the date of the financialstatements. Actual results may differ from those estimates.
Accounting for Business Combinations. We utilize the purchase method to account for acquisitions of businesses and assets. The value of the purchase consideration takes into account the degree to which the consideration isobjective and measurable such as cash consideration paid to a seller. With the issuance of equity, restrictions upon the sale of the issued stock are taken into consideration. Pursuant to purchase method accounting, we allocate the cost of theacquisition to assets acquired
60
and liabilities assumed based on fair values as of the acquisition date. The purchase price allocations are based on appraisals, discounted cash flows, quoted market prices and estimates by management. When appropriate, we reviewcomparable purchases and sales of crude oil and natural gas properties within the same regions and use that data as a basis for fair market value as such sales represent the amount at which a willing buyer and seller would enter into anexchange for such properties.
In estimating the fair values of assets acquired and liabilities assumed, we make various assumptions. The most significant assumptions relate to the estimated fair values assigned to proved developed producing, proved developednon-producing, proved undeveloped and unproved crude oil and natural gas properties. To estimate the fair values of these properties, we prepare estimates of crude oil and natural gas reserves. We estimate future prices by using theapplicable forward pricing strip to apply to our estimate of reserve quantities acquired, and estimates of future operating and development costs to arrive at an estimate of future net revenues. For estimated proved reserves, the future netrevenues are discounted using a market-based weighted-average cost of capital rate determined appropriate at the time of the acquisition. The market-based weighted-average cost of capital rate is subject to additional project-specificrisking factors. To compensate for the inherent risk of estimating and valuing unproved properties, we reduce the discounted future net revenues of probable and possible reserves by additional risk-weighting factors. Additionally, foracquisitions with significant unproved properties, we complete an analysis of comparable purchased properties to determine an estimation of fair value.
If applicable, we record deferred taxes for any differences between the assigned values and tax basis of assets and liabilities. Estimated deferred taxes are based on available information concerning the tax basis of assets acquiredand liabilities assumed and loss carryforwards at the acquisition date, although such estimates may change in the future as additional information becomes known.
Acreage Exchanges. From time to time, we enter into acreage exchanges in order to consolidate our core acreage positions, enabling us to have more control over the timing of development activities, achieve higher workinginterests and providing us the ability to drill longer lateral length wells within those core areas. We account for our nonmonetary acreage exchanges of non-producing interests and unproved mineral leases in accordance with the guidanceprescribed by Accounting Standards Codification 845, Nonmonetary Transactions. For those exchanges that lack commercial substance, we record the acreage received at the net carrying value of the acreage surrendered to obtain it. Forthose acreage exchanges that are deemed to have commercial substance, we record the acreage received at fair value, with a related gain or loss recognized in earnings, in accordance with Accounting Standards Codification 820, Fair ValueMeasurement.
Recent Accounting Standards
See the footnote titled Summary of Significant Accounting Policies - Recently Adopted Accounting Standards to our consolidated financial statements included elsewhere in this report.
Reconciliation of Non-U.S. GAAP Financial Measures
We use "adjusted cash flows from operations," "free cash flow (deficit)," "adjusted net income (loss)" and "adjusted EBITDAX," non-U.S. GAAP financial measures, for internal management reporting, when evaluating period-to-period changes and, in some cases, in providing public guidance on possible future results. In addition, we believe these are measures of our fundamental business and can be useful to us, investors, lenders and other parties in theevaluation of our performance relative to our peers and in assessing acquisition opportunities and capital expenditure projects. These supplemental measures are not measures of financial performance under U.S. GAAP and should beconsidered in addition to, not as a substitute for, net income (loss) or cash flows from operations, investing or financing activities and should not be viewed as liquidity measures or indicators of cash flows reported in accordance with U.S.GAAP. The non-U.S. GAAP financial measures that we use may not be comparable to similarly titled measures reported by other companies. In the future, we may disclose different non-U.S. GAAP financial measures in order to help usand our investors more meaningfully evaluate and compare our future results of operations to our previously reported results of operations. We strongly encourage investors to review our financial statements and publicly filed reports intheir entirety and to not rely on any single financial measure.
Adjusted cash flows from operations and free cash flow (deficit). We believe adjusted cash flows from operations can provide additional transparency into the drivers of trends in our operating cash flows, such as production,realized sales prices and operating costs, as it disregards the timing of settlement of operating assets and liabilities. We believe free cash flow (deficit) provides additional information that may be useful in an analysis of our ability togenerate cash to fund exploration and development activities and to return capital to stockholders.
We are unable to present a reconciliation of forward-looking free cash flow because components of the calculation, including fluctuations in working capital accounts, are inherently unpredictable. Moreover, estimating the mostdirectly
61

comparable GAAP measure with the required precision necessary to provide a meaningful reconciliation is extremely difficult and could not be accomplished without unreasonable effort. We believe that forward-looking estimates of freecash flow are important to investors because they assist in the analysis of our ability to generate cash from our operations in excess of capital investments in crude oil and natural gas properties.
Adjusted net income (loss). We believe that adjusted net income (loss) provides additional transparency into operating trends, such as production, realized sales prices, operating costs and net settlements on commodity derivativecontracts, because it disregards changes in our net income (loss) from mark-to-market adjustments resulting from net changes in the fair value of our unsettled commodity derivative contracts, and these changes are not directly reflective ofour operating performance.
Adjusted EBITDAX. We believe that adjusted EBITDAX provides additional transparency into operating trends because it reflects the financial performance of our assets without regard to financing methods, capital structure,accounting methods or historical cost basis. In addition, because adjusted EBITDAX excludes certain non-cash expenses, we believe it is not a measure of income, but rather a measure of our liquidity and ability to generate sufficient cashfor exploration, development, acquisitions and to service our debt obligations.
Beginning in the third quarter of 2019, we included a reconciling item for gains or losses on the sale of properties and equipment when calculating adjusted EBITDAX, thereby no longer including such gains or losses in ourreported adjusted EBITDAX. We believe this methodology for calculating adjusted EBITDAX will enable greater comparability to our peers, as well as consistent treatment of adjustments for impairment and gains or losses on the sale ofproperties and equipment. For comparability, all prior periods presented have been conformed to the aforementioned methodology.
PV-10. We define PV-10 as the estimated present value of the future net cash flows from our proved reserves before income taxes, discounted using a 10 percent discount rate. We believe that PV-10 provides useful information toinvestors as it is widely used by professional analysts and sophisticated investors when evaluating oil and gas companies. We believe that PV-10 is relevant and useful for evaluating the relative monetary significance of our reserves.Professional analysts, investors and other users of our financial statements may utilize the measure as a basis for comparison of the relative size and value of our reserves to other companies' reserves. Because there are many unique factorsthat can impact an individual company when estimating the amount of future income taxes to be paid, we believe the use of a pre-tax measure is valuable in evaluating us and our reserves. PV-10 is not intended to represent the currentmarket value of our estimated reserves.
62

The following table presents a reconciliation of each of our non-U.S. GAAP financial measures to its most comparable U.S. GAAP measure:
Year Ended December 31,
2019 2018 2017
(in millions)Cash flows from operations to adjusted cash flows from operationsand free cash flow (deficit):
Net cash from operating activities $ 858.2 $ 889.3 $ 597.8
Changes in assets and liabilities (32.8) (80.9) (15.7)
Adjusted cash flows from operations 825.4 808.4 582.1Capital expenditures for development of crude oil and natural gasproperties (855.9) (946.4) (737.2)
Change in accounts payable related to capital expenditures 68.2 (36.3) (50.8)
Free cash flow (deficit) $ 37.7 $ (174.3) $ (205.9)
Net income (loss) to adjusted net income (loss): Net income (loss) $ (56.7) 2.0 $ (127.5)
(Gain) loss on commodity derivative instruments 162.8 (145.2) 3.9
Net settlements on commodity derivative instruments (17.6) (115.5) 13.3
Tax effect of above adjustments (35.2) 62.4 (4.1)
Adjusted net income (loss) $ 53.3 $ (196.3) $ (114.4)
Net income (loss) to adjusted EBITDAX: Net income (loss) $ (56.7) $ 2.0 $ (127.5)
(Gain) loss on commodity derivative instruments 162.8 (145.2) 3.9
Net settlements on commodity derivative instruments (17.6) (115.5) 13.3
Non-cash stock-based compensation 23.8 21.8 19.4
Interest expense, net 71.1 70.3 76.4
Income tax expense (benefit) (3.3) 5.4 (211.9)
Impairment of properties and equipment 38.5 458.4 285.9
Impairment of goodwill — — 75.1
Exploration, geologic and geophysical expense 4.1 6.2 47.3
Depreciation, depletion and amortization 644.2 559.8 469.1
Accretion of asset retirement obligations 6.1 5.1 6.4
Loss on extinguishment of debt — — 24.7
(Gain) loss on sale of properties and equipment 9.7 0.4 (0.7)
Adjusted EBITDAX $ 882.7 $ 868.7 $ 681.4
Cash from operating activities to adjusted EBITDAX: Net cash from operating activities $ 858.2 $ 889.3 $ 597.8
Interest expense, net 71.1 70.3 76.4
Amortization of debt discount and issuance costs (13.6) (12.8) (12.9)
Exploration, geologic and geophysical expense 4.1 6.2 47.3
Exploratory dry hole expense — (0.1) (41.3)
Other (4.3) (3.3) 29.8
Changes in assets and liabilities (32.8) (80.9) (15.7)
Adjusted EBITDAX $ 882.7 $ 868.7 $ 681.4
PV-10: PV-10 $ 3,837.0 $ 5,321.3 $ 3,212.0
Present value of estimated future income tax discounted at 10% (526.7) (873.6) (331.9)
Standardized measure of discounted future net cash flows $ 3,310.3 $ 4,447.7 $ 2,880.1
63

ITEM 7A. QUANTITATIVE AND QUALITATIVE DISCLOSURES ABOUT MARKET RISK
Market-Sensitive Instruments and Risk Management
We are exposed to market risks associated with interest rate risks, commodity price risk and credit risk. We have established risk management processes to monitor and manage these market risks.
Interest Rate Risk
Changes in interest rates affect the amount of interest we earn on our interest bearing cash and cash equivalents and the interest we pay on borrowings under our revolving credit facility. Our 2021 Convertible Notes, 2024 SeniorNotes and 2026 Senior Notes have fixed rates and, therefore, near-term changes in interest rates do not expose us to risk of earnings or cash flow loss; however, near-term changes in interest rates may affect the fair value of our fixed-ratedebt.
As of December 31, 2019, our interest-bearing deposit accounts included money market accounts and checking accounts with various banks. The amount of our interest-bearing cash and cash equivalents as of December 31, 2019was $0.4 million, with a weighted-average interest rate of one percent. Based on a sensitivity analysis of our interest bearing deposits as of December 31, 2019 and assuming we had $0.4 million outstanding throughout the period, weestimate that a one percent increase in interest rates would not have a material impact on interest income for the twelve months ended December 31, 2019.
As of December 31, 2019, we had $4.0 million outstanding balance on our revolving credit facility. If market interest rates would have increased or decreased by one percent, our interest expense for the twelve months endedDecember 31, 2019 would have changed by approximately $0.3 million.
Commodity Price Risk
We are exposed to the potential risk of loss from adverse changes in the market price of crude oil, natural gas and NGLs. Pursuant to established policies and procedures, we manage a portion of the risks associated with thesemarket fluctuations using commodity derivative instruments. These instruments help us predict with greater certainty the effective crude oil, natural gas and propane prices we will receive for our hedged production. We believe that ourcommodity derivative policies and procedures are effective in achieving our risk management objectives.
Our realized prices vary regionally based on local market differentials and our transportation agreements. The following table presents average market index prices for crude oil and natural gas for the periods identified, as well asthe average sales prices we realized for our crude oil, natural gas and NGLs production:
Year Ended December 31,
2019 2018
Average NYMEX Index Price: Crude oil (per Bbl)
NYMEX $ 57.03 $ 64.77
Natural gas (per MMBtu) NYMEX $ 2.63 $ 3.09
Average Sales Price Realized: Excluding net settlements on commodityderivatives
Crude oil (per Bbl) $ 53.26 $ 61.19
Natural gas (per Mcf) 1.30 1.85
NGLs (per Bbl) 12.41 22.14
Based on a sensitivity analysis as of December 31, 2019, we estimate that a 10 percent increase in natural gas, crude oil prices and the propane portion of NGLs prices, inclusive of basis, over the entire period for which we havecommodity derivatives in place would have resulted in a decrease in the fair value of our derivative positions of $49.7 million, whereas a 10 percent decrease in prices would have resulted in an increase in fair value of $50.1 million.
64

Credit Risk
Credit risk represents the loss that we would incur if a counterparty fails to perform under its contractual obligations. We attempt to reduce credit risk by diversifying our counterparty exposure and entering into transactions withhigh-quality counterparties. When exposed to significant credit risk, we analyze the counterparties’ financial condition prior to entering into an agreement, establish credit limits and monitor the appropriateness of those limits on anongoing basis. We monitor the creditworthiness of significant counterparties through our credit committee, which utilizes a number of qualitative and quantitative tools to assess credit risk and takes mitigative actions if deemed necessary.While we believe that our credit risk analysis and monitoring procedures are reasonable, no amount of analysis can assure financial performance by our counterparties.
We primarily use financial institutions which are lenders in our revolving credit facility as counterparties for our derivative financial instruments. Disruption in the credit markets, changes in commodity prices and other factorsmay have a significant adverse impact on a number of financial institutions. To date, we have had no material counterparty default losses from our commodity derivative financial instruments. See the footnote titled Commodity DerivativeFinancial Instruments to our consolidated financial statements included elsewhere in this report for more detail on our commodity derivative financial instruments.
Our crude oil, natural gas and NGLs sales are concentrated with a few predominately large customers. This concentrates our credit risk exposure with a small number of large customers.
Disclosure of Limitations
Because the information above included only those exposures that existed at December 31, 2019, it does not consider those exposures or positions which could arise after that date. Our ultimate realized gain or loss with respect tointerest rate and commodity price fluctuations will depend on the exposures that arise during the period, our commodity price risk management strategies at the time and interest rates and commodity prices at the time.
65

ITEM 8. FINANCIAL STATEMENTS AND SUPPLEMENTARY DATA
Index to Consolidated Financial Statements, Financial Statement Schedule and Supplemental Information
Financial Statements: Report of Independent Registered Public Accounting Firm 67Consolidated Balance Sheets - December 31, 2019 and 2018 70Consolidated Statements of Operations - Years Ended December 31, 2019, 2018 and 2017 71Consolidated Statements of Cash Flows - Years Ended December 31, 2019, 2018 and 2017 72Consolidated Statements of Equity - Years Ended December 31, 2019, 2018 and 2017 73Notes to Consolidated Financial Statements 74
Supplemental Information - Unaudited: Crude Oil and Natural Gas Information 115Quarterly Financial Information 123
Financial Statement Schedule: Schedule II - Valuation and Qualifying Accounts - Years Ended December 31, 2019, 2018 and 2017 124
66

Report of Independent Registered Public Accounting Firm
To the Board of Directors and Stockholders of PDC Energy, Inc.
Opinions on the Financial Statements and Internal Control over Financial Reporting
We have audited the accompanying consolidated balance sheets of PDC Energy, Inc. and its subsidiaries (the “Company”) as of December 31, 2019 and 2018, and the related consolidated statements of operations, equity, and cashflows for each of the three years in the period ended December 31, 2019, including the related notes and financial statement schedule listed in the accompanying index (collectively referred to as the “consolidated financial statements”). Wealso have audited the Company's internal control over financial reporting as of December 31, 2019, based on criteria established in Internal Control - Integrated Framework (2013) issued by the Committee of Sponsoring Organizations ofthe Treadway Commission (COSO).
In our opinion, the consolidated financial statements referred to above present fairly, in all material respects, the financial position of the Company as of December 31, 2019 and 2018, and the results of its operations and its cashflows for each of the three years in the period ended December 31, 2019 in conformity with accounting principles generally accepted in the United States of America. Also in our opinion, the Company maintained, in all material respects,effective internal control over financial reporting as of December 31, 2019, based on criteria established in Internal Control - Integrated Framework (2013) issued by the COSO.
Change in Accounting Principle
As discussed in Note 2 to the consolidated financial statements, the Company changed the manner in which it accounts for leases in 2019.
Basis for Opinions
The Company's management is responsible for these consolidated financial statements, for maintaining effective internal control over financial reporting, and for its assessment of the effectiveness of internal control over financialreporting, included in Management’s Report on Internal Control over Financial Reporting appearing under Item 9A. Our responsibility is to express opinions on the Company’s consolidated financial statements and on the Company'sinternal control over financial reporting based on our audits. We are a public accounting firm registered with the Public Company Accounting Oversight Board (United States) (PCAOB) and are required to be independent with respect tothe Company in accordance with the U.S. federal securities laws and the applicable rules and regulations of the Securities and Exchange Commission and the PCAOB.
We conducted our audits in accordance with the standards of the PCAOB. Those standards require that we plan and perform the audits to obtain reasonable assurance about whether the consolidated financial statements are free ofmaterial misstatement, whether due to error or fraud, and whether effective internal control over financial reporting was maintained in all material respects.
Our audits of the consolidated financial statements included performing procedures to assess the risks of material misstatement of the consolidated financial statements, whether due to error or fraud, and performing procedures thatrespond to those risks. Such procedures included examining, on a test basis, evidence regarding the amounts and disclosures in the consolidated financial statements. Our audits also included evaluating the accounting principles used andsignificant estimates made by management, as well as evaluating the overall presentation of the consolidated financial statements. Our audit of internal control over financial reporting included obtaining an understanding of internal controlover financial reporting, assessing the risk that a material weakness exists, and testing and evaluating the design and operating effectiveness of internal control based on the assessed risk. Our audits also included performing such otherprocedures as we considered necessary in the circumstances. We believe that our audits provide a reasonable basis for our opinions.
Definition and Limitations of Internal Control over Financial Reporting
A company’s internal control over financial reporting is a process designed to provide reasonable assurance regarding the reliability of financial reporting and the preparation of financial statements for external purposes inaccordance with generally accepted accounting principles. A company’s internal control over financial reporting includes those policies and procedures that (i) pertain to the maintenance of records that, in reasonable detail, accurately andfairly reflect the transactions and dispositions of the assets of the company; (ii) provide reasonable assurance that transactions are recorded as necessary to permit preparation of financial statements in accordance with generally acceptedaccounting principles, and that receipts and
67

expenditures of the company are being made only in accordance with authorizations of management and directors of the company; and (iii) provide reasonable assurance regarding prevention or timely detection of unauthorized acquisition,use, or disposition of the company’s assets that could have a material effect on the financial statements.
Because of its inherent limitations, internal control over financial reporting may not prevent or detect misstatements. Also, projections of any evaluation of effectiveness to future periods are subject to the risk that controls maybecome inadequate because of changes in conditions, or that the degree of compliance with the policies or procedures may deteriorate.
Critical Audit Matters
The critical audit matters communicated below are matters arising from the current period audit of the consolidated financial statements that were communicated or required to be communicated to the audit committee and that (i)relate to accounts or disclosures that are material to the consolidated financial statements and (ii) involved our especially challenging, subjective, or complex judgments. The communication of critical audit matters does not alter in any wayour opinion on the consolidated financial statements, taken as a whole, and we are not, by communicating the critical audit matters below, providing separate opinions on the critical audit matters or on the accounts or disclosures to whichthey relate.
Impairment Assessment of Proved Crude Oil and Natural Gas Properties
As described in Notes 2 and 8 to the consolidated financial statements, as of December 31, 2019 the Company’s proved crude oil and natural gas properties were approximately $6,241.8 million. Upon a triggering event or at leastannually, the Company assesses its proved crude oil and natural gas properties for possible impairment by comparing the carrying value to estimated undiscounted future net cash flows on a field-by-field basis using estimated production,based upon prices at which the Company estimates the commodity will be sold. If net capitalized costs exceed undiscounted future net cash flows, the measurement of impairment is based on estimated fair value utilizing a futurediscounted cash flows analysis. Significant inputs and assumptions to the valuation of proved crude oil and natural gas properties include estimates of reserves volumes, future operating and development costs, future commodity prices, andestimated future cash flows. Management utilizes the services of independent petroleum engineers (management’s specialists) to estimate their proved crude oil and natural gas reserves.
The principal considerations for our determination that performing procedures relating to the valuation of proved crude oil and natural gas properties is a critical audit matter are there was significant judgment by management,including the use of management’s specialists, when developing the estimates of proved oil and natural gas reserves; which in turn led to a high degree of auditor judgment, effort, and subjectivity in performing procedures to evaluatemanagement’s estimated future cash flows and significant assumptions, including estimates of reserves volumes, future operating and development costs, and future commodity prices, as well as the significant input of interest and netrevenue interest inputs used in estimated future cash flows.
Addressing the matter involved performing procedures and evaluating audit evidence in connection with forming our overall opinion on the consolidated financial statements. These procedures included testing the effectiveness ofcontrols relating to the impairment assessment of proved crude oil and natural gas properties and the development of future cash flows. These procedures also included, among others, evaluating the completeness and accuracy of ownershiprecords, including inputs of interest and net revenue interests, and evaluating the significant assumptions and method used in the Company’s proved crude oil and natural gas impairment analysis. The work of management’s specialists wasused in performing the procedures to evaluate the reasonableness of the estimates of proved crude oil and natural gas reserves. As a basis for this work, the specialists’ qualifications and objectivity were understood, as well as the methodsand assumptions used by the specialists. The procedures performed also included tests of the data used by the specialists and an evaluation of the specialist’s findings. When evaluating the assumptions relating to the estimates of reservesvolumes, future operating and development costs, and future commodity prices, procedures performed included obtaining evidence related to the reasonableness of these assumptions, including whether the assumptions used werereasonable considering the past performance of the Company and whether the assumptions were consistent with evidence obtained in other areas of the audit.
Impairment Assessment of Unproved Crude Oil and Natural Gas Properties
As described in Notes 2 and 8 to the consolidated financial statements, unproved crude oil and natural gas properties with individually significant acquisition costs are periodically assessed for impairment. Unproved crude oil andnatural gas properties which are not individually significant are amortized, by field, based on historical experience, acquisition dates, and average lease terms. During the year ended December 31, 2019, the Company recorded impairmentcharges related to unproved crude oil and natural gas properties of $10.6 million, including those related to unproved crude oil and natural gas properties, primarily resulting from identified current and anticipated leasehold expirations andmanagement’s determination to no longer pursue plans to develop certain properties. As of December 31, 2019, the Company had approximately $403.4 million of unproved crude oil and natural gas properties.
68

The principal considerations for our determination that performing procedures relating to the impairment assessment of unproved crude oil and natural gas properties is a critical audit matter are there was a high degree of auditorsubjectivity and significant audit effort in performing procedures to test the completeness and accuracy of lease records, including leasehold expiration and evaluate plans to develop certain properties. As previously disclosed bymanagement, a material weakness existed during the year related to this matter.
Addressing the matter involved performing procedures and evaluating audit evidence in connection with forming our overall opinion on the consolidated financial statements. These procedures included testing the effectiveness ofcontrols relating to the impairment of unproved crude oil and natural gas properties, including the completeness and accuracy of lease records. These procedures also included, among others, evaluating the reasonableness of the Company’sunproved crude oil and natural gas impairment assessment by testing the completeness and accuracy of the lease records, including lease expirations, production data, and identification of dry holes. Procedures were also performed toevaluate the reasonableness of management’s plans to develop certain properties, including the Company’s approved capital budget and average cost to drill.
/s/PricewaterhouseCoopers LLP
Denver, ColoradoFebruary 26, 2020
We have served as the Company’s auditor since 2007.
69

PDC ENERGY, INC.Consolidated Balance Sheets
(in thousands, except share and per share data)
As of December 31, 2019 2018
Assets Current assets:
Cash and cash equivalents $ 963 $ 1,398
Accounts receivable, net 266,354 181,434
Fair value of derivatives 28,078 84,492
Prepaid expenses and other current assets 8,635 7,136
Total current assets 304,030 274,460
Properties and equipment, net 4,095,202 4,002,862
Assets held-for-sale, net — 140,705
Fair value of derivatives 3,746 93,722
Other assets 45,702 32,396
Total Assets $ 4,448,680 $ 4,544,145
Liabilities and Stockholders' Equity Liabilities
Current liabilities: Accounts payable $ 98,934 $ 181,864
Production tax liability 76,236 60,719
Fair value of derivatives 2,921 3,364
Funds held for distribution 98,393 105,784
Accrued interest payable 14,284 14,150
Other accrued expenses 70,462 75,133
Total current liabilities 361,230 441,014
Long-term debt 1,177,226 1,194,876
Deferred income taxes 195,841 198,096
Asset retirement obligations 95,051 85,312
Liabilities held-for-sale — 4,111
Fair value of derivatives 692 1,364
Other liabilities 283,133 92,664
Total liabilities 2,113,173 2,017,437
Commitments and contingent liabilities
Stockholders' equity
Common shares - par value $0.01 per share, 150,000,000 authorized, 61,652,412 and 66,148,609 issued as ofDecember 31, 2019 and 2018, respectively 617 661
Additional paid-in capital 2,384,309 2,519,423
Retained earnings (deficit) (47,945) 8,727
Treasury shares - at cost, 34,922 and 45,220 as of December 31, 2019 and 2018, respectively (1,474) (2,103)
Total stockholders' equity 2,335,507 2,526,708
Total Liabilities and Stockholders' Equity $ 4,448,680 $ 4,544,145
See accompanying Notes to Consolidated Financial Statements
70

PDC ENERGY, INC.Consolidated Statements of Operations
(in thousands, except per share data)
Year Ended December 31, 2019 2018 2017
Revenues Crude oil, natural gas and NGLs sales $ 1,307,275 $ 1,389,961 $ 913,084
Commodity price risk management gain (loss), net (162,844) 145,237 (3,936)
Other income 11,692 13,461 12,468
Total revenues 1,156,123 1,548,659 921,616
Costs, expenses and other Lease operating expenses 142,248 130,957 89,641
Production taxes 80,754 90,357 60,717
Transportation, gathering and processing expenses 46,353 37,403 33,220
Exploration, geologic and geophysical expense 4,054 6,204 47,334
General and administrative expense 161,753 170,504 120,370
Depreciation, depletion and amortization 644,152 559,793 469,084
Accretion of asset retirement obligations 6,117 5,075 6,306
Impairment of properties and equipment 38,536 458,397 285,887
Impairment of goodwill — — 75,121
(Gain) loss on sale of properties and equipment 9,734 394 (766)
Provision for uncollectible notes receivable — — (40,203)
Other expenses 11,317 11,829 13,157
Total costs, expenses and other 1,145,018 1,470,913 1,159,868
Income (loss) from operations 11,105 77,746 (238,252)
Loss on extinguishment of debt — — (24,747)
Interest expense (71,171) (70,730) (78,694)
Interest income 72 413 2,261
Income (loss) before income taxes (59,994) 7,429 (339,432)
Income tax (expense) benefit 3,322 (5,406) 211,928
Net income (loss) $ (56,672) $ 2,023 $ (127,504)
Earnings per share:
Basic $ (0.89) $ 0.03 $ (1.94)
Diluted $ (0.89) $ 0.03 $ (1.94)
Weighted-average common shares outstanding:
Basic 64,032 66,059 65,837
Diluted 64,032 66,303 65,837
See accompanying Notes to Consolidated Financial Statements
71

PDC ENERGY, INC.Consolidated Statements of Cash Flows
(in thousands)
Year Ended December 31, 2019 2018 2017
Cash flows from operating activities:
Net income (loss) $ (56,672) $ 2,023 $ (127,504)
Adjustments to net income (loss) to reconcile to net cash from operating activities:
Net change in fair value of unsettled commodity derivatives 145,246 (260,775) 17,260
Depreciation, depletion and amortization 644,152 559,793 469,084
Impairment of properties and equipment 38,536 458,397 285,887
Accretion of asset retirement obligations 6,117 5,075 6,306
Non-cash stock-based compensation 23,837 21,782 19,353
(Gain) loss on sale of properties and equipment 9,734 394 (766)
Amortization of debt discount and issuance costs 13,575 12,769 12,907
Deferred income taxes (2,256) 6,105 (203,685)
Impairment of goodwill — — 75,121
Exploratory dry hole costs — 113 41,297
Provision for uncollectible notes receivable — — (40,203)
Loss on extinguishment of debt — — 24,747
Other 3,155 2,763 2,265
Total adjustments to net income (loss) to reconcile to net cash from operating activities: 882,096 806,416 709,573
Changes in assets and liabilities:
Accounts receivable (88,304) 12,025 (60,546)
Other assets (11,560) (81) 3,364
Production tax liability 22,240 35,225 31,316
Accounts payable and accrued expenses (29,578) 16,261 31,378
Funds held for future distribution (7,298) 9,973 24,472
Asset retirement obligations (21,511) (13,341) (10,176)
Other liabilities 168,813 20,801 (4,064)
Total changes in assets and liabilities 32,802 80,863 15,744
Net cash from operating activities 858,226 889,302 597,813
Cash flows from investing activities:
Capital expenditures for development of crude oil and natural gas properties (855,908) (946,350) (737,208)
Capital expenditures for other properties and equipment (20,839) (11,055) (5,094)
Acquisition of crude oil and natural gas properties (13,207) (180,026) (15,628)
Proceeds from sale of properties and equipment 2,105 3,562 9,991
Proceeds from divestitures 202,076 44,693 —
Sale of promissory note — — 40,203
Restricted cash 8,001 1,249 (9,250)
Sale of short-term investments — — 49,890
Purchase of short-term investments — — (49,890)
Net cash from investing activities (677,772) (1,087,927) (716,986)
Cash flows from financing activities:
Proceeds from revolving credit facility 1,577,000 1,072,500 —
Repayment of revolving credit facility (1,605,500) (1,040,000) —
Proceeds from issuance of senior notes — — 592,366
Redemption of senior notes — — (519,375)
Payment of debt issuance costs (72) (7,704) (50)
Purchase of treasury shares (154,363) — —
Purchase of treasury shares for employee stock-based compensation tax withholding obligations (4,003) (5,147) (6,672)
Principal payments under financing lease obligations (1,952) (1,495) (1,168)
Other — (55) (103)
Net cash from financing activities (188,890) 18,099 64,998
Net change in cash, cash equivalents and restricted cash (8,436) (180,526) (54,175)
Cash, cash equivalents and restricted cash, beginning of year 9,399 189,925 244,100
Cash, cash equivalents and restricted cash, end of year $ 963 $ 9,399 $ 189,925
See accompanying Notes to Consolidated Financial Statements
72

PDC ENERGY, INC.Consolidated Statements of Equity
(in thousands, except share data)
Common Stock Treasury Stock
Shares Amount Additional Paid-in
Capital Shares Amount Retained Earnings Total Stockholders' Equity
Balances, January 1, 2017 65,704,568 $ 657 $ 2,489,557 (28,763) $ (1,668) $ 134,208 $ 2,622,754
Net loss — — — — — (127,504) (127,504)
Stock-based compensation 250,512 2 19,351 — — — 19,353Purchase of treasury shares for employee stock-based compensation tax withholdingobligations — — — (107,357) (6,672) — (6,672)
Issuance of treasury shares — — (5,517) 83,228 5,517 — —
Non-employee directors' deferred compensation plan — — — (3,035) (185) — (185)
Other — — (97) — — — (97)
Balances, December 31, 2017 65,955,080 $ 659 $ 2,503,294 (55,927) $ (3,008) $ 6,704 $ 2,507,649
Net income — — — — — 2,023 2,023
Stock-based compensation 193,529 2 21,780 — — — 21,782Purchase of treasury shares for employee stock-based compensation tax withholdingobligations — — — (102,647) (5,147) — (5,147)
Issuance of treasury shares — — (5,561) 104,068 5,561 — —
Non-employee directors' deferred compensation plan — — — 9,286 491 — 491
Other — — (90) — — — (90)
Balances, December 31, 2018 66,148,609 $ 661 $ 2,519,423 (45,220) $ (2,103) $ 8,727 $ 2,526,708
Net loss — — — — — (56,672) (56,672)
Stock-based compensation 213,745 2 23,835 — — — 23,837Purchase of treasury shares for employee stock-based compensation tax withholdingobligations — — — (106,151) (4,003) — (4,003)Retirement of treasury shares for employee stock-based compensation tax withholdingobligations (3,803) — (127) 3,803 127 — —
Purchase of treasury shares — — — (4,706,139) (154,363) — (154,363)
Retirement of treasury shares (4,706,139) (46) (154,317) 4,706,139 154,363 — —
Issuance of treasury shares — — (4,505) 112,646 4,505 — —
Balance, December 31, 2019 61,652,412 $ 617 $ 2,384,309 (34,922) $ (1,474) $ (47,945) $ 2,335,507
See accompanying Notes to Consolidated Financial Statements
73

PDC ENERGY, INC.NOTES TO CONSOLIDATED FINANCIAL STATEMENTS
NOTE 1 - NATURE OF OPERATIONS AND BASIS OF PRESENTATION
PDC Energy, Inc. is a domestic independent exploration and production company that acquires, explores and develops properties for the production of crude oil, natural gas and NGLs, with operations in the Wattenberg Field inColorado and the Delaware Basin in Texas. Our operations in the Wattenberg Field are focused in the horizontal Niobrara and Codell plays and our Delaware Basin operations are primarily focused in the Wolfcamp zones. We previouslyoperated properties in the Utica Shale in Southeastern Ohio; however, we divested these properties during the first quarter of 2018. As of December 31, 2019, we owned an interest in approximately 2,649 productive gross wells.
The accompanying audited consolidated financial statements include the accounts of PDC and our wholly-owned subsidiaries. Pursuant to the proportionate consolidation method, our accompanying consolidated financialstatements include our pro rata share of assets, liabilities, revenues and expenses of the entities which we proportionately consolidate. All material intercompany accounts and transactions have been eliminated in consolidation.
The preparation of our consolidated financial statements in accordance with U.S. GAAP requires us to make estimates and assumptions that affect the amounts reported in our consolidated financial statements and accompanyingnotes. Actual results could differ from those estimates. Estimates which are particularly significant to our consolidated financial statements include estimates of crude oil, natural gas and NGLs sales revenue; crude oil, natural gas andNGLs reserves; estimates of unpaid revenues and unbilled costs; future cash flows from crude oil and natural gas properties; valuation of commodity derivative instruments; exploratory dry hole costs; impairment of proved and unprovedproperties; impairment of goodwill; valuation and allocations of purchased and exchanged businesses and assets; and valuation of deferred income tax assets.
Certain immaterial reclassifications have been made to our prior period balance sheet to conform to the current period presentation. The reclassifications had no impact on previously reported results.
NOTE 2 - SUMMARY OF SIGNIFICANT ACCOUNTING POLICIES
Cash Equivalents. We consider all highly liquid investments with original maturities of three months or less to be cash equivalents.
Restricted Cash. At December 31, 2018, our total cash, cash equivalents and restricted cash of $9.4 million was comprised of $1.4 million of cash and cash equivalents and $8.0 million of restricted cash. We included restrictedcash in other assets at December 31, 2018. We did not have any restricted cash at December 31, 2019.
Commodity Derivative Financial Instruments. We are exposed to the effect of market fluctuations in the prices of crude oil, natural gas and NGLs. We employ established policies and procedures to manage a portion of the risksassociated with these market fluctuations using commodity derivative instruments. Our policy and our revolving credit facility prohibit the use of crude oil and natural gas derivative instruments for speculative purposes.
Derivative assets and liabilities are recorded on our consolidated balance sheets at fair value. We have elected not to designate any of our commodity derivative instruments as cash flow hedges. Accordingly, changes in the fairvalue of our commodity derivative instruments are recorded in the consolidated statements of operations. We have elected the normal purchase, normal sale exception for our crude oil and natural gas contracts; therefore, the effects of thesecontracts are not included in our derivative assets and liabilities. Classification of net settlements resulting from maturities and changes in fair value of unsettled commodity derivatives depends on the purpose of issuing or holding thederivative. The consolidated statements of cash flows reflects the net settlement of commodity derivative instruments in operating cash flows.
The calculation of the commodity derivative instrument's fair value is performed internally and, while we use common industry practices to develop our valuation techniques, changes in our pricing methodologies or theunderlying assumptions could result in significantly different fair values.
74

PDC ENERGY, INC.NOTES TO CONSOLIDATED FINANCIAL STATEMENTS - Continued
Properties and Equipment.
Crude Oil and Natural Gas Properties. We account for our crude oil and natural gas properties under the successful efforts method of accounting. Costs of proved developed producing properties, successful exploratory wells anddevelopmental dry hole costs are capitalized and depleted by the unit-of-production method, based on estimated proved developed producing reserves. Property acquisition costs are depleted on the unit-of-production method based onestimated proved reserves. We have determined that we have two unit-of-production fields: the Wattenberg Field and the Delaware Basin. In making these conclusions we consider the geographic concentration, operating similarities withinthe areas, geologic considerations and common cost environments in these areas. We calculate quarterly depreciation, depletion and amortization ("DD&A") expense by using our estimated prior period-end reserves as the denominator,with the exception of our fourth quarter where we use the year-end reserve estimate adjusted for fourth quarter production. Upon the sale or retirement of significant portions of or complete fields of depreciable or depletable property, thenet book value thereof, less proceeds or salvage value, is recognized as a gain or loss. Upon the sale of individual wells or an insignificant portion of a field, the proceeds are credited to accumulated DD&A.
Exploration costs, including geologic and geophysical expenses, seismic costs on unproved leaseholds and delay rentals are charged to expense as incurred. Exploratory well drilling costs, including the cost of stratigraphic test
wells, are initially capitalized, but charged to expense if the well is determined to be economically nonproductive. The status of each in-progress well is reviewed quarterly to determine the proper accounting treatment under the successfulefforts method of accounting. Exploratory well costs continue to be capitalized as long as we have found a sufficient quantity of reserves to justify completion as a producing well, we are making sufficient progress assessing our reservesand economic and operating viability or we have not made sufficient progress to allow for final determination of productivity. If an in-progress exploratory well is found to be economically unsuccessful prior to the issuance of the financialstatements, the costs incurred prior to the end of the reporting period are charged to exploration expense. If we are unable to make a final determination about the productive status of a well prior to issuance of the financial statements, thecosts associated with the well are classified as suspended well costs until we have had sufficient time to conduct additional completion or testing operations to evaluate the pertinent geological and engineering data obtained. At the time weare able to make a final determination of a well’s productive status, the well is removed from suspended well status and the resulting accounting treatment is recorded.
Proved Property Impairment. Annually, or upon a triggering event, we assess our producing crude oil and natural gas properties for possible impairment by comparing carrying value to estimated undiscounted future net cash flowson a field-by-field basis using estimated production and prices at which we reasonably estimate the commodities will be sold. Significant inputs and assumptions to the valuation of proved crude oil and natural gas properties includeestimates of reserve volumes, future operating and development costs, future commodity prices and estimated future cash flows. The estimates of future prices may differ from current market prices of crude oil, natural gas and NGLs.Certain events, including but not limited to downward revisions in estimates of our reserve quantities, expectations of falling commodity prices or rising operating costs, could result in a triggering event, and therefore a possible impairmentof our proved crude oil and natural gas properties. If carrying values exceed undiscounted future net cash flows, the measurement of impairment is based on estimated fair value utilizing a discounted future cash flows analysis. Theimpairment recorded is the amount by which the carrying values exceed fair value. Impairments are included in the consolidated statements of operations line item impairment of properties and equipment, with a corresponding impact onaccumulated DD&A.
Unproved Property Impairment. Acquisition costs of unproved properties are capitalized when incurred, until such properties are transferred to proved properties or charged to expense. Unproved crude oil and natural gasproperties with individually significant acquisition costs are periodically assessed for impairment. Unproved crude oil and natural gas properties which are not individually significant are amortized by field, based on our historicalexperience, acquisition dates and average lease terms. Impairment and amortization charges related to unproved crude oil and natural gas properties are charged to the consolidated statements of operations line item impairment ofproperties and equipment.
75

PDC ENERGY, INC.NOTES TO CONSOLIDATED FINANCIAL STATEMENTS - Continued
Other Property and Equipment. Other property and equipment such as pipelines, vehicles, facilities, office furniture and equipment, buildings and computer hardware and software is carried at cost. Depreciation is providedprincipally on the straight-line method over the assets' estimated useful lives, which range from two to 35 years. Total depreciation expense related to other property and equipment was $5.7 million, $8.5 million and $6.6 million in 2019,2018 and 2017, respectively.
We review these long-lived assets for impairment whenever events or changes in circumstances indicate that the carrying value of an asset may not be recoverable. Recoverability of assets to be held and used is measured by acomparison of the carrying value of the asset to estimated undiscounted future cash flows expected to be generated by the asset. If the carrying value of the asset exceeds the estimated future cash flows, an impairment charge is recognizedin the amount by which the carrying value of the asset exceeds the fair value of the asset. Impairment and amortization charges related to other property and equipment are charged to the consolidated statements of operations line itemimpairment of properties and equipment.
Maintenance and repair costs on other property and equipment are charged to expense as incurred. Major renewals and improvements are capitalized and depreciated over the remaining useful life of the asset. Upon the sale orother disposition of assets, the cost and related accumulated DD&A are removed, the proceeds are applied and any resulting gain or loss is recognized.
Internal-Use Software. Internal-use software costs incurred during the development stage of our ERP software are capitalized. The development stage generally includes software design, configuration, testing and installationactivities. Training and maintenance costs are expensed as incurred, while upgrades and enhancements are capitalized if it is probable that such expenditures will result in additional functionality. Capitalized internal-use software costs aredepreciated over the estimated useful life of the underlying project on a straight-line basis upon completion of the project. As of December 31, 2019 and December 31, 2018, our capitalized costs for internal-use software were $25.9million and $1.4 million, respectively.
Capitalized Interest. Interest costs are capitalized as part of the historical cost of acquiring assets. Investments in unproved crude oil and natural gas properties and major development projects, on which DD&A expense is notcurrently recorded and on which exploration or development activities are in progress, qualify for capitalization of interest. Major construction projects also qualify for interest capitalization until the asset is ready to be placed into service.Capitalized interest is calculated by multiplying our weighted-average interest rate on our outstanding debt by the qualifying costs. Interest capitalized may not exceed gross interest expense for the period. As the qualifying asset is placedinto service, we begin amortizing the related capitalized interest over the useful life of the asset. Capitalized interest totaled $13.4 million, $9.2 million and $5.0 million in 2019, 2018 and 2017, respectively.
Assets Held-for-Sale. Assets held-for-sale are valued at the lower of their carrying amount or estimated fair value, less costs to sell. If the carrying amount of the assets exceeds their estimated fair value, an impairment loss isrecognized. Fair values are estimated using accepted valuation techniques, such as a discounted cash flow model, earnings multiples or indicative bids, when available. Management considers historical experience and all availableinformation at the time the estimates are made; however, the fair value that is ultimately realized upon the sale of the assets to be divested may differ from the estimated fair values reflected in the consolidated financial statements. DD&Aexpense is not recorded on assets once they are classified as held-for-sale. Assets classified as held-for-sale are expected to be disposed of within one year.
Income Taxes. We account for income taxes under the asset and liability method. We recognize deferred tax assets and liabilities for the future tax consequences attributable to operating loss and credit carryforwards anddifferences between the financial statement carrying amounts of existing assets and liabilities and their respective tax basis. Deferred tax assets and liabilities are measured using enacted tax rates. The effect on deferred tax assets andliabilities of a change in tax rate is recognized in income in the period that includes the enactment date. If we determine that it is more likely than not that some portion or all of the deferred tax assets will not be realized, we record avaluation allowance, thereby reducing the deferred tax assets to what we consider realizable.
Debt Issuance Costs. Debt issuance costs are capitalized and amortized over the life of the respective borrowings using the effective interest method. Debt issuance costs for the 2021 Convertible Notes, the 2024 Senior Notes andthe 2026 Senior Notes are included in long-term debt and the debt issuance costs for the revolving credit facility are included in other assets.
Asset Retirement Obligations. We account for asset retirement obligations by recording the fair value of our plugging and abandonment obligations when incurred, which is at the time the related well is completed. Upon initialrecognition of an asset retirement obligation, we increase the carrying amount of the associated long-lived asset by the same amount as the liability. Over time, the liability is accreted for the change in the present value. The initialcapitalized cost, net of salvage value,
76

PDC ENERGY, INC.NOTES TO CONSOLIDATED FINANCIAL STATEMENTS - Continued
is depleted over the useful life of the related asset through a charge to DD&A expense. If the fair value of the estimated asset retirement obligation changes, an adjustment is recorded to both the asset retirement obligation and the assetretirement cost. Revisions in estimated liabilities can result from, among other things, changes in retirement costs or the estimated timing of settling asset retirement obligations.
Treasury Shares. We record treasury share purchases at cost, which includes incremental direct transaction costs. Amounts are recorded as a reduction in shareholders’ equity. When we retire treasury shares, we charge any excessof cost over the par value to additional paid-in-capital ("APIC"), to the extent we have amounts in APIC, with any remaining excess cost being charged to retained earnings.
Revenue Recognition. Crude oil, natural gas and NGLs revenues are recognized when we have transferred control of crude oil, natural gas or NGLs production to the purchaser. We consider the transfer of control to have occurredwhen the purchaser has the ability to direct the use of, and obtain substantially all of the remaining benefits from, the crude oil, natural gas or NGLs production. We record sales revenue based on an estimate of the volumes delivered atestimated prices as determined by the applicable sales agreement. We estimate our sales volumes based on company-measured volume readings. We then adjust our crude oil, natural gas and NGLs sales in subsequent periods based on thedata received from our purchasers that reflects actual volumes delivered and prices received. We receive payment for sales one to two months after actual delivery has occurred. The differences in sales estimates and actual sales arerecorded one to two months later. Historically, these differences have not been material. We account for natural gas imbalances using the sales method. For 2019, 2018 and 2017, the impact of any natural gas imbalances was not significant.
Our crude oil, natural gas and NGLs sales are recorded using either the “net-back” or "gross" method of accounting, depending upon the related agreement. We use the net-back method when control of the crude oil, natural gas orNGLs has been transferred to the purchasers of these commodities that are providing transportation, gathering or processing services. In these situations, the purchaser pays us proceeds based on a percent of the proceeds or have fixed oursales price at index less specified deductions. The net-back method results in the recognition of a net sales price that is lower than the index for which the production is based because the operating costs and profit of the midstream facilitiesare embedded in the net price we are paid.
We use the gross method of accounting when control of the crude oil, natural gas or NGLs is not transferred to the purchaser and the purchaser does not provide transportation, gathering or processing services as a function of theprice we receive. Rather, we contract separately with midstream providers for the applicable transport and processing on a per unit basis. Under this method, we recognize revenues based on the gross selling price and recognizetransportation, gathering and processing expenses.
Credit Risk and Allowance for Doubtful Accounts. Inherent to our industry is the concentration of crude oil, natural gas and NGLs sales to a limited number of customers. This concentration has the potential to impact our overallexposure to credit risk in that our customers may be similarly affected by changes in economic and financial conditions, commodity prices or other conditions. We record an allowance for doubtful accounts representing our best estimate ofprobable losses from our existing accounts receivable. In making our estimate, we consider, among other things, our historical write-offs and the overall creditworthiness of our customers.
Accounting for Business Combinations. We utilize the purchase method to account for acquisitions of businesses. Pursuant to purchase method accounting, we allocate the cost of the acquisition to assets acquired and liabilitiesassumed based upon respective fair values as of the acquisition date. The purchase price allocations are based upon appraisals, discounted cash flows, quoted market prices and estimates by management, which are Level 3 inputs. Whenappropriate, we review comparable purchases and sales of crude oil and natural gas properties within the same regions and use that data as a basis for fair market value; for example, the amount at which a willing buyer and seller wouldenter into an exchange for such properties.
In estimating the fair values of assets acquired and liabilities assumed, we make various assumptions. The most significant assumptions relate to the estimated fair values assigned to proved developed producing, proved developednon-producing, proved undeveloped and unproved crude oil and natural gas properties. To estimate the fair value of these properties, we prepare estimates of crude oil and natural gas reserves. We estimate future prices by using theapplicable forward pricing strip to apply to our estimate of reserve quantities acquired and estimates of future operating and development costs to arrive at an estimate of future net revenues. For estimated proved reserves, the future netrevenues are discounted using a market-based weighted-average cost of capital rate determined appropriate at the time of the acquisition. The market-based weighted-average cost of capital rate is subject to additional project-specific riskfactors. To compensate for the inherent risk of estimating and valuing unproved properties, we reduce the discounted future net revenues of probable and possible reserves by
77

PDC ENERGY, INC.NOTES TO CONSOLIDATED FINANCIAL STATEMENTS - Continued
additional risk-weighting factors. Additionally, for acquisitions with significant unproved properties, we complete an analysis of comparable purchased properties to determine an estimation of fair value.
If applicable, we record deferred taxes for any differences between the assigned values and tax basis of assets and liabilities, except goodwill. Estimated deferred taxes are based on available information concerning the tax basis ofassets acquired and liabilities assumed and loss carryforwards at the acquisition date, although such estimates may change in the future as additional information becomes known.
Acreage Exchanges. From time to time, we enter into acreage exchanges in order to consolidate our core acreage positions, enabling us to have more control over the timing of development activities, achieve higher workinginterests and providing us the ability to drill longer lateral length wells within those core areas. We account for our nonmonetary acreage exchanges of non-producing interests and unproved mineral leases in accordance with the guidanceprescribed by Accounting Standards Codification 845, Nonmonetary Transactions. For those exchanges that lack commercial substance, we record the acreage received at the net carrying value of the acreage surrendered to obtain it. Forthose acreage exchanges that are deemed to have commercial substance, we record the acreage received at fair value, with a related gain or loss recognized in earnings, in accordance with Accounting Standards Codification 820, Fair ValueMeasurement.
Stock-Based Compensation. Stock-based compensation is recognized in our financial statements based on the grant-date fair value of the equity instrument awarded. Stock-based compensation expense is recognized in thefinancial statements on a straight-line basis over the requisite service period for the entire award and we account for forfeitures of stock-based compensation awards as they occur. To the extent compensation cost relates to employeesdirectly involved in crude oil and natural gas exploration and development activities or the development of internal-use software, such amounts may be capitalized to properties and equipment. Amounts not capitalized to properties andequipment are recognized in the related cost and expense line item in the consolidated statements of operations.
Recently Adopted Accounting Standards.
In February 2016, the Financial Accounting Standards Board ("FASB") issued an accounting update and subsequent amendments aimed at increasing the transparency and comparability among organizations by recognizing leaseassets and liabilities on the balance sheet and disclosing key information about related leasing arrangements (the “New Lease Standard”). For leases with terms of more than 12 months, the accounting update requires lessees to recognize aright-of-use ("ROU") asset and lease liability for its right to use the underlying asset and the corresponding lease obligation. As provided by practical expedients, we made accounting policy elections to not recognize ROU assets and leaseliabilities that arise from short-term leases and to not separate lease and non-lease components for any class of underlying asset. The FASB issued an accounting update which provides an optional transition practical expedient for theadoption of the New Lease Standard that, if elected, permits an organization to not evaluate the accounting for existing land easements that are not accounted for under the previous lease accounting standard. We elected this practicalexpedient, and accordingly, existing land easements at December 31, 2018 were not assessed. All new or modified land easements entered into after January 1, 2019 are evaluated under the New Lease Standard. The New Lease Standarddoes not apply to leases of mineral rights to explore for or use crude oil and natural gas. Adoption of the New Lease Standard resulted in increases to other assets of $20.1 million, other accrued expenses of $4.6 million and other liabilitiesof $15.5 million at January 1, 2019, with no adjustment to the opening balance of retained earnings.
78

PDC ENERGY, INC.NOTES TO CONSOLIDATED FINANCIAL STATEMENTS - Continued
NOTE 3 - ACQUISITION In January 2020, we merged with SRC in a transaction valued at $1.7 billion, inclusive of SRC's net debt. Upon closing, we issued approximately 39 million shares of our common stock to SRC shareholders and holders of SRC
equity awards, reflecting the issuance of 0.158 of a share of our common stock in exchange for each outstanding share of SRC common stock and the cancellation of outstanding SRC equity awards pursuant to the terms of the MergerAgreement. We expect to account for the SRC Acquisition under the acquisition method of accounting for business combinations and are currently in the process of determining preliminary estimated acquisition date fair values ofidentifiable assets acquired and liabilities assumed. During 2019, we recorded transaction costs related to the SRC Acquisition of $7.3 million, which are included in general and administrative expense.
As result of closing the SRC Acquisition, the borrowing base on our revolving credit facility increased to $2.1 billion and we elected to increase the aggregate commitment amount under our revolving credit facility to $1.7 billion.As part of the SRC acquisition, we assumed the SRC Senior Notes and paid off and terminated SRC's revolving credit facility, which had an outstanding balance of $165.0 million at closing. The indenture governing the SRC Senior Noteshas a change of control provision pursuant to which, if a “Change of Control” occurs, the issuer is required to make an offer to repurchase the SRC Senior Notes at a price equal to 101 percent of the principal amount of the notes, togetherwith any accrued and unpaid interest to the date of purchase. It was determined that the SRC Acquisition did result in a "Change of Control", and on January 17, 2020, we commenced an offer to repurchase the outstanding SRC SeniorNotes. Upon expiration of the repurchase offer on February 18, 2020, holders of $447.7 million of the outstanding SRC Senior Notes accepted our redemption offer for a total redemption price of approximately $452.2 million, plus accruedand unpaid interest of $6.2 million. We funded the repurchase with proceeds from our revolving credit facility.
Additionally, in August 2019, effective upon on the closing of the SRC Acquisition, our Board approved an increase and extension to the Stock Repurchase Program from $200 million to $525 million with a target completion dateof December 31, 2021.
79

PDC ENERGY, INC.NOTES TO CONSOLIDATED FINANCIAL STATEMENTS - Continued
NOTE 4 - REVENUE RECOGNITION
On January 1, 2018, we adopted the new accounting standard that was issued by the FASB to provide a single, comprehensive model to determine the measurement of revenue and timing of when it is recognized and all relatedamendments (the “New Revenue Standard”) using the modified retrospective method. The comparative information has not been restated and continues to be reported under the accounting standards in effect for those periods. Based uponour review, we determined that the adoption of the New Revenue Standard would have reduced our crude oil, natural gas and NGLs sales by approximately $11.3 million in 2017 with a corresponding decrease in transportation, gatheringand processing expenses and no impact on net earnings. To determine the impact on our crude oil, natural gas and NGLs sales and our transportation, processing and gathering expenses for 2018, we applied the new guidance to contractsthat were not completed as of December 31, 2017. The adoption of the New Revenue Standard has not significantly impacted our net income.
Disaggregated Revenue. The following table presents crude oil, natural gas and NGLs sales disaggregated by commodity and operating region for 2019, 2018 and 2017:
Year Ended December 31,Revenue by Commodity and OperatingRegion 2019 2018 2017 (1)
(in thousands)
Crude oil Wattenberg Field $ 767,760 $ 783,158 $ 529,562
Delaware Basin 252,929 252,107 82,677
Utica Shale (2) — 2,696 12,814
Total $ 1,020,689 $ 1,037,961 $ 625,053
Natural gas Wattenberg Field $ 137,143 $ 130,073 $ 131,792
Delaware Basin 13,877 32,010 21,251
Utica Shale (2) — 1,109 5,216
Total $ 151,020 $ 163,192 $ 158,259
NGLs Wattenberg Field $ 94,347 $ 132,820 $ 104,298
Delaware Basin 41,219 55,148 20,756
Utica Shale (2) — 840 4,718
Total $ 135,566 $ 188,808 $ 129,772
Revenue by Operating Region Wattenberg Field $ 999,250 $ 1,046,051 $ 765,652
Delaware Basin 308,025 339,265 124,684
Utica Shale (2) — 4,645 22,748
Total $ 1,307,275 $ 1,389,961 $ 913,084
(1) As we have elected the modified retrospective method of adoption for the New Revenue Standard, revenues for 2017
have not been restated. Such changes would not have been material.(2) In March 2018, we completed the disposition of our Utica Shale properties.
80

PDC ENERGY, INC.NOTES TO CONSOLIDATED FINANCIAL STATEMENTS - Continued
NOTE 5 - FAIR VALUE OF FINANCIAL INSTRUMENTS
Determination of Fair Value
Our fair value measurements are estimated pursuant to a fair value hierarchy that requires us to maximize the use of observable inputs and minimize the use of unobservable inputs when measuring fair value. The valuationhierarchy is based upon the transparency of inputs to the valuation of an asset or liability as of the measurement date, giving the highest priority to quoted prices in active markets (Level 1) and the lowest priority to unobservable data(Level 3). In some cases, the inputs used to measure fair value might fall in different levels of the fair value hierarchy. The lowest level input that is significant to a fair value measurement in its entirety determines the applicable level in thefair value hierarchy. Assessing the significance of a particular input to the fair value measurement in its entirety requires judgment, considering factors specific to the asset or liability, and may affect the valuation of the assets and liabilitiesand their placement within the fair value hierarchy levels. The three levels of inputs that may be used to measure fair value are defined as:
Level 1 – Quoted prices (unadjusted) for identical assets or liabilities in active markets.
Level 2 – Inputs other than quoted prices included within Level 1 that are either directly or indirectly observable for the asset or liability, including quoted prices for similar assets or liabilities in active markets, quoted prices foridentical or similar assets or liabilities in inactive markets, inputs other than quoted prices that are observable for the asset or liability and inputs that are derived from observable market data by correlation or other means.
Level 3 – Unobservable inputs for the asset or liability, including situations where there is little, if any, market activity.
Derivative Financial Instruments
We measure the fair value of our derivative instruments based upon a pricing model that utilizes market-based inputs, including, but not limited to, the contractual price of the underlying position, current market prices, crude oiland natural gas forward curves, discount rates such as the LIBOR curve for a similar duration of each outstanding position, volatility factors and nonperformance risk. Nonperformance risk considers the effect of our credit standing on thefair value of derivative liabilities and the effect of our counterparties' credit standings on the fair value of derivative assets. Both inputs to the model are based on published credit default swap rates and the duration of each outstandingderivative position.
We validate our fair value measurement by corroborating the original source of inputs, monitoring changes in valuation methods and assumptions, and through the review of counterparty statements and other supportingdocumentation.
Our crude oil and natural gas fixed-price swaps are included in Level 2. Our collars are included in Level 3. Our basis swaps are included in Level 2 and Level 3. The following table presents, for each applicable level within thefair value hierarchy, our derivative assets and liabilities, including both current and non-current portions, measured at fair value on a recurring basis:
As of December 31,
2019 2018
SignificantOther
ObservableInputs
(Level 2)
SignificantUnobservable
Inputs(Level 3) Total
SignificantOther
ObservableInputs
(Level 2)
SignificantUnobservable
Inputs(Level 3) Total
(in thousands)
Total assets $ 22,886 $ 8,938 $ 31,824 $ 118,521 $ 59,693 $ 178,214
Total liabilities (3,089) (524) (3,613) (3,364) (1,364) (4,728)
Net asset $ 19,797 $ 8,414 $ 28,211 $ 115,157 $ 58,329 $ 173,486
81

PDC ENERGY, INC.NOTES TO CONSOLIDATED FINANCIAL STATEMENTS - Continued
The following table presents a reconciliation of our Level 3 assets measured at fair value:
Year Ended December 31,
2019 2018 2017
(in thousands)
Fair value of Level 3 instruments, net asset (liability) beginning of period $ 58,329 $ (9,687) $ (9,574)Changes in fair value included in consolidated statements of operations lineitem:
Commodity price risk management gain (loss), net (41,749) 63,257 6,241
Settlements included in consolidated statements of operations line items: Commodity price risk management gain (loss), net (8,166) 4,759 (6,354)
Fair value of Level 3 instruments, net asset (liability) end of period $ 8,414 $ 58,329 $ (9,687)
Net change in fair value of Level 3 unsettled derivatives included inconsolidated statements of operations line item:
Commodity price risk management gain (loss), net $ (22,694) $ — $ (866)
Total $ (22,694) $ — $ (866)
The significant unobservable input used in the fair value measurement of our derivative contracts is the implied volatility curve, which is provided by a third-party vendor. A significant increase or decrease in the implied volatility,in isolation, would have a directionally similar effect resulting in a significantly higher or lower fair value measurement of our Level 3 derivative contracts. There has been no change in the methodology we apply to measure the fair valueof our Level 3 derivative contracts during the periods covered by the financial statements.
Non-Derivative Financial Assets and Liabilities
We utilize fair value on a nonrecurring basis to review our proved crude oil and natural gas properties for possible impairment when events and circumstances indicate a possible decline in the recoverability of the carrying value ofsuch assets. The fair value of the properties is determined based upon estimated future discounted cash flow, a Level 3 input, using estimated production and prices at which we reasonably expect the crude oil and natural gas will be sold.
The portion of our long-term debt related to our revolving credit facility approximates fair value due to the variable nature of related interest rates. We have not elected to account for the portion of our debt related to our senior
notes under the fair value option; however, we have determined an estimate of the fair values based on measurements of trading activity and broker and/or dealer quotes, respectively, which are published market prices, and therefore areLevel 2 inputs. The table below presents these estimates of the fair value of the portion of our long-term debt related to our senior notes and convertible notes as of December 31, 2019 and 2018:
As of December 31,
2019 2018
Estimated Fair
Value Percent of Par Estimated Fair
Value Percent of Par
(in millions)
Senior notes: 2021 Convertible Notes $ 188.6 94.3% $ 175.4 87.7%
2024 Senior Notes 409.2 102.3% 370.2 92.5%
2026 Senior Notes 599.4 99.9% 532.4 88.7%
The carrying value of the financial instruments included in current assets and current liabilities approximate fair value due to the short-term maturities of these instruments.
82

PDC ENERGY, INC.NOTES TO CONSOLIDATED FINANCIAL STATEMENTS - Continued
NOTE 6 - COMMODITY DERIVATIVE FINANCIAL INSTRUMENTS
Our results of operations and operating cash flows are affected by changes in market prices for crude oil, natural gas and NGLs. To manage a portion of our exposure to price volatility from producing crude oil and natural gas weenter into commodity derivative contracts to protect against price declines in future periods. While we structure these commodity derivatives to reduce our exposure to decreases in commodity prices, they also limit the benefit we mightotherwise receive from price increases.
We believe our commodity derivative instruments continue to be effective in achieving the risk management objectives for which they were intended. As of December 31, 2019, we had derivative instruments, which were
comprised of fixed-price swaps, collars and basis protection swaps, in place for a portion of our anticipated 2020 and 2021 production. Our commodity derivative contracts have been entered into at no upfront cost to us as we hedge ouranticipated production at the then-prevailing commodity market prices, without adjustment for premium or discount.
As of December 31, 2019, our derivative instruments were comprised of fixed-price swaps, collars and basis protection swaps.
• Fixed-price swaps are arrangements that guarantee a fixed price. If the index price is below the fixed contract price, we receive the market price from the purchaser and receive the difference between the index price and thefixed contract price from the counterparty. If the index price is above the fixed contract price, we receive the market price from the purchaser and pay the difference between the index price and the fixed contract price to thecounterparty;
• Collars contain a fixed floor price (put) and ceiling price (call). If the index price falls below the fixed put strike price, we receive the market price from the purchaser and receive the difference between the put strike price andindex price from the counterparty. If the index price exceeds the fixed call strike price, we receive the market price from the purchaser and pay the difference between the call strike price and index price to the counterparty. Ifthe index price is between the put and call strike price, no payments are due to or from the counterparty;
• Basis protection swaps are arrangements that guarantee a price differential for natural gas from a specified delivery point. For basis protection swaps, we receive a payment from the counterparty if the price differential isgreater than the stated terms of the contract and pay the counterparty if the price differential is less than the stated terms of the contract.
83

PDC ENERGY, INC.NOTES TO CONSOLIDATED FINANCIAL STATEMENTS - Continued
As of December 31, 2019, we had the following outstanding derivative contracts. When aggregating multiple contracts, the weighted-average contract price is shown.
Collars Fixed-Price Swaps
Commodity/ Index/Maturity Period
Quantity(Crude oil -
MBlsNatural Gas -
BBtu)
Weighted-Average
Contract Price
Quantity(Crude Oil -
MBblsGas and Basis-
BBtu)
Weighted-AverageContract
Price
Fair Value
December 31,2019 (1)
(in thousands) Floors Ceilings Crude Oil
NYMEX 2020 3,600 55.00 71.68 7,160 60.98 27,162
2021 — — — 3,200 55.76 3,054
Total Crude Oil 3,600 10,360 $ 30,216
Natural Gas NYMEX
2020 — — — 4,000 2.30 75
Dominion South 2020 — — — 14 2.54 —
Total Natural Gas — 4,014 $ 75
Basis Protection - Natural Gas CIG
2020 — $ — $ — 20,500 $ (0.62) $ (2,392)
Waha 2020 — — — 4,000 (1.40) 312
Total Basis Protection - Natural Gas — 24,500 $ (2,080)
Commodity Derivatives Fair Value $ 28,211
(1) Approximately 28.1 percent of the fair value of our commodity derivative assets and 14.5 percent of the fair value of our commodity derivative liabilities were measured using significant unobservable inputs (Level 3).
Subsequent to December 31, 2019, we entered into commodity derivative positions covering approximately 1,000 MBbls and 2,000 MBbls of crude oil production for 2020 and 2021, respectively. Additionally, we receivedcommodity derivative positions covering approximately 3,900 MBbls of crude oil production for 2020 as a result of the SRC Acquisition.
We have not elected to designate any of our derivative instruments as cash flow hedges; therefore, these instruments do not qualify for hedge accounting. Accordingly, changes in the fair value of our derivative instruments arerecorded in the consolidated statements of operations.
84

PDC ENERGY, INC.NOTES TO CONSOLIDATED FINANCIAL STATEMENTS - Continued
The following table presents the balance sheet location and fair value amounts of our derivative instruments as of December 31, 2019 and 2018:
Fair Value
Derivative Instruments: Consolidated Balance
Sheet Line Item 2019 2018
(in thousands)
Derivative assets: Current Commodity derivative contracts Fair value of derivatives $ 27,766 $ 84,492
Basis protection derivative contracts Fair value of derivatives 312 —
28,078 84,492
Non-current Commodity derivative contracts Fair value of derivatives 3,746 93,722
Total derivative assets $ 31,824 $ 178,214
Derivative liabilities: Current Commodity derivative contracts Fair value of derivatives $ 529 748
Basis protection derivative contracts Fair value of derivatives 2,392 2,616
2,921 3,364
Non-current Commodity derivative contracts Fair value of derivatives 692 1,364
Total derivative liabilities $ 3,613 $ 4,728
The following table presents the impact of our derivative instruments on our consolidated statements of operations:
Year Ended December 31,
Consolidated Statements of Operations Line Item 2019 2018 2017
(in thousands)
Commodity price risk management gain (loss), net Net settlements $ (17,598) $ (115,538) $ 13,324
Net change in fair value of unsettled derivatives (145,246) 260,775 (17,260)
Total commodity price risk management gain (loss), net $ (162,844) $ 145,237 $ (3,936)
Our financial derivative agreements contain master netting provisions that provide for the net settlement of contracts through a single payment in the event of early termination. We have elected not to offset the fair value positionsrecorded on our consolidated balance sheets.
The following table reflects the impact of netting agreements on gross derivative assets and liabilities:
As of December 31, 2019 Derivative
Instruments, Gross Effect of Master
Netting Agreements Derivative
Instruments, Net
(in thousands)
Asset derivatives: Derivative instruments, at fair value $ 31,824 $ (2,619) $ 29,205
Liability derivatives: Derivative instruments, at fair value $ 3,613 $ (2,619) $ 994
85

PDC ENERGY, INC.NOTES TO CONSOLIDATED FINANCIAL STATEMENTS - Continued
As of December 31, 2018 Derivative instruments, gross Effect of Master Netting Agreements Derivative Instruments, Net
(in thousands)
Asset derivatives: Derivative instruments, at fair value $ 178,214 $ (3,985) $ 174,229
Liability derivatives: Derivative instruments, at fair value $ 4,728 $ (3,985) $ 743
NOTE 7 - CONCENTRATION OF RISK
Accounts Receivable. The following table presents the components of accounts receivable, net of allowance for doubtful accounts:
As of December 31,
2019 2018
(in thousands)
Crude oil, natural gas and NGLs sales $ 149,758 $ 155,756
Joint interest billings 29,510 19,580Midstream asset divestitures deferredpayments 81,702 —
Derivative counterparties — 3,937
Other 12,860 6,542
Allowance for doubtful accounts (7,476) (4,381)
Accounts receivable, net $ 266,354 $ 181,434
Our accounts receivable primarily relate to sales of our crude oil, natural gas and NGLs production, receivable balances from other third parties that own working interests in the properties we operate and derivative counterparties.
For the years ended December 31, 2019 and 2018, amounts written off to allowance for doubtful accounts were not material. As of December 31, 2019 and December 31, 2018, four and three, respectively, of our customers represented 10percent or more of our crude oil, natural gas and NGLs accounts receivable balance.
Major Customers. The following table presents the individual customers constituting 10 percent or more of total revenues:
Year Ended December 31,
Customer 2019 2018 2017
Occidental Marketing, Inc. 20.0% —% —%
DCP Midstream, LP 17.0% 12.5% 19.6%
Mercuria Energy Trading, Inc. 16.0% —% —%
United Energy Trading, LLC 11.0% —% —%
Suncor Energy Marketing, Inc. —% —% 16.4%
Derivative Counterparties. We utilize commodity derivative instruments to manage a portion of our exposure to price volatility from producing crude oil, natural gas and NGLs. These arrangements expose us to credit risk ofnonperformance by our counterparties. We primarily use financial institutions who are also lenders under our revolving credit facility as counterparties to our commodity derivative contracts. To date, we have had no derivative counterpartydefault losses. We have evaluated the credit risk of our derivative assets from our counterparties using relevant credit market default rates, giving consideration to amounts outstanding for each counterparty and the duration of eachoutstanding derivative position. Based on our evaluation, we have determined that the potential impact of nonperformance of our current counterparties on the fair value of our derivative instruments is not significant at December 31, 2019.
86

PDC ENERGY, INC.NOTES TO CONSOLIDATED FINANCIAL STATEMENTS - Continued
Other Accrued Expenses. The following table presents the components of other accrued expenses:
As of December 31,
2019 2018
(in thousands)
Employee benefits $ 21,611 $ 25,811
Asset retirement obligations 32,200 25,598
Environmental expenses 2,256 3,038
Operating and finance leases 5,926 1,779
Other 8,469 18,907
Other accrued expenses $ 70,462 $ 75,133
Other Liabilities. The following table presents the components of other liabilities as of:
As of December 31,
2019 2018
(in thousands)
Production taxes $ 68,020 $ 61,310
Deferred oil gathering credits 20,100 22,710
Deferred midstream gathering credits 175,897 —
Operating and finance leases 15,779 2,900
Other 3,337 5,744
Other liabilities $ 283,133 $ 92,664
Deferred Oil Gathering Credits. In January 2018, we entered into an agreement that dedicates crude oil from the majority of our Wattenberg Field acreage to the midstream provider's gathering lines and extends the term of theagreement through December 2029. The payment is being amortized over the life of the agreement. Amortization charges related to this deferred oil gathering credit totaling approximately $2.0 million and $1.4 million for 2019 and 2018,respectively, are included as a reduction to transportation, gathering and processing expenses.
Deferred Midstream Gathering Credits. In May 2019, concurrent with the sale of our Delaware Basin produced water gathering and disposal midstream assets, we entered into an agreement with the purchaser which dedicates allof our water gathering and disposal volumes in the Delaware Basin via pipeline for a term of 15 years. We recorded a long-term deferred credit of $40.5 million attributable to the value of the dedication, which is being amortized using theunits-of-production basis. Amortization charges related to this deferred credit totaling $0.9 million for 2019 are included as a reduction to lease operating expenses and capital costs.
In May 2019, concurrent with the sale of our Delaware Basin crude oil gathering midstream assets, we entered into an agreement with the purchaser which provides us with gathering and transport for crude oil from dedicatedacreage within an area of mutual interest for a term of 15 years. We recorded a long-term deferred credit of $28.9 million attributable to the value of the dedication, which is being amortized on a units-of-production basis. Amortizationcharges related to this deferred credit totaling $0.5 million for 2019 are included as crude oil sales.
In June 2019, concurrent with the sale of our Delaware Basin natural gas gathering midstream assets, we entered into an agreement with the purchaser which provides us with gathering, processing and transportation of our naturalgas from certain dedicated leases for a term of 22 years. We recorded a long-term deferred credit of $110.2 million attributable to the value of the dedication, which is being amortized on a units-of-production basis. Amortization chargesrelated to this deferred credit totaling $2.0 million for 2019 are included as a reduction to transportation, gathering and processing expenses.
87
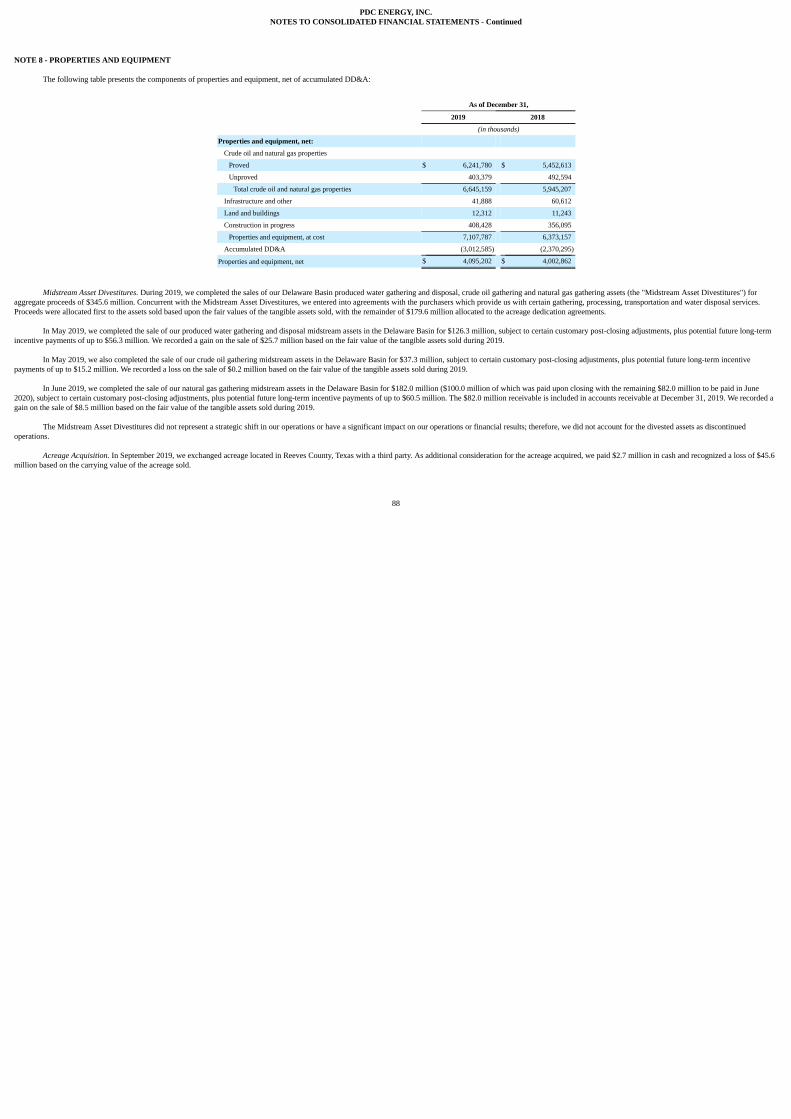
PDC ENERGY, INC.NOTES TO CONSOLIDATED FINANCIAL STATEMENTS - Continued
NOTE 8 - PROPERTIES AND EQUIPMENT
The following table presents the components of properties and equipment, net of accumulated DD&A:
As of December 31,
2019 2018
(in thousands)
Properties and equipment, net: Crude oil and natural gas properties
Proved $ 6,241,780 $ 5,452,613
Unproved 403,379 492,594
Total crude oil and natural gas properties 6,645,159 5,945,207
Infrastructure and other 41,888 60,612
Land and buildings 12,312 11,243
Construction in progress 408,428 356,095
Properties and equipment, at cost 7,107,787 6,373,157
Accumulated DD&A (3,012,585) (2,370,295)
Properties and equipment, net $ 4,095,202 $ 4,002,862
Midstream Asset Divestitures. During 2019, we completed the sales of our Delaware Basin produced water gathering and disposal, crude oil gathering and natural gas gathering assets (the "Midstream Asset Divestitures") foraggregate proceeds of $345.6 million. Concurrent with the Midstream Asset Divestitures, we entered into agreements with the purchasers which provide us with certain gathering, processing, transportation and water disposal services.Proceeds were allocated first to the assets sold based upon the fair values of the tangible assets sold, with the remainder of $179.6 million allocated to the acreage dedication agreements.
In May 2019, we completed the sale of our produced water gathering and disposal midstream assets in the Delaware Basin for $126.3 million, subject to certain customary post-closing adjustments, plus potential future long-termincentive payments of up to $56.3 million. We recorded a gain on the sale of $25.7 million based on the fair value of the tangible assets sold during 2019.
In May 2019, we also completed the sale of our crude oil gathering midstream assets in the Delaware Basin for $37.3 million, subject to certain customary post-closing adjustments, plus potential future long-term incentivepayments of up to $15.2 million. We recorded a loss on the sale of $0.2 million based on the fair value of the tangible assets sold during 2019.
In June 2019, we completed the sale of our natural gas gathering midstream assets in the Delaware Basin for $182.0 million ($100.0 million of which was paid upon closing with the remaining $82.0 million to be paid in June2020), subject to certain customary post-closing adjustments, plus potential future long-term incentive payments of up to $60.5 million. The $82.0 million receivable is included in accounts receivable at December 31, 2019. We recorded again on the sale of $8.5 million based on the fair value of the tangible assets sold during 2019.
The Midstream Asset Divestitures did not represent a strategic shift in our operations or have a significant impact on our operations or financial results; therefore, we did not account for the divested assets as discontinued
operations.
Acreage Acquisition. In September 2019, we exchanged acreage located in Reeves County, Texas with a third party. As additional consideration for the acreage acquired, we paid $2.7 million in cash and recognized a loss of $45.6million based on the carrying value of the acreage sold.
88
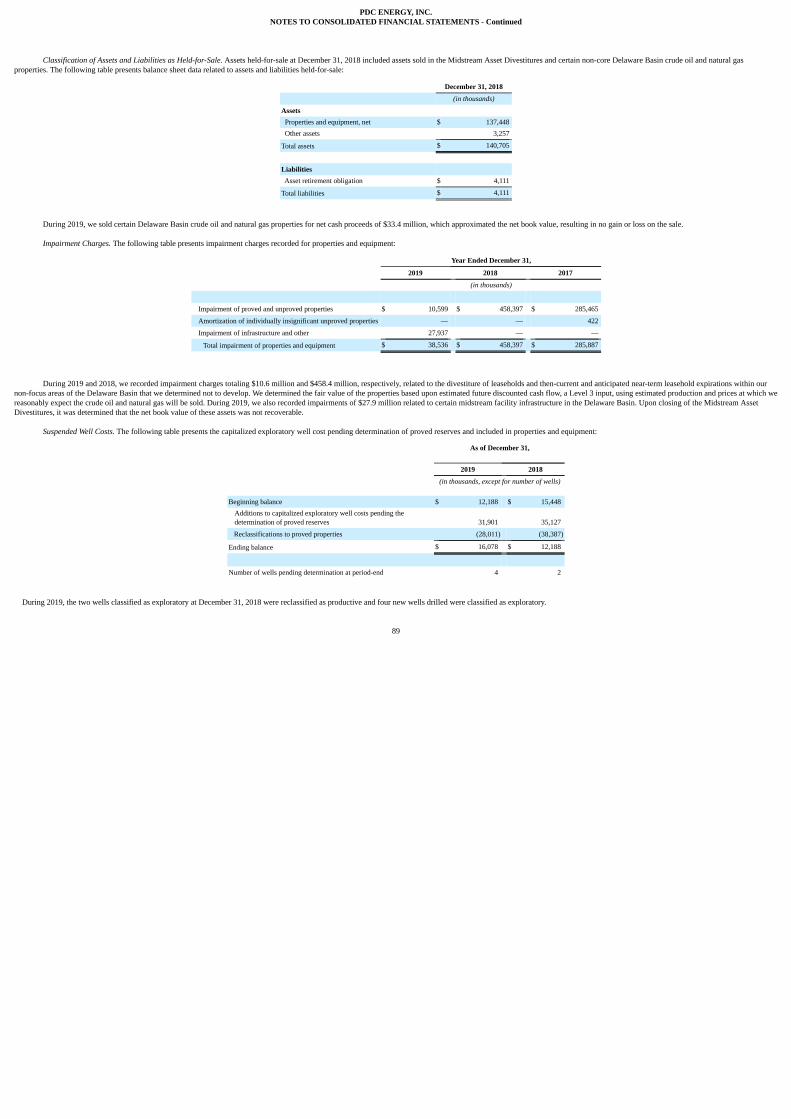
PDC ENERGY, INC.NOTES TO CONSOLIDATED FINANCIAL STATEMENTS - Continued
Classification of Assets and Liabilities as Held-for-Sale. Assets held-for-sale at December 31, 2018 included assets sold in the Midstream Asset Divestitures and certain non-core Delaware Basin crude oil and natural gasproperties. The following table presents balance sheet data related to assets and liabilities held-for-sale:
December 31, 2018
(in thousands)
Assets Properties and equipment, net $ 137,448 Other assets 3,257
Total assets $ 140,705
Liabilities Asset retirement obligation $ 4,111
Total liabilities $ 4,111
During 2019, we sold certain Delaware Basin crude oil and natural gas properties for net cash proceeds of $33.4 million, which approximated the net book value, resulting in no gain or loss on the sale.
Impairment Charges. The following table presents impairment charges recorded for properties and equipment:
Year Ended December 31,
2019 2018 2017
(in thousands)
Impairment of proved and unproved properties $ 10,599 $ 458,397 $ 285,465
Amortization of individually insignificant unproved properties — — 422
Impairment of infrastructure and other 27,937 — —
Total impairment of properties and equipment $ 38,536 $ 458,397 $ 285,887
During 2019 and 2018, we recorded impairment charges totaling $10.6 million and $458.4 million, respectively, related to the divestiture of leaseholds and then-current and anticipated near-term leasehold expirations within ournon-focus areas of the Delaware Basin that we determined not to develop. We determined the fair value of the properties based upon estimated future discounted cash flow, a Level 3 input, using estimated production and prices at which wereasonably expect the crude oil and natural gas will be sold. During 2019, we also recorded impairments of $27.9 million related to certain midstream facility infrastructure in the Delaware Basin. Upon closing of the Midstream AssetDivestitures, it was determined that the net book value of these assets was not recoverable.
Suspended Well Costs. The following table presents the capitalized exploratory well cost pending determination of proved reserves and included in properties and equipment:
As of December 31,
2019 2018
(in thousands, except for number of wells)
Beginning balance $ 12,188 $ 15,448Additions to capitalized exploratory well costs pending thedetermination of proved reserves 31,901 35,127
Reclassifications to proved properties (28,011) (38,387)
Ending balance $ 16,078 $ 12,188
Number of wells pending determination at period-end 4 2
During 2019, the two wells classified as exploratory at December 31, 2018 were reclassified as productive and four new wells drilled were classified as exploratory.
89

PDC ENERGY, INC.NOTES TO CONSOLIDATED FINANCIAL STATEMENTS - Continued
Exploration Expenses. The following table presents the major components of exploration, geologic and geophysical expense:
Year Ended December 31,
2019 2018 2017
(in thousands)
Exploratory dry hole costs $ — $ 113 $ 41,297
Geological and geophysical costs, including seismic purchases 3,017 3,401 3,881
Operating, personnel and other 1,037 2,690 2,156
Total exploration, geologic and geophysical expense $ 4,054 $ 6,204 $ 47,334
Exploratory dry hole costs. During 2017, two exploratory dry holes, associated lease costs and related infrastructure assets in the Delaware Basin were expensed at a cost of $41.3 million. The conclusion to expense these itemswas based on our determination that the acreage on which these wells were drilled was exploratory in nature and, following drilling, that the hydrocarbon production was insufficient for the wells to be deemed economically viable.
NOTE 9 - GOODWILL
Goodwill that resulted from the purchase price allocation of a business combination in the Delaware Basin in December 2016 was determined to be $75.1 million. In 2017, we evaluated goodwill for impairment by performing aquantitative test, which involves comparing the estimated fair value of the goodwill reporting unit, which we define as the Delaware Basin, to the carrying value. The quantitative test resulted in a determination that a full impairment chargeof $75.1 million was required; therefore, the charge was recorded in 2017.
NOTE 10 - LONG-TERM DEBT
Long-term debt consisted of the following as of:
As of December 31,
2019 2018
(in thousands)
Senior Notes: 1.125% Convertible Notes due September 2021:
Principal amount $ 200,000 $ 200,000
Unamortized discount (14,763) (22,766)
Unamortized debt issuance costs (1,666) (2,640)
Net of unamortized discount and debt issuance costs 183,571 174,594
6.125% Senior Notes due September 2024:
Principal amount 400,000 400,000
Unamortized debt issuance costs (4,611) (5,590)
Net of unamortized debt issuance costs 395,389 394,410
5.75% Senior Notes due May 2026:
Principal amount 600,000 600,000
Unamortized debt issuance costs (5,734) (6,628)
Net of unamortized debt issuance costs 594,266 593,372
Total senior notes 1,173,226 1,162,376
Revolving Credit Facility:
Revolving credit facility due May 2023 4,000 32,500
Total long-term debt, net of unamortized discount and debt issuance costs $ 1,177,226 $ 1,194,876
Senior Notes
90

PDC ENERGY, INC.NOTES TO CONSOLIDATED FINANCIAL STATEMENTS - Continued
2021 Convertible Notes. In September 2016, we issued $200 million of 1.125% convertible notes due September 15, 2021 in a public offering. Interest at the rate of 1.125% per year is payable in cash semiannually in arrears onMarch 15 and September 15.
The 2021 Convertible Notes are convertible prior to March 15, 2021 only upon specified events and during specified periods and, thereafter, at any time, at an initial conversion rate of 11.7113 shares of our common stock per$1,000 principal amount of the 2021 Convertible Notes, which is equal to an initial conversion price of approximately $85.39 per share. The conversion rate is subject to adjustment upon certain events. Upon conversion, the 2021Convertible Notes may be settled, at our sole election, in shares of our common stock, cash or a combination thereof. We have initially elected a combination settlement method to satisfy our conversion obligation, which allows us to settlethe principal amount of the 2021 Convertible Notes in cash and to settle the excess conversion value, if any, in shares, as well as cash in lieu of fractional shares.
We may not redeem the 2021 Convertible Notes prior to their maturity date. If we undergo a "fundamental change", as defined in the indenture for the 2021 Convertible Notes, subject to certain conditions, holders of the 2021Convertible Notes may require us to repurchase all or part of the 2021 Convertible Notes for cash at a price equal to 100 percent of the principal amount of the 2021 Convertible Notes to be repurchased, plus any accrued and unpaidinterest. The occurrence of a fundamental change will also result in the 2021 Convertible Notes becoming convertible.
We allocated the gross proceeds of the 2021 Convertible Notes between the liability and equity components of the debt. The initial $160.5 million liability component was determined based on the fair value of similar debtinstruments excluding the conversion feature priced on the same day we issued the 2021 Convertible Notes. The initial $39.5 million equity component represents the debt discount and was calculated as the difference between the fairvalue of the debt and the gross proceeds of the 2021 Convertible Notes. Approximately $4.8 million in costs associated with the issuance of the 2021 Convertible Notes were capitalized as debt issuance costs and are being amortized asinterest expense over the life of the notes. As of December 31, 2019, the unamortized debt discount will be amortized over the remaining contractual term to maturity of the 2021 Convertible Notes. Based upon the December 31, 2019stock price of $26.17 per share, the “if-converted” value of the 2021 Convertible Notes did not exceed the principal amount.
2024 Senior Notes. In September 2016, we issued $400 million aggregate principal amount of 6.125% senior notes due September 15, 2024. Interest is payable semi-annually on March 15 and September 15. Approximately $7.8million in costs associated with the issuance of the 2024 Senior Notes were capitalized as debt issuance costs and are being amortized as interest expense over the life of the notes. The 2024 Senior Notes are redeemable after September 15,2019 at fixed redemption prices, currently 104.594 percent of the principal amount redeemed.
2026 Senior Notes. In November 2017, we issued $600.0 million aggregate principal amount 5.75% senior notes due May 15, 2026. Interest is payable semi-annually on May 15 and November 15. Approximately $7.6 million incosts associated with the issuance of the 2026 Senior Notes were capitalized as debt issuance costs and are being amortized as interest expense over the life of the notes.
The 2026 Senior Notes are redeemable after May 15, 2021 at fixed redemption prices beginning at 104.313 percent of the principal amount redeemed. At any time prior to May 15, 2021, we may redeem all or part of the 2026Senior Notes at a make-whole price set forth in the indenture which generally approximates the present value of the redemption price at May 15, 2021 and remaining interest payments on the 2026 Senior Notes at the time of redemption.
At any time prior to May 15, 2021 we may redeem up to 35 percent of the outstanding 2026 Senior Notes with proceeds from certain equity offerings at a redemption price of 105.75 percent of the principal amount of the notesredeemed, plus accrued and unpaid interest, if at least 65 percent of the aggregate principal amount of the 2026 Senior Notes remains outstanding after each such redemption and the redemption occurs within 180 days after the closing ofthe equity offering.
The 2021 Convertible Notes, the 2024 Senior Notes and the 2026 Senior notes are senior unsecured obligations and rank senior in right of payment to our future indebtedness that is expressly subordinated to the notes; equal inright of payment to our existing and future indebtedness that is not so subordinated; effectively junior in right of payment to all of our secured indebtedness to the extent of the value of the assets securing such indebtedness; and structurallyjunior to all existing and future indebtedness (including trade payables) incurred by our non-guarantor subsidiaries. Our wholly-owned subsidiary, PDC Permian, Inc., is a guarantor of our obligations under the 2021 Convertible Notes, the2024 Senior Notes and the 2026 Senior Notes.
91

PDC ENERGY, INC.NOTES TO CONSOLIDATED FINANCIAL STATEMENTS - Continued
Upon the occurrence of a "change of control," as defined in the indenture for the 2024 Senior Notes and the 2026 Senior Notes, holders will have the right to require us to repurchase all or a portion of the notes at a price equal to101 percent of the aggregate principal amount of the notes repurchased, together with any accrued and unpaid interest to the date of purchase. In connection with certain asset sales, we may, under certain circumstances, be required to usethe net cash proceeds of such asset sale to make an offer to purchase the notes at 100 percent of the principal amount, together with any accrued and unpaid interest to the date of purchase.
The indentures governing the 2024 Senior Notes and 2026 Senior Notes contain covenants that, among other things, limit our ability and the ability of our subsidiaries to incur additional indebtedness; pay dividends or makedistributions on our stock; purchase or redeem stock or subordinated indebtedness; make investments; create certain liens; enter into agreements that restrict distributions or other payments by restricted subsidiaries to us; enter intotransactions with affiliates; sell assets; consolidate or merge with or into other companies or transfer all or substantially of our assets; and create unrestricted subsidiaries. As of December 31, 2019, we were in compliance with all covenantsrelated to the 2021 Convertible Notes, 2024 Convertible Notes and the 2026 Senior Notes.
Revolving Credit Facility
In May 2018, we entered into a Fourth Amended and Restated Credit Agreement (the “Restated Credit Agreement”). Among other things, the Restated Credit Agreement provides for a maximum credit amount of $2.5 billion. Theamount we may borrow under the Restated Credit Agreement is subject to certain limitations under our senior notes. In August 2019, we entered into a First Amendment to the Restated Credit Agreement (the "First Amendment"). TheFirst Amendment primarily provided for certain borrowing in connection with the SRC Acquisition and modified certain sections of the Restated Credit Agreement to permit the consummation of the SRC Acquisition. In October 2019, aspart of our semi-annual redetermination, the borrowing base on our revolving credit facility was reaffirmed at $1.6 billion and we elected to retain our commitment amount at $1.3 billion.
As a result of closing the SRC Acquisition, the borrowing base on our revolving credit facility increased to $2.1 billion and we elected to increase the aggregate commitment amount under our revolving credit facility to $1.7billion. As part of the SRC acquisition, we assumed the SRC Senior Notes. The SRC Senior Notes contained a change of control provision pursuant to which, if the consummation of the SRC Acquisition resulted in a “Change of Control”under the indenture governing the SRC Senior Notes, we were required to make an offer to repurchase the SRC Senior Notes at a price equal to 101 percent of the principal amount of the notes, together with any accrued and unpaid interestto the date of purchase. It was determined that the SRC Acquisition did result in a "Change of Control", and on January 17, 2020, we commenced an offer to repurchase the outstanding SRC Senior Notes at 101 percent of the principalamount. See the footnote titled Acquisition for information regarding the redemption of the SRC Senior Notes.
The revolving credit facility is available for working capital requirements, capital investments, acquisitions, to support letters of credit and for general corporate purposes. The borrowing base is based on, among other things, the
loan value assigned to the proved reserves attributable to our crude oil and natural gas interests. The borrowing base is subject to a semi-annual redetermination on November 1 and May 1 based upon quantification of our reserves at June30 and December 31, and is also subject to a redetermination upon the occurrence of certain events. Substantially all of our crude oil and natural gas properties have been mortgaged or pledged as security for our revolving credit facility.
The outstanding principal amount under the revolving credit facility accrues interest at a varying interest rate that fluctuates with an alternate base rate (equal to the greatest of the administrative agent's prime rate, the federalfunds rate plus a premium and the rate for dollar deposits in the London interbank market (“LIBOR”) for one month plus a premium) or, at our election, a rate equal to LIBOR for certain time periods. Additionally, commitment fees,interest margin and other bank fees, charged as a component of interest, vary with our utilization of the facility. As of December 31, 2019, the applicable interest margin is 0.25 percent for the alternate base rate option or 1.25 percent forthe LIBOR option, and the unused commitment fee is 0.375 percent. Principal payments are generally not required until the revolving credit facility expires in May 2023, unless the borrowing base falls below the outstanding balance.
The revolving credit facility contains covenants customary for agreements of this type, with the most restrictive being certain financial tests on a quarterly basis. The financial tests, as defined per the revolving credit facility,include requirements to: (a) maintain a minimum current ratio of 1.0:1.0 and (b) not exceed a maximum leverage ratio of 4.0:1.0. As of December 31, 2019, we were in compliance with all the revolving credit facility covenants.
As of December 31, 2019 and 2018, debt issuance costs related to our revolving credit facility were $8.9 million
92

PDC ENERGY, INC.NOTES TO CONSOLIDATED FINANCIAL STATEMENTS - Continued
and $11.5 million, respectively, and are included in other assets. As of December 31, 2019 and 2018, availability under our revolving credit facility was $1.3 billion. As of December 31, 2019, the weighted-average interest rate on theoutstanding balance on our revolving credit facility, exclusive of fees on the unused commitment, was five percent.
NOTE 11 - LEASES
On January 1, 2019, we adopted the New Lease Standard issued by the FASB. We determine if an arrangement is representative of a lease under the New Lease Standard at contract inception. ROU assets represent our right to usethe underlying assets for the lease term and the corresponding lease liabilities represent our obligations to make lease payments arising from the leases. Operating and finance lease ROU assets and liabilities are recognized at thecommencement date based on the present value of the expected lease payments over the lease term. As most of our leases do not provide an implicit interest rate, we utilize our incremental borrowing rate based on information available atthe commencement date in determining the present value of lease payments. Subsequent measurement, as well as presentation of expenses and cash flows, will depend upon the classification of the lease as either a finance or operatinglease. Terms of our leases include options to extend or terminate the lease only when we can ascertain that it is reasonably certain we will exercise that option.
We have operating leases for office space and compressors and finance leases for vehicles. Our leases have remaining lease terms ranging from one to five years. The vehicle leases include options to renew for up to four years.Lease payments associated with vehicle leases also include a contractually stated residual value guarantee.
The following table presents the components of lease costs:
Lease Costs Year Ended December
31, 2019
(in thousands)
Operating lease costs $ 4,917
Finance lease costs: Amortization of ROU assets $ 1,961
Interest on lease liabilities 252
Total finance lease costs $ 2,213
Short-term lease costs 170,064
Total lease costs $ 177,194
Our operating lease costs are recorded in lease operating expenses or general and administrative expense and our finance lease costs are recorded in DD&A expense and interest expense on our consolidated statements ofoperations. Our short-term lease costs include amounts that are capitalized as part of the cost of another asset and are recorded as properties and equipment or recognized as expense.
93

PDC ENERGY, INC.NOTES TO CONSOLIDATED FINANCIAL STATEMENTS - Continued
The following table presents the balance sheet classification and other information regarding our leases as of:
Leases Consolidated Balance
Sheet Line Item December 31, 2019
(in thousands)
Operating Leases: Operating lease ROU assets Other assets $ 14,926
Operating lease obligation - short-term Other accrued expense $ 4,159
Operating lease obligation - long-term Other liabilities 12,944
Total operating lease liabilities $ 17,103
Finance Leases:
Finance lease ROU assets Properties and equipment,net $ 4,637
Finance lease obligation - short-term Other accrued expense $ 1,767
Finance lease obligation - long-term Other liabilities 2,835
Total finance lease liabilities $ 4,602
Weighted-average remaining lease term (years) Operating leases 4.28
Finance leases 3.17
Weighted-average discount rate Operating leases 5.0%
Finance leases 5.0%
Maturity of lease liabilities by year and in the aggregate, under operating and financing leases with terms of one year or more, as of December 31, 2019 consist of the following:
Operating Leases Finance Leases Total
(in thousands)
2020 $ 4,847 $ 1,949 $ 6,796
2021 4,923 1,423 6,346
2022 5,016 855 5,871
2023 1,559 637 2,196
2024 950 95 1,045
Thereafter 1,698 — 1,698
Total lease payments 18,993 4,959 23,952
Less: Interest and discount (1,890) (357) (2,247)
Present value of lease liabilities $ 17,103 $ 4,602 $ 21,705
94

PDC ENERGY, INC.NOTES TO CONSOLIDATED FINANCIAL STATEMENTS - Continued
NOTE 12 - ASSET RETIREMENT OBLIGATIONS
The following table presents the changes in carrying amounts of the asset retirement obligations associated with our working interest in crude oil and natural gas properties:
Year Ended December 31,
2019 2018
(in thousands)
Beginning balance $ 115,021 $ 87,306
Obligations incurred with development activities 4,605 2,793
Obligations incurred with acquisition 2,882 4,332
Accretion expense 6,117 5,075
Revisions in estimated cash flows 28,991 30,166
Obligations discharged with asset retirements (23,426) (14,651)
Obligations discharged with divestitures (6,939) —
Balance at December 31 127,251 115,021
Liabilities held-for-sale — (4,111)
Current portion (32,200) (25,598)
Long-term portion $ 95,051 $ 85,312
Our estimated asset retirement obligations liability is based on historical experience in plugging and abandoning wells, estimated economic lives and estimated plugging, abandonment and surface reclamation costs consideringfederal and state regulatory requirements in effect at that time. The liability is discounted using the credit-adjusted risk-free rate estimated at the time the liability is incurred or revised. To the extent future revisions to these assumptionsimpact the present value of the existing asset retirement obligations liability, a corresponding adjustment is made to the properties and equipment balance. Changes in the liability due to the passage of time are recognized as an increase inthe carrying amount of the liability and as accretion expense. Short-term asset retirement obligations are included in other accrued expenses.
The revisions in estimated cash flows during 2019 and 2018 were primarily due to increases in the estimated surface reclamation costs to obtain final well pad reclamation approval from the applicable regulatory agencies.
NOTE 13 - COMMITMENTS AND CONTINGENCIES
Firm Transportation and Processing Agreements. We enter into contracts that provide firm transportation and processing on pipeline systems through which we transport or sell crude oil and natural gas. Satisfaction of thevolume requirements includes volumes produced by us and purchased from third parties and other third-party working, royalty and overriding royalty interest owners, whose volumes we market on their behalf. Our consolidated statementsof operations reflect our share of these firm transportation and processing costs. These contracts require us to pay these transportation and processing charges whether or not the required volumes are delivered.
95

PDC ENERGY, INC.NOTES TO CONSOLIDATED FINANCIAL STATEMENTS - Continued
The following table presents gross volume information related to our long-term firm transportation, sales and processing agreements for pipeline capacity and water delivery and disposal commitments:
Year Ending December 31,
Area 2020 2021 2022 2023 Thereafter Total Expiration
Date
Natural gas (MMcf) Wattenberg Field 30,608 31,025 31,025 31,025 63,992 187,675 August 31, 2026
Delaware Basin 37,552 28,241 9,125 9,125 66,175 150,218 March 31, 2031
Gas Marketing 7,136 7,056 4,495 — — 18,687 August 31, 2022
Total 75,296 66,322 44,645 40,150 130,167 356,580
Crude oil (MBbls)
Wattenberg Field 9,992 16,243 16,243 12,567 37,255 92,300 December 31, 2027
Delaware Basin 8,784 8,030 8,030 8,030 — 32,874 December 31, 2023
Total 18,776 24,273 24,273 20,597 37,255 125,174
Water (MBbls)
Wattenberg Field 6,224 6,207 6,207 6,206 6,223 31,067 December 31, 2024
Total 6,224 6,207 6,207 6,206 6,223 31,067
Dollar commitment (inthousands) $ 85,159 $ 106,322 $ 101,107 $ 85,774 $ 202,532 $ 580,894
Wattenberg Field. We have entered into two facilities expansion agreements with our primary midstream provider to expand and improve its natural gas gathering pipelines and processing facilities. The midstream provider
completed and turned on line the first of the two 200 MMcfd cryogenic plants in August 2018 and the second plant was completed in August 2019. We are bound to the volume requirements in these agreements on the first day of thecalendar month following the actual in-service date of the relevant plant. Both agreements require baseline volume commitments, consisting of our gross wellhead volume delivered in November 2016 to this midstream provider, andincremental wellhead volume commitments of 51.5 MMcfd and 33.5 MMcfd for the first and second agreements, respectively, for seven years. We may be required to pay shortfall fees for any volumes under the 51.5 MMcfd and 33.5MMcfd incremental commitments. We are currently satisfying the volume commitment.
Delaware Basin. In May 2018, we entered into a firm sales agreement that is effective from June 2018 through December 2023 with an integrated marketing company for our crude oil production in the Delaware Basin. Contractedvolumes are currently 24,000 barrels of crude oil per day and decrease over time to 22,000 barrels of crude oil per day. This agreement is expected to provide price diversification through realization of export market pricing via a CorpusChristi terminal and exposure to Brent-weighted prices.
Crude Oil, Natural Gas and NGLs Sales. For 2019, amounts related to long-term transportation volumes, net to our interest, for Wattenberg Field crude oil and Delaware Basin natural gas were $50.1 million and in accordancewith the guidance in the New Revenue Standard, were netted against our crude oil and natural gas sales. In addition, for 2019 and 2018, $1.9 million and $1.6 million, respectively, related to long-term transportation volumes were recordedin transportation, gathering and processing expense. Amounts related to long-term transportation volumes for Wattenberg Field crude oil and Utica Shale natural gas of $10.0 million for 2017 were recorded in transportation, gathering andprocessing expense. In March 2018, we completed the disposition of our Utica Shale properties.
Litigation and Legal Items. We are involved in various legal proceedings. We review the status of these proceedings on an ongoing basis and, from time to time, may settle or otherwise resolve these matters on terms andconditions that management believes are in our best interests. We have provided the necessary estimated accruals in the accompanying balance sheets where deemed appropriate for litigation and legal related items that are ongoing and notyet concluded. Although the results cannot be known with certainty, we currently believe that the ultimate results of such proceedings will not have a material adverse effect on our financial position, results of operations or liquidity.
96

PDC ENERGY, INC.NOTES TO CONSOLIDATED FINANCIAL STATEMENTS - Continued
Action Regarding Partnerships. In December 2017, we received an action entitled Dufresne, et al. v. PDC Energy, et al. (the "Dufresne Case"), filed in the United States District Court for the District of Colorado (the "DistrictCourt"). The original complaint stated that it was a derivative action brought by a number of limited partner investors seeking to assert claims for breach of fiduciary duties on behalf of our two affiliated partnerships, Rockies Region 2006LP and Rockies Region 2007 LP (collectively, the "Partnerships"), against PDC. The complaint was subsequently amended to include putative class claims for breach of the partnership agreements. The plaintiffs also included claimsagainst two of our senior officers and three independent members of the Board for allegedly aiding and abetting PDC's purported breach of fiduciary duty. We filed a motion to dismiss on July 31, 2018. On February 19, 2019, the DistrictCourt granted the motion to dismiss, in part. It dismissed all claims against the individuals named as defendants. It also held that that the plaintiffs were time-barred from using the failure to assign acreage to the Partnerships as grounds tosupport their claims for breach of fiduciary duty against PDC. On June 4, 2019, the District Court entered an order holding its opinion on the motion to dismiss in abeyance pending resolution of the Partnerships' bankruptcy cases andstaying the litigation. As discussed in more detail below, the District Court in Colorado has dismissed the Dufresne Case.
Partnership Bankruptcy Filings. On October 30, 2018, the Partnerships filed petitions under Chapter 11 of the Bankruptcy Code (the "Chapter 11 Proceedings") in the United States Bankruptcy Court for the Northern District ofTexas, Dallas Division (the "Bankruptcy Court"). Prior to the bankruptcy filings, PDC designated a third-party (the “Responsible Party”) to analyze strategic options for the Partnerships. After designation of the Responsible Party andbefore filing the Chapter 11 Proceedings, PDC and the Partnerships agreed to enter into a transaction pursuant to which PDC would acquire substantially all of the Partnerships’ assets through a Chapter 11 plan of liquidation and obtain arelease of claims from the Partnerships, including the claims asserted in the Dufresne Case. In June 2019, the Responsible Party, PDC and the plaintiffs in the Dufresne Case reached a settlement of the matters raised in the Dufresne Caseand the Chapter 11 Proceedings. The settlement, which settles all claims asserted against PDC, whether direct or derivative, including, but not limited to, the claims asserted in the Dufresne Case, was incorporated into an Amended Chapter11 Plan (the “Amended Chapter 11 Plan”). The Disclosure Statement accompanying the Amended Chapter 11 Plan was approved by the Bankruptcy Court in August 2019 along with procedures for soliciting votes on the Amended Chapter11 Plan. The Amended Chapter 11 Plan was distributed to the Partnership unit holders for voting. On October 2, 2019, the Bankruptcy Court held a hearing to consider confirmation of the Amended Chapter 11 Plan and, on October 3,2019, entered an order confirming the Amended Chapter 11 Plan. The requirements for the Amended Chapter 11 Plan to become effective were met on October 21, 2019 (the “Effective Date”). As contemplated by the Amended Chapter 11Plan, on the Effective Date, PDC funded the settlement payment, purchase price for the Partnership’s oil and gas assets and the administrative reserve. Additionally, the Partnership’s oil and gas assets were conveyed to PDC and PDC andthe plaintiffs in the Dufresne Case submitted an agreed order dismissing the Dufresne Case with prejudice to the District Court. The District Court entered the agreed order on October 23, 2019, dismissing the Dufresne Case with prejudice.On December 5, 2019, the Bankruptcy Court entered orders approving final fee applications of the debtors' legal representatives and professional service providers, which were paid before the end of 2019, along with distributions of thesettlement amount pursuant to the Amended Chapter 11 Plan to the Partnership unit holders.
Environmental. Due to the nature of the natural gas and oil industry, we are exposed to environmental risks. We have various policies and procedures to minimize and mitigate the risks from environmental contamination. Weconduct periodic reviews and simulated drills to identify changes in our environmental risk profile. Liabilities are recorded when environmental damages resulting from past events are probable and the costs can be reasonably estimated.Except as discussed herein, we are not aware of any material environmental claims existing as of December 31, 2019 which have not been provided for or would otherwise have a material impact on our financial statements; however, therecan be no assurance that current regulatory requirements will not change or that unknown potential past non-compliance with environmental laws or other environmental liabilities will not be discovered on our properties. Accruedenvironmental liabilities are recorded in other accrued expenses. The liability ultimately incurred with respect to a matter may exceed the related accrual.
On October 23, 2018, we agreed to an Administrative Order by Consent ("AOC") with the Colorado Oil and Gas Conservation Commission relating to a historical release discovered during the decommissioning of a location inWeld County, Colorado, pursuant to which, among other things, we agreed to a penalty of approximately $130,000, of which 20 percent would be suspended subject to compliance with certain corrective actions identified in the AOC. Inaddition to the penalty, we agreed to timely complete certain corrective actions set forth in the AOC relating to procedures for completing future work on buried or partially buried produced water vessels, and to reestablish vegetation andotherwise reclaim the location. We have completed the corrective actions in a timely manner and some of our reclamation activities are ongoing.
In recent years, we have been executing a program to plug and abandon certain of our older vertical wells in the Wattenberg Field. A self-audit of final reclamation activities associated with site retirements, which we concluded in
2019,
97

PDC ENERGY, INC.NOTES TO CONSOLIDATED FINANCIAL STATEMENTS - Continued
identified deficiencies, including incomplete documentation and agency submittals, inadequate plant growth and incomplete earthwork. In December 2019, we formally disclosed these deficiencies to the COGCC and are working to closethis backlog of site reclamation work. We do not believe potential penalties and other expenditures associated with this disclosure will have a material effect on our financial condition or results of operations, but they may exceed $100,000.
Clean Air Act Agreement and Related Consent Decree. In June 2017, following our receipt of a 2015 Clean Air Act information request from the EPA and a 2015 compliance advisory from the Colorado Department of PublicHealth and Environment's (“CDPHE”) Air Pollution Control Division, the U.S. Department of Justice, on behalf of the EPA and the state of Colorado, filed a complaint against us in the U.S. District Court for the District of Colorado,claiming that we failed to operate and maintain certain condensate collection facilities at 65 facilities so as to minimize leakage of volatile organic compounds in compliance with applicable law.
In October 2017, we entered into a consent decree to resolve the lawsuit and the compliance advisory. Pursuant to the consent decree, we agreed to implement a variety of operational enhancements and mitigation and similarprojects, including vapor control system modifications and verification, increased inspection and monitoring and installation of tank pressure monitors. The three primary elements of the consent decree are: (i) fine/supplementalenvironmental projects ($1.5 million cash fine, plus $1 million in supplemental environmental projects) of which the cash fines and the full cost of supplemental environmental projects were paid in the first and third quarters of 2018,respectively, (ii) injunctive relief with an estimated cost of approximately $18 million, primarily representing capital enhancements to our operations and (iii) mitigation with an estimated cost of $1.7 million. Additionally, we are subject tothe revised requirements of the COC entered into by SRC with CDPHE as described in "Risk Factors -We are subject to complex federal, state, local and other laws and regulations that adversely affect the cost and manner of doingbusiness." We continue to incur costs associated with these activities. If we fail to comply fully with the requirements of the consent decree with respect to those matters, we could be subject to additional liability. We do not believe that theexpenditures resulting from the settlement will have a material adverse effect on our consolidated financial statements.
We are in the process of implementing the consent decree program, recently expanded to include the COC. Over the course of its execution, we have identified certain immaterial deficiencies in our implementation of the program.We report these immaterial deficiencies to the appropriate authorities and remediate them promptly. We do not believe that the penalties and expenditures associated with the consent decree, including any sanctions associated with thesedeficiencies, will have a material effect on our financial condition or results of operations, but they may exceed $100,000.
In addition, in December 2018, we were named as a nominal defendant in a derivative action filed in the Delaware chancery court. The complaint, which seeks unspecified monetary damages and various forms of equitable relief,alleges that certain current and former members of the Board violated their fiduciary duties, committed waste and were unjustly enriched by, among other things, failing to implement adequate environmental safeguards in connection withthe issues that gave rise to the Department of Justice lawsuit and consent decree. We believe that this lawsuit is without merit but cannot predict its outcome.
Further, we could be the subject of other enforcement actions by regulatory authorities in the future relating to our past, present or future operations.
98

PDC ENERGY, INC.NOTES TO CONSOLIDATED FINANCIAL STATEMENTS - Continued
NOTE 14 - COMMON STOCK
Stock-Based Compensation Plans
2018 Equity Incentive Plan. In May 2018, our stockholders approved a long-term equity compensation plan for our employees and non-employee directors (the “2018 Plan”). The 2018 Plan provides for a reserve of 1,800,000shares of our common stock that may be issued pursuant to awards under the 2018 Plan and a term that expires in March 2028. Shares issued may be either authorized but unissued shares, treasury shares or any combination. Additionally,the 2018 Plan permits the reuse or reissuance of shares of common stock which were canceled, expired, forfeited or paid out in the form of cash. However, shares tendered or withheld to satisfy the exercise price of options or taxwithholding obligations, and shares covering the portion of exercised stock-settled stock appreciation rights ("SARs") (regardless of the number of shares actually delivered), count against the share limit. Awards may be issued in the formof options, SARs, restricted stock, restricted stock units ("RSUs"), performance stock units ("PSUs") and other stock-based awards. Awards may vest over periods of continued service or the satisfaction of performance conditions set at thediscretion of the Compensation Committee of the Board (the "Compensation Committee"), with a minimum one-year vesting period applicable to most awards. With regard to SARs and options, awards have a maximum exercisable periodof ten years. We began issuing shares from the 2018 Plan during 2019. As of December 31, 2019, there were 1,429,004 shares available for grant under the 2018 Plan.
2010 Long-Term Equity Compensation Plan. Our Amended and Restated 2010 Long-Term Equity Compensation Plan, which was most recently approved by stockholders in 2013 (as the same has been amended and restated from
time to time, the "2010 Plan"), will remain outstanding and we may continue to use the 2010 Plan to grant awards. As of December 31, 2019, there were 133,330 shares available for grant under the 2010 Plan.
The following table provides a summary of the impact of our outstanding stock-based compensation plans on the results of operations for the periods presented:
Year Ended December 31,
2019 2018 2017
(in thousands)
Stock-based compensation expense $ 23,837 $ 21,782 $ 19,353
Income tax benefit (5,780) (5,210) (7,372)
Net stock-based compensation expense $ 18,057 $ 16,572 $ 11,981
Restricted Stock Units
Time-Based Awards. The fair value of the time-based RSUs is amortized ratably over the requisite service period, primarily three years. The time-based RSUs generally vest ratably on each anniversary following the grant dateprovided that a participant is continuously employed.
The following table presents the changes in non-vested time-based RSUs to all employees, including executive officers, for 2019:
Shares
Weighted-AverageGrant Date
Fair Value per Share
Non-vested at December 31, 2018 618,407 $ 54.16
Granted 588,899 40.34
Vested (307,450) 52.98
Forfeited (103,930) 45.62
Non-vested at December 31, 2019 795,926 45.51
99
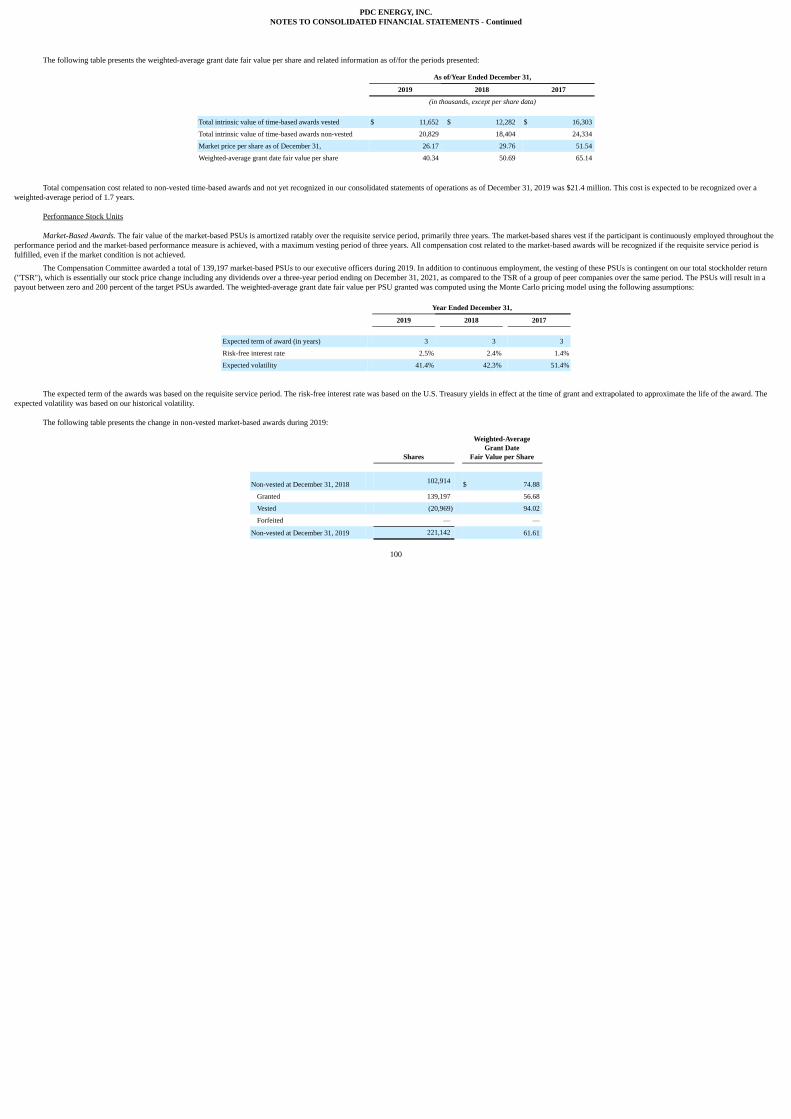
PDC ENERGY, INC.NOTES TO CONSOLIDATED FINANCIAL STATEMENTS - Continued
The following table presents the weighted-average grant date fair value per share and related information as of/for the periods presented:
As of/Year Ended December 31,
2019 2018 2017
(in thousands, except per share data)
Total intrinsic value of time-based awards vested $ 11,652 $ 12,282 $ 16,303
Total intrinsic value of time-based awards non-vested 20,829 18,404 24,334
Market price per share as of December 31, 26.17 29.76 51.54
Weighted-average grant date fair value per share 40.34 50.69 65.14
Total compensation cost related to non-vested time-based awards and not yet recognized in our consolidated statements of operations as of December 31, 2019 was $21.4 million. This cost is expected to be recognized over aweighted-average period of 1.7 years.
Performance Stock Units
Market-Based Awards. The fair value of the market-based PSUs is amortized ratably over the requisite service period, primarily three years. The market-based shares vest if the participant is continuously employed throughout theperformance period and the market-based performance measure is achieved, with a maximum vesting period of three years. All compensation cost related to the market-based awards will be recognized if the requisite service period isfulfilled, even if the market condition is not achieved.
The Compensation Committee awarded a total of 139,197 market-based PSUs to our executive officers during 2019. In addition to continuous employment, the vesting of these PSUs is contingent on our total stockholder return("TSR"), which is essentially our stock price change including any dividends over a three-year period ending on December 31, 2021, as compared to the TSR of a group of peer companies over the same period. The PSUs will result in apayout between zero and 200 percent of the target PSUs awarded. The weighted-average grant date fair value per PSU granted was computed using the Monte Carlo pricing model using the following assumptions:
Year Ended December 31,
2019 2018 2017
Expected term of award (in years) 3 3 3
Risk-free interest rate 2.5% 2.4% 1.4%
Expected volatility 41.4% 42.3% 51.4%
The expected term of the awards was based on the requisite service period. The risk-free interest rate was based on the U.S. Treasury yields in effect at the time of grant and extrapolated to approximate the life of the award. Theexpected volatility was based on our historical volatility.
The following table presents the change in non-vested market-based awards during 2019:
Shares
Weighted-AverageGrant Date
Fair Value per Share
Non-vested at December 31, 2018 102,914 $ 74.88
Granted 139,197 56.68
Vested (20,969) 94.02
Forfeited — —
Non-vested at December 31, 2019 221,142 61.61
100

PDC ENERGY, INC.NOTES TO CONSOLIDATED FINANCIAL STATEMENTS - Continued
The following table presents the weighted-average grant date fair value per share and related information as of/for the periods presented:
As of/Year Ended December 31,
2019 2018 2017
(in thousands, except per share data)
Total intrinsic value of market-based awards vested $ 530 $ 620 $ 2,687
Total intrinsic value of market-based awards non-vested 5,787 3,063 2,698
Market price per share as of December 31, 26.17 29.76 51.54
Weighted-average grant date fair value per share 56.68 69.98 94.02
Total compensation cost related to non-vested market-based awards not yet recognized in our consolidated statements of operations as of December 31, 2019 was $7.5 million. This cost is expected to be recognized over aweighted-average period of 1.6 years.
Stock Appreciation Rights
The SARs vest ratably over a three-year period and may generally be exercised at any point after vesting through ten years from the date of issuance. Pursuant to the terms of the awards, upon exercise, the executive officers willreceive, in shares of common stock, the excess of the market price of the award on the date of exercise over the market price of the award on the date of issuance.
The Compensation Committee awarded SARs to our executive officers in 2017. There were no SARs awarded to our executive officers in 2018 or 2019. The fair value of each SAR award was estimated on the date of grant using aBlack-Scholes pricing model using the following assumptions:
Year EndedDecember 31,
2017
Expected term of award (in years) 6Risk-free interest rate 2.0%Expected volatility 53.3%Weighted-average grant date fair value per share $ 38.58
The expected term of the award was estimated using historical stock option exercise behavior data. The risk-free interest rate was based on the U.S. Treasury yields approximating the expected life of the award in effect at the timeof grant. Expected volatilities were based on our historical volatility.
The following table presents the changes in our SARs for all periods presented (in thousands, except per share data):
Year Ended December 31,
2019 2018 2017
Numberof
SARs
Weighted-AverageExercise
Price
AverageRemainingContractual
Term (inyears)
AggregateIntrinsic
Value
Numberof
SARs
Weighted-AverageExercise
Price
AggregateIntrinsic
Value
Numberof
SARs
Weighted-AverageExercise
Price
AggregateIntrinsic
Value
Outstanding at January 1, 290,258 $ 46.64 4.6 $ 125 298,220 $ 47.39 $ 2,490 244,078 $ 41.36 $ 7,620
Awarded — — — — — — — 54,142 74.57 —
Modified — — — — 63,969 42.83 — — — —
Expired — — — — (71,931) 46.34 — — — —Outstanding at December31, 290,258 46.64 3.6 41 290,258 46.64 125 298,220 47.39 2,490Exercisable at December31, 276,775 45.28 3.4 41 260,101 44.88 125 223,865 43.28 2,267
101

PDC ENERGY, INC.NOTES TO CONSOLIDATED FINANCIAL STATEMENTS - Continued
We expect all SARs outstanding as of December 31, 2019 to vest in 2020. The SARS modified during 2018, as included in the table above, were related to one employee and the total compensation cost associated with themodification was not material to our consolidated statement of operations. Total compensation cost related to SARs granted and not yet recognized in our consolidated statements of operations as of December 31, 2019 is not material andwill be recognized within the next twelve months.
Preferred stock
We are authorized to issue 50,000,000 shares of preferred stock, par value $0.01 per share, which may be issued in one or more series, with such rights, preferences, privileges and restrictions as shall be fixed by the Board fromtime to time. Through December 31, 2019, no shares of preferred shares had been issued.
Stock Repurchase Program
In April 2019, the Board approved a Stock Repurchase Program to acquire up to $200 million of our outstanding common stock, depending on market conditions. Repurchases under the Stock Repurchase Program can be made inopen markets at our discretion and in compliance with safe harbor provisions, or in privately negotiated transactions. The Stock Repurchase Program does not require any specific number of shares to be acquired, and can be modified ordiscontinued by the Board at any time. During 2019, we repurchased 4.7 million shares of our outstanding common stock at a cost of $154.4 million pursuant to the Stock Repurchase Program. Subsequent to December 31, 2019, werepurchased approximately 0.6 million shares of our outstanding common stock at a cost of $12.5 million. Effective upon on the closing of the SRC Acquisition, our Board approved an increase and extension to the Stock RepurchaseProgram from $200 million to $525 million. As of February 24, 2020, $358.2 million of our outstanding common stock remained available for repurchase under the Stock Repurchase Program. Our target completion date for the StockRepurchase Program is December 31, 2021.
NOTE 15 - INCOME TAXES
The table below presents the components of our provision for income tax (expense) benefit for the years presented:
Year Ended December 31,
2019 2018 2017
(in thousands)
Current: Federal $ 1,366 $ 887 $ 8,443
State (300) (188) (200)
Total current income tax benefit 1,066 699 8,243
Deferred: Federal 4,507 (1,986) 193,809
State (2,251) (4,119) 9,876
Total deferred income tax (expense) benefit 2,256 (6,105) 203,685
Income tax (expense) benefit $ 3,322 $ (5,406) $ 211,928
102

PDC ENERGY, INC.NOTES TO CONSOLIDATED FINANCIAL STATEMENTS - Continued
The following table presents a reconciliation of the federal statutory rate to the effective tax rate related to our (expense) benefit for income taxes:
Year Ended December 31,
2019 2018 2017
Federal statutory tax rate 21.0 % 21.0 % 35.0 %
State income tax, net 3.6 (6.4) 1.8
Federal tax credits (3.3) (52.1) —
Effect of state income tax rate changes (6.4) 6.7 —
Change in valuation allowance (0.6) 45.5 —
Non-deductible compensation (5.0) 21.8 (0.3)
Non-deductible acquisition costs (2.3) — —
Non-deductible government relations (1.0) 31.8 —
Other non-deductible items (0.5) 4.9 —
Federal tax reform rate reduction — — 33.7
Non-deductible goodwill impairment — — (7.7)
Other — (0.4) (0.1)
Effective tax rate 5.5 % 72.8 % 62.4 %
Tax effects of temporary differences that give rise to significant portions of deferred tax assets and deferred tax liabilities at December 31, 2019 and 2018 are presented below.
As of December 31,
2019 2018
(in thousands)
Deferred tax assets: Deferred compensation $ 9,905 $ 9,963
Asset retirement obligations 30,993 27,166
Federal NOL carryforward 22,965 54,736
State NOL and tax credit carryforwards, net 9,508 13,223
Federal tax - credit carryforwards 4,448 7,756
Prepaid revenue 4,874 5,288
Other 3,887 4,647
Valuation allowance (3,775) (3,380)
Total gross deferred tax assets 82,805 119,399
Deferred tax liabilities: Properties and equipment 268,234 270,565
Net change in fair value of unsettled derivatives 6,841 41,496
Convertible debt 3,571 5,434
Total gross deferred tax liabilities 278,646 317,495
Net deferred tax liability $ 195,841 $ 198,096
As of December 31, 2019, we have prior year federal NOL carryforwards of $175.7 million of which $31.5 million will begin to expire in 2036. Also, we acquired a federal NOL of $60.1 million as a component of our 2016acquisition in the Delaware Basin that will begin to expire in 2034 and is subject to an annual limitation of $15.1 million as a result of the acquisition, which constitutes a change of ownership as defined under IRS Code Section 382. Weexpect to utilize $126.4 million of these NOLs to offset current federal taxable income.
As of December 31, 2019, we have state NOL carryforwards of $265.9 million that begin to expire in 2030 and state credit carryforwards of $4.0 million that begin to expire in 2022. We expect to utilize $98.0 million of theseNOLs to offset current state taxable income. Due to the potential non-utilization of our state tax credit carryforwards before their expiration, we have recorded a valuation allowance for the future tax benefit of these credit carryforwards.
Unrecognized tax benefits and related accrued interest and penalties were immaterial for the three-year period ended December 31, 2019. The statutes of limitations for most of our state tax jurisdictions are open for tax year 2015forward.
103

PDC ENERGY, INC.NOTES TO CONSOLIDATED FINANCIAL STATEMENTS - Continued
The IRS partially accepted our 2018 tax return. The 2018 tax return is in the IRS CAP Program post-filing review process, with no significant tax adjustments currently proposed. We continue to voluntarily participate in the IRSCAP Program for the 2019 and 2020 tax years. Participation in the IRS CAP Program has enabled us to have minimal uncertain tax benefits associated with our federal tax return filings.
NOTE 16 - EARNINGS PER SHARE
Basic earnings per share is computed by dividing net earnings by the weighted-average number of common shares outstanding for the period. Diluted earnings per share is similarly computed except that the denominator includesthe effect, using the treasury stock method, of unvested restricted stock, outstanding SARs, convertible notes and shares held pursuant to our non-employee director deferred compensation plan, if including such potential shares of commonstock is dilutive.
The following table presents our weighted-average basic and diluted shares outstanding:
Year Ended December 31,
2019 2018 2017
(in thousands)
Weighted-average common shares outstanding - basic 64,032 66,059 65,837
Dilutive effect of: RSUs and PSUs — 173 —
Other equity-based awards — 71 —
Weighted-average common shares and equivalents outstanding - diluted 64,032 66,303 65,837
For 2019 and 2017, we reported a net loss. As a result, our basic and diluted weighted-average common shares outstanding were the same for those periods because the effect of the common share equivalents was anti-dilutive.
The following table presents the weighted-average common share equivalents excluded from the calculation of diluted earnings per share due to their anti-dilutive effect:
Year Ended December 31,
2019 2018 2017
(in thousands)
Weighted-average common share equivalents excluded from diluted earnings per share due totheir anti-dilutive effect:
RSUs and PSUs 989 145 590
Other equity-based awards 302 109 75
Total anti-dilutive common share equivalents 1,291 254 665
The 2021 Convertible Notes give the holders, at our election, the right to convert the aggregate principal amount into 2.3 million shares of our common stock at a conversion price of $85.39 per share. The 2021 Convertible Notescould be included in the diluted earnings per share calculation using the treasury stock method if the average market share price exceeds the $85.39 conversion price during the periods presented. During 2019, 2018 and 2017, the averagemarket price of our common stock did not exceed the conversion price; therefore, shares issuable upon conversion of the 2021 Convertible Notes were not included in the diluted earnings per share calculation.
104

PDC ENERGY, INC.NOTES TO CONSOLIDATED FINANCIAL STATEMENTS - Continued
NOTE 17 - SUPPLEMENTAL DISCLOSURES OF CASH FLOW INFORMATION
Year Ended December 31,
2019 2018 (1) 2017 (1)
(in thousands)
Supplemental cash flow information:
Cash payments (receipts) for: Interest, net of capitalized interest $ 57,439 $ 55,586 $ 69,880
Income taxes (1,167) (6,719) (13,925)
Non-cash investing and financing activities: Change in accounts payable related to capital expenditures (68,246) 36,328 50,761Change in asset retirement obligation, with a corresponding change to crude oil andnatural gas properties, net of disposal 29,533 37,136 839
Cash paid for amounts included in the measurement of lease liabilities:
Operating cash flows from operating leases $ 5,301 $ — $ —
Operating cash flows from finance leases 253 — —
Financing cash flows from finance leases 1,952 — —
ROU assets obtained in exchange for lease obligations:
Operating leases $ 1,428 $ — $ —
Finance leases 2,323 — —
(1) As we have elected the modified retrospective method of adoption for the New Lease, cash flows related to lease liabilitieshave not been restated for 2018 and 2017.
105

PDC ENERGY, INC.NOTES TO CONSOLIDATED FINANCIAL STATEMENTS - Continued
NOTE 18 - SUBSIDIARY GUARANTOR
PDC Permian, Inc., our wholly-owned subsidiary, guarantees our obligations under our publicly-registered senior notes. The following presents the consolidating financial information separately for:
(i) PDC Energy, Inc. ("Parent"), the issuer of the guaranteed obligations, including non-material subsidiaries;(ii) PDC Permian, Inc., the guarantor subsidiary ("Guarantor"), as specified in the indentures related to our senior notes;(iii) Eliminations representing adjustments to (a) eliminate intercompany transactions between or among Parent, Guarantor and our other subsidiaries and (b) eliminate the investments in our subsidiaries; and(iv) Parent and subsidiaries on a consolidated basis ("Consolidated").
The Guarantor is 100 percent owned by the Parent. The senior notes are fully and unconditionally guaranteed on a joint and several basis by the Guarantor. The guarantee is subject to release in limited circumstances only upon theoccurrence of certain customary conditions. Each entity in the consolidating financial information follows the same accounting policies as described in the notes to the consolidated financial statements.
The following consolidating financial statements have been prepared on the same basis of accounting as our consolidated financial statements. Investments in subsidiaries are accounted for under the equity method. Accordingly,the entries necessary to consolidate the Parent and Guarantor are reflected in the eliminations column.
106

PDC ENERGY, INC.NOTES TO CONSOLIDATED FINANCIAL STATEMENTS - Continued
Consolidating Balance Sheets
December 31, 2019
Parent Guarantor Eliminations Consolidated
(in thousands)
Assets Current assets:
Cash and cash equivalents $ 963 $ — $ — $ 963
Accounts receivable, net 140,742 125,612 — 266,354
Fair value of derivatives 28,078 — — 28,078
Prepaid expenses and other current assets 8,204 431 — 8,635
Total current assets 177,987 126,043 — 304,030
Properties and equipment, net 2,328,337 1,766,865 — 4,095,202
Intercompany receivable 348,818 — (348,818) —
Investment in subsidiaries 1,286,931 — (1,286,931) —
Fair value of derivatives 3,746 — — 3,746
Other assets 38,863 6,839 — 45,702
Total Assets $ 4,184,682 $ 1,899,747 $ (1,635,749) $ 4,448,680
Liabilities and Stockholders' Equity Liabilities
Current liabilities: Accounts payable $ 72,212 $ 26,722 $ — $ 98,934
Production tax liability 67,509 8,727 — 76,236
Fair value of derivatives 2,921 — — 2,921
Funds held for distribution 83,072 15,321 — 98,393
Accrued interest payable 14,281 3 — 14,284
Other accrued expenses 68,803 1,659 — 70,462
Total current liabilities 308,798 52,432 — 361,230
Intercompany payable — 348,818 (348,818) —
Long-term debt 1,177,226 — — 1,177,226
Deferred income taxes 169,520 26,321 — 195,841
Asset retirement obligations 87,749 7,302 — 95,051
Fair value of derivatives 692 — — 692
Other liabilities 105,190 177,943 — 283,133
Total liabilities 1,849,175 612,816 (348,818) 2,113,173
Commitments and contingent liabilities Stockholders' equity
Common shares 617 — — 617
Additional paid-in capital 2,384,309 1,766,775 (1,766,775) 2,384,309
Retained deficit (47,945) (479,844) 479,844 (47,945)
Treasury shares (1,474) — — (1,474)
Total stockholders' equity 2,335,507 1,286,931 (1,286,931) 2,335,507
Total Liabilities and Stockholders' Equity $ 4,184,682 $ 1,899,747 $ (1,635,749) $ 4,448,680
107

PDC ENERGY, INC.NOTES TO CONSOLIDATED FINANCIAL STATEMENTS - Continued
Consolidating Balance Sheets
December 31, 2018
Parent Guarantor Eliminations Consolidated
(in thousands)
Assets Current assets: Cash and cash equivalents $ 1,398 $ — $ — $ 1,398
Accounts receivable, net 146,529 34,905 — 181,434
Fair value of derivatives 84,492 — — 84,492
Prepaid expenses and other current assets 6,725 411 — 7,136
Total current assets 239,144 35,316 — 274,460
Properties and equipment, net 2,270,711 1,732,151 — 4,002,862
Assets held-for-sale, net — 140,705 — 140,705
Intercompany receivable 451,601 — (451,601) —
Investment in subsidiaries 1,316,945 — (1,316,945) —
Fair value of derivatives 93,722 — — 93,722
Other assets 30,084 2,312 — 32,396
Total Assets $ 4,402,207 $ 1,910,484 $ (1,768,546) $ 4,544,145
Liabilities and Stockholders' Equity Liabilities
Current liabilities: Accounts payable $ 110,847 $ 71,017 $ — $ 181,864
Production tax liability 53,309 7,410 — 60,719
Fair value of derivatives 3,364 — — 3,364
Funds held for distribution 90,183 15,601 — 105,784
Accrued interest payable 14,143 7 — 14,150
Other accrued expenses 73,689 1,444 — 75,133
Total current liabilities 345,535 95,479 — 441,014
Intercompany payable — 451,601 (451,601) —
Long-term debt 1,194,876 — — 1,194,876
Deferred income taxes 162,368 35,728 — 198,096
Asset retirement obligations 79,904 5,408 — 85,312
Liabilities held-for-sale — 4,111 — 4,111
Fair value of derivatives 1,364 — — 1,364
Other liabilities 91,452 1,212 — 92,664
Total liabilities 1,875,499 593,539 (451,601) 2,017,437
Commitments and contingent liabilities Stockholders' equity
Common shares 661 — — 661
Additional paid-in capital 2,519,423 1,766,775 (1,766,775) 2,519,423
Retained earnings (deficit) 8,727 (449,830) 449,830 8,727
Treasury shares (2,103) — — (2,103)
Total stockholders' equity 2,526,708 1,316,945 (1,316,945) 2,526,708
Total Liabilities and Stockholders' Equity $ 4,402,207 $ 1,910,484 $ (1,768,546) $ 4,544,145
108

PDC ENERGY, INC.NOTES TO CONSOLIDATED FINANCIAL STATEMENTS - Continued
Consolidating Statements of Operations
Year Ended December 31, 2019
Parent Guarantor Eliminations Consolidated
(in thousands)
Revenues Crude oil, natural gas and NGLs sales $ 999,250 $ 308,025 $ — $ 1,307,275
Commodity price risk management loss, net (162,844) — — (162,844)
Other income 10,972 720 — 11,692
Total revenues 847,378 308,745 — 1,156,123
Costs, expenses and other Lease operating expenses 94,829 47,419 — 142,248
Production taxes 61,577 19,177 — 80,754
Transportation, gathering and processing expenses 23,719 22,634 — 46,353
Exploration, geologic and geophysical expense 1,111 2,943 — 4,054
General and administrative expense 144,345 17,408 — 161,753
Depreciation, depletion and amortization 451,282 192,870 — 644,152
Accretion of asset retirement obligations 5,446 671 — 6,117
Impairment of properties and equipment 292 38,244 — 38,536
(Gain) loss on sale of properties and equipment (853) 10,587 — 9,734
Other expenses 11,317 — — 11,317
Total costs, expenses and other 793,065 351,953 — 1,145,018
Income (loss) from operations 54,313 (43,208) — 11,105
Interest expense (75,257) 4,086 — (71,171)
Interest income 71 1 — 72
Loss before income taxes (20,873) (39,121) — (59,994)
Income tax (expense) benefit (5,784) 9,106 — 3,322
Equity in loss of subsidiary (30,015) — 30,015 —
Net loss $ (56,672) $ (30,015) $ 30,015 $ (56,672)
109
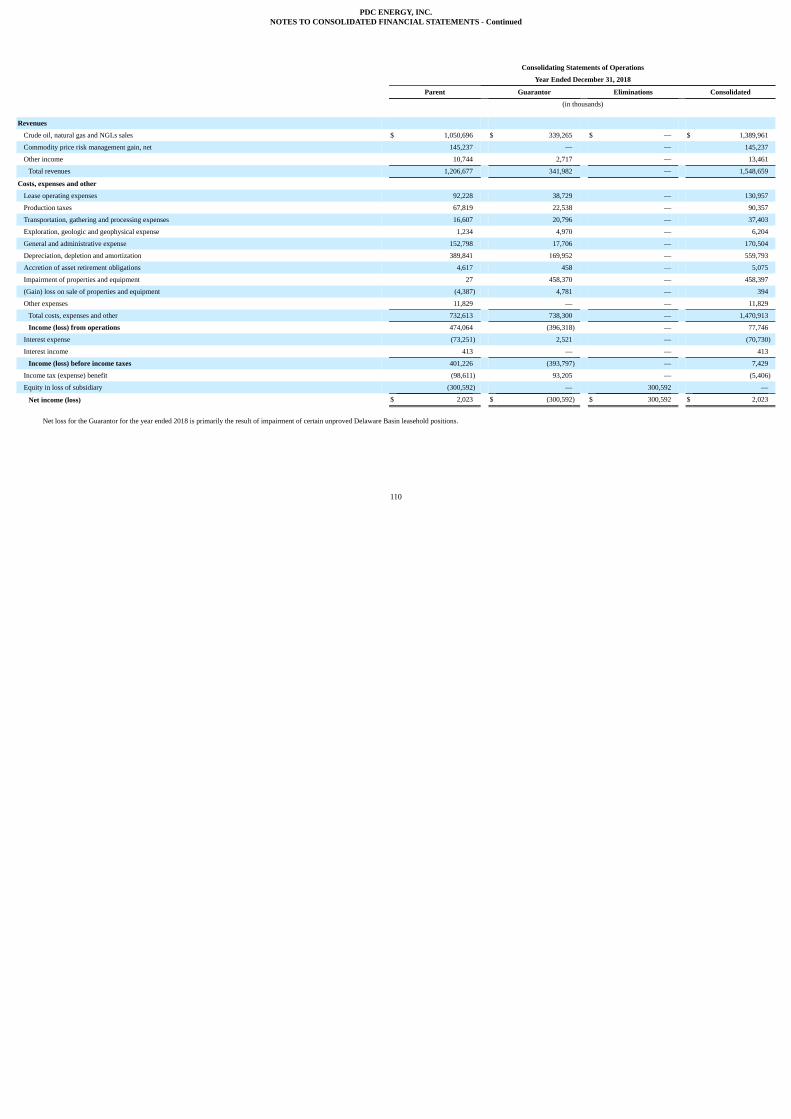
PDC ENERGY, INC.NOTES TO CONSOLIDATED FINANCIAL STATEMENTS - Continued
Consolidating Statements of Operations
Year Ended December 31, 2018
Parent Guarantor Eliminations Consolidated
(in thousands)
Revenues Crude oil, natural gas and NGLs sales $ 1,050,696 $ 339,265 $ — $ 1,389,961
Commodity price risk management gain, net 145,237 — — 145,237
Other income 10,744 2,717 — 13,461
Total revenues 1,206,677 341,982 — 1,548,659
Costs, expenses and other Lease operating expenses 92,228 38,729 — 130,957
Production taxes 67,819 22,538 — 90,357
Transportation, gathering and processing expenses 16,607 20,796 — 37,403
Exploration, geologic and geophysical expense 1,234 4,970 — 6,204
General and administrative expense 152,798 17,706 — 170,504
Depreciation, depletion and amortization 389,841 169,952 — 559,793
Accretion of asset retirement obligations 4,617 458 — 5,075
Impairment of properties and equipment 27 458,370 — 458,397
(Gain) loss on sale of properties and equipment (4,387) 4,781 — 394
Other expenses 11,829 — — 11,829
Total costs, expenses and other 732,613 738,300 — 1,470,913
Income (loss) from operations 474,064 (396,318) — 77,746
Interest expense (73,251) 2,521 — (70,730)
Interest income 413 — — 413
Income (loss) before income taxes 401,226 (393,797) — 7,429
Income tax (expense) benefit (98,611) 93,205 — (5,406)
Equity in loss of subsidiary (300,592) — 300,592 —
Net income (loss) $ 2,023 $ (300,592) $ 300,592 $ 2,023
Net loss for the Guarantor for the year ended 2018 is primarily the result of impairment of certain unproved Delaware Basin leasehold positions.
110

PDC ENERGY, INC.NOTES TO CONSOLIDATED FINANCIAL STATEMENTS - Continued
Consolidating Statements of Operations
Year Ended December 31, 2017
Parent Guarantor Eliminations Consolidated
(in thousands)
Revenues
Crude oil, natural gas, and NGLs sales $ 788,400 $ 124,684 $ — $ 913,084
Commodity price risk management loss, net (3,936) — — (3,936)
Other income 11,901 567 — 12,468
Total revenues 796,365 125,251 — 921,616
Costs, expenses and other Lease operating expenses 68,031 21,610 — 89,641
Production taxes 53,236 7,481 — 60,717
Transportation, gathering and processing expenses 23,301 9,919 — 33,220
Exploration, geologic and geophysical expense 1,092 46,242 — 47,334
General and administrative expense 107,518 12,852 — 120,370
Depreciation, depletion and amortization 403,984 65,100 — 469,084
Accretion of asset retirement obligations 5,965 341 — 6,306
Impairment of properties and equipment 4,951 280,936 — 285,887
Impairment of goodwill — 75,121 — 75,121
Gain on sale of properties and equipment (766) — — (766)
Provision for uncollectible notes receivable (40,203) — — (40,203)
Other expenses 13,157 — — 13,157
Total costs, expenses and other 640,266 519,602 — 1,159,868
Income (loss) from operations 156,099 (394,351) — (238,252)
Loss on extinguishment of debt (24,747) — — (24,747)
Interest expense (79,919) 1,225 — (78,694)
Interest income 2,261 — — 2,261
Income (loss) before income taxes 53,694 (393,126) — (339,432)
Income tax (expense) benefit (33,643) 245,571 — 211,928
Equity in loss of subsidiary (147,555) — 147,555 —
Net loss $ (127,504) $ (147,555) $ 147,555 $ (127,504)
Net loss for the Guarantor for the year ended 2017 is primarily the result of the exploratory dry hole expense, impairment of certain unproved Delaware Basin leasehold positions and the impairment of goodwill.
111
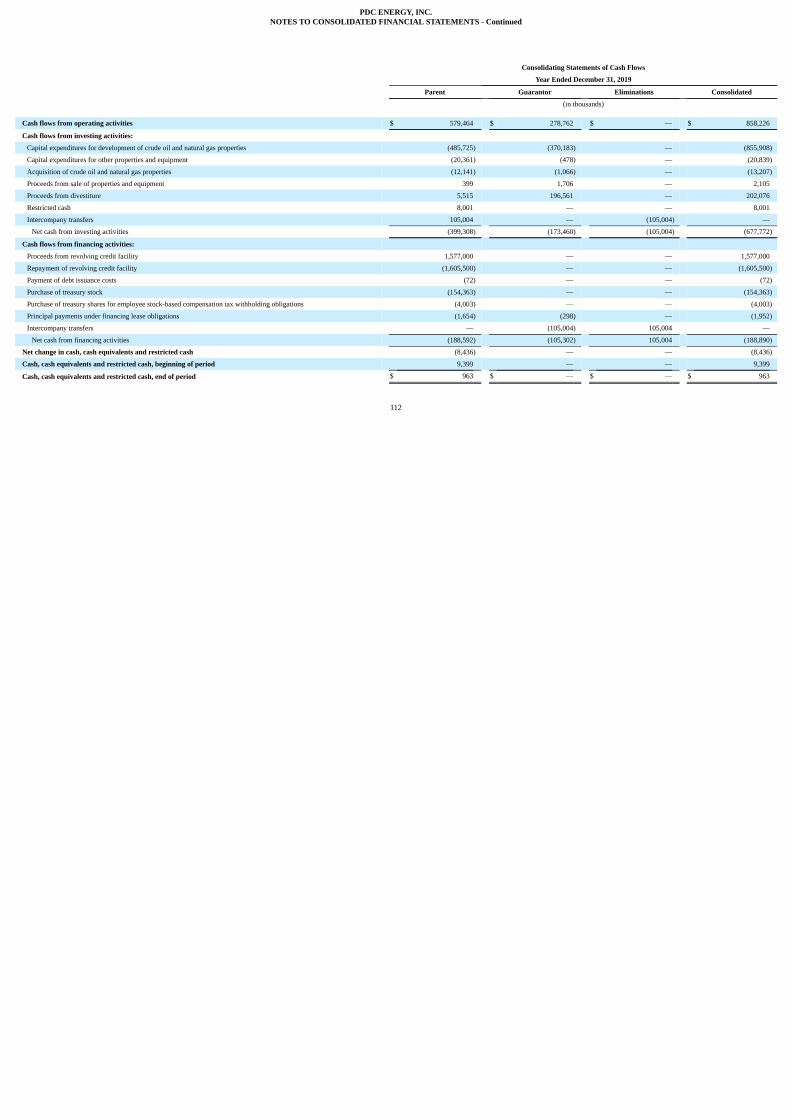
PDC ENERGY, INC.NOTES TO CONSOLIDATED FINANCIAL STATEMENTS - Continued
Consolidating Statements of Cash Flows
Year Ended December 31, 2019
Parent Guarantor Eliminations Consolidated
(in thousands)
Cash flows from operating activities $ 579,464 $ 278,762 $ — $ 858,226
Cash flows from investing activities: Capital expenditures for development of crude oil and natural gas properties (485,725) (370,183) — (855,908)
Capital expenditures for other properties and equipment (20,361) (478) — (20,839)
Acquisition of crude oil and natural gas properties (12,141) (1,066) — (13,207)
Proceeds from sale of properties and equipment 399 1,706 — 2,105
Proceeds from divestiture 5,515 196,561 — 202,076
Restricted cash 8,001 — — 8,001
Intercompany transfers 105,004 — (105,004) —
Net cash from investing activities (399,308) (173,460) (105,004) (677,772)
Cash flows from financing activities: Proceeds from revolving credit facility 1,577,000 — — 1,577,000
Repayment of revolving credit facility (1,605,500) — — (1,605,500)
Payment of debt issuance costs (72) — — (72)
Purchase of treasury stock (154,363) — — (154,363)
Purchase of treasury shares for employee stock-based compensation tax withholding obligations (4,003) — — (4,003)
Principal payments under financing lease obligations (1,654) (298) — (1,952)
Intercompany transfers — (105,004) 105,004 —
Net cash from financing activities (188,592) (105,302) 105,004 (188,890)
Net change in cash, cash equivalents and restricted cash (8,436) — — (8,436)
Cash, cash equivalents and restricted cash, beginning of period 9,399 — — 9,399
Cash, cash equivalents and restricted cash, end of period $ 963 $ — $ — $ 963
112

PDC ENERGY, INC.NOTES TO CONSOLIDATED FINANCIAL STATEMENTS - Continued
Consolidating Statements of Cash Flows
Year Ended December 31, 2018
Parent Guarantor Eliminations Consolidated
(in thousands)
Cash flows from operating activities $ 625,206 $ 264,096 $ — $ 889,302
Cash flows from investing activities: Capital expenditures for development of crude oil and natural gas properties (482,534) (463,816) — (946,350)
Capital expenditures for other properties and equipment (9,806) (1,249) — (11,055)
Acquisition of crude oil and natural gas properties (179,955) (71) — (180,026)
Proceeds from sale of properties and equipment 1,929 1,633 — 3,562
Proceeds from divestiture 44,693 — — 44,693
Restricted cash 1,249 — — 1,249
Intercompany transfers (199,584) — 199,584 —
Net cash from investing activities (824,008) (463,503) 199,584 (1,087,927)
Cash flows from financing activities: Proceeds from revolving credit facility 1,072,500 — — 1,072,500
Repayment of revolving credit facility (1,040,000) — — (1,040,000)
Payment of debt issuance costs (7,704) — — (7,704)
Purchase of treasury shares for employee stock-based compensation tax withholding obligations (5,147) — — (5,147)
Principal payments under financing lease obligations (1,318) (177) — (1,495)
Other (55) — — (55)
Intercompany transfers — 199,584 (199,584) —
Net cash from financing activities 18,276 199,407 (199,584) 18,099
Net change in cash, cash equivalents and restricted cash (180,526) — — (180,526)
Cash, cash equivalents and restricted cash, beginning of period 189,925 — — 189,925
Cash, cash equivalents and restricted cash, end of period $ 9,399 $ — $ — $ 9,399
113

PDC ENERGY, INC.NOTES TO CONSOLIDATED FINANCIAL STATEMENTS - Continued
Consolidating Statements of Cash Flows
Year Ended December 31, 2017
Parent Guarantor Eliminations Consolidated
(in thousands)
Cash flows from operating activities $ 546,954 $ 50,859 $ — $ 597,813
Cash flows from investing activities: Capital expenditures for development of crude oil and natural gas properties (439,897) (297,311) — (737,208)
Capital expenditures for other properties and equipment (3,539) (1,555) — (5,094)
Acquisition of crude oil and natural gas properties (21,000) 5,372 — (15,628)
Proceeds from sale of properties and equipment 10,084 (93) — 9,991
Sale of promissory note 40,203 — — 40,203
Restricted cash (9,250) — — (9,250)
Sales of short-term investments 49,890 — — 49,890
Purchases of short-term investments (49,890) — — (49,890)
Intercompany transfers (239,191) — 239,191 —
Net cash from investing activities (662,590) (293,587) 239,191 (716,986)
Cash flows from financing activities: Proceeds from issuance of senior notes 592,366 — — 592,366
Redemption of senior notes (519,375) — — (519,375)
Payment of debt issuance costs (50) — — (50)
Purchase of treasury shares for employee stock-based compensation tax withholding obligations (6,672) — — (6,672)
Principal payments under financing lease obligations (1,092) (76) — (1,168)
Other (103) — — (103)
Intercompany transfers — 239,191 (239,191) —
Net cash from financing activities 65,074 239,115 (239,191) 64,998
Net change in cash, cash equivalents and restricted cash (50,562) (3,613) — (54,175)
Cash, cash equivalents and restricted cash, beginning of period 240,487 3,613 — 244,100
Cash, cash equivalents and restricted cash, end of period $ 189,925 $ — $ — $ 189,925
114

PDC ENERGY, INC.SUPPLEMENTAL INFORMATION
(Unaudited)
CRUDE OIL AND NATURAL GAS INFORMATION - UNAUDITED
Net Proved Reserves
All of our crude oil, natural gas and NGLs reserves are located in the U.S. We utilize the services of independent petroleum engineers to estimate our crude oil, natural gas and NGLs reserves. As of December 31, 2019, 2018 and2017 (as applicable), all of our estimates of proved reserves for the Wattenberg Field and the Utica Shale were based on reserve reports prepared by Ryder Scott and NSAI prepared the reserve reports for the Delaware Basin. These reserveestimates have been prepared in compliance with professional standards and the reserves definitions prescribed by the SEC.
Proved reserves are those quantities of crude oil, natural gas and NGLs which can be estimated with reasonable certainty to be economically producible under existing economic conditions and operating methods. Proveddeveloped reserves are the proved reserves that can be produced through existing wells with existing equipment and infrastructure and operating methods. Proved undeveloped reserves are proved reserves that are expected to be recoveredfrom new wells on undrilled acreage or from existing wells where a relatively major expenditure is required for development. All of our proved undeveloped reserves conform to the SEC five-year rule requirement that they be scheduled tobe drilled within five years of each location’s initial booking date.
The indicated index prices for our reserves, by commodity, are presented below.
Average Benchmark Prices (1)
As of December 31, Crude Oil
(per Bbl) (2) Natural Gas(per Mcf) (2)
NGLs(per Bbl) (3)
2019 $ 55.69 $ 2.58 $ 55.69
2018 65.56 3.10 65.56
2017 51.34 2.98 51.34
The netted back price used to estimate our reserves, by commodity, are presented below.
Price Used to Estimate Reserves (4)
As of December 31, Crude Oil(per Bbl)
Natural Gas(per Mcf)
NGLs(per Bbl)
2019 $ 52.63 $ 1.50 $ 12.21
2018 61.14 2.15 23.04
2017 48.68 2.31 20.21
(1)Per SEC rules, the pricing used to prepare the proved reserves is based on the unweighted arithmetic average of the first of the month prices for the preceding 12 months.(2) Our benchmark prices for crude oil and natural gas are WTI and Henry Hub, respectively.(3)For NGLs, we use the NYMEX crude oil price as a reference for presentation purposes.(4)These prices are based on the index prices and are net of basin differentials, transportation fees, contractual adjustments and Btu adjustments we experienced for the respective commodity.
115

PDC ENERGY, INC.SUPPLEMENTAL INFORMATION
(Unaudited)
The following tables present the changes in our estimated quantities of proved reserves:
Crude Oil,Condensate
(MBbls) Natural Gas
(MMcf) NGLs
(MBbls) Total
(MBoe)
Proved reserves, January 1, 2017 118,169 833,697 84,288 341,407
Revisions of previous estimates 28,334 96,119 8,104 52,457
Extensions, discoveries and other additions 2,923 11,541 1,158 6,005
Acquisition of reserves 18,971 289,223 19,604 86,778
Dispositions (653) (4,597) (481) (1,900)
Production (12,902) (71,689) (6,981) (31,830)
Proved reserves, December 31, 2017 154,842 1,154,294 105,692 452,917
Revisions of previous estimates 26,548 94,738 12,674 55,011
Extensions, discoveries and other additions 8,786 61,750 8,868 27,946
Acquisition of reserves 19,644 148,674 15,936 60,360
Dispositions (2,507) (35,750) (2,656) (11,121)
Production (16,964) (88,017) (8,527) (40,160)
Proved reserves, December 31, 2018 190,349 1,335,689 131,987 544,953
Revisions of previous estimates 25,875 328,290 31,559 112,147
Extensions, discoveries and other additions 1,056 10,262 1,519 4,285
Acquisition of reserves 553 4,558 448 1,761
Dispositions (1,412) (5,052) (614) (2,868)
Production (19,166) (115,950) (10,923) (49,414)
Proved reserves, December 31, 2019 197,255 1,557,797 153,976 610,864
Proved developed reserves, as of: December 31, 2017 46,862 365,332 35,220 142,971
December 31, 2018 61,821 443,151 43,856 179,535
December 31, 2019 66,211 554,234 55,411 213,994
Proved undeveloped reserves, as of: December 31, 2017 107,980 788,962 70,472 309,946
December 31, 2018 128,528 892,538 88,131 365,418
December 31, 2019 131,044 1,003,563 98,565 396,870
116

PDC ENERGY, INC.SUPPLEMENTAL INFORMATION
(Unaudited)
Developed Undeveloped Total
(MBoe)
Proved reserves, January 1, 2017 98,285 243,122 341,407
Revisions of previous estimates 18,291 34,166 52,457
Extensions, discoveries and other additions 2,292 3,713 6,005
Acquisition of reserves 1,305 85,473 86,778
Dispositions (20) (1,880) (1,900)
Production (31,830) — (31,830)
Undeveloped reserves converted to developed 54,648 (54,648) —
Proved reserves, December 31, 2017 142,971 309,946 452,917
Revisions of previous estimates 6,284 48,727 55,011
Extensions, discoveries and other additions 7,874 20,072 27,946
Acquisition of reserves 8,758 51,602 60,360
Dispositions (4,486) (6,635) (11,121)
Production (40,160) — (40,160)
Undeveloped reserves converted to developed 58,294 (58,294) —
Proved reserves, December 31, 2018 179,535 365,418 544,953
Revisions of previous estimates 27,452 84,695 112,147
Extensions, discoveries and other additions 4,285 — 4,285
Acquisition of reserves 441 1,320 1,761
Dispositions (474) (2,394) (2,868)
Production (49,414) — (49,414)
Undeveloped reserves converted to developed 52,169 (52,169) —
Proved reserves, December 31, 2019 213,994 396,870 610,864
2019 Activity. During 2019, we increased proved reserves by 65.9 MMBoe, or 12 percent, relative to December 31, 2018. The increase in proved reserves was primarily the result of our 2019 development activities and our futuredrilling schedule. In 2019, we produced 49.4 MMboe.
Revisions of Previous Estimates-Proved Developed Reserves. Proved developed reserves experienced a net positive revision of 17.3 MMBoe due to a decrease in operating costs, performance revisions and other items. We alsoexperienced an additional increase of 10.2 MMBoe in proved developed reserves related to our current year drilling activities. These net positive revisions were partially offset by a decrease in prices for crude oil, natural gas and NGLs.
Revisions of Previous Estimates-PUDs. Upward revisions to our PUD reserves were related to an increase of 74.2 MMBoe reflecting additional locations on proven acreage resulting from our drilling plan. Other changesimpacting the increase were due to commodity pricing, lease operating expenses and type curve revisions, which resulted in further upward revisions of 23.4 MMBoe of PUD reserves. Partially offsetting this increase was a negativerevision of 12.9 MMBoe due to drilling schedule changes.
Extensions, Discoveries and Other Additions-Proved Developed Reserves. Developed activity for 2019 included the addition of 4.3 MMBoe of developed reserves related to three gross (three net) newly-drilled wells.
Extensions, Discoveries and Other Additions-PUDs. There were no extensions, discoveries or other additions for PUD reserves during 2019.
Acquisitions of Reserves-Proved Developed Reserves. Proved developed reserves acquired in various acreage swaps and acquisitions were 0.4 MMBoe during 2019.
Acquisitions of Reserves-PUDs. We acquired 1.3 MMBoe of PUD reserves in 2019 in acreage swaps and acquisitions.
Dispositions-Proved Developed Reserves. Dispositions of 0.5 MMBoe were related to a divestiture and acreage surrendered in various acreage swaps.
Dispositions-PUDs. Dispositions of 2.4 MMBoe were related to a divestiture and acreage surrendered in various acreage swaps.
117

PDC ENERGY, INC.SUPPLEMENTAL INFORMATION
(Unaudited)
At December 31, 2018, we projected a PUD reserve conversion rate of 16 percent for 2019. During 2019, a smaller number of wells were turned-in-line than we anticipated, resulting in an actual conversion rate of 14 percent. Weconverted 52.2 MMBoe of PUD reserves at December 31, 2018 to proved developed reserves as of December 31, 2019.
Based on economic conditions on December 31, 2019, our approved development plan provides for the development of our remaining PUD locations within five years of the date such reserves were initially recorded. As ofDecember 31, 2019, our 2020 PUD reserve conversion rate is expected to be approximately 26 percent. The balance of the PUD reserves are scheduled to be developed over the remaining four years in accordance with our currentdevelopment plan. The level of capital spending necessary to achieve this drilling schedule is consistent with our recent performance and our outlook for future development activities.
2018 Activity. During 2018, we increased proved reserves by 92.0 MMBoe, or 20 percent, relative to December 31, 2017. The increase in proved reserves was primarily a result of acreage exchange transactions and acquisitions inthe Wattenberg Field and reserve additions on proved acreage resulting from our 2018 development activities. In 2018, we produced 40.2 MMboe.
Revisions of Previous Estimates-Proved Developed Reserves. Proved developed reserves experienced a net positive revision of 11.4 MMBoe due to an increase in prices for crude oil, natural gas and NGLs, offset by net negative
revisions of 5.1 MMBoe for an increase in operating costs, performance revisions and other items.
Revisions of Previous Estimates-PUDs. Upward revisions to our PUD reserves were related to an increase of 71.7 MMBoe reflecting newly-booked locations on proven acreage resulting from our drilling activities. Partiallyoffsetting this increase was a negative revision of 26.8 MMBoe in the Wattenberg Field due to drilling schedule changes and updated timing for development of certain locations exceeding the five-year rule. Drilling schedule changes,primarily related to 2018 acreage exchanges, resulted in these locations being reclassified from proved to unproved status. All other changes were due to commodity pricing, lease operating expenses and type curve revisions, whichresulted in further upward revisions of 3.8 MMBoe of PUD reserves.
Extensions, Discoveries and Other Additions-Proved Developed Reserves. Developed additions for 2018 included the addition of 7.9 MMBoe of developed reserves related to 17 gross (9.2 net) newly-drilled wells.
Extensions, Discoveries and Other Additions-PUDs. PUD activity was comprised primarily of 20.1 MMBoe of PUD reserves related to 16 gross (15.0 net) PUD locations in the Delaware Basin.
Acquisitions of Reserves-Proved Developed Reserves. Proved developed reserves acquired in various acreage swaps and an acquisition were 8.8 MMBoe during 2018.
Acquisitions of Reserves-PUDs. We acquired 47.6 MMBoe and 4.0 MMBoe of PUD reserves in 2018 in acreage swaps and an acquisition, respectively.
Dispositions-Proved Developed Reserves. Dispositions of 4.5 MMBoe were related to a divestiture and acreage surrendered in various acreage swaps.
Dispositions-PUDs. Dispositions of 6.6 MMBoe reflect that we primarily divested proved acreage with future locations that were not in our five-year drilling plan as of December 31, 2017 in the acreage swap transactions.
At December 31, 2017, we projected a PUD reserve conversion rate of 16 percent for 2018. During 2018, a larger number of wells were turned-in-line than we anticipated, resulting in an actual conversion rate of 19 percent. Weconverted 58.3 MMBoe of PUD reserves at December 31, 2017 to proved developed reserves as of December 31, 2018.
2017 Activity. During 2017, we increased proved reserves by 111.5 MMBoe, or 33 percent, relative to December 31, 2016. The increase in proved reserves was primarily a result of an increase in acquisitions and reserve additionson proved acreage in the Delaware Basin from our 2017 development plan. In 2017, we produced 31.8 MMBoe.
Revisions of Previous Estimates-Proved Developed Reserves. Proved developed reserves experienced a net positive revision of 17.7 MMBoe due to an increase in prices for crude oil, natural gas and NGLs and net positiverevisions of 0.6 MMBoe reflecting changes in operating costs, performance revisions and other items.
118
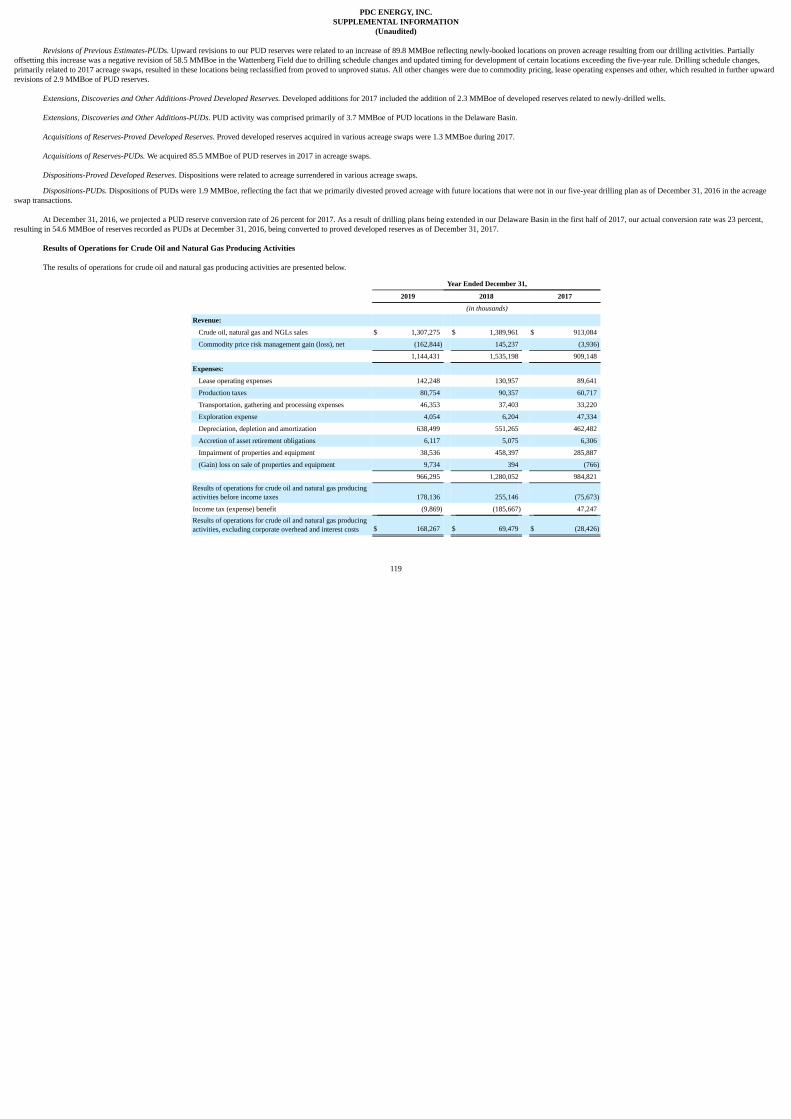
PDC ENERGY, INC.SUPPLEMENTAL INFORMATION
(Unaudited)
Revisions of Previous Estimates-PUDs. Upward revisions to our PUD reserves were related to an increase of 89.8 MMBoe reflecting newly-booked locations on proven acreage resulting from our drilling activities. Partiallyoffsetting this increase was a negative revision of 58.5 MMBoe in the Wattenberg Field due to drilling schedule changes and updated timing for development of certain locations exceeding the five-year rule. Drilling schedule changes,primarily related to 2017 acreage swaps, resulted in these locations being reclassified from proved to unproved status. All other changes were due to commodity pricing, lease operating expenses and other, which resulted in further upwardrevisions of 2.9 MMBoe of PUD reserves.
Extensions, Discoveries and Other Additions-Proved Developed Reserves. Developed additions for 2017 included the addition of 2.3 MMBoe of developed reserves related to newly-drilled wells.
Extensions, Discoveries and Other Additions-PUDs. PUD activity was comprised primarily of 3.7 MMBoe of PUD locations in the Delaware Basin.
Acquisitions of Reserves-Proved Developed Reserves. Proved developed reserves acquired in various acreage swaps were 1.3 MMBoe during 2017. Acquisitions of Reserves-PUDs. We acquired 85.5 MMBoe of PUD reserves in 2017 in acreage swaps.
Dispositions-Proved Developed Reserves. Dispositions were related to acreage surrendered in various acreage swaps.
Dispositions-PUDs. Dispositions of PUDs were 1.9 MMBoe, reflecting the fact that we primarily divested proved acreage with future locations that were not in our five-year drilling plan as of December 31, 2016 in the acreageswap transactions.
At December 31, 2016, we projected a PUD reserve conversion rate of 26 percent for 2017. As a result of drilling plans being extended in our Delaware Basin in the first half of 2017, our actual conversion rate was 23 percent,resulting in 54.6 MMBoe of reserves recorded as PUDs at December 31, 2016, being converted to proved developed reserves as of December 31, 2017.
Results of Operations for Crude Oil and Natural Gas Producing Activities
The results of operations for crude oil and natural gas producing activities are presented below.
Year Ended December 31,
2019 2018 2017
(in thousands)
Revenue: Crude oil, natural gas and NGLs sales $ 1,307,275 $ 1,389,961 $ 913,084
Commodity price risk management gain (loss), net (162,844) 145,237 (3,936)
1,144,431 1,535,198 909,148
Expenses: Lease operating expenses 142,248 130,957 89,641
Production taxes 80,754 90,357 60,717
Transportation, gathering and processing expenses 46,353 37,403 33,220
Exploration expense 4,054 6,204 47,334
Depreciation, depletion and amortization 638,499 551,265 462,482
Accretion of asset retirement obligations 6,117 5,075 6,306
Impairment of properties and equipment 38,536 458,397 285,887
(Gain) loss on sale of properties and equipment 9,734 394 (766)
966,295 1,280,052 984,821Results of operations for crude oil and natural gas producingactivities before income taxes 178,136 255,146 (75,673)
Income tax (expense) benefit (9,869) (185,667) 47,247Results of operations for crude oil and natural gas producingactivities, excluding corporate overhead and interest costs $ 168,267 $ 69,479 $ (28,426)
119
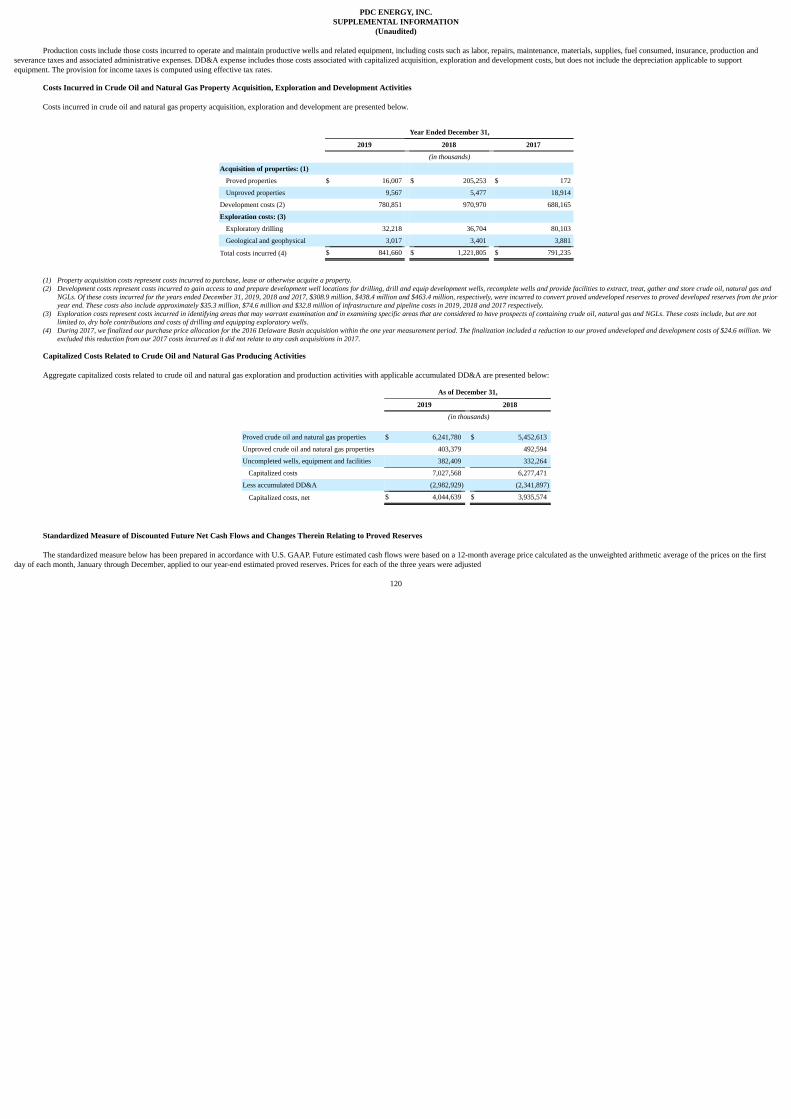
PDC ENERGY, INC.SUPPLEMENTAL INFORMATION
(Unaudited)
Production costs include those costs incurred to operate and maintain productive wells and related equipment, including costs such as labor, repairs, maintenance, materials, supplies, fuel consumed, insurance, production andseverance taxes and associated administrative expenses. DD&A expense includes those costs associated with capitalized acquisition, exploration and development costs, but does not include the depreciation applicable to supportequipment. The provision for income taxes is computed using effective tax rates.
Costs Incurred in Crude Oil and Natural Gas Property Acquisition, Exploration and Development Activities
Costs incurred in crude oil and natural gas property acquisition, exploration and development are presented below.
Year Ended December 31,
2019 2018 2017
(in thousands)
Acquisition of properties: (1) Proved properties $ 16,007 $ 205,253 $ 172
Unproved properties 9,567 5,477 18,914
Development costs (2) 780,851 970,970 688,165
Exploration costs: (3) Exploratory drilling 32,218 36,704 80,103
Geological and geophysical 3,017 3,401 3,881
Total costs incurred (4) $ 841,660 $ 1,221,805 $ 791,235
(1) Property acquisition costs represent costs incurred to purchase, lease or otherwise acquire a property.(2) Development costs represent costs incurred to gain access to and prepare development well locations for drilling, drill and equip development wells, recomplete wells and provide facilities to extract, treat, gather and store crude oil, natural gas and
NGLs. Of these costs incurred for the years ended December 31, 2019, 2018 and 2017, $308.9 million, $438.4 million and $463.4 million, respectively, were incurred to convert proved undeveloped reserves to proved developed reserves from the prioryear end. These costs also include approximately $35.3 million, $74.6 million and $32.8 million of infrastructure and pipeline costs in 2019, 2018 and 2017 respectively.
(3) Exploration costs represent costs incurred in identifying areas that may warrant examination and in examining specific areas that are considered to have prospects of containing crude oil, natural gas and NGLs. These costs include, but are notlimited to, dry hole contributions and costs of drilling and equipping exploratory wells.
(4) During 2017, we finalized our purchase price allocation for the 2016 Delaware Basin acquisition within the one year measurement period. The finalization included a reduction to our proved undeveloped and development costs of $24.6 million. Weexcluded this reduction from our 2017 costs incurred as it did not relate to any cash acquisitions in 2017.
Capitalized Costs Related to Crude Oil and Natural Gas Producing Activities
Aggregate capitalized costs related to crude oil and natural gas exploration and production activities with applicable accumulated DD&A are presented below:
As of December 31,
2019 2018
(in thousands)
Proved crude oil and natural gas properties $ 6,241,780 $ 5,452,613
Unproved crude oil and natural gas properties 403,379 492,594
Uncompleted wells, equipment and facilities 382,409 332,264
Capitalized costs 7,027,568 6,277,471
Less accumulated DD&A (2,982,929) (2,341,897)
Capitalized costs, net $ 4,044,639 $ 3,935,574
Standardized Measure of Discounted Future Net Cash Flows and Changes Therein Relating to Proved Reserves
The standardized measure below has been prepared in accordance with U.S. GAAP. Future estimated cash flows were based on a 12-month average price calculated as the unweighted arithmetic average of the prices on the firstday of each month, January through December, applied to our year-end estimated proved reserves. Prices for each of the three years were adjusted
120

PDC ENERGY, INC.SUPPLEMENTAL INFORMATION
(Unaudited)
by field for Btu content, transportation and regional price differences; however, they were not adjusted to reflect the value of our commodity derivatives. Production and development costs were based on prices as of December 31 for eachof the respective years presented. The amounts shown do not give effect to non-property related expenses, such as corporate general and administrative expenses, debt service or to depreciation, depletion and amortization expense.Production and development costs include those cash flows associated with the expected ultimate settlement of our asset retirement obligations. Future estimated income tax expense is computed by applying the statutory rate in effect at theend of each year to the projected future pre-tax net cash flows, less the tax basis of the properties and gives effect to permanent differences, tax credits and allowances related to the properties.
The following table presents information with respect to the standardized measure of discounted future net cash flows relating to proved reserves. Changes in the demand for crude oil, natural gas and NGLs, inflation and other
factors make such estimates inherently imprecise and subject to substantial revision. This table should not be construed to be an estimate of the current market value of our proved reserves.
As of December 31,
2019 2018 2017
(in thousands)
Future estimated cash flows $ 14,590,604 $ 17,554,880 $ 12,340,407
Future estimated production costs (1) (4,530,173) (4,782,948) (3,245,627)
Future estimated development costs (3,257,106) (3,632,822) (2,893,335)
Future estimated income tax expense (907,382) (1,404,121) (748,494)
Future net cash flows 5,895,943 7,734,989 5,452,951
10% annual discount for estimated timing of cash flows (2,585,609) (3,287,273) (2,572,846)
Standardized measure of discounted future estimated net cash flows $ 3,310,334 $ 4,447,716 $ 2,880,105
(1) Represents future estimated lease operating expenses, production taxes and transportation, gathering and processing expenses. The following table presents the principal sources of change in the standardized measure of discounted future estimated net cash flows:
Year Ended December 31,
2019 2018 2017
(in thousands)
Beginning of period $ 4,447,716 $ 2,880,105 $ 1,420,629Sales of crude oil, natural gas and NGLs production, net of productioncosts (1,037,920) (1,131,244) (729,506)
Net changes in prices and production costs (1) (2,122,538) 936,077 841,713
Extensions, discoveries and improved recovery, less related costs 39,606 190,084 47,240
Sales of reserves (14,533) (42,362) (2,613)
Purchases of reserves 18,816 467,807 224,483
Development costs incurred during the period 605,753 462,088 419,047
Revisions of previous quantity estimates 538,242 631,198 484,431
Changes in estimated income taxes 346,826 (232,002) (138,560)
Net changes in future development costs 206,003 (123,663) 25,183
Accretion of discount 532,127 583,744 167,487
Timing and other (249,764) (174,116) 120,571
End of period $ 3,310,334 $ 4,447,716 $ 2,880,105
(1) Our weighted-average price, net of production costs per Boe, in our 2019 reserve report decreased to $16.18 as compared to $23.44 for 2018 and $20.08 for 2017. The data presented should not be viewed as representing the expected cash flows from, or current value of, existing proved reserves since the computations are based on a large number of estimates and arbitrary assumptions.
Reserve quantities cannot be measured with precision and their estimation requires many judgmental determinations and frequent revisions. The required projection of production and related expenditures over time requires furtherestimates with respect to pipeline availability, rates of demand and governmental control. Actual future prices and costs are likely to be substantially different from the recent average prices and current costs utilized in the computation ofreported amounts. Any analysis or evaluation of
121

PDC ENERGY, INC.SUPPLEMENTAL INFORMATION
(Unaudited)
the reported amounts should give specific recognition to the computational methods utilized and the limitations inherent therein.
122

PDC ENERGY, INC.
QUARTERLY FINANCIAL INFORMATION - UNAUDITED
Quarterly financial data for the years ended December 31, 2019 and 2018 is presented below. The sum of the quarters may not equal the total of the year's net income or loss per share due to changes in the weighted-average sharesoutstanding throughout the year.
2019 Quarter Ended
March 31 June 30 September 30 December 31
(in thousands, except per share data)
Total revenues $ 134,500 $ 390,658 $ 365,943 $ 265,022
Total costs, expenses and other 275,120 280,623 321,562 267,713
Income (loss) from operations (140,620) 110,035 44,381 (2,691)
Income (loss) before income taxes (157,588) 91,135 26,570 (20,111)
Net income (loss) $ (120,176) $ 68,548 $ 15,908 $ (20,952)
Earnings per share: Basic $ (1.82) $ 1.04 $ 0.25 $ (0.34)
Diluted (1.82) 1.04 0.25 (0.34)
2018 Quarter Ended
March 31 June 30 September 30 December 31
(in thousands, except per share data)
Total revenues $ 260,600 $ 212,531 $ 280,717 $ 794,811
Total costs, expenses and other 260,924 400,770 270,593 538,626
Income (loss) from operations (324) (188,239) 10,124 256,185
Income (loss) before income taxes (17,705) (205,580) (7,310) 238,024
Net income (loss) $ (13,139) $ (160,257) $ (3,434) $ 178,853
Earnings per share: Basic $ (0.20) $ (2.43) $ (0.05) $ 2.71
Diluted (0.20) (2.43) (0.05) 2.71
123

PDC ENERGY, INC.
FINANCIAL STATEMENT SCHEDULE
Schedule II -VALUATION AND QUALIFYING ACCOUNTS
Description
BeginningBalance
January 1,
Charged toCosts andExpenses Deductions (1)
EndingBalance
December 31,
(in thousands)
2019:
Allowance for doubtful accounts $ 4,381 $ 3,209 $ 114 $ 7,476
Allowance for expirations of unproved crude oil and natural gas properties 542,709 8,523 544,351 6,881
2018: Allowance for doubtful accounts 3,128 1,276 23 4,381
Allowance for expirations of unproved crude oil and natural gas properties 251,159 388,068 96,518 542,709
2017: Allowance for uncollectible notes $ 44,038 $ — $ 44,038 $ —
Allowance for doubtful accounts 2,190 1,108 170 3,128
Allowance for expirations of unproved crude oil and natural gas properties 359 263,817 13,017 251,159
(1) For allowance for uncollectible notes, deductions represent reversals of allowances due to the collection of amounts owed. For allowance for doubtful accounts, deductions represent the write-off of accounts receivable deemed uncollectible. For allowance forexpirations of unproved crude oil and natural gas properties, deductions represent actual expired or abandoned unproved crude oil and natural gas properties, with a corresponding decrease to the historical cost of the associated asset.
124

ITEM 9. CHANGES IN AND DISAGREEMENTS WITH ACCOUNTANTS ON ACCOUNTING AND FINANCIAL DISCLOSURE
None.
ITEM 9A. CONTROLS AND PROCEDURES
Evaluation of Disclosure Controls and Procedures
As of December 31, 2019, we carried out an evaluation under the supervision and with the participation of management, including the Chief Executive Officer and Chief Financial Officer, of the effectiveness of the design andoperation of our disclosure controls and procedures defined in Rules 13a-15(e) and 15d-15(e) of the Exchange Act. Based on the results of this evaluation, the Chief Executive Officer and Chief Financial Officer concluded that ourdisclosure controls and procedures were effective as of December 31, 2019.
Management's Report on Internal Control over Financial Reporting Management is responsible for establishing and maintaining adequate internal control over financial reporting as such term is defined in Rules 13a-15(f) and 15d-15(f) of the Exchange Act. Internal control over financial reporting
is a process designed by, or under the supervision of, our Chief Executive Officer and Chief Financial Officer, or persons performing similar functions, and effected by our board of directors, management and other personnel to providereasonable assurance regarding the reliability of financial reporting and the preparation of financial statements for external purposes in accordance with generally accepted accounting principles.
Because of its inherent limitations, internal control over financial reporting may not prevent or detect misstatements. Also, projections of any evaluation of effectiveness to future periods are subject to the risk that controls maybecome inadequate because of changes in conditions, or that the degree of compliance with policies or procedures may deteriorate.
Management has assessed the effectiveness of our internal control over financial reporting as of December 31, 2019, based upon the criteria established in Internal Control - Integrated Framework (2013) issued by the Committeeof Sponsoring Organizations of the Treadway Commission ("COSO").
The effectiveness of our internal control over financial reporting as of December 31, 2019 has been audited by PricewaterhouseCoopers LLP, an independent registered public accounting firm, as stated in their report which
appears under Item 8.
Remediation of Material Weaknesses
We previously identified and disclosed in our Annual Report on Form 10-K for the year ended December 31, 2018 material weaknesses in our internal control over financial reporting related to an insufficient complement ofpersonnel within our Land Department, which contributed to the ineffective design and maintenance of controls to verify the completeness and accuracy of certain land administrative records associated with unproved leases.
We remediated these material weaknesses in 2019 by enhancing the design of existing controls through a combination of new leadership, hiring additional personnel with relevant experience and increased layers of supervision anddivision of responsibilities within the Land Department. We also redesigned existing control activities to verify the completeness and accuracy of land administrative records associated with unproved leases, including the verification of thereliability of underlying data used in the execution of the control activities.
Changes in Internal Control over Financial Reporting
There were no changes in our internal control over financial reporting during the quarter ended December 31, 2019 that have materially affected, or are reasonably likely to materially affect, our internal control over financialreporting.
ITEM 9B. OTHER INFORMATION
None.
125

PART III
ITEM 10. DIRECTORS, EXECUTIVE OFFICERS AND CORPORATE GOVERNANCE
Information relating to this Item will be included in an amendment to this report or the proxy statement to be filed pursuant to Regulation 14A for our 2020 Annual Stockholders' meeting and is incorporated by reference in thisreport.
ITEM 11. EXECUTIVE COMPENSATION
Information relating to this Item will be included in an amendment to this report or the proxy statement to be filed pursuant to Regulation 14A for our 2020 Annual Stockholders' meeting and is incorporated by reference in thisreport.
ITEM 12. SECURITY OWNERSHIP OF CERTAIN BENEFICIAL OWNERS AND MANAGEMENT AND RELATED STOCKHOLDER MATTERS
Information relating to this Item will be included in an amendment to this report or the proxy statement to be filed pursuant to Regulation 14A for our 2020 Annual Stockholders' meeting and is incorporated by reference in thisreport.
ITEM 13. CERTAIN RELATIONSHIPS AND RELATED TRANSACTIONS AND DIRECTOR INDEPENDENCE
Information relating to this Item will be included in an amendment to this report or the proxy statement to be filed pursuant to Regulation 14A for our 2020 Annual Stockholders' meeting and is incorporated by reference in thisreport.
ITEM 14. PRINCIPAL ACCOUNTING FEES AND SERVICES
Information relating to this Item will be included in an amendment to this report or the proxy statement to be filed pursuant to Regulation 14A for our 2020 Annual Stockholders' meeting and is incorporated by reference in thisreport.
PART IV
ITEM 15. EXHIBITS, FINANCIAL STATEMENT SCHEDULES
(a) (1) Exhibits:
See Exhibits Index on the following page.
126

ITEM 16. FORM 10-K SUMMARY
None.Exhibits Index
Incorporated by Reference Exhibit Number Exhibit Description Form SEC File Number Exhibit Filing Date Filed Herewith
2.1 Plan of Conversion, dated June 5, 2015, by PDC Energy, Inc. 8-K12B 001-37419 2.1 6/8/2015
2.2 Agreement and Plan of Merger, dated as of August 25, 2019 by and between PDC Energy, Inc., and SRC Energy Inc. 8-K 001-37419 2.1 8/26/2019
3.1 Certificate of Incorporation of PDC Energy, Inc. 8-K12B 001-37419 3.1 6/8/2015
3.2 Bylaws of PDC Energy, Inc. 8-K12B 001-37419 3.2 6/8/2015
4.1 Description of Capital Stock X
4.1.1 Form of Common Stock Certificate of PDC Energy, Inc. X
4.2
Indenture, dated as of November 29, 2017, by and between PDC Energy, Inc., PDC Permian, Inc., a subsidiaryguarantor of PDC Energy, Inc., and U.S. Bank Trust National Association, as Trustee, relating to the 5.750% SeniorNotes due 2026.
8-K
001-37419
4.1
11/29/2017
4.3
Base Indenture, dated as of September 14, 2016, by and between PDC Energy, Inc. and U.S. Bank Trust NationalAssociation, as Trustee.
8-K
001-37419
4.1
9/14/2016
4.4
First Supplemental Indenture, dated as of September 14, 2016, by and between PDC Energy, Inc. and U.S. Bank TrustNational Association, as Trustee, relating to the 1.125% Convertible Senior Notes due 2021.
8-K
001-37419
4.2
9/14/2016
4.5
Indenture, dated as of September 15, 2016, by and between PDC Energy, Inc. and U.S. Bank Trust NationalAssociation, as Trustee, relating to the 6.125% Senior Notes due 2024.
8-K
001-37419
4.1
9/15/2016
4.6 Indenture, dated as of November 29, 2017, among SRC Energy, Inc. and U.S. Bank National Association as Trustee. 8-K 001-37419 4.1 11/29/2017
4.7
First Supplemental Indenture, dated as of January 14, 2020, among PDC Energy, Inc. and U.S. Bank NationalAssociation as Trustee.
8-K
001-37419
4.2
1/14/2019
10.1 Form of Indemnification Agreement. 8-K 000-07246 10.1 6/8/2015
10.2 401(k) and Profit Sharing Plan, as amended on January 4, 2016. 10-K 001-37419 10.2 2/28/2017
10.3 Amended and Restated Non-Employee Director Deferred Compensation Plan. 10-K 001-37419 10.3 2/27/2018
10.4 2004 Long-Term Equity Compensation Plan amended and restated as of March 8, 2008 ("2004 Plan"). 10-K 000-07246 10.26 2/27/2009
10.4.1 Summary of 2010 Stock Appreciation Rights and Restricted Stock Awards under the 2004 Plan. 8-K 000-07246 4/23/2010
10.5 Amended and Restated 2010 Long-Term Equity Compensation Plan, as amended. 10-K 001-37419 10.5 2/22/2016
10.6 Executive Severance Compensation Plan, as amended. 10-K 001-37419 10.6 2/22/2016
10.7.1 Form of 2011 Restricted Stock/Stock Appreciation Rights Agreement. 10-K 000-07246 10.5.2 2/21/2014
10.7.2 Form of 2013 Restricted Stock/Stock Appreciation Rights Agreement. 10-K 000-07246 10.10 2/27/2013
10.7.3 Form of 2014 Restricted Stock/Stock Appreciation Rights Agreement. 10-K 000-07246 10.5.5 2/19/2015
10.7.4 Form of 2015 Stock Appreciation Rights Agreement. 10-K 000-07246 10.5.8 2/19/2015
127

Incorporated by Reference Exhibit Number Exhibit Description Form SEC File Number Exhibit Filing Date Filed Herewith
10.7.5 Form of 2018 Performance Share Agreement. 10-Q 001-37419 99.1 5/3/2018
10.7.6 Form of 2018 Restricted Stock Unit Agreement (Executives). 10-Q 001-37419 99.2 5/3/2018
10.7.7 Form of 2018 Restricted Stock Unit Agreement (Directors). 10-Q 001-37419 99.3 5/3/2018
10.7.8 Form of 2019 Performance Share Agreement. 10-Q 001-37419 99.1 5/2/2019
10.7.9 Form of 2019 Restricted Stock Unit Agreement (Directors). 10-Q 001-37419 99.2 5/2/2019
10.7.10
Form of 2019 Restricted Stock Unit Agreement (Executives) (Amended and Restated 2010 Long-Term EquityCompensation Plan).
10-Q
001-37419
99.3
5/2/2019
10.7.11 Form of 2019 Restricted Stock Unit Agreement (Executives) (2018 Equity Incentive Plan). 10-Q 001-37419 99.4 5/2/2019
10.7.12
SRC Energy, Inc./PDC Energy, Inc. Merger Performance Share Agreement, dated January 13, 2020, by and betweenPDC Energy, Inc.(as successor to SRC Energy, Inc.) and Lynn A. Peterson.
8-K
001-37419
10.2
1/14/2020
10.8
Employment Agreement with Lance A. Lauck, Senior Vice President of Business Development, dated as of April 19,2010.
8-K
000-07246
10.4
4/23/2010
10.9 2018 Equity Incentive Plan. 8-K 001-37419 10.1 5/31/2018
10.10 SRC Energy Inc. 2015 Equity Incentive Plan. 8-K 001-37419 10.1 1/14/2020
10.11
Fourth Amended and Restated Credit Agreement, dated as of May 23, 2018, among PDC Energy, Inc. as Borrower,each of the Lenders party thereto, and JPMorgan Chase Bank, N.A. as Administrative Agent for the Lenders.
8-K
001-37419
10.1
5/25/2018
10.11.1
First Amendment to Fourth Amended and Restated Credit Agreement, dated as August 30, 2019, among PDC Energy,Inc. as Borrower, each of the Lenders party thereto, and JPMorgan Chase Bank, N.A. as Administrative Agent for theLenders.
8-K
001-37419
10.1
9/4/2019
21.1 Subsidiaries. X
23.1 Consent of PricewaterhouseCoopers LLP. X
23.2 Consent of Ryder Scott Company, L.P., Petroleum Consultants. X
23.3 Consent of Netherland, Sewell & Associates, Inc., Petroleum Consultants. X
31.1
Certification by Chief Executive Officer pursuant to Rule 13a-14(a) and 15d-14(a) of the Exchange Act Rules, asadopted pursuant to Section 302 of the Sarbanes-Oxley Act of 2002.
X
31.2
Certification by Chief Financial Officer pursuant to Rule 13a-14(a) and 15d-14(a) of the Exchange Act Rules, asadopted pursuant to Section 302 of the Sarbanes-Oxley Act of 2002.
X
32.1*
Certifications by Chief Executive Officer and Chief Financial Officer pursuant to Title 18 U.S.C. Section 1350, asadopted pursuant to Section 906 of Sarbanes-Oxley Act of 2002.
99.1 Report of Independent Petroleum Consultants - Ryder Scott Company, L.P. X
99.2 Report of Independent Petroleum Consultants - Netherland, Sewell & Associates, Inc. X
128

Incorporated by Reference Exhibit Number Exhibit Description Form SEC File Number Exhibit Filing Date Filed Herewith
101.INS
XBRL Instance Document - the instance document does not appear in the Interactive Data File because its XBRL tagsare embedded within the Inline XBRL document
X
101.SCH XBRL Taxonomy Extension Schema Document X
101.CAL XBRL Taxonomy Extension Calculation Linkbase Document X
101.DEF XBRL Taxonomy Extension Definition Linkbase Document
X
101.LAB XBRL Taxonomy Extension Label Linkbase Document X
101.PRE XBRL Taxonomy Extension Presentation Linkbase Document
X
104 Cover Page Interactive Data File (formatted as inline XBRL and contained in Exhibit 101) X
* Furnished herewith.
129

SIGNATURES
Pursuant to the requirements of Section 13 or 15(d) of the Securities Exchange Act of 1934, the Registrant has duly caused this report to be signed on its behalf by the undersigned, thereunto duly authorized.
PDC ENERGY, INC.
By: /s/ Barton Brookman
Barton Brookman
President and Chief Executive Officer
February 26, 2020
Pursuant to the requirements of the Securities Exchange Act of 1934, this report has been signed below by the following persons on behalf of the Registrant and in the capacities and on the dates indicated:
Signature Title Date
/s/ Barton Brookman President, Chief Executive Officer and Director February 26, 2020
Barton Brookman (principal executive officer)
/s/ R. Scott Meyers Senior Vice President and Chief Financial Officer February 26, 2020
R. Scott Meyers (principal financial officer)
/s/ Douglas Griggs Chief Accounting Officer February 26, 2020
Douglas Griggs (principal accounting officer)
/s/ Jeffrey C. Swoveland Chairman and Director February 26, 2020
Jeffrey C. Swoveland
/s/ Anthony J. Crisafio Director February 26, 2020
Anthony J. Crisafio
/s/ Mark E. Ellis Director February 26, 2020
Mark E. Ellis
/s/ Christina M. Ibrahim Director February 26, 2020
Christina M. Ibrahim
/s/ Paul J. Korus Director February 26, 2020
Paul J. Korus
/s/ Randy S. Nickerson Director February 26, 2020
Randy S. Nickerson
/s/ David C. Parke Director February 26, 2020
David C. Parke
/s/ Lynn A. Peterson Director February 26, 2020
Lynn A. Peterson
130

GLOSSARY OF UNITS OF MEASUREMENT AND INDUSTRY TERMS
UNITS OF MEASUREMENT
The following presents a list of units of measurement used throughout the document.
Bbl – One barrel of crude oil or NGL or 42 gallons of liquid volume.Bcf – One billion cubic feet of natural gas volume.Boe – One barrel of crude oil equivalent.Btu – British thermal unit.BBtu – One billion British thermal units.MBoe – One thousand barrels of crude oil equivalent.MBbls – One thousand barrels of crude oil.Mcf – One thousand cubic feet of natural gas volume.MMBoe – One million barrels of crude oil equivalent.MMBbls – One million barrels of crude oil.MMBtu – One million British thermal units.MMcf – One million cubic feet of natural gas volume.
GLOSSARY OF INDUSTRY TERMS
The following are abbreviations and definitions of terms commonly used in the oil and gas industry and this report:
CIG - Colorado Interstate Gas.
Completion - Refers to the installation of permanent equipment for the production of crude oil and natural gas from a recently drilled well or, in the case of a dry well, to reporting to the appropriate authority that the well has beenabandoned.
Developed acreage - Acreage assignable to productive wells.
Development well - A well drilled within the proved area of an oil or gas reservoir to the depth of a stratigraphic horizon known to be productive.
Differentials - The difference between the crude oil and natural gas index spot price and the corresponding cash spot price in a specified location.
Dry well or dry hole - A well found to be incapable of producing hydrocarbons in sufficient quantities to justify completion as an oil or gas well.
Exploratory well - A well drilled to find a new field or to find a new reservoir in a field previously found to be productive of oil or gas in another reservoir.
Extensions, discoveries and other additions - As to any period, the increases to proved reserves from all sources other than the acquisition of proved properties or revisions of previous estimates.
Farm-out - Transfer of all or part of the operating rights from a working interest owner to an assignee, who assumes all or some of the burden of development in return for an interest in the property. The assignor usually retains anoverriding royalty interest but may retain any type of interest.
Fracture or Fracturing - Procedure to stimulate production by forcing a mixture of fluid and proppant into the formation under high pressure. Fracturing creates artificial fractures in the reservoir rock to increase permeability and porosity,thereby allowing the release of trapped hydrocarbons.
Gross acres or wells - Refers to the total acres or wells in which we have a working interest.
Henry Hub - Refers to the pricing point for natural gas futures contracts traded on NYMEX.
131

Horizontal drilling - A drilling technique that permits the operator to drill a horizontal well shaft from the bottom of a vertical well and thereby to contact and intersect a larger portion of the producing horizon than conventional verticaldrilling techniques and may, depending on the horizon, result in increased production rates and greater ultimate recoveries of hydrocarbons.
Joint interest billing - Process of billing/invoicing the costs related to well drilling, completions and production operations among working interest partners.
Natural gas liquid(s) or NGL(s) - Hydrocarbons which can be extracted from natural gas and become liquid under various combinations of increasing pressure and lower temperature. NGLs include ethane, propane, butane and other naturalgasolines.
Net acres or wells - Refers to gross acres or wells we own multiplied, in each case, by our percentage working interest.
Net production - Crude oil and natural gas production that we own, less royalties and production due to others.
Non-operated - A project in which we are not the operator.
NYMEX - New York Mercantile Exchange.
Operator - The individual or company responsible for the exploration, development and/or production of an oil or gas well or lease.
Overriding royalty - An interest which is created out of the operating or working interest. Its term is coextensive with that of the operating interest.
Possible reserves - This term is defined in the SEC Regulation S-X Section 4-10(a) and refers to those reserves that are less certain to be recovered than probable reserves. When deterministic methods are used, the total quantitiesultimately recovered from a project have a low probability to exceed the sum of proved, probable and possible reserves. When probabilistic methods are used, there must be at least a 10 percent probability that the actual quantitiesrecovered will equal or exceed the sum of proved, probable and possible estimates.
Present value of future net revenues or (PV-10) - The present value of estimated future revenues to be generated from the production of proved reserves, before income taxes, of proved reserves calculated in accordance with FinancialAccounting Standards Board guidelines, net of estimated production and future development costs, using pricing and costs as of the date of estimation without future escalation, without giving effect to hedging activities, non-propertyrelated expenses such as general and administrative expenses, debt service and depreciation, depletion and amortization and discounted using an annual discount rate of 10 percent. PV-10 is pre-tax and therefore a non-U.S. GAAP financialmeasure.
Probable reserves - This term is defined in the SEC Regulation S-X Section 4-10(a) and refers to those reserves that are less certain to be recovered than proved reserves but which, together with proved reserves, are as likely as not to berecovered. When deterministic methods are used, it is as likely as not that actual remaining quantities recovered will exceed the sum of estimated proved plus probable reserves. Similarly, when probabilistic methods are used, there must beat least a 50 percent probability that the actual quantities recovered will equal or exceed the proved plus probable reserves estimates.
Productive well - An exploratory or developmental well that is not a dry well or dry hole, as defined above.
Proved developed non-producing reserves - Reserves that consist of (i) proved reserves from wells which have been completed and tested but are not producing due to lack of market or minor completion problems which are expected to becorrected and/or (ii) proved reserves currently behind the pipe in existing wells and which are expected to be productive due to both the well log characteristics and analogous production in the immediate vicinity of the wells.
Proved developed producing reserves or PDPs - Proved reserves that can be expected to be recovered from currently producing zones under the continuation of present operating methods.
Proved developed reserves - The combination of proved developed producing and proved developed non-producing reserves.
Proved reserves - This term means "proved oil and gas reserves" as defined in SEC Regulation S-X Section 4-10(a) and refers to those quantities of crude oil and condensate, natural gas and NGLs, which, by analysis of geoscience andengineering data, can be estimated with reasonable certainty to be economically producible - from a given date forward, from known reservoirs, and under existing conditions, operating methods and government regulations - prior to thetime at which contracts providing
132

the right to operate expire, unless evidence indicates that renewal is reasonably certain, regardless of whether deterministic or probabilistic methods are used for the estimation.
Proved undeveloped reserves or PUDs - Proved reserves that are expected to be recovered from new wells on undrilled acreage or from existing wells where a relatively major expenditure is required for recompletion.
Recomplete or Recompletion - The modification of an existing well for the purpose of producing crude oil and natural gas from a different producing formation.
Reserves - Estimated remaining quantities of crude oil, natural gas, NGLs and related substances anticipated to be economically producible, as of a given date, by application of development projects to known accumulations. In addition,there must exist, or there must be a reasonable expectation that there will exist, the legal right to produce or a revenue interest in the production, installed means of delivering crude oil, natural gas and NGLs or related substances to market,and all permits and financing required to implement the project.
Royalty - An interest in a crude oil and natural gas lease or mineral interest that gives the owner of the royalty the right to receive a portion of the production from the leased acreage or mineral interest (or of the proceeds of the salethereof), but generally does not require the owner to pay any portion of the costs of drilling or operating the wells on the leased acreage. Royalties may be either landowner’s royalties, which are reserved by the owner of the leased acreageat the time the lease is granted, or overriding royalties, which are usually reserved by an owner of the leasehold in connection with a transfer to a subsequent owner.
Section - A square tract of land one mile by one mile, containing 640 acres.
Spud - To begin drilling; the act of beginning a hole.
Standardized measure of discounted future net cash flows or standardized measure - Future net cash flows discounted at a rate of 10 percent. Future net cash flows represent the estimated future revenues to be generated from the productionof proved reserves determined in accordance with SEC guidelines, net of estimated production and future development costs, using prices and costs as of the date of estimation without future escalation, giving effect to (i) estimated futureabandonment costs, net of the estimated salvage value of related equipment and (ii) future income tax expense.
Stratigraphic test well - A drilling effort, geologically directed, to obtain information pertaining to a specific geologic condition. Such wells customarily are drilled without the intent of being completed for hydrocarbon production.
Undeveloped acreage - Leased acreage on which wells have not been drilled or completed to a point that would permit the production of commercial quantities of crude oil and natural gas, regardless of whether such acreage containsproved reserves.
Waha - Waha West Texas natural gas prices
Working interest - An interest in a crude oil and natural gas lease that gives the owner of the interest the right to drill and produce crude oil and natural gas on the leased acreage. It requires the owner to pay its share of the costs of drillingand production operations.
Workover - Major remedial operations on a producing well to restore, maintain, or improve the well's production.
133

Exhibit 4.1
DESCRIPTION OF THE REGISTRANT’S SECURITIES REGISTERED PURSUANT TO SECTION 12 OF THE SECURITIES EXCHANGE ACT OF 1934
The following is a summary of the common stock, $0.01 par value per share (the “common stock”), of PDC Energy, Inc. (the “Company”), which is the only class of the Company’s securities registered underSection 12 of the Securities Exchange Act of 1934, as amended. The following summary is not complete. You should refer to the applicable provisions of the Company’s certificate of incorporation, the Company’sbylaws, and the General Corporation Law of the State of Delaware (“DGCL”), including Section 203, for a complete statement of the terms and rights of the common stock. Copies of the certificate of incorporationand bylaws have been filed with the Securities and Exchange Commission as Exhibits 3.1 and 3.2, respectively, to the Company’s Annual Report on Form 10-K
Common Stock
The Company’s certificate of incorporation authorizes the issuance of 150,000,000 shares of common stock. Holders of common stock of the Company are entitled to one vote for each share held of record onall matters submitted to a vote of the stockholders and do not have cumulative voting rights. Except as may be otherwise provided in a preferred stock designation, holders of common stock have the exclusive right tovote for the election of directors.
Subject to prior rights and preferences that may be applicable to any outstanding shares or series of preferred stock, holders of common stock are entitled to receive ratably in proportion to the shares ofcommon stock held by them such dividends (payable in cash, stock or otherwise), if any, as may be declared from time to time by the Company’s board of directors out of funds legally available for dividend payments.All outstanding shares of common stock are fully paid and non-assessable. The holders of common stock have no preferences or rights of conversion, exchange or pre-emption or other subscription rights. There are noredemption or sinking fund provisions applicable to the common stock. In the event of any voluntary or involuntary liquidation, dissolution or winding-up of the Company’s affairs, holders of common stock will beentitled to share ratably in the Company’s assets in proportion to the shares of common stock held by them that are remaining after payment or provision for payment of all of the Company’s debts and obligations andafter distribution in full of preferential amounts to be distributed to holders of outstanding shares of preferred stock, if any.
Anti-takeover Effects of Delaware Law and Provisions of the Company’s Certificate of Incorporation and Bylaws
Delaware Law
Section 203 of the Delaware General Corporation Law (the “DGCL”) generally prohibits a Delaware corporation from engaging in any “business combination” with any “interested stockholder” for a period ofthree years following the date that the stockholder became an interested stockholder, unless:
• prior to such time, either the business combination or the transaction in which the stockholder became an interested stockholder was approved by the board of directors;
114686200.1

• upon consummation of the transaction that resulted in the stockholder becoming an interested stockholder, the interested stockholder owned at least 85% of the voting stock of thecorporation outstanding at the time the transaction commenced; or
• on or after such time the business combination is approved by the board of directors and authorized at a meeting of stockholders by at least two-thirds of the outstanding voting stockthat is not owned by the interested stockholder.
An “interested stockholder” is generally defined as a person or group that beneficially owns 15% or more of the corporation’s outstanding common stock. A “business combination” includes a merger,consolidation, sale of assets or other transaction resulting in a financial benefit to the stockholder.
Certificate of Incorporation and Bylaws
The certificate of incorporation and bylaws:
• establish advance notice procedures with regard to stockholder proposals relating to the nomination of candidates for election as directors or new business to be brought beforemeetings of the Company’s stockholders. These procedures provide that notice of stockholder proposals must be timely given in writing to the corporate secretary prior to the meetingat which the action is to be taken. Generally, to be timely, notice must be received at the Company’s principal executive office not less than 80 days nor more than 90 days prior to thefirst anniversary date of the annual meeting for the preceding year. The bylaws specify the requirements as to form and content of all stockholders’ notices. These requirements maypreclude stockholders from bringing matters before the stockholders at an annual or special meeting;
• provide that the authorized number of directors may be changed only by resolution of the board of directors and may not exceed a total of nine; and
• provide for the board of directors to be divided into three classes of directors, with each class as nearly equal in number as possible, serving staggered three-year terms, other thandirectors who may be elected by holders of preferred stock, if any.
Limitation of Liability and Indemnification Matters
The certificate of incorporation limits the liability of the Company's directors for monetary damages for breach of their fiduciary duty as directors, except for liability that cannot be eliminated under theDGCL.
Any amendment, repeal or modification of these provisions will be prospective only and would not affect any limitation on liability of a director for acts or omissions that occurred prior to any suchamendment, repeal or modification.
22

The bylaws also provide that the Company will indemnify its directors and officers to the fullest extent permitted by Delaware law. The Company has entered into indemnification agreements with each of itsdirectors pursuant to which is has generally agreed to provide indemnification and advancement to the directors to the maximum extent permitted by the DGCL.
33


Exhibit No. 21.1
Subsidiaries of PDC Energy, Inc.
PDC Permian, Inc., a Delaware corporation, doing business as PDC Energy.

Exhibit No. 23.1
CONSENT OF INDEPENDENT REGISTERED PUBLIC ACCOUNTING FIRM
We hereby consent to the incorporation by reference in the Registration Statements on Form S-3 (No. 333-215422 and No. 333-225312) and Form S-8 (No. 333-189685, No. 333-167945, No. 333-137836, No. 333-118222, No. 333-118215, No. 333-225596 and 333-235908) of PDC Energy, Inc. of our report dated February 26, 2020, relating to the financial statements, financial statement schedule, and the effectiveness of internal control over financial reporting,which appears in this Form 10-K.
/s/ PricewaterhouseCoopers LLPDenver, ColoradoFebruary 26, 2020

Exhibit 23.2
TBPE REGISTERED ENGINEERING FIRM F-1580 633 SEVENTEENTH STREET SUITE 1700 DENVER, COLORADO 80202 TELEPHONE (303) 339-8110
Consent of Independent Petroleum Engineers
We hereby consent to the incorporation by reference in the Registration Statements on Form S‑3 of PDC Energy, Inc. (333-215422 and 333-225312) and to the incorporation by reference in the Registration Statements on Form S-8of PDC Energy, Inc. (No. 333-189685, No. 333-167945, No. 333-137836, No. 333-118222, No. 333-118215, No. 333-225596 and No. 333-235908), of all references to our firm and information from our reserves report dated January 15,2020, included in or made a part of PDC Energy, Inc.'s Annual Report on Form 10-K for the year ended December 31, 2019, and our summary report attached as Exhibit 99.1 to the Annual Report on Form 10-K.
/s/ Ryder Scott Company, L.P.
RYDER SCOTT COMPANY, L.P.
TBPE Firm Registration No. F-1580
Denver, CO February 25, 2020

Exhibit 23.3
CONSENT OF INDEPENDENT PETROLEUM ENGINEERS AND GEOLOGISTS
We hereby consent to the incorporation by reference in the Registration Statements on Form S‑3 of PDC Energy, Inc. (No. 333-215422 and No. 333-225312) and to the incorporation by reference in the Registration Statements on Form S-8of PDC Energy, Inc. (No. 333-189685, No. 333-167945, No. 333-137836, No. 333-118222, No. 333-118215, No. 333-225596, and No. 333-235908), of all references to our firm and information from our reserves report dated January 27,2020, included in or made a part of PDC Energy, Inc.'s Annual Report on Form 10-K for the year ended December 31, 2019, and our summary report attached as Exhibit 99.2 to the Annual Report on Form 10-K.
NETHERLAND, SEWELL & ASSOCIATES, INC. By: /s/ Danny D. Simmons Danny D. Simmons, P.E. President and Chief Operating Officer
Houston, TexasFebruary 25, 2020
Please be advised that the digital document you are viewing is provided by Netherland, Sewell & Associates, Inc. (NSAI) as a convenience to our clients. The digital document is intended to be substantively the same as the original signed document maintained byNSAI. The digital document is subject to the parameters, limitations, and conditions stated in the original document. In the event of any differences between the digital document and the original document, the original document shall control and supersede thedigital document.

Exhibit 31.1
CERTIFICATIONS
I, Barton Brookman, certify that:
1. I have reviewed this Annual Report on Form 10-K of PDC Energy, Inc.;
2. Based on my knowledge, this report does not contain any untrue statement of a material fact or omit to state a material fact necessary to make the statements made, in light of the circumstances under which such statements weremade, not misleading with respect to the period covered by this report;
3. Based on my knowledge, the financial statements, and other financial information included in this report, fairly present in all material respects the financial condition, results of operations and cash flows of the registrant as of, andfor, the periods presented in this report;
4. The registrant's other certifying officer(s) and I are responsible for establishing and maintaining disclosure controls and procedures (as defined in Exchange Act Rules 13a-15(e) and 15d-15(e)) and internal control over financialreporting (as defined in Exchange Act Rules 13a-15(f) and 15d-15(f)) for the registrant and have:
a. Designed such disclosure controls and procedures, or caused such disclosure controls and procedures to be designed under our supervision, to ensure that material information relating to the registrant, including itsconsolidated subsidiaries, is made known to us by others within those entities, particularly during the period in which this report is being prepared;
b. Designed such internal control over financial reporting, or caused such internal control over financial reporting to be designed under our supervision, to provide reasonable assurance regarding the reliability of financialreporting and the preparation of financial statements for external purposes in accordance with generally accepted accounting principles;
c. Evaluated the effectiveness of the registrant's disclosure controls and procedures and presented in this report our conclusions about the effectiveness of the disclosure controls and procedures, as of the end of the periodcovered by this report based on such evaluation; and
d. Disclosed in this report any change in the registrant's internal control over financial reporting that occurred during the registrant's most recent fiscal quarter (the registrant's fourth fiscal quarter in the case of an annualreport) that has materially affected, or is reasonably likely to materially affect, the registrant's internal control over financial reporting; and
5. The registrant's other certifying officer(s) and I have disclosed, based on our most recent evaluation of internal control over financial reporting, to the registrant's auditors and the audit committee of the registrant's board ofdirectors (or persons performing the equivalent functions):
a. All significant deficiencies and material weaknesses in the design or operation of internal control over financial reporting which are reasonably likely to adversely affect the registrant's ability to record, process,summarize and report financial information; and
b. Any fraud, whether or not material, that involves management or other employees who have a significant role in the registrant's internal control over financial reporting.
Date: February 26, 2020 /s/ Barton Brookman Barton Brookman
President and Chief Executive Officer
(principal executive officer)

Exhibit 31.2
CERTIFICATIONS
I, R. Scott Meyers, certify that:
1. I have reviewed this Annual Report on Form 10-K of PDC Energy, Inc.;
2. Based on my knowledge, this report does not contain any untrue statement of a material fact or omit to state a material fact necessary to make the statements made, in light of the circumstances under which such statements weremade, not misleading with respect to the period covered by this report;
3. Based on my knowledge, the financial statements, and other financial information included in this report, fairly present in all material respects the financial condition, results of operations and cash flows of the registrant as of, andfor, the periods presented in this report;
4. The registrant's other certifying officer(s) and I are responsible for establishing and maintaining disclosure controls and procedures (as defined in Exchange Act Rules 13a-15(e) and 15d-15(e)) and internal control over financialreporting (as defined in Exchange Act Rules 13a-15(f) and 15d-15(f)) for the registrant and have:
a. Designed such disclosure controls and procedures, or caused such disclosure controls and procedures to be designed under our supervision, to ensure that material information relating to the registrant, including itsconsolidated subsidiaries, is made known to us by others within those entities, particularly during the period in which this report is being prepared;
b. Designed such internal control over financial reporting, or caused such internal control over financial reporting to be designed under our supervision, to provide reasonable assurance regarding the reliability of financialreporting and the preparation of financial statements for external purposes in accordance with generally accepted accounting principles;
c. Evaluated the effectiveness of the registrant's disclosure controls and procedures and presented in this report our conclusions about the effectiveness of the disclosure controls and procedures, as of the end of the periodcovered by this report based on such evaluation; and
d. Disclosed in this report any change in the registrant's internal control over financial reporting that occurred during the registrant's most recent fiscal quarter (the registrant's fourth fiscal quarter in the case of an annualreport) that has materially affected, or is reasonably likely to materially affect, the registrant's internal control over financial reporting; and
5. The registrant's other certifying officer(s) and I have disclosed, based on our most recent evaluation of internal control over financial reporting, to the registrant's auditors and the audit committee of the registrant's board ofdirectors (or persons performing the equivalent functions):
a. All significant deficiencies and material weaknesses in the design or operation of internal control over financial reporting which are reasonably likely to adversely affect the registrant's ability to record, process,summarize and report financial information; and
b. Any fraud, whether or not material, that involves management or other employees who have a significant role in the registrant's internal control over financial reporting.
Date: February 26, 2020 /s/ R. Scott Meyers R. Scott Meyers Senior Vice President and Chief Financial Officer (principal financial officer)

Exhibit 32.1CERTIFICATION
In connection with the Annual Report of PDC Energy, Inc. (the "Company") on Form 10-K for the period ended December 31, 2019, as filed with the Securities and Exchange Commission on the date hereof (the "Report"), the undersignedcertify pursuant to § 906 of the Sarbanes-Oxley Act of 2002, that:
1. The Report fully complies with the requirements of section 13(a) or 15(d) of the Securities Exchange Act of 1934; and2. The information contained in the Report fairly presents, in all material respects, the financial condition and results of operations of the Company.
/s/ Barton Brookman February 26, 2020
Barton Brookman President and Chief Executive Officer
(principal executive officer)
/s/ R. Scott Meyers February 26, 2020
R. Scott Meyers Senior Vice President and Chief Financial Officer (principal financial officer)

Exhibit No. 99.1
PDC Energy, Inc.
Estimated
Future Reserves and Income
Attributable to Certain
Leasehold and Royalty Interests
SEC Parameters
As of
December 31, 2019
/s/ Stephen E. Gardner /s/ Edward M. PolishukStephen E. Gardner, P.E. Edward M. Polishuk
Colorado License No. 44720 Senior Petroleum EvaluatorManaging Senior Vice President
[SEAL] RYDER SCOTT COMPANY, L.P.TBPE Firm Registration No. F-1580
RYDER SCOTT COMPANY PETROLEUM CONSULTANTS

PDC Energy, Inc.January 15, 2020Page 1
TBPE REGISTERED ENGINEERING FIRM F-1580633 17TH STREET SUITE 1700 DENVER, COLORADO 80202 TELEPHONE (303) 339-8110
January 15, 2020
PDC Energy, Inc.1775 Sherman StreetDenver, Colorado 80203
Ladies and Gentlemen:
At your request, Ryder Scott Company, L.P. (Ryder Scott) has prepared an estimate of the proved reserves, future production, and income attributable to certain leasehold and royaltyinterests of PDC Energy, Inc. (PDC) as of December 31, 2019. The subject properties are located in the state of Colorado. The reserves and income data were estimated based on the definitionsand disclosure guidelines of the United States Securities and Exchange Commission (SEC) contained in Title 17, Code of Federal Regulations, Modernization of Oil and Gas Reporting, Final Rulereleased January 14, 2009 in the Federal Register (SEC regulations). Our third party study, completed on January 15, 2020 and presented herein, was prepared for public disclosure by PDC infilings made with the SEC in accordance with the disclosure requirements set forth in the SEC regulations.
The properties evaluated by Ryder Scott account for a portion of PDC’s total net proved reserves as of December 31, 2019. Based on information provided by PDC, the third party estimateconducted by Ryder Scott addresses 72.2 percent of the total proved developed net liquid hydrocarbon reserves, 80.0 percent of the total proved developed net gas reserves, 79.1 percent of thetotal proved undeveloped net liquid hydrocarbon reserves, and 88.8 percent of the total proved undeveloped net gas reserves of PDC.
The estimated reserves and future net income amounts presented in this report, as of December 31, 2019 are related to hydrocarbon prices. The hydrocarbon prices used in the preparationof this report are based on the average prices during the 12-month period prior to the “as of date” of this report, determined as the unweighted arithmetic averages of the prices in effect on the first-day-of-the-month for each month within such period, unless prices were defined by contractual arrangements, as required by the SEC regulations. Actual future prices may vary considerably fromthe prices required by SEC regulations. The recoverable reserves volumes and the income attributable thereto have a direct relationship to the hydrocarbon prices actually received; therefore,volumes of reserves actually recovered and the amounts of income actually received may differ significantly from the estimated quantities presented in this report. The results of this study aresummarized as follows.
1100 LOUISIANA, SUITE 4600 HOUSTON, TEXAS 77002-5294 TEL (713) 651-9191 FAX (713) 651-0849SUITE 800, 350 7TH AVENUE, S.W. CALGARY, ALBERTA T2P 3N9 TEL (403) 262-2799 FAX (403) 262-2790

PDC Energy, Inc.January 15, 2020Page 2
SEC PARAMETERSEstimated Net Reserves and Income DataCertain Leasehold and Royalty Interests of
PDC Energy, Inc.
As of December 31, 2019
Proved
Developed Total
Producing Non-Producing Undeveloped Proved
Net Reserves Oil/Condensate – Mbbl 46,883 206 94,598 141,687Plant Products – Mbbl 40,540 215 87,181 127,936Gas – MMcf 441,291 2,112 891,682 1,335,085
Income Data ($M) Future Gross Revenue $3,498,763 $16,056 $7,290,967 $10,805,786Deductions 1,153,773 219,431 4,199,857 5,573,061Future Net Income (FNI) $2,344,990 $(203,375) $3,091,110 $5,232,725
Discounted FNI @ 10% $1,639,228 $(138,541) (1) $1,439,784 $2,940,471
(1) The Discounted Future Net Income for the proved developed non-producing reserves is higher than the Undiscounted Future Net Income due to the inclusion of abandonment costs net of salvage.
Liquid hydrocarbons are expressed in standard 42 U.S. gallon barrels and shown herein as thousands of barrels (Mbbl). All gas volumes are reported on an “as sold basis” expressed inmillions of cubic feet (MMcf) at the official temperature and pressure bases of the areas in which the gas reserves are located. In this report, the revenues, deductions, and income data areexpressed as thousands of U.S. dollars ($M).
The estimates of the reserves, future production, and income attributable to properties in this report were prepared using the economic software package ARIESTM Petroleum Economics andReserves Software, a copyrighted program of Halliburton. The program was used at the request of PDC. Ryder Scott has found this program to be generally acceptable, but notes that certainsummaries and calculations may vary due to rounding and may not exactly match the sum of the properties being summarized. Furthermore, one line economic summaries may vary slightly fromthe more detailed cash flow projections of the same properties, also due to rounding. The rounding differences are not material.
The future gross revenue is after the deduction of production taxes. The deductions incorporate the normal direct costs of operating the wells, ad valorem taxes, development costs, andcertain abandonment costs net of salvage. These abandonment costs net of salvage are shown as “Other Deductions” in the cash flow projections. The future net income is before the deduction ofstate and federal income taxes and general administrative overhead, and has not been adjusted for outstanding loans that may exist nor does it include any adjustment for cash on hand orundistributed income.
Liquid hydrocarbon reserves account for approximately 81 percent and gas reserves account for the remaining 19 percent of total future gross revenue from proved reserves.
RYDER SCOTT COMPANY PETROLEUM CONSULTANTS

PDC Energy, Inc.January 15, 2020Page 3
The discounted future net income shown above was calculated using a discount rate of 10 percent per annum compounded monthly. Future net income was discounted at four otherdiscount rates, which were also compounded monthly. These results are shown in summary form as follows.
Discounted Future Net Income ($M) As of December 31, 2019
Discount Rate Total Percent Proved
5 $3,824,345 15 $2,350,827 20 $1,937,621 25 $1,636,352
The results shown above are presented for your information and should not be construed as our estimate of fair market value.
Reserves Included in This Report
The proved reserves included herein conform to the definition as set forth in the Securities and Exchange Commission’s Regulations Part 210.4-10(a). An abridged version of the SECreserves definitions from 210.4-10(a) entitled “PETROLEUM RESERVES DEFINITIONS” is included as an attachment to this report.
The various reserves status categories are defined under the attachment entitled “PETROLEUM RESERVES STATUS DEFINITIONS AND GUIDELINES” in this report. The proveddeveloped non-producing reserves included herein consist of shut-in wells waiting for abandonment or low volume wells waiting for optimal pipeline pressure.
No attempt was made to quantify or otherwise account for any accumulated gas production imbalances that may exist. The proved gas volumes presented herein do not include volumes of
gas consumed in operations as reserves.
Reserves are “estimated remaining quantities of oil and gas and related substances anticipated to be economically producible, as of a given date, by application of development projects toknown accumulations.” All reserves estimates involve an assessment of the uncertainty relating the likelihood that the actual remaining quantities recovered will be greater or less than the estimatedquantities determined as of the date the estimate is made. The uncertainty depends chiefly on the amount of reliable geologic and engineering data available at the time of the estimate and theinterpretation of these data. The relative degree of uncertainty may be conveyed by placing reserves into one of two principal classifications, either proved or unproved. Unproved reserves are lesscertain to be recovered than proved reserves and may be further sub-categorized as probable and possible reserves to denote progressively increasing uncertainty in their recoverability. At PDC’srequest, this report addresses only the proved reserves attributable to the properties evaluated herein.
Proved oil and gas reserves are “those quantities of oil and gas which, by analysis of geoscience and engineering data, can be estimated with reasonable certainty to be economicallyproducible from a given date forward.” The proved reserves included herein were estimated using deterministic methods. The SEC has defined reasonable certainty for proved reserves, whenbased on deterministic methods, as a “high degree of confidence that the quantities will be recovered.”
RYDER SCOTT COMPANY PETROLEUM CONSULTANTS

PDC Energy, Inc.January 15, 2020Page 4
Proved reserves estimates will generally be revised only as additional geologic or engineering data become available or as economic conditions change. For proved reserves, the SECstates that “as changes due to increased availability of geoscience (geological, geophysical, and geochemical), engineering, and economic data are made to the estimated ultimate recovery (EUR)with time, reasonably certain EUR is much more likely to increase or remain constant than to decrease.” Moreover, estimates of proved reserves may be revised as a result of future operations,effects of regulation by governmental agencies or geopolitical or economic risks. Therefore, the proved reserves included in this report are estimates only and should not be construed as beingexact quantities, and if recovered, the revenues therefrom, and the actual costs related thereto, could be more or less than the estimated amounts.
PDC’s operations may be subject to various levels of governmental controls and regulations. These controls and regulations may include, but may not be limited to, matters relating to landtenure and leasing, the legal rights to produce hydrocarbons, drilling and production practices, environmental protection, marketing and pricing policies, royalties, various taxes and levies includingincome tax, and are subject to change from time to time. Such changes in governmental regulations and policies may cause volumes of proved reserves actually recovered and amounts of provedincome actually received to differ significantly from the estimated quantities.
The estimates of proved reserves presented herein were based upon a detailed study of the properties in which PDC owns an interest; however, we have not made any field examination ofthe properties. No consideration was given in this report to potential environmental liabilities that may exist nor were any costs included for potential liabilities to restore and clean up damages, ifany, caused by past operating practices.
Estimates of Reserves
The estimation of reserves involves two distinct determinations. The first determination results in the estimation of the quantities of recoverable oil and gas and the second determinationresults in the estimation of the uncertainty associated with those estimated quantities in accordance with the definitions set forth by the Securities and Exchange Commission’s Regulations Part210.4-10(a). The process of estimating the quantities of recoverable oil and gas reserves relies on the use of certain generally accepted analytical procedures. These analytical procedures fall intothree broad categories or methods: (1) performance-based methods, (2) volumetric-based methods and (3) analogy. These methods may be used individually or in combination by the reservesevaluator in the process of estimating the quantities of reserves. Reserves evaluators must select the method or combination of methods, which in their professional judgment is most appropriategiven the nature and amount of reliable geoscience and engineering data available at the time of the estimate, the established or anticipated performance characteristics of the reservoir beingevaluated, and the stage of development or producing maturity of the property.
In many cases, the analysis of the available geoscience and engineering data and the subsequent interpretation of this data may indicate a range of possible outcomes in an estimate,irrespective of the method selected by the evaluator. When a range in the quantity of reserves is identified, the evaluator must determine the uncertainty associated with the incremental quantities ofthe reserves. If the reserves quantities are estimated using the deterministic incremental approach, the uncertainty for each discrete incremental quantity of the reserves is addressed by thereserves category assigned by the evaluator. Therefore, it is the categorization of reserves quantities as proved, probable and/or possible that addresses the inherent uncertainty in the estimatedquantities reported. For proved reserves, uncertainty is defined by the SEC as reasonable certainty wherein the “quantities actually recovered are much more likely to be achieved than not.” TheSEC states that “probable reserves are those additional reserves that are less certain to be recovered than proved reserves but which, together with proved reserves, are as likely as not to berecovered.” The SEC states that “possible reserves are those additional reserves that are less certain to be recovered than probable reserves and the total quantities ultimately recovered from aproject
RYDER SCOTT COMPANY PETROLEUM CONSULTANTS

PDC Energy, Inc.January 15, 2020Page 5
have a low probability of exceeding proved plus probable plus possible reserves.” All quantities of reserves within the same reserves category must meet the SEC definitions as noted above.
Estimates of reserves quantities and their associated reserves categories may be revised in the future as additional geoscience or engineering data become available. Furthermore,estimates of reserves quantities and their associated reserves categories may also be revised due to other factors such as changes in economic conditions, results of future operations, effects ofregulation by governmental agencies or geopolitical or economic risks as previously noted herein.
The proved reserves for the properties included herein were estimated by performance methods or analogy. All of the proved producing reserves attributable to producing wells and/orreservoirs were estimated by performance methods. These performance methods include decline curve analysis, which utilized extrapolations of historical production and pressure data availablethrough December 2019 in those cases where such data were considered to be definitive. The data utilized in this analysis were furnished to Ryder Scott by PDC or obtained from public datasources and were considered sufficient for the purpose thereof.
All of the proved developed non-producing and the proved undeveloped reserves included herein were estimated by analogy methods. The data utilized from the existing producing wells todevelop analogues were considered sufficient for the purpose thereof.
To estimate economically recoverable proved oil and gas reserves and related future net cash flows, we consider many factors and assumptions including, but not limited to, the use ofreservoir parameters derived from geological, geophysical and engineering data which cannot be measured directly, economic criteria based on current costs and SEC pricing requirements, andforecasts of future production rates. Under the SEC regulations 210.4-10(a)(22)(v) and (26), proved reserves must be anticipated to be economically producible from a given date forward based onexisting economic conditions including the prices and costs at which economic producibility from a reservoir is to be determined. While it may reasonably be anticipated that the future pricesreceived for the sale of production and the operating costs and other costs relating to such production may increase or decrease from those under existing economic conditions, such changes were,in accordance with rules adopted by the SEC, omitted from consideration in making this evaluation.
PDC has informed us that they have furnished us all of the material accounts, records, geological and engineering data, and reports and other data required for this investigation. Inpreparing our forecast of future proved production and income, we have relied upon data furnished by PDC with respect to property interests owned, production and well tests from examined wells,normal direct costs of operating the wells or leases, other costs such as transportation and/or processing fees, ad valorem and production taxes, development costs, development plans,abandonment costs after salvage, product prices based on the SEC regulations, adjustments or differentials to product prices, geological structural and isochore maps, well logs, core analyses, andpressure measurements. Ryder Scott reviewed such factual data for its reasonableness; however, we have not conducted an independent verification of the data furnished by PDC. We consider thefactual data used in this report appropriate and sufficient for the purpose of preparing the estimates of reserves and future net revenues herein.
In summary, we consider the assumptions, data, methods and analytical procedures used in this report appropriate for the purpose hereof, and we have used all such methods andprocedures that we consider necessary and appropriate to prepare the estimates of reserves herein. The proved reserves included herein were determined in conformance with the United StatesSecurities and Exchange Commission (SEC) Modernization of Oil and Gas Reporting; Final Rule, including all references to Regulation S-X and Regulation S-K, referred to herein collectively as the“SEC Regulations.” In our opinion, the proved reserves presented in this report comply with the definitions, guidelines and disclosure requirements as required by the SEC regulations.
RYDER SCOTT COMPANY PETROLEUM CONSULTANTS

PDC Energy, Inc.January 15, 2020Page 6
Future Production Rates
For wells currently on production, our forecasts of future production rates are based on historical performance data. If no production decline trend has been established, future productionrates were held constant, or adjusted for the effects of curtailment where appropriate, until a decline in ability to produce was anticipated. An estimated rate of decline was then applied untildepletion of the reserves. If a decline trend has been established, this trend was used as the basis for estimating future production rates.
Test data and other related information were used to estimate the anticipated initial production rates for those wells or locations that are not currently producing. For reserves not yet onproduction, sales were estimated to commence at an anticipated date furnished by PDC. Wells or locations that are not currently producing may start producing earlier or later than anticipated in ourestimates due to unforeseen factors causing a change in the timing to initiate production. Such factors may include delays due to weather, the availability of rigs, the sequence of drilling, completingand/or recompleting wells and/or constraints set by regulatory bodies.
The future production rates from wells currently on production or wells or locations that are not currently producing may be more or less than estimated because of changes including, but notlimited to, reservoir performance, operating conditions related to surface facilities, compression and artificial lift, pipeline capacity and/or operating conditions, producing market demand and/orallowables or other constraints set by regulatory bodies.
Hydrocarbon Prices
The hydrocarbon prices used herein are based on SEC price parameters using the average prices during the 12-month period prior to the “as of date” of this report, determined as theunweighted arithmetic averages of the prices in effect on the first-day-of-the-month for each month within such period, unless prices were defined by contractual arrangements. For hydrocarbonproducts sold under contract, the contract prices, including fixed and determinable escalations, exclusive of inflation adjustments, were used until expiration of the contract. Upon contract expiration,the prices were adjusted to the 12-month unweighted arithmetic average as previously described.
PDC furnished us with the above mentioned average prices in effect on December 31, 2019. These initial SEC hydrocarbon prices were determined using the 12-month average first-day-of-the-month benchmark prices appropriate to the geographic area where the hydrocarbons are sold. These benchmark prices are prior to the adjustments for differentials as described herein. Thetable below summarizes the “benchmark prices” and “price reference” used for the geographic area included in the report. In certain geographic areas, the price reference and benchmark pricesmay be defined by contractual arrangements.
The product prices which were actually used to determine the future gross revenue for each property reflect adjustments to the benchmark prices for gravity, quality, local conditions,gathering and transportation fees and/or distance from market, referred to herein as “differentials.” The differentials used in the preparation of this report were furnished to us by PDC. Thedifferentials furnished to us were accepted as factual data and reviewed by us for their reasonableness; however, we have not conducted an independent verification of the data used by PDC todetermine these differentials.
In addition, the table below summarizes the net volume weighted benchmark prices adjusted for differentials and referred to herein as the “average realized prices.” The average realizedprices shown in the table below were determined from the total future gross revenue before production taxes and the total net reserves for the geographic area and presented in accordance withSEC disclosure requirements for the geographic area included in the report.
RYDER SCOTT COMPANY PETROLEUM CONSULTANTS

PDC Energy, Inc.January 15, 2020Page 7
Geographic Area ProductPrice
Reference
AverageBenchmark
PricesAverage Realized
PricesNorth America Oil/Condensate WTI Cushing $55.69/bbl $52.08/bblUnited States NGLs WTI Cushing $55.69/bbl $11.33/bbl Gas Henry Hub $2.58/MMBTU $1.53/Mcf
The effects of derivative instruments designated as price hedges of oil and gas quantities are not reflected in our individual property evaluations.
Costs
Operating costs for the leases and wells in this report were furnished by PDC and are based on the operating expense reports of PDC and include only those costs directly applicable to theleases or wells. The operating costs include a portion of general and administrative costs allocated directly to the leases and wells. The operating costs for non-operated properties include theCOPAS overhead costs that are allocated directly to the leases and wells under terms of operating agreements. The operating costs furnished to us were accepted as factual data and reviewed byus for their reasonableness; however, we have not conducted an independent verification of the operating cost data used by PDC. No deduction was made for loan repayments, interest expenses,or exploration and development prepayments that were not charged directly to the leases or wells.
Development costs were furnished to us by PDC and are based on authorizations for expenditure for the proposed work or actual costs for similar projects. The development costs furnishedto us were accepted as factual data and reviewed by us for their reasonableness; however, we have not conducted an independent verification of these costs. The estimated net cost ofabandonment after salvage was included for properties where abandonment costs net of salvage were material. The estimates of the net abandonment costs furnished by PDC were acceptedwithout independent verification.
The proved developed non-producing and undeveloped reserves in this report have been incorporated herein in accordance with PDC’s plans to develop these reserves as of December 31,2019. The implementation of PDC’s development plans as presented to us and incorporated herein is subject to the approval process adopted by PDC’s management. As the result of our inquiriesduring the course of preparing this report, PDC has informed us that the development activities included herein have been subjected to and received the internal approvals required by PDC’smanagement at the appropriate local, regional and/or corporate level. In addition to the internal approvals as noted, certain development activities may still be subject to specific partner AFEprocesses, Joint Operating Agreement (JOA) requirements or other administrative approvals external to PDC. PDC has provided written documentation supporting their commitment to proceed withthe development activities as presented to us. Additionally, PDC has informed us that they are not aware of any legal, regulatory, or political obstacles that would significantly alter their plans. Whilethese plans could change from those under existing economic conditions as of December 31, 2019 such changes were, in accordance with rules adopted by the SEC, omitted from consideration inmaking this evaluation.
Current costs used by PDC were held constant throughout the life of the properties.
Standards of Independence and Professional Qualification
Ryder Scott is an independent petroleum engineering consulting firm that has been providing petroleum consulting services throughout the world since 1937. Ryder Scott is employee-ownedand maintains offices in Houston, Texas; Denver, Colorado; and Calgary, Alberta, Canada. We have approximately eighty engineers and geoscientists on our permanent staff. By virtue of the size ofour firm
RYDER SCOTT COMPANY PETROLEUM CONSULTANTS

PDC Energy, Inc.January 15, 2020Page 8
and the large number of clients for which we provide services, no single client or job represents a material portion of our annual revenue. We do not serve as officers or directors of any privately-owned or publicly-traded oil and gas company and are separate and independent from the operating and investment decision-making process of our clients. This allows us to bring the highest levelof independence and objectivity to each engagement for our services.
Ryder Scott actively participates in industry-related professional societies and organizes an annual public forum focused on the subject of reserves evaluations and SEC regulations. Many ofour staff have authored or co-authored technical papers on the subject of reserves related topics. We encourage our staff to maintain and enhance their professional skills by actively participating inongoing continuing education.
Prior to becoming an officer of the Company, Ryder Scott requires that staff engineers and geoscientists have received professional accreditation in the form of a registered or certifiedprofessional engineer’s license or a registered or certified professional geoscientist’s license, or the equivalent thereof, from an appropriate governmental authority or a recognized self-regulatingprofessional organization. Regulating agencies require that, in order to maintain active status, a certain amount of continuing education hours be completed annually, including an hour of ethicstraining. Ryder Scott fully supports this technical and ethics training with our internal requirement mentioned above.
We are independent petroleum engineers with respect to PDC. Neither we nor any of our employees have any financial interest in the subject properties and neither the employment to dothis work nor the compensation is contingent on our estimates of reserves for the properties which were reviewed.
The results of this study, presented herein, are based on technical analysis conducted by teams of geoscientists and engineers from Ryder Scott. The professional qualifications of theundersigned, the technical person primarily responsible for overseeing, reviewing and approving the evaluation of the reserves information discussed in this report, are included as an attachment tothis letter.
Terms of Usage
The results of our third party study, presented in report form herein, were prepared in accordance with the disclosure requirements set forth in the SEC regulations and intended for publicdisclosure as an exhibit in filings made with the SEC by PDC.
PDC makes periodic filings on Form 10-K with the SEC under the 1934 Exchange Act. Furthermore, PDC has certain registration statements filed with the SEC under the 1933 Securities Actinto which any subsequently filed Form 10-K is incorporated by reference. We have consented to the incorporation by reference in the registration statements on Form S-8 of PDC, of the referencesto our name, as well as to the references to our third party report for PDC, which appears in the December 31, 2019 annual report on Form 10-K of PDC. In addition, we have consented to thereferences to our name and third party report in the registration statement(s) on Form S-4 by PDC. Our written consent for such use is included as a separate exhibit to the filings made with theSEC by PDC.
RYDER SCOTT COMPANY PETROLEUM CONSULTANTS

PDC Energy, Inc.January 15, 2020Page 9
We have provided PDC with a digital version of the original signed copy of this report letter. In the event there are any differences between the digital version included in filings made by PDCand the original signed report letter, the original signed report letter shall control and supersede the digital version.
The data and work papers used in the preparation of this report are available for examination by authorized parties in our offices. Please contact us if we can be of further service.
Very truly yours,
RYDER SCOTT COMPANY, L.P.TBPE Firm Registration No. F-1580
/s/ Stephen E. Gardner
Stephen E. Gardner, P.E.Colorado License No. 44720
Managing Senior Vice President[SEAL]
/s/ Edward M. Polishuk
Edward M. PolishukSenior Petroleum Evaluator
SEG-EMP (DCR)/pl
RYDER SCOTT COMPANY PETROLEUM CONSULTANTS

Professional Qualifications of Primary Technical Person
The conclusions presented in this report are the result of technical analysis conducted by teams of geoscientists and engineers from Ryder Scott Company, L.P. Mr. Stephen E. Gardner is theprimary technical person responsible for the estimate of the reserves, future production and income.
Mr. Gardner, an employee of Ryder Scott Company, L.P. (Ryder Scott) since 2006, is a Managing Senior Vice President responsible for ongoing reservoir evaluation studies worldwide. Beforejoining Ryder Scott, Mr. Gardner served in a number of engineering positions with Exxon Mobil Corporation. For more information regarding Mr. Gardner’s geographic and job specific experience,please refer to the Ryder Scott Company website at www.ryderscott.com/Experience/Employees.
Mr. Gardner earned a Bachelor of Science degree in Mechanical Engineering from Brigham Young University in 2001 (summa cum laude). He is a licensed Professional Engineer in the States ofColorado and Texas. Mr. Gardner is also a member of the Society of Petroleum Engineers and the Society of Petroleum Evaluation Engineers, serving in the latter organization’s Denver Chapter asChairman during 2018. In addition to gaining experience and competency through prior work experience, the Texas Board of Professional Engineers requires a minimum of 15 hours of continuing education annually,including at least one hour in the area of professional ethics, which Mr. Gardner fulfills. As part of his 2019 continuing education hours, Mr. Gardner attended the annual Ryder Scott ReservesConference in Houston, Texas which covered a variety of reserves topics including updated PRMS guidelines, data analytics, unconventional resource issues, SEC comment letter trends, andothers. In addition, Mr. Gardner attended the 2019 SPEE conference held in Banff, Canada, various local SPEE technical seminars, and other internal company training courses during the yearcovering topics such as analysis techniques for unconventional reservoirs, ethics, reserves evaluation, and more. Based on his educational background, professional training and more than 14 years of practical experience in the estimation and evaluation of petroleum reserves, Mr. Gardner has attained theprofessional qualifications as a Reserves Estimator set forth in Article III of the “Standards Pertaining to the Estimating and Auditing of Oil and Gas Reserves Information” promulgated by theSociety of Petroleum Engineers as of February 19, 2007.
RYDER SCOTT COMPANY PETROLEUM CONSULTANTS

PETROLEUM RESERVES DEFINITIONS
As Adapted From:RULE 4-10(a) of REGULATION S-X PART 210
UNITED STATES SECURITIES AND EXCHANGE COMMISSION (SEC)
PREAMBLE
On January 14, 2009, the United States Securities and Exchange Commission (SEC) published the “Modernization of Oil and Gas Reporting; Final Rule” in the Federal Register of NationalArchives and Records Administration (NARA). The “Modernization of Oil and Gas Reporting; Final Rule” includes revisions and additions to the definition section in Rule 4-10 of Regulation S-X,revisions and additions to the oil and gas reporting requirements in Regulation S-K, and amends and codifies Industry Guide 2 in Regulation S-K. The “Modernization of Oil and Gas Reporting; FinalRule”, including all references to Regulation S-X and Regulation S-K, shall be referred to herein collectively as the “SEC regulations”. The SEC regulations take effect for all filings made with theUnited States Securities and Exchange Commission as of December 31, 2009, or after January 1, 2010. Reference should be made to the full text under Title 17, Code of Federal Regulations,Regulation S-X Part 210, Rule 4-10(a) for the complete definitions (direct passages excerpted in part or wholly from the aforementioned SEC document are denoted in italics herein).
Reserves are estimated remaining quantities of oil and gas and related substances anticipated to be economically producible, as of a given date, by application of development projects toknown accumulations. All reserve estimates involve an assessment of the uncertainty relating the likelihood that the actual remaining quantities recovered will be greater or less than the estimatedquantities determined as of the date the estimate is made. The uncertainty depends chiefly on the amount of reliable geologic and engineering data available at the time of the estimate and theinterpretation of these data. The relative degree of uncertainty may be conveyed by placing reserves into one of two principal classifications, either proved or unproved. Unproved reserves are lesscertain to be recovered than proved reserves and may be further sub-classified as probable and possible reserves to denote progressively increasing uncertainty in their recoverability. Under theSEC regulations as of December 31, 2009, or after January 1, 2010, a company may optionally disclose estimated quantities of probable or possible oil and gas reserves in documents publicly filedwith the SEC. The SEC regulations continue to prohibit disclosure of estimates of oil and gas resources other than reserves and any estimated values of such resources in any document publiclyfiled with the SEC unless such information is required to be disclosed in the document by foreign or state law as noted in §229.1202 Instruction to Item 1202.
Reserves estimates will generally be revised only as additional geologic or engineering data become available or as economic conditions change.
Reserves may be attributed to either natural energy or improved recovery methods. Improved recovery methods include all methods for supplementing natural energy or altering naturalforces in the reservoir to increase ultimate recovery. Examples of such methods are pressure maintenance, natural gas cycling, waterflooding, thermal methods, chemical flooding, and the use ofmiscible and immiscible displacement fluids. Other improved recovery methods may be developed in the future as petroleum technology continues to evolve.
Reserves may be attributed to either conventional or unconventional petroleum accumulations. Petroleum accumulations are considered as either conventional or unconventional based onthe nature of their in-place characteristics, extraction method applied, or degree of processing prior to sale. Examples of unconventional petroleum accumulations include coalbed or coalseammethane (CBM/CSM), basin-
RYDER SCOTT COMPANY PETROLEUM CONSULTANTS

PETROLEUM RESERVES DEFINITIONSPage 2
centered gas, shale gas, gas hydrates, natural bitumen and oil shale deposits. These unconventional accumulations may require specialized extraction technology and/or significant processing priorto sale.
Reserves do not include quantities of petroleum being held in inventory.
Because of the differences in uncertainty, caution should be exercised when aggregating quantities of petroleum from different reserves categories.
RESERVES (SEC DEFINITIONS)
Securities and Exchange Commission Regulation S-X §210.4-10(a)(26) defines reserves as follows:
Reserves. Reserves are estimated remaining quantities of oil and gas and related substances anticipated to be economically producible, as of a given date, by application of development projectsto known accumulations. In addition, there must exist, or there must be a reasonable expectation that there will exist, the legal right to produce or a revenue interest in the production, installedmeans of delivering oil and gas or related substances to market, and all permits and financing required to implement the project.
Note to paragraph (a)(26): Reserves should not be assigned to adjacent reservoirs isolated by major, potentially sealing, faults until those reservoirs are penetrated and evaluated as economicallyproducible. Reserves should not be assigned to areas that are clearly separated from a known accumulation by a non-productive reservoir (i.e., absence of reservoir, structurally low reservoir, ornegative test results). Such areas may contain prospective resources (i.e., potentially recoverable resources from undiscovered accumulations).
PROVED RESERVES (SEC DEFINITIONS)
Securities and Exchange Commission Regulation S-X §210.4-10(a)(22) defines proved oil and gas reserves as follows:
Proved oil and gas reserves. Proved oil and gas reserves are those quantities of oil and gas, which, by analysis of geoscience and engineering data, can be estimated with reasonable certainty tobe economically producible—from a given date forward, from known reservoirs, and under existing economic conditions, operating methods, and government regulations—prior to the time at whichcontracts providing the right to operate expire, unless evidence indicates that renewal is reasonably certain, regardless of whether deterministic or probabilistic methods are used for the estimation.The project to extract the hydrocarbons must have commenced or the operator must be reasonably certain that it will commence the project within a reasonable time.
(i) The area of the reservoir considered as proved includes:
(A) The area identified by drilling and limited by fluid contacts, if any, and
(B) Adjacent undrilled portions of the reservoir that can, with reasonable certainty, be judged to be continuous with it and to contain economically producible oil or gas on the basis ofavailable geoscience and engineering data.
(ii) In the absence of data on fluid contacts, proved quantities in a reservoir are limited by the lowest known hydrocarbons (LKH) as seen in a well penetration unless geoscience,engineering, or performance data and reliable technology establishes a lower contact with reasonable certainty.
RYDER SCOTT COMPANY PETROLEUM CONSULTANTS

PETROLEUM RESERVES DEFINITIONSPage 3
(iii) Where direct observation from well penetrations has defined a highest known oil (HKO) elevation and the potential exists for an associated gas cap, proved oil reserves may be assignedin the structurally higher portions of the reservoir only if geoscience, engineering, or performance data and reliable technology establish the higher contact with reasonable certainty.
(iv) Reserves which can be produced economically through application of improved recovery techniques (including, but not limited to, fluid injection) are included in the proved classificationwhen:
(A) Successful testing by a pilot project in an area of the reservoir with properties no more favorable than in the reservoir as a whole, the operation of an installed program in thereservoir or an analogous reservoir, or other evidence using reliable technology establishes the reasonable certainty of the engineering analysis on which the project or program wasbased; and
(B) The project has been approved for development by all necessary parties and entities, including governmental entities.
(v) Existing economic conditions include prices and costs at which economic producibility from a reservoir is to be determined. The price shall be the average price during the 12-monthperiod prior to the ending date of the period covered by the report, determined as an unweighted arithmetic average of the first-day-of-the-month price for each month within such period,unless prices are defined by contractual arrangements, excluding escalations based upon future conditions.
RYDER SCOTT COMPANY PETROLEUM CONSULTANTS
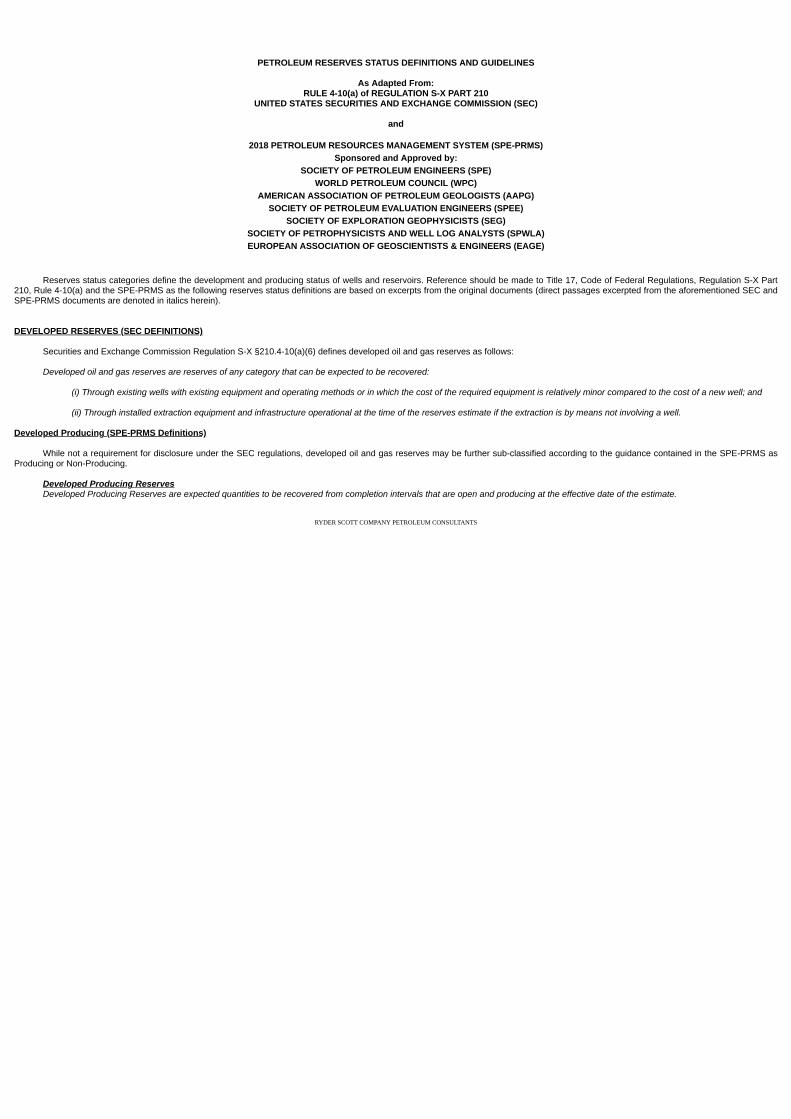
PETROLEUM RESERVES STATUS DEFINITIONS AND GUIDELINES
As Adapted From:RULE 4-10(a) of REGULATION S-X PART 210
UNITED STATES SECURITIES AND EXCHANGE COMMISSION (SEC)
and
2018 PETROLEUM RESOURCES MANAGEMENT SYSTEM (SPE-PRMS)Sponsored and Approved by:
SOCIETY OF PETROLEUM ENGINEERS (SPE)WORLD PETROLEUM COUNCIL (WPC)
AMERICAN ASSOCIATION OF PETROLEUM GEOLOGISTS (AAPG)SOCIETY OF PETROLEUM EVALUATION ENGINEERS (SPEE)
SOCIETY OF EXPLORATION GEOPHYSICISTS (SEG)SOCIETY OF PETROPHYSICISTS AND WELL LOG ANALYSTS (SPWLA)EUROPEAN ASSOCIATION OF GEOSCIENTISTS & ENGINEERS (EAGE)
Reserves status categories define the development and producing status of wells and reservoirs. Reference should be made to Title 17, Code of Federal Regulations, Regulation S-X Part210, Rule 4-10(a) and the SPE-PRMS as the following reserves status definitions are based on excerpts from the original documents (direct passages excerpted from the aforementioned SEC andSPE-PRMS documents are denoted in italics herein).
DEVELOPED RESERVES (SEC DEFINITIONS)
Securities and Exchange Commission Regulation S-X §210.4-10(a)(6) defines developed oil and gas reserves as follows:
Developed oil and gas reserves are reserves of any category that can be expected to be recovered:
(i) Through existing wells with existing equipment and operating methods or in which the cost of the required equipment is relatively minor compared to the cost of a new well; and
(ii) Through installed extraction equipment and infrastructure operational at the time of the reserves estimate if the extraction is by means not involving a well.
Developed Producing (SPE-PRMS Definitions)
While not a requirement for disclosure under the SEC regulations, developed oil and gas reserves may be further sub-classified according to the guidance contained in the SPE-PRMS asProducing or Non-Producing.
Developed Producing ReservesDeveloped Producing Reserves are expected quantities to be recovered from completion intervals that are open and producing at the effective date of the estimate.
RYDER SCOTT COMPANY PETROLEUM CONSULTANTS

PETROLEUM RESERVES STATUS DEFINITIONS AND GUIDELINESPage 2
Improved recovery reserves are considered producing only after the improved recovery project is in operation.
Developed Non-ProducingDeveloped Non-Producing Reserves include shut-in and behind-pipe Reserves.
Shut-InShut-in Reserves are expected to be recovered from:
(1)completion intervals that are open at the time of the estimate but which have not yet started producing;(2)wells which were shut-in for market conditions or pipeline connections; or(3)wells not capable of production for mechanical reasons.
Behind-PipeBehind-pipe Reserves are expected to be recovered from zones in existing wells that will require additional completion work or future re-completion before start of production with minor costto access these reserves.
In all cases, production can be initiated or restored with relatively low expenditure compared to the cost of drilling a new well.
UNDEVELOPED RESERVES (SEC DEFINITIONS)
Securities and Exchange Commission Regulation S-X §210.4-10(a)(31) defines undeveloped oil and gas reserves as follows:
Undeveloped oil and gas reserves are reserves of any category that are expected to be recovered from new wells on undrilled acreage, or from existing wells where a relatively majorexpenditure is required for recompletion.
(i)Reserves on undrilled acreage shall be limited to those directly offsetting development spacing areas that are reasonably certain of production when drilled, unless evidence usingreliable technology exists that establishes reasonable certainty of economic producibility at greater distances.
(ii) Undrilled locations can be classified as having undeveloped reserves only if a development plan has been adopted indicating that they are scheduled to be drilled within five years,unless the specific circumstances, justify a longer time.
(iii) Under no circumstances shall estimates for undeveloped reserves be attributable to any acreage for which an application of fluid injection or other improved recovery technique iscontemplated, unless such techniques have been proved effective by actual projects in the same reservoir or an analogous reservoir, as defined in paragraph (a)(2) of this section, orby other evidence using reliable technology establishing reasonable certainty.
RYDER SCOTT COMPANY PETROLEUM CONSULTANTS

January 27, 2020 Exhibit No. 99.2
Mr. Erik RoachPDC Energy, Inc.1775 Sherman Street, Suite 3000Denver, Colorado 80203
Dear Mr. Roach:
In accordance with your request, we have estimated the proved reserves and future revenue, as of December 31, 2019, to the PDC Energy, Inc. (PDC) interest in certain oil and gas properties located in Culbersonand Reeves Counties, Texas. We completed our evaluation on or about the date of this letter. It is our understanding that the proved reserves estimated in this report constitute approximately 19 percent of all provedreserves owned by PDC. The estimates in this report have been prepared in accordance with the definitions and regulations of the U.S. Securities and Exchange Commission (SEC) and, with the exception of theexclusion of future income taxes, conform to the FASB Accounting Standards Codification Topic 932, Extractive Activities—Oil and Gas. Definitions are presented immediately following this letter. This report has beenprepared for PDC's use in filing with the SEC; in our opinion the assumptions, data, methods, and procedures used in the preparation of this report are appropriate for such purpose.
We estimate the net reserves and future net revenue to the PDC interest in these properties, as of December 31, 2019, to be:
Net Reserves Future Net Revenue (M$)
Oil NGL Gas Present WorthCategory (MBBL) (MBBL) (MMCF) Total at 10%
Proved Developed Producing 19,126.4 14,656.5 110,835.5 668,618.4 451,554.4Proved Undeveloped 36,447.1 11,383.5 111,881.1 901,686.5 444,781.9
Total Proved 55,573.5 26,040.0 222,716.7 1,570,305.3 896,336.3
Totals may not add because of rounding.
The oil volumes shown include crude oil and condensate. Oil and natural gas liquids (NGL) volumes are expressed in thousands of barrels (MBBL); a barrel is equivalent to 42 United States gallons. Gas volumes areexpressed in millions of cubic feet (MMCF) at standard temperature and pressure bases.
Reserves categorization conveys the relative degree of certainty; reserves subcategorization is based on development and production status. There are no proved developed non-producing reserves at the price andcost parameters used in this report. No study was made to determine whether probable or possible reserves might be established for these properties. The estimates of reserves and future revenue included hereinhave not been adjusted for risk. This report does not include any value that could be attributed to interests in undeveloped acreage beyond those tracts for which undeveloped reserves have been estimated.

Gross revenue is PDC's share of the gross (100 percent) revenue from the properties prior to any deductions. Future net revenue is after deductions for PDC's share of production taxes, ad valorem taxes, capitalcosts, abandonment costs, and operating expenses but before consideration of any income taxes. The future net revenue has been discounted at an annual rate of 10 percent to determine its present worth, which isshown to indicate the effect of time on the value of money. Future net revenue presented in this report, whether discounted or undiscounted, should not be construed as being the fair market value of the properties.
Prices used in this report are based on the 12-month unweighted arithmetic average of the first-day-of-the-month price for each month in the period January through December 2019. For oil and NGL volumes, theaverage West Texas Intermediate spot price of $55.691 per barrel is adjusted for quality, transportation fees, and market differentials. For gas volumes, the average Henry Hub spot price of $2.58 per MMBTU isadjusted for energy content, transportation fees, and market differentials; the transportation fees for certain operated properties have been adjusted for existing contractual agreements. All prices are held constantthroughout the lives of the properties. The average adjusted product prices weighted by production over the remaining lives of the properties are $54.01 per barrel of oil, $16.51 per barrel of NGL, and $1.280 per MCFof gas.
Operating costs used in this report are based on operating expense records of PDC. For the nonoperated properties, these costs include the per-well overhead expenses allowed under joint operating agreementsalong with estimates of costs to be incurred at and below the district and field levels. As requested, operating costs for the operated properties are limited to direct lease- and field-level costs and PDC's estimate of theportion of its headquarters general and administrative overhead expenses necessary to operate the properties. An economic projection is included in the proved developed producing category to account for the feesassociated with PDC's El Paso transportation contract. Operating costs have been divided into per-well costs and per-unit-of-production costs and are not escalated for inflation.
Capital costs used in this report were provided by PDC and are based on authorizations for expenditure and actual costs from recent activity. Capital costs are included as required for new development wells andproduction equipment. Based on our understanding of future development plans, a review of the records provided to us, and our knowledge of similar properties, we regard these estimated capital costs to bereasonable. Abandonment costs used in this report are PDC's estimates of the costs to abandon the wells and production facilities, net of any salvage value. Capital costs and abandonment costs are not escalated forinflation.
For the purposes of this report, we did not perform any field inspection of the properties, nor did we examine the mechanical operation or condition of the wells and facilities. We have not investigated possibleenvironmental liability related to the properties; therefore, our estimates do not include any costs due to such possible liability.
We have made no investigation of potential volume and value imbalances resulting from overdelivery or underdelivery to the PDC interest. Therefore, our estimates of reserves and future revenue do not includeadjustments for the settlement of any such imbalances; our projections are based on PDC receiving its net revenue interest share of estimated future gross production.
The reserves shown in this report are estimates only and should not be construed as exact quantities. Proved reserves are those quantities of oil and gas which, by analysis of engineering and geoscience data, canbe estimated with reasonable certainty to be economically producible; probable and possible reserves are those additional reserves which are sequentially less certain to be recovered than proved reserves. Estimatesof reserves may increase or decrease as a result of market conditions, future operations, changes in regulations, or actual reservoir performance. In addition to the primary economic assumptions discussed herein,our estimates are based on certain assumptions including, but not limited to, that the properties will be developed consistent with current development plans as provided to us by PDC, that the properties will beoperated in a prudent manner, that no governmental regulations or controls will be put in place that would impact the ability of the interest owner to recover the reserves, and that our projections of future production willprove consistent with actual performance. If the reserves are recovered, the

revenues therefrom and the costs related thereto could be more or less than the estimated amounts. Because of governmental policies and uncertainties of supply and demand, the sales rates, prices received for thereserves, and costs incurred in recovering such reserves may vary from assumptions made while preparing this report.
For the purposes of this report, we used technical and economic data including, but not limited to, well logs, geologic maps, well test data, production data, historical price and cost information, and property ownershipinterests. The reserves in this report have been estimated using deterministic methods; these estimates have been prepared in accordance with the Standards Pertaining to the Estimating and Auditing of Oil and GasReserves Information promulgated by the Society of Petroleum Engineers (SPE Standards). We used standard engineering and geoscience methods, or a combination of methods, including performance analysis andanalogy, that we considered to be appropriate and necessary to categorize and estimate reserves in accordance with SEC definitions and regulations. A substantial portion of these reserves are for undevelopedlocations; such reserves are based on analogy to properties with similar geologic and reservoir characteristics. As in all aspects of oil and gas evaluation, there are uncertainties inherent in the interpretation ofengineering and geoscience data; therefore, our conclusions necessarily represent only informed professional judgment.
The data used in our estimates were obtained from PDC, public data sources, and the nonconfidential files of Netherland, Sewell & Associates, Inc. (NSAI) and were accepted as accurate. Supporting work data are onfile in our office. We have not examined the titles to the properties or independently confirmed the actual degree or type of interest owned. The technical persons primarily responsible for preparing the estimatespresented herein meet the requirements regarding qualifications, independence, objectivity, and confidentiality set forth in the SPE Standards. Neil H. Little, a Licensed Professional Engineer in the State of Texas, hasbeen practicing consulting petroleum engineering at NSAI since 2011 and has over 9 years of prior industry experience. Mike K. Norton, a Licensed Professional Geoscientist in the State of Texas, has been practicingconsulting petroleum geoscience at NSAI since 1989 and has over 10 years of prior industry experience. We are independent petroleum engineers, geologists, geophysicists, and petrophysicists; we do not own aninterest in these properties nor are we employed on a contingent basis.
Sincerely,
NETHERLAND, SEWELL & ASSOCIATES, INC.Texas Registered Engineering Firm F-2699
/s/ C.H. (Scott) Rees IIIBy:
C.H. (Scott) Rees III, P.E.Chairman and Chief Executive Officer
/s/ Neil H. Little /s/ Mike K. NortonBy: By:
Neil H. Little, P.E. 117966 Mike K. Norton, P.G. 441Vice President Senior Vice President
Date Signed: January 27, 2020 Date Signed: January 27, 2020

NHL:SMDPlease be advised that the digital document you are viewing is provided by Netherland, Sewell & Associates, Inc. (NSAI) as a convenience to our clients. The digital document is intended to be substantively the same as the original signed document maintained by NSAI.The digital document is subject to the parameters, limitations, and conditions stated in the original document. In the event of any differences between the digital document and the original document, the original document shall control and supersede the digital document.
The following definitions are set forth in U.S. Securities and Exchange Commission (SEC) Regulation S-X Section 210.4‑10(a). Also included is supplemental information from (1) the 2018 Petroleum Resources Management Systemapproved by the Society of Petroleum Engineers, (2) the FASB Accounting Standards Codification Topic 932, Extractive Activities—Oil and Gas, and (3) the SEC's Compliance and Disclosure Interpretations.
(1) Acquisition of properties. Costs incurred to purchase, lease or otherwise acquire a property, including costs of lease bonuses and options to purchase or lease properties, the portion of costs applicable to minerals when land includingmineral rights is purchased in fee, brokers' fees, recording fees, legal costs, and other costs incurred in acquiring properties.
(2) Analogous reservoir. Analogous reservoirs, as used in resources assessments, have similar rock and fluid properties, reservoir conditions (depth, temperature, and pressure) and drive mechanisms, but are typically at a more advancedstage of development than the reservoir of interest and thus may provide concepts to assist in the interpretation of more limited data and estimation of recovery. When used to support proved reserves, an "analogous reservoir" refers to areservoir that shares the following characteristics with the reservoir of interest:
(i) Same geological formation (but not necessarily in pressure communication with the reservoir of interest);(ii) Same environment of deposition;(iii) Similar geological structure; and(iv) Same drive mechanism.
Instruction to paragraph (a)(2): Reservoir properties must, in the aggregate, be no more favorable in the analog than in the reservoir of interest.
(3) Bitumen. Bitumen, sometimes referred to as natural bitumen, is petroleum in a solid or semi-solid state in natural deposits with a viscosity greater than 10,000 centipoise measured at original temperature in the deposit and atmosphericpressure, on a gas free basis. In its natural state it usually contains sulfur, metals, and other non-hydrocarbons.
(4) Condensate. Condensate is a mixture of hydrocarbons that exists in the gaseous phase at original reservoir temperature and pressure, but that, when produced, is in the liquid phase at surface pressure and temperature.
(5) Deterministic estimate. The method of estimating reserves or resources is called deterministic when a single value for each parameter (from the geoscience, engineering, or economic data) in the reserves calculation is used in thereserves estimation procedure.
(6) Developed oil and gas reserves. Developed oil and gas reserves are reserves of any category that can be expected to be recovered:
(i) Through existing wells with existing equipment and operating methods or in which the cost of the required equipment is relatively minor compared to the cost of a new well; and(ii) Through installed extraction equipment and infrastructure operational at the time of the reserves estimate if the extraction is by means not involving a well.
Supplemental definitions from the 2018 Petroleum Resources Management System:
Developed Producing Reserves – Expected quantities to be recovered from completion intervals that are open and producing at the effective date of the estimate. Improved recovery Reserves are considered producing only after the improvedrecovery project is in operation.
Developed Non-Producing Reserves – Shut-in and behind-pipe Reserves. Shut-in Reserves are expected to be recovered from (1) completion intervals that are open at the time of the estimate but which have not yet started producing, (2) wells whichwere shut-in for market conditions or pipeline connections, or (3) wells not capable of production for mechanical reasons. Behind-pipe Reserves are expected to be recovered from zones in existing wells that will require additional completion work orfuture re-completion before start of production with minor cost to access these reserves. In all cases, production can be initiated or restored with relatively low expenditure compared to the cost of drilling a new well.
(7) Development costs. Costs incurred to obtain access to proved reserves and to provide facilities for extracting, treating, gathering and storing the oil and gas. More specifically, development costs, including depreciation and applicableoperating costs of support equipment and facilities and other costs of development activities, are costs incurred to:
(i) Gain access to and prepare well locations for drilling, including surveying well locations for the purpose of determining specific development drilling sites, clearing ground, draining, road building, and relocating public roads, gaslines, and power lines, to the extent necessary in developing the proved reserves.
(ii) Drill and equip development wells, development-type stratigraphic test wells, and service wells, including the costs of platforms and of well equipment such as casing, tubing, pumping equipment, and the wellhead assembly.
Definitions - Page 1 of 6

(iii) Acquire, construct, and install production facilities such as lease flow lines, separators, treaters, heaters, manifolds, measuring devices, and production storage tanks, natural gas cycling and processing plants, and central utility andwaste disposal systems.
(iv) Provide improved recovery systems.
(8) Development project. A development project is the means by which petroleum resources are brought to the status of economically producible. As examples, the development of a single reservoir or field, an incremental development in aproducing field, or the integrated development of a group of several fields and associated facilities with a common ownership may constitute a development project.
(9) Development well. A well drilled within the proved area of an oil or gas reservoir to the depth of a stratigraphic horizon known to be productive.
(10) Economically producible. The term economically producible, as it relates to a resource, means a resource which generates revenue that exceeds, or is reasonably expected to exceed, the costs of the operation. The value of theproducts that generate revenue shall be determined at the terminal point of oil and gas producing activities as defined in paragraph (a)(16) of this section.
(11) Estimated ultimate recovery (EUR). Estimated ultimate recovery is the sum of reserves remaining as of a given date and cumulative production as of that date.
(12) Exploration costs. Costs incurred in identifying areas that may warrant examination and in examining specific areas that are considered to have prospects of containing oil and gas reserves, including costs of drilling exploratory wells andexploratory-type stratigraphic test wells. Exploration costs may be incurred both before acquiring the related property (sometimes referred to in part as prospecting costs) and after acquiring the property. Principal types of exploration costs,which include depreciation and applicable operating costs of support equipment and facilities and other costs of exploration activities, are:
(i) Costs of topographical, geographical and geophysical studies, rights of access to properties to conduct those studies, and salaries and other expenses of geologists, geophysical crews, and others conducting those studies.Collectively, these are sometimes referred to as geological and geophysical or "G&G" costs.
(ii) Costs of carrying and retaining undeveloped properties, such as delay rentals, ad valorem taxes on properties, legal costs for title defense, and the maintenance of land and lease records.(iii) Dry hole contributions and bottom hole contributions.(iv) Costs of drilling and equipping exploratory wells.(v) Costs of drilling exploratory-type stratigraphic test wells.
(13) Exploratory well. An exploratory well is a well drilled to find a new field or to find a new reservoir in a field previously found to be productive of oil or gas in another reservoir. Generally, an exploratory well is any well that is not adevelopment well, an extension well, a service well, or a stratigraphic test well as those items are defined in this section.
(14) Extension well. An extension well is a well drilled to extend the limits of a known reservoir.
(15) Field. An area consisting of a single reservoir or multiple reservoirs all grouped on or related to the same individual geological structural feature and/or stratigraphic condition. There may be two or more reservoirs in a field which areseparated vertically by intervening impervious strata, or laterally by local geologic barriers, or by both. Reservoirs that are associated by being in overlapping or adjacent fields may be treated as a single or common operational field. Thegeological terms "structural feature" and "stratigraphic condition" are intended to identify localized geological features as opposed to the broader terms of basins, trends, provinces, plays, areas-of-interest, etc.
(16) Oil and gas producing activities.
(i) Oil and gas producing activities include:
(A) The search for crude oil, including condensate and natural gas liquids, or natural gas ("oil and gas") in their natural states and original locations;(B) The acquisition of property rights or properties for the purpose of further exploration or for the purpose of removing the oil or gas from such properties;(C) The construction, drilling, and production activities necessary to retrieve oil and gas from their natural reservoirs, including the acquisition, construction, installation, and maintenance of field gathering and storage systems, such
as:(1) Lifting the oil and gas to the surface; and(2) Gathering, treating, and field processing (as in the case of processing gas to extract liquid hydrocarbons); and
(D) Extraction of saleable hydrocarbons, in the solid, liquid, or gaseous state, from oil sands, shale, coalbeds, or other nonrenewable natural resources which are intended to be upgraded into synthetic oil or gas, and activitiesundertaken with a view to such extraction.
Definitions - Page 2 of 6

Instruction 1 to paragraph (a)(16)(i): The oil and gas production function shall be regarded as ending at a "terminal point", which is the outlet valve on the lease or field storage tank. If unusual physical or operational circumstances exist,it may be appropriate to regard the terminal point for the production function as:
a. The first point at which oil, gas, or gas liquids, natural or synthetic, are delivered to a main pipeline, a common carrier, a refinery, or a marine terminal; andb. In the case of natural resources that are intended to be upgraded into synthetic oil or gas, if those natural resources are delivered to a purchaser prior to upgrading, the first point at which the natural resources are delivered to a main
pipeline, a common carrier, a refinery, a marine terminal, or a facility which upgrades such natural resources into synthetic oil or gas.
Instruction 2 to paragraph (a)(16)(i): For purposes of this paragraph (a)(16), the term saleable hydrocarbons means hydrocarbons that are saleable in the state in which the hydrocarbons are delivered.
(ii) Oil and gas producing activities do not include:
(A) Transporting, refining, or marketing oil and gas;(B) Processing of produced oil, gas, or natural resources that can be upgraded into synthetic oil or gas by a registrant that does not have the legal right to produce or a revenue interest in such production;(C) Activities relating to the production of natural resources other than oil, gas, or natural resources from which synthetic oil and gas can be extracted; or(D) Production of geothermal steam.
(17) Possible reserves. Possible reserves are those additional reserves that are less certain to be recovered than probable reserves.
(i) When deterministic methods are used, the total quantities ultimately recovered from a project have a low probability of exceeding proved plus probable plus possible reserves. When probabilistic methods are used, there should beat least a 10% probability that the total quantities ultimately recovered will equal or exceed the proved plus probable plus possible reserves estimates.
(ii) Possible reserves may be assigned to areas of a reservoir adjacent to probable reserves where data control and interpretations of available data are progressively less certain. Frequently, this will be in areas where geoscience andengineering data are unable to define clearly the area and vertical limits of commercial production from the reservoir by a defined project.
(iii) Possible reserves also include incremental quantities associated with a greater percentage recovery of the hydrocarbons in place than the recovery quantities assumed for probable reserves.(iv) The proved plus probable and proved plus probable plus possible reserves estimates must be based on reasonable alternative technical and commercial interpretations within the reservoir or subject project that are clearly
documented, including comparisons to results in successful similar projects.(v) Possible reserves may be assigned where geoscience and engineering data identify directly adjacent portions of a reservoir within the same accumulation that may be separated from proved areas by faults with displacement less
than formation thickness or other geological discontinuities and that have not been penetrated by a wellbore, and the registrant believes that such adjacent portions are in communication with the known (proved) reservoir. Possiblereserves may be assigned to areas that are structurally higher or lower than the proved area if these areas are in communication with the proved reservoir.
(vi) Pursuant to paragraph (a)(22)(iii) of this section, where direct observation has defined a highest known oil (HKO) elevation and the potential exists for an associated gas cap, proved oil reserves should be assigned in the structurallyhigher portions of the reservoir above the HKO only if the higher contact can be established with reasonable certainty through reliable technology. Portions of the reservoir that do not meet this reasonable certainty criterion may beassigned as probable and possible oil or gas based on reservoir fluid properties and pressure gradient interpretations.
(18) Probable reserves. Probable reserves are those additional reserves that are less certain to be recovered than proved reserves but which, together with proved reserves, are as likely as not to be recovered.
(i) When deterministic methods are used, it is as likely as not that actual remaining quantities recovered will exceed the sum of estimated proved plus probable reserves. When probabilistic methods are used, there should be at least a50% probability that the actual quantities recovered will equal or exceed the proved plus probable reserves estimates.
(ii) Probable reserves may be assigned to areas of a reservoir adjacent to proved reserves where data control or interpretations of available data are less certain, even if the interpreted reservoir continuity of structure or productivitydoes not meet the reasonable certainty criterion. Probable reserves may be assigned to areas that are structurally higher than the proved area if these areas are in communication with the proved reservoir.
(iii) Probable reserves estimates also include potential incremental quantities associated with a greater percentage recovery of the hydrocarbons in place than assumed for proved reserves.
Definitions - Page 3 of 6

(iv) See also guidelines in paragraphs (a)(17)(iv) and (a)(17)(vi) of this section.
(19) Probabilistic estimate. The method of estimation of reserves or resources is called probabilistic when the full range of values that could reasonably occur for each unknown parameter (from the geoscience and engineering data) is usedto generate a full range of possible outcomes and their associated probabilities of occurrence.
(20) Production costs.
(i) Costs incurred to operate and maintain wells and related equipment and facilities, including depreciation and applicable operating costs of support equipment and facilities and other costs of operating and maintaining those wellsand related equipment and facilities. They become part of the cost of oil and gas produced. Examples of production costs (sometimes called lifting costs) are:
(A) Costs of labor to operate the wells and related equipment and facilities.(B) Repairs and maintenance.(C) Materials, supplies, and fuel consumed and supplies utilized in operating the wells and related equipment and facilities.(D) Property taxes and insurance applicable to proved properties and wells and related equipment and facilities.(E) Severance taxes.
(ii) Some support equipment or facilities may serve two or more oil and gas producing activities and may also serve transportation, refining, and marketing activities. To the extent that the support equipment and facilities are used in oiland gas producing activities, their depreciation and applicable operating costs become exploration, development or production costs, as appropriate. Depreciation, depletion, and amortization of capitalized acquisition, exploration,and development costs are not production costs but also become part of the cost of oil and gas produced along with production (lifting) costs identified above.
(21) Proved area. The part of a property to which proved reserves have been specifically attributed.
(22) Proved oil and gas reserves. Proved oil and gas reserves are those quantities of oil and gas, which, by analysis of geoscience and engineering data, can be estimated with reasonable certainty to be economically producible—from agiven date forward, from known reservoirs, and under existing economic conditions, operating methods, and government regulations—prior to the time at which contracts providing the right to operate expire, unless evidence indicates thatrenewal is reasonably certain, regardless of whether deterministic or probabilistic methods are used for the estimation. The project to extract the hydrocarbons must have commenced or the operator must be reasonably certain that it willcommence the project within a reasonable time.
(i) The area of the reservoir considered as proved includes:
(A) The area identified by drilling and limited by fluid contacts, if any, and(B) Adjacent undrilled portions of the reservoir that can, with reasonable certainty, be judged to be continuous with it and to contain economically producible oil or gas on the basis of available geoscience and engineering data.
(ii) In the absence of data on fluid contacts, proved quantities in a reservoir are limited by the lowest known hydrocarbons (LKH) as seen in a well penetration unless geoscience, engineering, or performance data and reliabletechnology establishes a lower contact with reasonable certainty.
(iii) Where direct observation from well penetrations has defined a highest known oil (HKO) elevation and the potential exists for an associated gas cap, proved oil reserves may be assigned in the structurally higher portions of thereservoir only if geoscience, engineering, or performance data and reliable technology establish the higher contact with reasonable certainty.
(iv) Reserves which can be produced economically through application of improved recovery techniques (including, but not limited to, fluid injection) are included in the proved classification when:
(A) Successful testing by a pilot project in an area of the reservoir with properties no more favorable than in the reservoir as a whole, the operation of an installed program in the reservoir or an analogous reservoir, or other evidenceusing reliable technology establishes the reasonable certainty of the engineering analysis on which the project or program was based; and
(B) The project has been approved for development by all necessary parties and entities, including governmental entities.
(v) Existing economic conditions include prices and costs at which economic producibility from a reservoir is to be determined. The price shall be the average price during the 12-month period prior to the ending date of the periodcovered by the report, determined as an unweighted arithmetic average of the first-day-of-the-month price for each month within such period, unless prices are defined by contractual arrangements, excluding escalations based uponfuture conditions.
Definitions - Page 4 of 6

(23) Proved properties. Properties with proved reserves.
(24) Reasonable certainty. If deterministic methods are used, reasonable certainty means a high degree of confidence that the quantities will be recovered. If probabilistic methods are used, there should be at least a 90% probability that thequantities actually recovered will equal or exceed the estimate. A high degree of confidence exists if the quantity is much more likely to be achieved than not, and, as changes due to increased availability of geoscience (geological,geophysical, and geochemical), engineering, and economic data are made to estimated ultimate recovery (EUR) with time, reasonably certain EUR is much more likely to increase or remain constant than to decrease.
(25) Reliable technology. Reliable technology is a grouping of one or more technologies (including computational methods) that has been field tested and has been demonstrated to provide reasonably certain results with consistency andrepeatability in the formation being evaluated or in an analogous formation.
(26) Reserves. Reserves are estimated remaining quantities of oil and gas and related substances anticipated to be economically producible, as of a given date, by application of development projects to known accumulations. In addition,there must exist, or there must be a reasonable expectation that there will exist, the legal right to produce or a revenue interest in the production, installed means of delivering oil and gas or related substances to market, and all permits andfinancing required to implement the project.
Note to paragraph (a)(26): Reserves should not be assigned to adjacent reservoirs isolated by major, potentially sealing, faults until those reservoirs are penetrated and evaluated as economically producible. Reserves should not be assignedto areas that are clearly separated from a known accumulation by a non-productive reservoir (i.e., absence of reservoir, structurally low reservoir, or negative test results). Such areas may contain prospective resources (i.e., potentiallyrecoverable resources from undiscovered accumulations).
Excerpted from the FASB Accounting Standards Codification Topic 932, Extractive Activities—Oil and Gas:
932-235-50-30 A standardized measure of discounted future net cash flows relating to an entity's interests in both of the following shall be disclosed as of the end of the year:
a. Proved oil and gas reserves (see paragraphs 932-235-50-3 through 50-11B)b. Oil and gas subject to purchase under long-term supply, purchase, or similar agreements and contracts in which the entity participates in the operation of the properties on which the oil or gas is located or otherwise serves as the
producer of those reserves (see paragraph 932-235-50-7).
The standardized measure of discounted future net cash flows relating to those two types of interests in reserves may be combined for reporting purposes.
932-235-50-31 All of the following information shall be disclosed in the aggregate and for each geographic area for which reserve quantities are disclosed in accordance with paragraphs 932-235-50-3 through 50-11B:
a. Future cash inflows. These shall be computed by applying prices used in estimating the entity's proved oil and gas reserves to the year-end quantities of those reserves. Future price changes shall be considered only to the extentprovided by contractual arrangements in existence at year-end.
b. Future development and production costs. These costs shall be computed by estimating the expenditures to be incurred in developing and producing the proved oil and gas reserves at the end of the year, based on year-end costsand assuming continuation of existing economic conditions. If estimated development expenditures are significant, they shall be presented separately from estimated production costs.
c. Future income tax expenses. These expenses shall be computed by applying the appropriate year-end statutory tax rates, with consideration of future tax rates already legislated, to the future pretax net cash flows relating to theentity's proved oil and gas reserves, less the tax basis of the properties involved. The future income tax expenses shall give effect to tax deductions and tax credits and allowances relating to the entity's proved oil and gas reserves.
d. Future net cash flows. These amounts are the result of subtracting future development and production costs and future income tax expenses from future cash inflows.e. Discount. This amount shall be derived from using a discount rate of 10 percent a year to reflect the timing of the future net cash flows relating to proved oil and gas reserves.f. Standardized measure of discounted future net cash flows. This amount is the future net cash flows less the computed discount.
(27) Reservoir. A porous and permeable underground formation containing a natural accumulation of producible oil and/or gas that is confined by impermeable rock or water barriers and is individual and separate from other reservoirs.
Definitions - Page 5 of 6

(28) Resources. Resources are quantities of oil and gas estimated to exist in naturally occurring accumulations. A portion of the resources may be estimated to be recoverable, and another portion may be considered to be unrecoverable.Resources include both discovered and undiscovered accumulations.
(29) Service well. A well drilled or completed for the purpose of supporting production in an existing field. Specific purposes of service wells include gas injection, water injection, steam injection, air injection, salt-water disposal, water supplyfor injection, observation, or injection for in-situ combustion.
(30) Stratigraphic test well. A stratigraphic test well is a drilling effort, geologically directed, to obtain information pertaining to a specific geologic condition. Such wells customarily are drilled without the intent of being completed forhydrocarbon production. The classification also includes tests identified as core tests and all types of expendable holes related to hydrocarbon exploration. Stratigraphic tests are classified as "exploratory type" if not drilled in a known area or"development type" if drilled in a known area.
(31) Undeveloped oil and gas reserves. Undeveloped oil and gas reserves are reserves of any category that are expected to be recovered from new wells on undrilled acreage, or from existing wells where a relatively major expenditure isrequired for recompletion.
(i) Reserves on undrilled acreage shall be limited to those directly offsetting development spacing areas that are reasonably certain of production when drilled, unless evidence using reliable technology exists that establishesreasonable certainty of economic producibility at greater distances.
(ii) Undrilled locations can be classified as having undeveloped reserves only if a development plan has been adopted indicating that they are scheduled to be drilled within five years, unless the specific circumstances, justify a longertime.
From the SEC's Compliance and Disclosure Interpretations (October 26, 2009):
Although several types of projects — such as constructing offshore platforms and development in urban areas, remote locations or environmentally sensitive locations — by their nature customarily take a longer time to develop and therefore often dojustify longer time periods, this determination must always take into consideration all of the facts and circumstances. No particular type of project per se justifies a longer time period, and any extension beyond five years should be the exception, andnot the rule.
Factors that a company should consider in determining whether or not circumstances justify recognizing reserves even though development may extend past five years include, but are not limited to, the following:
Ÿ The company's level of ongoing significant development activities in the area to be developed (for example, drilling only the minimum number of wells necessary to maintain the lease generally would not constitute significantdevelopment activities);
Ÿ The company's historical record at completing development of comparable long-term projects;Ÿ The amount of time in which the company has maintained the leases, or booked the reserves, without significant development activities;Ÿ The extent to which the company has followed a previously adopted development plan (for example, if a company has changed its development plan several times without taking significant steps to implement any of those plans,
recognizing proved undeveloped reserves typically would not be appropriate); andŸ The extent to which delays in development are caused by external factors related to the physical operating environment (for example, restrictions on development on Federal lands, but not obtaining government permits), rather than
by internal factors (for example, shifting resources to develop properties with higher priority).
(iii) Under no circumstances shall estimates for undeveloped reserves be attributable to any acreage for which an application of fluid injection or other improved recovery technique is contemplated, unless such techniques have beenproved effective by actual projects in the same reservoir or an analogous reservoir, as defined in paragraph (a)(2) of this section, or by other evidence using reliable technology establishing reasonable certainty.
(32) Unproved properties. Properties with no proved reserves.
Definitions - Page 6 of 6