
pCO2 based on stomatal density of modern and fossil Nageia … · 2016-02-10 · Estimates of late...
13
Clim. Past, 12, 241–253, 2016 www.clim-past.net/12/241/2016/ doi:10.5194/cp-12-241-2016 © Author(s) 2016. CC Attribution 3.0 License. Estimates of late middle Eocene pCO 2 based on stomatal density of modern and fossil Nageia leaves X. Y. Liu, Q. Gao, M. Han, and J. H. Jin State Key Laboratory of Biocontrol and Guangdong Provincial Key Laboratory of Plant Resources, School of Life Sciences, Sun Yat-sen University, Guangzhou 510275, China Correspondence to: J. H. Jin ([email protected]) Received: 31 May 2015 – Published in Clim. Past Discuss.: 1 July 2015 Revised: 5 January 2016 – Accepted: 8 January 2016 – Published: 10 February 2016 Abstract. Atmospheric pCO 2 concentrations have been es- timated for intervals of the Eocene using various models and proxy information. Here we reconstruct late middle Eocene (42.0–38.5 Ma) pCO 2 based on the fossil leaves of Nageia maomingensis Jin et Liu collected from the Maoming Basin, Guangdong Province, China. We first determine relation- ships between atmospheric pCO 2 concentrations, stomatal density (SD) and stomatal index (SI) using “modern” leaves of N. motleyi (Parl.) De Laub, the nearest living species to the Eocene fossils. This work indicates that the SD in- versely responds to pCO 2 , while SI has almost no relation- ship with pCO 2 . Eocene pCO 2 concentrations can be recon- structed based on a regression approach and the stomatal ra- tio method by using the SD. The first approach gives a pCO 2 of 351.9 ± 6.6 ppmv, whereas the one based on stomatal ra- tio gives a pCO 2 of 537.5 ± 56.5 ppmv. Here, we explored the potential of N. maomingensis in pCO 2 reconstruction and obtained different results according to different meth- ods, providing a new insight for the reconstruction of paleo- climate and paleoenvironment in conifers. 1 Introduction The Eocene (55.8–33.9 Ma) generally was much warmer than present-day, although temperatures varied significantly across this time interval (Zachos et al., 2008). Climate of the early Eocene was extremely warm, particularly during the early Eocene Climatic Optimum (EECO; 51–53 Ma), and the Paleocene-Eocene Thermal Maximum (PETM; ∼ 55.9 Ma). However, global climatic conditions cooled significantly by the middle to late Eocene (40–36 Ma). Indeed, small, ephemeral ice-sheets and Arctic sea ice likely existed during the latest Eocene (Moran et al., 2006; Zachos et al., 2008). Many authors have suggested that changes in temperature during the Phanerozoic were linked to atmospheric pCO 2 (Petit et al., 1999; Retallack, 2001; Royer, 2006). Central to these discussions are records across the Eocene, as this epoch spans the last major change from a “greenhouse” world to an “icehouse” world. The Eocene pCO 2 record remains incomplete and debated (Kürschner et al., 2001; Royer et al., 2001; Beerling et al., 2002; Greenwood et al., 2003; Royer, 2003). Most pCO 2 reconstructions have focused on the Cretaceous–Tertiary and Paleocene–Eocene boundaries (65–50 Ma) and the middle Eocene. In particu- lar, there are few reconstructions for the late middle Eocene (Pagani et al., 2005; Maxbauer et al., 2014). In addition, the pCO 2 reconstruction results have varied based on different proxies. Various methods having been used in pCO 2 recon- struction mainly include the computer modeling methods: GEOCARB-I, GEOCARB-II, GEOCARB-III, GEOCARB- SULF and the proxies: ice cores, paleosol carbonate, phyto- plankton, nahcolite, Boron, and stomata parameters. The abundance of stomatal cells can be measured on mod- ern leaves and well-preserved fossil leaves. Various plants show a negative correlation between atmospheric CO 2 con- centration and stomatal density (SD), stomatal index (SI), or both. As such, these parameters have been determined in fossil leaves to reconstruct past pCO 2 ; examples in- clude Ginkgo (Retallack, 2001, 2009a; Beerling et al., 2002; Royer, 2003; Kürschner et al., 2008; Smith et al., 2010), Metasequoia (Royer, 2003; Doria et al., 2011), Taxodium (Stults et al., 2011), Betula (Kürschner et al., 2001; Sun et al., 2012), Neolitsea (Greenwood et al., 2003), and Quer- Published by Copernicus Publications on behalf of the European Geosciences Union.
Transcript of pCO2 based on stomatal density of modern and fossil Nageia … · 2016-02-10 · Estimates of late...
Clim. Past, 12, 241–253, 2016
www.clim-past.net/12/241/2016/
doi:10.5194/cp-12-241-2016
© Author(s) 2016. CC Attribution 3.0 License.
Estimates of late middle Eocene pCO2 based on stomatal
density of modern and fossil Nageia leaves
X. Y. Liu, Q. Gao, M. Han, and J. H. Jin
State Key Laboratory of Biocontrol and Guangdong Provincial Key Laboratory of Plant Resources, School of Life Sciences,
Sun Yat-sen University, Guangzhou 510275, China
Correspondence to: J. H. Jin ([email protected])
Received: 31 May 2015 – Published in Clim. Past Discuss.: 1 July 2015
Revised: 5 January 2016 – Accepted: 8 January 2016 – Published: 10 February 2016
Abstract. Atmospheric pCO2 concentrations have been es-
timated for intervals of the Eocene using various models and
proxy information. Here we reconstruct late middle Eocene
(42.0–38.5 Ma) pCO2 based on the fossil leaves of Nageia
maomingensis Jin et Liu collected from the Maoming Basin,
Guangdong Province, China. We first determine relation-
ships between atmospheric pCO2 concentrations, stomatal
density (SD) and stomatal index (SI) using “modern” leaves
of N. motleyi (Parl.) De Laub, the nearest living species
to the Eocene fossils. This work indicates that the SD in-
versely responds to pCO2, while SI has almost no relation-
ship with pCO2. Eocene pCO2 concentrations can be recon-
structed based on a regression approach and the stomatal ra-
tio method by using the SD. The first approach gives a pCO2
of 351.9± 6.6 ppmv, whereas the one based on stomatal ra-
tio gives a pCO2 of 537.5± 56.5 ppmv. Here, we explored
the potential of N. maomingensis in pCO2 reconstruction
and obtained different results according to different meth-
ods, providing a new insight for the reconstruction of paleo-
climate and paleoenvironment in conifers.
1 Introduction
The Eocene (55.8–33.9 Ma) generally was much warmer
than present-day, although temperatures varied significantly
across this time interval (Zachos et al., 2008). Climate of the
early Eocene was extremely warm, particularly during the
early Eocene Climatic Optimum (EECO; 51–53 Ma), and the
Paleocene-Eocene Thermal Maximum (PETM; ∼ 55.9 Ma).
However, global climatic conditions cooled significantly
by the middle to late Eocene (40–36 Ma). Indeed, small,
ephemeral ice-sheets and Arctic sea ice likely existed during
the latest Eocene (Moran et al., 2006; Zachos et al., 2008).
Many authors have suggested that changes in temperature
during the Phanerozoic were linked to atmospheric pCO2
(Petit et al., 1999; Retallack, 2001; Royer, 2006). Central
to these discussions are records across the Eocene, as this
epoch spans the last major change from a “greenhouse”
world to an “icehouse” world. The Eocene pCO2 record
remains incomplete and debated (Kürschner et al., 2001;
Royer et al., 2001; Beerling et al., 2002; Greenwood et
al., 2003; Royer, 2003). Most pCO2 reconstructions have
focused on the Cretaceous–Tertiary and Paleocene–Eocene
boundaries (65–50 Ma) and the middle Eocene. In particu-
lar, there are few reconstructions for the late middle Eocene
(Pagani et al., 2005; Maxbauer et al., 2014). In addition, the
pCO2 reconstruction results have varied based on different
proxies. Various methods having been used in pCO2 recon-
struction mainly include the computer modeling methods:
GEOCARB-I, GEOCARB-II, GEOCARB-III, GEOCARB-
SULF and the proxies: ice cores, paleosol carbonate, phyto-
plankton, nahcolite, Boron, and stomata parameters.
The abundance of stomatal cells can be measured on mod-
ern leaves and well-preserved fossil leaves. Various plants
show a negative correlation between atmospheric CO2 con-
centration and stomatal density (SD), stomatal index (SI),
or both. As such, these parameters have been determined
in fossil leaves to reconstruct past pCO2; examples in-
clude Ginkgo (Retallack, 2001, 2009a; Beerling et al., 2002;
Royer, 2003; Kürschner et al., 2008; Smith et al., 2010),
Metasequoia (Royer, 2003; Doria et al., 2011), Taxodium
(Stults et al., 2011), Betula (Kürschner et al., 2001; Sun et
al., 2012), Neolitsea (Greenwood et al., 2003), and Quer-
Published by Copernicus Publications on behalf of the European Geosciences Union.
242 X. Y. Liu et al.: Late middle Eocene pCO2 based on the Nageia leaves
cus (Kürschner et al., 1996, 2001), Laurus and Ocotea
(Kürschner et al., 2008). Recently, positive correlations be-
tween stomatal index or stomatal frequency and pCO2 have
been reported based on fossil Typha and Quercus (Bai et
al., 2015; Hu et al., 2015). However, the tropical and sub-
tropical moist broadleaf forest conifer tree Nageia has not
been used previously in paleobotanical estimates of pCO2
concentration.
Herein, we firstly document correlations between stom-
atal properties and atmospheric CO2 concentrations using
leaves of the extant species Nageia motleyi (Parl.) De Laub.
that were collected over the last 2 centuries. This provides a
training data set for application to fossil representatives of
Nageia. We secondly measure stomatal parameters on fossil
Nageia leaves from late middle Eocene of South China to es-
timate past CO2 levels. The work provides further insights
for discussing Eocene climate change.
2 Background
2.1 Stomatal proxy in pCO2 research
Stomatal information gathered from careful examination of
leaves has been widely used for reconstructions of past pCO2
concentrations (Beerling and Kelly, 1997; Doria et al., 2011).
The three main parameters are stomatal density (SD), which
is expressed as the total number of stomata divided by area,
epidermal density (ED), which is expressed as the total num-
ber of epidermal cells per area, and the stomatal index (SI),
which is defined as the percentage of stomata among the total
number of cells within an area [SI= SD× 100/(SD+ED)].
Woodward (1987) considered that both SD and SI had in-
verse relationships with atmospheric CO2 during the devel-
opment of the leaves. Subsequently, McElwain (1998) cre-
ated the stomatal ratio (SR) method to reconstruct pCO2. SR
is a ratio of the stomatal density or index of a fossil [SD(f) or
SI(f)] to that of corresponding nearest living equivalent [SD(e)
or SI(e)], expressed as follows:
SR= SI(e)/SI(f). (1)
The stomatal ratio method is a semi-quantitative method of
reconstructing pCO2 concentrations under certain standard-
izations. An example is the “Carboniferous standardization”
(Chaloner and McElwain, 1997), where one stomatal ratio
unit equals two RCO2 units:
SR= 2RCO2 (2)
and the value of RCO2 is the pCO2 level divided by the pre-
industrial atmospheric level (PIL) of 300 ppm (McElwain,
1998) or that of the year when the nearest living equivalent
(NLE) was collected (Berner, 1994; McElwain, 1998):
RCO2 = C(f)/300 or RCO2 = C(f)/C(e). (3)
The estimated pCO2 level can then be expressed as follows:
C(f) = 0.5×C(e)×SD(e)/SD(f) or
C(f) = 0.5×C(e)×SI(e)/SI(f), (4)
where C(f) is the pCO2 represented by the fossil leaf, and
C(e) is the atmospheric CO2 of the year when the leaf of the
NLE species was collected (McElwain and Chaloner, 1995,
1996; McElwain 1998). The equation adapts to the pCO2
concentration prior to Cenozoic.
Another standardization, the “Recent standardization”
(McElwain, 1998), is expressed as one stomatal ratio unit be-
ing equal to one RCO2 unit:
SR= 1RCO2. (5)
According to the equations stated above, the pCO2 concen-
tration can be expressed as
C(f) = Ce×SD(e)/SD(f) or C(f) = Ce×SI(e)/SI(f). (6)
This standardization is usually used for reconstruction based
on Cenozoic fossils (Chaloner and McElwain, 1997; McEl-
wain, 1998; Beerling and Royer, 2002).
Kouwenberg et al. (2003) proposed some special stom-
atal quantification methods for conifer leaves with stomata
arranged in rows. The stomatal number per length (SNL) is
expressed as the number of abaxial stomata plus the num-
ber of adaxial stomata divided by leaf length in millimeters.
Stomatal rows (SRO) are expressed as the number of stom-
atal rows in both stomatal bands. Stomatal density per length
(SDL) is expressed as the equation SDL= SD×SRO. True
stomatal density per length (TSDL) is expressed as the equa-
tion TSDL= SD × band width (in millimeters). The band
width on Nageia motleyi leaves was measured as leaf blade
width.
2.2 Review of extant and fossil Nageia
The genus Nageia, including seven living species, is a special
group of Podocarpaceae, a large family of conifers mainly
distributed in the Southern Hemisphere. Nageia has broadly
ovate-elliptic to oblong-lanceolate, multi-veined (without a
mid-vein), spirally arranged or in decussate, and opposite
or sub-opposite leaves (Cheng et al., 1978; Fu et al., 1999).
Generally, Nageia is divided into two sections, Nageia Sect.
Nageia and Nageia Sect. Dammaroideae (Mill 1999, 2001).
Both sections are mainly distributed in southeast Asia and
Australasia from north latitude 30◦ to nearly the equator (Fu,
1992; Fig. 1). Four species of the N. section Nageia – Nageia
nagi (Thunberg) O. Kuntze, N. fleuryi (Hickel) De Laub.,
N. formosensis (Dummer) C. N. Page, and N. nankoensis
(Hayata) R. R. Mill – have hypostomatic leaves where stom-
ata only occur on the abaxial side. One species of this section
– N. maxima (De Laub.) De Laub. – is characterized by am-
phistomatic leaves, but where only a few stomata are found
Clim. Past, 12, 241–253, 2016 www.clim-past.net/12/241/2016/
X. Y. Liu et al.: Late middle Eocene pCO2 based on the Nageia leaves 243
Figure 1. Map showing the distribution of extant and fossil
Nageia and their mean annual temperature (modified after the
map from http://nelson.wisc.edu/sage/data-and-models/atlas/maps/
avganntemp/atl_avganntemp.jpg).
on the adaxial side (Hill and Pole, 1992; Sun, 2008). Both
N. wallichiana (Presl) O. Kuntze and N. motleyi of the N. sec-
tion Dammaroideae are amphistomatic with abundant stom-
ata distributed on both sides of the leaf. This is especially
true for N. motleyi, which has approximately equal stomata
numbers on both surfaces (Hill and Pole, 1992; Sun, 2008).
The fossil record of Nageia can be traced back to the Cre-
taceous. Krassilov (1965) described Podocarpus (Nageia)
sujfunensis Krassilov from the Lower Cretaceous of Far
East Russia. Kimura et al. (1988) reported Podocarpus
(Nageia) ryosekiensis Kimura, Ohanaet Mimoto, an ultimate
leafy branch bearing a seed, from the Early Barremian in
southwestern Japan. In China, a Cretaceous petrified wood,
Podocarpus (Nageia) nagi Pilger, was discovered from the
Dabie Mountains in central Henan, China (Yang et al., 1990).
Jin et al. (2010) reported an upper Eocene Nageia leaf
named N. hainanensis Jin, Qiu, Zhu et Kodrul from the
Changchang Basin of Hainan Island, South China. Recently,
Liu et al. (2015) found another leaf species N. maomingen-
sis Jin et Liu from upper middle Eocene of Maoming Basin,
South China. Although some of the Nageia fossil materi-
als described in the above studies (Krassilov, 1965; Jin et
al., 2010; Liu et al., 2015) have well-preserved cuticles, these
studies are mainly concentrated on morphology, systematics,
and phytogeography.
Here we try to reconstruct the pCO2 concentration based
on stomatal data of Nageia maomingensis Jin et Liu. Among
the modern Nageia species mentioned above, N. motleyi was
considered as the NLE species of N. maomingensis (Liu et
al., 2015). However, because of the species-specific inverse
relationship between atmospheric CO2 partial pressure and
SD (Woodward and Bazzaz, 1988), it is necessary to explore
whether the SD and SI of N. motleyi show negative correla-
tions with the CO2 concentration before applying the stom-
atal method. Both N. maomingensis and N. motleyi are am-
phistomatic, suggesting that both upper and lower surfaces of
leaves might be used to estimate the pCO2 concentrations.
3 Material and methods
3.1 Extant leaf preparation
We examined 12 specimens of extant Nageia motleyi from
different herbaria (Table 1). We removed one or two leaves
from each specimen, and took three fragments (0.25 mm2)
from every leaf (Fig. 2a) and numbered them for analysis.
The numbered fragments were boiled for 5–10 min in wa-
ter. Subsequently, after being macerated in a mixed solu-
tion of 10 % acetic acid and 10 % H2O2 (1 : 1) and heated
in the thermostatic water bath at 85 ◦C for 8.5 h, the reac-
tion was stopped when the specimen fragments turned white
and semitransparent. The cuticles were then rinsed with dis-
tilled water until the pH of the water became neutral. After,
the cuticles were treated in Schulze’s solution (one part of
potassium chlorate saturated solution and three part of con-
centrated nitric acid) for 30 min, rinsed in water, and then
treated with 8 % KOH (up to 30 min). The abaxial and adax-
ial cuticles were separated with a hair mounted on needle. Fi-
nally, the cuticles were stained with 1 % Safranin T alcoholic
solution for 5 min, sealed with Neutral Balsam and observed
under LM.
3.2 Fossil leaf preparation
Maoming Basin (21◦42′33.2′′ N, 110◦53′19.4′′ E) is located
in southwestern Guangdong, South China including Creta-
ceous and Tertiary strata. Tertiary strata are fluvial and la-
custrine sedimentary units, divided into the Gaopengling,
Laohuling, Shangcun, Huangniuling and Youganwo forma-
tions in descending order, aged from late Eocene to early
Oligocene (Wang et al., 1994).
Four fossil leaves of Nageia maomingensis were recovered
from the Youganwo (MMJ1-001) and Huangniuling (MMJ2-
003, MMJ2-004 and MMJ3-003) formations of Maoming
Basin, South China. Further information on the sections
is provided by Liu et al. (2015). Importantly, the forma-
tions span a depositional age of approximately 42.0–38.5 Ma
which was considered as late Eocene by Wang et al. (1994),
www.clim-past.net/12/241/2016/ Clim. Past, 12, 241–253, 2016
244 X. Y. Liu et al.: Late middle Eocene pCO2 based on the Nageia leaves
Table 1. Modern Nageia motleyi (Parl.) De Laub. samples and atmospheric CO2 values of their collection dates from ice core data (Brown,
2010).
Herbarium Collection number Collecting locality Collectors Number of leaf Collection date CO2 (ppmv)
samples
LE No. 2649 Malaysia O. Beccari, 1 1868 289.23
A/GH No. bb. 17229 150 m, Riau on Ond. Karimon Neth. Ind. For. Service 2 1932 306.19
A/GH No. bb. 18328 5 m, Z. O. afd. v. Borneo Tidoengsche Landen Neth. Ind. For. Service 2 1934 306.46
A/GH No. bb. 21151 500 m, Z. O. afd. Borneo, Poeroek Tjahoe Tahoedjan Neth. Ind. For. Service 2 1936 306.76
KEP No. 30887 Kata Tinggi, Johor, Malaysia E. J. H. Corner 1 1936 306.76
KEP No. 57329 Batang Padang, Perak, Malaysia Unkonwn 2 1947 309.82
KEP No. 57330 Batang Padang, Perak, Malaysia Unkonwn 2 1947 309.82
KEP No. 55897 Batang Padang, Perak, Malaysia Unkonwn 2 1947 309.82
KEP No. 61064 Batang Padang, Perak, Malaysia Syed Woh 2 1947 309.82
E No. bb. 40798 51 m, Kuala Trengganu-Besut Road, Bukit Bintang Block,
Gunong Tebu Forest reserve, Malaysia J. Sinclair and K. bin Salleh 2 1955 313.73
KEP No. 80548 Gombak, Selangor, Malaysia Rahim 1 1965 320.04
KEP No. 33343 Jelebu, Negeri Sembilan, Malaysia S. K. Yap 2 1987 348.98
Note: A/GH: Harvard University Herbarium, Harvard University, 22 Divinity Avenue, Cambridge, Massachusetts 02138, USA (www.huh.harvard.edu).
E: The Herbarium of Royal Botanic Garden, Edinburgh EH3 5LR, Scotland, UK (www.rbge.org.uk).
LE: The Herbarium of the V. L. Komarov Botanical Institute of the Russian Academy of Sciences, Prof. Popov Street 2, Saint Petersburg 197376, Russia (www.binran.ru).
KEP: Kepong Herbarium, Forest Research Institute Malaysia, 52109 Kepong, Selangor, Malaysia (http://www.frim.gov.my/).
Figure 2. Sampling areas and counting rules are shown. (a) Nageia
motleyi (Parl.) De Laub. leaf. Black squares in the middle of the leaf
show the sampling areas for preparing the cuticles. (b) The abax-
ial side of the cuticle from N. motleyi leaf. Black circles show the
counted stomatal complexes. (c) N. maomingensis Jin et Liu. Red
squares in the middle of the leaf indicate the sampling areas. (d) The
abaxial side of the fossil cuticle. Red circles show the counted stom-
atal complexes. Scale bars: (a) and (c)= 1 cm; (b) and (d)= 50 µm.
but it can be recognized as late middle Eocene according to
Walker and Geissman (2009).
Macrofossil cuticular fragments were taken from the mid-
dle part of each fossil leaf (Fig. 2c) and directly treated
with Schulze’s solution for approximately 1 h and 5–10%
KOH for 30 min (Ye, 1981). The cuticles were observed and
photographed under a Carl Zeiss Axio Scope A1 light mi-
croscope (LM). All fossil specimens and cuticle slides are
housed in the Museum of Biology of Sun Yat-sen University,
Guangzhou, China.
3.3 Stomatal counting strategy and calculation methods
The basic stomatal parameters, SD, ED, and SI were counted
based on analyzing pictures taken with a light microscope
(LM). A total of 2816 pictures (200× magnification of Zeiss
LM) of cuticles from 21 leaves of N. motleyi were counted.
Each counting field was 0.366 mm2. We used a standard sam-
pling protocol (Poole and Kürschner, 1999), counting all full
stomata in the image plus stomata straddling the left and top
margins, as presented in Fig. 2b and d.
The SNL, SRO, SDL, and TSDL were also determined
based on LM images. A total of 2293 pictures (200× magni-
fication of Zeiss LM) of the cuticles from 21 leaves of N. mot-
leyi were counted. Each counting field was 0.366 mm2. None
of the aforementioned counting areas overlapped and they
were larger than the minimum area (0.03 mm2) for statistics
(Poole and Kürschner, 1999). In this study, the stomatal data
of both surfaces are applied in pCO2 reconstruction because
both the fossil and NLE species are amphistomatic.
4 Results
4.1 Correlations between the CO2 concentrations and
stomatal parameters of Nageia motleyi
The SD and SI data of the adaxial sides of N. motleyi
leaves are presented in Table 2. The SDs and SIs average
62.28 mm−2 and 3.30 %, respectively. However, the SDs and
SIs data of the abaxial sides, summarized in Table 3, give
higher average values (70.03 mm−2 in SDs and 3.90 % in
SIs) than those from the adaxial sides. The combined SD and
Clim. Past, 12, 241–253, 2016 www.clim-past.net/12/241/2016/
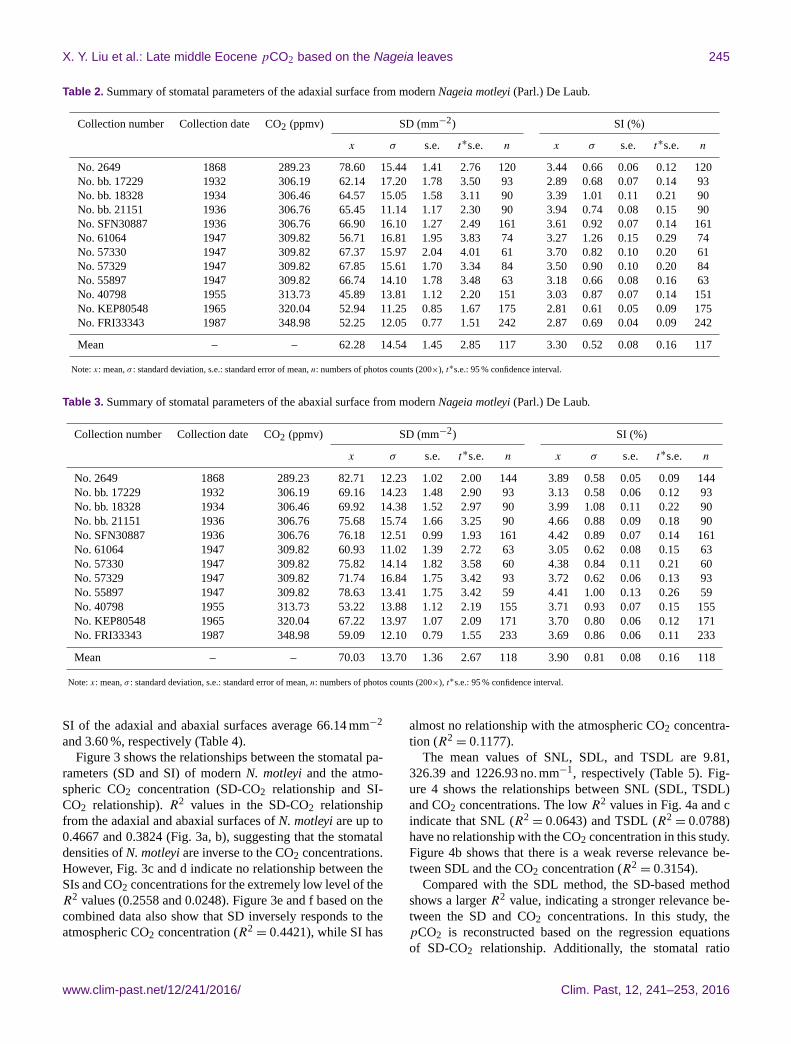
X. Y. Liu et al.: Late middle Eocene pCO2 based on the Nageia leaves 245
Table 2. Summary of stomatal parameters of the adaxial surface from modern Nageia motleyi (Parl.) De Laub.
Collection number Collection date CO2 (ppmv) SD (mm−2) SI (%)
x σ s.e. t∗s.e. n x σ s.e. t∗s.e. n
No. 2649 1868 289.23 78.60 15.44 1.41 2.76 120 3.44 0.66 0.06 0.12 120
No. bb. 17229 1932 306.19 62.14 17.20 1.78 3.50 93 2.89 0.68 0.07 0.14 93
No. bb. 18328 1934 306.46 64.57 15.05 1.58 3.11 90 3.39 1.01 0.11 0.21 90
No. bb. 21151 1936 306.76 65.45 11.14 1.17 2.30 90 3.94 0.74 0.08 0.15 90
No. SFN30887 1936 306.76 66.90 16.10 1.27 2.49 161 3.61 0.92 0.07 0.14 161
No. 61064 1947 309.82 56.71 16.81 1.95 3.83 74 3.27 1.26 0.15 0.29 74
No. 57330 1947 309.82 67.37 15.97 2.04 4.01 61 3.70 0.82 0.10 0.20 61
No. 57329 1947 309.82 67.85 15.61 1.70 3.34 84 3.50 0.90 0.10 0.20 84
No. 55897 1947 309.82 66.74 14.10 1.78 3.48 63 3.18 0.66 0.08 0.16 63
No. 40798 1955 313.73 45.89 13.81 1.12 2.20 151 3.03 0.87 0.07 0.14 151
No. KEP80548 1965 320.04 52.94 11.25 0.85 1.67 175 2.81 0.61 0.05 0.09 175
No. FRI33343 1987 348.98 52.25 12.05 0.77 1.51 242 2.87 0.69 0.04 0.09 242
Mean – – 62.28 14.54 1.45 2.85 117 3.30 0.52 0.08 0.16 117
Note: x: mean, σ : standard deviation, s.e.: standard error of mean, n: numbers of photos counts (200×), t∗s.e.: 95 % confidence interval.
Table 3. Summary of stomatal parameters of the abaxial surface from modern Nageia motleyi (Parl.) De Laub.
Collection number Collection date CO2 (ppmv) SD (mm−2) SI (%)
x σ s.e. t∗s.e. n x σ s.e. t∗s.e. n
No. 2649 1868 289.23 82.71 12.23 1.02 2.00 144 3.89 0.58 0.05 0.09 144
No. bb. 17229 1932 306.19 69.16 14.23 1.48 2.90 93 3.13 0.58 0.06 0.12 93
No. bb. 18328 1934 306.46 69.92 14.38 1.52 2.97 90 3.99 1.08 0.11 0.22 90
No. bb. 21151 1936 306.76 75.68 15.74 1.66 3.25 90 4.66 0.88 0.09 0.18 90
No. SFN30887 1936 306.76 76.18 12.51 0.99 1.93 161 4.42 0.89 0.07 0.14 161
No. 61064 1947 309.82 60.93 11.02 1.39 2.72 63 3.05 0.62 0.08 0.15 63
No. 57330 1947 309.82 75.82 14.14 1.82 3.58 60 4.38 0.84 0.11 0.21 60
No. 57329 1947 309.82 71.74 16.84 1.75 3.42 93 3.72 0.62 0.06 0.13 93
No. 55897 1947 309.82 78.63 13.41 1.75 3.42 59 4.41 1.00 0.13 0.26 59
No. 40798 1955 313.73 53.22 13.88 1.12 2.19 155 3.71 0.93 0.07 0.15 155
No. KEP80548 1965 320.04 67.22 13.97 1.07 2.09 171 3.70 0.80 0.06 0.12 171
No. FRI33343 1987 348.98 59.09 12.10 0.79 1.55 233 3.69 0.86 0.06 0.11 233
Mean – – 70.03 13.70 1.36 2.67 118 3.90 0.81 0.08 0.16 118
Note: x: mean, σ : standard deviation, s.e.: standard error of mean, n: numbers of photos counts (200×), t∗s.e.: 95 % confidence interval.
SI of the adaxial and abaxial surfaces average 66.14 mm−2
and 3.60 %, respectively (Table 4).
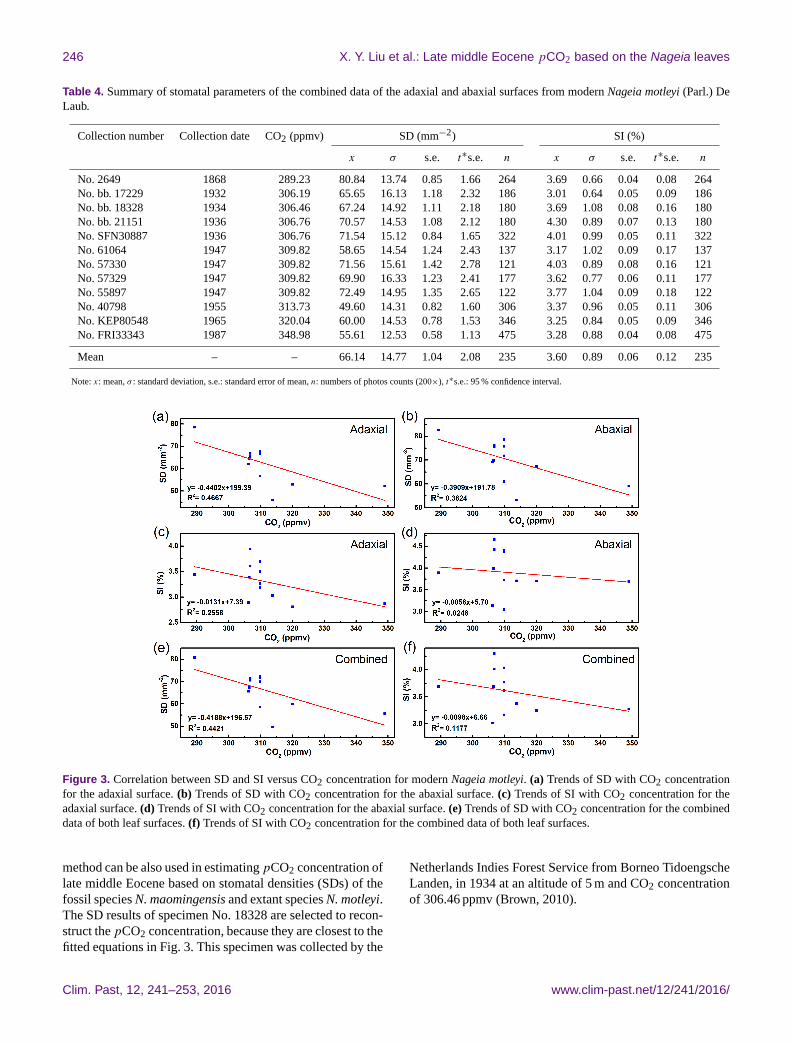
Figure 3 shows the relationships between the stomatal pa-
rameters (SD and SI) of modern N. motleyi and the atmo-
spheric CO2 concentration (SD-CO2 relationship and SI-
CO2 relationship). R2 values in the SD-CO2 relationship
from the adaxial and abaxial surfaces of N. motleyi are up to
0.4667 and 0.3824 (Fig. 3a, b), suggesting that the stomatal
densities of N. motleyi are inverse to the CO2 concentrations.
However, Fig. 3c and d indicate no relationship between the
SIs and CO2 concentrations for the extremely low level of the
R2 values (0.2558 and 0.0248). Figure 3e and f based on the
combined data also show that SD inversely responds to the
atmospheric CO2 concentration (R2= 0.4421), while SI has
almost no relationship with the atmospheric CO2 concentra-
tion (R2= 0.1177).
The mean values of SNL, SDL, and TSDL are 9.81,
326.39 and 1226.93 no.mm−1, respectively (Table 5). Fig-
ure 4 shows the relationships between SNL (SDL, TSDL)
and CO2 concentrations. The low R2 values in Fig. 4a and c
indicate that SNL (R2= 0.0643) and TSDL (R2
= 0.0788)
have no relationship with the CO2 concentration in this study.
Figure 4b shows that there is a weak reverse relevance be-
tween SDL and the CO2 concentration (R2= 0.3154).
Compared with the SDL method, the SD-based method
shows a larger R2 value, indicating a stronger relevance be-
tween the SD and CO2 concentrations. In this study, the
pCO2 is reconstructed based on the regression equations
of SD-CO2 relationship. Additionally, the stomatal ratio
www.clim-past.net/12/241/2016/ Clim. Past, 12, 241–253, 2016
246 X. Y. Liu et al.: Late middle Eocene pCO2 based on the Nageia leaves
Table 4. Summary of stomatal parameters of the combined data of the adaxial and abaxial surfaces from modern Nageia motleyi (Parl.) De
Laub.
Collection number Collection date CO2 (ppmv) SD (mm−2) SI (%)
x σ s.e. t∗s.e. n x σ s.e. t∗s.e. n
No. 2649 1868 289.23 80.84 13.74 0.85 1.66 264 3.69 0.66 0.04 0.08 264
No. bb. 17229 1932 306.19 65.65 16.13 1.18 2.32 186 3.01 0.64 0.05 0.09 186
No. bb. 18328 1934 306.46 67.24 14.92 1.11 2.18 180 3.69 1.08 0.08 0.16 180
No. bb. 21151 1936 306.76 70.57 14.53 1.08 2.12 180 4.30 0.89 0.07 0.13 180
No. SFN30887 1936 306.76 71.54 15.12 0.84 1.65 322 4.01 0.99 0.05 0.11 322
No. 61064 1947 309.82 58.65 14.54 1.24 2.43 137 3.17 1.02 0.09 0.17 137
No. 57330 1947 309.82 71.56 15.61 1.42 2.78 121 4.03 0.89 0.08 0.16 121
No. 57329 1947 309.82 69.90 16.33 1.23 2.41 177 3.62 0.77 0.06 0.11 177
No. 55897 1947 309.82 72.49 14.95 1.35 2.65 122 3.77 1.04 0.09 0.18 122
No. 40798 1955 313.73 49.60 14.31 0.82 1.60 306 3.37 0.96 0.05 0.11 306
No. KEP80548 1965 320.04 60.00 14.53 0.78 1.53 346 3.25 0.84 0.05 0.09 346
No. FRI33343 1987 348.98 55.61 12.53 0.58 1.13 475 3.28 0.88 0.04 0.08 475
Mean – – 66.14 14.77 1.04 2.08 235 3.60 0.89 0.06 0.12 235
Note: x: mean, σ : standard deviation, s.e.: standard error of mean, n: numbers of photos counts (200×), t∗s.e.: 95 % confidence interval.
Figure 3. Correlation between SD and SI versus CO2 concentration for modern Nageia motleyi. (a) Trends of SD with CO2 concentration
for the adaxial surface. (b) Trends of SD with CO2 concentration for the abaxial surface. (c) Trends of SI with CO2 concentration for the
adaxial surface. (d) Trends of SI with CO2 concentration for the abaxial surface. (e) Trends of SD with CO2 concentration for the combined
data of both leaf surfaces. (f) Trends of SI with CO2 concentration for the combined data of both leaf surfaces.
method can be also used in estimating pCO2 concentration of
late middle Eocene based on stomatal densities (SDs) of the
fossil species N. maomingensis and extant species N. motleyi.
The SD results of specimen No. 18328 are selected to recon-
struct the pCO2 concentration, because they are closest to the
fitted equations in Fig. 3. This specimen was collected by the
Netherlands Indies Forest Service from Borneo Tidoengsche
Landen, in 1934 at an altitude of 5 m and CO2 concentration
of 306.46 ppmv (Brown, 2010).
Clim. Past, 12, 241–253, 2016 www.clim-past.net/12/241/2016/

X. Y. Liu et al.: Late middle Eocene pCO2 based on the Nageia leaves 247
Table 5. Summary of stomatal parameters from modern Nageia
motleyi (Parl.) De Laub. (Kouwenberg et al., 2003).
Collection Collection CO2 SNL SDL TSDL n
number date (ppmv)
No. 2649 1868 289.23 11.64 394.38 1455.10 264
No. bb. 17229 1932 306.19 9.19 337.98 1280.12 186
No. bb. 18328 1934 306.46 8.71 378.92 1277.63 180
No. bb. 21151 1936 306.76 9.62 376.93 1517.21 180
No. SFN30887 1936 306.76 10.55 325.08 735.38 240
No. 61064 1947 309.82 8.19 282.04 1200.66 133
No. 57330 1947 309.82 9.67 397.83 1397.33 119
No. 57329 1947 309.82 10.13 350.98 1672.50 176
No. 55897 1947 309.82 10.48 379.06 1486.13 122
No. 40798 1955 313.73 10.29 175.14 933.85 305
No. KEP80548 1965 320.04 9.36 266.16 585.72 263
No. FRI33343 1987 348.98 9.84 252.20 1181.51 125
Mean – – 9.81 326.39 1226.93 191
4.2 The pCO2 estimates results
4.2.1 The regression approach
The summary of stomatal parameters of the fossil Nageia and
reconstruction results are provided in Tables 6–8. The mean
SD and SI values of the adaxial surface are 44.5 mm−2 and
1.8 %, respectively (Table 6). The mean SD and SI values of
the abaxial surface are 48.9 mm−2 and 2.07 %, respectively
(Table 7).
Based on the regression approach, the pCO2 was recon-
structed as 351.9± 6.6 ppmv and 365.6± 7.7 ppmv accord-
ing to the SD of adaxial and abaxial sides. The combined
SD value is an average of 46.6 mm−2 (Table 8), giving the
reconstructed pCO2 of 358.1± 5.0 ppmv.
4.2.2 The stomatal ratio method
Mean SR value of the adaxial side (SR= 1.75± 0.18) is a
little larger than that of the abaxial side (SR= 1.62± 0.12)
in fossil Nageia leaves (Tables 6, 7). The pCO2 reconstruc-
tion results are 537.5± 56.5 ppmv (Table 6) and 496.1±
35.7 ppmv (Table 7) based on the adaxial and abaxial cuti-
cles, respectively. Based on the combined SD of both leaf
sides, the pCO2 result is 519.9± 35.0 ppmv.
The partial pressure of CO2decreases with elevation (Gale,
1972). Jones (1992) proposed that the relationship between
elevation and partial pressure in the lower atmosphere can
be expressed as P =−10.6E+ 100, where E is elevation in
kilometers and P is the percentage of partial pressure rel-
ative to sea level. Various studies corroborate that SI and
SD of many plants have positive correlations with altitude
(Körner and Cochrane, 1985; Woodward, 1986; Woodward
and Bazzaz, 1988; Beerling et al., 1992; Rundgren and Beer-
ling, 1999) while they are negatively related to the partial
pressure of CO2 (Woodward and Bazzaz, 1988). Therefore,
it is essential to take elevation calibration into account dur-
ing pCO2 concentration estimates. However, Royer (2003)
pointed out that it is unnecessary to provide this conversion
Figure 4. Correlation between SNL, SDL, and TSDL versus CO2
concentration for modern Nageia motleyi. (a) Trends of SNL with
CO2 concentration for the adaxial surface. (b) Trends of SDL with
CO2 concentration for the adaxial surface. (c) Trends of TSDL with
CO2 concentration for the adaxial surface.
when trees lived at < 250 m in elevation. In this paper, the
nearest living equivalent species, Nageia motleyi, grows at
5 m in elevation with P = 99.9, suggesting that CO2 concen-
tration estimates were only underestimated by 0.1 %. Conse-
quently, no correction is needed for the reconstruction result
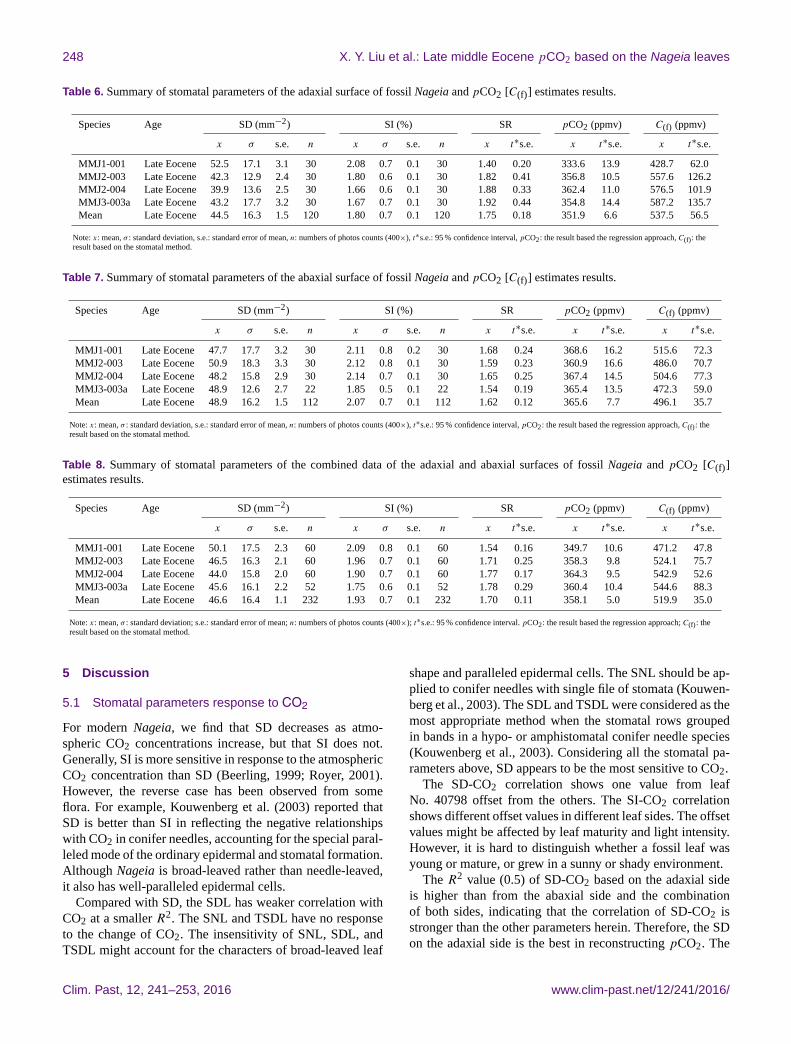
in this study. After being projected into a long-term carbon
cycle model (GEOCARB III; Berner and Kothavalá, 2001),
the results of this study compare well with CO2 concentra-
tions for corresponding age within their error ranges (Fig. 5).
www.clim-past.net/12/241/2016/ Clim. Past, 12, 241–253, 2016
248 X. Y. Liu et al.: Late middle Eocene pCO2 based on the Nageia leaves
Table 6. Summary of stomatal parameters of the adaxial surface of fossil Nageia and pCO2 [C(f)] estimates results.
Species Age SD (mm−2) SI (%) SR pCO2 (ppmv) C(f) (ppmv)
x σ s.e. n x σ s.e. n x t∗s.e. x t∗s.e. x t∗s.e.
MMJ1-001 Late Eocene 52.5 17.1 3.1 30 2.08 0.7 0.1 30 1.40 0.20 333.6 13.9 428.7 62.0
MMJ2-003 Late Eocene 42.3 12.9 2.4 30 1.80 0.6 0.1 30 1.82 0.41 356.8 10.5 557.6 126.2
MMJ2-004 Late Eocene 39.9 13.6 2.5 30 1.66 0.6 0.1 30 1.88 0.33 362.4 11.0 576.5 101.9
MMJ3-003a Late Eocene 43.2 17.7 3.2 30 1.67 0.7 0.1 30 1.92 0.44 354.8 14.4 587.2 135.7
Mean Late Eocene 44.5 16.3 1.5 120 1.80 0.7 0.1 120 1.75 0.18 351.9 6.6 537.5 56.5
Note: x: mean, σ : standard deviation, s.e.: standard error of mean, n: numbers of photos counts (400×), t∗s.e.: 95 % confidence interval, pCO2: the result based the regression approach, C(f): the
result based on the stomatal method.
Table 7. Summary of stomatal parameters of the abaxial surface of fossil Nageia and pCO2 [C(f)] estimates results.
Species Age SD (mm−2) SI (%) SR pCO2 (ppmv) C(f) (ppmv)
x σ s.e. n x σ s.e. n x t∗s.e. x t∗s.e. x t∗s.e.
MMJ1-001 Late Eocene 47.7 17.7 3.2 30 2.11 0.8 0.2 30 1.68 0.24 368.6 16.2 515.6 72.3
MMJ2-003 Late Eocene 50.9 18.3 3.3 30 2.12 0.8 0.1 30 1.59 0.23 360.9 16.6 486.0 70.7
MMJ2-004 Late Eocene 48.2 15.8 2.9 30 2.14 0.7 0.1 30 1.65 0.25 367.4 14.5 504.6 77.3
MMJ3-003a Late Eocene 48.9 12.6 2.7 22 1.85 0.5 0.1 22 1.54 0.19 365.4 13.5 472.3 59.0
Mean Late Eocene 48.9 16.2 1.5 112 2.07 0.7 0.1 112 1.62 0.12 365.6 7.7 496.1 35.7
Note: x: mean, σ : standard deviation, s.e.: standard error of mean, n: numbers of photos counts (400×), t∗s.e.: 95 % confidence interval, pCO2: the result based the regression approach, C(f): the
result based on the stomatal method.
Table 8. Summary of stomatal parameters of the combined data of the adaxial and abaxial surfaces of fossil Nageia and pCO2 [C(f)]
estimates results.
Species Age SD (mm−2) SI (%) SR pCO2 (ppmv) C(f) (ppmv)
x σ s.e. n x σ s.e. n x t∗s.e. x t∗s.e. x t∗s.e.
MMJ1-001 Late Eocene 50.1 17.5 2.3 60 2.09 0.8 0.1 60 1.54 0.16 349.7 10.6 471.2 47.8
MMJ2-003 Late Eocene 46.5 16.3 2.1 60 1.96 0.7 0.1 60 1.71 0.25 358.3 9.8 524.1 75.7
MMJ2-004 Late Eocene 44.0 15.8 2.0 60 1.90 0.7 0.1 60 1.77 0.17 364.3 9.5 542.9 52.6
MMJ3-003a Late Eocene 45.6 16.1 2.2 52 1.75 0.6 0.1 52 1.78 0.29 360.4 10.4 544.6 88.3
Mean Late Eocene 46.6 16.4 1.1 232 1.93 0.7 0.1 232 1.70 0.11 358.1 5.0 519.9 35.0
Note: x: mean, σ : standard deviation; s.e.: standard error of mean; n: numbers of photos counts (400×); t∗s.e.: 95 % confidence interval. pCO2: the result based the regression approach; C(f): the
result based on the stomatal method.
5 Discussion
5.1 Stomatal parameters response to CO2
For modern Nageia, we find that SD decreases as atmo-
spheric CO2 concentrations increase, but that SI does not.
Generally, SI is more sensitive in response to the atmospheric
CO2 concentration than SD (Beerling, 1999; Royer, 2001).
However, the reverse case has been observed from some
flora. For example, Kouwenberg et al. (2003) reported that
SD is better than SI in reflecting the negative relationships
with CO2 in conifer needles, accounting for the special paral-
leled mode of the ordinary epidermal and stomatal formation.
Although Nageia is broad-leaved rather than needle-leaved,
it also has well-paralleled epidermal cells.
Compared with SD, the SDL has weaker correlation with
CO2 at a smaller R2. The SNL and TSDL have no response
to the change of CO2. The insensitivity of SNL, SDL, and
TSDL might account for the characters of broad-leaved leaf
shape and paralleled epidermal cells. The SNL should be ap-
plied to conifer needles with single file of stomata (Kouwen-
berg et al., 2003). The SDL and TSDL were considered as the
most appropriate method when the stomatal rows grouped
in bands in a hypo- or amphistomatal conifer needle species
(Kouwenberg et al., 2003). Considering all the stomatal pa-
rameters above, SD appears to be the most sensitive to CO2.
The SD-CO2 correlation shows one value from leaf
No. 40798 offset from the others. The SI-CO2 correlation
shows different offset values in different leaf sides. The offset
values might be affected by leaf maturity and light intensity.
However, it is hard to distinguish whether a fossil leaf was
young or mature, or grew in a sunny or shady environment.
The R2 value (0.5) of SD-CO2 based on the adaxial side
is higher than from the abaxial side and the combination
of both sides, indicating that the correlation of SD-CO2 is
stronger than the other parameters herein. Therefore, the SD
on the adaxial side is the best in reconstructing pCO2. The
Clim. Past, 12, 241–253, 2016 www.clim-past.net/12/241/2016/
X. Y. Liu et al.: Late middle Eocene pCO2 based on the Nageia leaves 249
Figure 5. The pCO2 reconstruction results and extant CO2 con-
centrations are projected onto the long-term carbon cycle model
(GEOCARB III; Berner and Kothavalá, 2001). The pCO2 results
based on the regression approach and stomatal ratio method are rep-
resented by red and blue squares, respectively.
reconstruction result based on the regression approach is
351.9±6.6 ppmv lower than the one based on the stomatal ra-
tio method (Table 6), and it is relatively lower than the results
based on the other proxies (Fig. 6; Freeman and Hayes, 1992;
Pagani et al., 2005; Maxbauer et al., 2014). However, the re-
sult based on stomatal ratio method is 537.5± 56.5 ppmv,
which is fairly close to GEOCARB III predictions (Fig. 5)
and historical reconstruction trends (Fig. 6).
5.2 Paleoclimate reconstructed history
The pCO2 levels throughout the Cenozoic were generally
lower than during much of the Cretaceous, but probably
also decreased significantly from the early to late Eocene.
However, there is a wide range of estimates for the Eocene
(Koch et al., 1992; Sinha and Stott, 1994; Ekart et al., 1999;
Greenwood et al., 2003; Royer, 2003; Pagani et al., 2005;
Wing et al., 2005; Lowenstein and Demicco, 2006; Fletcher
et al., 2008; Zachos et al., 2008; Beerling et al., 2009; Bijl
et al., 2010; Smith et al., 2010; Doria et al., 2011; Kato et
al., 2011; Maxbauer et al., 2014).
Smith et al. (2010) reconstructed the value of the early
Eocene pCO2 ranging from 580± 40 to 780± 50 ppmv us-
ing the stomatal ratio method (recent standardization) based
on both SI and SD. A climatic optimum occurred in the mid-
dle Eocene (MECO): the reconstructed CO2 concentrations
are mainly between 700 and 1000 ppmv during the late mid-
dle Eocene climate transition (42–38 Ma) using stomatal in-
dices of fossil Metasequoia needles, but concentrations de-
clined to 450 ppmv toward the top of the investigated sec-
tion (Doria et al., 2011). Jacques et al. (2014) used CLAMP
Figure 6. Atmospheric CO2 estimates from proxies over the past
60 million years. The horizontal dashed line indicates monthly
atmospheric CO2 concentration for March 2015 at Mauna Loa,
Hawaii (401.5 ppmv) (Pieter and Keeling, 2015). The vertical lines
show the error bars. The data are from the supporting data of Beer-
ling and Royer (2011) and references in Table 9. The lower blue star
shows the reconstructed result based on the regression approach.
The higher one presents the result of stomatal ratio method.
Table 9. pCO2 estimates proxies and corresponding references.
Proxies References
Boron Pearson et al. (2009), Seki et al. (2010)
B /Ca Tripati et al. (2009)
Phytoplankton Freeman and Hayes (1992), Stott (1992),
Pagani et al. (1999, 2005),
Henderiks and Pagani (2008), Seki et al. (2010)
Nahcolite Lowenstein and Demicco (2006)
Liverworts Fletcher et al. (2008)
Paleosols Cerling (1992), Koch et al. (1992),
Ekart et al. (1999), Royer et al. (2001),
Nordt et al. (2002), Retallack (2009b),
Huang et al. (2013)
Stomata Van der Burgh et al. (1993),
Kürschner et al. (1996, 2001, 2008),
McElwain (1998), Royer et al. (2001, 2003),
Greenwood et al. (2003), Beerling et al. (2009),
Retallack (2009a), Smith et al. (2010),
Doria et al. (2011),
Roth-Nebelsick et al. (2012; 2014),
Grein et al. (2013), Maxbauer et al. (2014)
to calibrate climate change in Antarctica during the early-
middle Eocene, suggesting a seasonal alternation of high-
and low-pressure systems over Antarctica during the early-
middle Eocene. Spicer et al. (2014) also reconstructed a rel-
atively lower cool temperature than δ18O records (Keating-
www.clim-past.net/12/241/2016/ Clim. Past, 12, 241–253, 2016
250 X. Y. Liu et al.: Late middle Eocene pCO2 based on the Nageia leaves
Bitonti et al., 2011) in the middle Eocene of Hainan Island,
South China using CLAMP, indicating a not uniformly warm
climate in the low latitude during the Eocene. An overall de-
creasing trend of the pCO2 level was presented after the mid-
dle Eocene (Fig. 6; Retallack, 2009b). The ice-sheets started
to appear in the Antarctic during the Late Eocene (Zachos et
al., 2001), then the temperature suffered an apparent further
decrease from the late Eocene onwards (Fig. 6).
In conclusion, although various results were made by dif-
ferent pCO2 reconstruction proxies at the same time, their
entire decreasing tendency of pCO2 level is remarkably con-
sistent with each other since the Eocene (Fig. 6). Figure 6
shows that during the Eocene the temperature was higher
than at present. Comparing to the estimates of late middle
Eocene pCO2 by Doria et al. (2011), the present result of
351.9± 6.6 ppmv based on the regression approach shows
a remarkably lower pCO2 level, while the one based on the
stomatal ratio method of 537.5±56.5 ppmv is within the vari-
ation range of 500–1000 ppmv, which is closely consistent
with the pCO2 changes over the geological ages (Fig. 6).
The world was dynamic in the Paleogene, including in the
late middle Eocene, when the MECO occurred. Thus, the ex-
act age matters, and it is possible that the values may differ
because of slight offsets in time.
6 Conclusion
In this study, we reconstructed late middle Eocene pCO2
based on the fossil leaves of Nageia maomingensis Jin et
Liu from late middle Eocene of Maoming Basin, Guangdong
Province, China. Nageia is a special element in conifers by
its broad multi-veined leaf that lacks mid-vein. The stom-
atal data analysis suggests that only stomatal densities (SD)
from both sides of Nageia motleyi leaves have significant
negative correlations with the atmospheric CO2 concentra-
tion. The SD from the adaxial side gives the best correlation
to the CO2. Based on SDs, the pCO2 concentration is recon-
structed using both the regression approach and the stomatal
ratio method. The pCO2 result based on the regression ap-
proach is 351.9± 6.6 ppmv, showing a relatively lower CO2
level. The reconstructed result based on the stomatal ratio
method is 537.5± 56.5 ppmv, consistent with the variation
trends based on the other proxies. Here, we explored the po-
tential of N. maomingensis in pCO2 reconstruction and ob-
tained different results according to different methods, pro-
viding a new insight for the reconstruction of paleoclimate
and paleoenvironment in conifers.
Acknowledgements. This study was supported by the National
Natural Science Foundation of China (Grant Nos. 41210001,
41572011), the Fundamental Research Funds for the Central
Universities, and the Scientific Research Fund, Hongda Zhang,
Sun Yat-sen University. We greatly thank the Herbarium of the
V. L. Komarov Botanical Institute of the Russian Academy of
Sciences (LE) for the permission to examine and collect extant
Nageia specimens. We also express sincere gratitude to Sun Tongx-
ing (Yancheng Teachers University), David Boufford (Harvard
University) and Richard Chung Cheng Kong (Forest Research
Institute Malaysia) for providing extant N. motleyi leaves from
the herbarium of the Royal Botanic Garden at Edinburgh (E), the
Harvard University Herbaria (A/GH) and the herbarium of Forest
Research Institute Malaysia (KEP). We sincerely appreciate the
guidance of Chengqian Wang (Harbin Institute of Technology) on
preparing Figs. 3–6. We also offer sincere gratitude to Steven R.
Manchester and Terry Lott (Florida Museum of Natural History,
University of Florida) for suggestions and modification.
Edited by: G. Dickens
References
Bai, Y. J., Chen, L. Q., Ranhotra, S. P., Wang, Q., Wang, Y. F.,
and Li, C. S.: Reconstructing atmospheric CO2 during the Plio–
Pleistocene transition by fossil Typha, Glob. Change Biol., 21,
874–881, doi:10.1111/gcb.12670, 2015.
Beerling, D. J.: Stomatal density and index: theory and applica-
tion, in: Fossil Plants and Spores: Modern Techniques, edited
by: Jones, T. P. and Rowe, N. P., Geological Society, London,
251–256, 1999.
Beerling, D. J., and Kelly, C. K.: Stomatal density responses of
temperate woodland plants over the past seven decades of CO2
increase: A comparison of salisbury (1927) with contemporary
data, Am. J. Bot., 84, 1572–1583, 1997.
Beerling, D. J. and Royer, D. L.: Reading a CO2 signal from
fossil stomata, New Phytol., 153, 387–397, doi:10.1046/j.0028-
646X.2001.00335.x, 2002.
Beerling, D. J. and Royer, D. L.: Convergent Cenozoic CO2 history,
Nat. Geosci., 4, 418–420, doi:10.1038/ngeo1186, 2011.
Beerling, D. J., Chaloner, W. G., Huntley, B., Pearson, J. A., Tooley,
M. J., and Woodward, F. I.: Variations in the stomatal density of
Salix herbacea L. under the changing atmospheric CO2 concen-
trations of late- and post-glacial time, Philos. T. R. Soc. Lon. B,
336, 215–224, doi:10.1098/rstb.1992.0057, 1992.
Beerling, D. J., Lomax, B. H., Royer, D. L., Upchurch Jr., G. R.,
and Kump, L. R.: An atmospheric pCO2 reconstruction across
the Cretaceous-Tertiary boundary from leaf megafossils, P. Natl.
Acad. Sci. USA, 99, 7836–7840, doi:10.1073/pnas.122573099,
2002.
Beerling, D. J., Fox, A., and Anderson, C. W.: Quantitative uncer-
tainty analyses of ancient atmospheric CO2 estimates from fos-
sil leaves, Am. J. Sci., 309, 775–787, doi:10.2475/09.2009.01,
2009.
Berner, R. A.: GEOCARB II: A revised model of atmo-
spheric CO2 over Phanerozoic time, Am. J. Sci., 294, 56–91,
doi:10.2475/ajs.294.1.56, 1994.
Berner, R. A. and Kothavalá, Z.: GEOCARB III: A revised model
of atmospheric CO2 over Phanerozoic time, Am. J. Sci., 301,
182–204, doi:10.2475/ajs.301.2.182, 2001.
Bijl, P. K., Houben, A. J. P., Schouten, S., Bohaty, S. M., Sluijs,
A., Reichart, G., Sinninghe Damsté, J. S., and Brinkhuis, H.:
Transient middle Eocene atmospheric CO2 and temperature vari-
ations, Science, 330, 819–821, doi:10.1126/science.1193654,
2010.
Clim. Past, 12, 241–253, 2016 www.clim-past.net/12/241/2016/
X. Y. Liu et al.: Late middle Eocene pCO2 based on the Nageia leaves 251
Brown, L. R.: Atmospheric carbon dioxide concentration, 1000–
2009 (Supporting data), in: World on the Edge: How to Prevent
Environmental and Economic Collapse, Chapter 4 Data: Rising
Temperatures, Melting Ice, and Food Security, edited by: Brown,
L. R., Earth Policy Institute, Norton, W. W. and Company, New
York, London, available at: http://www.earth-policy.org/books/
wote/wote_data, last access: 25 January 2016, 2010.
Cerling, T. E.: Use of carbon isotopes in paleosols as an indicator
of the P(CO2) of the paleoatmosphere, Global Biogeochem. Cy.,
6, 307–314, doi:10.1029/92GB01102, 1992.
Chaloner, W. G. and McElwain, J. C.: The fossil plant record
and global climate change, Rev. Palaeobot. Palyno., 95, 73–82,
doi:10.1016/S0034-6667(96)00028-0, 1997.
Cheng, W. C., Fu, L. K., and Chao, C. S.: Podocarpus
(Podocarpaceae), in: Flora of China, edited by: Cheng, W. and
Fu, L., Science Press, Beijing, 7, 398–422, 1978 (in Chinese).
Doria, G., Royer, D. L., Wolfe, A. P., Fox, A., Westgate, J. A.,
and Beerling, D. J.: Declining atmospheric CO2 during the
late Middle Eocene climate transition, Am. J. Sci., 311, 63–75,
doi:10.2475/01.2011.03, 2011.
Ekart, D. D., Cerling, T. E., Montanez, I. P., and Tabor, N. J.: A 400
million year carbon isotope record of pedogenic carbonate: im-
plications for paleoatmospheric carbon dioxide, Am. J. Sci., 299,
805–827, doi:10.2475/ajs.299.10.805, 1999.
Fletcher, B. J., Brentnall, S. J., Anderson, C. W., Berner, R. A., and
Beerling, D. J.: Atmospheric carbon dioxide linked with Meso-
zoic and early Cenozoic climate change, Nat. Geosci., 1, 43–48,
doi:10.1038/ngeo.2007.29, 2008.
Freeman, K. H. and Hayes, J. M.: Fractionation of carbon isotopes
by phytoplankton and estimates of ancient CO2 levels, Global
Biogeochem. Cy., 6, 185–198, doi:10.1029/92GB00190, 1992.
Fu, D. Z.: Nageiaceae – a new gymnosperm family, Acta Phyto-
taxon. Sin., 30, 515–528, 1992 (in Chinese with English sum-
mary).
Fu, L. K., Li, Y., and Mill, R. R.: Podocarpaceae, in: Flora of China,
edited by: Wu, Z. Y. and Raven, P. H., Science Press, Beijing, 4,
78–84, 1999.
Gale, J.: Availability of carbon dioxide for photosynthesis at
high altitudes: theoretical considerations, Ecology, 53, 494–497,
doi:10.2307/1934239, 1972.
Greenwood, D. G., Scarr, M. J., and Christophel, D. C.:
Leaf stomatal frequency in the Australian tropical rain for-
est tree Neolitsea dealbata (Lauraceae) as a proxy measure
of atmospheric pCO2, Palaeogeogr. Palaeocl., 196, 375–393,
doi:10.1016/S0031-0182(03)00465-6, 2003.
Grein, M., Oehm, C., Konrad, W., Utescher, T., Kunzmann,
L., and Roth-Nebelsick, A.: Atmospheric CO2 from the late
Oligocene to early Miocene based on photosynthesis data and
fossil leaf characteristics, Palaeogeogr. Palaeocl., 374, 41–51,
doi:10.1016/j.palaeo.2012.12.025, 2013.
Henderiks, J. and Pagani, M.: Coccolithophore cell size and the Pa-
leogene decline in atmospheric CO2, Earth Planet. Sc. Lett., 269,
575–583, doi:10.1016/j.epsl.2008.03.016, 2008.
Hill, R. S. and Pole, M. S.: Leaf and shoot morphology of
extant Afrocarpus, Nageia and Retrophyllum (Podocarpaceae)
species, and species with similar leaf arrangement, from Ter-
tiary sediments in Australasia, Aust. Syst. Bot., 5, 337–358,
doi:10.1071/SB9920337, 1992.
Hu, J. J., Xing, Y. W., Turkington, R., Jacques, F. M. B. Su, T.,
Huang, Y. J., and Zhou, Z. K.: A new positive relationship be-
tween pCO2 and stomatal frequency in Quercus guyavifolia (Fa-
gaceae): a potential proxy for palaeo-CO2 levels, Ann. Bot.-
London, 115, 777–788, doi:10.1093/aob/mcv007, 2015.
Huang, C. M., Retallack, G. J., Wang, C. S., and Huang,
Q. H.: Paleoatmospheric pCO2 fluctuations across the
Cretaceous-Tertiary boundary recorded from paleosol car-
bonates in NE China, Palaeogeogr. Palaeocl., 385, 95–105,
doi:10.1016/j.palaeo.2013.01.005, 2013.
Jacques, F. M. B., Shi, G. L., Li, H. M., and Wang, W. M.:
An early-middle Eocene Antarctic summer monsoon: Evi-
dence of “fossil climates”, Gondwana Res., 25, 1422–1428,
doi:10.1016/j.gr.2012.08.007, 2014.
Jin, J. H., Qiu, J., Zhu, Y. A., and Kodrul, T. M.: First fossil record
of the genus Nageia (Podocarpaceae) in South China and its
phytogeographic implications, Plant Syst. Evol., 285, 159–163,
doi:10.1007/s00606-010-0267-4, 2010.
Jones, H. G.: Plants and Microclimate, Cambridge University Press,
Cambridge, UK, 1–428, 1992.
Kato, Y., Fujinaga, K., and Suzuki, K.: Marine Os isotopic fluctua-
tions in the early Eocene greenhouse interval as recorded by met-
alliferous umbers from a Tertiary ophiolite in Japan, Gondwana
Res., 20, 594–607, doi:10.1016/j.gr.2010.12.007, 2011.
Keating-Bitonti, C. R., Ivany, L. C., Affek, H. P., Douglas,
P., and Samson, S. D.: Warm, not super-hot, tempera-
tures in the early Eocene subtropics, Geology, 39, 771–774,
doi:10.1130/G32054.1, 2011.
Kimura, T., Ohana, T., and Mimoto, K.: Discovery of a podocarpa-
ceous plant from the Lower Cretaceous of Kochi Prefecture, in
the outer zone of southwest Japan, P. Jpn. Acad. B-Phys., 64,
213–216, doi:10.2183/pjab.64.213, 1988.
Koch, P. L., Zachos, J. C., and Gingerich, P. D.: Correlation be-
tween isotope records in marine and continental carbon reser-
voirs near the Palaeocene/Eocene boundary, Nature, 358, 319–
322, doi:10.1038/358319a0, 1992.
Kouwenberg, L. L. R., McElwain, J. C., Kürschner, W. M., Wagner,
F., Beerling, S. J., Mayle, F. E., and Visscher, H.: Stomatal fre-
quency adjustment of four conifer species to historical changes
in atmospheric CO2, Am. J. Bot., 90, 610–619, 2003.
Körner, Ch. and Cochrane, P. M.: Stomatal responses and water re-
lations of Eucalyptus pauciflora in summer along an elevational
gradient, Oecologia, 66, 443–455, doi:10.1007/BF00378313,
1985.
Krassilov, V. A.: New coniferales from Lower Cretaceous of Pri-
morye, Bot. J., 50, 1450–1455, 1965 (in Russian).
Kürschner, W. M., van der Burgh, J., Visscher, H., and Dilcher,
D. L.: Oak leaves as biosensors of late Neogene and early Pleis-
tocene paleoatmospheric CO2 concentrations, Mar. Micropale-
ontol., 27, 299–312, doi:10.1016/0377-8398(95)00067-4, 1996.
Kürschner, W. M., Wagner, F., Dilcher, D. L., and Visscher, H.:
Using fossil leaves for the reconstruction of Cenozoic paleoat-
mospheric CO2 concentrations, in: Geological Perspectives of
Global Climate Change, edited by: Gerhard, L. C., Harrison,
W. E., and Hanson, B. M., APPG Studies in Geology, 47, Tulsa,
169–189, 2001.
Kürschner, W. M., Kvacek, Z., and Dilcher, D. L.: The impact of
Miocene atmospheric carbon dioxide fluctuations on climate and
www.clim-past.net/12/241/2016/ Clim. Past, 12, 241–253, 2016
252 X. Y. Liu et al.: Late middle Eocene pCO2 based on the Nageia leaves
the evolution of terrestrial ecosystems, P. Natl. Acad. Sci. USA,
105, 449–453, doi:10.1073/pnas.0708588105, 2008.
Liu, X. Y., Gao, Q., and Jin, J. H.: late Eocene leaves of Nageia
Gaertner (section Dammaroideae Mill) from Maoming Basin,
South China and their implications on phytogeography, J. Syst.
Evol., 999, 1–11, doi:10.1111/jse.12133, 2015.
Lowenstein, T. K. and Demicco, R. V.: Elevated Eocene atmo-
spheric CO2 and its subsequent decline, Science, 313, 1928,
doi:10.1126/science.1129555, 2006.
Maxbauer, D. P., Royer, D. L., and LePage, B. A.: High Artic forests
during the middle Eocene supported by moderate levels of atmo-
spheric CO2, Geology, 42, 1027–1030, doi:10.1130/G36014.1,
2014.
McElwain, J. C.: Do fossil plants signal palaeoatmospheric carbon
dioxide concentration in the geological past?, Philos. T. R. Soc.
Lon. B, 353, 83–96, doi:10.1098/rstb.1998.0193, 1998.
McElwain, J. C. and Chaloner, W. G.: Stomatal density and index of
fossil plants track atmospheric carbon dioxide in the Palaeozoic,
Ann. Bot.-London, 76, 389–395, doi:10.1006/anbo.1995.1112,
1995.
McElwain, J. C. and Chaloner, W. G.: The fossil cuticle as a
skeletal record of environmental changes, Palaios, 11, 376–388,
doi:10.2307/3515247, 1996.
Mill, R. R.: A new combination in Nageia (Podocarpaceae), Novon,
9, 77–78, 1999.
Mill, R. R.: A new sectional combination in Nageia
Gaertn. (Podocarpaceae), Edinburgh J. Bot., 58, 499–501,
doi:10.1017/S0960428601000804, 2001.
Moran, K., Backman, J., Brinkhuis, H., Clemens, S. C., Cronin,
T., Dickens, G. R., Eynaud, F., Gattacceca, J., Jakobsson, M.,
Jordan, R. W., Kaminski, M., King, J., Koc, N., Krylov, A.,
Martinez, N., Matthiessen, J., McInroy, D., Moore, T. C., On-
odera, J., O’Regan, M., Pälike, H., Rea, B., Rio, D., Sakamoto,
T., Smith, D. C., Stein, R., St John, K., Suto, I., Suzuki, N.,
Takahashi, K., Watanabe, M., Yamamoto, M., Farrell, J., Frank,
M., Kubik, P., Jokat, W., and Kristoffersen, Y.: The Cenozoic
palaeoenvironment of the Arctic Ocean, Nature, 441, 601–605,
doi:10.1038/nature04800, 2006.
Nordt, L., Atchley, S., and Dworkin, S. I.: Paleosol barometer
indicates extreme fluctuations in atmospheric CO2 across
the Cretaceous-Tertiary boundary, Geology, 30, 703–706,
doi:10.1130/0091-7613(2002)030<0703:PBIEFI>2.0.CO;2,
2002.
Pagani, M., Arthur, M. A., and Freeman, K. H.: Miocene evolution
of atmospheric carbon dioxide, Paleoceanography, 14, 273–292,
doi:10.1029/1999PA900006, 1999.
Pagani, M., Zachos, J. C., Freeman, K. H., Tipple, B., and
Bohaty, S.: Marked decline in atmospheric carbon dioxide
concentrations during the Paleocene, Science, 309, 600–603,
doi:10.1126/science.1110063, 2005.
Pearson, P. N., Foster, G. L., and Wade, B. S.: Atmospheric car-
bon dioxide through the Eocene-Oligocene climate transition,
Nature, 461, 1110–1113, doi:10.1038/nature08447, 2009.
Petit, J. R., Jouzel, J., Raynaud, D., Barkov, N. I., Barnola, J.-
M., Basile, I., Bender, M., Chappellaz, J., Davis, M., Delaygue,
G., Delmotte, M., Kotlyakov, V. M., Legrand, M., Lipenkov,
V. Y., Lorius, C., PÉpin, L., Ritz, C., Saltzman, E., and Stieve-
nard, M.: Climate and atmospheric history of the past 420,000
years from the Vostokicecore, Antarctica, Nature, 399, 429–436,
doi:10.1038/20859, 1999.
Pieter, T. and Keeling, R.: Recent monthly average Mauna Loa
CO2, NOAA/ESRL, available at: www.esrl.noaa.gov/gmd/ccgg/
trends/ (last access: March 2015), 2015.
Poole, I. and Kürschner, W. M.: Stomatal density and index: the
practice, in: Fossil Plants and Spores: Modern Techniques, edited
by: Jones, T. P. and Rowe, N. P., Geological Society, London,
257–260, 1999.
Retallack, G. J.: A 300-million-year record of atmospheric car-
bon dioxide from fossil plant cuticles, Nature, 411, 287–290,
doi:10.1038/35077041, 2001.
Retallack, G. J.: Greenhouse crises of the past 300 million years,
Geol. Soc. Am. Bull., 121, 1441–1455, doi:10.1130/B26341.1,
2009a.
Retallack, G. J.: Refining a pedogenic-carbonate CO2 paleobarome-
ter to quantify a middle Miocene greenhouse spike, Palaeogeogr.
Palaeocl., 281, 57–65, doi:10.1016/j.palaeo.2009.07.011, 2009b.
Roth-Nebelsick, A., Grein, M., Utescher, T., and Konrad, W.: Stom-
atal pore length change in leaves of Eotrigonobalanus furcinervis
(Fagaceae) from the Late Eocene to the Latest Oligocene and its
impact on gas exchange and CO2 reconstruction, Rev. Palaeobot.
Palyno., 174, 106–112, doi:10.1016/j.revpalbo.2012.01.001,
2012.
Roth-Nebelsick, A., Oehm, C., Grein, M., Utescher, T., Kunzmann,
L., Friedrich, J.-P., and Konrad, W.: Stomatal density and index
data of Platanus neptuni leaf fossils and their evaluation as a
CO2 proxy for the Oligocene, Rev. Palaeobot. Palyno., 206, 1–9,
doi:10.1016/j.revpalbo.2014.03.001, 2014.
Royer, D. L.: Stomatal density and stomatal index as indicators of
paleoatmospheric CO2 concentration, Rev. Palaeobot. Palyno.,
114, 1–28, doi:10.1016/S0034-6667(00)00074-9, 2001.
Royer, D. L.: Estimating latest Cretaceous and Tertiary atmospheric
CO2 from stomatal indices, in: Causes and Consequences of
Globally Warm Climates in the early Paleocene, edited by: Wing,
S. L., Gingerich, P. D., Schmitz, B., and Thomas, E., Geological
Society of America Special Paper, 79–93, 2003.
Royer, D. L.: CO2-forced climate thresholds during the
Phanerozoic, Geochim. Cosmochim. Ac., 70, 5665–5675,
doi:10.1016/j.gca.2005.11.031, 2006.
Royer, D. L., Wing, S. L., Beerling, D. J., Jolley, D. W.,
Koch, P. L., Hickey, L. J., and Berner, R. A.: Paleob-
otanical evidence for near present-day levels of atmospheric
CO2 during part of the Tertiary, Science, 292, 2310–2313,
doi:10.1126/science.292.5525.2310, 2001.
Rundgren, M. and Beerling, D. J.: A Holocene CO2 record
from the stomatal index of subfossil Salix herbacea L.
leaves from northern Sweden, Holocene, 9, 509–513,
doi:10.1191/095968399677717287, 1999.
Seki, O, Foster, G. L., Schmidt, D. N., Mackensen, A., Kawa-
mura, K., and Pancost, R. D.: Alkenone and boron-based
Pliocene pCO2 records, Earth Planet. Sc. Lett., 292, 201–211,
doi:10.1016/j.epsl.2010.01.037, 2010.
Sinha, A. and Stott, L. D.: New atmospheric pCO2 estimates from
paleosols during the late Paleocene/early Eocene global warming
interval, Global Planet. Change, 9, 297–307, doi:10.1016/0921-
8181(94)00010-7, 1994,
Clim. Past, 12, 241–253, 2016 www.clim-past.net/12/241/2016/
X. Y. Liu et al.: Late middle Eocene pCO2 based on the Nageia leaves 253
Smith, R. Y., Greenwood, D. R., and Basinger, J. F.: Estimating
paleoatmospheric pCO2 during the early Eocene Climatic Opti-
mum from stomatal frequency of Ginkgo, Okanagan Highlands,
British Columbia, Canada, Palaeogeogr. Palaeocl., 293, 120–
131, doi:10.1016/j.palaeo.2010.05.006, 2010.
Spicer, A. R., Herman, A. B., Liao, W. B., Spicer, T. E. V.,
Kodrul, T. M., Yang, J., and Jin, J. H.: Cool tropics in
the middle Eocene: Evidence from the Changchang Flora,
Hainan Island, China, Palaeogeogr. Palaeocl., 412, 1–16,
doi:10.1016/j.palaeo.2014.07.011, 2014.
Stott, L. D.: Higher temperatures and lower oceanic pCO2: A cli-
mate enigma at the end of the Paleocene Epoch, Paleoceanogra-
phy, 7, 395–404, doi:10.1029/92PA01183, 1992.
Stults, D. Z., Wagner-Cremer, F., and Axsmith, B. J.: Atmo-
spheric paleo-CO2 estimates based on Taxodium distichum (Cu-
pressaceae) fossils from the Miocene and Pliocene of East-
ern North America, Palaeogeogr. Palaeocl., 309, 327–332,
doi:10.1016/j.palaeo.2011.06.017, 2011.
Sun, B. N., Ding, S. T., Wu, J. Y., Dong, C., Xie, S. P., and Lin, Z. C.:
Carbon isotope and stomatal data of late Pliocene Betulaceae
leaves from SW China: Implications for palaeoatmospheric
CO2-levels, Turk. J. Earth Sci., 21, 237–250, doi:10.3906/yer-
1003-42, 2012.
Sun, T. X.: Cuticle micromorphology of Nageia, J. Wuhan Bot.
Res., 26, 554–560, doi:10.3969/j.issn.2095-0837.2008.06.002,
2008 (in Chinese with English abstract).
Tripati, A. K., Roberts, C. D., and Eagle, R. A.: Coupling
of CO2 and ice sheet stability over major climate transi-
tions of the last 20 million years, Science, 326, 1394–1397,
doi:10.1126/science.1178296, 2009.
Van der Burgh, J., Visscher, H., Dilcher, D. L., and Kürschner,
W. M.: Paleoatmospheric signatures in Neogene fossil leaves,
Science, 260, 1788–1790, doi:10.1126/science.260.5115.1788,
1993.
Walker, J. D. and Geissman, J. W.: Geologic Time Scale, Geolog-
ical Society of America, doi:10.1130/2009.CTS004R2C, avail-
able at: http://www.geosociety.org/science/timescale/, last ac-
cess: 25 January 2016, 2009.
Wang, J. D., Li, H. M., and Zhu, Z. Y.: Magnetostratig-
raphy of Tertiary rocks from Maoming Basin, Guangdong
province, China, Chinese Journal of Geochemistry, 13, 165–175,
doi:10.1007/BF02838516, 1994.
Wing, S. L., Harrington, G. J., Smith, F. A., Bloch, J. I., Boyer,
D. M., and Freeman, K. H.: Transient floral change and rapid
global warming at the Paleocene-Eocene boundary, Science, 310,
993–996, doi:10.1126/science.1116913, 2005.
Woodward, F. I.: Ecophysiological studies on the shrub Vaccinium
myrtillus L. taken from a wide altitudinal range, Oecologia, 70,
580–586, doi:10.1007/BF00379908, 1986.
Woodward, F. I.: Stomatal numbers are sensitive to increases in CO2
concentration from pre-industrial levels, Nature, 327, 617–618,
doi:10.1038/327617a0, 1987.
Woodward, F. I. and Bazzaz, F. A.: The responses of stomatal
density to CO2 partial pressure, J. Exp. Bot., 39, 1771–1781,
doi:10.1093/jxb/39.12.1771, 1988.
Yang, J. J., Qi, G. F., and Xu, R. H.: Studies on fossil woods ex-
cavated from the Dabie mountains, Sci. Silvae Sinicae, 26, 379–
386, 1990 (in Chinese with English abstract).
Ye, M. N.: On the preparation methods of fossil cuticle, in: Selected
papers of the 12th Annual conference of the Palaeontological So-
ciety of China, edited by: Palaeontological Society of China, Sci-
ence Press, Beijing, 170–179, 1981 (in Chinese).
Zachos, J., Pagani, M., Sloan, L., Thomas, E., and Billups, K.:
Trends, rhythms, aberrations in global climate 65 Ma to present,
Science, 292, 686–693, doi:10.1126/science.1059412, 2001.
Zachos, J., Dickens, G. R., and Zeebe, R. E.: An early Cenozoic
perspective on greenhouse warming and carbon-cycle dynamics,
Nature, 451, 279–283, doi:10.1038/nature06588, 2008.
www.clim-past.net/12/241/2016/ Clim. Past, 12, 241–253, 2016


![[Cariel] Manual PCO2](https://static.fdocuments.net/doc/165x107/577ccd351a28ab9e788bca03/cariel-manual-pco2.jpg)


![Stomatal Defense a Decade Later1[OPEN] - Plant Physiology · Update on Stomatal Defense Stomatal Defense a Decade Later1[OPEN] Maeli Melotto*, Li Zhang, Paula R. Oblessuc, and Sheng](https://static.fdocuments.net/doc/165x107/5eddc0a3ad6a402d6668efaa/stomatal-defense-a-decade-later1open-plant-update-on-stomatal-defense-stomatal.jpg)
![Stomatal Biology of CAM Plants1[CC-BY] - Plant … on Stomatal Biology Stomatal Biology of CAM Plants1[CC-BY] Jamie Males* and Howard Griffiths Department of Plant Sciences, University](https://static.fdocuments.net/doc/165x107/5ae808d37f8b9a08778f24b1/stomatal-biology-of-cam-plants1cc-by-plant-on-stomatal-biology-stomatal.jpg)
