PChome Group Company Overview
24
1 PChome Group Company Overview
Transcript of PChome Group Company Overview

1
PChome Group Company Overview

2
• Established: July 1998
• Public listing: Jan 2005(stock symbol:8044-TT)
• Main business: e-commerce
• HQ location: Taipei, Taiwan
• Business location: Primary Taiwan
• Founder:
Company Profile
Hung Tze Jan
Chairman
Arthur Lee
CEO
3
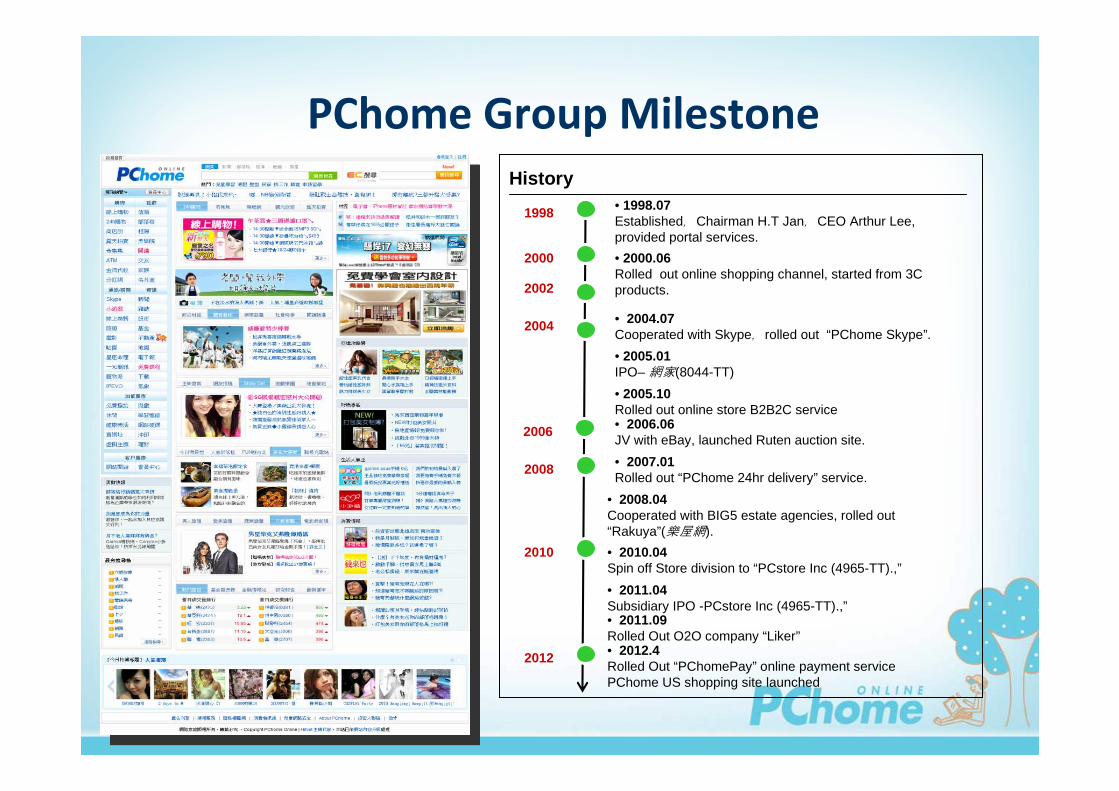
PChome Group Milestone
History• 1998.07Established,Chairman H.T Jan,CEO Arthur Lee, provided portal services.
• 2004.07Cooperated with Skype,rolled out “PChome Skype”.
• 2005.01IPO–網家(8044-TT)
1998
2000
2004
2008
2006 • 2006.06JV with eBay, launched Ruten auction site.
• 2008.04Cooperated with BIG5 estate agencies, rolled out “Rakuya”(樂屋網).
• 2000.06Rolled out online shopping channel, started from 3C products.
• 2005.10Rolled out online store B2B2C service
• 2007.01Rolled out “PChome 24hr delivery” service.
2010 • 2010.04Spin off Store division to “PCstore Inc (4965-TT).,”
2012
• 2011.04Subsidiary IPO -PCstore Inc (4965-TT).,”
2002
• 2011.09Rolled Out O2O company “Liker”• 2012.4Rolled Out “PChomePay” online payment servicePChome US shopping site launched

4
PChome Group Structure(2013 1Q)
PChome
Online
(8044-TT)
PChome US
90%
Ruten Auction65%
(PChome eBay JV Company)
PChome
Store
(4965-TT)
60%
LinkTel
100%
Rakuya
22%
PChome
Trading
(ShenZhen)
Ltd.
100%
IThome
Weekly
100%
20122012
E-commerce
Portal
Subsidiaries
O2OPayment
B2C Logistic C2C B2B2CSkype C2C
housingIT media
PChomePay
2012
30%
Liker
62.5%
41.5%
34.6%

5
3 Major E-commerce Platform
PChome
E-commerce
Layout
Professional seller/
Casual seller
SMEGeneral customerRevenue
Target
Subsidiary. holding 65%
Joint venture with eBay
Subsidiary.(4965-TT)
Holding 60%
Parent Company
(8044-TT)
Note
eBayRakutenAmazon.comGlobal
Icon
Seller →
Auction platform→ Buyer
Online Store →Marketplace
platform→
Consumer
Shopping site →Consumer
Business Model
C2C
Online Auction
B2B2C
Online Shopping Mall
B2C
Online Shopping
Type

6
2 New E-commerce Service
Transaction feeB2C:Coupon sales
C2C: Service commission
Revenue
Model
E-commerce
Layout
SME merchantB2C:General customer
C2C:SME merchant
Revenue
Target
PChome holds 62.5%
Ruten holds 30%
* Credit payment service will
open on 2013 Q1
PChome holds 34.6%
PCstore holds 41.5%
Note
PayPalGrouponGlobal
Icon
Buyer → Payment service →Seller
Physical store→O2O platform →Consumer→ Physical store
Business Model
Online Payment ServiceO2O
E-commerce
Type

7
Online Retailing
Business Highlight

8
‧‧‧‧Founded::::2000.6
‧‧‧‧http://shopping.pchome.com.tw
‧‧‧‧Service model: Non-inventory, Order
transfer
‧‧‧‧+ 1,000,000 products in wide selection
‧‧‧‧Coordinate with +5,000 suppliers
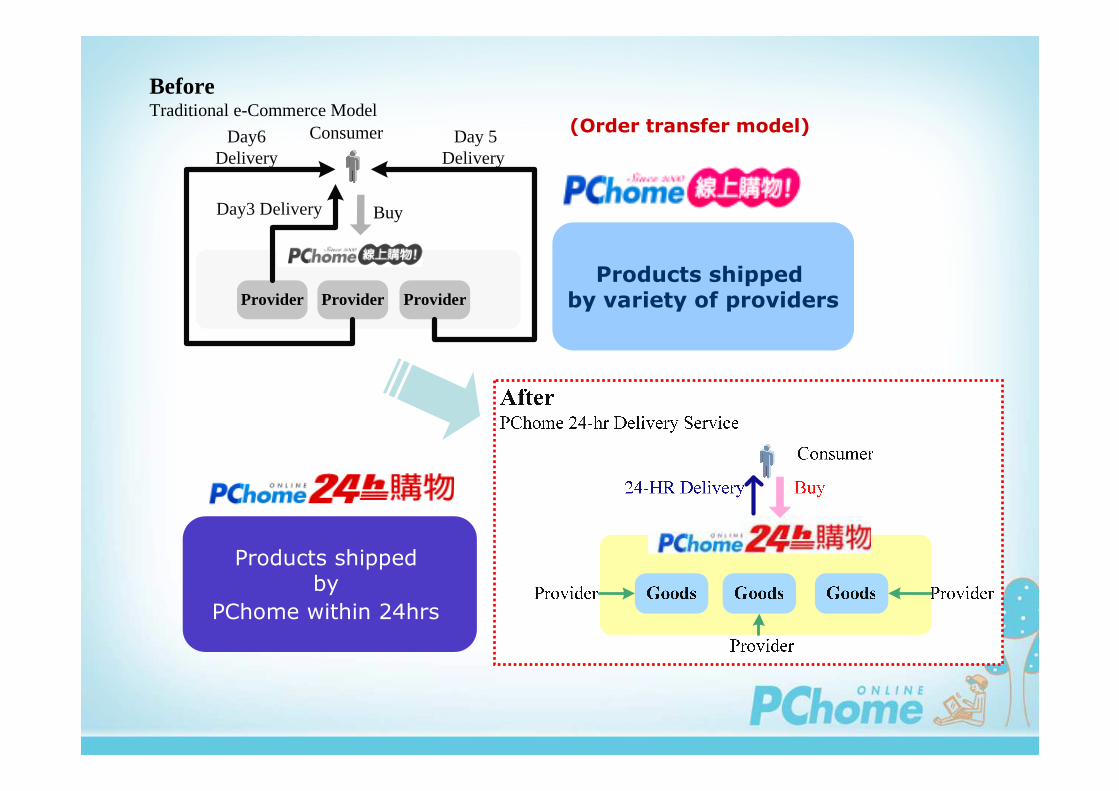
PChome Shopping ----Order Transfer Model

9
‧‧‧‧Launched::::2007.01
‧‧‧‧http://24h.pchome.com.tw
‧‧‧‧Service Model: Consignment in-stock central
warehouse
‧‧‧‧Items::::1,310,292 (’13.02)
‧‧‧‧On time rate::::99.67%
‧‧‧‧24 hrs delivery guarantee
PChome 24h Shopping
---- Consignment warehouse base
10
Provider Provider Provider
Buy
Day 5Delivery
Day3 Delivery
ConsumerDay6 Delivery
BeforeTraditional e-Commerce Model
Products shipped by
PChome within 24hrs
Products shipped by variety of providers
(Order transfer model)

11
PChome 24h Shopping On Time Delivered :99.67%
2
67
8
9
5
4
31
12
Marketplace Highlight
‧‧‧‧PChome Store
‧‧‧‧Ruten Auction

13
PCStore Inc.
‧‧‧‧IPO in Apr. 2011 (4965-TT)
‧‧‧‧Service launched:2005.10
‧‧‧‧http://www.pcstore.com.tw
‧‧‧‧# of Stores: 13,356 (’13,02)
‧‧‧‧# of items::::5,139,612 (’13,02)
‧‧‧‧HQ location: Taipei, Taiwan
‧‧‧‧Employee::::125

14
PCStore SME E-commerce Cloud
14
15
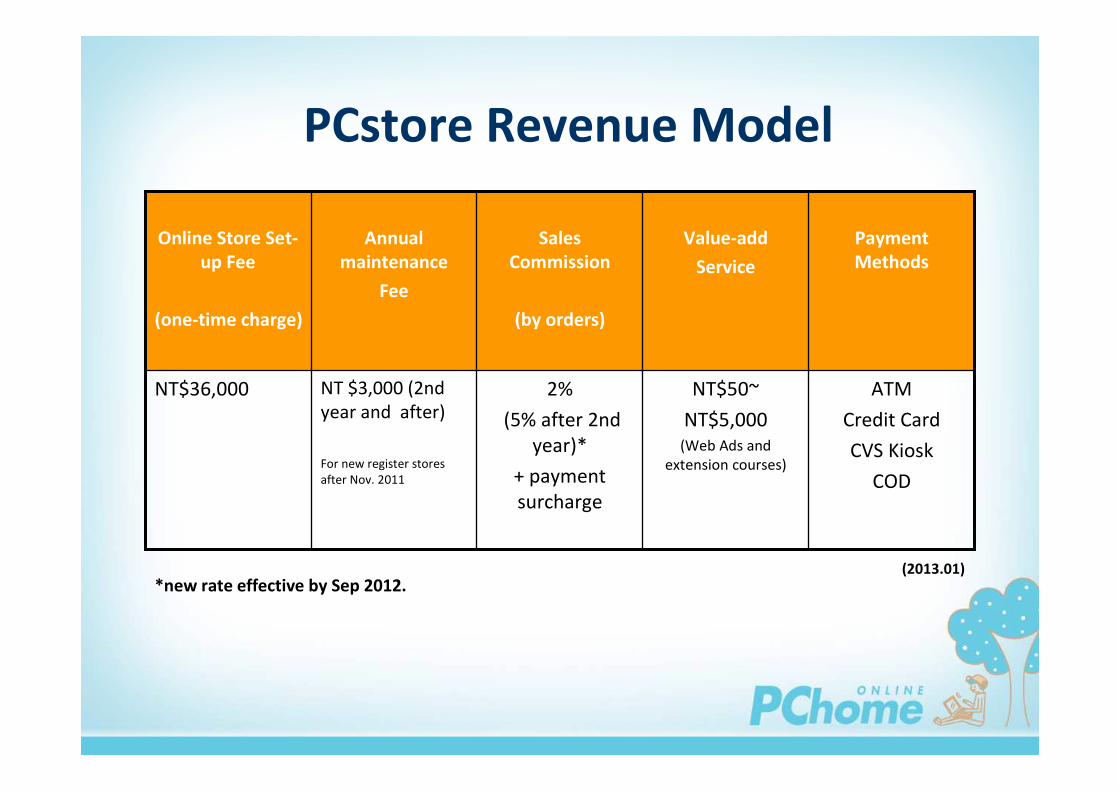
PCstore Revenue Model
NT$50~
NT$5,000(Web Ads and
extension courses)
Value-add
Service
ATM
Credit Card
CVS Kiosk
COD
2%
(5% after 2nd
year)*
+ payment
surcharge
NT $3,000 (2nd
year and after)
For new register stores
after Nov. 2011
NT$36,000
Payment
Methods
Sales
Commission
(by orders)
Annual
maintenance
Fee
Online Store Set-
up Fee
(one-time charge)
(2013.01)*new rate effective by Sep 2012.

16
# of Stores 2005 – YTD(Concurrent)
110
1,545
3,143
4,872
7,343
9,343
11,06
3
13,09
2
0
1000
2000
3000
4000
5000
6000
7000
8000
9000
10000
11000
12000
13000
14000
2005 2006 2007 2008 2009 2010 2011 2012# of Store

17
+ =
Ruten Auction
‧‧‧‧Established::::2006.09
‧‧‧‧ PChome holding 65%
‧‧‧‧# of Listing::::42,364,452(’13,02)
‧‧‧‧Business model: final value fee,
advertisement
‧‧‧‧Final value fee: 1.5% (Since ’09.11)
‧‧‧‧# of seller::::Over 700,000
‧‧‧‧# of web member: Over 6Mn

18
Subsidiary -
New Investment

19
New Investment Updates
2012.Mar.
2011.Sep
2012. Apr.
Service/
business
Launch
(2011.Q4)
(2011.Q2)
(2011. Q3)
Company
NTD $50Mn
USD $4MnOnline retailing /
USA
PChome:
NTD $ 50Mn
Ruten:
NTD $ 24Mn
Online escrow
payment /
Taiwan
PChome:
NTD $ 25Mn
PCStore:
NTD $ 30Mn
O2O Group buying
/
Taiwan
2012 1-3Q
Operating loss
Investment
Amount
Business/ Market

20
Financial Update

21
2012 Quarterly Income Statement
(Consolidated)
Consolidated
NTD :000 2012 1Q % 2012 2Q % 2012 3Q %
Revenue 3,795,600 100.0% 3,559,036 100.0% 3,811,110 100.0%
Gross Margin 659,258 17.4% 634,438 17.8% 673,663 17.7%
Operating Expense 527,612 13.9% 539,328 15.2% 570,721 15.0%
marketing Expense 419,325 11.0% 435,251 12.2% 467,971 12.3%
Aministration expense 78,428 2.1% 68,004 1.9% 68,269 1.8%
R&D expense 29,859 0.8% 36,073 1.0% 34,481 0.9%
Operating Income 131,646 3.5% 95,110 2.7% 102,942 2.7%
Net non-operating income 619 0.0% 8,415 0.2% 4,082 0.1%
Net income before tax 132,265 3.5% 103,525 2.9% 107,024 2.8%
Tax (19,006) (10,654) (14,534)
Net income after tax 113,259 3.0% 92,871 2.6% 92,490 2.4%

22
2012 vs 2011 1-3Q Income Statement(Consolidated)
Consolidated
NTD :000 2012 1-3Q % 2011 1-3Q % Variance
Revenue 11,165,746 100.0% 10,062,192 100.0% 11.0%
Gross Margin 1,967,359 17.6% 1,716,477 17.1% 14.6%
Operating Expense 1,637,661 14.7% 1,376,079 13.7% 19.0%
marketing Expense 1,322,547 11.8% 1,091,417 10.8% 21.2%
Aministration expense 214,701 1.9% 203,836 2.0% 5.3%
R&D expense 100,413 0.9% 80,826 0.8% 24.2%
Operating Income 329,698 3.0% 340,398 3.4% -3.1%
Net non-operating income 13,116 0.1% 13,775 0.1% -4.8%
Net income before tax 342,814 3.1% 354,173 3.5% -3.2%
Tax (44,194) -0.4% (43,368) -0.4% 1.9%
Net income after tax 298,620 2.7% 310,805 3.1% -3.9%
Opening cash balance 2,882,263 1,891,457
Closing cash balance 2,694,578 2,515,395
Shareholders of parent company 273,584 297,548
Minority Interest 25,036 13,257

23
2012 vs 2011 1-3Q Balance Sheet(Consolidated)
Consolidated Balance Sheet 2012 9.30 % 2011 9.30 %NTD:000Current Assets 3,642,111 91% 3,282,094 91%
Current Assets-Cash 2,694,578 67% 2,515,395 70%
Fund and Long Term Investments 82,317 2% 83,881 2%
Fixed Assets 219,355 5% 164,574 5%
Intangible Assets 552 0% 289 0%
Other Assets 57,480 1% 57,612 2%
Total Assets 4,001,815 100% 3,588,450 100%
Current Liabilities 2,266,574 57% 2,123,452 59%
Long Term Liabilities 0 0% 0 0%
Other Liabilities 0 0% 0 0%
Total Liabilities 2,266,574 57% 2,123,452 59%
Shareholders' EquityCapital Stock:Common Stock 821,308 21% 692,439 19%
Capital Surplus: 176,861 4% 132,872 4%
Retained Earnings: 364,701 9% 350,568 10%
Other Adjustments to Stockholders'
Equity (600) 0% 618 0%
Total Parent Company's
Shareholders' Equity 1,362,270 34% 1,176,497 33%
Minority Interest 372,971 9% 288,501 8%
Total Shareholders' Equity 1,735,241 43% 1,464,998 41%
Total Liabilities and Shareholders' 4,001,815 100% 3,588,450 100%

24
Thank you