PCensus Tutorial - Thunder Bay Public Library Tutorial 2017 • Demographic and statistical...
40
PCensus Tutorial 2017
-
Upload
truongkiet -
Category
Documents
-
view
217 -
download
0
Transcript of PCensus Tutorial - Thunder Bay Public Library Tutorial 2017 • Demographic and statistical...

PCensus Tutorial
2017
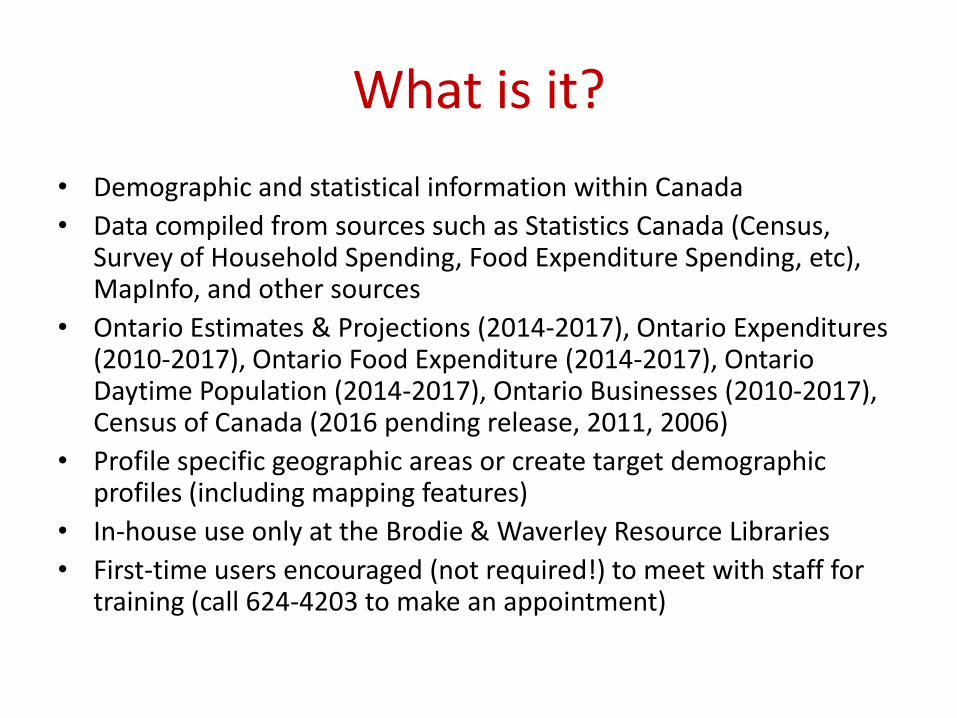
• Demographic and statistical information within Canada
• Data compiled from sources such as Statistics Canada (Census, Survey of Household Spending, Food Expenditure Spending, etc), MapInfo, and other sources
• Ontario Estimates & Projections (2014-2017), Ontario Expenditures (2010-2017), Ontario Food Expenditure (2014-2017), Ontario Daytime Population (2014-2017), Ontario Businesses (2010-2017), Census of Canada (2016 pending release, 2011, 2006)
• Profile specific geographic areas or create target demographic profiles (including mapping features)
• In-house use only at the Brodie & Waverley Resource Libraries
• First-time users encouraged (not required!) to meet with staff for training (call 624-4203 to make an appointment)
What is it?
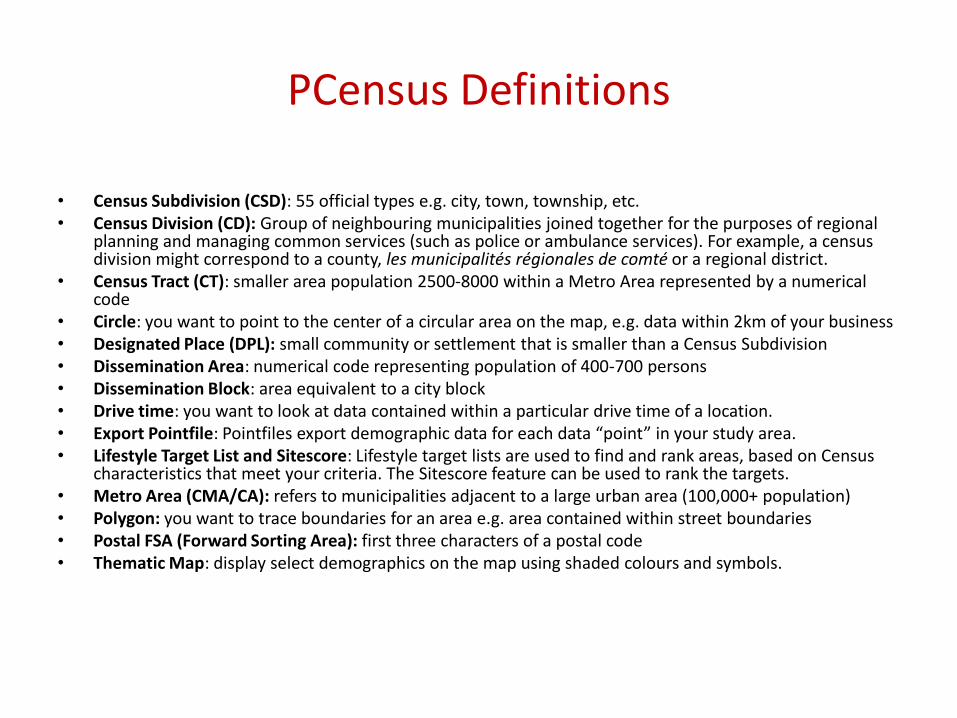
PCensus Definitions
• Census Subdivision (CSD): 55 official types e.g. city, town, township, etc. • Census Division (CD): Group of neighbouring municipalities joined together for the purposes of regional
planning and managing common services (such as police or ambulance services). For example, a census division might correspond to a county, les municipalités régionales de comté or a regional district.
• Census Tract (CT): smaller area population 2500-8000 within a Metro Area represented by a numerical code
• Circle: you want to point to the center of a circular area on the map, e.g. data within 2km of your business • Designated Place (DPL): small community or settlement that is smaller than a Census Subdivision • Dissemination Area: numerical code representing population of 400-700 persons • Dissemination Block: area equivalent to a city block • Drive time: you want to look at data contained within a particular drive time of a location. • Export Pointfile: Pointfiles export demographic data for each data “point” in your study area. • Lifestyle Target List and Sitescore: Lifestyle target lists are used to find and rank areas, based on Census
characteristics that meet your criteria. The Sitescore feature can be used to rank the targets. • Metro Area (CMA/CA): refers to municipalities adjacent to a large urban area (100,000+ population) • Polygon: you want to trace boundaries for an area e.g. area contained within street boundaries • Postal FSA (Forward Sorting Area): first three characters of a postal code • Thematic Map: display select demographics on the map using shaded colours and symbols.
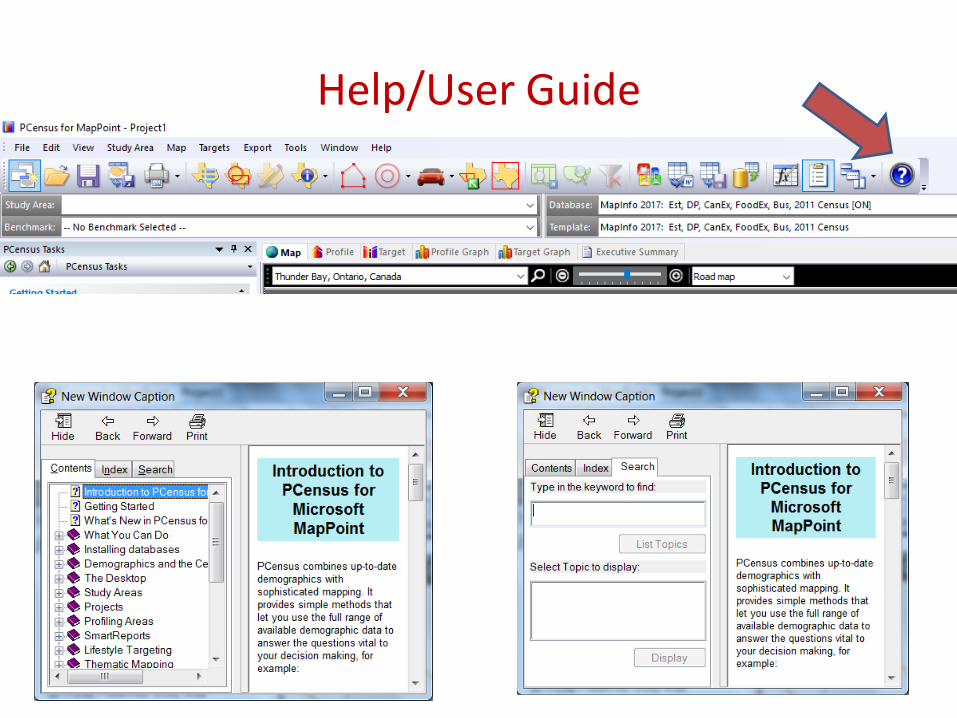
Help/User Guide
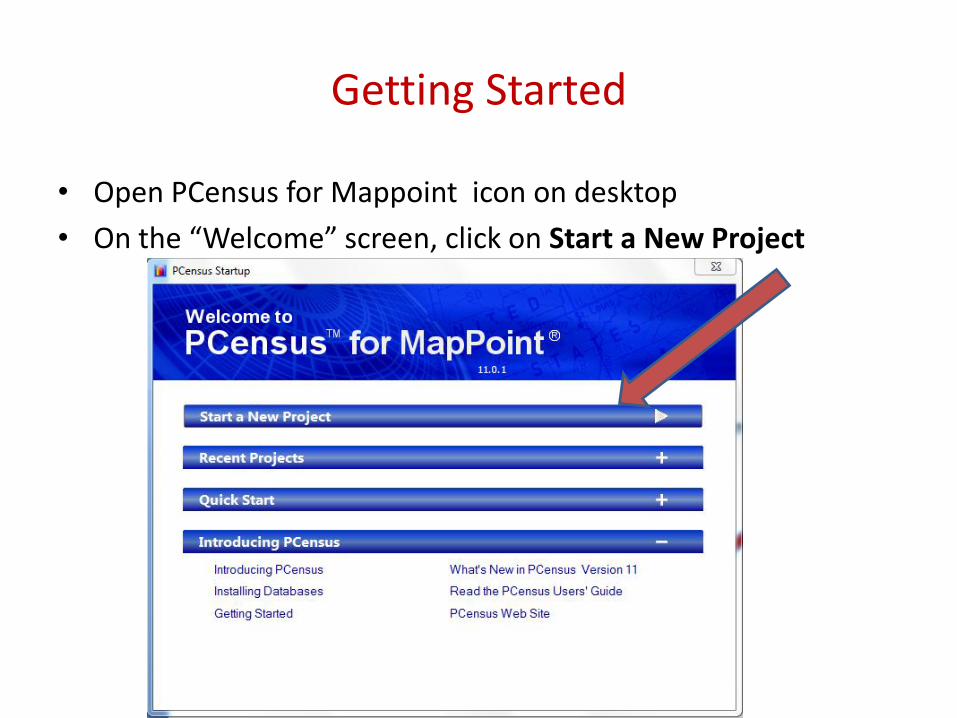
Getting Started
• Open PCensus for Mappoint icon on desktop
• On the “Welcome” screen, click on Start a New Project
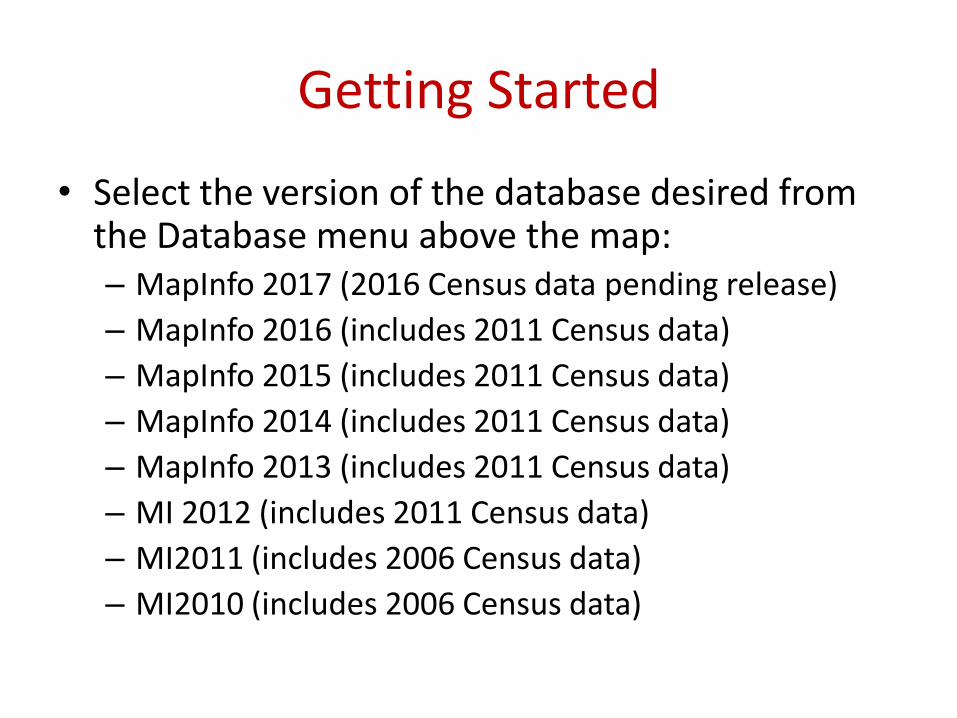
Getting Started
• Select the version of the database desired from the Database menu above the map: – MapInfo 2017 (2016 Census data pending release)
– MapInfo 2016 (includes 2011 Census data)
– MapInfo 2015 (includes 2011 Census data)
– MapInfo 2014 (includes 2011 Census data)
– MapInfo 2013 (includes 2011 Census data)
– MI 2012 (includes 2011 Census data)
– MI2011 (includes 2006 Census data)
– MI2010 (includes 2006 Census data)

Getting Started
• Select the type of report you would like to create from the PCensus Tasks menu on the left side of the map: – Predefined Study Area
(eg. City of Thunder Bay)
– Polygon Study Area
– Radius Study Area
– Drive Time Study Area
– Target or Site Score List
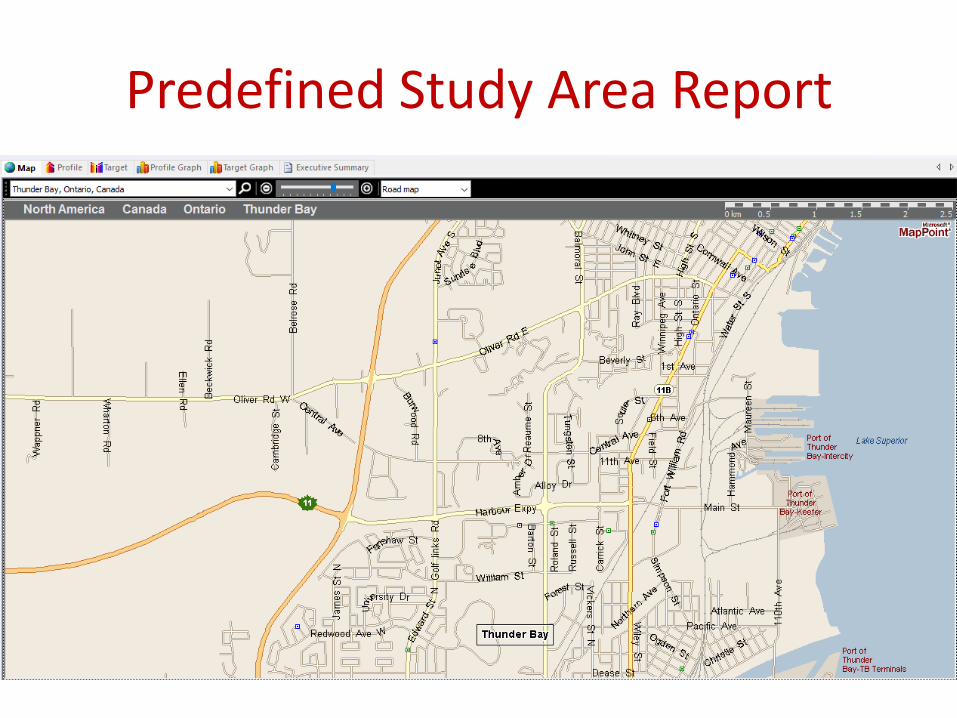
Predefined Study Area Report

Predefined Study Area Report
• Select profile predefined study area

Predefined Study Area
• Select Create a predefined study area

Predefined Study Area
• Select desired “Geographies” level
• Search & choose one or more Area from the “Area List”
• Move Area(s) into “Selection Builder” using the right facing arrow
• Click OK
Tip: Thunder Bay (City) is found under Census Subdivision

Predefined Study Area
• Data displayed in Profile Tab – To view other categories, click on grey Category Bar at the bottom left
of the screen
Category Bar
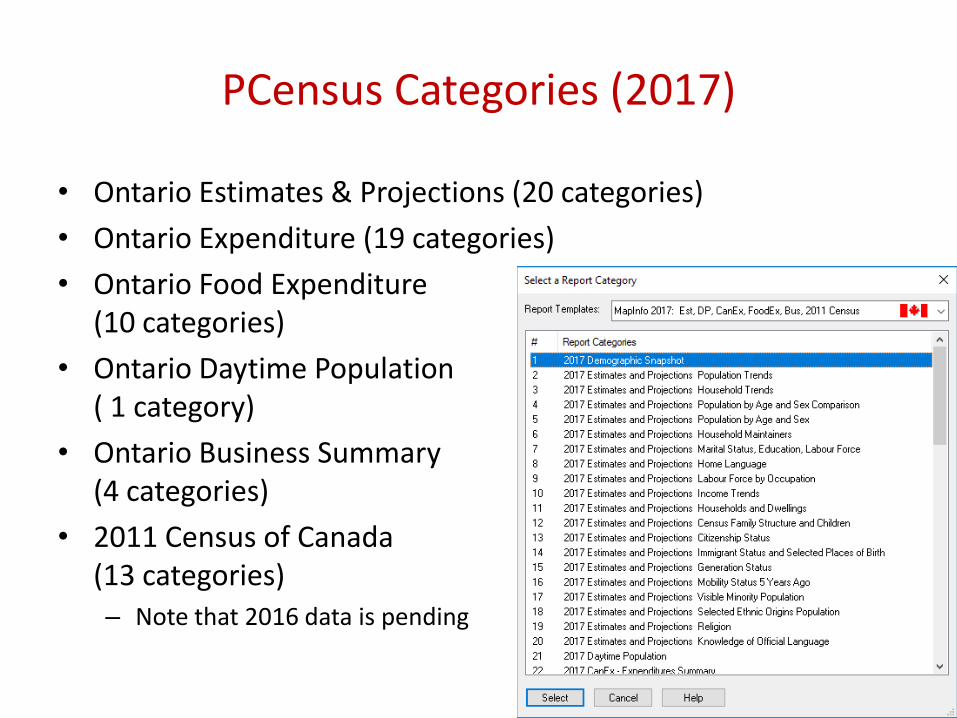
PCensus Categories (2017)
• Ontario Estimates & Projections (20 categories)
• Ontario Expenditure (19 categories)
• Ontario Food Expenditure (10 categories)
• Ontario Daytime Population ( 1 category)
• Ontario Business Summary (4 categories)
• 2011 Census of Canada (13 categories) – Note that 2016 data is pending
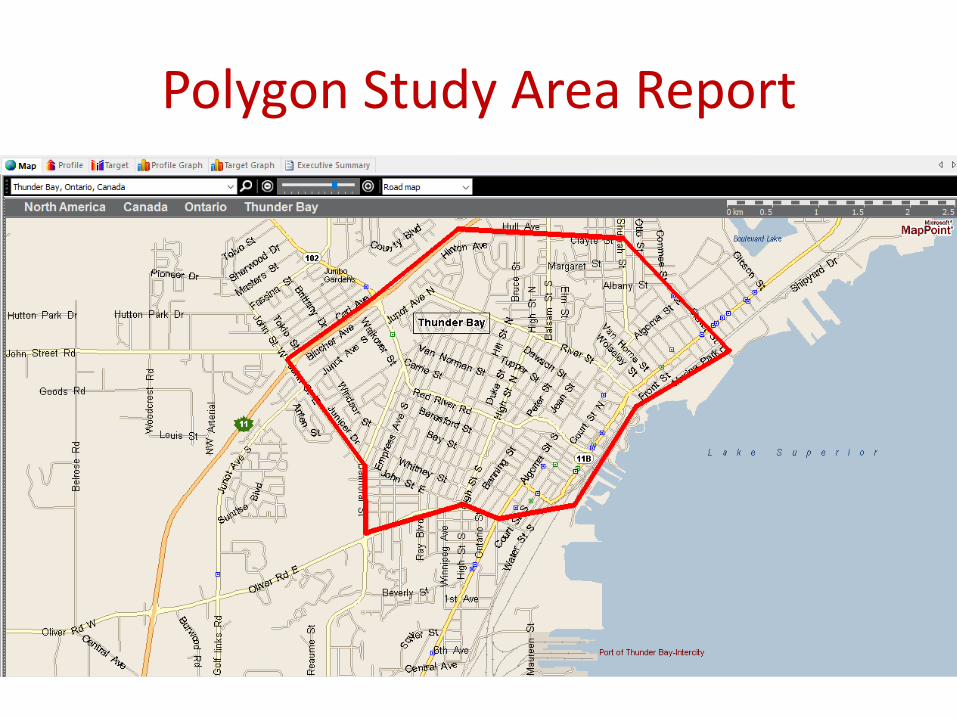
Polygon Study Area Report

Polygon Study Area
• Select Profile polygon study area from the PCensus Tasks menu

Polygon Study Area
• Choose default settings for polygon search (e.g. Dissemination Block, etc)

Polygon Study Area
• Indicate if you would like to “trace polygon on map” or “create from current map view”
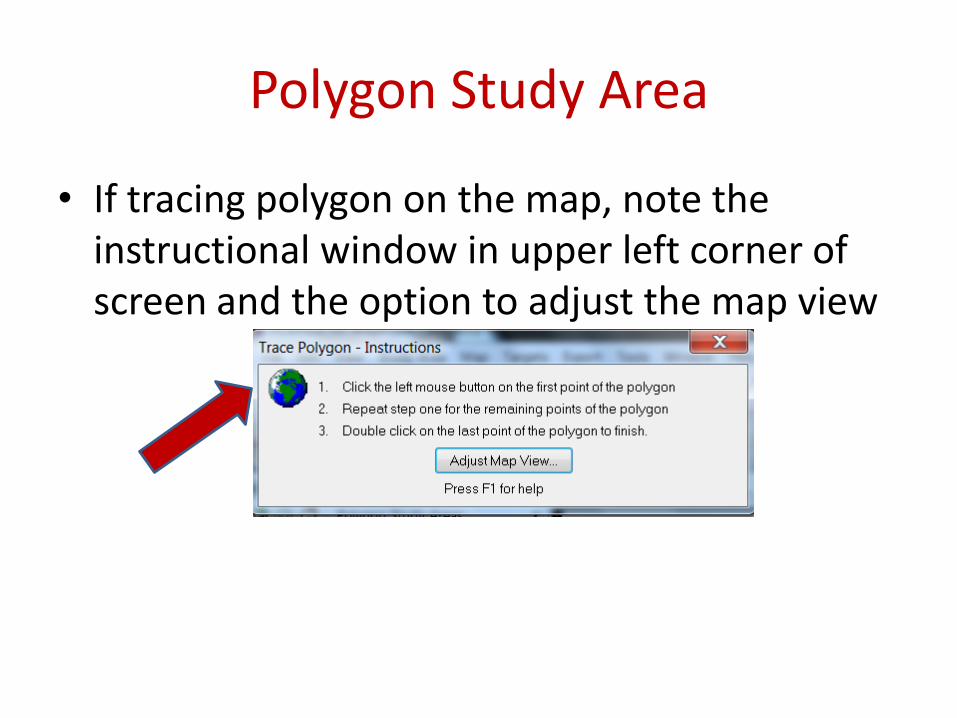
Polygon Study Area
• If tracing polygon on the map, note the instructional window in upper left corner of screen and the option to adjust the map view

Polygon Study Area
• After creating the polygon, assign a study area name
• Note: the search results will indicate the number of areas found (e.g. 111 dissemination blocks, etc)

Polygon Study Area
• Data displayed in Profile Tab – To view other categories, click on grey Category Bar at the bottom left
of the screen
Category Bar
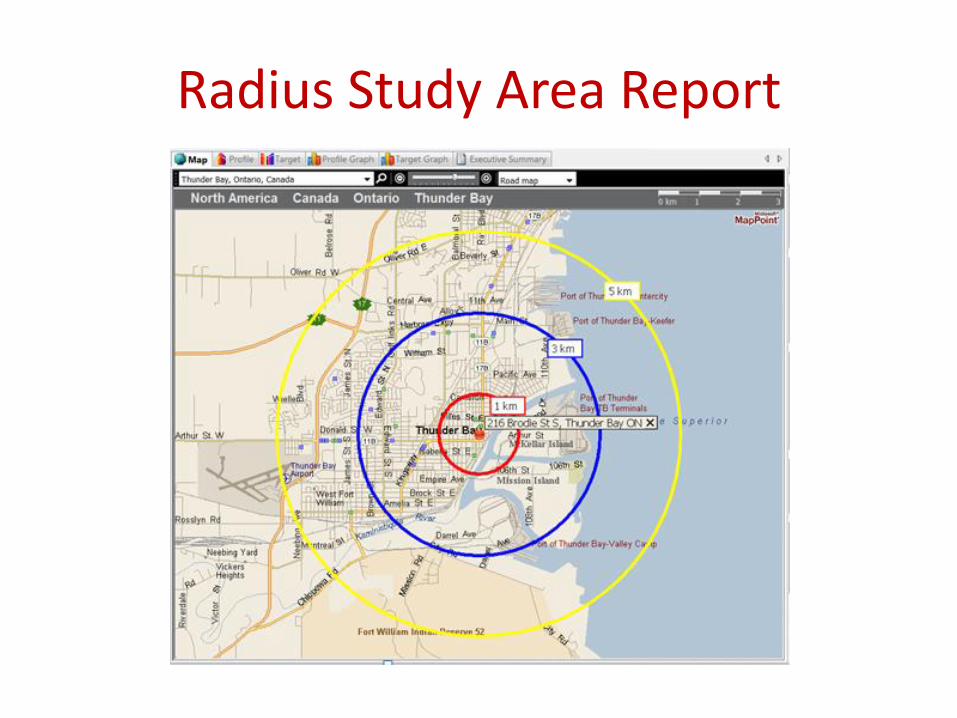
Radius Study Area Report
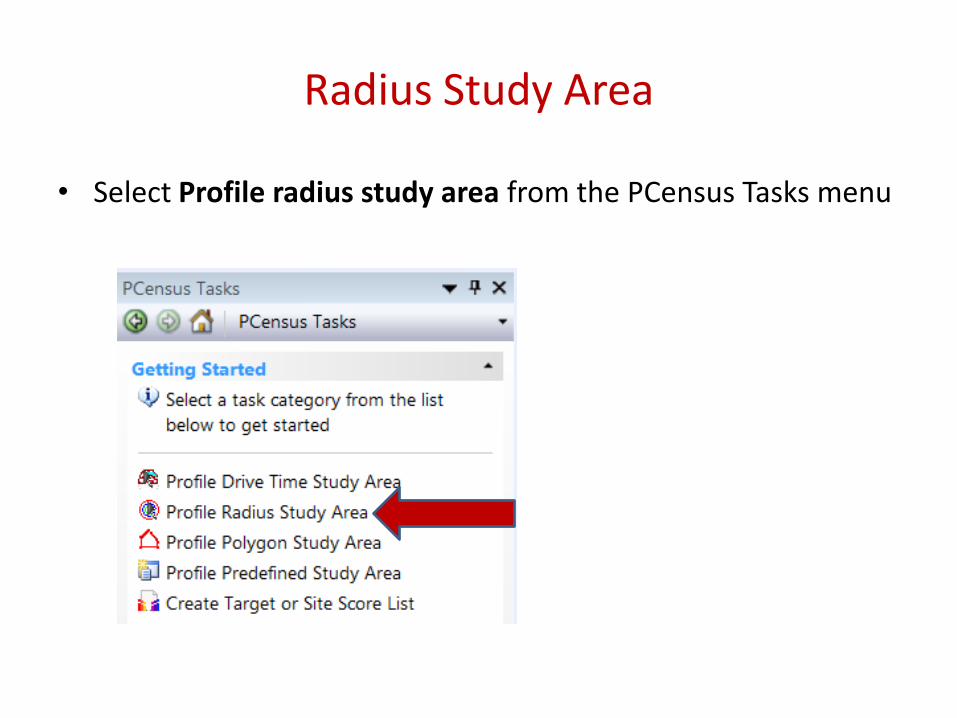
Radius Study Area
• Select Profile radius study area from the PCensus Tasks menu
Radius Study Area
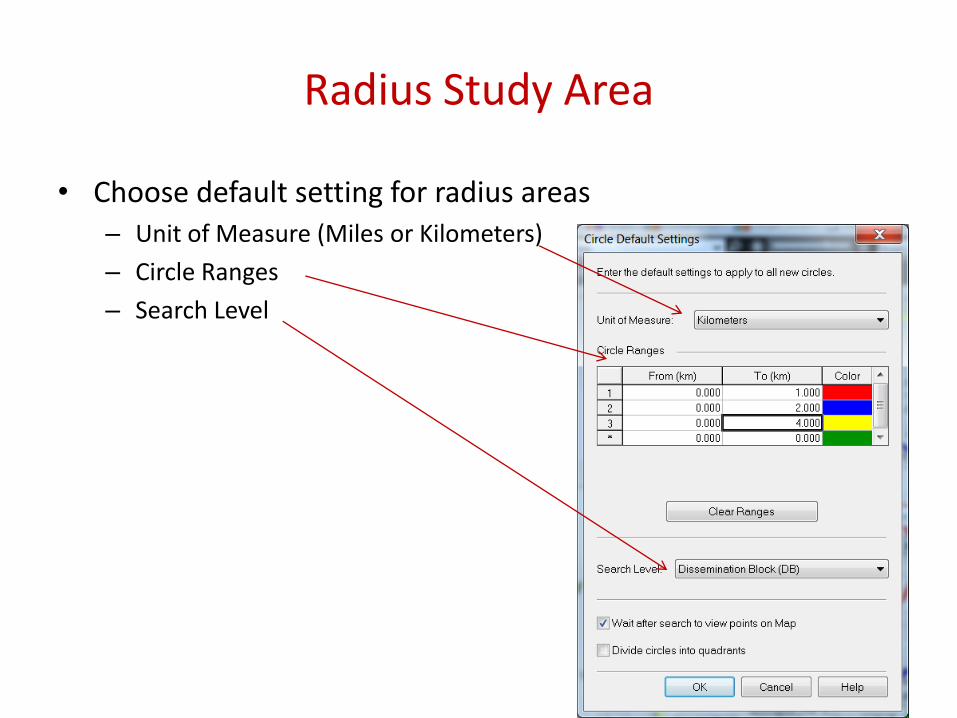
• Choose default setting for radius areas – Unit of Measure (Miles or Kilometers)
– Circle Ranges
– Search Level
Radius Study Area
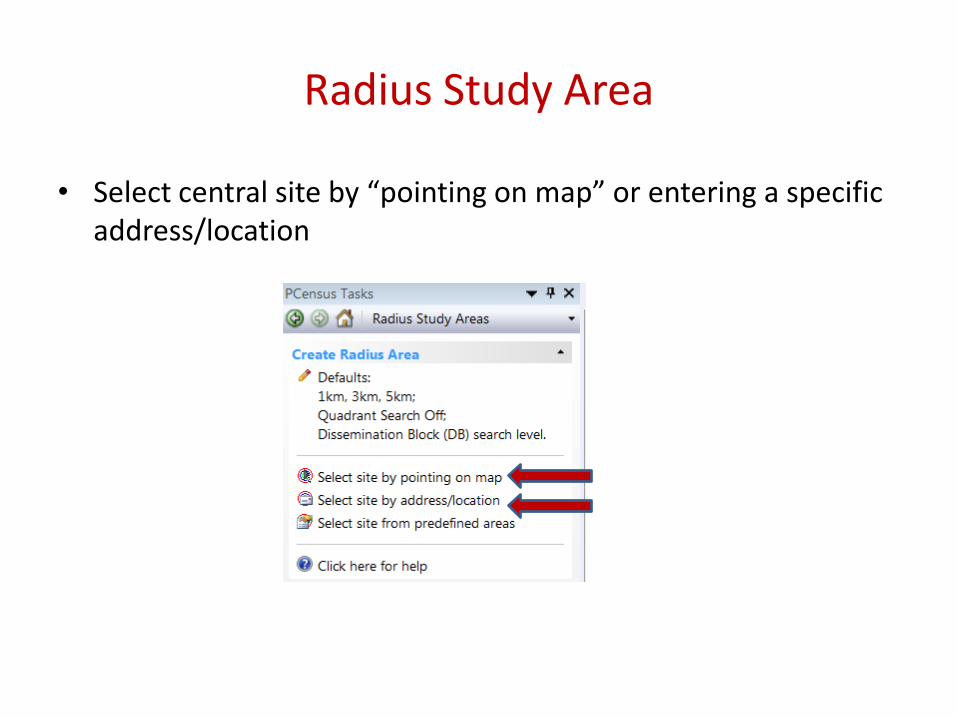
• Select central site by “pointing on map” or entering a specific address/location
Radius Study Area
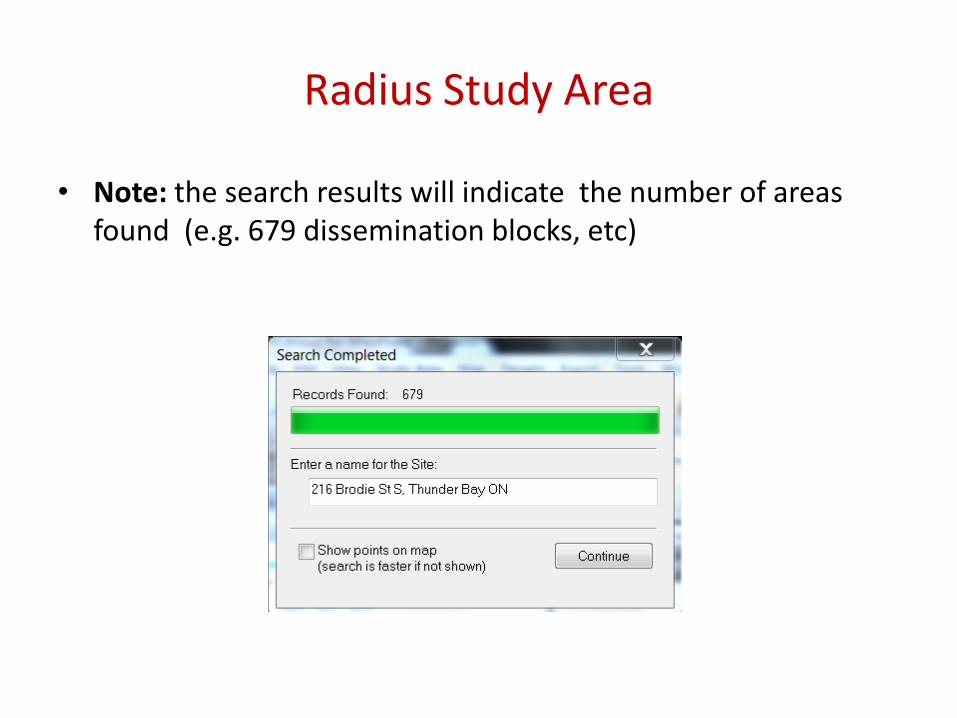
• Note: the search results will indicate the number of areas found (e.g. 679 dissemination blocks, etc)
Radius Study Area
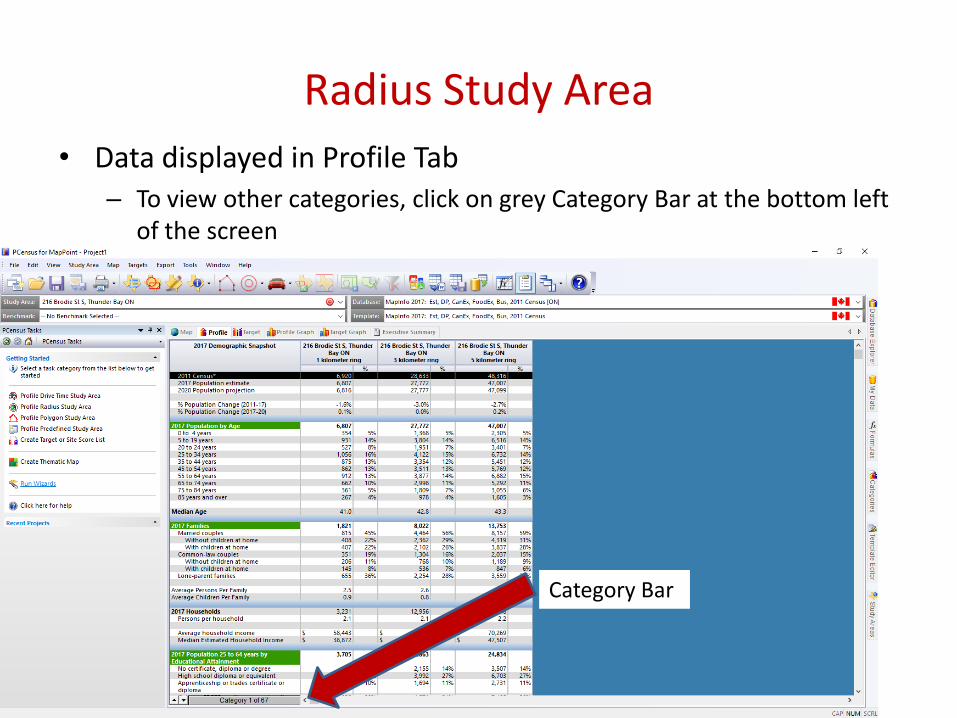
• Data displayed in Profile Tab – To view other categories, click on grey Category Bar at the bottom left
of the screen
Category Bar
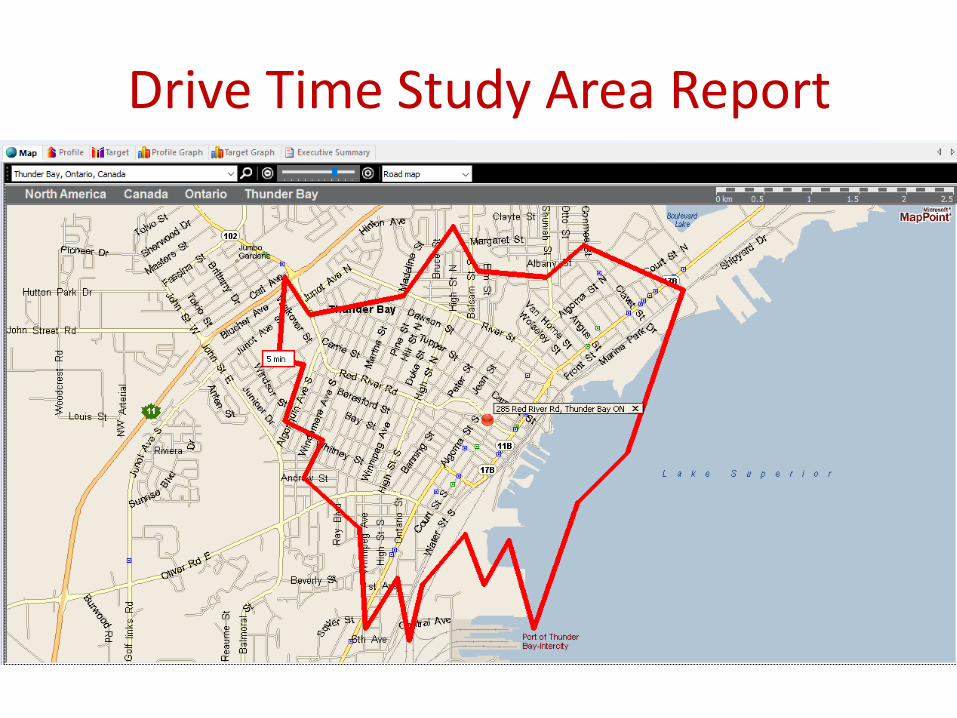
Drive Time Study Area Report

Drive Time Study Area
• Select Profile Drive Time Study Area from the PCensus Tasks menu
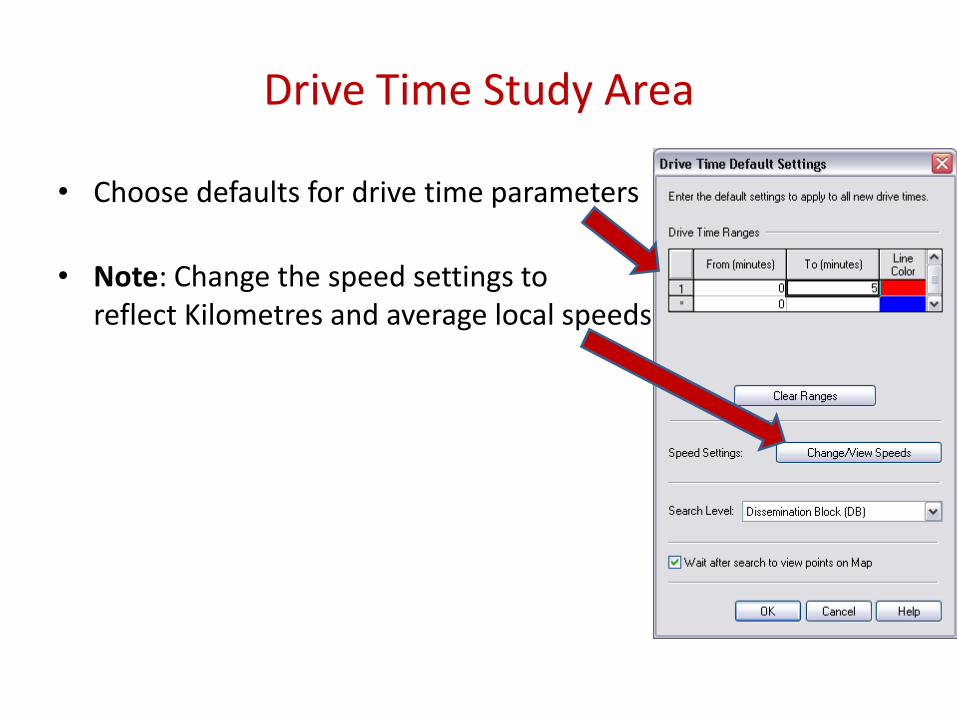
Drive Time Study Area
• Choose defaults for drive time parameters
• Note: Change the speed settings to reflect Kilometres and average local speeds
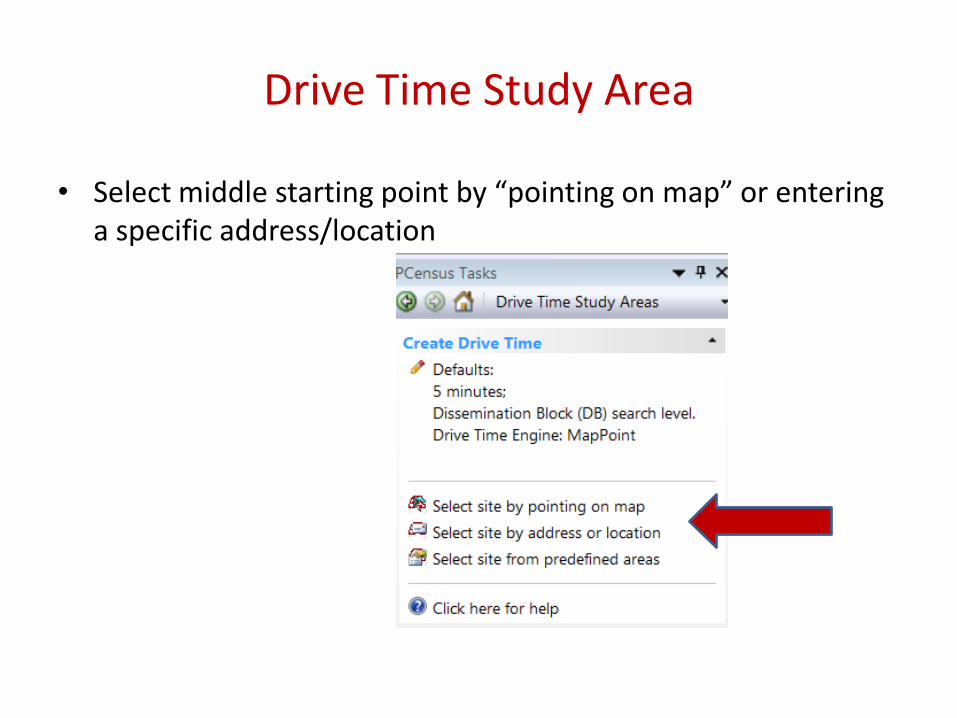
Drive Time Study Area
• Select middle starting point by “pointing on map” or entering a specific address/location
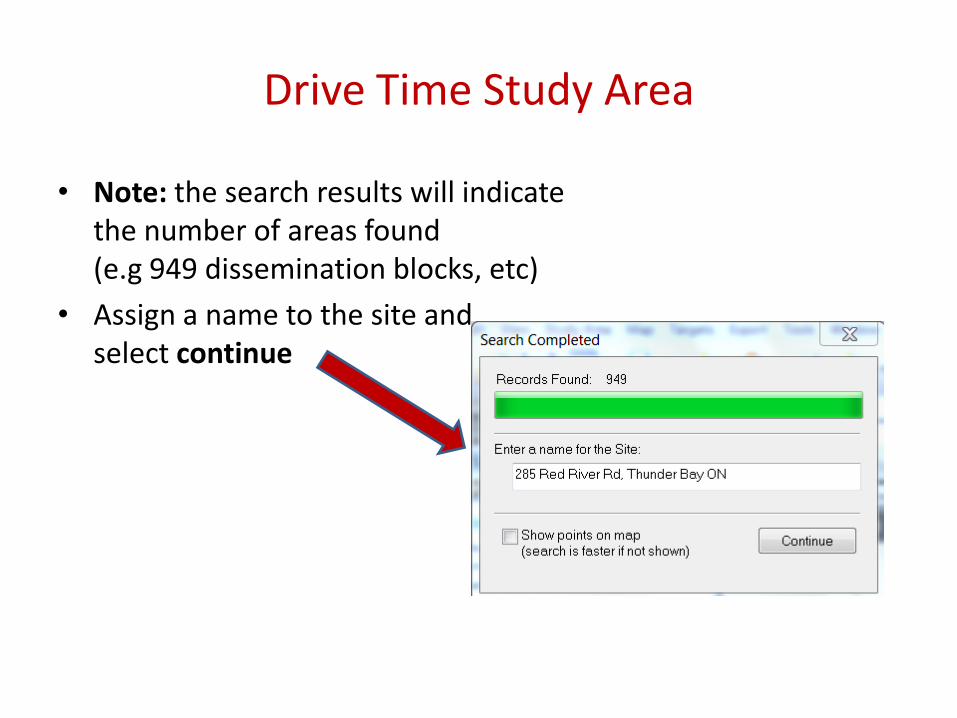
Drive Time Study Area
• Note: the search results will indicate the number of areas found (e.g 949 dissemination blocks, etc)
• Assign a name to the site and select continue

Drive Time Study Area
• Data displayed in Profile Tab – To view other categories, click on grey Category Bar at the bottom left
of the screen
Category Bar

Target List
• Create a Study Area first that covers the geographic region you are researching • Go to PCensus Tasks Menu (left side of screen) • Choose “Target or Site Score List” • Select defaults – this opens the Lifestyle Editor • Assign a title • Choose lifestyle dimensions: click “paste”, choose the database category from the
lifestyle menu and choose dimensions (can choose more than one at a time), click “paste”
• Select Dimension Properties – very important when targeting dollar amounts (Note which dimension you’re assigning limits to)
• Click OK - goes to Target List Settings • Choose target type (recommend using Dissemination Area) • Choose Benchmark reference if you want to do a comparison • Click OK • From task menu on left, select “create target report for the study area”

Site Score List
• Site Score = index of key variables that can be mapped out • Go to Study Area in top menu bar • Choose “new sitescan study area” • Choose mapped area or draw it on map manually • Click “Next” • If drawing on map, remember to “adjust map view” in order to
move/zoom before drawing site area and then click on “continue” • Select area on map and draw (following the “draw rectangle –
instructions”) • Follow steps in SiteScan Wizard • Map out selected targets to see placement throughout city • Note: radius of site coverage should be changed to kilometers for
Canadian target locations
Point/Boundary Thematic Maps
• Go to PCensus Tasks Menu (left side of screen)
• Select “Create Point Thematic Map” or “Create Boundary Thematic Map”
• Set defaults (Dissemination Block, Dissemination Area, etc)
• Select “Create thematic for the study area” / “current map view”
Printing
To print from PCensus, go to File / Print . Organize the look of the document (table of contents, headers, etc) / select the study areas (Maps) and categories (Profile Reports) needed and click “Print”
Prints are only produced in black & white and are available to pick up at the Reference desk (Brodie) or Circulation desk (Waverley) for 15 cents per page
Saving - PDF
To save a PCensus report in PDF format, go to File / Print . Organize the look of the document (table of contents, headers, etc) / select the study areas (Maps) and categories (Profile Reports) needed. Change the printer to the PDF printer and click “Print”. Choose where you would like to save the document (personal USB stick) and click “Save”. The document will open for review upon creation.
Exporting - Word
To export information to a Word document, click on the icon at the top of the screen (sort of in the middle but a bit to the right) that looks like a chart with a “W” in the bottom right corner. Organize the look of the document (table of contents, headers, etc) / select the study areas (Maps) and categories (Profile Reports) needed. Click OK. The document will then open up in Word and you can work with it or save it from there.

Exporting - Excel
To export information to an Excel file, click on the icon beside the export to Word icon that looks like a chart with a floppy disc in the bottom right corner. Choose File Type (Excel Workbook). Select the categories needed and create a Report Header if you want one. Click OK. The document will then open up in Excel and you can work with it or save it from there.
For additional help or questions:
- Jesse Roberts 624-4203 ([email protected])
- Ruth Hamlin-Douglas 624-4206 ([email protected])