Judgment Day Surprises! Judgment Day Surprises! I. That Judgment Day is a REALITY:

P/C and L/H:BCAR-The New Generation
Status Update onStochastic Based BCAR
08 April 2015
Matthew Mosher, Senior Vice PresidentThomas Mount, Vice PresidentGeorge Hansen, Assistant Vice President

Disclaimer
BCAR – The New Generation 2
© AM Best Company (AMB) and/or its licensors and affiliates. All rights reserved. ALL INFORMATION CONTAINED HEREIN IS PROTECTED BY COPYRIGHT LAW AND NONE OF SUCH INFORMATION MAY BE COPIED OR OTHERWISE REPRODUCED, REPACKAGED, FURTHER TRANSMITTED, TRANSFERRED, DISSEMINATED, REDISTRIBUTED OR RESOLD, OR STORED FOR SUBSEQUENT USE FOR ANY SUCH PURPOSE, IN WHOLE OR IN PART, IN ANY FORM OR MANNER OR BY ANY MEANS WHATSOEVER, BY ANY PERSON WITHOUT AMB’s PRIOR WRITTEN CONSENT. All information contained herein is obtained by AMB from sources believed by it to be accurate and reliable. Because of the possibility of human or mechanical error as well as other factors, however, all information contained herein is provided “AS IS” without warranty of any kind. Under no circumstances shall AMB have any liability to any person or entity for (a) any loss or damage in whole or in part caused by, resulting from, or relating to, any error (negligent or otherwise) or other circumstance or contingency within or outside the control of AMB or any of its directors, officers, employees or agents in connection with the procurement, collection, compilation, analysis, interpretation, communication, publication or delivery of any such information, or (b) any direct, indirect, special, consequential, compensatory or incidental damages whatsoever (including without limitation, lost profits), even if AMB is advised in advance of the possibility of such damages, resulting from the use of or inability to use, any such information. The credit ratings, financial reporting analysis, projections, and other observations, if any, constituting part of the information contained herein are, and must be construed solely as, statements of opinion and not statements of fact or recommendations topurchase, sell or hold any securities, insurance policies, contracts or any other financial obligations, nor does it address thesuitability of any particular financial obligation for a specific purpose or purchaser. Credit risk is the risk that an entity may not meet its contractual, financial obligations as they come due. Credit ratings do not address any other risk, including but not limited to, liquidity risk, market value risk or price volatility of rated securities. NO WARRANTY, EXPRESS OR IMPLIED, AS TO THE ACCURACY, TIMELINESS, COMPLETENESS, MERCHANTABILITY OR FITNESS FOR ANY PARTICULAR PURPOSE OF ANY SUCH RATING OR OTHER OPINION OR INFORMATION IS GIVEN OR MADE BY AMB IN ANY FORM OR MANNER WHATSOEVER. Each credit rating or other opinion must be weighed solely as one factor in any investment or purchasing decisionmade by or on behalf of any user of the information contained herein, and each such user must accordingly make its own study and evaluation of each security or other financial obligation and of each issuer and guarantor of, and each provider of credit support for, each security or other financial obligation that it may consider purchasing, holding or selling.

Purpose of Webinar
BCAR – The New Generation 3
o Informationalo Improve direct communicationo Set expectationso Provide ongoing status updates of the project
Agenda
BCAR – The New Generation 4
o AMB Rating Methodology – role of BCAR in the determination of a credit rating
o Current BCAR structureo Reasons for proposed changeso Overview of proposed changes & work to dateo Preliminary observationso Next Stepso Proposed implementation time frame
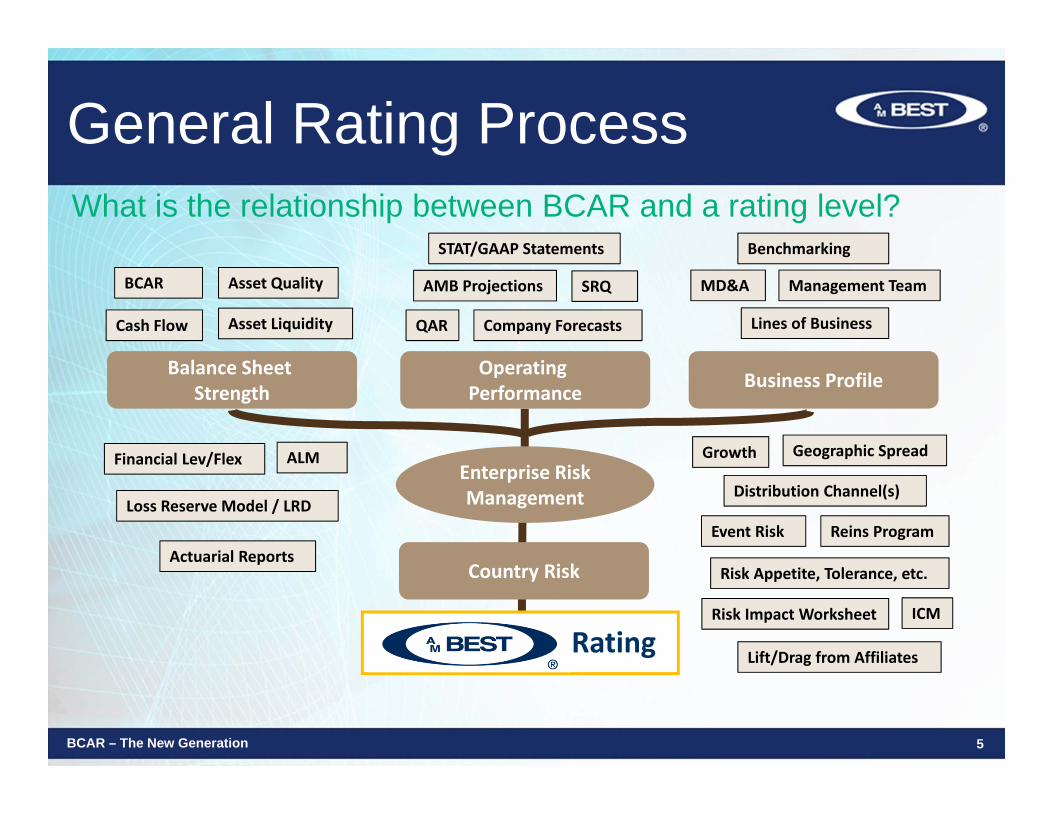
What is the relationship between BCAR and a rating level?
Balance Sheet Strength
Operating Performance Business Profile
Country Risk
Enterprise RiskManagement
General Rating Process
BCAR
Cash Flow
Asset Quality
Asset Liquidity
Financial Lev/Flex
Actuarial Reports
ALM
QAR
STAT/GAAP Statements
Company Forecasts
MD&A
Lines of Business
Management Team
Geographic SpreadGrowth
Risk Impact Worksheet
Event Risk Reins Program
Benchmarking
ICM
SRQ
Loss Reserve Model / LRD
Lift/Drag from Affiliates
Risk Appetite, Tolerance, etc.
Distribution Channel(s)
Rating
BCAR – The New Generation 5
AMB Projections
How is BCAR Used?
6
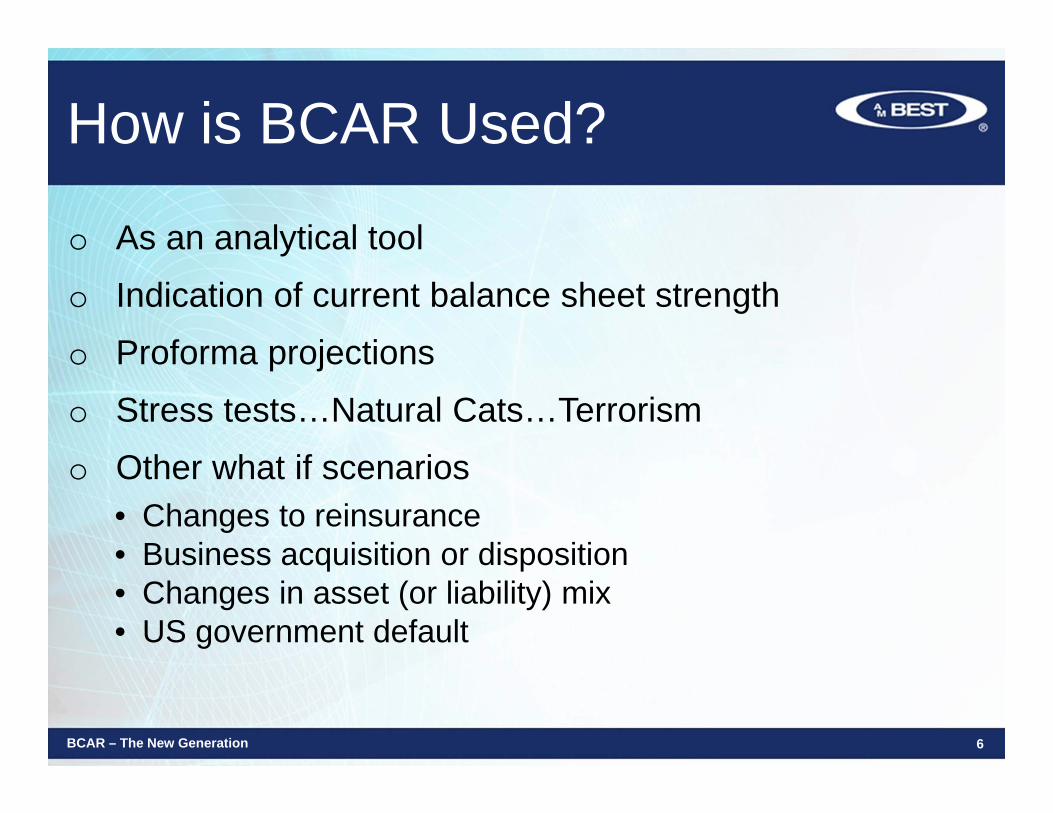
o As an analytical toolo Indication of current balance sheet strengtho Proforma projectionso Stress tests…Natural Cats…Terrorismo Other what if scenarios
• Changes to reinsurance• Business acquisition or disposition• Changes in asset (or liability) mix• US government default
BCAR – The New Generation

Current Structure – PC BCAR
Adjusted Surplus (APHS)Reported Surplus (PHS)Equity Adjustments:
Unearned Premiums (DAC)Equalization/Contingency ReservesLoss ReservesAssets
Debt Adjustments:Surplus NotesDebt Service Requirements
Other Adjustments:Future Operating LossesPotential Catastrophe LossFuture DividendsGoodwillOther Intangible AssetsMinority Interests, etc.
7
Net Required CapitalGross Required Capital (GRC):
(B1) Fixed Income Securities(B2) Equity Securities(B3) Interest Rate(B4) Credit(B5) Loss and LAE Reserves(B6) Net Premiums Written(B7) Off-Balance Sheet
Covariance Adjustment
Net Required Capital (NRC)*
BCAR Ratio = Adjusted Surplus / Net Required Capital
*NRC= SQRT [ (B1)²+(B2)²+(B3)²+(0.5*B4)² +[(0.5*B4)+B5)]²+(B6)² ] + B7
BCAR – The New Generation

Current Structure – LH BCAR
Adjusted Surplus (APHS)Reported Surplus (PHS)Equity Adjustments:
AVR ReservesInterest Maintenance ReserveUnearned Premiums (DAC)
Debt Adjustments:Surplus NotesDebt Service Requirements
Other Adjustments:Future Operating LossesFuture DividendsDerivatives Off Balance SheetGoodwillOther Intangible AssetsMinority Interests, etc.
Net Required CapitalGross Required Capital (GRC):
(C1) Asset Risk(C2) Insurance Risk(C3) Interest Rate/Market Risk(C4) Business Risk
Covariance Adjustment
Net Required Capital (NRC)*
*NRC= SQRT [ (C1NonEq + C3interest)² + (C1Eq + C3market)² + (C2)² ] + C4
BCAR Ratio = Adjusted Surplus / Net Required Capital
8BCAR – The New Generation

Reasons for Proposed Changes
o More sophisticated and faster software available now• Simulations / probability curves• Economic scenario generators (ESGs)• Correlations / diversification• Company specific detail
• Assets
• Reinsurers
• Profitability
• Volatility
BCAR – The New Generation 9

Reasons for Proposed Changes
o Metrics better understood and utilized by industry• Tail Value at Risk (TVaR)…aka Conditional Tail
Expectation (CTE)Average loss beyond a given thresholdThreshold is a percentile (ie 99%)Considers size of losses beyond threshold (Financial Strength)
• Value at Risk (VAR) … aka Probability of DefaultProbability loss will exceed a given threshold
o Consistent confidence intervals across risks• 95%, 97.5%, 99%, 99.5%, 99.9%
BCAR – The New Generation 10

Reasons for Proposed Changes
o Consistent Time Horizon for risk factors• Runoff to Ultimate basis for PC UW capital factors
Protects policyholders & claimantsNo change from current view
• Some risks will need to use duration of liabilities as indicator for ultimate riskCredit risk on recoverables
• Bonds – duration of bonds• Common stocks – one year
BCAR – The New Generation 11

Overview of Proposed Changes & Work to Dateo Do not intend to change underlying view of the risks
• Bonds – default risk• Common stock – price volatility• Reinsurance credit risk – uncollectible recoverables• Pricing risk – potential for UW loss on business written
next year• Reserve risk – potential for unanticipated adverse reserve
developmento Do not intend to change the main structure of the modelo Goal is to generate risk factors using stochastic
simulations from probability curves
BCAR – The New Generation 12

o Phase 1 – Bonds • Use Economic Scenario Generator• Update bond default risk factors
Reflect duration of company’s bond portfolio (SRQ)Reflect asset quality of company’s bond portfolio (SRQ)Reflect volatility in bond default assumptions (stochastic portion -
tied to ESG)Can offset default with recovery on defaults (vary by rating?)TVaR metric – (currently 5 year, 5% probability of ruin)VaR metric?
BCAR – The New Generation 13
Overview of Proposed Changes & Work to Date

Bond Quality & Maturity SRQ question:
BCAR – The New Generation 14
Overview of Proposed Changes & Work to Date

o Phase 1 – Common Stock• Use Economic Scenario Generator• Update common stock risk factors
Reflect type of stocks held by company (SRQ – Beta)Reflect volatility (stochastic portion – tied to ESG)Can cap simulated downside riskTVaR metric – (currently 1% EPD, 1 year)VaR metric?
BCAR – The New Generation 15
Overview of Proposed Changes & Work to Date

Common Stock Beta SRQ Question:
BCAR – The New Generation 16
Overview of Proposed Changes & Work to Date

o Phase 1 – Reinsurance • Update reinsurance credit risk factors
Reflect type of recoverable (paid, unpaid, upr)Reflect rating of each reinsurer (Schedule F/S and ratings data)Reflect duration of recoverablesCan reflect partial recovery when reins defaultsSimulate 10,000 scenarios for each reinsurerReflects concentration riskTVaR metric (currently based on FSR)VaR metric?
BCAR – The New Generation 17
Overview of Proposed Changes & Work to Date

o Phase 1 – PC Premium• Update PC premium risk factors
Create Industry UW Loss probability curves– 21 Schedule P lines and 4 NPW size categories (VS,S,M,L)– 84 industry probability curves for premiums
Use company NPW size to select industry probability curve– use company profitability to adjust curve
Simulate 10,000 UW profit/loss scenarios for each lineReflect diversification across lines
– use one of 4 industry correlation matrices – based on size of company’s total NPW (VS,S,M,L)
Risk factors based on TVaR metric (currently 1% EPD – ultimate)VaR metric?
BCAR – The New Generation 18
Overview of Proposed Changes & Work to Date

o Phase 1 – PC Reserves• Update PC reserve risk Factors
Create industry unanticipated adverse development probability curves– 21 Schedule P lines and 4 reserve size categories (VS,S,M,L)– 84 industry probability curves for reserves
Use company Reserve size to select industry probability curve– use company volatility to adjust curve
Simulate 10,000 reserve development scenarios for each lineReflect diversification across lines
– use one of 4 industry correlation matrices – based on size of company’s total net reserves (VS,S,M,L)
Risk factors based on TVaR metric (currently 1% EPD – ultimate) VaR metric?
BCAR – The New Generation 19
Overview of Proposed Changes & Work to Date

o Phase 1 – Natural Catastrophe• Update natural catastrophe approach
Var or TVaR metric?Occurrence vs. aggregate season?Total all perils?Currently different VaRs for EQ and WindStraight charge to PHS or add to NRC?Confidence level?Continue stress test approach?
BCAR – The New Generation 20
Overview of Proposed Changes & Work to Date

Potential Structure – PC BCAR
Adjusted Surplus (APHS)Reported Surplus (PHS)Equity Adjustments:
Unearned Premiums (DAC)Equalization/Contingency ReservesLoss ReservesAssets
Debt Adjustments:Surplus NotesDebt Service Requirements
Other Adjustments:Future Operating LossesPotential LossFuture DividendsGoodwillOther Intangible AssetsMinority Interests, etc.
21
Net Required CapitalGross Required Capital (GRC):
(B1) Fixed Income Securities(B2) Equity Securities(B3) Interest Rate(B4) Credit(B5) Loss and LAE Reserves(B6) Net Premiums Written(B7) Off-Balance Sheet(B8) Catastrophe Exposure
Covariance Adjustment
Net Required Capital (NRC)*
BCAR Ratio = Adjusted Surplus / Net Required Capital
*NRC= SQRT [ (B1)²+(B2)²+(B3)²+(0.5*B4)² +[(0.5*B4)+B5)]²+(B6)² ] + B7 + B8
BCAR – The New Generation

Example of Impact to PC Model
22
Current CalculationAPHS (ex Potential Cat Losses) = $150MPotential cat Losses = $30MNRC = $80M
BCAR = (150-30) = 120 = 15080 80
Potential CalculationAPHS (ex Potential Cat Losses) = $150MPotential cat Losses = $30MNRC = $80M
BCAR = 150 = 150 = 136(80+30) 110
BCAR – The New Generation

Overview of Proposed Changes
o Phase 2• Remaining asset classes• Life and annuity risks
MortalityLongevityDisintermediationProduct GuaranteesLong Term Care/Disability
• Change net required capital formula to correlation matrix approach (instead of the square root rule)
BCAR – The New Generation 23

Observationso Investments
• Greater risk than previous considered
• Particularly in equities
o Reinsurance
• Initial charges came out high and this is being reviewedo PC Underwriting (Reserves and Premium)
• Auto is coming out lower – not surprised by this• Made sure we are not double counting catastrophe charge• TVaR very high at high confidence levels• More differentiation between lines of business• By line correlation matrices – no real surprises
o BCAR Guidelines
• May need to change
BCAR – The New Generation 24

Observations
o Next generation BCAR as an indication of current balance sheet strength…what do scores say about relative financial strength?
95% 98% 99% Company A 178 (A++) 111 83
Company B 178 (A++) 126 103
Company C 152 (A) 128 116
BCAR – The New Generation 25

Observations
o Next generation BCAR as an indication of current balance sheet strength…what do scores say about relative financial strength?
95% 98% 99% Company A 178 (A++) 111 83
Company B 178 (A++) 126 103
Company C 152 (A) 128 116
BCAR – The New Generation 26

Observations
o Next generation BCAR as an indication of current balance sheet strength…what do scores say about relative financial strength?
95% 98% 99% Company A 178 (A++) 111 83
Company B 178 (A++) 126 103
Company C 152 (A) 128 116
BCAR – The New Generation 27
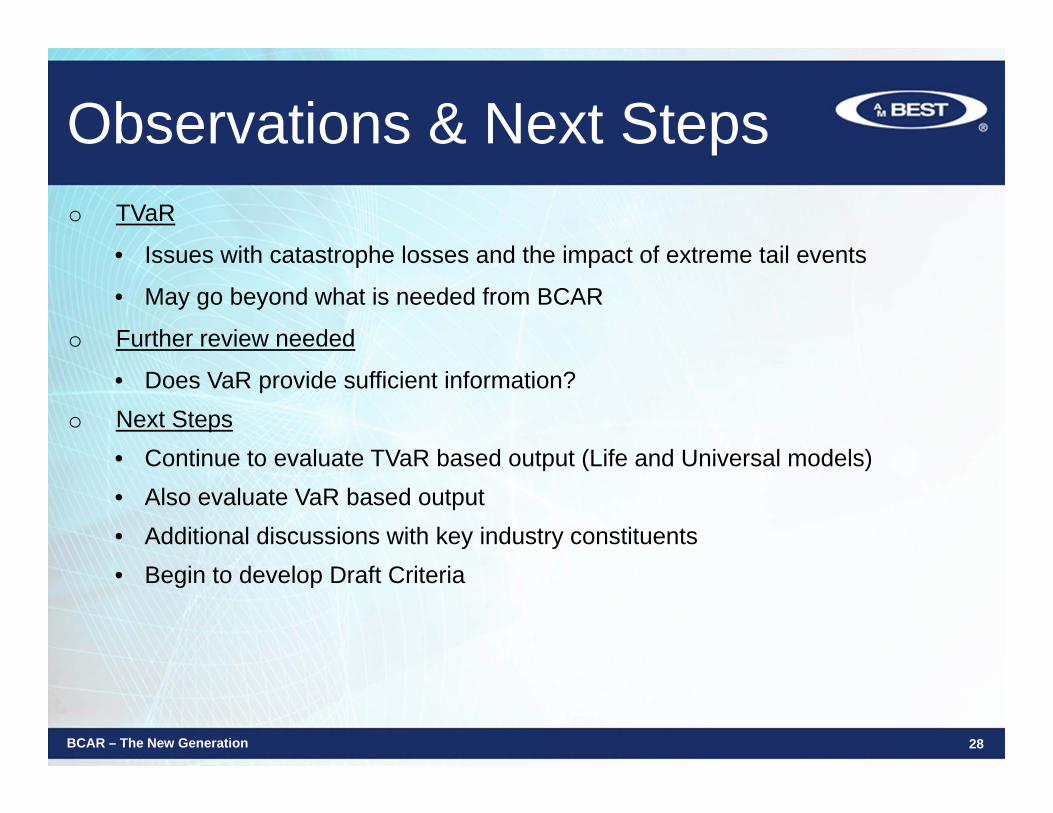
Observations & Next Stepso TVaR
• Issues with catastrophe losses and the impact of extreme tail events
• May go beyond what is needed from BCAR
o Further review needed
• Does VaR provide sufficient information?o Next Steps
• Continue to evaluate TVaR based output (Life and Universal models)• Also evaluate VaR based output• Additional discussions with key industry constituents• Begin to develop Draft Criteria
BCAR – The New Generation 28

Expected Timeline
o Model being developed in phases• Phase 1 built – testing internally with 2013 YE data
Initial Parameters completedRun parallel BCARs (PC; LH; Universal) internally with 2014 YE
dataDraft criteria expected to be released this summer for commentWe do anticipate sharing 2014 YE output with companies as draft
criteria are releasedTime frames for final criteria release will be impacted by
comments received on criteria, changes based on comments, & LH impact study
• Phase 2 – 1 year after Phase 1 finalized
BCAR – The New Generation 29