PAYMENTS TO THE STATES - budget.gov.au · 1 Annex A PAYMENTS TO THE STATES This annex provides...
57
1 Annex A PAYMENTS TO THE STATES This annex provides accrual estimates of Australian Government payments to state and territory governments (the states) and local governments. This includes Australian Government advances (loans) to the states, including new advances, interest on advances and repayments of advances. The Australian Government advances the states loans under a range of agreements. These advances have often been over very long repayment periods (some in excess of 50 years), although the terms of each agreement vary considerably. Each table presents estimated payments to the states for the period 2018–19 to 2021–22 as follows: A.1 — health; A.2 — education; A.3 — skills and workforce development; A.4 — community services; A.5 — affordable housing; A.6 — infrastructure; A.7 — environment; A.8 — contingent payments; A.9 — other; A.10 — GST and general revenue assistance; A.11 — payments presented on the Australian Bureau of Statistics Government Finance Statistics (GFS) functional basis; and A.12 — advances, repayment of advances and interest payments.
Transcript of PAYMENTS TO THE STATES - budget.gov.au · 1 Annex A PAYMENTS TO THE STATES This annex provides...

1
Annex A
PAYMENTS TO THE STATES
This annex provides accrual estimates of Australian Government payments to state and territory governments (the states) and local governments. This includes Australian Government advances (loans) to the states, including new advances, interest on advances and repayments of advances. The Australian Government advances the states loans under a range of agreements. These advances have often been over very long repayment periods (some in excess of 50 years), although the terms of each agreement vary considerably.
Each table presents estimated payments to the states for the period 2018–19 to 2021–22 as follows:
A.1 — health;
A.2 — education;
A.3 — skills and workforce development;
A.4 — community services;
A.5 — affordable housing;
A.6 — infrastructure;
A.7 — environment;
A.8 — contingent payments;
A.9 — other;
A.10 — GST and general revenue assistance;
A.11 — payments presented on the Australian Bureau of Statistics Government Finance Statistics (GFS) functional basis; and
A.12 — advances, repayment of advances and interest payments.

2
Mid-Year Econom
ic and Fiscal Outlook 2018-19
Table A.1: Estimated payments to support state health services, by year and state $million NSW VIC QLD WA SA TAS ACT NT Total2018-19National Health Reform funding(a)
Hospital services 6,465.6 4,985.4 4,993.9 2,197.6 1,283.2 423.8 395.5 270.0 21,015.1Public health 130.3 105.6 81.5 42.2 28.2 8.5 6.8 4.0 407.0
National Partnership paymentsHealth services
Additional assistance for public hospitals(b) - - - - - - 12.4 - 12.4Comprehensive palliative care
across the life course - - - - - - - - -Expansion of the BreastScreen
Australia Program 4.8 3.8 3.0 1.6 1.1 0.3 0.2 0.2 14.9Hummingbird House - - 0.8 - - - - - 0.8Improving Health Services in Tasmania
Subacute and acute projects - - - - - 5.0 - - 5.0Management of Torres Strait / Papua New
Guinea cross-border health issues - - 4.8 - - - - - 4.8Mosquito control and cross border liaison
in the Torres Strait - - 1.0 - - - - - 1.0National Bowel Cancer Screening Program
– participant follow-up function 2.5 1.9 1.6 0.8 0.6 0.3 0.2 0.1 8.0OzFoodNet 0.4 0.3 0.3 0.2 0.2 0.2 0.1 0.2 1.8Royal Darwin hospital – equipped,
prepared and ready - - - - - - - 16.3 16.3Specialist dementia care program(c) ~ ~ ~ ~ ~ ~ ~ ~ 0.2Vaccine-preventable diseases
surveillance 0.2 0.2 0.2 0.1 0.1 .. .. 0.1 0.9Victorian Cytology Service - 10.3 - - - - - - 10.3
Mid-Year Econom
ic and Fiscal Outlook 2018-19
3
Table A.1: Estimated payments to support state health services, by year and state (continued) $million NSW VIC QLD WA SA TAS ACT NT Total2018-19
Health infrastructureAlbury-Wodonga Cardiac Catheterisation
Laboratory - 1.0 - - - - - - 1.0Expansion of Clare Holland House - - - - - - 4.0 - 4.0Fussell House accommodation 4.0 - - - - - - - 4.0Hospital infrastructure projects 1.9 - 16.5 5.7 - 17.5 - 0.1 41.7Proton Beam Therapy Facility - - - - 40.7 - - - 40.7Redevelopment of Strathalbyn
residential aged care facility - - - - 2.5 - - - 2.5Indigenous health
Addressing blood borne viruses and sexually transmitted infections in the
Torres Strait - - 1.1 - - - - - 1.1Improving trachoma control services for
Indigenous Australians .. - 0.3 1.6 1.3 - - 1.8 5.1Northern Territory remote Aboriginal
investment – health component - - - - - - - 6.4 6.4Rheumatic fever strategy - - 1.8 1.8 0.8 - - 0.9 5.4
Other healthEncouraging more clinical trials in Australia 0.3 0.2 0.3 0.2 0.1 0.1 0.2 0.1 1.5Electronic recording and reporting of
controlled drugs 0.3 0.4 0.4 0.4 0.4 0.5 0.4 0.4 3.2Essential vaccines 5.5 3.5 4.0 2.1 1.1 0.4 0.2 0.6 17.4Health Innovation Fund 36.7 - - 13.3 - - - - 50.0National Coronial Information System - 0.4 - - - - - - 0.4Public dental services for adults 34.4 26.9 49.5 9.7 9.4 3.4 1.4 1.4 136.1Suicide prevention(d) 1.3 0.8 - - - 0.3 0.3 - 6.0
Total(e) 6,688.1 5,140.6 5,160.9 2,277.5 1,369.7 460.3 421.9 302.6 21,825.0 (a) National Health Reform Funding in 2018-19 includes an adjustment of $629.6m related to services provided in previous years. (b) Funding is indicative only and will depend on final entitlements to National Health Reform funding from 2017-18 to 2019-20. (c) State allocations are yet to be finalised. (d) Total includes unallocated funding. (e) State allocations for a number of programs are not yet finalised, therefore total payments may not equal the sum of state totals.

4
Mid-Year Econom
ic and Fiscal Outlook 2018-19
Table A.1: Estimated payments to support state health services, by year and state (continued) $million NSW VIC QLD WA SA TAS ACT NT Total2019-20National Health Reform funding(a)
Hospital services 6,602.5 5,417.2 4,791.0 2,307.8 1,368.1 435.6 403.1 308.9 21,634.2Public health 137.3 111.9 85.7 44.2 29.4 8.9 7.2 4.2 428.8
National Partnership paymentsHealth services
Additional assistance for public hospitals(b) - - - - - - 1.7 - 1.7Comprehensive palliative care
across the life course(c) ~ ~ ~ ~ ~ ~ ~ ~ 9.9Expansion of the BreastScreen
Australia Program 4.9 3.8 3.0 1.6 1.1 0.3 0.2 0.2 15.2Hummingbird House - - 0.8 - - - - - 0.8Improving Health Services in Tasmania
Subacute and acute projects - - - - - - - - -Management of Torres Strait / Papua New
Guinea cross-border health issues - - 4.9 - - - - - 4.9Mosquito control and cross border liaison
in the Torres Strait - - 1.0 - - - - - 1.0National Bowel Cancer Screening Program
– participant follow-up function 2.8 2.2 1.8 1.0 0.7 0.3 0.2 0.1 8.9OzFoodNet 0.4 0.3 0.3 0.2 0.2 0.2 0.1 0.2 1.8Royal Darwin hospital – equipped,
prepared and ready - - - - - - - 16.5 16.5Specialist dementia care program(c) ~ ~ ~ ~ ~ ~ ~ ~ 2.8Vaccine-preventable diseases
surveillance 0.2 0.2 0.2 0.1 0.1 .. .. 0.1 0.9Victorian Cytology Service - 10.5 - - - - - - 10.5

Mid-Year Econom
ic and Fiscal Outlook 2018-19
5
Table A.1: Estimated payments to support state health services, by year and state (continued) $million NSW VIC QLD WA SA TAS ACT NT Total2019-20
Health infrastructureAlbury-Wodonga Cardiac Catheterisation
Laboratory - - - - - - - - -Expansion of Clare Holland House - - - - - - - - -Fussell House accommodation 2.7 - - - - - - - 2.7Hospital infrastructure projects - 0.5 - 4.4 - 10.0 - 2.2 17.1Proton Beam Therapy Facility - - - - - - - - -Redevelopment of Strathalbyn
residential aged care facility - - - - 0.7 - - - 0.7Indigenous health
Addressing blood borne viruses and sexually transmitted infections in the
Torres Strait - - 1.1 - - - - - 1.1Improving trachoma control services for
Indigenous Australians .. - 0.3 1.7 1.4 - - 1.9 5.2Northern Territory remote Aboriginal
investment – health component - - - - - - - 6.7 6.7Rheumatic fever strategy - - 0.9 0.9 0.4 - - 0.9 3.2
Other healthEncouraging more clinical trials in Australia 0.3 0.2 0.3 0.2 0.1 0.1 0.2 0.1 1.5Electronic recording and reporting of
controlled drugs - - - - - - - - -Essential vaccines 5.4 3.4 4.0 2.1 1.1 0.4 0.2 0.5 17.1Health Innovation Fund - - - - - - - - -National Coronial Information System - 0.4 - - - - - - 0.4Public dental services for adults(c) ~ ~ ~ ~ ~ ~ ~ ~ 107.8Suicide prevention(d) 1.3 0.5 - - - 0.5 - - 3.0
Total(e) 6,761.8 5,551.1 4,895.2 2,364.2 1,403.3 456.3 413.0 342.5 22,308.5 (a) National Health Reform Funding in 2019-20 includes an adjustment of $81.5m related to services provided in 2018-19. (b) Funding is indicative only and will depend on final entitlements to National Health Reform funding from 2017-18 to 2019-20. (c) State allocations are yet to be finalised. (d) Total includes unallocated funding. (e) State allocations for a number of programs are not yet finalised, therefore total payments may not equal the sum of state totals.

6
Mid-Year Econom
ic and Fiscal Outlook 2018-19
Table A.1: Estimated payments to support state health services, by year and state (continued) $million NSW VIC QLD WA SA TAS ACT NT Total2020-21National Health Reform funding
Hospital services 6,920.1 5,672.1 5,012.2 2,449.5 1,424.1 450.7 430.4 332.2 22,691.4Public health 144.8 118.6 90.2 46.3 30.7 9.2 7.6 4.3 451.7
National Partnership paymentsHealth services
Additional assistance for public hospitals(a) - - - - - 2.5 - - 2.5Comprehensive palliative care
across the life course(b) ~ ~ ~ ~ ~ ~ ~ ~ 10.5Expansion of the BreastScreen
Australia Program 4.9 3.9 3.1 1.7 1.1 0.3 0.3 0.2 15.4Hummingbird House - - - - - - - - -Improving Health Services in Tasmania
Subacute and acute projects - - - - - - - - -Management of Torres Strait / Papua New
Guinea cross-border health issues - - - - - - - - -Mosquito control and cross border liaison
in the Torres Strait - - - - - - - - -National Bowel Cancer Screening Program
– participant follow-up function 2.8 2.2 1.8 1.0 0.7 0.3 0.2 0.1 9.1OzFoodNet - - - - - - - - -Royal Darwin hospital – equipped,
prepared and ready - - - - - - - 16.8 16.8Specialist dementia care program(b) ~ ~ ~ ~ ~ ~ ~ ~ 3.9Vaccine-preventable diseases
surveillance - - - - - - - - -Victorian Cytology Service - 10.6 - - - - - - 10.6

Mid-Year Econom
ic and Fiscal Outlook 2018-19
7
Table A.1: Estimated payments to support state health services, by year and state (continued) $million NSW VIC QLD WA SA TAS ACT NT Total2020-21
Health infrastructureAlbury-Wodonga Cardiac Catheterisation
Laboratory - - - - - - - - -Expansion of Clare Holland House - - - - - - - - -Fussell House accommodation - - - - - - - - -Hospital infrastructure projects - - - - - - - - -Proton Beam Therapy Facility - - - - - - - - -Redevelopment of Strathalbyn
residential aged care facility - - - - 0.7 - - - 0.7Indigenous health
Addressing blood borne viruses and sexually transmitted infections in the
Torres Strait - - - - - - - - -Improving trachoma control services for
Indigenous Australians .. - 0.3 1.7 1.4 - - 1.9 5.3Northern Territory remote Aboriginal
investment – health component - - - - - - - 7.0 7.0Rheumatic fever strategy - - 1.0 1.0 0.4 - - 1.0 3.3
Other healthEncouraging more clinical trials in Australia 0.3 0.2 0.3 0.2 0.1 0.1 0.2 0.1 1.5Electronic recording and reporting of
controlled drugs - - - - - - - - -Essential vaccines 5.4 3.4 4.0 2.1 1.1 0.4 0.2 0.5 17.1Health Innovation Fund(b) ~ ~ ~ ~ ~ ~ ~ ~ 50.0National Coronial Information System - - - - - - - - -Public dental services for adults - - - - - - - - -Suicide prevention - - - - - - - - -
Total(c) 7,080.4 5,811.1 5,112.8 2,503.4 1,460.3 463.6 438.8 364.2 23,298.8 (a) Funding is indicative only and will depend on final entitlements to National Health Reform funding from 2017-18 to 2019-20. (b) State allocations are yet to be finalised. (c) State allocations for a number of programs are not yet finalised, therefore total payments may not equal the sum of state totals.

8
Mid-Year Econom
ic and Fiscal Outlook 2018-19
Table A.1: Estimated payments to support state health services, by year and state (continued) $million NSW VIC QLD WA SA TAS ACT NT Total2021-22National Health Reform funding
Hospital services 7,272.8 5,947.4 5,295.1 2,599.4 1,482.0 466.4 459.5 362.8 23,885.2Public health 152.8 125.8 94.9 48.5 32.1 9.6 8.0 4.5 476.2
National Partnership paymentsHealth services
Additional assistance for public hospitals(a) - - - - - 4.7 - - 4.7Comprehensive palliative care
across the life course(b) ~ ~ ~ ~ ~ ~ ~ ~ 11.0Expansion of the BreastScreen
Australia Program - - - - - - - - -Hummingbird House - - - - - - - - -Improving Health Services in Tasmania
Subacute and acute projects - - - - - - - - -Management of Torres Strait / Papua New
Guinea cross-border health issues - - - - - - - - -Mosquito control and cross border liaison
in the Torres Strait - - - - - - - - -National Bowel Cancer Screening Program
– participant follow-up function 2.8 2.2 1.8 1.0 0.7 0.3 0.2 0.1 9.0OzFoodNet - - - - - - - - -Royal Darwin hospital – equipped,
prepared and ready - - - - - - - 17.0 17.0Specialist dementia care program(b) ~ ~ ~ ~ ~ ~ ~ ~ 4.0Vaccine-preventable diseases
surveillance - - - - - - - - -Victorian Cytology Service - - - - - - - - -
Mid-Year Econom
ic and Fiscal Outlook 2018-19
9
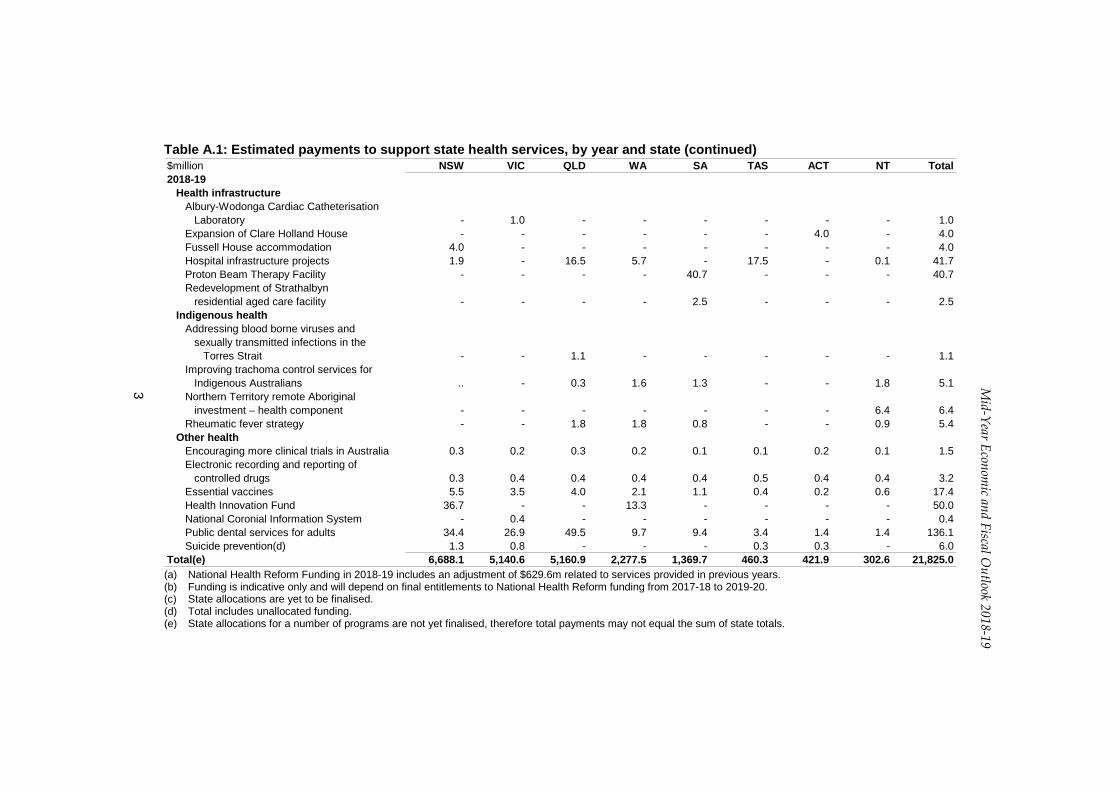
Table A.1: Estimated payments to support state health services, by year and state (continued) $million NSW VIC QLD WA SA TAS ACT NT Total2021-22
Health infrastructureAlbury-Wodonga Cardiac Catheterisation
Laboratory - - - - - - - - -Expansion of Clare Holland House - - - - - - - - -Fussell House accommodation - - - - - - - - -Hospital infrastructure projects - - - - - - - - -Proton Beam Therapy Facility - - - - 27.3 - - - 27.3Redevelopment of Strathalbyn
residential aged care facility - - - - - - - - -Indigenous health
Addressing blood borne viruses and sexually transmitted infections in the
Torres Strait - - - - - - - - -Improving trachoma control services for
Indigenous Australians - - - - - - - - -Northern Territory remote Aboriginal
investment – health component - - - - - - - 7.4 7.4Rheumatic fever strategy - - - - - - - - -
Other healthEncouraging more clinical trials in Australia - - - - - - - - -Electronic recording and reporting of
controlled drugs - - - - - - - - -Essential vaccines 5.3 3.4 4.0 2.1 1.1 0.4 0.2 0.5 17.0Health Innovation Fund - - - - - - - - -National Coronial Information System - - - - - - - - -Public dental services for adults - - - - - - - - -Suicide prevention - - - - - - - - -
Total(c) 7,433.7 6,078.8 5,395.8 2,651.0 1,543.1 481.3 467.8 392.3 24,458.7 (a) Funding is indicative only and will depend on final entitlements to National Health Reform funding from 2017-18 to 2019-20. (b) State allocations are yet to be finalised. (c) State allocations for a number of programs are not yet finalised, therefore total payments may not equal the sum of state totals.

10
Mid-Year Econom
ic and Fiscal Outlook 2018-19
Table A.2: Estimated payments to support state education services, by year and state $million NSW VIC QLD WA SA TAS ACT NT Total2018-19Quality Schools funding(a)(b)(c)(d) 6,114.7 4,897.0 4,239.1 1,956.9 1,362.8 452.5 330.5 367.0 19,720.5National Partnership payments
MoneySmart Teaching(e) ~ ~ ~ 0.3 0.3 0.3 0.1 ~ 2.5National School Chaplaincy Program 11.3 12.8 18.4 7.7 7.6 2.2 1.0 0.5 61.4Northern Territory remote Aboriginal
investment(f)Children and schooling component - - - - - - - 37.5 37.5
School Pathways Program - - - 0.6 0.6 - - - 1.2Universal access to early childhood education 124.9 120.9 88.0 46.3 28.2 9.3 9.1 4.8 431.5
Total(g) 6,250.9 5,030.6 4,345.5 2,011.9 1,399.5 464.3 340.7 409.7 20,254.6Memorandum item – payments for non-government
schools included in payments aboveQuality Schools funding(b)(c) 3,684.0 3,129.8 2,493.7 1,211.1 852.1 256.2 223.1 162.7 12,012.6
Total 3,684.0 3,129.8 2,493.7 1,211.1 852.1 256.2 223.1 162.7 12,012.6 (a) Includes funding for the NT to accelerate evidence based reforms to improve student outcomes for some of our most vulnerable children. (b) Includes capital funding. (c) Includes special circumstances funding, other prescribed purpose funding (including adjustment assistance for non-government schools and short term emergency
assistance) and non-government school reform support. As State allocations are yet to be finalised, this funding is included in the total for each year only. As a result, the total for each year does not equal the sum of State totals.
(d) Includes funding for literacy support for Tasmanian students. (e) State allocations are yet to be finalised. (f) Includes payments for government and non-government schools. However, the non-government schools component is not included in the Memorandum item. (g) State allocations for a number of programs are not yet finalised, therefore total payments may not equal the sum of state totals

Mid-Year Econom
ic and Fiscal Outlook 2018-19
11
Table A.2: Estimated payments to support state education services, by year and state (continued) $million NSW VIC QLD WA SA TAS ACT NT Total2019-20Quality Schools funding(a)(b)(c)(d) 6,472.8 5,236.9 4,542.4 2,105.2 1,438.5 471.7 341.5 386.6 20,995.6National Partnership payments
MoneySmart Teaching(e) ~ ~ ~ 0.1 0.1 0.1 0.1 ~ 1.3National School Chaplaincy Program 11.3 12.8 18.4 7.7 7.6 2.2 1.0 0.5 61.4Northern Territory remote Aboriginal
investment(f)Children and schooling component - - - - - - - 37.3 37.3
School Pathways Program - - - 0.6 0.6 - - - 1.2Universal access to early childhood education 90.2 86.7 61.9 33.0 19.9 6.4 6.5 3.4 308.1
Total(g) 6,574.3 5,336.4 4,622.6 2,146.7 1,466.8 480.5 349.1 427.9 21,405.0Memorandum item – payments for non-government
schools included in payments aboveQuality Schools funding(b)(c) 3,868.0 3,303.7 2,645.1 1,268.9 881.3 266.6 221.4 174.4 12,629.5
Total 3,868.0 3,303.7 2,645.1 1,268.9 881.3 266.6 221.4 174.4 12,629.5 (a) Includes funding for the NT to accelerate evidence based reforms to improve student outcomes for some of our most vulnerable children. (b) Includes capital funding. (c) Includes special circumstances funding, other prescribed purpose funding (including adjustment assistance for non-government schools and short term emergency
assistance) and non-government school reform support. As State allocations are yet to be finalised, this funding is included in the total for each year only. As a result, the total for each year does not equal the sum of State totals.
(d) Includes funding for literacy support for Tasmanian students. (e) State allocations are yet to be finalised. (f) Includes payments for government and non-government schools. However, the non-government schools component is not included in the Memorandum item. (g) State allocations for a number of programs are not yet finalised, therefore total payments may not equal the sum of state totals
12
Mid-Year Econom
ic and Fiscal Outlook 2018-19
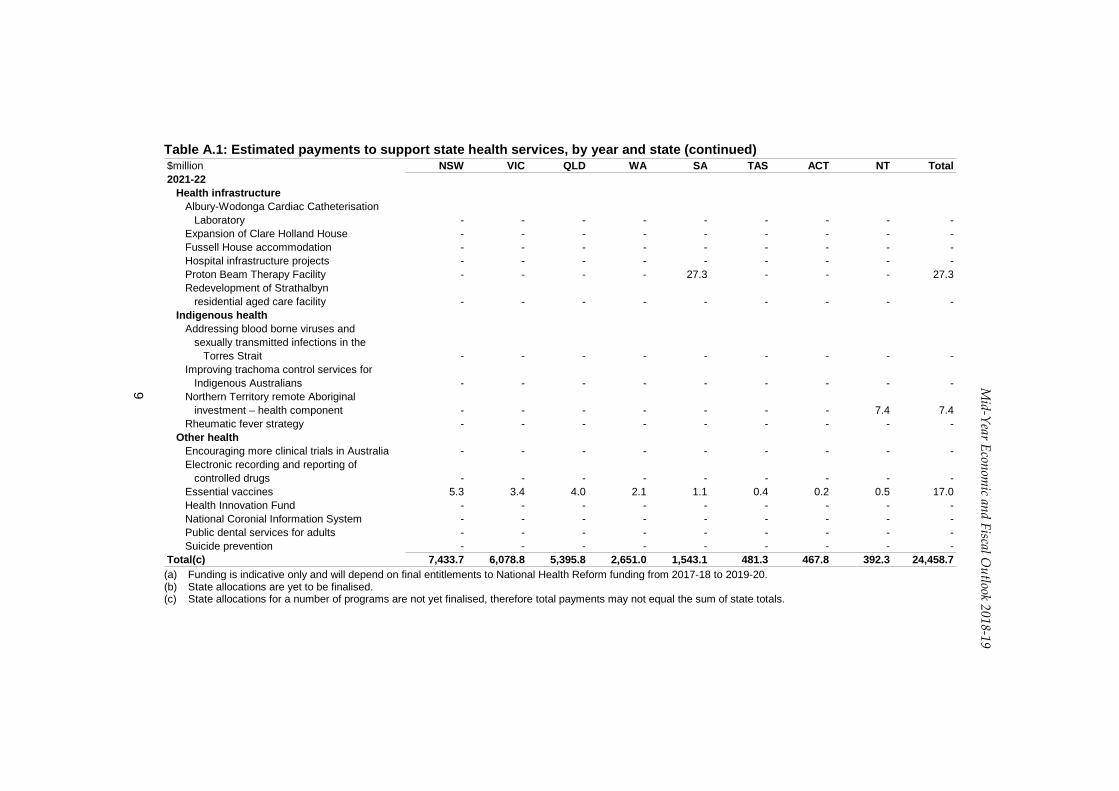
Table A.2: Estimated payments to support state education services, by year and state (continued) $million NSW VIC QLD WA SA TAS ACT NT Total2020-21Quality Schools funding(a)(b)(c)(d) 6,962.9 5,683.5 4,921.6 2,299.8 1,542.2 499.4 364.9 410.7 22,685.0National Partnership payments
MoneySmart Teaching(e) ~ ~ ~ 0.1 0.1 0.1 0.1 ~ 1.3National School Chaplaincy Program 11.3 12.8 18.4 7.7 7.6 2.2 1.0 0.5 61.4Northern Territory remote Aboriginal
investment(f)Children and schooling component - - - - - - - 30.2 30.2
School Pathways Program - - - - - - - - -Universal access to early childhood education - - - - - - - - -
Total(g) 6,974.2 5,696.3 4,939.9 2,307.7 1,549.9 501.8 366.0 441.4 22,778.0Memorandum item – payments for non-government
schools included in payments aboveQuality Schools funding(b)(c) 4,171.0 3,576.7 2,868.0 1,365.9 936.2 284.6 231.3 189.7 13,623.4
Total 4,171.0 3,576.7 2,868.0 1,365.9 936.2 284.6 231.3 189.7 13,623.4 (a) Includes funding for the NT to accelerate evidence based reforms to improve student outcomes for some of our most vulnerable children. (b) Includes capital funding. (c) Includes special circumstances funding, other prescribed purpose funding (including adjustment assistance for non-government schools and short term emergency
assistance) and non-government school reform support. As State allocations are yet to be finalised, this funding is included in the total for each year only. As a result, the total for each year does not equal the sum of State totals.
(d) Includes funding for literacy support for Tasmanian students. (e) State allocations are yet to be finalised. (f) Includes payments for government and non-government schools. However, the non-government schools component is not included in the Memorandum item. (g) State allocations for a number of programs are not yet finalised, therefore total payments may not equal the sum of state totals

Mid-Year Econom
ic and Fiscal Outlook 2018-19
13
Table A.2: Estimated payments to support state education services, by year and state (continued) $million NSW VIC QLD WA SA TAS ACT NT Total2021-22Quality Schools funding(a)(b)(c)(d) 7,370.2 6,094.4 5,212.4 2,470.4 1,632.4 521.9 385.1 429.3 24,116.2National Partnership payments
MoneySmart Teaching - - - - - - - - -National School Chaplaincy Program 11.3 12.8 18.4 7.7 7.6 2.2 1.0 0.5 61.4Northern Territory remote Aboriginal
investment(e)Children and schooling component - - - - - - - 29.3 29.3
School Pathways Program - - - - - - - - -Universal access to early childhood education - - - - - - - - -
Total 7,381.5 6,107.2 5,230.8 2,478.2 1,640.0 524.1 386.1 459.1 24,206.9Memorandum item – payments for non-government
schools included in payments aboveQuality Schools funding(b)(c) 4,394.6 3,805.8 3,020.2 1,434.8 976.5 297.8 237.7 202.4 14,369.7
Total 4,394.6 3,805.8 3,020.2 1,434.8 976.5 297.8 237.7 202.4 14,369.7 (a) Includes funding for the NT to accelerate evidence based reforms to improve student outcomes for some of our most vulnerable children. (b) Includes capital funding. (c) Includes special circumstances funding, other prescribed purpose funding (including adjustment assistance for non-government schools and short term emergency
assistance) and non-government school reform support. As State allocations are yet to be finalised, this funding is included in the total for each year only. As a result, the total for each year does not equal the sum of State totals.
(d) Includes funding for literacy support for Tasmanian students. (e) Includes payments for government and non-government schools. However, the non-government schools component is not included in the Memorandum item.

14
Mid-Year Econom
ic and Fiscal Outlook 2018-19
Table A.3: Estimated payments to support state skills and workforce development services, by year and state $million NSW VIC QLD WA SA TAS ACT NT Total2018-19National Skills and Workforce
Development SPP 485.5 393.5 303.6 157.3 104.9 31.8 25.5 14.9 1,516.9National Partnership payments
Job Ready Generation Package - North-WestTasmania - - - - - 3.2 - - 3.2
Skilling Australians Fund(a) ~ ~ ~ ~ ~ ~ ~ ~ 293.4Total(b) 485.5 393.5 303.6 157.3 104.9 34.9 25.5 14.9 1,813.42019-20National Skills and Workforce
Development SPP 493.3 402.0 307.8 158.7 105.6 31.9 25.8 14.9 1,540.1National Partnership payments
Job Ready Generation Package - North-WestTasmania - - - - - - - - -
Skilling Australians Fund(a) ~ ~ ~ ~ ~ ~ ~ ~ 293.4Total(b) 493.3 402.0 307.8 158.7 105.6 31.9 25.8 14.9 1,833.52020-21National Skills and Workforce
Development SPP 501.9 411.1 312.4 160.4 106.4 32.1 26.2 15.0 1,565.4National Partnership payments
Job Ready Generation Package - North-WestTasmania - - - - - - - - -
Skilling Australians Fund(a) ~ ~ ~ ~ ~ ~ ~ ~ 338.3Total(b) 501.9 411.1 312.4 160.4 106.4 32.1 26.2 15.0 1,903.72021-22National Skills and Workforce
Development SPP 510.0 419.8 316.8 161.9 107.1 32.2 26.6 15.0 1,589.4National Partnership payments
Job Ready Generation Package - North-WestTasmania - - - - - - - - -
Skilling Australians Fund(a) ~ ~ ~ ~ ~ ~ ~ ~ 298.2Total(b) 510.0 419.8 316.8 161.9 107.1 32.2 26.6 15.0 1,887.6 (a) State allocations are yet to be finalised. (b) State allocations for a number of programs are not yet finalised, therefore total payments may not equal the sum of state totals.

Mid-Year Econom
ic and Fiscal Outlook 2018-19
15
Table A.4: Estimated payments to support state community services, by year and state $million NSW VIC QLD WA SA TAS ACT NT Total2018-19National Disability SPP(a) - 417.6 322.2 166.9 - 33.7 - 15.8 956.3National Partnership payments
Family advocacy and support services 1.7 1.2 1.1 0.7 0.6 0.6 0.6 0.5 7.0Northern Territory remote Aboriginal investment
Community safety component - - - - - - - 53.7 53.7Pay equity for the social and community
services sector 31.9 45.8 48.5 59.6 - 5.2 0.9 4.0 195.9Payments from the DisabilityCare Australia
Fund(b) 547.0 1,101.6 838.6 49.7 295.3 101.8 30.9 42.2 3,007.1Specialist disability services - 76.6 45.4 27.3 - 12.3 - 6.3 167.8Women's Safety Package Technology Trials 0.5 0.5 0.1 - 0.1 0.4 - .. 1.7
Total 581.0 1,643.4 1,255.9 304.2 296.0 154.0 32.4 122.6 4,389.42019-20National Disability SPP(a) - - - 173.6 - - - - 173.6National Partnership payments
Family advocacy and support services 1.7 1.3 1.1 0.7 0.6 0.6 0.6 0.6 7.2Northern Territory remote Aboriginal investment
Community safety component - - - - - - - 44.4 44.4Pay equity for the social and community
services sector - - - 33.3 - - - - 33.3Payments from the DisabilityCare Australia
Fund(b) 607.0 244.0 197.4 512.8 72.7 22.5 16.3 9.7 1,682.4Specialist disability services - - - 28.2 - - - - 28.2Women's Safety Package Technology Trials 0.2 .. - - 0.2 0.4 - .. 0.9
Total 608.9 245.3 198.6 748.6 73.5 23.6 16.8 54.7 1,969.9 (a) A zero entitlement indicates that the NDIS has been fully rolled out in that state. (b) Funding amounts are indicative estimates only. Negotiations are continuing with the states on drawdown arrangements.

16
Mid-Year Econom
ic and Fiscal Outlook 2018-19
Table A.4: Estimated payments to support state community services, by year and state (continued) $million NSW VIC QLD WA SA TAS ACT NT Total2020-21National Disability SPP(a) - - - - - - - - -National Partnership payments
Family advocacy and support services 1.7 1.3 1.2 0.7 0.6 0.6 0.6 0.6 7.3Northern Territory remote Aboriginal investment
Community safety component - - - - - - - 34.7 34.7Pay equity for the social and community
services sector - - - - - - - - -Payments from the DisabilityCare Australia
Fund(b) 618.0 252.5 204.3 94.4 75.2 23.3 16.8 10.0 1,294.7Specialist disability services - - - - - - - - -Women's Safety Package Technology Trials - - - - - - - - -
Total 619.7 253.8 205.5 95.1 75.9 24.0 17.4 45.3 1,336.72021-22National Disability SPP(a) - - - - - - - - -National Partnership payments
Family advocacy and support services 1.8 1.3 1.2 0.7 0.6 0.6 0.6 0.6 7.4Northern Territory remote Aboriginal investment
Community safety component - - - - - - - 36.0 36.0Pay equity for the social and community
services sector - - - - - - - - -Payments from the DisabilityCare Australia
Fund(b) 630.0 261.4 211.5 103.6 77.9 24.1 17.4 10.4 1,336.2Specialist disability services - - - - - - - - -Women's Safety Package Technology Trials - - - - - - - - -
Total 631.7 262.7 212.7 104.3 78.5 24.8 18.0 46.9 1,379.6 (a) A zero entitlement indicates that the NDIS has been fully rolled out in that state. (b) Funding amounts are indicative estimates only. Negotiations are continuing with the states on drawdown arrangements.
Mid-Year Econom
ic and Fiscal Outlook 2018-19
17
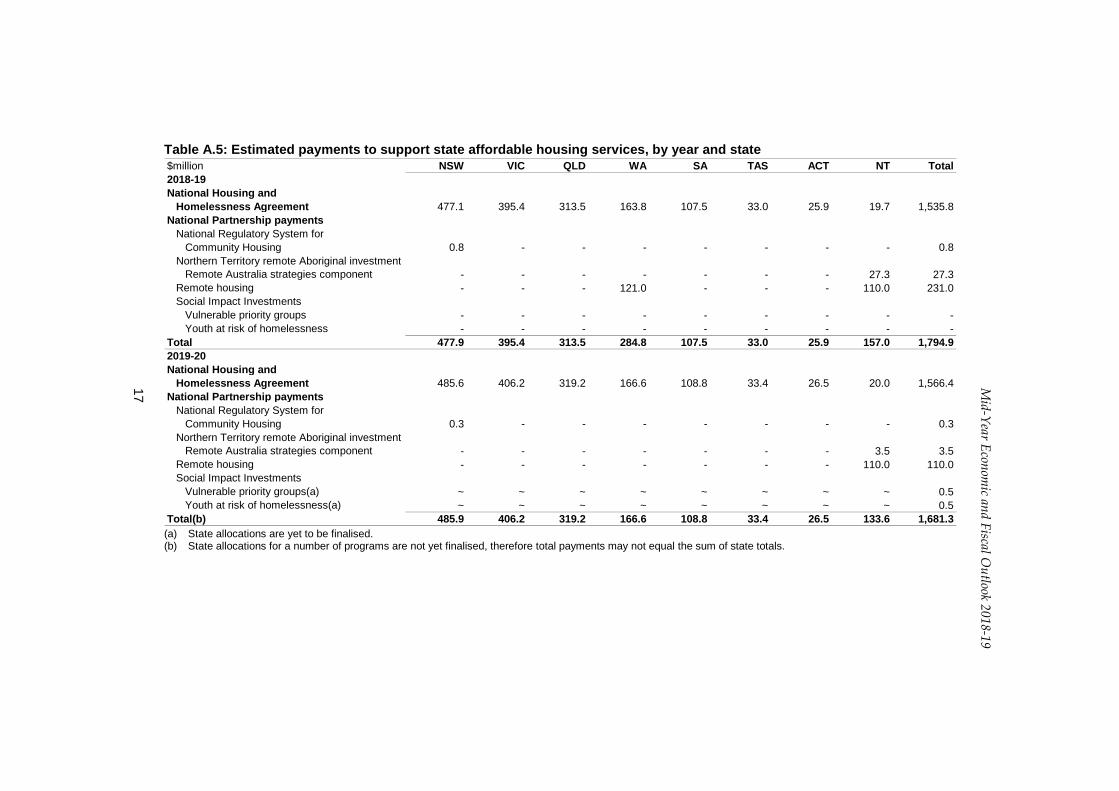
Table A.5: Estimated payments to support state affordable housing services, by year and state $million NSW VIC QLD WA SA TAS ACT NT Total2018-19National Housing and
Homelessness Agreement 477.1 395.4 313.5 163.8 107.5 33.0 25.9 19.7 1,535.8National Partnership payments
National Regulatory System for Community Housing 0.8 - - - - - - - 0.8
Northern Territory remote Aboriginal investmentRemote Australia strategies component - - - - - - - 27.3 27.3
Remote housing - - - 121.0 - - - 110.0 231.0Social Impact Investments
Vulnerable priority groups - - - - - - - - -Youth at risk of homelessness - - - - - - - - -
Total 477.9 395.4 313.5 284.8 107.5 33.0 25.9 157.0 1,794.92019-20National Housing and
Homelessness Agreement 485.6 406.2 319.2 166.6 108.8 33.4 26.5 20.0 1,566.4National Partnership payments
National Regulatory System for Community Housing 0.3 - - - - - - - 0.3
Northern Territory remote Aboriginal investmentRemote Australia strategies component - - - - - - - 3.5 3.5
Remote housing - - - - - - - 110.0 110.0Social Impact Investments
Vulnerable priority groups(a) ~ ~ ~ ~ ~ ~ ~ ~ 0.5Youth at risk of homelessness(a) ~ ~ ~ ~ ~ ~ ~ ~ 0.5
Total(b) 485.9 406.2 319.2 166.6 108.8 33.4 26.5 133.6 1,681.3 (a) State allocations are yet to be finalised. (b) State allocations for a number of programs are not yet finalised, therefore total payments may not equal the sum of state totals.

18
Mid-Year Econom
ic and Fiscal Outlook 2018-19
Table A.5: Estimated payments to support state affordable housing services, by year and state (continued) $million NSW VIC QLD WA SA TAS ACT NT Total2020-21National Housing and
Homelessness Agreement 494.8 417.6 325.3 169.6 110.3 33.8 27.2 20.4 1,599.1National Partnership payments
National Regulatory System for Community Housing - - - - - - - - -
Northern Territory remote Aboriginal investmentRemote Australia strategies component - - - - - - - 3.7 3.7
Remote housing - - - - - - - 110.0 110.0Social Impact Investments
Vulnerable priority groups(a) ~ ~ ~ ~ ~ ~ ~ ~ 0.5Youth at risk of homelessness(a) ~ ~ ~ ~ ~ ~ ~ ~ 0.5
Total(b) 494.8 417.6 325.3 169.6 110.3 33.8 27.2 134.0 1,713.82021-22National Housing and
Homelessness Agreement 495.0 405.5 318.2 162.9 106.7 32.2 25.8 19.3 1,565.6National Partnership payments
National Regulatory System for Community Housing - - - - - - - - -
Northern Territory remote Aboriginal investmentRemote Australia strategies component - - - - - - - 3.7 3.7
Remote housing - - - - - - - 110.0 110.0Social Impact Investments
Vulnerable priority groups(a) ~ ~ ~ ~ ~ ~ ~ ~ 0.5Youth at risk of homelessness(a) ~ ~ ~ ~ ~ ~ ~ ~ 0.5
Total(b) 495.0 405.5 318.2 162.9 106.7 32.2 25.8 133.0 1,680.4 (a) State allocations are yet to be finalised. (b) State allocations for a number of programs are not yet finalised, therefore total payments may not equal the sum of state totals.
Mid-Year Econom
ic and Fiscal Outlook 2018-19
19
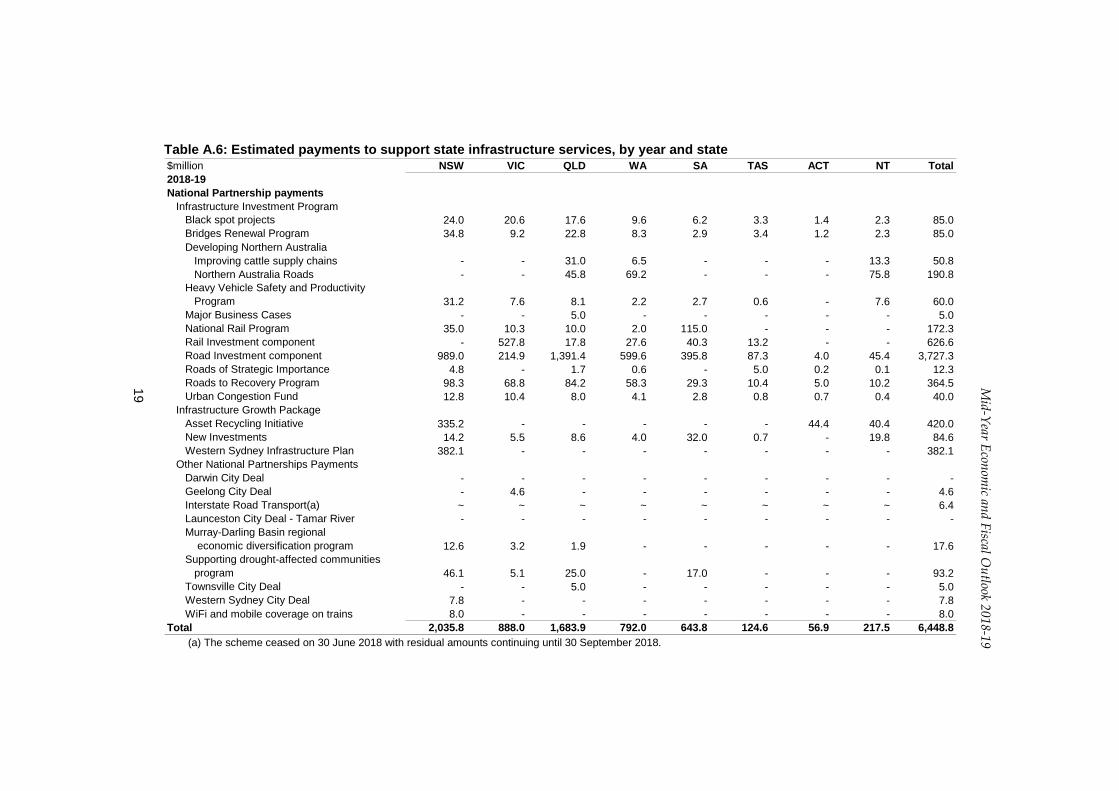
Table A.6: Estimated payments to support state infrastructure services, by year and state $million NSW VIC QLD WA SA TAS ACT NT Total2018-19National Partnership payments
Infrastructure Investment ProgramBlack spot projects 24.0 20.6 17.6 9.6 6.2 3.3 1.4 2.3 85.0Bridges Renewal Program 34.8 9.2 22.8 8.3 2.9 3.4 1.2 2.3 85.0Developing Northern Australia
Improving cattle supply chains - - 31.0 6.5 - - - 13.3 50.8Northern Australia Roads - - 45.8 69.2 - - - 75.8 190.8
Heavy Vehicle Safety and ProductivityProgram 31.2 7.6 8.1 2.2 2.7 0.6 - 7.6 60.0
Major Business Cases - - 5.0 - - - - - 5.0National Rail Program 35.0 10.3 10.0 2.0 115.0 - - - 172.3Rail Investment component - 527.8 17.8 27.6 40.3 13.2 - - 626.6Road Investment component 989.0 214.9 1,391.4 599.6 395.8 87.3 4.0 45.4 3,727.3Roads of Strategic Importance 4.8 - 1.7 0.6 - 5.0 0.2 0.1 12.3Roads to Recovery Program 98.3 68.8 84.2 58.3 29.3 10.4 5.0 10.2 364.5Urban Congestion Fund 12.8 10.4 8.0 4.1 2.8 0.8 0.7 0.4 40.0
Infrastructure Growth PackageAsset Recycling Initiative 335.2 - - - - - 44.4 40.4 420.0New Investments 14.2 5.5 8.6 4.0 32.0 0.7 - 19.8 84.6Western Sydney Infrastructure Plan 382.1 - - - - - - - 382.1
Other National Partnerships PaymentsDarwin City Deal - - - - - - - - -Geelong City Deal - 4.6 - - - - - - 4.6Interstate Road Transport(a) ~ ~ ~ ~ ~ ~ ~ ~ 6.4Launceston City Deal - Tamar River - - - - - - - - -Murray-Darling Basin regional
economic diversification program 12.6 3.2 1.9 - - - - - 17.6Supporting drought-affected communities
program 46.1 5.1 25.0 - 17.0 - - - 93.2Townsville City Deal - - 5.0 - - - - - 5.0Western Sydney City Deal 7.8 - - - - - - - 7.8WiFi and mobile coverage on trains 8.0 - - - - - - - 8.0
Total 2,035.8 888.0 1,683.9 792.0 643.8 124.6 56.9 217.5 6,448.8 (a) The scheme ceased on 30 June 2018 with residual amounts continuing until 30 September 2018.
20
Mid-Year Econom
ic and Fiscal Outlook 2018-19
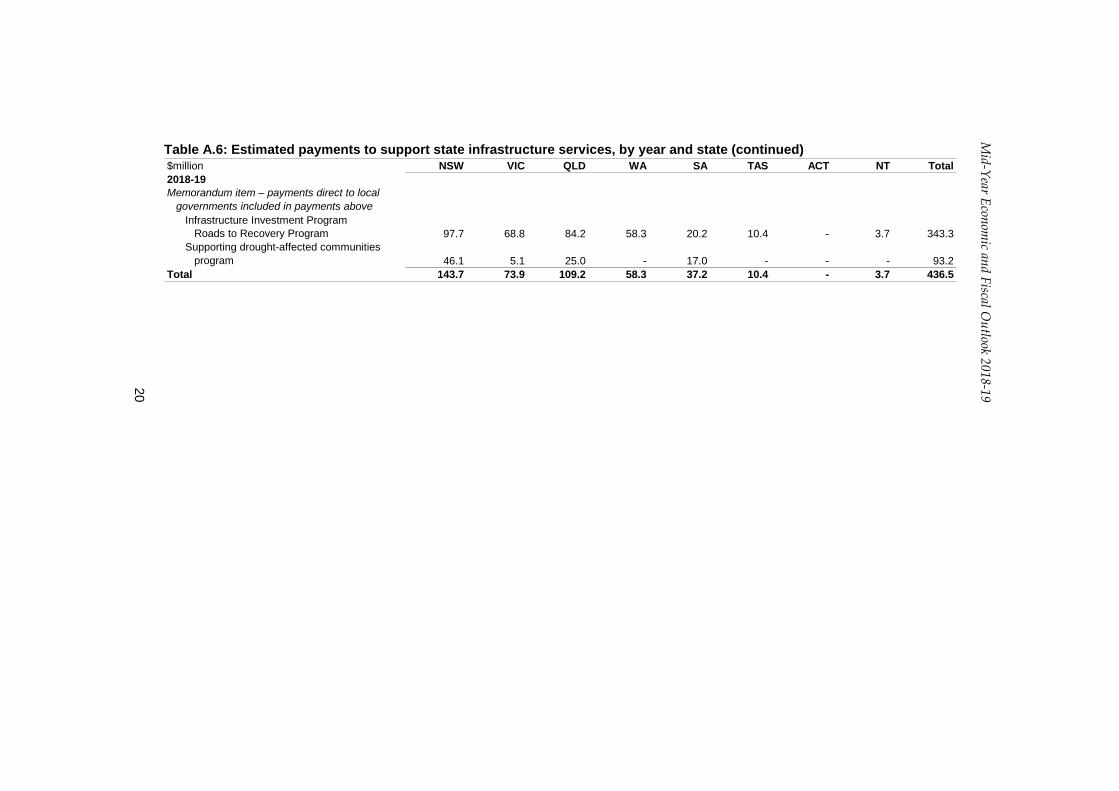
Table A.6: Estimated payments to support state infrastructure services, by year and state (continued) $million NSW VIC QLD WA SA TAS ACT NT Total2018-19Memorandum item – payments direct to local
governments included in payments aboveInfrastructure Investment Program
Roads to Recovery Program 97.7 68.8 84.2 58.3 20.2 10.4 - 3.7 343.3Supporting drought-affected communities
program 46.1 5.1 25.0 - 17.0 - - - 93.2Total 143.7 73.9 109.2 58.3 37.2 10.4 - 3.7 436.5

Mid-Year Econom
ic and Fiscal Outlook 2018-19
21
Table A.6: Estimated payments to support state infrastructure services, by year and state (continued) $million NSW VIC QLD WA SA TAS ACT NT Total2019-20National Partnership payments
Infrastructure Investment ProgramBlack spot projects 19.6 17.0 14.5 8.3 5.1 2.8 1.0 1.8 70.0Bridges Renewal Program 30.7 11.0 26.1 9.4 5.8 3.6 1.1 8.6 96.3Developing Northern Australia
Improving cattle supply chains - - 21.1 6.2 - - - 15.6 42.9Northern Australia Roads - - 92.8 40.5 - - - 69.9 203.2
Heavy Vehicle Safety and ProductivityProgram 30.1 11.1 13.4 7.9 2.2 0.7 0.5 4.1 70.0
Major Business Cases - - 10.0 5.0 - - - - 15.0National Rail Program 15.0 30.0 40.0 150.0 95.0 - - - 330.0Rail Investment component - 395.1 - 44.4 7.6 15.0 - - 462.0Road Investment component 674.9 202.7 1,111.9 506.4 371.9 49.3 6.0 55.6 2,978.8Roads of Strategic Importance 14.3 - 21.6 47.4 - 13.0 0.7 1.0 98.0Roads to Recovery Program 111.5 81.4 81.4 58.5 35.9 13.0 6.4 11.6 399.7Urban Congestion Fund 102.5 83.5 64.0 33.0 21.9 6.6 5.4 3.1 320.0
Infrastructure Growth PackageAsset Recycling Initiative - - - - - - - - -New Investments 37.0 1.5 - - 29.7 - - 1.0 69.2Western Sydney Infrastructure Plan 492.6 - - - - - - - 492.6
Other National Partnerships PaymentsDarwin City Deal - - - - - - - 2.3 2.3Geelong City Deal - 26.5 - - - - - - 26.5Interstate Road Transport - - - - - - - - -Launceston City Deal - Tamar River - - - - - 8.8 - - 8.8Murray-Darling Basin regional
economic diversification program - - - - - - - - -Supporting drought-affected communities
program - - - - - - - - -Townsville City Deal - - 55.0 - - - - - 55.0Western Sydney City Deal 32.3 - - - - - - - 32.3WiFi and mobile coverage on trains 2.0 - - - - - - - 2.0
Total 1,562.4 859.8 1,551.7 916.9 575.2 112.8 21.1 174.7 5,774.6

22
Mid-Year Econom
ic and Fiscal Outlook 2018-19
Table A.6: Estimated payments to support state infrastructure services, by year and state (continued) $million NSW VIC QLD WA SA TAS ACT NT Total2019-20Memorandum item – payments direct to local
governments included in payments aboveInfrastructure Investment Program
Roads to Recovery Program 110.6 81.4 81.4 58.5 27.6 13.0 - 6.4 378.8Supporting drought-affected communities
program - - - - - - - - -Total 110.6 81.4 81.4 58.5 27.6 13.0 - 6.4 378.8
Mid-Year Econom
ic and Fiscal Outlook 2018-19
23
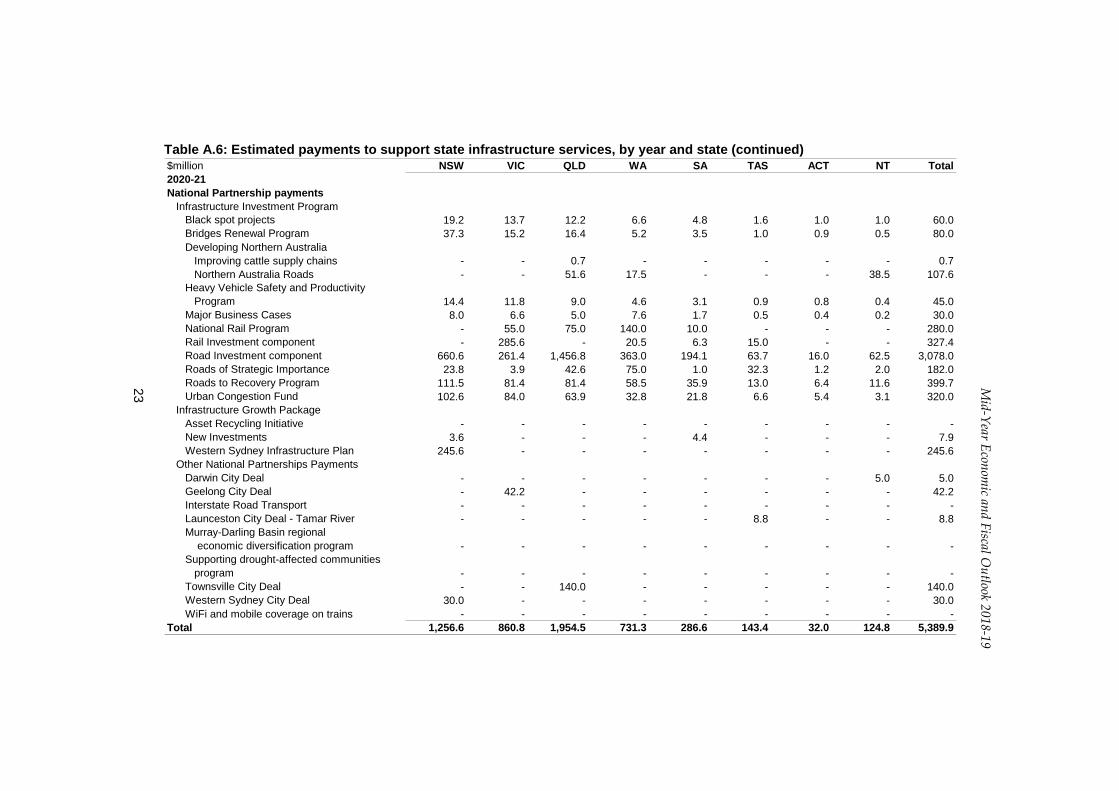
Table A.6: Estimated payments to support state infrastructure services, by year and state (continued) $million NSW VIC QLD WA SA TAS ACT NT Total2020-21National Partnership payments
Infrastructure Investment ProgramBlack spot projects 19.2 13.7 12.2 6.6 4.8 1.6 1.0 1.0 60.0Bridges Renewal Program 37.3 15.2 16.4 5.2 3.5 1.0 0.9 0.5 80.0Developing Northern Australia
Improving cattle supply chains - - 0.7 - - - - - 0.7Northern Australia Roads - - 51.6 17.5 - - - 38.5 107.6
Heavy Vehicle Safety and ProductivityProgram 14.4 11.8 9.0 4.6 3.1 0.9 0.8 0.4 45.0
Major Business Cases 8.0 6.6 5.0 7.6 1.7 0.5 0.4 0.2 30.0National Rail Program - 55.0 75.0 140.0 10.0 - - - 280.0Rail Investment component - 285.6 - 20.5 6.3 15.0 - - 327.4Road Investment component 660.6 261.4 1,456.8 363.0 194.1 63.7 16.0 62.5 3,078.0Roads of Strategic Importance 23.8 3.9 42.6 75.0 1.0 32.3 1.2 2.0 182.0Roads to Recovery Program 111.5 81.4 81.4 58.5 35.9 13.0 6.4 11.6 399.7Urban Congestion Fund 102.6 84.0 63.9 32.8 21.8 6.6 5.4 3.1 320.0
Infrastructure Growth PackageAsset Recycling Initiative - - - - - - - - -New Investments 3.6 - - - 4.4 - - - 7.9Western Sydney Infrastructure Plan 245.6 - - - - - - - 245.6
Other National Partnerships PaymentsDarwin City Deal - - - - - - - 5.0 5.0Geelong City Deal - 42.2 - - - - - - 42.2Interstate Road Transport - - - - - - - - -Launceston City Deal - Tamar River - - - - - 8.8 - - 8.8Murray-Darling Basin regional
economic diversification program - - - - - - - - -Supporting drought-affected communities
program - - - - - - - - -Townsville City Deal - - 140.0 - - - - - 140.0Western Sydney City Deal 30.0 - - - - - - - 30.0WiFi and mobile coverage on trains - - - - - - - - -
Total 1,256.6 860.8 1,954.5 731.3 286.6 143.4 32.0 124.8 5,389.9
24
Mid-Year Econom
ic and Fiscal Outlook 2018-19
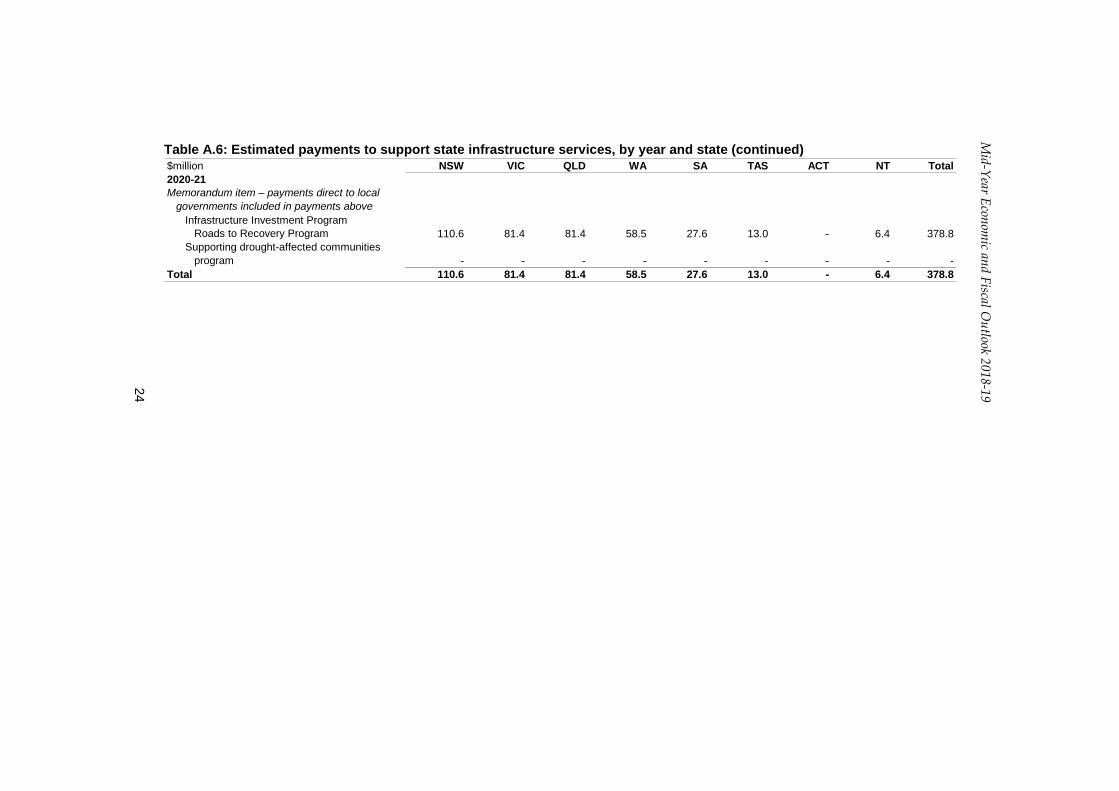
Table A.6: Estimated payments to support state infrastructure services, by year and state (continued) $million NSW VIC QLD WA SA TAS ACT NT Total2020-21Memorandum item – payments direct to local
governments included in payments aboveInfrastructure Investment Program
Roads to Recovery Program 110.6 81.4 81.4 58.5 27.6 13.0 - 6.4 378.8Supporting drought-affected communities
program - - - - - - - - -Total 110.6 81.4 81.4 58.5 27.6 13.0 - 6.4 378.8
Mid-Year Econom
ic and Fiscal Outlook 2018-19
25
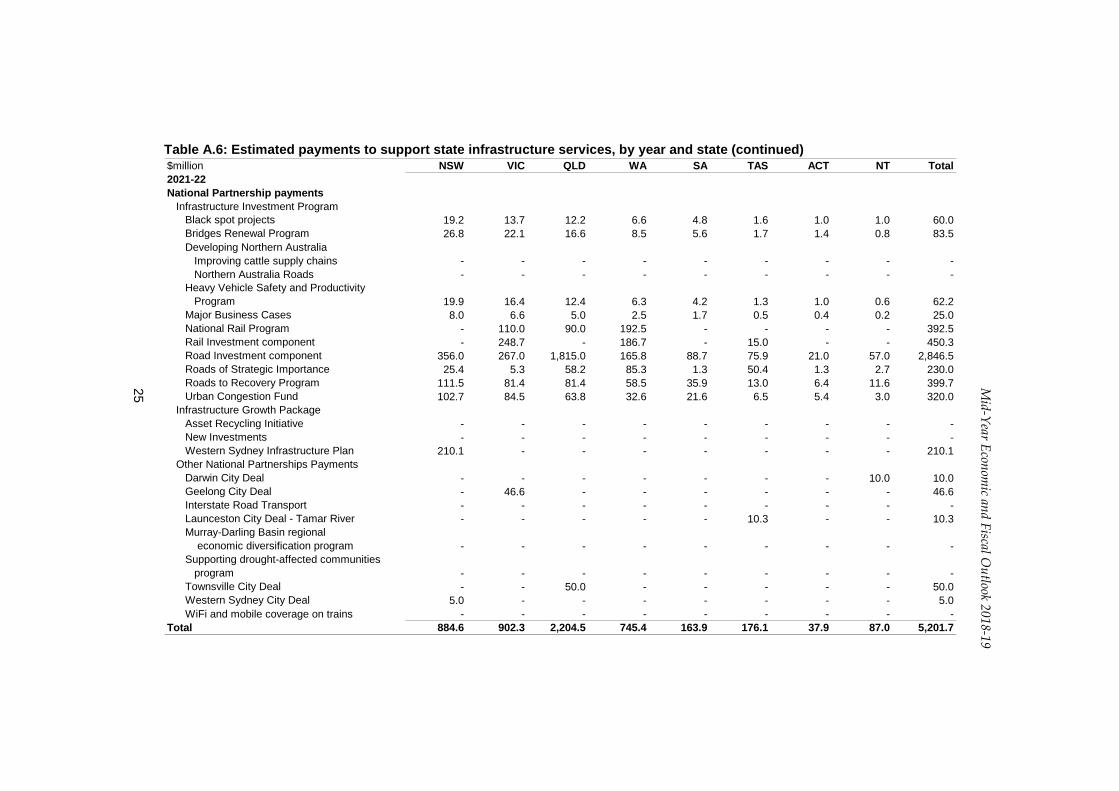
Table A.6: Estimated payments to support state infrastructure services, by year and state (continued) $million NSW VIC QLD WA SA TAS ACT NT Total2021-22National Partnership payments
Infrastructure Investment ProgramBlack spot projects 19.2 13.7 12.2 6.6 4.8 1.6 1.0 1.0 60.0Bridges Renewal Program 26.8 22.1 16.6 8.5 5.6 1.7 1.4 0.8 83.5Developing Northern Australia
Improving cattle supply chains - - - - - - - - -Northern Australia Roads - - - - - - - - -
Heavy Vehicle Safety and ProductivityProgram 19.9 16.4 12.4 6.3 4.2 1.3 1.0 0.6 62.2
Major Business Cases 8.0 6.6 5.0 2.5 1.7 0.5 0.4 0.2 25.0National Rail Program - 110.0 90.0 192.5 - - - - 392.5Rail Investment component - 248.7 - 186.7 - 15.0 - - 450.3Road Investment component 356.0 267.0 1,815.0 165.8 88.7 75.9 21.0 57.0 2,846.5Roads of Strategic Importance 25.4 5.3 58.2 85.3 1.3 50.4 1.3 2.7 230.0Roads to Recovery Program 111.5 81.4 81.4 58.5 35.9 13.0 6.4 11.6 399.7Urban Congestion Fund 102.7 84.5 63.8 32.6 21.6 6.5 5.4 3.0 320.0
Infrastructure Growth PackageAsset Recycling Initiative - - - - - - - - -New Investments - - - - - - - - -Western Sydney Infrastructure Plan 210.1 - - - - - - - 210.1
Other National Partnerships PaymentsDarwin City Deal - - - - - - - 10.0 10.0Geelong City Deal - 46.6 - - - - - - 46.6Interstate Road Transport - - - - - - - - -Launceston City Deal - Tamar River - - - - - 10.3 - - 10.3Murray-Darling Basin regional
economic diversification program - - - - - - - - -Supporting drought-affected communities
program - - - - - - - - -Townsville City Deal - - 50.0 - - - - - 50.0Western Sydney City Deal 5.0 - - - - - - - 5.0WiFi and mobile coverage on trains - - - - - - - - -
Total 884.6 902.3 2,204.5 745.4 163.9 176.1 37.9 87.0 5,201.7

26
Mid-Year Econom
ic and Fiscal Outlook 2018-19
Table A.6: Estimated payments to support state infrastructure services, by year and state (continued) $million NSW VIC QLD WA SA TAS ACT NT Total2021-22Memorandum item – payments direct to local
governments included in payments aboveInfrastructure Investment Program
Roads to Recovery Program 110.6 81.4 81.4 58.5 27.6 13.0 - 6.4 378.8Supporting drought-affected communities
program - - - - - - - - -Total 110.6 81.4 81.4 58.5 27.6 13.0 - 6.4 378.8

Mid-Year Econom
ic and Fiscal Outlook 2018-19
27
Table A.7: Estimated payments to support state environment services, by year and state $million NSW VIC QLD WA SA TAS ACT NT Total2018-19National Partnership payments
Assistance for pest animal and weedmanagement in drought-affected areas 0.5 - 1.0 0.3 0.3 - - - 2.0
Development of Business Cases forConstraints Measures and
Implementation(a) ~ ~ ~ ~ ~ ~ ~ ~ 10.0Environmental management of the former
Rum Jungle Mine site - - - - - - - 7.8 7.8Great Artesian Basin Sustainability Initiative - - 2.5 - - - - - 2.5Hydrogen Energy Supply Chain Pilot Project - 10.0 - - - - - - 10.0Implementation of the National Insurance
Affordability Initiative - - 5.0 - - - - - 5.0Implementing water reform in the
Murray-Darling Basin 9.4 6.8 2.0 - 1.5 - 0.3 - 20.0Management of Established Pest and Weeds 1.1 1.6 2.0 1.0 0.8 0.2 .. 0.5 7.2Mechanical fuel load reduction trials 0.5 - - - - - - - 0.5National fire danger rating system - - - - 0.2 - - - 0.2National Forestry Industry Plan - - - - - - - - -

28
Mid-Year Econom
ic and Fiscal Outlook 2018-19
Table A.7: Estimated payments to support state environment services, by year and state (continued) $million NSW VIC QLD WA SA TAS ACT NT Total2018-19
Natural disaster resilience 6.8 - - 6.3 2.1 - - - 15.1On-farm emergency water infrastructure
rebate(a) ~ ~ ~ ~ ~ ~ ~ ~ 19.9Pest and disease preparedness and
response programs 0.4 0.8 46.0 2.4 0.1 - - 8.1 57.8Prepared communities(a) ~ ~ ~ ~ ~ ~ ~ ~ 5.0Preparing Australia package 7.4 2.0 - - - - - - 9.4South Australian River Murray Sustainability
ProgramIrrigation efficiency and water purchase - - - - 24.0 - - - 24.0Irrigation industry assistance - - - - 7.5 - - - 7.5
Sustainable Rural Water Use andInfrastructure Program 93.9 123.8 13.7 - 39.5 21.2 17.2 - 309.3
Water Infrastructure Development FundFeasibility studies(a) ~ ~ ~ ~ ~ ~ ~ ~ 22.9Capital component(a) ~ ~ ~ ~ ~ ~ ~ ~ 90.1
World Heritage Sites 0.8 - 3.1 0.4 0.1 5.1 - - 9.5Total(b) 120.7 145.0 75.2 10.3 76.1 26.5 17.5 16.5 635.6 (a) State allocations are yet to be finalised. (b) State allocations for a number of programs are not yet finalised, therefore total payments may not equal the sum of state totals.

Mid-Year Econom
ic and Fiscal Outlook 2018-19
29
Table A.7: Estimated payments to support state environment services, by year and state (continued) $million NSW VIC QLD WA SA TAS ACT NT Total2019-20National Partnership payments
Assistance for pest animal and weedmanagement in drought-affected areas - - - - - - - - -
Development of Business Cases forConstraints Measures and
Implementation(a) ~ ~ ~ ~ ~ ~ ~ ~ 20.0Environmental management of the former
Rum Jungle Mine site - - - - - - - - -Great Artesian Basin Sustainability Initiative(a) ~ ~ 4.0 ~ ~ ~ ~ ~ 10.0Hydrogen Energy Supply Chain Pilot Project - 17.5 - - - - - - 17.5Implementation of the National Insurance
Affordability Initiative - - - - - - - - -Implementing water reform in the
Murray-Darling Basin 9.4 6.8 2.0 - 1.5 - 0.3 - 20.0Management of Established Pest and Weeds - - - - - - - - -Mechanical fuel load reduction trials - - - - - - - - -National fire danger rating system - - - - - - - - -National Forestry Industry Plan - - - - - - - - -

30
Mid-Year Econom
ic and Fiscal Outlook 2018-19
Table A.7: Estimated payments to support state environment services, by year and state (continued) $million NSW VIC QLD WA SA TAS ACT NT Total2019-20
Natural disaster resilience - - - - - - - - -On-farm emergency water infrastructure
rebate(a) ~ ~ ~ ~ ~ ~ ~ ~ 19.7Pest and disease preparedness and
response programs 0.3 0.4 28.8 1.0 0.1 - - 1.0 31.5Prepared communities - - - - - - - - -Preparing Australia package - - - - - - - - -South Australian River Murray Sustainability
ProgramIrrigation efficiency and water purchase - - - - - - - - -Irrigation industry assistance - - - - - - - - -
Sustainable Rural Water Use andInfrastructure Program 37.7 28.6 - - 9.0 - - - 75.3
Water Infrastructure Development FundFeasibility studies(a) ~ ~ ~ ~ ~ ~ ~ ~ 15.2Capital component(a) ~ ~ ~ ~ ~ ~ ~ ~ 148.4
World Heritage Sites 0.8 - 3.1 0.4 0.1 5.1 - - 9.5Total(b) 48.1 53.3 37.8 1.4 10.7 5.1 0.3 1.0 367.1 (a) State allocations are yet to be finalised. (b) State allocations for a number of programs are not yet finalised, therefore total payments may not equal the sum of state totals.

Mid-Year Econom
ic and Fiscal Outlook 2018-19
31
Table A.7: Estimated payments to support state environment services, by year and state (continued) $million NSW VIC QLD WA SA TAS ACT NT Total2020-21National Partnership payments
Assistance for pest animal and weedmanagement in drought-affected areas - - - - - - - - -
Development of Business Cases forConstraints Measures and
Implementation(a) ~ ~ ~ ~ ~ ~ ~ ~ 40.0Environmental management of the former
Rum Jungle Mine site - - - - - - - - -Great Artesian Basin Sustainability Initiative(a) ~ ~ ~ ~ ~ ~ ~ ~ 6.0Hydrogen Energy Supply Chain Pilot Project - 12.5 - - - - - - 12.5Implementation of the National Insurance
Affordability Initiative - - - - - - - - -Implementing water reform in the
Murray-Darling Basin - - - - - - - - -Management of Established Pest and Weeds - - - - - - - - -Mechanical fuel load reduction trials - - - - - - - - -National fire danger rating system - - - - - - - - -National Forestry Industry Plan(a) ~ ~ ~ ~ ~ ~ ~ ~ 1.8

32
Mid-Year Econom
ic and Fiscal Outlook 2018-19
Table A.7: Estimated payments to support state environment services, by year and state (continued) $million NSW VIC QLD WA SA TAS ACT NT Total2020-21
Natural disaster resilience - - - - - - - - -On-farm emergency water infrastructure
rebate(a) ~ ~ ~ ~ ~ ~ ~ ~ 9.7Pest and disease preparedness and
response programs 0.3 0.4 29.6 1.0 0.1 - - 1.0 32.4Prepared communities - - - - - - - - -Preparing Australia package - - - - - - - - -South Australian River Murray Sustainability
ProgramIrrigation efficiency and water purchase - - - - - - - - -Irrigation industry assistance - - - - - - - - -
Sustainable Rural Water Use andInfrastructure Program 41.7 37.3 9.4 - 3.5 - - - 91.9
Water Infrastructure Development FundFeasibility studies(a) ~ ~ ~ ~ ~ ~ ~ ~ 10.0Capital component(a) ~ ~ ~ ~ ~ ~ ~ ~ 150.0
World Heritage Sites 0.8 - 3.1 0.4 0.1 5.1 - - 9.5Total(b) 42.8 50.2 42.1 1.4 3.7 5.1 - 1.0 363.8 (a) State allocations are yet to be finalised. (b) State allocations for a number of programs are not yet finalised, therefore total payments may not equal the sum of state totals.
Mid-Year Econom
ic and Fiscal Outlook 2018-19
33
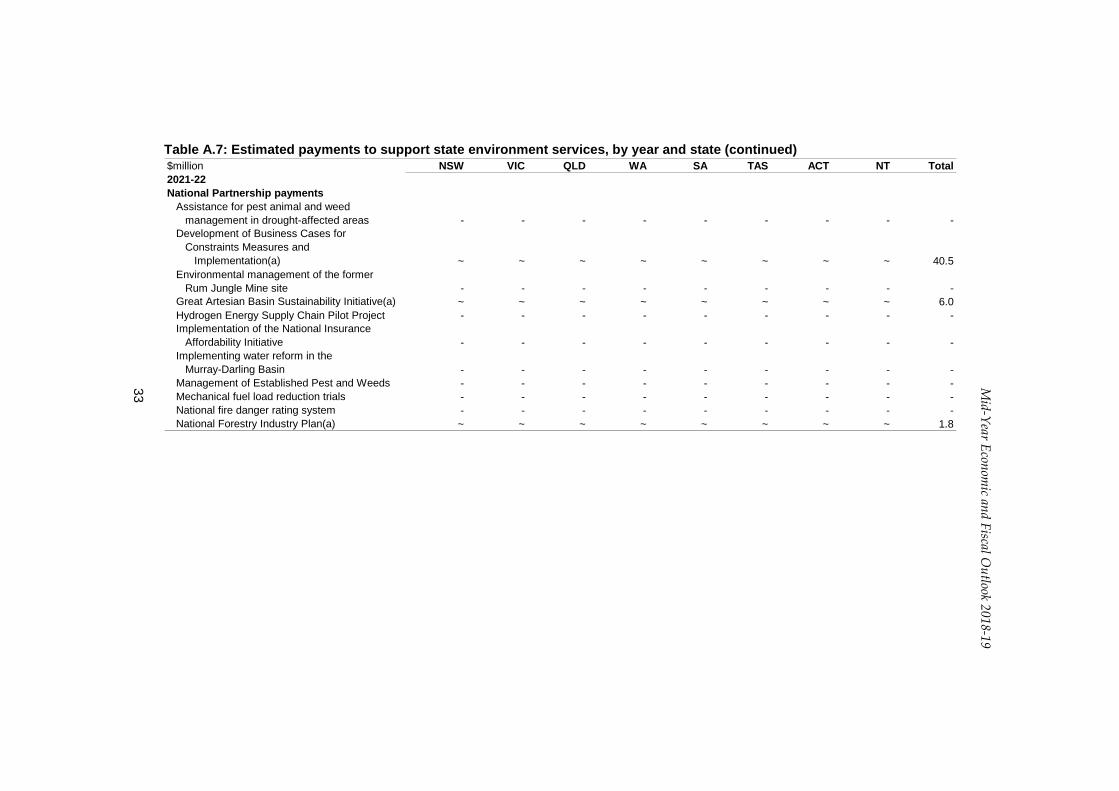
Table A.7: Estimated payments to support state environment services, by year and state (continued) $million NSW VIC QLD WA SA TAS ACT NT Total2021-22National Partnership payments
Assistance for pest animal and weedmanagement in drought-affected areas - - - - - - - - -
Development of Business Cases forConstraints Measures and
Implementation(a) ~ ~ ~ ~ ~ ~ ~ ~ 40.5Environmental management of the former
Rum Jungle Mine site - - - - - - - - -Great Artesian Basin Sustainability Initiative(a) ~ ~ ~ ~ ~ ~ ~ ~ 6.0Hydrogen Energy Supply Chain Pilot Project - - - - - - - - -Implementation of the National Insurance
Affordability Initiative - - - - - - - - -Implementing water reform in the
Murray-Darling Basin - - - - - - - - -Management of Established Pest and Weeds - - - - - - - - -Mechanical fuel load reduction trials - - - - - - - - -National fire danger rating system - - - - - - - - -National Forestry Industry Plan(a) ~ ~ ~ ~ ~ ~ ~ ~ 1.8

34
Mid-Year Econom
ic and Fiscal Outlook 2018-19
Table A.7: Estimated payments to support state environment services, by year and state (continued) $million NSW VIC QLD WA SA TAS ACT NT Total2021-22
Natural disaster resilience - - - - - - - - -On-farm emergency water infrastructure
rebate - - - - - - - - -Pest and disease preparedness and
response programs 0.3 0.4 32.0 1.0 0.1 - - 1.0 34.8Prepared communities - - - - - - - - -Preparing Australia package - - - - - - - - -South Australian River Murray Sustainability
ProgramIrrigation efficiency and water purchase - - - - - - - - -Irrigation industry assistance - - - - - - - - -
Sustainable Rural Water Use andInfrastructure Program 35.0 4.1 - - 0.8 - - - 40.0
Water Infrastructure Development FundFeasibility studies(a) ~ ~ ~ ~ ~ ~ ~ ~ 5.0Capital component(a) ~ ~ ~ ~ ~ ~ ~ ~ 185.0
World Heritage Sites 0.8 - 3.1 0.4 0.1 5.1 - - 9.5Total(b) 36.1 4.5 35.1 1.4 1.0 5.1 - 1.0 322.5 (a) State allocations are yet to be finalised. (b) State allocations for a number of programs are not yet finalised, therefore total payments may not equal the sum of state totals.

Mid-Year Econom
ic and Fiscal Outlook 2018-19
35
Table A.8: Estimated contingent payments to the states, by year and state $million NSW VIC QLD WA SA TAS ACT NT Total2018-19National Partnership payments
Hepatitis C settlement fund 0.2 - - - - - - - 0.2Natural Disaster Relief and Recovery
Arrangements(a) 0.6 1.9 145.1 3.4 0.1 0.6 - 1.3 153.0Total 0.7 1.9 145.1 3.4 0.1 0.6 - 1.3 153.22019-20National Partnership payments
Hepatitis C settlement fund 0.2 - - - - - - - 0.2Natural Disaster Relief and Recovery
Arrangements(a) .. 0.2 10.6 1.5 .. 0.1 - 0.6 12.9Total 0.2 0.2 10.6 1.5 .. 0.1 - 0.6 13.12020-21National Partnership payments
Hepatitis C settlement fund 0.2 - - - - - - - 0.2Natural Disaster Relief and Recovery
Arrangements(a) - .. 2.7 - - - - - 2.8Total 0.2 .. 2.7 - - - - - 2.92021-22National Partnership payments
Hepatitis C settlement fund 0.2 - - - - - - - 0.2Natural Disaster Relief and Recovery
Arrangements(a) - - - - - - - - -Total 0.2 - - - - - - - 0.2 (a) Figures reflect estimated expense outcomes. Estimated cash outcomes are presented in Table 3.28 in Attachment D.

36
Mid-Year Econom
ic and Fiscal Outlook 2018-19
Table A.9: Estimated payments to support other state services, by year and state $million NSW VIC QLD WA SA TAS ACT NT Total2018-19National Partnership payments
Financial assistance to local governments- Financial assistance grant program 381.7 297.5 241.4 146.7 80.1 38.0 26.3 17.3 1,229.0
Financial assistance forpolice officers 2.9 - - - - - - - 2.9
Legal assistance services 78.8 61.1 53.3 31.3 20.3 7.5 6.0 7.5 265.9North Queensland stadium - - 50.0 - - - - - 50.0North Queensland strata title inspection
scheme - - 3.5 - - - - - 3.5Provision of fire services 4.8 3.4 3.3 1.5 1.2 0.3 5.2 2.2 21.8Sinking fund on state debt .. - - - - - - - ..Small business regulatory reform(a) ~ ~ ~ ~ ~ ~ ~ ~ 129.4South Sydney Rabbitohs' centre of excellence 6.0 - - - - - - - 6.0Supplementary funding to South Australia
for local roads - - - - 20.0 - - - 20.0Total(b) 474.3 362.0 351.5 179.6 121.6 45.8 37.5 26.9 1,728.5 (a) State allocations are yet to be finalised. (b) State allocations for a number of programs are not yet finalised, therefore total payments may not equal the sum of state totals.
Mid-Year Econom
ic and Fiscal Outlook 2018-19
37
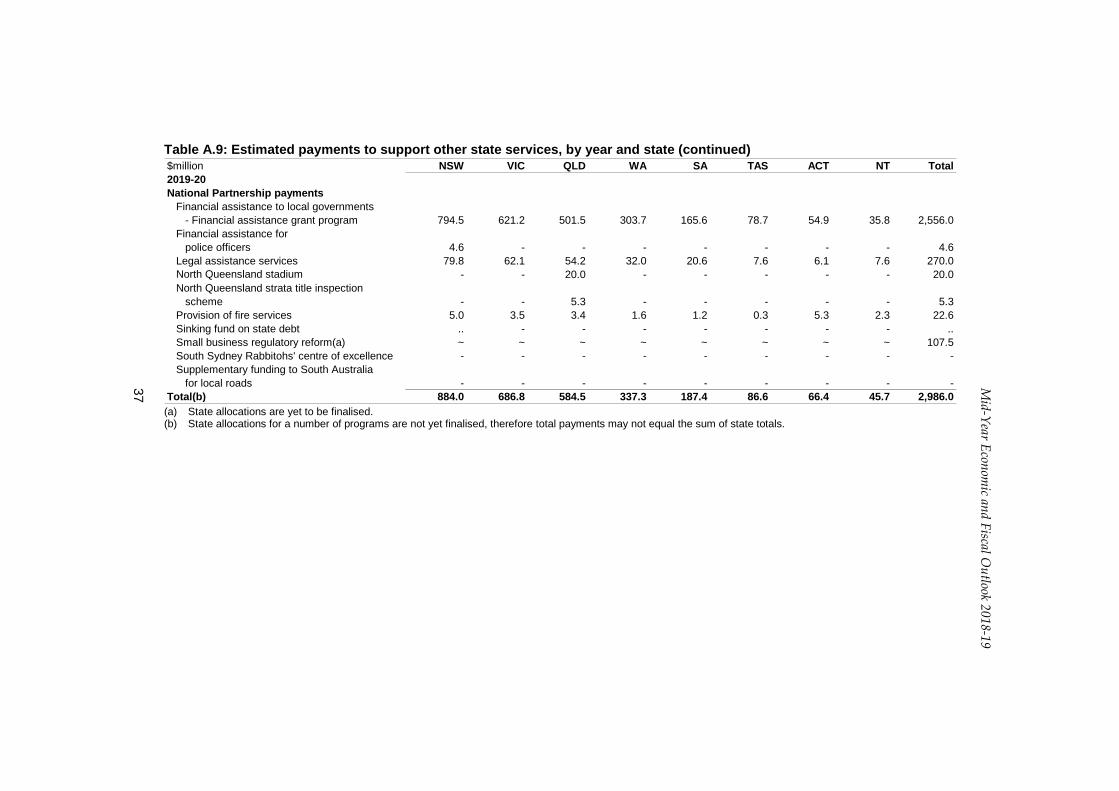
Table A.9: Estimated payments to support other state services, by year and state (continued) $million NSW VIC QLD WA SA TAS ACT NT Total2019-20National Partnership payments
Financial assistance to local governments- Financial assistance grant program 794.5 621.2 501.5 303.7 165.6 78.7 54.9 35.8 2,556.0
Financial assistance forpolice officers 4.6 - - - - - - - 4.6
Legal assistance services 79.8 62.1 54.2 32.0 20.6 7.6 6.1 7.6 270.0North Queensland stadium - - 20.0 - - - - - 20.0North Queensland strata title inspection
scheme - - 5.3 - - - - - 5.3Provision of fire services 5.0 3.5 3.4 1.6 1.2 0.3 5.3 2.3 22.6Sinking fund on state debt .. - - - - - - - ..Small business regulatory reform(a) ~ ~ ~ ~ ~ ~ ~ ~ 107.5South Sydney Rabbitohs' centre of excellence - - - - - - - - -Supplementary funding to South Australia
for local roads - - - - - - - - -Total(b) 884.0 686.8 584.5 337.3 187.4 86.6 66.4 45.7 2,986.0 (a) State allocations are yet to be finalised. (b) State allocations for a number of programs are not yet finalised, therefore total payments may not equal the sum of state totals.

38
Mid-Year Econom
ic and Fiscal Outlook 2018-19
Table A.9: Estimated payments to support other state services, by year and state (continued) $million NSW VIC QLD WA SA TAS ACT NT Total2020-21National Partnership payments
Financial assistance to local governments- Financial assistance grant program 827.4 649.5 521.4 314.9 171.2 81.5 57.1 37.0 2,660.1
Financial assistance forpolice officers 5.1 - - - - - - - 5.1
Legal assistance services nfp nfp nfp nfp nfp nfp nfp nfp nfpNorth Queensland stadium - - - - - - - - -North Queensland strata title inspection
scheme - - 2.9 - - - - - 2.9Provision of fire services 5.2 3.6 3.5 1.6 1.2 0.3 5.5 2.3 23.3Sinking fund on state debt .. - - - - - - - ..Small business regulatory reform(a) ~ ~ ~ ~ ~ ~ ~ ~ 63.2South Sydney Rabbitohs' centre of excellence - - - - - - - - -Supplementary funding to South Australia
for local roads - - - - - - - - -Total(b) 837.6 653.1 527.8 316.5 172.5 81.8 62.6 39.4 2,754.5 (a) State allocations are yet to be finalised. (b) State allocations for a number of programs are not yet finalised, therefore total payments may not equal the sum of state totals.
Mid-Year Econom
ic and Fiscal Outlook 2018-19
39
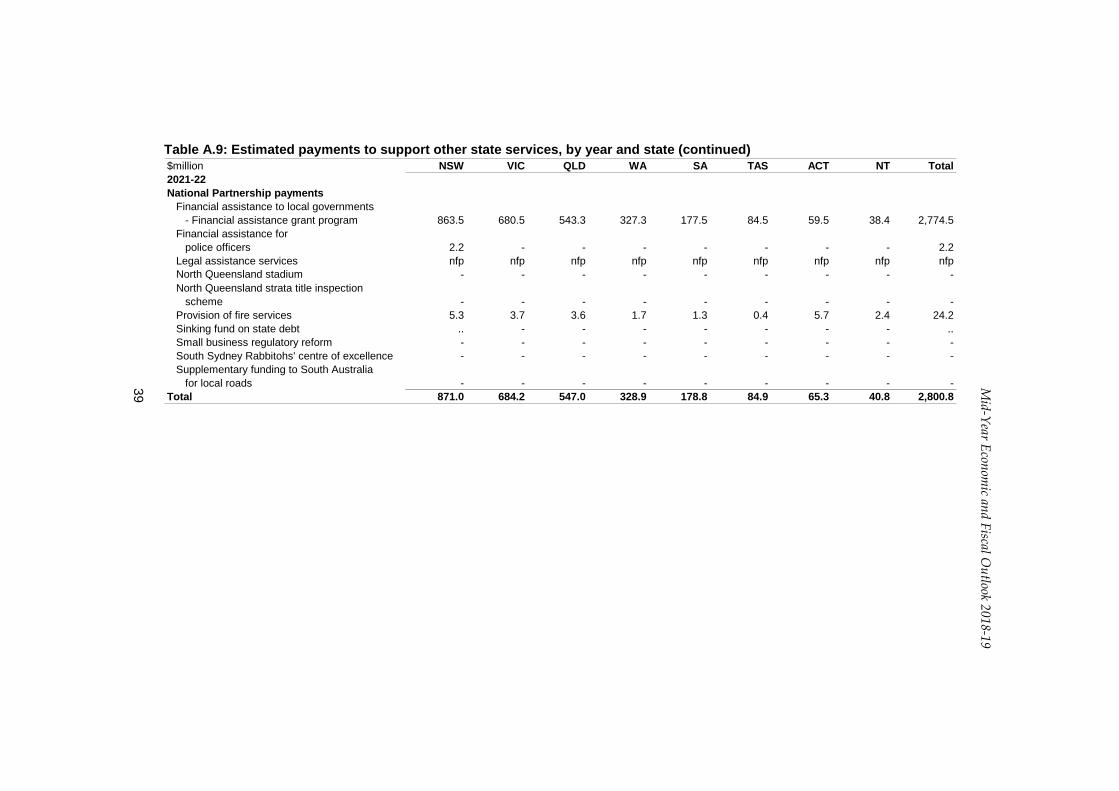
Table A.9: Estimated payments to support other state services, by year and state (continued) $million NSW VIC QLD WA SA TAS ACT NT Total2021-22National Partnership payments
Financial assistance to local governments- Financial assistance grant program 863.5 680.5 543.3 327.3 177.5 84.5 59.5 38.4 2,774.5
Financial assistance forpolice officers 2.2 - - - - - - - 2.2
Legal assistance services nfp nfp nfp nfp nfp nfp nfp nfp nfpNorth Queensland stadium - - - - - - - - -North Queensland strata title inspection
scheme - - - - - - - - -Provision of fire services 5.3 3.7 3.6 1.7 1.3 0.4 5.7 2.4 24.2Sinking fund on state debt .. - - - - - - - ..Small business regulatory reform - - - - - - - - -South Sydney Rabbitohs' centre of excellence - - - - - - - - -Supplementary funding to South Australia
for local roads - - - - - - - - -Total 871.0 684.2 547.0 328.9 178.8 84.9 65.3 40.8 2,800.8

40
Mid-Year Econom
ic and Fiscal Outlook 2018-19
Table A.10: GST and general revenue assistance payments to the states, by year and state
$million NSW VIC QLD WA SA TAS ACT NT Total2018-19GST entitlement 18,256.7 17,073.5 14,630.2 3,271.1 6,814.9 2,469.0 1,322.4 2,792.1 66,630.0Other payments
ACT municipal services - - - - - - 40.1 - 40.1Compensation for reduced royalties - - - 38.2 - - - - 38.2Royalty payments(a) - - - nfp - - - nfp 920.1Snowy Hydro Limited tax compensation 50.0 25.0 - - - - - - 75.0Transitional GST top-up payments - - - - - - - - -
Total(b) 18,306.7 17,098.5 14,630.2 3,309.3 6,814.9 2,469.0 1,362.5 2,792.1 67,703.52019-20GST entitlement(c) ~ ~ ~ ~ ~ ~ ~ ~ 69,010.0Other payments
ACT municipal services - - - - - - 40.7 - 40.7Compensation for reduced royalties - - - 40.8 - - - - 40.8Royalty payments(a) - - - nfp - - - nfp 838.0Snowy Hydro Limited tax compensation - - - - - - - - -Transitional GST top-up payments(d) - - - 814.2 - - - 68.6 882.8
Total(b)(e) - - - 854.9 - - 40.7 68.6 70,812.3 (a) State allocations are not published due to commercial sensitivities. (b) Total payments may not equal the sum of state totals. (c) State allocations are dependent upon the GST revenue sharing relativities for that financial year. These relativities are not forecast beyond the Budget year. (d) Estimates reflect those presented to the Parliament alongside the Treasury Laws Amendment (Making Sure Every State and Territory Gets Their Fair
Share of GST) Bill 2018. (e) State allocations reflect other general revenue assistance payments only.

Mid-Year Econom
ic and Fiscal Outlook 2018-19
41
Table A.10: GST and general revenue assistance payments to the states, by year and state (continued) $million NSW VIC QLD WA SA TAS ACT NT Total2020-21GST entitlement(c) ~ ~ ~ ~ ~ ~ ~ ~ 72,600.0Other payments
ACT municipal services - - - - - - 41.4 - 41.4Compensation for reduced royalties - - - 38.9 - - - - 38.9Royalty payments(a) - - - nfp - - - nfp 769.9Snowy Hydro Limited tax compensation - - - - - - - - -Transitional GST top-up payments(d) - - - 585.0 - - - - 585.0
Total(b)(e) - - - 623.9 - - 41.4 - 74,035.22021-22GST entitlement(c) ~ ~ ~ ~ ~ ~ ~ ~ 77,020.0Other payments
ACT municipal services - - - - - - 42.0 - 42.0Compensation for reduced royalties - - - 35.5 - - - - 35.5Royalty payments(a) - - - nfp - - - nfp 762.3Snowy Hydro Limited tax compensation - - - - - - - - -Transitional GST top-up payments(d) - - - 305.5 - - - - 305.5
Total(b)(e) - - - 340.9 - - 42.0 - 78,165.3 (a) State allocations are not published due to commercial sensitivities. (b) Total payments may not equal the sum of state totals. (c) State allocations are dependent upon the GST revenue sharing relativities for that financial year. These relativities are not forecast beyond the Budget year. (d) Estimates reflect those presented to the Parliament alongside the Treasury Laws Amendment (Making Sure Every State and Territory Gets Their Fair
Share of GST) Bill 2018. (e) State allocations reflect other general revenue assistance payments only.

42
Mid-Year Econom
ic and Fiscal Outlook 2018-19
Table A.11: Total payments to the states by GFS function $million NSW VIC QLD WA SA TAS ACT NT Total(a)2018-19General public services - - 5.0 - - - - - 5.0Public order and safety 95.8 67.1 56.5 32.6 22.0 8.7 11.6 63.7 362.9Education 6,736.4 5,424.1 4,649.1 2,169.2 1,504.4 496.0 366.2 418.1 22,058.3Health 6,688.3 5,140.6 5,160.9 2,277.5 1,367.2 460.3 421.9 302.6 21,822.5Social security and welfare 579.6 1,642.7 1,256.0 304.4 298.2 153.1 32.2 78.6 4,344.9Housing and community amenities 551.9 408.3 352.0 291.5 126.6 38.1 25.9 161.3 2,068.6Recreation and culture 6.0 - 50.0 - - - - - 56.0Fuel and energy - 10.0 - - - - - - 10.0Agriculture, forestry and fishing 105.3 133.0 67.1 3.6 73.7 21.4 17.5 8.6 460.1Mining, manufacturing and construction - - - - - - - - -Transport and communication 1,969.4 875.1 1,652.0 792.0 626.8 124.6 56.9 217.5 6,320.6Other economic affairs - - - - - 3.2 - - 132.6Other purposes(b) 18,689.0 17,398.0 15,016.7 3,459.5 6,915.1 2,507.6 1,388.8 2,810.7 69,105.5Total payments to the states 35,421.6 31,099.0 28,265.3 9,330.2 10,933.9 3,813.0 2,320.9 4,061.1 126,747.0less payments 'through' the states 3,775.1 3,196.1 2,588.2 1,276.4 913.0 265.5 230.1 180.8 12,556.2less financial assistance for
local government 381.7 297.5 241.4 146.7 100.1 38.0 26.3 17.3 1,249.0less payments direct 'to'
local government 143.7 73.9 109.2 58.3 37.2 10.4 - 3.7 436.5equals total payments 'to' the states for
own-purpose expenses 31,121.0 27,531.5 25,326.5 7,848.7 9,883.6 3,499.2 2,064.5 3,859.3 112,505.3 (a) State allocations for a number of programs are not yet finalised, therefore total payments may not equal the sum of state totals. (b) Payments for ‘Other purposes’ includes general revenue assistance to the states.
Mid-Year Econom
ic and Fiscal Outlook 2018-19
43
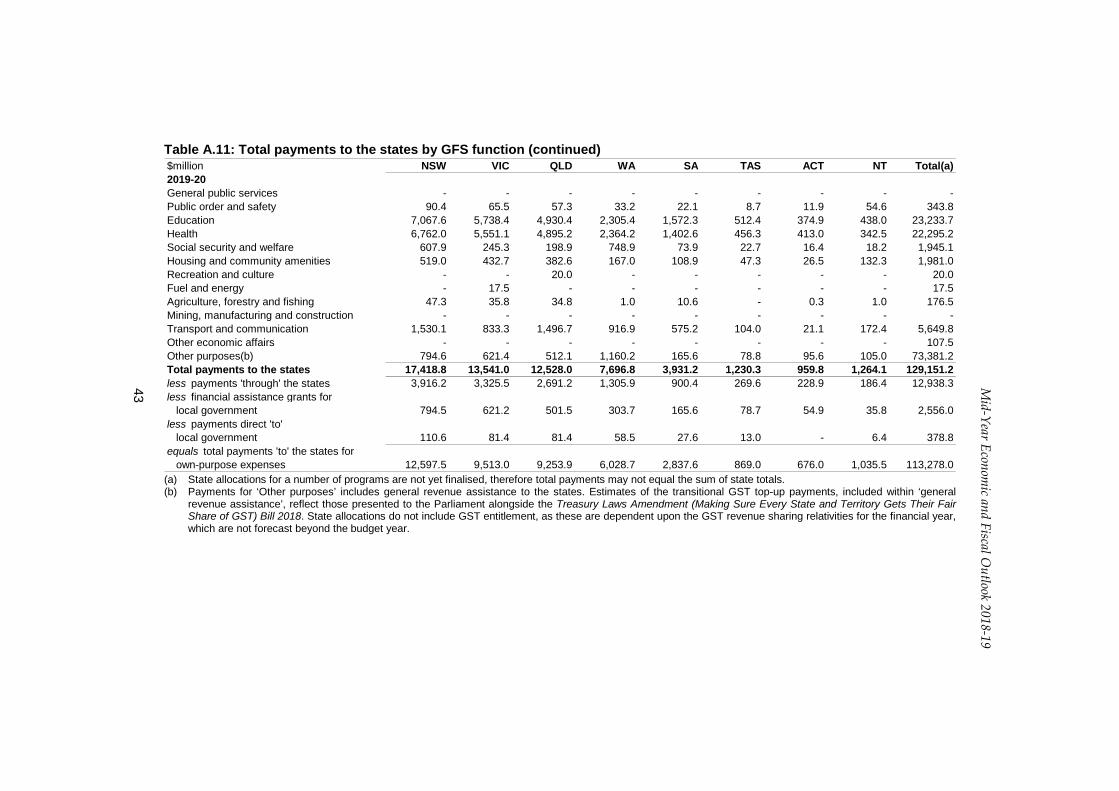
Table A.11: Total payments to the states by GFS function (continued) $million NSW VIC QLD WA SA TAS ACT NT Total(a)2019-20General public services - - - - - - - - -Public order and safety 90.4 65.5 57.3 33.2 22.1 8.7 11.9 54.6 343.8Education 7,067.6 5,738.4 4,930.4 2,305.4 1,572.3 512.4 374.9 438.0 23,233.7Health 6,762.0 5,551.1 4,895.2 2,364.2 1,402.6 456.3 413.0 342.5 22,295.2Social security and welfare 607.9 245.3 198.9 748.9 73.9 22.7 16.4 18.2 1,945.1Housing and community amenities 519.0 432.7 382.6 167.0 108.9 47.3 26.5 132.3 1,981.0Recreation and culture - - 20.0 - - - - - 20.0Fuel and energy - 17.5 - - - - - - 17.5Agriculture, forestry and fishing 47.3 35.8 34.8 1.0 10.6 - 0.3 1.0 176.5Mining, manufacturing and construction - - - - - - - - -Transport and communication 1,530.1 833.3 1,496.7 916.9 575.2 104.0 21.1 172.4 5,649.8Other economic affairs - - - - - - - - 107.5Other purposes(b) 794.6 621.4 512.1 1,160.2 165.6 78.8 95.6 105.0 73,381.2Total payments to the states 17,418.8 13,541.0 12,528.0 7,696.8 3,931.2 1,230.3 959.8 1,264.1 129,151.2less payments 'through' the states 3,916.2 3,325.5 2,691.2 1,305.9 900.4 269.6 228.9 186.4 12,938.3less financial assistance grants for
local government 794.5 621.2 501.5 303.7 165.6 78.7 54.9 35.8 2,556.0less payments direct 'to'
local government 110.6 81.4 81.4 58.5 27.6 13.0 - 6.4 378.8equals total payments 'to' the states for
own-purpose expenses 12,597.5 9,513.0 9,253.9 6,028.7 2,837.6 869.0 676.0 1,035.5 113,278.0 (a) State allocations for a number of programs are not yet finalised, therefore total payments may not equal the sum of state totals. (b) Payments for ‘Other purposes’ includes general revenue assistance to the states. Estimates of the transitional GST top-up payments, included within ‘general
revenue assistance’, reflect those presented to the Parliament alongside the Treasury Laws Amendment (Making Sure Every State and Territory Gets Their Fair Share of GST) Bill 2018. State allocations do not include GST entitlement, as these are dependent upon the GST revenue sharing relativities for the financial year, which are not forecast beyond the budget year.

44
Mid-Year Econom
ic and Fiscal Outlook 2018-19
Table A.11: Total payments to the states by GFS function (continued) $million NSW VIC QLD WA SA TAS ACT NT Total(a)2020-21General public services - - - - - - - - -Public order and safety 12.0 4.9 4.7 2.3 1.9 1.0 6.1 37.6 70.4Education 7,476.1 6,107.4 5,252.3 2,468.0 1,656.3 533.9 392.2 452.8 24,678.1Health 7,080.6 5,811.1 5,112.8 2,503.4 1,459.6 463.6 438.8 364.2 23,283.9Social security and welfare 618.0 252.5 204.3 94.4 75.9 23.3 16.8 17.3 1,317.0Housing and community amenities 525.6 459.8 471.3 170.0 110.4 47.7 27.2 135.4 2,108.5Recreation and culture - - - - - - - - -Fuel and energy - 12.5 - - - - - - 12.5Agriculture, forestry and fishing 42.0 37.7 39.0 1.0 3.6 - - 1.0 181.8Mining, manufacturing and construction - - - - - - - - -Transport and communication 1,226.6 818.6 1,814.5 731.3 286.6 134.6 32.0 119.8 5,163.9Other economic affairs - - - - - - - - 63.2Other purposes(b) 827.4 649.5 524.2 938.8 171.2 81.5 98.5 37.0 76,698.0Total payments to the states 17,808.1 14,154.1 13,423.1 6,909.3 3,765.5 1,285.5 1,011.6 1,165.1 133,577.3less payments 'through' the states 4,202.9 3,590.4 2,892.5 1,373.6 952.2 286.8 238.6 199.1 13,806.1less financial assistance grants for
local government 827.4 649.5 521.4 314.9 171.2 81.5 57.1 37.0 2,660.1less payments direct 'to'
local government 110.6 81.4 81.4 58.5 27.6 13.0 - 6.4 378.8equals total payments 'to' the states for
own-purpose expenses 12,667.3 9,832.8 9,927.8 5,162.3 2,614.5 904.2 715.8 922.6 116,732.4 (a) State allocations for a number of programs are not yet finalised, therefore total payments may not equal the sum of state totals. (b) Payments for ‘Other purposes’ includes general revenue assistance to the states. Estimates of the transitional GST top-up payments, included within ‘general
revenue assistance’, reflect those presented to the Parliament alongside the Treasury Laws Amendment (Making Sure Every State and Territory Gets Their Fair Share of GST) Bill 2018. State allocations do not include GST entitlement, as these are dependent upon the GST revenue sharing relativities for the financial year, which are not forecast beyond the budget year.

Mid-Year Econom
ic and Fiscal Outlook 2018-19
45
Table A.11: Total payments to the states by GFS function (continued) $million NSW VIC QLD WA SA TAS ACT NT Total(a)2021-22General public services - - - - - - - - -Public order and safety 9.3 5.0 4.8 2.4 1.9 1.0 6.3 39.0 69.7Education 7,891.4 6,527.0 5,547.6 2,640.0 1,747.1 556.3 412.7 470.4 26,090.8Health 7,433.8 6,078.8 5,395.8 2,651.0 1,543.1 481.3 467.8 392.3 24,443.9Social security and welfare 630.0 261.4 211.5 103.6 77.9 24.1 17.4 17.8 1,358.5Housing and community amenities 500.8 452.1 371.3 163.3 106.8 47.6 25.8 139.3 1,997.9Recreation and culture - - - - - - - - -Fuel and energy - - - - - - - - -Agriculture, forestry and fishing 35.3 4.5 32.0 1.0 0.9 - - 1.0 123.0Mining, manufacturing and construction - - - - - - - - -Transport and communication 879.6 855.7 2,154.5 745.4 163.9 165.9 37.9 77.0 5,079.8Other economic affairs - - - - - - - - -Other purposes(b) 863.5 680.5 543.3 668.2 177.5 84.5 101.5 38.4 80,939.7Total payments to the states 18,243.7 14,865.0 14,260.8 6,974.8 3,819.1 1,360.7 1,069.5 1,175.1 140,103.4less payments 'through' the states 4,406.7 3,818.6 3,038.5 1,442.5 1,019.7 300.0 245.0 211.8 14,489.0less financial assistance grants for
local government 863.5 680.5 543.3 327.3 177.5 84.5 59.5 38.4 2,774.5less payments direct 'to'
local government 110.6 81.4 81.4 58.5 27.6 13.0 - 6.4 378.8equals total payments 'to' the states for
own-purpose expenses 12,862.9 10,284.5 10,597.6 5,146.6 2,594.3 963.1 764.9 918.6 122,461.2 (a) State allocations for a number of programs are not yet finalised, therefore total payments may not equal the sum of state totals. (b) Payments for ‘Other purposes’ includes general revenue assistance to the states. Estimates of the transitional GST top-up payments, included within ‘general
revenue assistance’, reflect those presented to the Parliament alongside the Treasury Laws Amendment (Making Sure Every State and Territory Gets Their Fair Share of GST) Bill 2018. State allocations do not include GST entitlement, as these are dependent upon the GST revenue sharing relativities for the financial year, which are not forecast beyond the budget year.
46
Mid-Year Econom
ic and Fiscal Outlook 2018-19
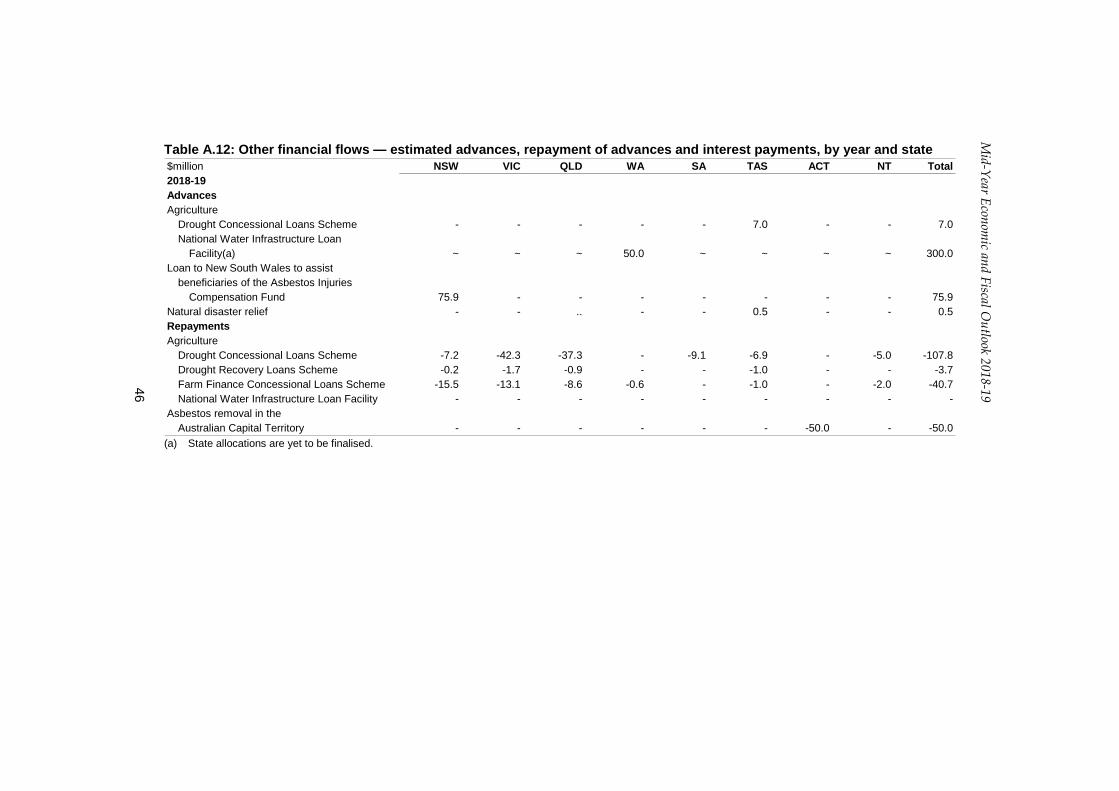
Table A.12: Other financial flows — estimated advances, repayment of advances and interest payments, by year and state $million NSW VIC QLD WA SA TAS ACT NT Total2018-19AdvancesAgriculture
Drought Concessional Loans Scheme - - - - - 7.0 - - 7.0National Water Infrastructure Loan
Facility(a) ~ ~ ~ 50.0 ~ ~ ~ ~ 300.0Loan to New South Wales to assist
beneficiaries of the Asbestos InjuriesCompensation Fund 75.9 - - - - - - - 75.9
Natural disaster relief - - .. - - 0.5 - - 0.5RepaymentsAgriculture
Drought Concessional Loans Scheme -7.2 -42.3 -37.3 - -9.1 -6.9 - -5.0 -107.8Drought Recovery Loans Scheme -0.2 -1.7 -0.9 - - -1.0 - - -3.7Farm Finance Concessional Loans Scheme -15.5 -13.1 -8.6 -0.6 - -1.0 - -2.0 -40.7National Water Infrastructure Loan Facility - - - - - - - - -
Asbestos removal in the Australian Capital Territory - - - - - - -50.0 - -50.0
(a) State allocations are yet to be finalised.
Mid-Year Econom
ic and Fiscal Outlook 2018-19
47
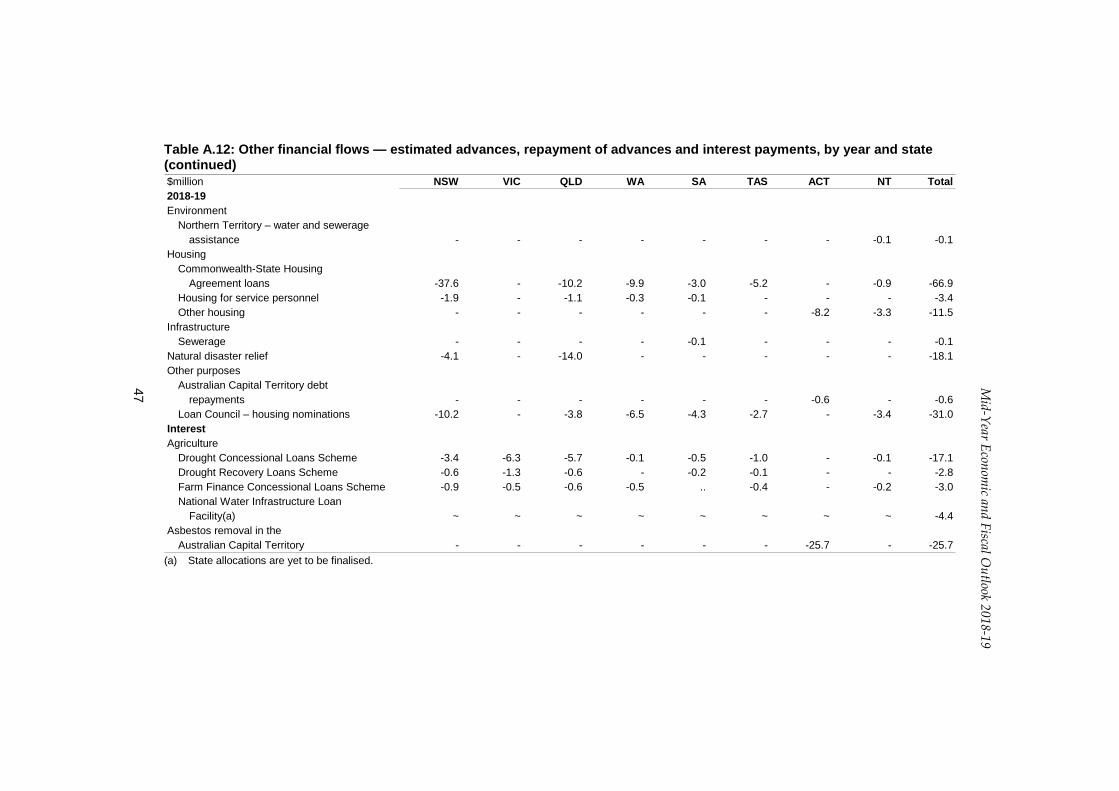
Table A.12: Other financial flows — estimated advances, repayment of advances and interest payments, by year and state (continued) $million NSW VIC QLD WA SA TAS ACT NT Total2018-19Environment
Northern Territory – water and sewerageassistance - - - - - - - -0.1 -0.1
HousingCommonwealth-State Housing
Agreement loans -37.6 - -10.2 -9.9 -3.0 -5.2 - -0.9 -66.9Housing for service personnel -1.9 - -1.1 -0.3 -0.1 - - - -3.4Other housing - - - - - - -8.2 -3.3 -11.5
InfrastructureSewerage - - - - -0.1 - - - -0.1
Natural disaster relief -4.1 - -14.0 - - - - - -18.1Other purposes
Australian Capital Territory debtrepayments - - - - - - -0.6 - -0.6
Loan Council – housing nominations -10.2 - -3.8 -6.5 -4.3 -2.7 - -3.4 -31.0InterestAgriculture
Drought Concessional Loans Scheme -3.4 -6.3 -5.7 -0.1 -0.5 -1.0 - -0.1 -17.1Drought Recovery Loans Scheme -0.6 -1.3 -0.6 - -0.2 -0.1 - - -2.8Farm Finance Concessional Loans Scheme -0.9 -0.5 -0.6 -0.5 .. -0.4 - -0.2 -3.0National Water Infrastructure Loan
Facility(a) ~ ~ ~ ~ ~ ~ ~ ~ -4.4Asbestos removal in the
Australian Capital Territory - - - - - - -25.7 - -25.7 (a) State allocations are yet to be finalised.
48
Mid-Year Econom
ic and Fiscal Outlook 2018-19
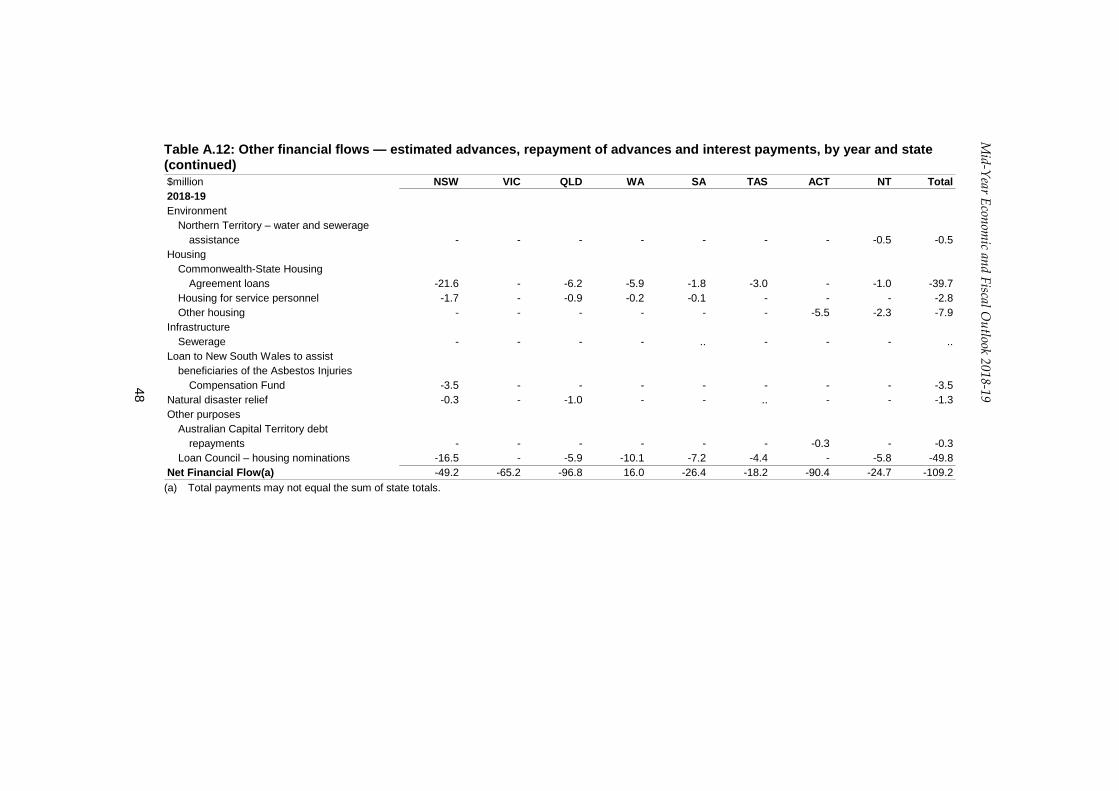
Table A.12: Other financial flows — estimated advances, repayment of advances and interest payments, by year and state (continued) $million NSW VIC QLD WA SA TAS ACT NT Total2018-19Environment
Northern Territory – water and sewerageassistance - - - - - - - -0.5 -0.5
HousingCommonwealth-State Housing
Agreement loans -21.6 - -6.2 -5.9 -1.8 -3.0 - -1.0 -39.7Housing for service personnel -1.7 - -0.9 -0.2 -0.1 - - - -2.8Other housing - - - - - - -5.5 -2.3 -7.9
InfrastructureSewerage - - - - .. - - - ..
Loan to New South Wales to assist beneficiaries of the Asbestos Injuries
Compensation Fund -3.5 - - - - - - - -3.5Natural disaster relief -0.3 - -1.0 - - .. - - -1.3Other purposes
Australian Capital Territory debtrepayments - - - - - - -0.3 - -0.3
Loan Council – housing nominations -16.5 - -5.9 -10.1 -7.2 -4.4 - -5.8 -49.8Net Financial Flow(a) -49.2 -65.2 -96.8 16.0 -26.4 -18.2 -90.4 -24.7 -109.2
(a) Total payments may not equal the sum of state totals.
Mid-Year Econom
ic and Fiscal Outlook 2018-19
49
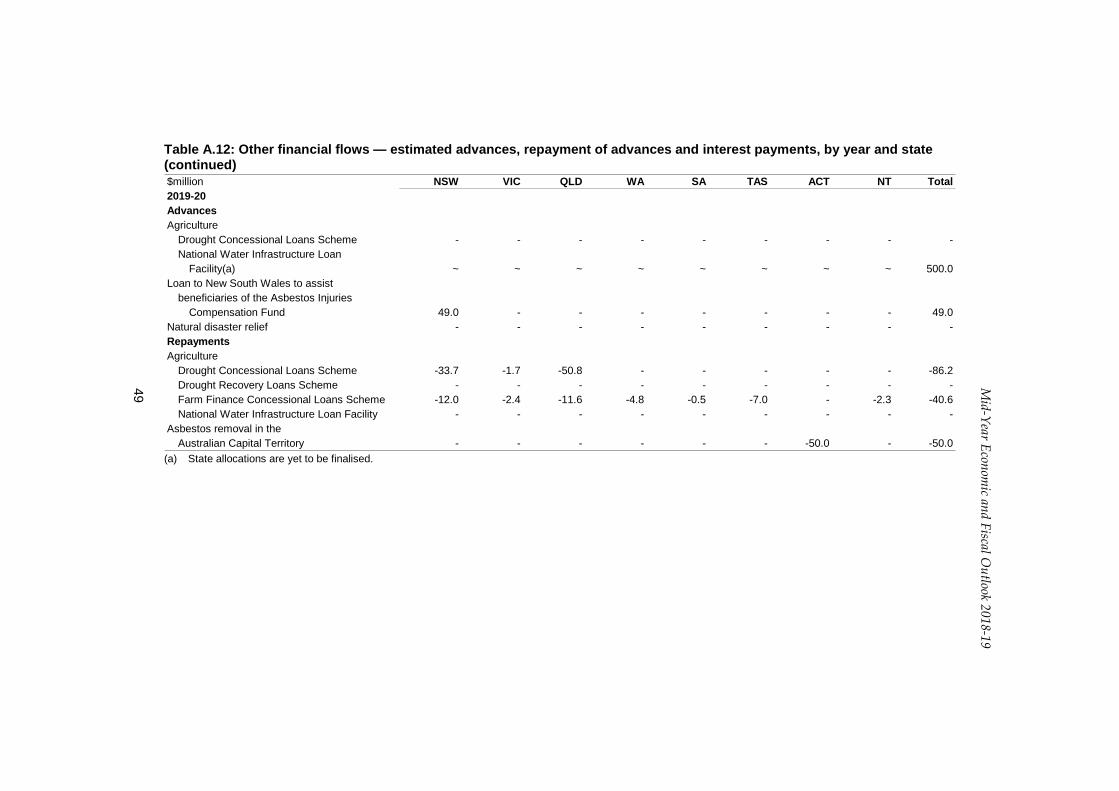
Table A.12: Other financial flows — estimated advances, repayment of advances and interest payments, by year and state (continued) $million NSW VIC QLD WA SA TAS ACT NT Total2019-20AdvancesAgriculture
Drought Concessional Loans Scheme - - - - - - - - -National Water Infrastructure Loan
Facility(a) ~ ~ ~ ~ ~ ~ ~ ~ 500.0Loan to New South Wales to assist
beneficiaries of the Asbestos InjuriesCompensation Fund 49.0 - - - - - - - 49.0
Natural disaster relief - - - - - - - - -RepaymentsAgriculture
Drought Concessional Loans Scheme -33.7 -1.7 -50.8 - - - - - -86.2Drought Recovery Loans Scheme - - - - - - - - -Farm Finance Concessional Loans Scheme -12.0 -2.4 -11.6 -4.8 -0.5 -7.0 - -2.3 -40.6National Water Infrastructure Loan Facility - - - - - - - - -
Asbestos removal in the Australian Capital Territory - - - - - - -50.0 - -50.0
(a) State allocations are yet to be finalised.

50
Mid-Year Econom
ic and Fiscal Outlook 2018-19
Table A.12: Other financial flows — estimated advances, repayment of advances and interest payments, by year and state (continued) $million NSW VIC QLD WA SA TAS ACT NT Total2019-20Environment
Northern Territory – water and sewerageassistance - - - - - - - -0.1 -0.1
HousingCommonwealth-State Housing
Agreement loans -37.4 - -10.3 -9.9 -3.2 -5.2 - -1.0 -66.9Housing for service personnel -2.0 - -1.2 -0.3 -0.1 - - - -3.6Other housing - - - - - - -8.3 -3.5 -11.7
InfrastructureSewerage - - - - - - - - -
Natural disaster relief -4.3 - -13.2 - - .. - - -17.6Other purposes
Australian Capital Territory debtrepayments - - - - - - -0.6 - -0.6
Loan Council – housing nominations -10.7 - -3.9 -6.8 -4.5 -2.9 - -3.6 -32.3InterestAgriculture
Drought Concessional Loans Scheme -2.7 -5.6 -4.3 -0.1 -0.4 -1.0 - - -14.2Drought Recovery Loans Scheme -0.6 -1.3 -0.6 - -0.2 -0.1 - - -2.8Farm Finance Concessional Loans Scheme -0.4 -0.2 -0.2 -0.4 .. -0.2 - -0.1 -1.5National Water Infrastructure Loan
Facility(a) ~ ~ ~ ~ ~ ~ ~ ~ -14.0Asbestos removal in the
Australian Capital Territory - - - - - - -24.4 - -24.4 (a) State allocations are yet to be finalised.

Mid-Year Econom
ic and Fiscal Outlook 2018-19
51
Table A.12: Other financial flows — estimated advances, repayment of advances and interest payments, by year and state (continued) $million NSW VIC QLD WA SA TAS ACT NT Total2019-20Environment
Northern Territory – water and sewerageassistance - - - - - - - -0.5 -0.5
HousingCommonwealth-State Housing
Agreement loans -19.9 - -5.8 -5.5 -1.7 -2.8 - -1.0 -36.7Housing for service personnel -1.6 - -0.9 -0.1 -0.1 - - - -2.6Other housing - - - - - - -5.2 -2.2 -7.3
InfrastructureSewerage - - - - - - - - -
Loan to New South Wales to assist beneficiaries of the Asbestos Injuries
Compensation Fund -7.3 - - - - - - - -7.3Natural disaster relief -0.2 - -0.8 - - .. - - -1.1Other purposes
Australian Capital Territory debtrepayments - - - - - - -0.3 - -0.3
Loan Council – housing nominations -16.0 - -5.7 -9.8 -7.0 -4.2 - -5.6 -48.4Net Financial Flow(a) -99.9 -11.2 -109.5 -37.7 -17.6 -23.4 -88.6 -19.9 78.3
(a) Total payments may not equal the sum of state totals.

52
Mid-Year Econom
ic and Fiscal Outlook 2018-19
Table A.12: Other financial flows — estimated advances, repayment of advances and interest payments, by year and state (continued) $million NSW VIC QLD WA SA TAS ACT NT Total2020-21AdvancesAgriculture
Drought Concessional Loans Scheme - - - - - - - - -National Water Infrastructure Loan
Facility(a) ~ ~ ~ ~ ~ ~ ~ ~ 500.0Loan to New South Wales to assist
beneficiaries of the Asbestos InjuriesCompensation Fund - - - - - - - - -
Natural disaster relief - - - - - - - - -RepaymentsAgriculture
Drought Concessional Loans Scheme -30.1 -17.8 -29.2 -1.6 -2.5 -0.3 - - -81.6Drought Recovery Loans Scheme - - -0.1 - - - - - -0.1Farm Finance Concessional Loans Scheme -4.3 -4.1 -0.3 -4.9 - -2.6 - -1.0 -17.2National Water Infrastructure Loan Facility - - - - - - - - -
Asbestos removal in the Australian Capital Territory - - - - - - -100.0 - -100.0
(a) State allocations are yet to be finalised.

Mid-Year Econom
ic and Fiscal Outlook 2018-19
53
Table A.12: Other financial flows — estimated advances, repayment of advances and interest payments, by year and state (continued) $million NSW VIC QLD WA SA TAS ACT NT Total2020-21Environment
Northern Territory – water and sewerageassistance - - - - - - - -0.1 -0.1
HousingCommonwealth-State Housing
Agreement loans -37.0 - -10.3 -9.9 -3.4 -5.1 - -1.0 -66.8Housing for service personnel -2.1 - -1.2 -0.3 -0.1 - - - -3.7Other housing - - - - - - -8.3 -3.6 -12.0
InfrastructureSewerage - - - - - - - - -
Natural disaster relief -4.3 - -13.2 - - -0.1 - - -17.6Other purposes
Australian Capital Territory debtrepayments - - - - - - -0.6 - -0.6
Loan Council – housing nominations -11.2 - -4.1 -7.1 -4.7 -3.0 - -3.7 -33.8InterestAgriculture
Drought Concessional Loans Scheme -1.7 -5.3 -3.1 -0.1 -0.3 -1.0 - - -11.5Drought Recovery Loans Scheme -0.6 -1.3 -0.6 - -0.2 -0.1 - - -2.8Farm Finance Concessional Loans Scheme -0.1 -0.1 .. -0.2 - -0.1 - .. -0.5National Water Infrastructure Loan
Facility(a) ~ ~ ~ ~ ~ ~ ~ ~ -26.8Asbestos removal in the
Australian Capital Territory - - - - - - -23.0 - -23.0 (a) State allocations are yet to be finalised.

54
Mid-Year Econom
ic and Fiscal Outlook 2018-19
Table A.12: Other financial flows — estimated advances, repayment of advances and interest payments, by year and state (continued) $million NSW VIC QLD WA SA TAS ACT NT Total2020-21Environment
Northern Territory – water and sewerageassistance - - - - - - - -0.5 -0.5
HousingCommonwealth-State Housing
Agreement loans -18.3 - -5.3 -5.1 -1.5 -2.6 - -1.0 -33.7Housing for service personnel -1.5 - -0.8 -0.1 -0.1 - - - -2.5Other housing - - - - - - -4.8 -2.0 -6.8
InfrastructureSewerage - - - - - - - - -
Loan to New South Wales to assist beneficiaries of the Asbestos Injuries
Compensation Fund -7.9 - - - - - - - -7.9Natural disaster relief -0.2 - -0.6 - - .. - - -0.8Other purposes
Australian Capital Territory debtrepayments - - - - - - -0.2 - -0.2
Loan Council – housing nominations -15.5 - -5.6 -9.5 -6.8 -4.1 - -5.5 -46.9Net Financial Flow(a) -134.9 -28.6 -74.4 -38.7 -19.6 -19.0 -136.9 -18.5 2.7
(a) Total payments may not equal the sum of state totals.

Mid-Year Econom
ic and Fiscal Outlook 2018-19
55
Table A.12: Other financial flows — estimated advances, repayment of advances and interest payments, by year and state (continued) $million NSW VIC QLD WA SA TAS ACT NT Total2021-22AdvancesAgriculture
Drought Concessional Loans Scheme - - - - - - - - -National Water Infrastructure Loan
Facility(a) ~ ~ ~ ~ ~ ~ ~ ~ 200.0Loan to New South Wales to assist
beneficiaries of the Asbestos InjuriesCompensation Fund - - - - - - - - -
Natural disaster relief - - - - - - - - -RepaymentsAgriculture
Drought Concessional Loans Scheme -5.3 -21.1 -27.3 -2.0 -3.3 - - - -58.9Drought Recovery Loans Scheme -1.2 -0.1 -0.7 - .. - - - -2.0Farm Finance Concessional Loans Scheme -0.6 - - -2.8 - -0.7 - - -4.2National Water Infrastructure Loan Facility - - - - - - - - -
Asbestos removal in the Australian Capital Territory - - - - - - -100.0 - -100.0
(a) State allocations are yet to be finalised.

56
Mid-Year Econom
ic and Fiscal Outlook 2018-19
Table A.12: Other financial flows — estimated advances, repayment of advances and interest payments, by year and state (continued) $million NSW VIC QLD WA SA TAS ACT NT Total2021-22Environment
Northern Territory – water and sewerageassistance - - - - - - - -0.1 -0.1
HousingCommonwealth-State Housing
Agreement loans -36.7 - -10.3 -9.9 -3.6 -5.1 - -1.1 -66.6Housing for service personnel -2.2 - -1.2 -0.3 -0.1 - - - -3.9Other housing - - - - - - -8.4 -3.7 -12.1
InfrastructureSewerage - - - - - - - - -
Natural disaster relief -4.3 - -12.3 - - -0.1 - - -16.7Other purposes
Australian Capital Territory debtrepayments - - - - - - -0.6 - -0.6
Loan Council – housing nominations -11.7 - -4.3 -7.4 -4.9 -3.1 - -3.9 -35.3InterestAgriculture
Drought Concessional Loans Scheme -1.2 -4.7 -2.2 .. -0.3 -1.0 - - -9.3Drought Recovery Loans Scheme -0.6 -1.3 -0.6 - -0.2 -0.1 - - -2.7Farm Finance Concessional Loans Scheme .. - - -0.1 - .. - - -0.1National Water Infrastructure Loan
Facility(a) ~ ~ ~ ~ ~ ~ ~ ~ -35.7Asbestos removal in the
Australian Capital Territory - - - - - - -20.3 - -20.3 (a) State allocations are yet to be finalised.
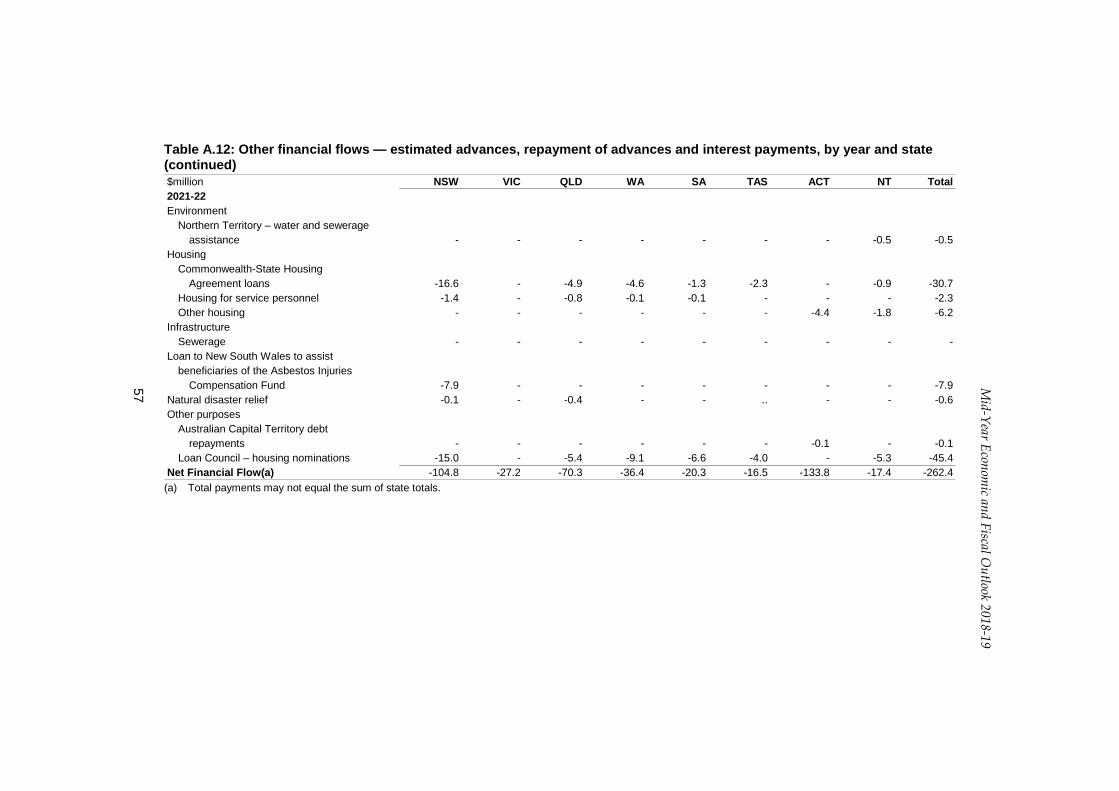
Mid-Year Econom
ic and Fiscal Outlook 2018-19
57
Table A.12: Other financial flows — estimated advances, repayment of advances and interest payments, by year and state (continued) $million NSW VIC QLD WA SA TAS ACT NT Total2021-22Environment
Northern Territory – water and sewerageassistance - - - - - - - -0.5 -0.5
HousingCommonwealth-State Housing
Agreement loans -16.6 - -4.9 -4.6 -1.3 -2.3 - -0.9 -30.7Housing for service personnel -1.4 - -0.8 -0.1 -0.1 - - - -2.3Other housing - - - - - - -4.4 -1.8 -6.2
InfrastructureSewerage - - - - - - - - -
Loan to New South Wales to assist beneficiaries of the Asbestos Injuries
Compensation Fund -7.9 - - - - - - - -7.9Natural disaster relief -0.1 - -0.4 - - .. - - -0.6Other purposes
Australian Capital Territory debtrepayments - - - - - - -0.1 - -0.1
Loan Council – housing nominations -15.0 - -5.4 -9.1 -6.6 -4.0 - -5.3 -45.4Net Financial Flow(a) -104.8 -27.2 -70.3 -36.4 -20.3 -16.5 -133.8 -17.4 -262.4
(a) Total payments may not equal the sum of state totals.