Payment adequacy: a view from those relying on social ... · PDF filePayment adequacy: a view...
31
Payment adequacy: a view from those relying on social security payments
Transcript of Payment adequacy: a view from those relying on social ... · PDF filePayment adequacy: a view...

Payment adequacy: a view from those
relying on social security payments

2
This paper was developed by the national network of Councils of Social Service based on research conducted by EMC
Media. The report was written by Jacqueline Phillips, Director of Policy at ACOSS based on research conducted by EMC
Media and with input and advice from policy staff in the Councils of Social Service.
The COSS Network collaborates to achieve shared goals of a fair, inclusive and sustainable Australia. We are
committed to working together to seek the best outcomes for people affected by poverty, disadvantage and inequity.
First published in 2015 by the national network of Councils of Social Services (‘the COSS Network’).
Locked Bag 4777
Strawberry Hills, NSW, 2012 Australia
Email: [email protected]
Website: www.acoss.org.au
ISSN: 1326 7124
ISBN: 978 0 85871 073 3
© Australian Council of Social Service
This publication is copyright. Apart from fair dealing for the purpose of private study, research, criticism, or review, as
permitted under the Copyright Act, no part may be reproduced by any process without written permission. Enquiries
should be addressed to the Publications Officer, Australian Council of Social Service. Copies are available from the
address above.
Front cover image © iStock.com/ACOSSpublications

3
Contents Introduction ............................................................................................................... 3
Research Methodology ............................................................................................. 6
Executive Summary ................................................................................................... 7
Key findings ............................................................................................................... 7
Section 1: Adequacy of Payments ..................................................................... 9
1.1 Not enough to live on ...................................................................... 9
1.2 Housing stress ............................................................................... 10
1.3 Reliance on government payments .............................................. 11
1.4 Capacity to save ............................................................................. 12
Section 3: Perceptions of Current Living Standards ........................................ 13
2.1 Enough to live on ........................................................................... 13
2.2 Falling behind ................................................................................ 14
2.3 Financial situation ......................................................................... 15
2.4 Most stressful aspect of managing on income ............................. 16
Section 3: Measures of Financial Stress........................................................... 17
3.1 Debt levels ..................................................................................... 17
3.2 Trouble paying for items ............................................................... 18
3.3 Actions taken to meet financial needs .......................................... 20
3.4 Actions taken to save money ........................................................ 21
3.5 Ability to quickly raise a large sum of money................................ 22
3.6 Concern about the cost of household expenses ........................... 23
Appendix A: Survey Reliability ................................................................................. 25
Appendix B: Basic survey demographics ................................................................. 26
Appendix C: Extended demographics ...................................................................... 27

4
Introduction
Research released by ACOSS late last year showed that 2.5 million people in Australia are living below the
internationally accepted income poverty line.1 This figure includes 603,000 children.
One of the key factors driving poverty in Australia is the inadequacy of income support payments,
particularly for people who are young, unemployed, have a disability or are raising children alone.
Specifically, the ACOSS Poverty Report found that the people most likely to be living in poverty are those
who are unemployed (61.2%), or in a household that relies on social security as its main source of income
(40.1%) and particularly on the Newstart Allowance (55.1%) or Youth Allowance (50.6%). This is largely
explained by the fact that many social security payments fall below the poverty line, even with Rent
Assistance and other supplementary payments added to household income.
The effects of poverty on those who experience it can be severe. This report reveals that many people living
below the poverty line are being forced to make trade-offs between basic needs - rent or groceries;
clothing or medical bills; electricity or transport – and often being forced to go without. For children, the
impact of deprivation on development can be serious and life-long.
Reducing poverty in Australia should be an imperative for all governments.
Two pillars of an effective anti-poverty strategy are: employment opportunities, training and support; and
adequate income support payments for those unable to find or participate in paid work. For this reason,
ACOSS has long advocated an increase to the lowest income support payments, the $37 per day Newstart
Allowance and the $30 per day Youth Allowance. This call has been broadly supported by the community
and business sectors, both of which recognise that poverty is not a pathway to participation.
Last year, the Government appointed Mr Patrick McClure to lead a Reference Group overseeing a review of
the welfare system focused on working age payments (‘The Welfare Review’). The Reference Group’s Final
Report noted that many stakeholders raised concerns about adequacy during the consultation process:
In particular, stakeholders pointed to the increasing gap between pensions and allowances.
Concerns were raised that payments may be too low to support income support recipients to fulfil
their desire to find work and to address the needs of those who receive an allowance, but who due
to only having a partial capacity to work, may never be able to work full time.2
Despite these concerns, the Reference Group did not recommend a specific increase to payment rates. It
noted that, “there is no simple formula for determining an appropriate level of assistance to achieve basic
adequacy” and instead concluded that:
Reforms to re focus the system towards employment are seen by the Reference Group as the best
way of improving people’s current circumstances and financial prospects. This means ensuring that
1 The poverty line used in ACOSS’ Poverty in Australia report is 50% of median household income (half of the ‘middle’ income for all households). This poverty line, also used by the OECD, equates to a very austere living standard: a disposable income of less than $400 per week for a single adult (higher for larger households to take account of their greater costs).
2 Reference Group on Welfare Reform, A New System for Better Employment and Social Outcomes, Commonwealth of Australia, 2015, page 77.

5
the primary focus of the income support system is to support people to move towards employment
and self reliance where possible.
The new payment architecture proposed by the Reference Group would likely result in payment increases
for some people, but could involve losses for others. As the Reference Group did not make specific
recommendations about payment rates, it is impossible to assess whether the new payment structure will
ensure people have adequate incomes to meet the essential costs of living. Significantly, the new proposed
payment structure would not appear to improve the circumstances of current Newstart and Youth
Allowance recipients who are assessed as having full capacity to work or study, despite the financial
hardship this group is experiencing.
The Reference Group did recommend the establishment of an independent mechanism to regularly review
the adequacy of payments to ensure payment rates keep up with community living standards and cost of
living increases over time. The Councils of Social Service support the establishment of such an independent
mechanism. We believe the review body should be authorised to consider the adequacy of all payment
rates and indexation methods across the income support system. However, though important and
necessary, this mechanism would not provide any immediate relief for those currently struggling on lower
payments below the poverty line or those with higher costs of living experiencing poverty at unacceptable
levels. For this reason, we advocate an immediate increase of $50 per week in allowance payments,
complemented by investment in effective employment training and support programs.
This report paints a bleak picture of the challenges faced by people locked out of paid work. With general
unemployment now above 6% and youth unemployment at 14% (and much higher in some regional areas),
it is a timely reminder of the need to invest in effective employment services and supports, including in
youth transitions programs which prevent young people from falling through the cracks.
While the 2014 Welfare Review focused on working age payments, a previous review led by Dr Jeff Harmer
considered the Age Pension, Carer Payment and Disability Support Pension as part of the wider tax and
transfer review. The final report noted the diversity of circumstances amongst pensioners, but noted that a
number of groups experienced poor outcomes fairly consistently, including single people; those in private
rental; those with high health or other related costs; and those who lived in areas in which the cost of living
was particularly high.3
The Councils of Social Service believe that the lived experience of people relying on income support must
be given due weight and respect in the development of new policy directions. We commissioned this
research to enable the voices of people relying on income support to be heard and given serious
consideration in the current welfare and pension reform debates.
3 Dr Jeff Harmer, Pension Review Report, 27 February 2009, Department of Families, Housing, Community Services and Indigenous Affairs, February 2009, available at: https://www.dss.gov.au/sites/default/files/documents/05_2012/pensionreviewreport.pdf.

6
Research Methodology
This research was conducted by EMC Media on behalf of the national network of Councils of Social Service.
An online survey, hosted by Research Now, was in the field from the 10th to 15th December 2014.
The survey fieldwork was conducted by Research Now. Data tables were prepared by Essential Research.
The target population for this research was Australian social security recipients. Participants were drawn
from the Research Now online research panel.
The survey was completed by 613 respondents. Unless otherwise stated the base for each table is 613.
Although the sample broadly represented the Australian population of social security recipients, the sample
was weighted so that it was proportionally reflective.
Quotas were placed on age, gender and location.
A note on the survey demographics
Only 6% of survey respondents identified as ‘unemployed and looking for work’; the vast majority having
some employment (whether full-time, part-time, casual or self-employed) and nearly half (48%) retired. Of
those who identified as ‘unemployed’, 58% reported being unemployed for more than 1 year.
A comparison of survey respondents with total social security recipients nationally (using Department of
Social Services data) suggests that a higher proportion of respondents received some private income in
addition to their social security payment and that the survey group has higher incomes overall than the
general population of people who rely on social security payments (see Appendix C). This may be explained
by the fact that the survey was conducted online, with respondents recruited to join an online research
panel via online and other promotions. Respondents are therefore more likely to have access to a
computer and the internet, and may have higher levels of education and literacy.
The largest group of survey respondents is those receiving the Age Pension (44%), compared with 15%
receiving the Disability Support Pension, 13% receiving the Newstart Allowance, 7% receiving the Parenting
Payment and 6% receiving the Youth Allowance.
Women comprise 55% of the sample (55%). Twenty-three percent are households with children, including
5% single parent households.
Most respondents live in the Eastern states (79%), with only 7% of respondents from South Australia, 3%
from Tasmania, 8% from Western Australia, less than 1% of respondents from the Northern Territory and
no respondents from the Australian Capital Territory.
Nine per cent of the survey are under 25 years of age, 31% between 25 and 65 years and 38% over 65
years.
For more information on survey reliability, see Appendix A. Detailed survey demographics are contained in
Appendices B and C.

7
Executive Summary
This report is based on a direct survey of people receiving income support payments and identifies the
challenges involved in making ends meet. In particular, it highlights the inadequacy of some income
support payments and the difficult decisions people are required to make about how to manage their
limited finances when faced with competing needs.
The report also demonstrates the different levels of disadvantage experienced by recipients of different
payment types. Unsurprisingly, this report consistently finds that although many on the Age Pension are
forced to live frugally, those on working age payments, including Newstart/Youth Allowance, Parenting
payments and Disability Support Pension, are struggling to a far greater extent.
Key findings
Adequacy of payments
83% of respondents receiving the Newstart or Youth Allowance do not consider it to be enough to
live on.
This compares with 80% of respondents receiving the Disability Support Pension, 73% of
respondents receiving Parenting Payment and 78% of respondents overall.
Less than a quarter of total surveyed social security recipients (22%) consider their government
payment to be enough to live on. Nearly half of all Newstart and Youth Allowance recipients said
their payment fell ‘far short’.
Housing Stress
More than a quarter of respondents receiving the Newstart Allowance are in ‘housing crisis’:
spending more than 50% of their incomes on housing costs.
52% of Newstart and Youth Allowance recipients are spending more than 25% of their incomes on
housing. A concerning proportion (10%) of this group are spending more than three-quarters of
their income on housing.
High levels of housing stress are also evident among people receiving the Disability Support Pension
(25% paying more than 50% of income) and Parenting Payment (24% paying more than 50% of
income).
Age Pension recipients are less at risk of housing stress or crisis due to higher rates of home
ownership. 72% own their homes outright and just 7% pay half their income or more on housing.
However, the situation is different for Age Pensioners in the private rental market who experience
greater financial stress, a key finding of the Harmer Review (noted above).
Income sources
Respondents receiving the Disability Support Pension are most likely to rely solely on that payment,
with 65% of respondents on that Pension not receiving any additional income.
Almost half of respondents relying on Newstart and Youth Allowance rely solely on their payment
(48%).

8
Capacity to save
More than one in four respondents relying on the Newstart payment spends more money than
they receive each week, with another 48% reporting to ‘break even’.
A similar proportion of respondents receiving the Disability Support Pension and Parenting
Payment report spending more than they receive each week (25% and 24% respectively).
Those reporting the least capacity to save are respondents receiving the Newstart and Youth
Allowances, with only 23% of respondents indicating they could save each week.
Perceptions of living standards
One in five respondents receiving the Newstart or Youth Allowance reported not having enough
money for basic essentials like housing, food and electricity.
A significant proportion of respondents receiving the Newstart Allowance/ Youth Allowance (40%)
or Disability Support Pension reported that they had enough money for basic essentials but nothing
extra. Note that this group includes 52% of people receiving the Newstart/Youth Allowance and
35% of people receiving the Disability Support Pension who receive other income in addition to
their government payment (i.e. this question asked respondents to comment on their overall
financial situation, not the adequacy of government payments to meet living costs.) The capacity of
people who rely exclusively on income support payments to make ends meet is much more limited.
73% of respondents receiving the Disability Support Pension and 63% of those receiving the
Newstart Allowance reported that their income had fallen behind the cost of living in the last two
years.
32% of respondents receiving the Newstart or Youth Allowance would describe themselves as poor
or very poor, with equal numbers in each sub-group (compared to 9% of respondents receiving the
Age Pension). Nearly one in four respondents receiving the Disability Support Pension would
describe themselves in this way.
Financial stress and deprivation
Nearly half of all respondents receiving the Newstart and Youth Allowances and more than a third
of respondents receiving the Disability Support Pension have unsustainable levels of personal debt,
reporting that they owe more than they can afford. This contrasts to just 13% of Age Pensioners.
The top five most common items that respondents had gone without in the last 12 months due to
lack of finances were: 1. Buying Christmas presents4 (31%); 2. Dental appointments or procedures
(30%); 3. Car Service (27%); 4. Buying presents for a loved one’s birthday (22%); and 5. Medical
appointments or procedures (19%).
More than half of respondents receiving the Disability Support Pension reported not being able to
afford to buy Christmas presents.
43% of respondents receiving the Disability Support Pension and 37% of respondents receiving the
Newstart or Youth Allowance reported not being able to afford dental appointments or procedures
in the last twelve months.
Nearly one third of respondents (32%) receiving the Disability Support Pension reported that they
had gone without meals in the last 12 months in an effort to save money. Significant proportions of
people receiving the Newstart or Youth Allowance (24%) and Parenting Payment (19%) also missed
meals during the period.
The majority of all respondents receiving working age payments reported turning off heating or
cooling in an effort to save money.
4 Please note that this poll was conducted in the weeks leading up to Christmas 2014.

9
Section 1: Adequacy of Payments
1.1 Not enough to live on
$240 per week is not even enough to pay for housing let alone gas, water, electricity, fuel, rates,
insurances, let alone food. I want to be able to survive on my own without begging for food, it’s
shattering to know that I can only eat what charities give me, I have no control over my own life.5
Eighty-three per cent of respondents receiving the Newstart or Youth Allowance do not consider it to be
enough to live on. This compares with 80% of respondents receiving the Disability Support Pension, 77% of
respondents receiving Parenting Payment, 73% of those on the Age Pension and 78% of respondents
overall.
Less than a quarter of total surveyed social security recipients (22%) considers their government payment
to be enough to live on. The proportion of Allowance recipients who consider their payment enough to live
on is only 17%. Of Newstart/Youth Allowance recipients surveyed, nearly half said that the payment falls far
short.
It is important to note in interpreting these results that those who have some private income and receive a
part payment may have responded by reference to the adequacy of their part payment alone. This could
explain the high percentage of Age Pensioners who describe their payments as inadequate (73%), noting
that only 31% of these respondents rely on the payment as their only source of income (see below).
Figure 1.1: Do you consider your government payment to be enough to live on?
% Age Pension
N=270
Non-Age Pension
N=344
Disability Support
N=94
NewStart/ Youth
Allowance
N=117
Parenting Payment
N=41
Other Payment
N=91
Yes 22% 27% 18% 19% 17% 23% 15%
No, it’s not quite enough 41%
44% 38%
43% 37% 24% 41%
No, it falls far short 37%
29% 43%
37% 46% 49% 42%
Don’t know 1% - 1% 1% - 4% 3%
5 Survey respondent and income support recipient.

10
1.2 Housing stress
Almost all of my payment is used up with rent alone. I have $25 a week spare, so I have to really
budget other things and work as much as possible. 6
More than a quarter of respondents receiving the Newstart Allowance are in ‘housing crisis’: spending
more than 50% of their incomes on housing costs. Fifty-two per cent of Newstart and Youth Allowance
recipients are spending more than 25% of their incomes. A concerning proportion (10%) of this group are
spending more than three-quarters of their income on housing.
High levels of housing stress are also evident among people receiving the Disability Support Pension (25%
paying more than 50% of income) and Parenting Payment (24% paying more than 50% of income).
Age Pension recipients are less at risk of housing stress or crisis due to higher rates of home ownership –
58% of Age Pensioners surveyed do not pay for housing while just 7% pay half their income or more on
housing. This accounts for the relatively high overall proportion of respondents who do not pay for housing.
However, we know that the circumstances of those receiving the Age Pension are diverse and that many
Age Pensioners in the private rental market face considerable financial stress (as confirmed by the Harmer
Pension Review, see above).
Figure 1.2: How much of your income is spent on housing?
%
Age Pension
N=270
Non-Age Pension
N=344
Disability Support
N=94
NewStart/ Youth
Allowance
N=117
Parenting Payment
N=41
Other
Payment
N=91
Nothing (don’t pay for housing)
39% 58% 24% 20% 23% 19% 33%
Less than 25% 16% 15% 16% 13% 19% 10% 18%
25-50% 23% 13% 31% 36% 26% 41% 29%
50-75% 10% 5% 15% 20% 15% 13% 9%
75%+ 5% 2% 7% 5% 11% 11% 3%
Don’t know 7% 8% 6% 6% 6% 6% 8%
6 Survey respondent and income support recipient.

11
1.3 Reliance on government payments
As noted above, a higher proportion of respondents received some private income in addition to their
social security payment and the survey group has higher incomes overall than the general population of
people who rely on social security payments (see Appendix C). Overall, 39% of respondents rely solely on
their government payment, 23% rely mostly on their payment, 14% indicated they relied equally on social
security and private income and 14% indicated they received most of their income from private sources.
Respondents receiving the Disability Support Pension are most likely to rely solely on that payment, with
65% of respondents on that Pension not receiving any additional income.
Almost half of respondents relying on the Newstart or Youth Allowance rely solely on their payment (48%).
Figure 1.3: How much of your income is made up by government payments?
%
Age Pension
N=270
Non-Age Pension
N=344
Disability Support
N=94
NewStart/ Youth
Allowance
N=117
Parenting Payment
N=41
Other
Payment
N=91
All: I rely solely on government payments
39% 31% 46% 65% 48% 19% 34%
Most: government payments make up most of my income, but I do have other income
23% 29% 18% 17% 16% 17% 24%
About half: My income is a mixture of government payments and other income
14% 17% 11% 10% 12% 9% 11%
Only some: I get most of my income from other payments
22% 21% 22% 5% 20% 49% 30%
Don't know 2% 2% 3% 2% 4% 7% 1%

12
1.4 Capacity to save
It is isolating I overspend as this is the only way I have any social life or contact with other people.
Since retiring I don't chat with those people on the tram stop or on the tram, I don't talk to people all
day long as I used to. I have to go out to get my need for people contact satisfied, and lunches and
coffees cost money. 7
More than one in four respondents relying on Newstart or the Youth Allowance spends more money than
they receive each week, with another 48% reporting to ‘break even’.
A similar proportion of respondents receiving the Disability Support Pension and Parenting Payment report
spending more than they receive each week (25% and 24% respectively).
Those reporting the least capacity to save are those relying on the Newstart and Youth Allowances, with
only 23% of respondents indicating they could save each week.
Figure 1.4: Over the time you have been receiving government payments, which best describes your weekly
finances?
% Age Pension
N=270
Non-Age Pension
N=344
Disability Support
N=94
NewStart/ Youth
Allowance
N=117
Parenting Payment
N=41
Other
Payment
N=91
I spend more money than I receive
21% 15% 25% 25% 27% 24% 23%
I break even most weeks
43% 40% 46% 48% 48% 30% 48%
I am able to save some money most week
30% 39% 22% 25% 16% 33% 25%
I am able to save a lot of money most weeks
4% 3% 4% 1% 7% 6% 3%
Don’t know 3% 3% 2% 1% 2% 7% 1%
7 Survey respondent and income support recipient.
13
Section 3: Perceptions of Current Living Standards
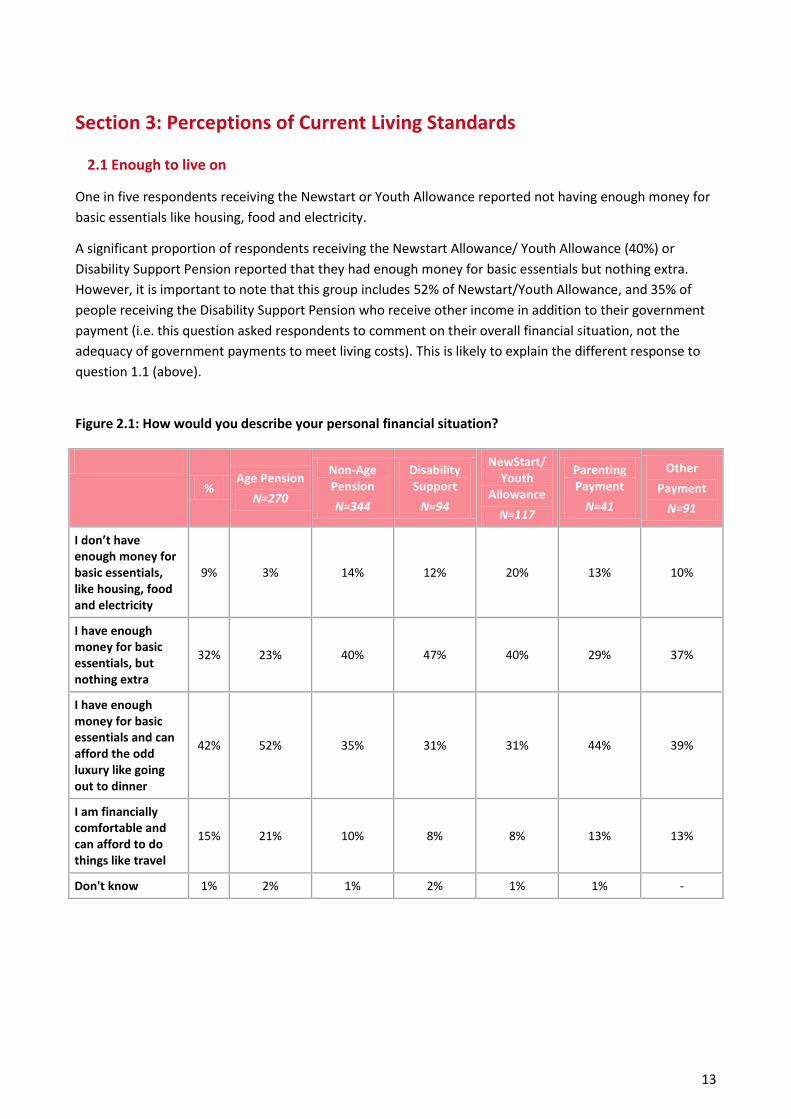
2.1 Enough to live on
One in five respondents receiving the Newstart or Youth Allowance reported not having enough money for
basic essentials like housing, food and electricity.
A significant proportion of respondents receiving the Newstart Allowance/ Youth Allowance (40%) or
Disability Support Pension reported that they had enough money for basic essentials but nothing extra.
However, it is important to note that this group includes 52% of Newstart/Youth Allowance, and 35% of
people receiving the Disability Support Pension who receive other income in addition to their government
payment (i.e. this question asked respondents to comment on their overall financial situation, not the
adequacy of government payments to meet living costs). This is likely to explain the different response to
question 1.1 (above).
Figure 2.1: How would you describe your personal financial situation?
% Age Pension
N=270
Non-Age Pension
N=344
Disability Support
N=94
NewStart/ Youth
Allowance
N=117
Parenting Payment
N=41
Other
Payment
N=91
I don’t have enough money for basic essentials, like housing, food and electricity
9% 3% 14% 12% 20% 13% 10%
I have enough money for basic essentials, but nothing extra
32% 23% 40% 47% 40% 29% 37%
I have enough money for basic essentials and can afford the odd luxury like going out to dinner
42% 52% 35% 31% 31% 44% 39%
I am financially comfortable and can afford to do things like travel
15% 21% 10% 8% 8% 13% 13%
Don't know 1% 2% 1% 2% 1% 1% -

14
2.2 Falling behind
The household bills increase[e] too much. The pension does not go up at the same rate as all the
household and general living expenses have been increasing.
Everything increases at an alarming rate except the pension, this puts a great amount of stress on
family relations causing unnecessary arguments.
Electricity and rental rates keep rising as does the price of fuel, gas anything to use or run in a house.
Yet income has stayed the same or dropped lower. 8
Seventy-three per cent of respondents receiving the Disability Support Pension and 63% of those receiving
the Newstart Allowance reported that their income had fallen behind the cost of living in the last two years.
Age pensioners were more likely to think that their income had kept pace with the cost of living (31%
compared with 21% of other payment recipients).
These findings are interesting given that the Age Pension and Disability Support Pension are both currently
indexed to wages or the Pensioner and Beneficiary Living Cost Index (PBLCI), whichever is higher, while
Allowances are indexed only to the Consumer Price Index (CPI). The high costs of disability are likely to be a
factor in the response by recipients relying on the Disability Support Pension.
Figure 2.2: In the last two years, do you think your income has:
% Age Pension
N=270
Non-Age Pension
N=344
Disability Support
N=94
NewStart/ Youth
Allowance
N=117
Parenting Payment
N=41
Other
Payment
N=91
Gone up more than the cost of living
7% 3% 10% 5% 13% 13% 11%
Fallen behind the cost of living
62% 61% 63% 73% 63% 46% 61%
Stayed even with the cost of living
26% 31% 21% 18% 17% 33% 24%
Don’t know 5% 5% 6% 5% 7% 9% 4%
8 Survey respondent and income support recipient.

15
2.3 Financial situation
I fear some weeks that I won't be able to afford my medications, to see my specialists and therapists,
the equipment I need, which then also takes a long time to receive. After that I still need to be able to
afford fuel for the car and groceries. Despite living in public/community housing… 9
Thirty-two per cent of Newstart and Youth Allowance recipients would describe themselves as poor or very
poor, with equal numbers in each sub-group. Nearly one in four people receiving the Disability Support
Pension would describe themselves in this way.
The largest proportion of overall respondents (47%) would describe themselves as ‘just getting along’ when
thinking about their current needs and financial responsibilities.
Those receiving the age pension were far more likely to describe themselves as comfortable (48%) and far
less likely to describe themselves as poor (9% compared to 32% of Newstart/Youth Allowance recipients).
Figure 2.3: Given your current needs and financial responsibilities, would you describe yourself as:
% Age Pension
N=270
Non-Age Pension
N=344
Disability Support
N=94
NewStart/ Youth
Allowance
N=117
Parenting Payment
N=41
Other
Payment
N=91
TOTAL Comfortable 35%
48% 25%
17% 23% 25% 35%
TOTAL Poor 17% 9% 24% 23% 32% 17% 16%
JUST GETTING ALONG 47%
43% 51%
59% 44% 54% 48%
Very comfortable 3%
2% 4%
3% 3% 4% 4%
Comfortable 32% 46% 21% 14% 20% 21% 31%
Poor 10% 7% 13% 15% 16% 10% 8%
Very poor 7% 2% 11% 8% 16% 7% 8%
Don’t know <1% - <1% - - 3% -
9 Survey respondent and income support recipient.

16
2.4 Most stressful aspect of managing on income
When asked what they found most stressful about managing on their income in the last 12 months,
respondents highlighted:
The rising cost of living
Being able to pay ‘bills’ (utilities)
Rent and or housing
Medical expenses
Although these were common responses, another key theme to emerge was ‘uncertainty’, the ‘fear’ and
the stress that comes from living so close to financial crisis.

17
Section 3: Measures of Financial Stress
3.1 Debt levels
Financial pressure, the bills keep coming in and there is just enough money to cover them, but when
the unexpected ones come along that’s when it becomes near impossible to survive on a pension, I
feel like putting a gun to my head nearly every day now. 10
Nearly half of all respondents receiving the Newstart and Youth Allowances and more than a third of
respondents receiving the Disability Support Pension appear to have unsustainable levels of personal debt,
reporting that they owe more than they can afford. This compares with just 13% of respondents relying on
the Age Pension.
Figure 3.1: In terms of your own level of personal debt do you:
% Age Pension
N=270
Non-Age Pension
N=344
Disability Support
N=94
NewStart/ Youth
Allowance
N=117
Parenting Payment
N=41
Other
Payment
N=91
TOTAL: Owe MORE than I can afford
26% 13% 36% 37% 44% 28% 30%
owe a lot more than I can afford
11% 4% 17% 16% 22% 11% 14%
owe a little more than I can afford
15% 9% 19% 21% 22% 17% 16%
owe about what I can afford
24% 22% 26% 24% 23% 44% 25%
owe less than I can afford
6% 5% 6% 4% 5% 9% 8%
I do not have debts
44% 60% 31% 35% 28% 19% 37%
10 Survey respondent and income support recipient.

18
3.2 Trouble paying for items
The top five most common items that respondents had gone without in the last 12 months due to lack of
finances were:
1 Buying Christmas presents11 (31%)
2 Dental appointments or procedures (30%)
3 Car Service (27%)
4 Buying presents for a loved one’s birthday (22%)
5 Medical appointments or procedures (19%)
More than half of respondents receiving the Disability Support Pension reported not being able to afford to
buy Christmas presents.
Forty-three per cent of respondents receiving the Disability Support Pension and 37% of people receiving
the Newstart or Youth Allowance reported not being able to afford dental appointments or procedures in
the last twelve months.
One in four respondents receiving the Newstart or Youth Allowance and 29% of respondents receiving the
Disability Support Pension reported not being able to afford medical appointments or procedures in the last
12 months.
Figure 3.2: Have you forgone or put off any of the following in the last 12 months due to a lack of finances? Please
select all that apply.
% Age Pension
N=270
Non-Age Pension
N=344
Disability Support
N=94
NewStart/ Youth
Allowance
N=117
Parenting Payment
N=41
Other
Payment
N=91
Buying Christmas presents
31% 21% 38% 52% 40% 37% 23%
Dental appointments or procedures
30% 24% 35% 43% 37% 36% 23%
Car Service 27% 20% 32% 36% 29% 39% 29%
Buying presents for a loved one’s birthday
22% 14% 29% 40% 29% 27% 18%
Medical appointments or procedures
19% 12% 25% 29% 25% 21% 22%
Urgent home repairs
17% 18% 16% 19% 14% 23% 12%
Paying utility bills on time
17% 8% 24% 24% 26% 31% 19%
Urgent car repairs
16% 8% 23% 26% 21% 20% 22%
Eating Meals 15% 6% 23% 28% 24% 19% 17%
11 Please note that this poll was conducted in the weeks leading up to Christmas 2014.

19
% Age Pension
N=270
Non-Age Pension
N=344
Disability Support
N=94
NewStart/ Youth
Allowance
N=117
Parenting Payment
N=41
Other
Payment
N=91
Paying back a debt to a family member or friend
14% 3% 23% 21% 29% 34% 12%
Paying phone bills on time
14% 4% 21% 25% 26% 23% 10%
Buying prescribed medication
12% 6% 17% 25% 14% 19% 11%
Paying back a debt to another lender
11% 4% 17% 13% 23% 19% 13%
Paying outstanding fines
7% 1% 12% 9% 14% 20% 7%
Making rent or mortgage payments
6% 1% 10% 8% 17% 13% 3%
Paying for a child’s school expenses (such as an excursion or sports equipment)
4% - 8% 4% 8% 13% 10%
None of these 35% 47% 25% 20% 27% 21% 31%

20
3.3 Actions taken to meet financial needs
Forty per cent of respondents receiving the Parenting Payment, 39% of respondents receiving the Newstart
or Youth Allowance and 32% of respondents receiving the Disability Support Pension reported having had
to borrow money from family and friends in the last twelve months to meet their financial needs.
More than one in four respondents receiving the Parenting Payment had to sell an item of value to make
ends meet.
Figure 3.3: In the last 12 months have you had to do any of the following to meet your immediate financial needs?
Please select all that apply.
%
Age Pension
N=270
Non-Age Pension
N=344
Disability Support
N=94
NewStart/ Youth
Allowance
N=117
Parenting Payment
N=41
Other
Payment
N=91
Borrow money from family or friends
20% 4% 32% 32% 39% 40% 18%
Sell an item of value (i.e. a car, jewellery or electronics)
14% 6% 20% 18% 21% 26% 19%
Use the services of a charity or welfare agency
10% 3% 15% 16% 21% 13% 7%
Trade in goods at Cash Converters or similar
9% 3% 13% 12% 20% 11% 7%
Increase the limit on an existing credit card, or take out a new card
7% 2% 12% 11% 10% 16% 13%
Take out a short-term pay day loan
6% 1% 9% 4% 12% 16% 7%
None of these 47% 64% 34% 39% 33% 26% 32%

21
3.4 Actions taken to save money
Nearly one third of respondents (32%) receiving the Disability Support Pension reported that they had gone
without meals in the last 12 months in an effort to save money. Significant proportions of people receiving
the Newstart or Youth Allowance (24%) and Parenting Payment (19%) also missed meals during the period.
The majority of all working age payment recipients reported turning off heating or cooling in an effort to
save money.
More than one in ten respondents receiving the Newstart or Youth Allowance or Parenting Payment left
their accommodation to move in with family or friends in an effort to save money. Similar proportions
pulled out of a course of study for the same reason.
Question: In the last 12 months have you done any of the following in an effort to save money or because of your
financial situation?
%
Age Pension
N=270
Non-Age Pension
N=344
Disability Support
N=94
NewStart/ Youth
Allowance
N=117
Parenting Payment
N=41
Other
Payment
N=91
Gone without meals
16% 6% 24% 32% 24% 19% 19%
Turned off heating or cooling
48% 41% 54% 59% 56% 54% 48%
Left your accommodation and moved in with family or friends
4% - 8% 2% 12% 11% 6%
Pulled out of a course or other study
5% * 9% 8% 11% 10% 6%
None of these 46% 59% 36% 34% 34% 36% 40%

22
3.5 Ability to quickly raise a large sum of money
Only 23% of people receiving the Disability Support Pension reported being able to raise $2000 in a week for something important. For people receiving the Newstart Allowance, the figure was 36%. This compares with those receiving the Age Pension, two-thirds of who said they could raise the money. Question: If all of a sudden you had to get $2000 for something important, could the money be obtained within a
week?
% Age
Pension
N=270
Non-Age Pension
N=344
Disability Support
N=94
NewStart/ Youth
Allowance
N=117
Parenting Payment
N=41
Other
Payment
N=91
Yes 50% 66% 38% 23% 36% 50% 50%
No 32% 17% 44% 59% 43% 37% 34%
Don’t know 18% 17% 18% 18% 21% 13% 16%

23
3.6 Concern about the cost of household expenses
For Newstart and Youth Allowance recipients, the household expenses of most concern were:
1. Electricity and transport (both 62%)
2. Health and medical services (59%)
3. Food (56%)
4. Internet (53%)
5. Water (49%)
6. Mortgage or rent (47%)
Recipients of the Disability Support Pension reported the highest levels of concern about the cost of health
and medical expenses (72%), electricity (71%), and food (62%).
Table: Total concerned about different household expenses, by payment type
‘Total Concerned’ % Age
Pension N=270
Non-Age Pension
N=344
Disability Support
N=94
NewStart/ Youth Allowance
N=117
Parenting Payment
N=41
Other Payment
N=91
Electricity 59% 49% 68% 71% 62% 71% 69%
Health or medical expenses
56% 44% 65% 72% 59% 62% 65%
Transport (petrol, car, public transport)
48% 36% 58% 59% 62% 57% 53%
Food and groceries 46% 31% 57% 62% 56% 60% 51%
Home insurance 45% 41% 48% 46% 43% 47% 57%
Water 42% 34% 48% 46% 49% 50% 50%
Internet 37% 23% 48% 48% 53% 45% 40%
Telephone 36% 22% 46% 51% 46% 42% 43%
Gas 32% 23% 39% 37% 34% 40% 45%
Mortgage or rent 30% 10% 44% 44% 47% 56% 35%
Education 18% 1% 32% 21% 31% 57% 31%

24
As a proportion of all respondents, the household expenses of most concern were:
1 Electricity (59%)
2 Health or medical expenses (56%)
3 Transport (petrol, car, public transport) (48%)
4 Food and groceries (46%)
5 Home insurance (45%)
The difference between age pensioners and those on other payments is stark. On average, those receiving
working age payments were more than 22% more likely to be concerned about each of the issues. Even
with items such as education and mortgage/rent removed (which those receiving the age pension were
more likely to state they did not have as a cost), the average difference in concern was more than 19%.
Question: How concerned or unconcerned are you about meeting the current costs of each of the following specific
expenses for your household? (All respondents)
% Very
concerned Quite
concerned Not very
concerned Not at all
concerned Don’t know
Household does not have this
expense
Electricity 59% 24% 35% 22% 14% 2% 2%
Health or medical expenses
56% 21% 35% 29% 13% 1% 1%
Transport (petrol, car, public transport)
48% 15% 33% 33% 16% 2% 1%
Food and groceries 46% 19% 27% 34% 18% 1% <1%
Home insurance 45% 15% 30% 26% 14% 3% 12%
Water 42% 14% 28% 28% 22% 2% 6%
Internet 37% 12% 25% 41% 19% 2% 1%
Telephone 36% 11% 25% 40% 21% 2% 2%
Gas 32% 14% 18% 20% 13% 2% 34%
Mortgage or rent 30% 14% 16% 17% 11% 2% 41%
Education 18% 7% 11% 11% 11% 2% 58%
Page 25 / 31
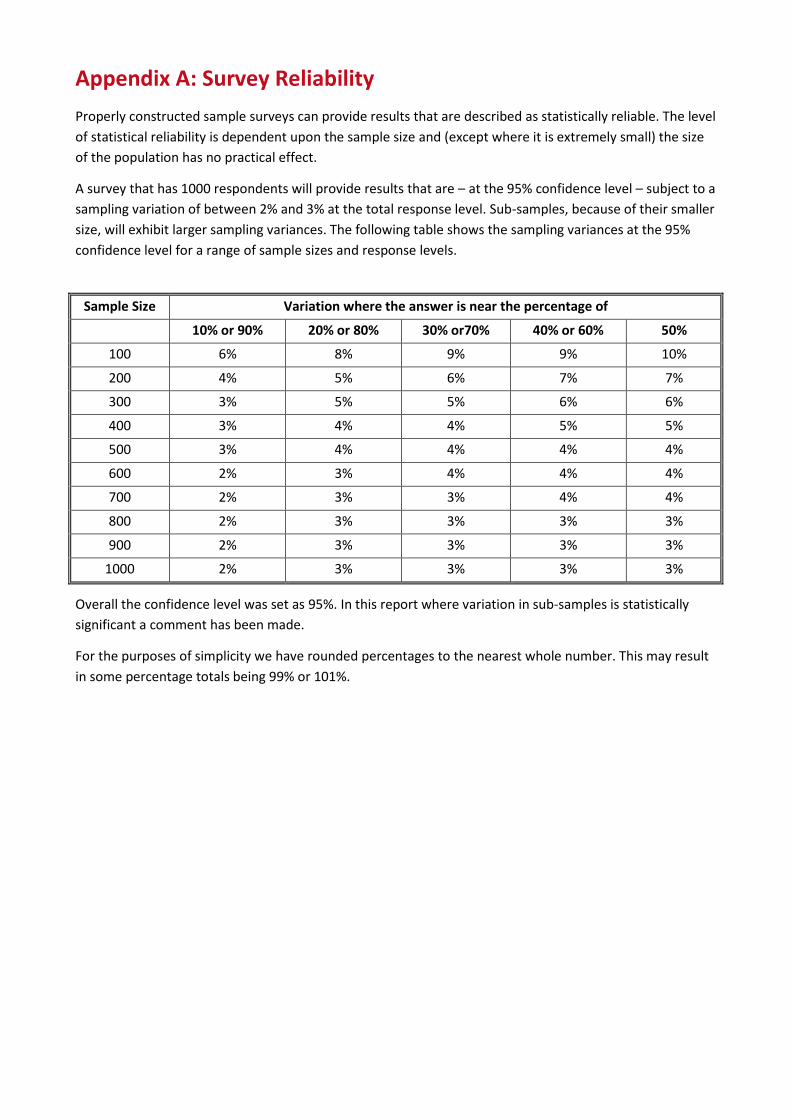
Appendix A: Survey Reliability
Properly constructed sample surveys can provide results that are described as statistically reliable. The level
of statistical reliability is dependent upon the sample size and (except where it is extremely small) the size
of the population has no practical effect.
A survey that has 1000 respondents will provide results that are – at the 95% confidence level – subject to a
sampling variation of between 2% and 3% at the total response level. Sub-samples, because of their smaller
size, will exhibit larger sampling variances. The following table shows the sampling variances at the 95%
confidence level for a range of sample sizes and response levels.
Sample Size Variation where the answer is near the percentage of
10% or 90% 20% or 80% 30% or70% 40% or 60% 50%
100 6% 8% 9% 9% 10%
200 4% 5% 6% 7% 7%
300 3% 5% 5% 6% 6%
400 3% 4% 4% 5% 5%
500 3% 4% 4% 4% 4%
600 2% 3% 4% 4% 4%
700 2% 3% 3% 4% 4%
800 2% 3% 3% 3% 3%
900 2% 3% 3% 3% 3%
1000 2% 3% 3% 3% 3%
Overall the confidence level was set as 95%. In this report where variation in sub-samples is statistically
significant a comment has been made.
For the purposes of simplicity we have rounded percentages to the nearest whole number. This may result
in some percentage totals being 99% or 101%.

26
Appendix B: Basic survey demographics
Location
Melbourne 21%
Other VIC 6%
Sydney 20%
Other NSW 18%
Brisbane 8%
Other QLD 6%
Darwin <1%
Other NT -
Adelaide 6%
Other SA 1%
Hobart 1%
Other Tasmania 2%
Perth 5%
Other WA 3%
ACT 2%
Marital status
Single 23%
Partnered 60%
Separated/Divorced 10%
Widowed 8%
Other *
Age
Under 18 -
18-25 9%
26-30 6%
31-45 8%
46-50 6%
51-55 3%
56-60 3%
61-65 5%
66-70 6%
70-75 11%
75+ 21%
Gender
Male 45%
Female 55%
Other *

Appendix C
Section 1: Extended Demographics
3.7 Welfare payment
Question: Do you receive any of the following types of government benefits?
%
Age pension 44%
Service pension 3%
Disability Support Pension 15%
Carer Allowance 11%
Austudy/Abstudy 1%
Newstart Allowance 13%
Youth Allowance 6%
Parenting Payment 7%
None of these -
3.8 Household composition
Question: What is the composition of your current household?
%
Person living alone 23%
Single person with children 5%
Couple only 42%
Couple with children 18%
Group/share household 7%
Other 5%
3.9 Dependent children
Question: How many dependent children do you have?
%
None 77%
1 10%
2 8%
3 3%
4 2%
5 <1%
6+ <1%

28
3.10 Study
Question: Are you currently studying?
%
Yes, full time 8%
Yes, part-time 9%
No 83%
3.11 Employment
Question: Which of the following best describes your employment status?
%
Permanent, full-time 9%
Permanent, part-time 8%
Self-employed 3%
Casual (30+ hours per week) 1%
Casual (less than 30 hours per week) 6%
Contract <1%
Retired 48%
Home duties 11%
Unemployed and looking for work 6%
Unemployed and not looking for work 3%
Other 4%
%
Age Pension
N=270
Non-Age Pension
N=344
Disability Support
N=94
NewStart/ Youth
Allowance
N=117
Parenting Payment
N=41
Other Payment
N=91
Permanent, full-time 9% <1% 16% 3% 22% 31% 13%
Permanent, part-time 8% 3% 12% 8% 17% 14% 10%
Self-employed 3% 3% 4% 6% 4% 4% 2%
Casual (30+ hours per week) 1% - 2% - 2% 3% 3%
Casual (less than 30 hours per week) 6% 4% 8% 7% 9% 7% 8%
Contract <1% <1% <1% - - - 1%
Retired 48% 86% 18% 35% 2% - 30%
Home duties 11% 3% 17% 17% 6% 33% 23%
Unemployed and looking for work 6% - 11% 4% 27% 6% 2%
Unemployed and not looking for work 3% <1% 5% 12% 2% 1% 3%
Other 4% <1% 6% 9% 8% - 4%

29
3.12 Length of time unemployed
Question: How long have you been looking for work? (unemployed respondents only)
%
Less than 1 month 14%
1 to 3 months 21%
3 to 6 months 2%
6 month to 1 year 5%
1 to 2 years 32%
2 to 5 years 15%
5+ years 11%
3.13 Education
Question: What is the highest level of education you have attained?
%
Year 10 or below 18%
Year 11 or equivalent 5%
Year 12 or equivalent 16%
Still attending school 1%
Trade certificate or apprenticeship 11%
Diploma, certificate etc. 23%
Bachelor or Honours degree 19%
Post-graduate qualifications (e.g., Masters, PhD) 5%
Other – please specify 1%

30
3.14 Income
Question: What is the total net weekly income from all sources – including pensions and allowances – your
household receives?
%
$2,000 or more per week ($104,000 or more per year) 4%
$1,600-$1,999 per week ($83,200-$103,999 per year) 4%
$1,300-$1,599 per week ($67,600-$83,199 per year) 6%
$1,000-$1,299 per week ($52,000-$67,599 per year) 9%
$800-$999 per week ($41,600-$51,999 per year) 12%
$600-$799 per week ($31,200-$41,599 per year) 18%
$400-$599 per week ($20,800-$31,199 per year) 25%
$250-$399 per week ($13,000-$20,799 per year) 12%
$150-$249 per week ($7,800-$12,999 per year) 4%
$1-$149 per week ($1-$7,799 per year) 3%
No income 3%
Negative income 1%

31
3.15 Housing
Question: Which of the following best describes your housing situation?
%
I own my home outright 48%
I have a mortgage on my home 14%
I rent 27%
I live with family (at no charge) 6%
I live in public housing 3%
I live in an assisted living or aged care facility or similar 1%
I am homeless -
Other 1%
%
Age Pension
N=270
Non-Age Pension
N=344
Disability Support
N=94
NewStart/ Youth
Allowance
N=117
Parenting Payment
N=41
Other Payment
N=91
I own my home outright
48% 72% 32% 20% 13% 45% 72%
I have a mortgage on my home
14% 9% 13% 11% 47% 16% 9%
I rent 27% 14% 43% 43% 30% 27% 14%
I live with family (at no charge)
6% * 1% 20% 9% 6% *
I live in public housing 3% 1% 9% 4% 1% 3% 1%
I live in an assisted living or aged care facility or similar
1% 3% - - - - 3%
I am homeless - - - - - - -
Other 1% 1% 2% 1% - 3% 1%