
Payback period review - Murdoch Research...
108
i Assessing the impacts of Feed in Tariffs and metering configuration (gross or net), on the payback period for an average solar PV system in metropolitan Melbourne Murdoch University School of Science and Engineering PEC 624 Master of Science in Renewable Energy Dissertation 2009 Assessing the impacts of Feed in Tariffs and metering configuration (gross or net), on the payback period for an average Solar PV system in Metropolitan Melbourne Author Darren Bailey B.Sc. (Hons) Student 30235339 Submitted Nov 2009
-
Upload
nguyennhan -
Category
Documents
-
view
221 -
download
0
Transcript of Payback period review - Murdoch Research...

i Assessing the impacts of Feed in Tariffs and metering configuration (gross or net), on the payback period for an
average solar PV system in metropolitan Melbourne
Murdoch University
School of Science and Engineering
PEC 624
Master of Science in Renewable Energy
Dissertation
2009
Assessing the impacts of Feed in Tariffs and metering
configuration (gross or net), on the payback period for an
average Solar PV system in Metropolitan Melbourne
Author Darren Bailey B.Sc. (Hons)
Student 30235339
Submitted Nov 2009

ii Assessing the impacts of Feed in Tariffs and metering configuration (gross or net), on the payback period for an
average solar PV system in metropolitan Melbourne
Declaration
This study is the authors own assessment of the impacts of feed in tariffs and metering
configuration on the payback period for an average solar PV system in metropolitan
Melbourne. Where the author has relied on information or work of others this has been
appropriately acknowledged.

iii Assessing the impacts of Feed in Tariffs and metering configuration (gross or net), on the payback period for an
average solar PV system in metropolitan Melbourne
Abstract
With an increasing customer focus on renewable energy and the perceived benefits from
widespread solar photovoltaic (PV) generation there has been a rapid increase in the
number of solar PV system installed across Australia during 2008 and 2009.
Debate has continued regarding the most effective configuration of a Feed in Tariff with
both gross and net metering identified as the most effective depending on the goals of the
scheme. The Victorian Government have proposed a net Feed in Tariff set at $0.60 per kWh
to meet the goals outlined by the Premier, John Brumby.
In this dissertation, the metering data obtained from over 125 existing Solar PV customers
is analysed and the payback periods for a PV system is calculated at a range of Feed in
Tariffs based on the modelling developed for the Victorian Government.
The existing models are extended to include a range of Feed in Tariffs and, secondly, data
assumptions from the models are tested using actual customer data from PV sites to
calculate a range of payback periods at different tariff and metering configurations.
The results show that the proposed $0.60per kWh net Feed in Tariff will be the most
effective to meet the goals defined for the scheme, but this result is achieved despite
inaccurate data assumptions.
The metering configuration and Feed in Tariff value have significant impacts on the payback
periods and variations in a customer’s energy usage profile will have large impacts on the
payback periods.
It is also identified from the customer data that solar PV will have a minimal impact on
reducing peak load demands across the energy network.

iv Assessing the impacts of Feed in Tariffs and metering configuration (gross or net), on the payback period for an
average solar PV system in metropolitan Melbourne
Acknowledgments
As author, I would like to acknowledge the support provided from the project sponsors Dr
Trevor Pryor and Dr Martina Calais from Murdoch University as well as Dr Muriel Watt from
UNSW whose discussions at the start of the project helped clarify and shape the direction
as well as helping limit the wide scope to a manageable level.
I would also acknowledge the support from my employers Jemena and the United Energy
Distribution network whose data was used for the analysis.
Finally, I would like to thank my partner Lucy King for her support throughout the project
and weekends and evenings will no longer be spent reviewing spreadsheets and data and
we might now have opportunity to get some more renovations completed.
v Assessing the impacts of Feed in Tariffs and metering configuration (gross or net), on the payback period for an
average solar PV system in metropolitan Melbourne
Contents
1 Introduction ................................................................................................................ 1
1.1 Background.......................................................................................................... 1
1.2 Research Focus .................................................................................................... 5
1.3 Document Outline ............................................................................................... 6
1.4 Limitations ........................................................................................................... 7
2 Overview of Feed in Tariffs and Metering Configuration .............................................. 8
2.1 Current Status...................................................................................................... 8
2.2 Metering Configuration Overview .......................................................................11
2.2.1 Gross Metering ...........................................................................................13
2.2.2 Net Metering ..............................................................................................14
2.2.3 Summary.....................................................................................................15
2.3 Data Collection Process .......................................................................................16
2.4 Methodology ......................................................................................................17
2.4.1 Sites ............................................................................................................17
2.4.2 Data ............................................................................................................18
2.5 Data Limitations ..................................................................................................20
3 Payback period and metering configuration review ....................................................22
3.1 Introduction........................................................................................................22
3.2 Models...............................................................................................................25
3.3 Assumptions .......................................................................................................26
4 Pricewaterhouse Coopers Modelling ..........................................................................29
4.1 PWC Assumptions ...............................................................................................30
4.2 Actual customer data ..........................................................................................33
4.3 Gross Metered Sites ............................................................................................35
4.3.1 Modelled data .............................................................................................35
vi Assessing the impacts of Feed in Tariffs and metering configuration (gross or net), on the payback period for an
average solar PV system in metropolitan Melbourne
4.3.2 Actual customer data ..................................................................................37
4.4 Net Metered Sites ...............................................................................................38
4.4.1 Net Modelled payback periods ....................................................................38
4.4.2 Net Actual payback periods .........................................................................40
4.4.3 Comparison .................................................................................................41
4.5 Summary ............................................................................................................42
5 Department of Primary Industries Modelling ..............................................................44
5.1 Background.........................................................................................................44
5.2 Assumptions .......................................................................................................46
5.3 Differences between PWC and DPI model ...........................................................47
5.4 Modelling ...........................................................................................................49
5.5 Analysis ..............................................................................................................51
5.5.1 Environment Victoria’s Gross Feed in Tariff .................................................51
5.5.2 Victorian Government Net Feed in Tariff .....................................................54
5.6 Summary and Results..........................................................................................56
6 Results and discussion ................................................................................................58
6.1 Modelling ...........................................................................................................58
6.2 Data Comparison ................................................................................................62
6.3 Customers Knowledge ........................................................................................65
6.4 Demand Management ........................................................................................68
6.5 Historical Consumption 2007 and 2008 ..............................................................75
7 Aims achieved ............................................................................................................76
8 Conclusion ..................................................................................................................78
Appendices ........................................................................................................................87
vii Assessing the impacts of Feed in Tariffs and metering configuration (gross or net), on the payback period for an
average solar PV system in metropolitan Melbourne
Figures
Figure 1 Victorian grid connected solar PV installations per month .............................. 2
Figure 2 Government goals for a Feed in Tariff............................................................. 4
Figure 3 Summary of key outcomes from DPI's Feed in Tariff Forum ............................ 9
Figure 4 Diagram of a Gross metering configuration ...................................................13
Figure 5 Diagram of a Net metering configuration ......................................................14
Figure 6 Data extract from customer metering file – de-identified ..............................19
Figure 7 PWC data model assumptions .......................................................................30
Figure 8 PWC Model – Payback period summary ........................................................31
Figure 9 Extended PWC gross model – payback period summary ................................35
Figure 10 Customer data - gross metered payback period summary .............................37
Figure 11 Extended PWC net model – payback period summary ...................................38
Figure 12 Customer data – net metered payback period summary ...............................40
Figure 13 PWC net model – payback period comparison ...............................................41
Figure 14 DPI Feed in Tariff model - data assumptions ..................................................46
Figure 15 Solar Capacity Factor calculation ..................................................................48
Figure 16 DPI Feed in Tariff – Original model ................................................................50
Figure 17 Environment Victoria model - subsidy and payback period summary.............52
Figure 18 Environment Victoria model – subsidy and payback period, customer data ...52
Figure 19 Victorian government net model – impact of lower PV generation ...............54
Figure 20 Victorian government net model – payback period summary ........................55
Figure 21 Payback periods - net metered - customer data ............................................56
Figure 22 Payback period comparison – net metered $0.60 tariff .................................60
Figure 23 Average daily export – gross metered customer ............................................63
Figure 24 Average daily export – net metered customer ...............................................64
Figure 25 Daily usage profile – gross metered customer ...............................................68

viii Assessing the impacts of Feed in Tariffs and metering configuration (gross or net), on the payback period for an
average solar PV system in metropolitan Melbourne
Figure 26 Daily usage profile – net metered customer ..................................................71
Figure 27 Average daily summer usage - gross metered customer ................................73
Figure 28 Average daily summer usage – net metered customer ..................................74
Figure 29 Annual consumption comparison where PV data available for 07 and 08 ......75

1 Assessing the impacts of Feed in Tariffs and metering configuration (gross or net), on the payback period for an
average solar PV system in metropolitan Melbourne
1 Introduction
1.1 Background
Victorian customers have long benefited from a readily available cheap electricity supply
delivered from the large, brown coal fired, base load generators located in the Latrobe
Valley, 60km to Melbourne’s east. With this plentiful supply, Victoria has had little
incentive to invest in other energy supply sources and the higher cost of renewable energy
has long been referenced against the existing cheap and reliable supply.
To meet increasing energy supply needs, smaller gas powered peak generation plants have
been developed over the last 10 years. With a higher fuel cost, the gas powered generation
plants are only operated during periods of high wholesale electricity prices coinciding with
high demand on the network.
Network investment has connected the South Australian, New South Wales and Tasmanian
energy networks enabling power to be transferred across the National Energy Market to
meet end user supply needs in multiple states.1
With the Federal Governments ‘Solar Homes and Communities Plan’2 a rebate of up to
$8,000 has been available for the purchase and installation of a household Solar PV system.
With an original aim to install 3,000 PV systems over a 5 year period, the rate of installation
remained low between 2000 and 2007 (refer to Figure 1).
1, The National Energy Market (NEM) supplies over $10 billion worth of electricity to 8 million end users
annually. Australian Energy Market Operator (AEMO), www.aemo.com.au
2 Australian Government, Solar Homes and Communities Plan, background and statistics available at.
http://www.environment.gov.au/settlements/renewable/pv/index.html. Graph has been created by separating
Victorian connections from the national statistics.

2 Assessing the impacts of Feed in Tariffs and metering configuration (gross or net), on the payback period for an
average solar PV system in metropolitan Melbourne
Figure 1 Victorian grid connected solar PV installations per month
With the change in Federal Government in 2007, the rebate was increased from the original
$4,000 to $8,000 and Figure1 shows the number of applications for the rebate increased
significantly3. This $8,000 rebate was unexpectedly withdrawn in June 2008 and replaced
with the Solar Credits program offering a grant up to $5,000. The calculations used in this
study are based on the $8,000 rebate available at the time of installation.
This increase has occurred with Federal and State Government policy still debating the tariff
value in price terms, of the electricity being fed back into the grid and the possible
3 Australian Government, Department of Environment Water Heritage and the Arts, 2009, Solar Homes and
Communities Plan ‘applications grew to...approximately 6,043 per week in May 2009’ and the scheme closed
with 63,000 applications to be processed.
http://www.environment.gov.au/settlements/renewable/pv/history.html accessed Oct 09

3 Assessing the impacts of Feed in Tariffs and metering configuration (gross or net), on the payback period for an
average solar PV system in metropolitan Melbourne
implementation of a defined Feed in Tariff, but without confirmed dates for
implementation of a Feed in Tariff scheme
Providing clarity in relation to the value and configuration of a Feed in Tariff will provide
customers the certainty required to assess the environmental and financial impacts from an
investment in a Solar PV system.
The Victorian Government through its Department of Primary Industries (DPI) have
regulated since 2008 that customers received a ‘fair price’ for the power they exported
back to the grid4. This price has remained the same as the retail tariff the customers pays
for their electricity, effectively providing a net overall outcome and an extended payback
period taking into account GST which is applicable on both the energy consumed and fed
back to the grid as the customer receives a net outcome..
In 2008, the Premier of Victoria, John Brumby outlined the principles required for the
introduction of a new Feed in Tariff in Victoria which would have to meet the goals shown
below in Figure 2, and which would define the price a customer would receive for their
exported electricity.
4The Department of Primary Industries is responsible for agriculture, fisheries, earth resources, energy and
forestry in Victoria, Summary of DPI’s Feed in Tariff forum which discussed the fair price and values for a Feed in
Tariff is found at,
http://www.dpi.vic.gov.au/dpi/dpinenergy.nsf/LinkView/51D8BB7390CE8683CA257457000CDFF74CAC723B1D
538D66CA25740C000D2004/$file/Stakeholder%20Forum%2028%20Sept%202007%20Summary.pdf

4 Assessing the impacts of Feed in Tariffs and metering configuration (gross or net), on the payback period for an
average solar PV system in metropolitan Melbourne
Figure 2 Government goals for a Feed in Tariff5
The calculation of the payback period for the PV system was also factored into the goals to
ensure it would be financially worthwhile to install a PV system. Extensive modelling was
then undertaken to review the options available and to determine a preferred approach.
5Brumby, J, 2008, Feed in Tariff Media Release – Victorians to benefit from the fairest and best solar feed in tariff
scheme in Australia, Dept of the Premier, Victorian Government http://www.premier.vic.gov.au/minister-for-
energy-resources/victorians-to-benefit-from-the-fairest-and-best-solar-feed-in-tariff-scheme-in-australia.html,
accessed May 2009
Stimulate the use of renewable energy
Create jobs
Help Victorians reduce their carbon footprint
Safeguards to ensure the schemes cost to Victorian’s does not exceed $10 per
year
Promote renewable energy and ensuring vulnerable Victorians would not be hit
by high electricity prices

5 Assessing the impacts of Feed in Tariffs and metering configuration (gross or net), on the payback period for an
average solar PV system in metropolitan Melbourne
1.2 Research Focus
This study will use customer metering data obtained from existing solar PV sites to assess
the impacts on the payback period of variable Feed in Tariffs as well as the impacts due to
the metering configuration at the site.
The payback periods will be assessed by extending the existing Feed in Tariff modelling and
then through the use of the customer data in place of the modelling assumptions. The
study will then review the accuracy of the data assumptions used for the modelling.
The data obtained from existing gross and net metered sites for the 2008 year, will then be
used to assess the effectiveness of solar PV as a demand management tool in reducing peak
energy load on the electricity network.
Specifically this study will address the following questions:
1. What are the impacts on the payback period from variations in the tariff rate of a
Feed in Tariff and in variations in the metering configuration, based on both the
existing modelling assumptions and then using actual customer data?
2. What is the most effective Feed in Tariff configuration to meet the goals outlined
for the implementation of a Feed in Tariff scheme in Victoria?
3. Is solar PV an effective demand management tool to assist the electricity network
to meet its peak load periods?
This study will also review the potential impacts to customers’ usage profile from installing
a solar PV system and recommend further areas of research to fully assess the impacts from
the introduction of the proposed Feed in Tariff.
6 Assessing the impacts of Feed in Tariffs and metering configuration (gross or net), on the payback period for an
average solar PV system in metropolitan Melbourne
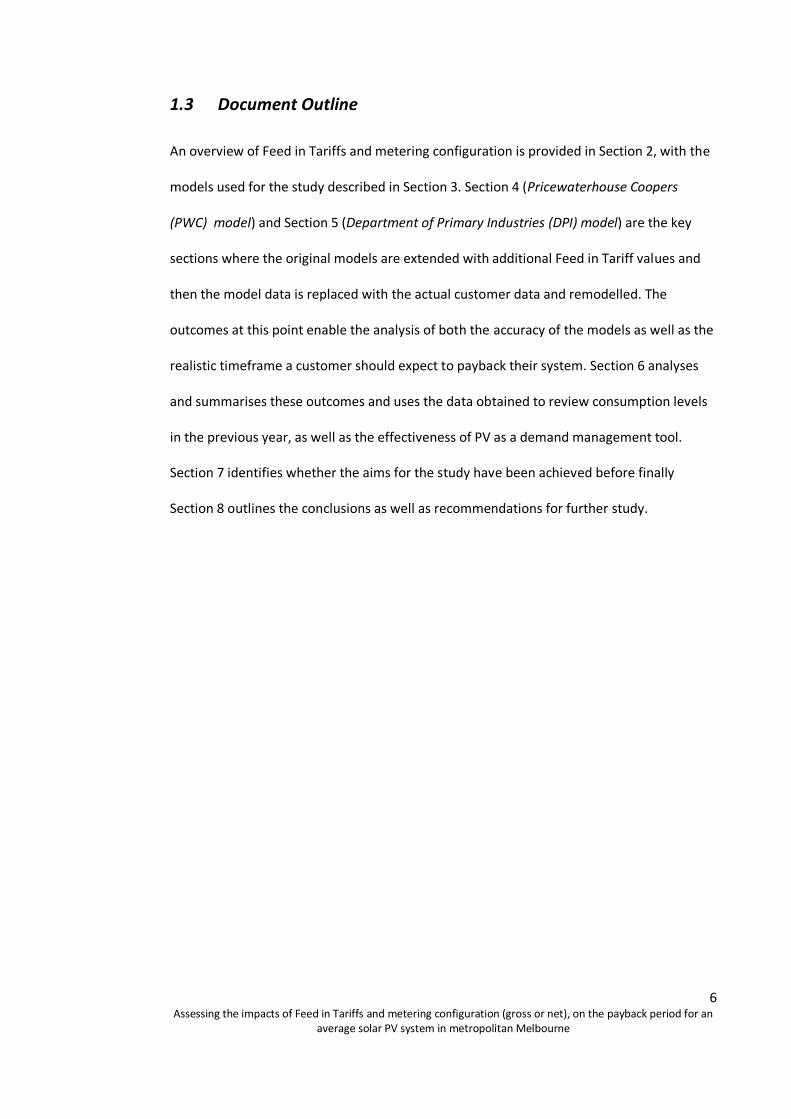
1.3 Document Outline
An overview of Feed in Tariffs and metering configuration is provided in Section 2, with the
models used for the study described in Section 3. Section 4 (Pricewaterhouse Coopers
(PWC) model) and Section 5 (Department of Primary Industries (DPI) model) are the key
sections where the original models are extended with additional Feed in Tariff values and
then the model data is replaced with the actual customer data and remodelled. The
outcomes at this point enable the analysis of both the accuracy of the models as well as the
realistic timeframe a customer should expect to payback their system. Section 6 analyses
and summarises these outcomes and uses the data obtained to review consumption levels
in the previous year, as well as the effectiveness of PV as a demand management tool.
Section 7 identifies whether the aims for the study have been achieved before finally
Section 8 outlines the conclusions as well as recommendations for further study.

7 Assessing the impacts of Feed in Tariffs and metering configuration (gross or net), on the payback period for an
average solar PV system in metropolitan Melbourne
1.4 Limitations
To enable the study to use data obtained from existing solar PV customers, the metering
data was analysed and then summarised into average hourly, daily, monthly and annual
consumption and export. In excess of 4.5 million half hour meter reads were used in
calculating the usage profile of an average PV customer.
For the study, the customer data has been de identified so the site specific customer
circumstances and energy usage profile have not been able to be explored.
The metering data has been obtained for the year 2008 and any seasonal or climate
variations during that year could have a disproportionate impact on the outcomes of this
study. Data obtained over a longer timeframe will remove this risk however it is generally
not available due to the recent installation of the PV systems.
The access to some of the Government modelling detail remains confidential and is
restricted, however as this assessment uses only the payback periods and customer
metering data, it is not expected that this restriction will have caused any significant
influence to the final results.

8 Assessing the impacts of Feed in Tariffs and metering configuration (gross or net), on the payback period for an
average solar PV system in metropolitan Melbourne
2 Overview of Feed in Tariffs and Metering Configuration
2.1 Current Status
The Victorian State Government through its Victorian Greenhouse Strategy6 implemented
legislation from which a Feed in Tariff will provide a guaranteed rate for any solar PV
generated electricity exported back to the grid. The development of the Feed in Tariff has
its origin at the stakeholder forum hosted by the Department of Primary Industries (DPI) in
2007 to principally discuss Feed in Tariffs.
With an increasing level of small scale distributed generation being installed, the DPI
wanted to ensure there was a clear understanding across the energy industry as to how
these sites would be managed in a fair and consistent manner in regards to the electricity
exported.
The ‘fair and reasonable’ criterion developed at the forum enabled customers and retailers
to have some certainty regarding tariff rates and processes. However these outcomes did
not lead to a major increase in the take up of solar PV, possibly due to the tariffs agreed
simply matching the retail tariffs, with a credit applied at the value as the customer’s retail
tariff for any electricity exported.
The outcomes from the forum (see Figure 3) provided the DPI with the basis to develop a
Feed in Tariff that would meet both the stakeholders’ requirements as well as meeting the
yet to be defined Government policy.
6 Summary and reference documents of the Victorian Greenhouse Strategy,
http://www.climatechange.vic.gov.au/Greenhouse/wcmn302.nsf/LinkView/CE4A1E3BBB1310BDCA2575BE0021
0C8663A847AC3FD0C6C9CA2575C40007A668, accessed October 2009
9 Assessing the impacts of Feed in Tariffs and metering configuration (gross or net), on the payback period for an
average solar PV system in metropolitan Melbourne
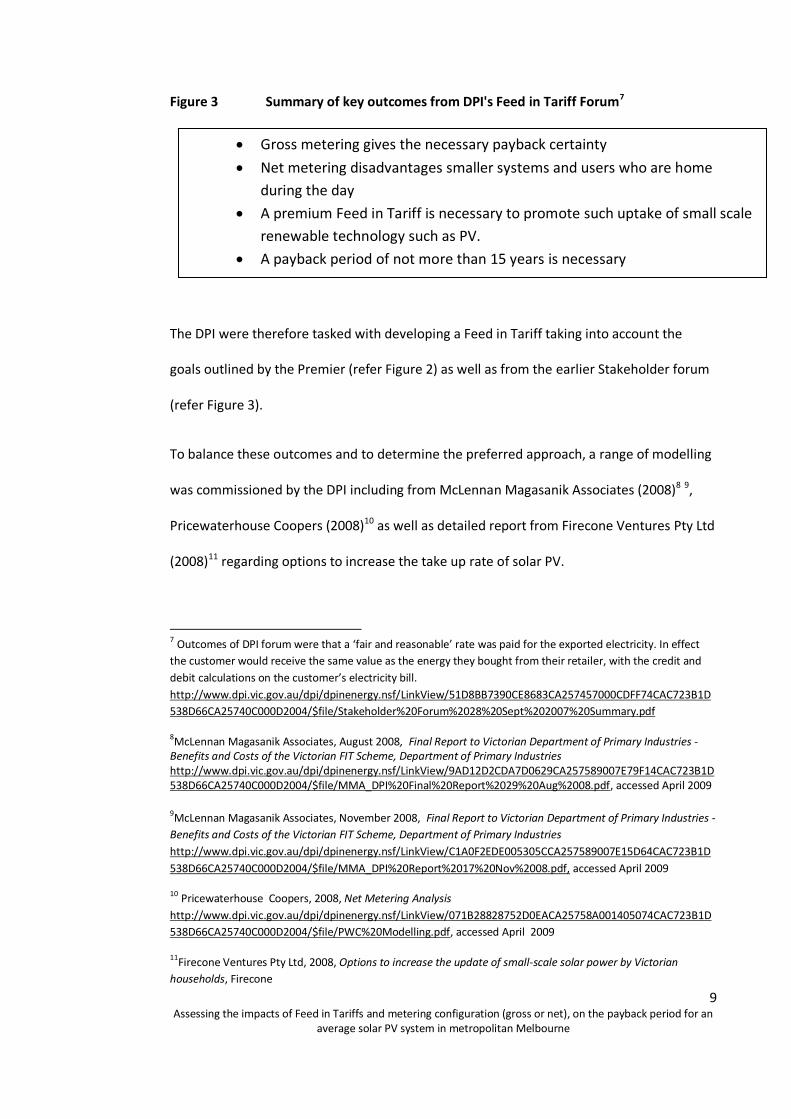
Figure 3 Summary of key outcomes from DPI's Feed in Tariff Forum7
The DPI were therefore tasked with developing a Feed in Tariff taking into account the
goals outlined by the Premier (refer Figure 2) as well as from the earlier Stakeholder forum
(refer Figure 3).
To balance these outcomes and to determine the preferred approach, a range of modelling
was commissioned by the DPI including from McLennan Magasanik Associates (2008)8 9,
Pricewaterhouse Coopers (2008)10 as well as detailed report from Firecone Ventures Pty Ltd
(2008)11 regarding options to increase the take up rate of solar PV.
7 Outcomes of DPI forum were that a ‘fair and reasonable’ rate was paid for the exported electricity. In effect
the customer would receive the same value as the energy they bought from their retailer, with the credit and
debit calculations on the customer’s electricity bill.
http://www.dpi.vic.gov.au/dpi/dpinenergy.nsf/LinkView/51D8BB7390CE8683CA257457000CDFF74CAC723B1D
538D66CA25740C000D2004/$file/Stakeholder%20Forum%2028%20Sept%202007%20Summary.pdf
8McLennan Magasanik Associates, August 2008, Final Report to Victorian Department of Primary Industries - Benefits and Costs of the Victorian FIT Scheme, Department of Primary Industries http://www.dpi.vic.gov.au/dpi/dpinenergy.nsf/LinkView/9AD12D2CDA7D0629CA257589007E79F14CAC723B1D538D66CA25740C000D2004/$file/MMA_DPI%20Final%20Report%2029%20Aug%2008.pdf, accessed April 2009
9McLennan Magasanik Associates, November 2008, Final Report to Victorian Department of Primary Industries -
Benefits and Costs of the Victorian FIT Scheme, Department of Primary Industries
http://www.dpi.vic.gov.au/dpi/dpinenergy.nsf/LinkView/C1A0F2EDE005305CCA257589007E15D64CAC723B1D
538D66CA25740C000D2004/$file/MMA_DPI%20Report%2017%20Nov%2008.pdf, accessed April 2009
10 Pricewaterhouse Coopers, 2008, Net Metering Analysis
http://www.dpi.vic.gov.au/dpi/dpinenergy.nsf/LinkView/071B28828752D0EACA25758A001405074CAC723B1D
538D66CA25740C000D2004/$file/PWC%20Modelling.pdf, accessed April 2009
11Firecone Ventures Pty Ltd, 2008, Options to increase the update of small-scale solar power by Victorian
households, Firecone
Gross metering gives the necessary payback certainty
Net metering disadvantages smaller systems and users who are home
during the day
A premium Feed in Tariff is necessary to promote such uptake of small scale
renewable technology such as PV.
A payback period of not more than 15 years is necessary
(Source DPI)
10 Assessing the impacts of Feed in Tariffs and metering configuration (gross or net), on the payback period for an
average solar PV system in metropolitan Melbourne
Payback period calculations were provided in both the PWC as well as the DPI modelling12
which also assessed the financial impacts to all customers.
The model outcomes led to a proposed net metered, Feed in Tariff at $0.60 per kWh. With
the aim to deliver the goals outlined by the Premier of limiting the impacts to other
Victorian customers as well as with a payback period of less than 15 years.
The payback period was calculated to ensure the system had been paid back within the 15
year life cycle of the proposed Feed in Tariff scheme and is calculated based on the
customers financial outlay for the system after rebates, and then the timeframe required to
payback this balance from the gains of their solar PV system.
The modelling assumptions provide the basis for this study, and the impacts on the payback
period for an average solar PV system can be determined at variable Feed in Tariff values
and with different metering configurations.
The assumptions are based on available industry data and the limited previous solar PV
payback period analysis including work from Watt, Passey, Barker and Rivier (2006)13 which
did not explore such customer numbers to understand the usage profiles across a range of
solar PV customers.
Solar PV has also been identified as a possible option to help reduce the peak load during
the hot summer afternoons when the network is at its most constrained and this study
http://www.dpi.vic.gov.au/dpi/dpinenergy.nsf/LinkView/0A73AE7F98408E28CA25758A0013C1804CAC723B1D5
38D66CA25740C000D2004/$file/Firecone%20Report%20April%202008.pdf, accessed April 2009
12Department of Primary Industries, 2009, DPI_FitModelling_v2.xls, Department of Primary Industries,
http://www.dpi.vic.gov.au/dpi/dpinenergy.nsf/LinkView/D34458A2CAFF8F4ACA25758A00147A3D4CAC723B1D
538D66CA25740C000D2004/$file/DPI_Fit%20Model.pdf, accessed April 2009
13 Watt, M., Passey, R. Barker, F. and Rivier, J., 2006, Newington Village – An Analysis of Photovoltaic Output, Residential Load and PV’s ability to Reduce Peak Demand, Report for the NSW Department of Planning, Centre for Energy & Environmental Markets, UNSW Sydney

11 Assessing the impacts of Feed in Tariffs and metering configuration (gross or net), on the payback period for an
average solar PV system in metropolitan Melbourne
expands on previous works from Borenstein (2005)14 and Pop (2005)15.to examine the peak
load and export timeframes to assess the effectiveness of PV as a demand management
tool in reducing demand on the network at peak times.
2.2 Metering Configuration Overview
A residential roof top solar PV system has its optimal placement on a north facing sloping
roof, angled perpendicular towards the maximum sunlight.
The installation and wiring of the PV system by the registered installer and its connection to
the electricity network will determine whether it will be gross or net metered. In both cases
the electricity exported back to the grid is measured with an interval based electricity
meter installed to record data every 30 minutes.
The electricity meter also records the customers’ household consumption from the network
and it is this usage data that is extracted and provided to the customer’s retailer for tariff
billing purposes.
The volume of generated electricity exported and receiving the value of the Feed in Tariff
will depend on whether the site is net or gross metered as seen in Figure 4 and Figure 5.
The value received for the exported electricity will directly impact the payback period for
the installation.
The gross metering configuration shown in section 2.2.1 exports all the generated
electricity directly to the grid, with the meter measuring the export and consumption data
14
Borenstein, S, 2005, Valuing the Time varying Electricity Production of Solar Photovoltaic Cells, Centre for the
Study of Energy Markets, University of California
15 Pop, M., 2005, The Value of Distributed Urban Residential PV Electricity in the Australian NEM, Practicum
report, Centre for Energy & Environmental Markets, UNSW Sydney

12 Assessing the impacts of Feed in Tariffs and metering configuration (gross or net), on the payback period for an
average solar PV system in metropolitan Melbourne
at the two measuring elements within the meter. The separate elements ensure that the 30
minute meter reading data is measured independently and it is the exported electricity that
receives the value of the Feed in Tariff.
A net metered configuration (section 2.2.2) has the PV system connected directly to the
customers’ switchboard and the PV generated electricity first supplies the internal
consumption needs. It is only when the system is generating more than is being consumed
internally that the excess electricity is exported to the grid. As with a gross metered site
the separate measuring elements ensure the data is clearly separated into export and
import.
With an average PV system generating the same amount of electricity regardless of its
metering, the gross metered site will export more power directly to the grid and will have a
greater benefit from a Feed in Tariff and a lower payback period than in a net site where it
is only the excess power exported back to the grid and hence receives less overall value.
The impact on the payback period will be impacted by both the value of the tariff as well as
the metering configuration.

13 Assessing the impacts of Feed in Tariffs and metering configuration (gross or net), on the payback period for an
average solar PV system in metropolitan Melbourne
2.2.1 Gross Metering
The rooftop generation system is connected directly to the Co-Generation meter, which
measures both the import and export electricity through the meter on a separate
measuring element.
All generated electricity is exported directly to the grid and the internal household
consumption is supplied directly from network via the meter and the customers’
switchboard.
Figure 4 Diagram of a Gross metering configuration16
16 Perez, F. 2009, Internal Jemena document, not available externally
Customer Premise
Customer’s
switchboard
Generation S
ystem
Co-Generation Meter
Item A
Item B
Energy exported
from distribution network
to customer’s load.
Energy flow
to the customers load
Item D
energy generated
Item C
Customers Load
Legend
Item A:
Measurement Element 1, measures the customers normal consumption main. Interval Channel 1 is assigned to measurement
element 1 that records the customers total consumption (export energy).
Item B:
Measurement Element 2, measures the energy generated by the customers generation system. Energy is measured via the
generation system’s output cable that is directly connected to a separate terminal within the meter. Interval Channel 2 is assigned to
measurement element 2 to record the total energy generated by the customers generation system (import energy).
Item C:
Generation System output cable that is connected directly to a meter for the purpose of measuring and the energy generated by the
generation system.
Item D:
Customer normal consumption main that is connected directly to the meter to measure and record energy consumed by the
customers load.

14 Assessing the impacts of Feed in Tariffs and metering configuration (gross or net), on the payback period for an
average solar PV system in metropolitan Melbourne
2.2.2 Net Metering
The net metered system connects the rooftop generation firstly to the customers’
switchboard, which provides electricity supply to the house.
Any excess electricity that is not used internally is exported to the grid and measured at the
meter. When the PV system is not generating the household load requirements are met
with the electricity supplied directly from the grid.
Figure 5 Diagram of a Net metering configuration17
Customer Premise
Customer’s
switchboard
Generation S
ystem
Co-Generation Meter
NET EXPORT OR
NET IMPORT
Item C
Item B
Customers Load
Legend
Item A:
Measurement Element 1, measures the customer’s net import and export energy and is recorded in separate
interval channels. Interval Channel 1 is assigned to record net export energy while interval channel 2 records net
import energy (excess generation to distribution network).
Item B:
Generation System output cable is connected directly to the customers switchboard.
Item C:
Customer normal consumption main is connected directly to the meter to allow a circuit path for net export and
net import energy.
Interval
Channel 1:
Net Export
Energy
Interval
Channel 2:
Net Import
Energy
Item C
17 Perez, F. 2009, Internal Jemena document, not available externally

15 Assessing the impacts of Feed in Tariffs and metering configuration (gross or net), on the payback period for an
average solar PV system in metropolitan Melbourne
2.2.3 Summary
With the existing value for the Feed in Tariff at the same level as the retail tariff with GST
being paid on both, the overall financial impact from both metering configurations is the
same. At this level the energy used internally and not exported is valued at the same rate as
the exported energy and there is no impact on the payback period from either metering
configuration and the payback period is based on how much is generated.
In 2008 the average Victorian energy tariff valued this exported power at $0.158 per kWh18
with this rate applied to both the exported electricity as well as the electricity used to offset
consumption from the grid. The introduction of an increased value for a Feed in Tariff will
provide a value differential between the retail tariff and the exported electricity with the
exported electricity becoming more valuable.
Setting an appropriate value for the Feed in Tariff will be critical to deliver the goals of the
scheme highlighted in Figure 2, as well as providing a price differential as an incentive to
export more electricity to the grid.
18 PWC Model uses the $0.158per kWh from the Electricity Distribution Annual Tariff report 2008, whereas the
DPI model uses a round up version of $0.16 per kWh, Victorian Energy Networks Corporations (VENCORP),
2008, Electricity Distribution Annual Tariff Report 2008, VENCORP, www.vencorp.com.au, accessed April 2008.

16 Assessing the impacts of Feed in Tariffs and metering configuration (gross or net), on the payback period for an
average solar PV system in metropolitan Melbourne
2.3 Data Collection Process
With the installation of a solar PV system connected to the grid, the electricity network is
required to install an Interval electricity meter to measure the imported and exported
electricity in 30 minute intervals. This ‘interval’ data is then downloaded from the meter
quarterly by the meter reader and provided in the agreed industry format to the retailer for
the calculation of the customer’s retail bill.
With multiple network businesses and retailers across Australia, a consistent data delivery
format is required to enable the automated processing of this data. The data formats are
outlined by the Australian Energy Market Operator (AEMO) in the ‘MDM File Format and
Load Process document19. It is from this agreed format that the data for each site has been
extracted and converted into a usable MS Excel format. The data was extracted from
network billing data files used to provide the interval data to the electricity retailers for
billing purposes.
With every PV customer having an interval meter installed ensuring that the full data set is
available for the 2008 period is critical in providing the required level of data for this study.
19 Australian Energy Market Operator, 2009, MDM File Format and Load Process, Australian Energy Market
Operator, http://www.aemo.com.au/electricityops/0630-0014.pdf, accessed August 2009

17 Assessing the impacts of Feed in Tariffs and metering configuration (gross or net), on the payback period for an
average solar PV system in metropolitan Melbourne
2.4 Methodology
2.4.1 Sites
The electricity distribution business United Energy Distribution20 (UED) supplies electricity
to approx 600,000 customer s across the South East / Mornington Peninsula areas of
Melbourne.
The Solar PV installer on behalf of the customer will have requested the type of meter to be
installed to meet the wiring requirements for the site and a gross or net meter will be
installed as per this request. This decision is at the request of the customer’s electrician or
installer with the network company installing the meter to fit this request.
Whether a site is net or gross metered is then tracked via the customers meter number and
it is this meter identifier that has been used to identify the sites used for this study.
To enable the data to be available for 2008, the customers must have had an interval meter
installed prior to December 2007.
From 2007, the majority of new PV installations have been net metered and the volume of
gross metered sites available for review were significantly lower than net metered sites.
A random selection of 75 gross and 75 net metered sites meeting the pre December 2007
installation criterion were obtained and the metering data files for the 2008 period were
extracted from the data already provided to the customer’s retailer.
As this data is sent quarterly to the retailers, the existing quarterly files were extracted and
formatted into a single file showing the full data for 2008.
20
United Energy Distribution, 2009, Distribution Area Map, United Energy Distribution
http://www.ue.com.au/industry/distributionMap.asp, accessed October 2009
18 Assessing the impacts of Feed in Tariffs and metering configuration (gross or net), on the payback period for an
average solar PV system in metropolitan Melbourne
Unexpected gaps in the data where no consumption or export was recorded as well as
meters being changed, reduced the number of sites with full data for 2008 to 65 net and 64
gross metered sites. As only sites with a clear data history on both the consumption and
export data streams were selected.
2.4.2 Data
The data is originally in a comma separated value or ‘csv’ format and was extracted into a
Microsoft Excel spreadsheet enabling the easier analysis of the customer’s consumption
and export.
This file results in two data streams (one for import and one for export) each day with 48
half hour individual meter readings for each stream. This is replicated across all 366 days of
2008 (Leap Year) and across all 129 meters used in this analysis.
With the data separated into half hourly readings the spreadsheets are used to do multiple
calculations to determine the average customer data used for this study.
This includes
1. Total electricity consumption and total exported electricity from each site for the
full period of 2008.
2. The daily average electricity import and export for each month at the 30 minute
interval level.
3. Daily export and consumption profiles focussing on summer afternoon peak
consumption between 2pm and 8 pm.

19 Assessing the impacts of Feed in Tariffs and metering configuration (gross or net), on the payback period for an
average solar PV system in metropolitan Melbourne
4. Identification of peak export periods for both net and gross metered sites.
An example of the ‘csv’ data format can be seen in Figure 6 where data is shown for the
period 1 Jan 2008 through to 10 Jan 2008 for the 00.00 to 15.00 timeframes.
Figure 6 Data extract from customer metering file – de-identified
Figure 6 shows a single data stream with the date followed by the ‘0’ values for the first 12
half hour readings before increasing in value. This is a typical profile of a PV site with no
export over night and with the gradually increasing value of electricity exported towards
the middle of the day this would indicate a gross metered site. The full daily data file can be
seen in Appendix 4.
The electricity is measured in watts (W) over a 30 minute period and converted into kWh
for the purpose of billing or crediting the customer.
20 Assessing the impacts of Feed in Tariffs and metering configuration (gross or net), on the payback period for an
average solar PV system in metropolitan Melbourne
2.5 Data Limitations
There are some key aspects which need to be taken into account regarding the data
obtained for the 2008 period and the limitations it places on the accuracy of this analysis.
1. Firstly, the data has been assumed to be accurate and where estimated or substituted
(calculated data where actual data is not available) data has been used within a data
file, it is assumed to be an accurate representation of the consumption or generation at
the site. Industry standards21 regulate the calculation methodology of this data and the
data has been assumed to be accurate.
2. It is assumed that each solar PV installation has been installed by an accredited installer
and has been located to maximise the effectiveness of the PV panels for the purpose of
generating electricity.
3. For the purpose of this study the household consumption for net metered sites has
been calculated as it is not directly measured by the network’s electricity meter.
It is assumed that the average PV system whether gross or net metered will generate
the same amount of electricity each year on average. The difference between the
average amount exported from a gross site and amount exported from a net site has
been calculated as the amount consumed internally.
Some customers have installed their own meter on the inverter side of their PV system
to measure the system output and enable them to calculate the internal consumption.
21 Essential Services Commission, 2009, Electricity Customer metering Code, Essential Services Commission
http://www.esc.vic.gov.au/NR/rdonlyres/D6EF0BF2-EF8E-4C23-8FE8-
5620D2F6E204/0/CODElectricityCusomterMeteringCode20090603.pdf, accessed Jan 2010
21 Assessing the impacts of Feed in Tariffs and metering configuration (gross or net), on the payback period for an
average solar PV system in metropolitan Melbourne
However as this study uses de-identified customer data this has not been further
investigated.
Without network metering to record the levels of electricity generated from the PV
systems at the net metered sites the chosen calculation method is the most reliable
method where the actual data is unavailable; however it is also a limitation when trying
to measure the effectiveness of the metering configuration and pay back periods and
will become more of a problem when there are less gross metered sites to calculate the
true output levels from the PV system.
4. For the purpose of this study, the installation configuration requested by the installer
has not been audited and it is assumed that the metering is correct for the installed PV
system.

22 Assessing the impacts of Feed in Tariffs and metering configuration (gross or net), on the payback period for an
average solar PV system in metropolitan Melbourne
3 Payback period and metering configuration review
3.1 Introduction
The purpose of this study is to assess the impacts on the payback period for an average
Solar PV system installed in metropolitan Melbourne using variable tariffs for a Feed in
Tariff and with either a net or gross metering configuration. This impact on the payback
period has been assessed using existing modelling and then with actual customer data.
The development and configuration options for a possible Feed in Tariff in Victoria were
outlined in the report by Firecone Ventures (2008)22 prepared for the Department of
Premier and Cabinet. The report outlined opportunities to increase the uptake of solar PV
as well assessing the impacts to a variety of stakeholders from the proposed changes. This
study was followed with additional work by McLennan Magasanik and Associates (2008)23
and Pricewaterhouse Coopers (2008)24 to determine the most suitable Feed in Tariff for
Victoria based on all the goals outlined by the Government and Stakeholders.
22 Firecone Ventures Pty Ltd, 2008, Options to increase the update of small-scale solar power by Victorian
households, Firecone Ventures,
23 McLennan Magasanik Associates, November 2008, Final Report to Victorian Department of Primary Industries
- Benefits and Costs of the Victorian FIT Scheme, Department of Primary Industries
24 Pricewaterhouse Coopers, 2008, Net Metering Analysis, Pricewaterhouse Coopers

23 Assessing the impacts of Feed in Tariffs and metering configuration (gross or net), on the payback period for an
average solar PV system in metropolitan Melbourne
In their report Firecone Venture 25 concluded that there was ‘no single correct answer to
the case for a FiT(Feed in Tariff) or the detailed design of a Feed in Tariff’ as well as
confirming that ‘the preferred approach depends on the weight placed on different policy
objectives, and on the assessment of likely impact.’
The Firecone analysis had identified that the different policy objectives would determine
the effectiveness of any proposed scheme and a single preferred option was not applicable
in every case. As policy goals changed so would the preferred version of the tariff.
This study investigates the impacts on payback periods in respect of the Government goals
and the modelling undertaken, through an expansion of the existing models to include
additional tariffs as well as using the actual customer data to replace the modelled
assumptions where applicable.
Modelling completed by Access Economics (2008)26 for the Clean Energy Council estimated
the cost of a gross metered National Feed in Tariff to achieve both a 10 and 20 year
payback period for a national scheme, whereas the Victorian models were based around
the overall costs for a scheme and not just the payback periods.
25 Firecone Ventures Pty Ltd, 2008, Options to increase the update of small-scale solar power by Victorian
households, Firecone Ventures, pg 25
26 Access Economics Pty Limited, 2008, The Economics of Feed in tariffs for Solar PV in Australia - Report by Access Economics Pty Limited for Clean Energy Council, Access Economics http://www.cleanenergycouncil.org.au/cec/resourcecentre/reports/mainColumnParagraphs/00/text
_files/file9/Access%20Economics%20-%20The%20Economics%20of%20Feed-
in%20Tariffs%20for%20solar%20PV%20in%20Australia%20-%2020Nov08.pdf, accessed June 2009

24 Assessing the impacts of Feed in Tariffs and metering configuration (gross or net), on the payback period for an
average solar PV system in metropolitan Melbourne
The previous modelling undertaken by Access Economics did not include the payback
periods for a net tariff as at the time the consensus from Access Economics (2008) stated
‘The rapid take up in 2007 in countries applying gross Feed in Tariff programs, is evidence
that the Gross Feed in Tariff approach is the prime mechanism for promoting grid-
connected PV applications,27.
However as noted by Firecone Ventures (2008) 28 ‘the preferred approach depends on the
weight placed on different policy objectives and not just on the perceived prime mechanism’
and both net and gross models were included in the subsequent work.
27Access Economics Pty Limited, 2008, The Economics of Feed in tariffs for Solar PV in Australia - Report by Access Economics Pty Limited for Clean Energy Council, Access Economics
28
Firecone Ventures Pty Ltd, 2008, Options to increase the update of small-scale solar power by
Victorian households, Firecone Ventures,

25 Assessing the impacts of Feed in Tariffs and metering configuration (gross or net), on the payback period for an
average solar PV system in metropolitan Melbourne
3.2 Models
Pricewaterhouse Coopers (PWC) was commissioned by the Victorian Government to assist
the Department of Primary Industries (DPI) in the development of a Business Impact
Assessment (BIA) to help the Victorian State Cabinet understand the consequences of
introducing Feed in Tariff legislation.
The Business Impact Assessment (BIA)29 assessed the impacts from a range of different
scenarios for the Victorian Feed in Tariff. It is against these modelled scenarios that the
impacts on payback periods from tariffs and metering have been assessed using the existing
models and customer data.
The two models used in this study for assessment are the Pricewaterhouse Coopers (PWC)30
and the Department of Primary Industries (DPI)31 models.
In both cases the existing modelling has firstly been expanded to include an assessment of
the payback periods at an increased range of Feed in Tariffs and then secondly the actual
customer data has been used in the model to determine the payback period which would
be achieved if the Feed in Tariff was introduced now, based on the modelling.
29 The BIA informs Cabinet of the consequences of the proposal and is a confidential document and
has not been available for review as part of this study, although the summary model was published
and is the basis for the scenarios.
30 Pricewaterhouse Coopers, 2008, Net Metering Analysis, Pricewaterhouse Coopers
31 Department of Primary Industries, 2009, DPI_FitModelling_v2.xls, Department of Primary
Industries.
26 Assessing the impacts of Feed in Tariffs and metering configuration (gross or net), on the payback period for an
average solar PV system in metropolitan Melbourne
3.3 Assumptions
To develop the models, data assumptions were required where accurate information
wasn’t readily available for the customer usage, output from the PV generation system and
the amount of electricity exported back to the grid. During this study, accurate data was
collected from all the sites and reviewed against the model data as part of the analysis.
Additional assumptions used in the models which will have an impact on the payback
period are as below:
A) System Cost
The cost of installing a PV system was different in each model with the DPI using a
$12,000 per kW cost, offset with the $8,000 rebate, giving a customer outlay of $4,000
for the purpose of the modelled 1 kW system.
The PWC model used a system cost of $12,500 per kW and an average 1.5 kW system,
with the installed customer outlay equating to $9,490 after all rebates and credits were
applied.
In both cases the PV system costs falls within the $4,000 to $7,000 per kW range
previously estimated by Zahedi (2008)32, which was calculated, taking into account the
cost of a national rooftop PV system.
The time taken to repay this initial outlay from the income generated by the Feed in
Tariff determines the payback period for each model.
32 Zahedi, A, 2008, Development of an economical model to determine an appropriate feed in tariff
for grid connected PV electricity in all states of Australia, Renewable & Sustainable Energy Reviews.
Available to purchase from www.sciencedirect.com
27 Assessing the impacts of Feed in Tariffs and metering configuration (gross or net), on the payback period for an
average solar PV system in metropolitan Melbourne
B) System Output
The PWC modelling identified an expected output of 1400 kWh per kW33 per year with
the average system size of 1.5 kW, equating to an annual expected output of 2,100
kWh per year.
The McLennan Magasanik Associates (MMA)34 research identified that the average
output for a 1.5 kW system would be between 1,708 and 2,536 kWh per year and the
PWC model has been based on these outcomes.
Additional modelling undertaken for the DPI35 used an assumption based on a 1 kW
system generating 1,577 kWh per year or for a 1.5 kW system generating 2,365 kWh
per year, which is at the upper range of the MMA modelling.
In the PWC and MMA modelling36 a ‘solar export factor’ of 30% has been used for the
net metered sites, assuming that of the electricity produced by the PV system 30% of
the production would be exported back to the grid and would receive the value of the
Feed in Tariff. The DPI model in comparison assumes that 25% will be exported in a net
model.
33Department of Primary Industries, 2009, DPI_FitModelling_v2.xls, Department of Primary
Industries.
34McLennan Magasanik Associates, November 2008, Final Report to Victorian Department of
Primary Industries - Benefits and Costs of the Victorian FIT Scheme, Department of Primary Industries
35Department of Primary Industries, 2009, DPI_FitModelling_v2.xls, Department of Primary
Industries.
36
McLennan Magasanik Associates, November 2008, Final Report to Victorian Department of
Primary Industries - Benefits and Costs of the Victorian FIT Scheme, Department of Primary Industries

28 Assessing the impacts of Feed in Tariffs and metering configuration (gross or net), on the payback period for an
average solar PV system in metropolitan Melbourne
In a gross metered site all the production is exported so 100% receives the value of the
Feed in Tariff.
For the modelling outcomes it is also essential to understand how much of the solar PV
generated electricity is now not drawn from the grid as this reduces the customers’
retail bill by the value of the retail tariff for each kWh not supplied from the grid.
A variation in both Feed in Tariff and the customers’ retail tariff will impact the value
returned each year which will impact the payback period for an average system.

29 Assessing the impacts of Feed in Tariffs and metering configuration (gross or net), on the payback period for an
average solar PV system in metropolitan Melbourne
4 Pricewaterhouse Coopers Modelling
Pricewaterhouse Coopers (PWC) reports on the expected payback periods, as well as the
Net Present Value over the proposed 15 year lifetime of the Feed in Tariff scheme.
The PWC modelling 37 was designed ‘to provide a cost benefit analysis of the introduction of
the a [sic] feed in premium on electricity generated from solar panels’. The model included
the expected costs associated with Government advertising as well as the benefits from
reduced network losses and the community benefits through avoided greenhouse gas
production.
Only the payback period and Net Present Values variations have been assessed in this
expansion of the model using additional Feed in Tariff values against the modelling
assumptions. The full Net Present Value results can be found in Appendix 9 – 12.
37 Pricewaterhouse Coopers, 2008, Net Metering Analysis, Pricewaterhouse Coopers, pg 1
30 Assessing the impacts of Feed in Tariffs and metering configuration (gross or net), on the payback period for an
average solar PV system in metropolitan Melbourne
4.1 PWC Assumptions
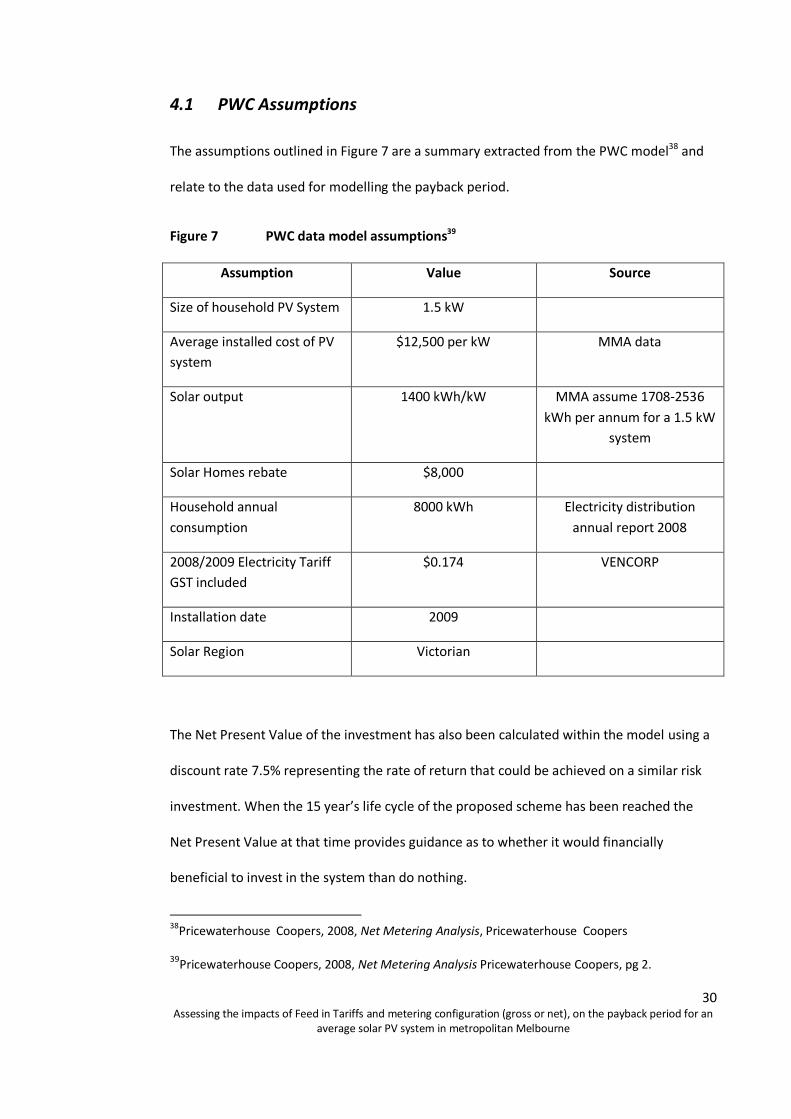
The assumptions outlined in Figure 7 are a summary extracted from the PWC model38 and
relate to the data used for modelling the payback period.
Figure 7 PWC data model assumptions39
Assumption Value Source
Size of household PV System 1.5 kW
Average installed cost of PV
system
$12,500 per kW MMA data
Solar output 1400 kWh/kW MMA assume 1708-2536
kWh per annum for a 1.5 kW
system
Solar Homes rebate $8,000
Household annual
consumption
8000 kWh Electricity distribution
annual report 2008
2008/2009 Electricity Tariff
GST included
$0.174 VENCORP
Installation date 2009
Solar Region Victorian
The Net Present Value of the investment has also been calculated within the model using a
discount rate 7.5% representing the rate of return that could be achieved on a similar risk
investment. When the 15 year’s life cycle of the proposed scheme has been reached the
Net Present Value at that time provides guidance as to whether it would financially
beneficial to invest in the system than do nothing.
38Pricewaterhouse Coopers, 2008, Net Metering Analysis, Pricewaterhouse Coopers
39Pricewaterhouse Coopers, 2008, Net Metering Analysis Pricewaterhouse Coopers, pg 2.
31 Assessing the impacts of Feed in Tariffs and metering configuration (gross or net), on the payback period for an
average solar PV system in metropolitan Melbourne
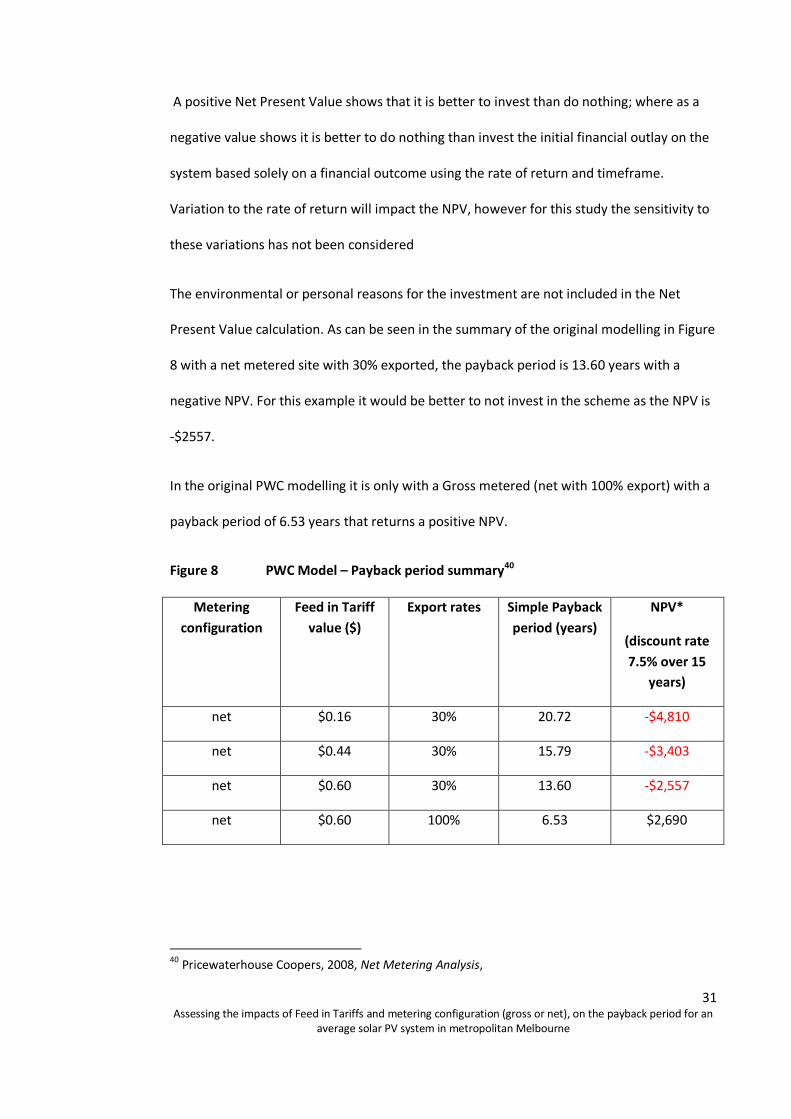
A positive Net Present Value shows that it is better to invest than do nothing; where as a
negative value shows it is better to do nothing than invest the initial financial outlay on the
system based solely on a financial outcome using the rate of return and timeframe.
Variation to the rate of return will impact the NPV, however for this study the sensitivity to
these variations has not been considered
The environmental or personal reasons for the investment are not included in the Net
Present Value calculation. As can be seen in the summary of the original modelling in Figure
8 with a net metered site with 30% exported, the payback period is 13.60 years with a
negative NPV. For this example it would be better to not invest in the scheme as the NPV is
-$2557.
In the original PWC modelling it is only with a Gross metered (net with 100% export) with a
payback period of 6.53 years that returns a positive NPV.
Figure 8 PWC Model – Payback period summary40
Metering
configuration
Feed in Tariff
value ($)
Export rates Simple Payback
period (years)
NPV*
(discount rate
7.5% over 15
years)
net $0.16 30% 20.72 -$4,810
net $0.44 30% 15.79 -$3,403
net $0.60 30% 13.60 -$2,557
net $0.60 100% 6.53 $2,690
40 Pricewaterhouse Coopers, 2008, Net Metering Analysis,

32 Assessing the impacts of Feed in Tariffs and metering configuration (gross or net), on the payback period for an
average solar PV system in metropolitan Melbourne
* The PWC model NPV calculations include cost of advertising, scheme implementation and
avoided cost of carbon abatement.
33 Assessing the impacts of Feed in Tariffs and metering configuration (gross or net), on the payback period for an
average solar PV system in metropolitan Melbourne
4.2 Actual customer data
With the PWC model to assess the impacts on the payback period, there are two immediate
areas where the actual customer data differs significantly from the modelled assumptions.
In Figure 7, the household annual consumption of 8000 kWh obtained from Vencorp41 has
been used for the average customer. However the customer data shows an average annual
consumption of 5392 kWh in a gross metered site with the calculated annual consumption
at a net metered site of 4792 kWh.
In both metering configurations the average annual consumption of a solar PV customer is
lower than the average non PV customer, but also there is an additional difference in the
annual consumption of a PV customer based on their metering configuration.
The previous modelling (DPI and PWC) assumed that the consumption level is based on the
‘average electricity customer’ whereas it can be seen that a solar PV customer has lower
than average consumption.
This variation is an important factor in assessing the impact of the Feed in Tariff on the
payback periods as the lower overall consumption will impact the level of electricity
exported to the grid and hence the value generated.
The second key difference from the modelled assumption is with the electricity generated
from the average PV system. This is assumed to be 1400 kWh per kW per year which is
significantly higher than the actual customer data showing a calculated output of 1110 kWh
41 Victorian Energy Networks Corporations (VENCORP), 2008, Electricity Distribution Annual Tariff
Report 2008, VENCORP, www.vencorp.com.au, accessed April 2008.
Restructure of the market operations company has merged Vencorp into the Australian Energy
Market Operator (AEMO), www.aemo.com.au and the report no longer appears to be available
online.
34 Assessing the impacts of Feed in Tariffs and metering configuration (gross or net), on the payback period for an
average solar PV system in metropolitan Melbourne
per kW. This has been calculated from the average gross system output of 1667 kWh per
year for a 1.5 kW system.
The immediate impact to the model is that the average solar customer uses less power
than the model, but also that the PV systems generate less than anticipated. With the
payback period reliant on the volume of electricity being exported this will have a negative
impact on the payback period.
As there is no direct measurement of the internal electricity usage from a net metered site
used for this study, it has been calculated as the difference between the exported amount
from a gross site and the exported amount from a net site with the difference having been
consumed internally.
For the purpose of the model this difference is as follows:
1667kWh (average gross export) minus 798kWh (average net export)
= 869kWh used internally per year
When calculating the total consumption for a net metered customer, this calculated
internal usage is added to the consumption recorded on the meter, providing an overall
level of electricity consumed.
35 Assessing the impacts of Feed in Tariffs and metering configuration (gross or net), on the payback period for an
average solar PV system in metropolitan Melbourne
4.3 Gross Metered Sites
4.3.1 Modelled data
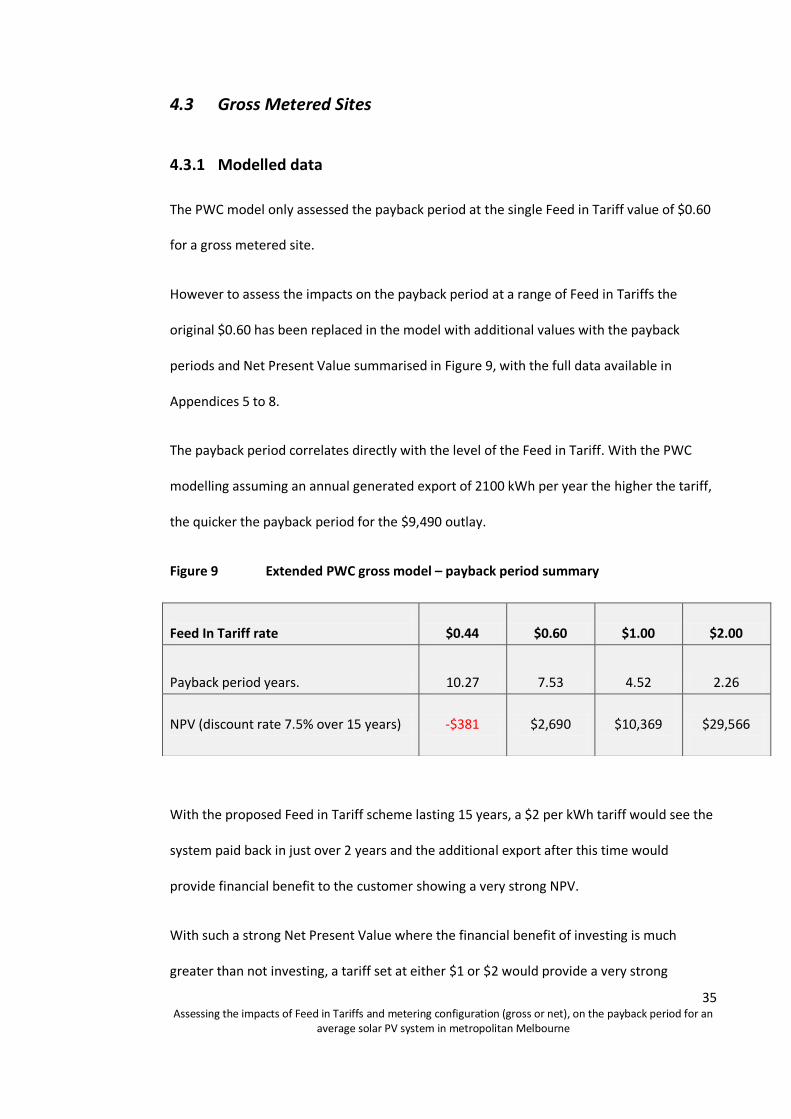
The PWC model only assessed the payback period at the single Feed in Tariff value of $0.60
for a gross metered site.
However to assess the impacts on the payback period at a range of Feed in Tariffs the
original $0.60 has been replaced in the model with additional values with the payback
periods and Net Present Value summarised in Figure 9, with the full data available in
Appendices 5 to 8.
The payback period correlates directly with the level of the Feed in Tariff. With the PWC
modelling assuming an annual generated export of 2100 kWh per year the higher the tariff,
the quicker the payback period for the $9,490 outlay.
Figure 9 Extended PWC gross model – payback period summary
With the proposed Feed in Tariff scheme lasting 15 years, a $2 per kWh tariff would see the
system paid back in just over 2 years and the additional export after this time would
provide financial benefit to the customer showing a very strong NPV.
With such a strong Net Present Value where the financial benefit of investing is much
greater than not investing, a tariff set at either $1 or $2 would provide a very strong
Feed In Tariff rate $0.44 $0.60 $1.00 $2.00
Payback period years. 10.27 7.53 4.52 2.26
NPV (discount rate 7.5% over 15 years)
-$381
$2,690
$10,369
$29,566
36 Assessing the impacts of Feed in Tariffs and metering configuration (gross or net), on the payback period for an
average solar PV system in metropolitan Melbourne
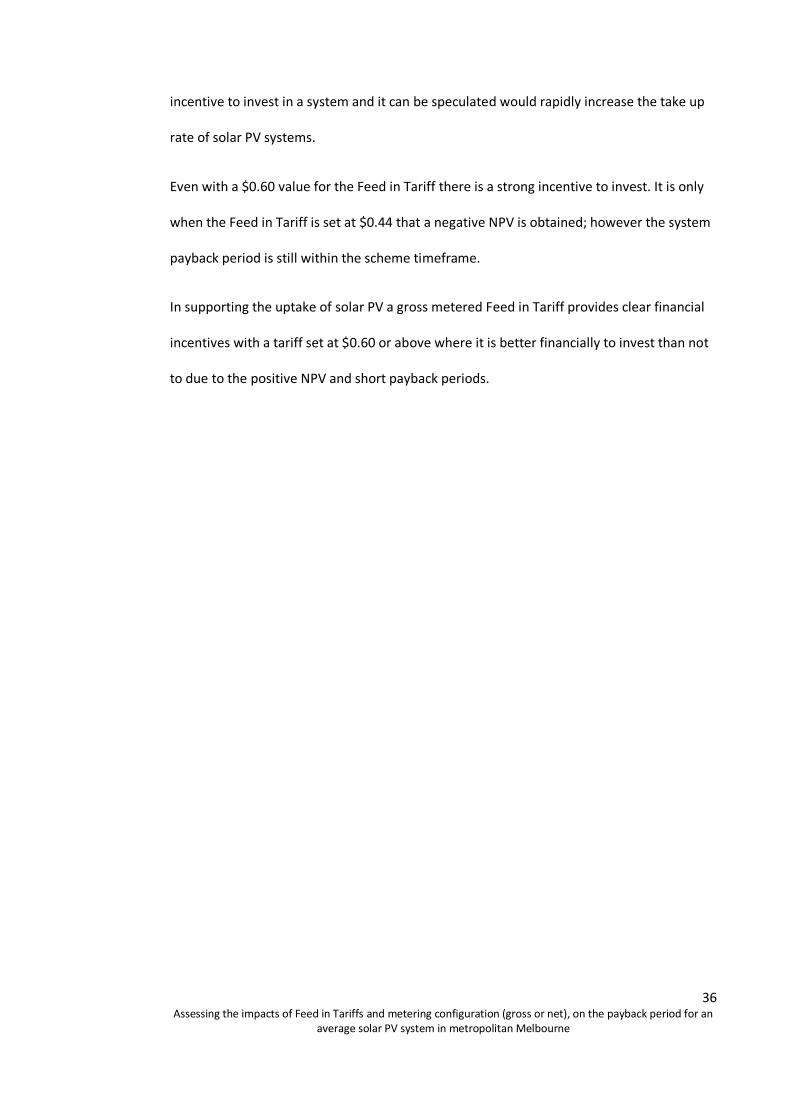
incentive to invest in a system and it can be speculated would rapidly increase the take up
rate of solar PV systems.
Even with a $0.60 value for the Feed in Tariff there is a strong incentive to invest. It is only
when the Feed in Tariff is set at $0.44 that a negative NPV is obtained; however the system
payback period is still within the scheme timeframe.
In supporting the uptake of solar PV a gross metered Feed in Tariff provides clear financial
incentives with a tariff set at $0.60 or above where it is better financially to invest than not
to due to the positive NPV and short payback periods.
37 Assessing the impacts of Feed in Tariffs and metering configuration (gross or net), on the payback period for an
average solar PV system in metropolitan Melbourne
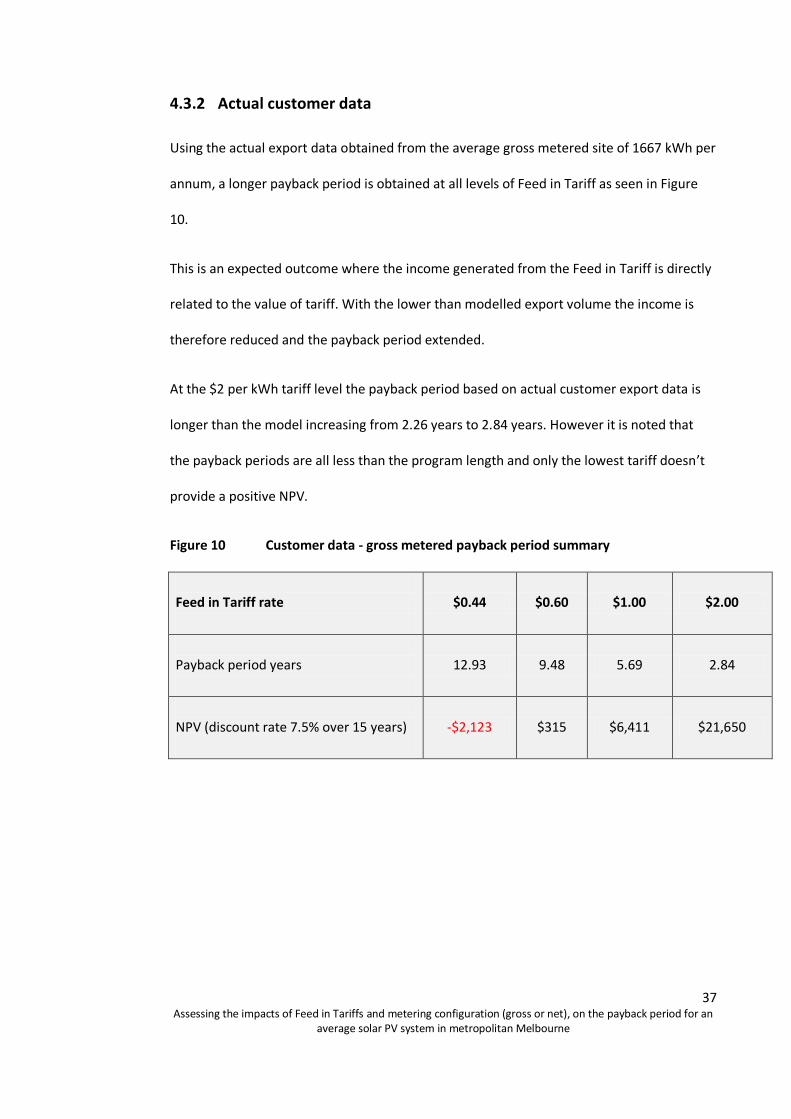
4.3.2 Actual customer data
Using the actual export data obtained from the average gross metered site of 1667 kWh per
annum, a longer payback period is obtained at all levels of Feed in Tariff as seen in Figure
10.
This is an expected outcome where the income generated from the Feed in Tariff is directly
related to the value of tariff. With the lower than modelled export volume the income is
therefore reduced and the payback period extended.
At the $2 per kWh tariff level the payback period based on actual customer export data is
longer than the model increasing from 2.26 years to 2.84 years. However it is noted that
the payback periods are all less than the program length and only the lowest tariff doesn’t
provide a positive NPV.
Figure 10 Customer data - gross metered payback period summary
Feed in Tariff rate
$0.44 $0.60 $1.00 $2.00
Payback period years
12.93 9.48 5.69 2.84
NPV (discount rate 7.5% over 15 years)
-$2,123 $315 $6,411 $21,650

38 Assessing the impacts of Feed in Tariffs and metering configuration (gross or net), on the payback period for an
average solar PV system in metropolitan Melbourne
4.4 Net Metered Sites
4.4.1 Net Modelled payback periods
The PWC model originally assessed the impacts on payback periods at three tariff rates and
Figure 11, shows the summary of these values as well as the extended model outcomes
using additional $1 and $2 values.
The model assumed that 30% of the generated electricity would be exported and would
therefore receive the premium value of the Feed in Tariff; the remaining generated
electricity would be used internally to offset the consumption drawn from the grid.
With the model assuming that 2100 kWh is generated, the total fed back into the grid
equals 630 kWh with the remaining 70% or 1470 kWh receiving the offset benefit by
reducing the overall customers’ bill by the value of the retail tariff which was assumed to be
$0.174 per kWh.
As Figure 11 indicates, the payback periods at a greater range of tariffs than previously
modelled by PWC for a net metered site are longer than those calculated previously for a
gross site using the modelling assumptions, and it is only at a $2 tariff that a positive
investment outcome is obtained.
Figure 11 Extended PWC net model – payback period summary
Feed in Tariff $0.16 $0.44 $0.60 $1.00 $2.00
Payback period years 26.89 15.79 13.60 10.09 6.08
NPV (discount rate 7.5% over 15
years -$5,263 -$3,639 -$2,717 -$413 $5,345

39 Assessing the impacts of Feed in Tariffs and metering configuration (gross or net), on the payback period for an
average solar PV system in metropolitan Melbourne
The NPV values in Figure 11, do not include the total calculated costs of the scheme
including the cost of advertising and implementation which was included into the
calculations in the original PWC modelling as seen at Figure 8.

40 Assessing the impacts of Feed in Tariffs and metering configuration (gross or net), on the payback period for an
average solar PV system in metropolitan Melbourne
4.4.2 Net Actual payback periods
Using customer data obtained from the export at the net metered sites there are again
clear variations between the modelled assumptions and the outcomes from the actual
customer data which impact the accuracy of the modelling.
As previously indicated the PV system has a lower level of generation with 1667 kWh
produced against the 2100 kWh assumed in the original model.
The key difference to the model is that although a lower amount is generated a greater
proportion of this electricity is exported to the grid with an export rate of 47% achieved
against the 30% level assumed in the PWC model.
With this greater percentage of the generated electricity exported, there will be an increase
in the revenue obtained from the Feed in Tariff and an associated drop in the savings
obtained from the offset usage with less electricity consumed internally.
The results impacts on the payback period for Net metered sites using the PWC model
structure are shown in Figure 12
Whilst the level of electricity exported is higher its impact on reducing the payback period is
reduced due to the lower volumes generated.
Figure 12 Customer data – net metered payback period summary
Feed in Tariff $0.44 $0.60 $1.00 $2.00
Payback period years 19.57 14.09 9.84 5.34
NPV -$4,220 -$3,053 -$135 $7,160

41 Assessing the impacts of Feed in Tariffs and metering configuration (gross or net), on the payback period for an
average solar PV system in metropolitan Melbourne
4.4.3 Comparison
The impacts on payback periods of using actual customer data against the PWC modelling
assumptions for a net metered site are shown in Figure 13.
Where the Feed in Tariff is set at $0.44 or $0.60 the payback period is longer than in the
model.
However when the tariff reaches $1 or $2 per kWh, the payback period for the actual net
metered customer is less than in the PWC modelling showing a better outcome is achieved
in reality than in the modelling.
Figure 13 PWC net model – payback period comparison
Feed in Tariff $0.44 $0.60 $1.00 $2.00
PWC payback period years 15.79 13.60 10.09 6.08
Actual payback period years 19.57 14.09 9.84 5.34

42 Assessing the impacts of Feed in Tariffs and metering configuration (gross or net), on the payback period for an
average solar PV system in metropolitan Melbourne
4.5 Summary
The PWC model shows a close correlation at the $0.60 and $1 per kWh Feed in Tariff with
less than 6 months difference in the calculated payback periods between the modelled
assumptions and the actual customer data.
With the 15 years proposed scheme both the PWC and the actual data suggest a payback
period close to the life time of the scheme at the $0.60 tariff.
The impact of the lower level of generation but higher export percentage in combination
reduces the impact on the modelling assumptions that would be achieved with either
variation on its own.
The PWC modelling incorrectly assumed all customers are the same and has not taken into
account an allowance that a customer installing solar PV will have lower than average
overall consumption.
The customers in this study have installed solar PV at a time when Feed in Tariffs were still
in a discussion phase with no clear timeframe for a scheme being implemented. At the time
of installation the payback period based on the average $0.16 rate would have been over
25 years for a gross metered site and at least 32 years for a net metered site.
It is therefore expected that these customers have installed their PV system for reasons
other than making a profit out of the electricity fed back into the grid.
Without contacting the customers their individual reasons for the installation are unknown.
However it could be speculated that wanting to reduce greenhouse gas emissions or
environmental footprint is at the forefront of the customers’ expectations.
43 Assessing the impacts of Feed in Tariffs and metering configuration (gross or net), on the payback period for an
average solar PV system in metropolitan Melbourne
Therefore it should not be unexpected that a customer who has installed a solar PV system
will also have a greater awareness of their energy consumption and would likely be a more
efficient than average user of power.
With a difference in payback periods and different usage levels between the gross and net
metered customers it suggests greater energy efficiency awareness in the net metered
customers who have reduced their energy usage profile to ensure they export excess
electricity to the grid.
A gross metered customer’s usage profile makes no difference to the amount exported and
subsequently would have less of a driver to reduce overall consumption as the payback
periods are not affected.
One problem of comparing the published PWC modelling to the customer data is that the
payback periods have been calculated incorrectly which explains why the data in the tables
of this study is slightly different to the published outcomes.
The published PWC model at a Feed in Tariff of $0.60 and at 30% export rate shows a
payback period of 13.6 years when calculated from 2009, however with the tariff at $0.60
and 100% exported the payback period is calculated to be 6.53 years with the payback
period starting calculated from 2010. The actual data shown in this study has all been
calculated from 2009.

44 Assessing the impacts of Feed in Tariffs and metering configuration (gross or net), on the payback period for an
average solar PV system in metropolitan Melbourne
5 Department of Primary Industries Modelling
5.1 Background
The second modelling assessed from the development of the Feed in Tariff was
commissioned by the Department of Primary Industries (DPI) to analyse the financial
impact on all customers from the implementation of a Feed in Tariff.
The modelling was designed to help determine whether a gross or net Feed in Tariff model
would deliver the goals of the scheme specifically including
Safeguards to ensure the schemes cost to Victorian’s does not exceed $10 per year
Promote renewable energy and ensuring vulnerable Victorians would not be hit
by high electricity prices
Premiers Media Release 200842
This modelling was used to ascertain the financial impacts of a Feed in Tariff on all
customers including non solar PV customer as well as calculating the payback periods a
customer would expect from either net or gross metering based on a single Feed in Tariff at
$0.60.
With the Feed in Tariff subsidy to be funded through increased electricity bills, the level of
impact on all consumers was a crucial factor in modelling an outcome for a Feed in Tariff
that would not cost each customer more than an additional $10 per year.
42 Brumby, J, 2008, Feed in Tariff Media Release – Victorians to benefit from the fairest and best solar
feed in tariff scheme in Australia, Dept of the Premier, Victorian Government
45 Assessing the impacts of Feed in Tariffs and metering configuration (gross or net), on the payback period for an
average solar PV system in metropolitan Melbourne
The DPI modelling compared the impacts of two proposed schemes with one from the
Victorian Government and one from Environment Victoria with a Feed in Tariff set at $0.60
per kWh.
The Victorian Government’s net metered scheme had a target to install 100 MW of solar PV
capacity across Victoria with the total subsidy cost of $23.7miillion per year. This compared
with a gross metered scheme proposed from Environment Victoria to install solar PV
capacity of 250 MW but with a subsidy cost of $236.5 million. The original model can be
seen at Appendix 1
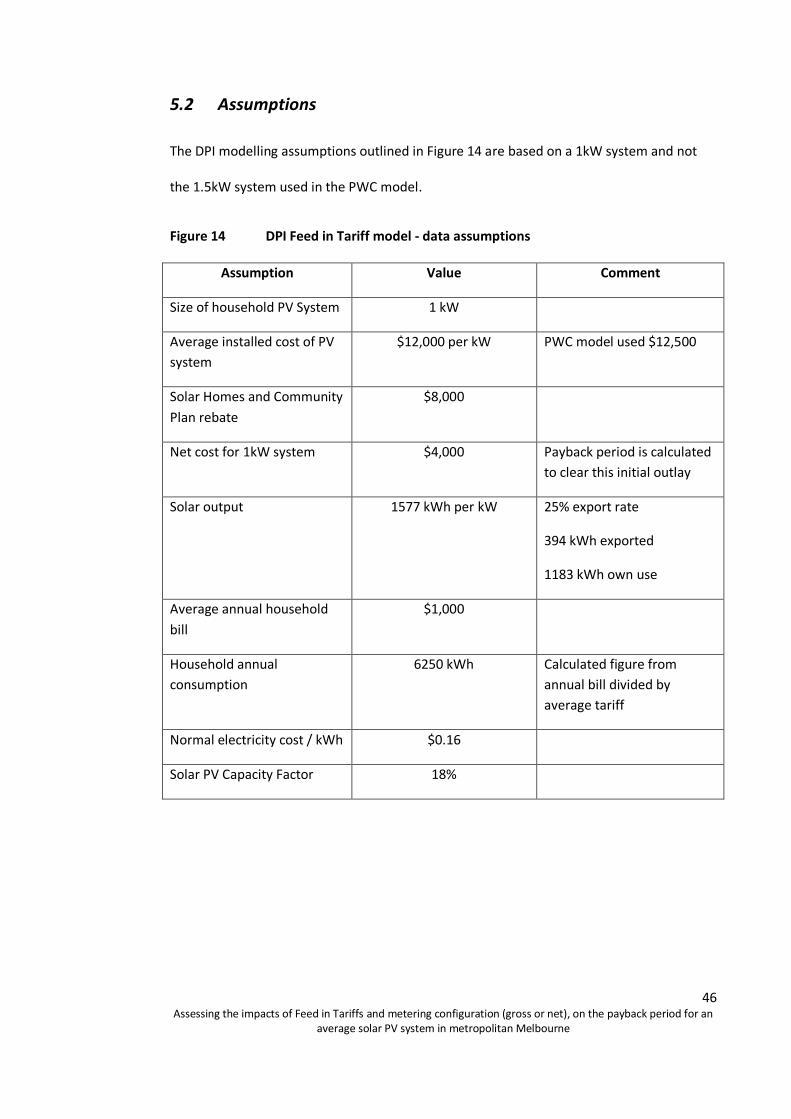
46 Assessing the impacts of Feed in Tariffs and metering configuration (gross or net), on the payback period for an
average solar PV system in metropolitan Melbourne
5.2 Assumptions
The DPI modelling assumptions outlined in Figure 14 are based on a 1kW system and not
the 1.5kW system used in the PWC model.
Figure 14 DPI Feed in Tariff model - data assumptions
Assumption Value Comment
Size of household PV System 1 kW
Average installed cost of PV
system
$12,000 per kW PWC model used $12,500
Solar Homes and Community
Plan rebate
$8,000
Net cost for 1kW system $4,000 Payback period is calculated
to clear this initial outlay
Solar output 1577 kWh per kW 25% export rate
394 kWh exported
1183 kWh own use
Average annual household
bill
$1,000
Household annual
consumption
6250 kWh Calculated figure from
annual bill divided by
average tariff
Normal electricity cost / kWh $0.16
Solar PV Capacity Factor 18%

47 Assessing the impacts of Feed in Tariffs and metering configuration (gross or net), on the payback period for an
average solar PV system in metropolitan Melbourne
5.3 Differences between PWC and DPI model
Other than the smaller system, a number of other parameters were different between the
two models.
1 Average cost of a system of 1kW system is $12,000 in the DPI model against
$12,500 in the PWC model – the calculated outlay is also significantly different
with the DPI model having a payback amount of $4,000 as opposed to the PWC
model with $9,490 to payback.
2 The DPI model uses a Feed in Tariff only at $0.60 and doesn’t investigate other
values and the impacts on the payback period.
3 The expected percentage of the PV generation that is exported to the grid is at 25%
for the DPI model and 30% for the PWC.
4 The average household consumption has been calculated from the average bill and
tariff and equates to 6250 kWh. This is lower than the 8000 kWh used for the
PWC model.
The customer data has been obtained from an average 1.5 kW system and as the DPI model
uses a 1kW system, the customers consumption and export from the 1.5 kW system has
been calculated at 66% of the actual output.
For the purpose of the modelling this reduces the calculated customer output from 1667 at
a 1.5 kW site to 1110 kWh for a 1 kW site. This assumption will have an acceptable degree
of accuracy to assess the impacts against the DPI model.
The DPI model introduces the solar capacity factor which determines how much the system
could generate if it operated at full capacity for an entire year. The DPI model uses a
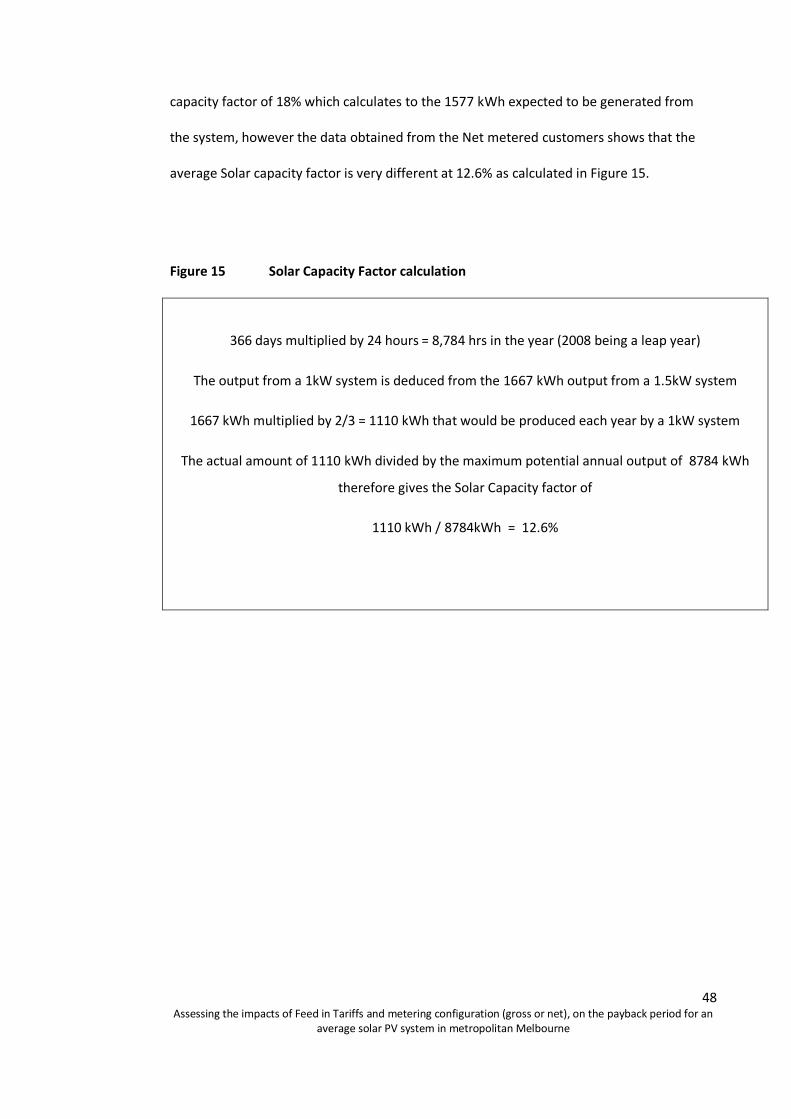
48 Assessing the impacts of Feed in Tariffs and metering configuration (gross or net), on the payback period for an
average solar PV system in metropolitan Melbourne
capacity factor of 18% which calculates to the 1577 kWh expected to be generated from
the system, however the data obtained from the Net metered customers shows that the
average Solar capacity factor is very different at 12.6% as calculated in Figure 15.
Figure 15 Solar Capacity Factor calculation
366 days multiplied by 24 hours = 8,784 hrs in the year (2008 being a leap year)
The output from a 1kW system is deduced from the 1667 kWh output from a 1.5kW system
1667 kWh multiplied by 2/3 = 1110 kWh that would be produced each year by a 1kW system
The actual amount of 1110 kWh divided by the maximum potential annual output of 8784 kWh
therefore gives the Solar Capacity factor of
1110 kWh / 8784kWh = 12.6%

49 Assessing the impacts of Feed in Tariffs and metering configuration (gross or net), on the payback period for an
average solar PV system in metropolitan Melbourne
5.4 Modelling
The DPI model shown in Figure 16 indicates that the Environment Victoria Gross scheme
would produce 394 MWh per year, but at an individual customer cost of $98.55 per year
equating to an almost 10% rise in electricity bills for each customer.
However the $4,000 outlay for the PV system would have a payback period of 4.23 years
and with the scheme due to run for 15 years this would provide an ongoing financial benefit
to the customer once the system has been paid back.
The Victorian Governments’ net model predicts an annual output significantly lower at 157
MWh, however also has a lower impact to all customers with a less than $10 (or 1%)
increase in the average customer bill. The payback period has extended to over 9 years;
however the PV system would still be paid back with at least 5 years of the Feed in Tariff
scheme remaining.
This option meets the customer impact goals previously outlined for a Feed in Tariff scheme
and based on this model outcome would likely have been an instrumental part in
confirming the proposed net Feed in Tariff for Victoria.

50 Assessing the impacts of Feed in Tariffs and metering configuration (gross or net), on the payback period for an
average solar PV system in metropolitan Melbourne
Figure 16 DPI Feed in Tariff – Original model
51 Assessing the impacts of Feed in Tariffs and metering configuration (gross or net), on the payback period for an
average solar PV system in metropolitan Melbourne
5.5 Analysis
5.5.1 Environment Victoria’s Gross Feed in Tariff
Annual Consumption
With the assumptions outlined in Figure 14 showing the average annual consumption for a
customer of 6250 kWh; this is 16% higher than that of an average actual gross metered
customer with an average annual consumption of 5392 kWh per year.
The first impact of this difference is that the average bill for a gross solar PV customer is
lower than the $1,000 average customer equating to $862 per year at the $0.16 retail tariff.
Generation
The calculated generation of 1110 kWh obtained from the gross metered customers is also
lower than the model assumption of 1577 kWh. With a gross metered customer exporting
100% of the generated electricity the annual value of the exported electricity will also be
lower when compared to the modelled outcomes.
The Environment Victoria model assumes that each customer will receive over $946 in
subsidy from the electricity exported back to the grid providing a simple payback period of
4.23 years, but as can be seen in Figure 17, the actual subsidy received would be lower at
$666 which extends the payback period to just over 6 years for the original $4,000 system
outlay.

52 Assessing the impacts of Feed in Tariffs and metering configuration (gross or net), on the payback period for an
average solar PV system in metropolitan Melbourne
Figure 17 Environment Victoria model - subsidy and payback period summary
Gross Metered Model DPI Model Actual
Total subsidy received by customer per year $946.20 $ 666.00
Payback period years 4.23 6.01
The lower actual output from the system is the key determinant in the increase in the
payback periods as the gross model is simply based on the amount of power generated and
exported with no internal household usage to reduce the subsidy.
Variable Feed in Tariff
The Environment Victoria model uses a Feed in Tariff of $0.60, but with alternate tariffs
applied across the actual gross metered customer data, the payback periods decrease as
the value of the Feed in Tariff increases.
The higher value set on the Feed in Tariff the quicker the payback period. At the lower level
tariff at $0.44 the payback period is just over 8 years as seen in Figure 18
Figure 18 Environment Victoria model – subsidy and payback period, customer data
Gross Feed in Tariff
Feed in Tariff $0.44 $0.60 $1.00 $2.00
Total subsidy received by customer per
year $488 $666 $1,100 $2,220
Payback period years 8.19 6.01 3.60 1.80
The full calculations across the variation in the gross Feed in Tariffs can be seen in Appendix
3

53 Assessing the impacts of Feed in Tariffs and metering configuration (gross or net), on the payback period for an
average solar PV system in metropolitan Melbourne
The key aspect limiting the Government support for a gross metered tariff is the significant
impact to non solar PV customers who would need to support the scheme through a $98 a
year increase in their annual bills, which is well outside of the scheme goals already
determined which set a maximum impact of $10 per customer.

54 Assessing the impacts of Feed in Tariffs and metering configuration (gross or net), on the payback period for an
average solar PV system in metropolitan Melbourne
5.5.2 Victorian Government Net Feed in Tariff
The Victorian Governments suggested model is based on a Net metered Feed in Tariff at
$0.60 with the impact to all customers limited to a 1% rise in average bill equating to less
than $10 per year.
The VIC Government model predicts as in the gross model an average level of generation at
1577 kWh for a 1kW system, however the customer data indicates a much lower amount of
1110kWh actually generated.
The impacts of this reduced generation are shown in Figure 19 and on its own with no other
inputs changing would extend the payback period from 9.4 to 13.4 years, simply due to the
lower amounts generated impacting both the export value and the amount offset from own
internal use.
Figure 19 Victorian government net model – impact of lower PV generation
NET DPI Model Actual Data
Export kWh 1577 1110
Subsidy from export - annual $236.40 $166.20
Savings from own use $189.28 $133.28
Total savings per year $425.68 $299.48
Payback period years 9.40 13.36
The export of 1577 has been adjusted in the appendix to take into account the extra day
within 2008 as a Leap Year and shows 1581 kWh

55 Assessing the impacts of Feed in Tariffs and metering configuration (gross or net), on the payback period for an
average solar PV system in metropolitan Melbourne
The model assumes an export rate of 25% of the generated electricity, slightly lower than in
the previous PWC model (30%) which indicates that the customer would use more of the
generated power internally to firstly meet the household load.
The key outcome from the customer data is that it shows a significantly higher percentage
exported, with 47% of the generated electricity being fed back into the grid, indicating a
much greater value obtained from the value of the Feed in Tariff with less used internally at
the lower retail rate.
In isolation, either of these inaccurate assumptions (export level and export %) would have
a large impact on the payback period at $0.60, however the combined impact on the
payback period with less electricity generated but a greater proportion exported is shown
in Figure 20 and indicates a variation from the modelled outcome of only 4 months.
Figure 20 Victorian government net model – payback period summary
NET DPI Model Actual Data
Solar PV Capacity Factor 18% 12.6%
Export kWh 1577 1110
Export % 25% 47%
Subsidy per customer $9.88 $13.28
Increase in average bill 0.99% 2.60%
Subsidy from export $236.40 $318.60
Savings from own use $189.28 $92.64
Total savings per year $425.68 $411.24
Payback period years 9.40 9.73

56 Assessing the impacts of Feed in Tariffs and metering configuration (gross or net), on the payback period for an
average solar PV system in metropolitan Melbourne
5.6 Summary and Results
The DPI modelling assumptions show significant differences between the assumed
modelled data and the actual data obtained from customers with Solar PV.
With the DPI model using the same average consumption for both net and gross customers,
the difference in actual customer consumption between the two metering configurations
hasn’t been factored into the model.
As seen in Figure 20, the modelled net tariff option correlates very closely with the
outcome that would be achieved using actual Net metered customer data.
With a gross model the higher the Feed in Tariff will always equate to a shorter payback
period and although the actual output from a gross metered customer is much lower than
the model, the impacts on the payback period would ensure the system is still paid back
well before the expiry of the Feed in Tariff scheme.
The payback period for the Victorian Governments net model are shown in Figure 21 with
the actual customer data being used to calculate both the subsidy received each year and
the payback period.
Figure 21 Payback periods - net metered - customer data
Net Feed in Tariff
$0.44 $0.60 $1.00 $2.00
Total subsidy received by customer per year $326.28 $411.24 $623.64 $1,154.64
Payback period years 12.26 9.73 6.41 3.46

57 Assessing the impacts of Feed in Tariffs and metering configuration (gross or net), on the payback period for an
average solar PV system in metropolitan Melbourne
The customers’ data has been obtained when the Feed in Tariff was still in discussion mode
and there would have been no financial incentive to have increased the amount exported
to the grid as the overall outcome would have been the same financially.
However it is expected that the introduction of a price differential between the retail rate
and the Feed in Tariff will change some customers usage patterns to maximise the output
from their system, which will in turn reduce the payback periods further and put the
customer in a lot more control of the overall outcomes.
This study has not reviewed the specific site details of each location and it should be
expected that there will be sites which are not optimal to generate at the maximum
capacity due to shading, roof angle etc.
It is expected that these site impacts will account for a proportion of the reduced output
actually achieved when compared to the modelled expectations, but even in these non
optimal locations the customer will have greater control on their ability to impact their
payback period.

58 Assessing the impacts of Feed in Tariffs and metering configuration (gross or net), on the payback period for an
average solar PV system in metropolitan Melbourne
6 Results and discussion
6.1 Modelling
With the modelling outcomes clearly indicating that the Government’s net Feed in Tariff
will meet the goals set for the scheme, it is clear that a customer’s usage level and profile
will be a determining factor in the payback period for an average Solar PV system in
Metropolitan Melbourne through a Feed in Tariff.
A gross metered site under both the PWC and DPI models has its payback period impacted
by both the amount generated as well as the rate of the tariff. With an average 1kW system
generating on average 1100 kWh (originally estimated in the DPI model as 1577 kWh) per
annum the payback period would be determined by the value set for the Feed in Tariff. The
higher the tariff is set the shorter the overall payback period.
The customer usage profile will have no impact in a gross model as the consumption and
generation are both separately measured. This is unlike the net option where the
generated electricity is first supplied to meet the internal household load.
The overall outcome across both metering configurations is that the higher the value
attributed to the tariff the shorter the payback period will be for that configuration. With a
net metered site the retail tariff and the avoided cost also impact the payback period.
The results show the significance of understanding the limitations placed on a model when
using assumptions regarding customers behaviour where it is a critical aspect of the model.
The significant discrepancy between the modelling levels of generation, internal usage and
export volume could have provided an inaccurate final model result, however in the net

59 Assessing the impacts of Feed in Tariffs and metering configuration (gross or net), on the payback period for an
average solar PV system in metropolitan Melbourne
metered DPI model these errors have almost cancelled each other out when reviewing at
the $0.60 tariff with the model and the actual outcomes very close.
The level of electricity exported of PWC (30%) and DPI (25%) underestimates the actual
percentage exported which averaged 47% of the generated electricity.
This level of export has already been obtained in the South Australian market where a study
by the energy network company (ETSA) and referenced in the Firecone paper ‘Options to
increase the update of PV’ (2008)43 indicated that a 50% export rate was achieved, however
the outcome is not included during the Victorian modelling possibly due to the small
sample size that provided this result.
The study also highlights an inherent difficulty with modelling a small specific subset of the
customers using ‘average’ customers data. Across metropolitan Melbourne at the time the
data was obtained there were approx 2500 Solar PV sites from a population of over 3
million customers so reducing the pool of sites from which the average data is calculated.
With energy usage possibly a factor in the customers decision to install a PV system, it
carries an accuracy risk to use in the model the average consumption based on a customer
who doesn’t have the same likely level of interest in overall energy consumption.
43 Firecone Ventures Pty Ltd, 2008, Options to increase the update of small-scale solar power by
Victorian households, Firecone Ventures

60 Assessing the impacts of Feed in Tariffs and metering configuration (gross or net), on the payback period for an
average solar PV system in metropolitan Melbourne
This has been reflected in the average consumption levels in both models of 6250 kWh
(DPI) and 8000 kWh (PWC) when the actual consumption in both the gross and net sites
was much lower, but was also importantly different between the net and gross sites.
For a net metered site using the modelling and actual customer data the impacts on the
payback periods at $0.60 are summarised in Figure 22, with a small difference between the
expected outcomes from the models and the actual outcomes that would be obtained
Figure 22 Payback period comparison – net metered $0.60 tariff
PWC model PWC Actual DPI model DPI Actual
Payback period
years
13.59 14.09 9.38 9.73
The full impacts on the payback period will be better understood when the Feed in Tariff is
introduced and customer behaviour may be changed due to a financial incentive not
available in the current data and with variations in the retail tariff.
Using the DPI Net metered, model the customer data suggest a payback timeframe of 9.73
years, however the data has been obtained during a non Feed in Tariff period and doesn’t
factor in any changes to the customers usage pattern or in the increasing level of
knowledge and awareness obtained by the customer on how to maximise the export.
With all other aspects staying the same, it could be speculated that the Feed in Tariff will
lead to a greater than 50% export level for the average net metered customer, however as
previously indicated although the average sized system is reducing from 1.8 kW in 2007 to
1.2 kW in 2009 the DPI model has been based on a 1 kW system.44
44
Department Environment, Water, Heritage Water and the Arts, 2009, Solar Homes Community
Plan – Watts Installed by month,
http://www.environment.gov.au/sustainability/renewable/pv/pubs/wattsbymonth-dec09.xls
accessed Jan 2010

61 Assessing the impacts of Feed in Tariffs and metering configuration (gross or net), on the payback period for an
average solar PV system in metropolitan Melbourne
There are two straight forward methods in which a customer can further reduce the
payback period at a net metered site.
Firstly, by simply reducing their overall energy consumption at the time the PV is generating
power through more efficient usage. With the amount of power being generated remaining
the same, it would now not need to meet the same level of internal load, allowing more to
be exported and receive the Feed in Tariff rate.
The second method is based on the consumer understanding when their PV system is
generating and exporting power and can help reduce the payback period even though they
make no overall reduction in their total energy consumption. By moving energy usage to a
timeframe outside of the PV generation period, more electricity will be exported and
receive the Feed in Tariff, with the energy use then occurring outside of the PV generation
timeframe. This could have a further benefit to the payback period reduction if this load
shifting occurs to a period of lower retail tariff (Off Peak period) as the customer’s bill will
then also be lower even though they have the same overall level of consumption.
With the interval data obtained from the meters and plans for a national smart meter roll
out program putting interval data into every property the greater availability of billing data
will provide greater opportunities for customers, retailers and networks to develop tariffs
which either reward or penalise usage during constrained periods. Customers will be
penalised for using at Peak load times, but be able to benefit from cheaper periods with
low demand.

62 Assessing the impacts of Feed in Tariffs and metering configuration (gross or net), on the payback period for an
average solar PV system in metropolitan Melbourne
6.2 Data Comparison
The following graphs for actual gross and net customers show the average daily export
amounts and timeframes for export averaged across the month.
It is clear from both Figure 23 and Figure 24, that the generated PV electricity has a short
period where there is a high level of export which correlates with the sun’s position in the
sky.
During the period between 11.30 and 14.30 the majority of the PV electricity is exported
and it is clear that there is a higher daily average exported in the gross sites than the Net for
reasons previously explained.
The impacts on the payback period for a solar PV system indicate that to maximise the
amount of energy fed back into the grid the customer needs to understand when their
system is generating the most electricity, so that they can in turn minimise their internal
consumption in a net metered site.
The gross metered sites provide the most accurate evidence of when a system will be
generating power as the export levels are not impacted through any internal consumption.
With Melbourne’s temperate climate, the summer months are also generally the sunniest
and driest months and hence the greatest levels of generation can be seen from the gross
sites during January with October and December as the next highest.
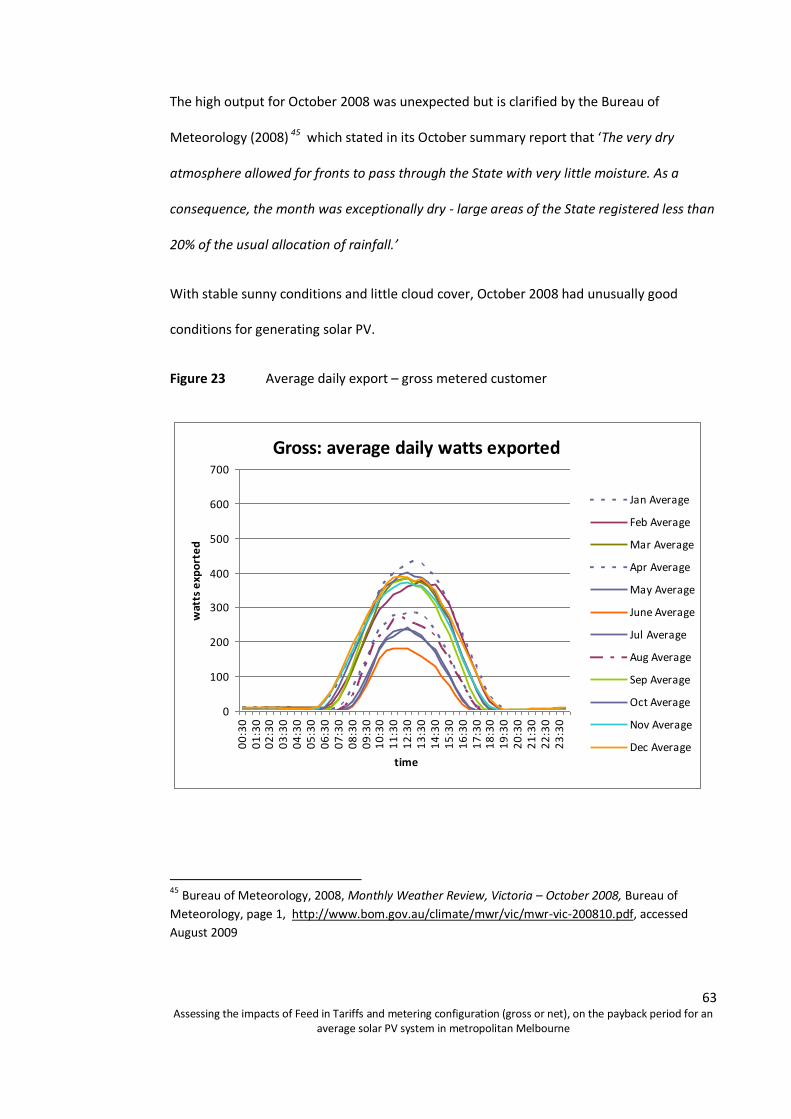
63 Assessing the impacts of Feed in Tariffs and metering configuration (gross or net), on the payback period for an
average solar PV system in metropolitan Melbourne
The high output for October 2008 was unexpected but is clarified by the Bureau of
Meteorology (2008) 45 which stated in its October summary report that ‘The very dry
atmosphere allowed for fronts to pass through the State with very little moisture. As a
consequence, the month was exceptionally dry - large areas of the State registered less than
20% of the usual allocation of rainfall.’
With stable sunny conditions and little cloud cover, October 2008 had unusually good
conditions for generating solar PV.
Figure 23 Average daily export – gross metered customer
Gross: average daily watts exported
0
100
200
300
400
500
600
700
00
:30
01
:30
02
:30
03
:30
04
:30
05
:30
06
:30
07
:30
08
:30
09
:30
10
:30
11
:30
12
:30
13
:30
14
:30
15
:30
16
:30
17
:30
18
:30
19
:30
20
:30
21
:30
22
:30
23
:30
time
wat
ts e
xpo
rte
d
Jan Average
Feb Average
Mar Average
Apr Average
May Average
June Average
Jul Average
Aug Average
Sep Average
Oct Average
Nov Average
Dec Average
45 Bureau of Meteorology, 2008, Monthly Weather Review, Victoria – October 2008, Bureau of
Meteorology, page 1, http://www.bom.gov.au/climate/mwr/vic/mwr-vic-200810.pdf, accessed
August 2009

64 Assessing the impacts of Feed in Tariffs and metering configuration (gross or net), on the payback period for an
average solar PV system in metropolitan Melbourne
Figure 24 Average daily export – net metered customer
Net: average daily watts exported
0
100
200
300
400
500
600
700
00
:30
01
:30
02
:30
03
:30
04
:30
05
:30
06
:30
07
:30
08
:30
09
:30
10
:30
11
:30
12
:30
13
:30
14
:30
15
:30
16
:30
17
:30
18
:30
19
:30
20
:30
21
:30
22
:30
23
:30
wat
ts e
xpo
rte
dJan Average
Feb Average
Mar Average
Apr Average
May Average
Jun Average
Jul Average
Aug Average
Sep Average
Oct Average
Nov Average
Dec Average
From a Metropolitan Melbourne aspect the dry summer months are the ideal periods for
generation with a high sun angle and longer periods of unbroken sunshine and ensuring a
customer is maximising their output during this time will have a large impact on their
payback period.
Minimising internal consumption during the middle of the day during the summer months
will help a customer reduce their payback period further.
Although Figure 24 shows a much lower level of output for a net customer, it needs to be
taken into account that this outcome was achieved when there was no additional incentive
to increase the output. It would be expected that post implementation of a Feed in Tariff
that there will be an average increases in the daily exported amounts.

65 Assessing the impacts of Feed in Tariffs and metering configuration (gross or net), on the payback period for an
average solar PV system in metropolitan Melbourne
6.3 Customers Knowledge
One area not directly assessed in this study is the level of customer knowledge both in
relation to the PV system they have installed as well as their ability to extract the maximum
benefit.
There is an assumption that a customer who has invested at least $4,000 in a solar PV
system prior to a Feed in Tariff being available will have a greater than average awareness
of energy consumption or energy efficiency tools.
The technical system knowledge and operational maintenance do not appear to be at this
same level, as despite the average system size being used for this study there is a large
disparity between the highest and lowest levels of export at the customer’s site. With the
highest and lowest net sites showing a range from 2181 kWh to 26 kWh exported and the
gross sites showing a range from 3601 kWh down to a lowest at 298 kWh exported.
In 5 cases the data extracted from the customer’s meter shows there are periods of up to 4
weeks where the level of exported electricity is at zero for the entire day.
With other customers generating at the same time it is clearly not a climate issue or power
outage and could be due to the non operation or fault within their PV system.
The customer’s lack of awareness as to whether the system is operational will be important
aspects in their ability to reduce the payback period. The lack of operational understanding
may in fact increase the payback period due to lost opportunities during down time. The
average export obtained for this study includes the data where a system appears to be non
operational and makes it a more realistic outcome and more accurate reflection of what
will likely occur with a tariff introduced.

66 Assessing the impacts of Feed in Tariffs and metering configuration (gross or net), on the payback period for an
average solar PV system in metropolitan Melbourne
It is unknown whether the customers were immediately aware of the non operating
periods of their systems or only noticed it after an external event such as power outage or
the electricity bill was received and then arranged for their system to be checked.
With the payback period impacted by the amount of energy exported, a system problem
during the sunnier summer months could have a disproportionate impact on the
customer’s payback period if it reduced their output at that time.
As this study has been undertaken prior to a Feed in Tariff there will be future opportunities
to assess the customer’s data and their ability to load shift and the impacts this has on the
amount exported as well as the length of non operational systems as an overall percentage
of lost opportunity.
With the greatest level of export during the middle of the day the payback period will be
shorter in a net site for those customers who are away from their property or who can
minimise their overall consumption. A working family with children at school and the
house empty during the lunchtime period will have a shorter payback period than to an
elderly person or young family who are at home during the day.
The benefit from a net metered Feed in Tariff scheme will reduce the payback periods for
those properties with low usage during the midday peak generation period.
A combination of lower overall consumption, load shifting away from peak PV generating
periods and shifting load to cheaper retail tariffs will all provide additional opportunities for
a consumer to reduce the payback period through maximising the amount of power being
exported and the price differential obtained.

67 Assessing the impacts of Feed in Tariffs and metering configuration (gross or net), on the payback period for an
average solar PV system in metropolitan Melbourne
As per Figure 1 the rapid increase in customers installing a solar PV system is likely due to
the pending implementation of the net Feed in Tariff and the customers' awareness or
belief that they can use this as a means to reduce their energy bills.
Anecdotal evidence suggest that customers currently installing a solar PV system during
late 2009 have significantly less understanding and awareness of the impacts and how to
best manage their export to impact the payback period than those who have installed a
solar PV system prior to 2009.
However with many of the installations now being offered at very low cost or at no charge
(Clear Solar46) the payback periods are also subsequently almost nonexistent so the drivers
for the customers to export generated PV may now also be different.
For some customers the Feed in Tariff will provide strong drivers to maximise the output so
that the system is paid back quickly, however for others with very little outlay on a system,
the simple reduction in their energy bill through offsetting usage from the grid by the PV
generation may be enough for them to be accepting of the outcomes and timeframe.
It is expected however that there will also be some customers who have installed solar PV
and who expect it to pay itself back much quicker than can be realistically expected.
These factors will be identified post implementation of the tariff and provide additional
opportunity for future study.
46 Clear Solar (www.clearsolar.com.au) are one example where a 1kW system was advertised as
being installed without cost, as the Government rebate of $8,000 and the selling of the Renewable
Energy Certificates covered the costs and provided a profit margin to the installers.

68 Assessing the impacts of Feed in Tariffs and metering configuration (gross or net), on the payback period for an
average solar PV system in metropolitan Melbourne
6.4 Demand Management
As shown previously in Figures 23 and 24, with the daily export profiles, solar PV generation
occurs is at its maximum during the 11.30 to 14.30 period each day.
Without the data streams and profiles being available for non PV customers for assessment
due to the limited extent of interval meters, it is not possible to easily confirm the ‘average’
non PV customer’s daily usage profile.
However, Figure 25 shows the usage profile for the average gross customer which shows an
early morning peak which would likely be due to cheaper rate hot water heating and then a
steady increase in consumption levels during the day before an early evening peak at 17.30
through to 20.30. The Gross customer profile has been used in the analysis due to its
separation from the export data so it accurately reflects the levels of PV generated and
exported from the site.
Figure 25 Daily usage profile – gross metered customer
Gross: average daily usage
0
100
200
300
400
500
600
700
00
:30
01
:30
02
:30
03
:30
04
:30
05
:30
06
:30
07
:30
08
:30
09
:30
10
:30
11
:30
12
:30
13
:30
14
:30
15
:30
16
:30
17
:30
18
:30
19
:30
20
:30
21
:30
22
:30
23
:30
time
wat
ts e
xpo
rte
d
Jan Average
Feb Average
Mar Average
Apr Average
May Average
June Average
Jul Average
Aug Average
Sep Average
Oct Average
Nov Average
Dec Average

69 Assessing the impacts of Feed in Tariffs and metering configuration (gross or net), on the payback period for an
average solar PV system in metropolitan Melbourne
Comparison of the times of peak generation and the times of peak load show that they do
not coincide; with the afternoon peak load occurring after the PV system has almost
stopped generating. This would indicate that solar PV on its own is not an effective tool in
reducing peak network demand and hence as a demand management tool on the network
without some sort of storage to use the energy generated by PV during peak periods of
peak network load.
This outcome replicates the work of Watt et al (2006)47 and which studied the peak
generation and peak load timeframes from the Newington Olympic Village in Sydney, with
an outcome with a very similar pattern with peak export between 11am and 2pm and then
peak network load from 7.30pm to 9pm. However a separate study by Borenstein (2005)48
found that in the California market PV production peaked only slightly earlier than network
demand peak and would provide a demand management response. This study has not
looked at the different climatic conditions and customers usage profile within the California
market.
The average daily consumption profile from an average net metered customer, measured
at the meter is shown in Figure 26. The impacts of the solar PV can be seen when compared
to Figure 25, with a drop in consumption used from the grid during the 11.00 to 15.00
period when the internal usage is being supported from the PV system. The 02.00 peak is
also not apparent with net metered sites who may have switched to gas hot water or who
have control of the switching times for their storage hot water systems and manage them
accordingly.
47 Watt, M., Passey, R. Barker, F. and Rivier, J., 2006, Newington Village – An Analysis of Photovoltaic Output, Residential Load and PV’s ability to Reduce Peak Demand, Report for the NSW Department of Planning, CEEM UNSW.
48
Borenstein, S, 2005, Valuing the Time varying Electricity Production of Solar Photovoltaic Cells,
Centre for the Study of Energy Markets, University of California, ,pg 7

70 Assessing the impacts of Feed in Tariffs and metering configuration (gross or net), on the payback period for an
average solar PV system in metropolitan Melbourne
In both the gross and net sites the dedicated off peak tariff for the hot water service has
been removed when the solar meter has been installed
This is supported by the work of Watt et al (2004)49 where it was also found that the PV
output didn’t coincide with the peak load periods at a residential level and to have an
impact on demand management would likely need storage or displacement of the PV
output curve.
With the lower consumption from the grid during the early afternoon period, the effects of
a solar PV customer also enhance the ‘peakiness’ of the supply required from the grid as
the PV output drops just prior to the peak load period.
49
Watt. M., S. Partlin, M. Oliphant, H. Outhred, I. MacGill, E. Spooner, “The Value of PV in Summer Peaks”, 19th European Photovoltaic Solar Energy Conference, Paris, France, June 2004.

71 Assessing the impacts of Feed in Tariffs and metering configuration (gross or net), on the payback period for an
average solar PV system in metropolitan Melbourne
Figure 26 Daily usage profile – net metered customer
Net: average daily usage
0
100
200
300
400
500
600
700
00
:30
01
:30
02
:30
03
:30
04
:30
05
:30
06
:30
07
:30
08
:30
09
:30
10
:30
11
:30
12
:30
13
:30
14
:30
15
:30
16
:30
17
:30
18
:30
19
:30
20
:30
21
:30
22
:30
23
:30
time
wat
ts e
xpo
rte
d
Jan Average
Feb Average
Mar Average
Apr Average
May Average
Jun Average
Jul Average
Aug Average
Sep Average
Oct Average
Nov Average
Dec Average
The highest afternoon peaks for net metered customers as seen in Figure 26, are during
June, July and August which would indicate an associated heating load, however there is
not the same Peak during the summer months when the network air conditioning load is at
its highest and the network is the most constrained during the early evening period. Future
work would be required to understand the prevalence of air conditioning in sites which
have installed solar PV as to whether they have the same air conditioning requirements due
to other energy efficiency aspects.
In a study by Pop, 200550 based on a South Australian load profile, the peak supply
requirements from the South Australian grid were between 12.00 and 15.00 which
correlated closely with the PV peak export timeframes on a January day, however this is not
50 Pop.M., Watt.M., Rivier.J., Birch.A., Tariff Implications for the Value of PV to Residential Customers, Centre for
Energy & Environmental Markets, UNSW,

72 Assessing the impacts of Feed in Tariffs and metering configuration (gross or net), on the payback period for an
average solar PV system in metropolitan Melbourne
replicated in the Metropolitan Melbourne results and the specific network load
requirements will vary between states due to climate zones and demand needs across the
country.
Zahedi, 200851 also identified that ‘different states need a different feed in tariff...and that a
single feed in tariff of Solar PV electricity is not appropriate’. Each state needs to determine
its Feed in Tariff to meet the goals required for the scheme and one size will not fit all
cases.
Further investigation into just the summer usage profiles for both the actual gross and net
metered customers are shown in Figure 27 and Figure 28.
It can be seen that the afternoon peak is not overly pronounced in the Gross customer
profile, but is clearly indicated for the net metered sites with the afternoon consumption
being lower during the PV export supported period and then increasing rapidly.
51 Zahedi, A, 2008, Development of an economical model to determine an appropriate feed in tariff
for grid connected PV electricity in all states of Australia, Renewable & Sustainable Energy Reviews.
Available to purchase from www.wciencedirect.com

73 Assessing the impacts of Feed in Tariffs and metering configuration (gross or net), on the payback period for an
average solar PV system in metropolitan Melbourne
Figure 27 Average daily summer usage - gross metered customer
Although solar PV doesn’t provide an effective demand management tool by
supplementing the grid during peak load periods, these customers’ sites are also not
contributing significantly to the Peak summer load demand.
Rather than using the generated solar PV as a demand management tool, it appears just by
installing solar PV system a customer reduces the peak impacts associated with the hot
summer afternoon air conditioning load and reduces the strain on the network.
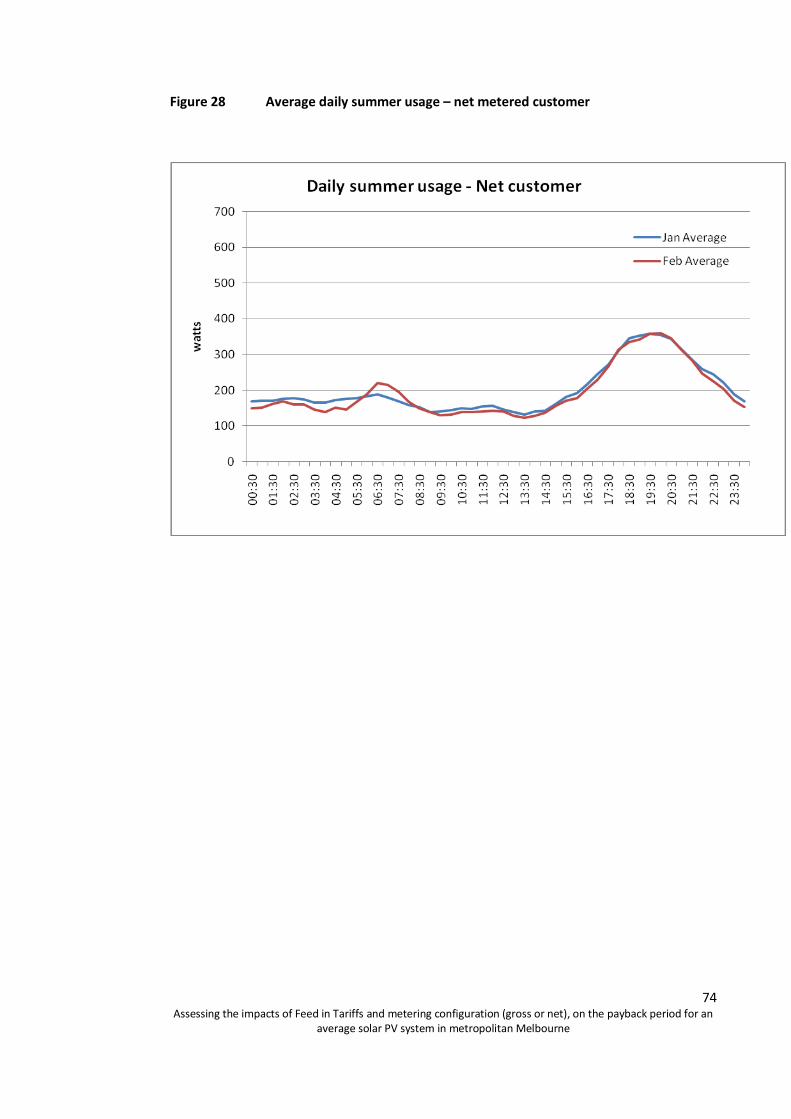
74 Assessing the impacts of Feed in Tariffs and metering configuration (gross or net), on the payback period for an
average solar PV system in metropolitan Melbourne
Figure 28 Average daily summer usage – net metered customer

75 Assessing the impacts of Feed in Tariffs and metering configuration (gross or net), on the payback period for an
average solar PV system in metropolitan Melbourne
6.5 Historical Consumption 2007 and 2008
The interval data used in the Feed in Tariff analysis relates to 2008, however for the
purpose of the comparison below, quarterly energy consumption data from 2007 was also
obtained for 60 net and 42 gross sites studied.
The total metered consumption per annum for both the average gross and net customer is
shown below in Figure 30, for 60 net and 42 gross metered sites.
Figure 29 Annual consumption comparison where PV data available for 07 and 08
It has been assumed that the output of the PV systems in the net sites has remained
consistent and it is just the electricity required from the grid which has been measured. As
previously identified a net metered customer has a greater incentive to reduce their overall
internal consumption as it will help maximise the export back into the grid and although in
both cases there has been an overall drop in consumption between 2007 and 2008, it is
much more pronounced in the net metered sites having a 2.9% or 121 kWh per year
decrease.
This reduction may be driven by greater consumer awareness of their energy usage and
may be the start of energy efficiency gains that will further increase with the introduction
of a Feed in Tariff or could be due to a natural fluctuation in demand levels.
Net Metered Consumption
(kWh)
Gross Metered Consumption
(kWh)
2008 3923 5392
2007 4042 5413
% Difference -2.9% -0.4%

76 Assessing the impacts of Feed in Tariffs and metering configuration (gross or net), on the payback period for an
average solar PV system in metropolitan Melbourne
7 Aims achieved
The aims of the study to assess the impacts of Feed in Tariff value and the metering
configuration on the payback period for an average solar PV system have been achieved in
that it has identified that both the tariff and the metering configuration play an important
role in determining the expected payback period.
The payback periods determined by the DPI and PWC modelling are at best a guide, with
the significant variations between the modelling assumptions and the customer data
introducing a degree of error to the model when factoring in customer behaviour and
optimum operating conditions for a solar PV system.
The results using customer data are significant with Victorian Government planning to
introduce a net Feed in Tariff at $0.60 per kWh from the start of November 2009. The
modelling using actual customer data supports the proposed net Feed in Tariff as the
option to provide certainty of investment and a reasonable payback period, whilst also
minimising the financial impacts to customers without solar PV customers through
increased tariffs to subsidise the scheme. However the goal of the scheme of impacting the
customer by less than $10 has not been achieved as the overall subsidy per customer is
$13.28
There is an additional significant outcome regarding the customers’ behaviour and usage
profile and the impact this will have on the payback period for their system. Through the
understanding of their export profile and internal usage, the control of the amount of
energy exported is very much with the customer, which will then determine the payback
periods.

77 Assessing the impacts of Feed in Tariffs and metering configuration (gross or net), on the payback period for an
average solar PV system in metropolitan Melbourne
The aim to assess the effectiveness of PV as a demand management tool has also been
achieved and is clear that the peak export periods do not coincide with the peak network
load periods. Within the Melbourne Metropolitan region solar PV is not an effective
demand management tool as it is not exporting at the same time as the peak load.
However the aspects of lower overall consumption and the speculation that those PV
customers are not also high energy users (minimal air conditioning) suggests that a greater
PV penetration will provide demand management benefits through overall more efficient
and lower usage.
The use of customer data provides an increased degree of accuracy to the PWC and DPI
models which at the time they were completed provided a good indication of solar PV
system costs: however with the rapid changing conditions (closure of the Solar Homes and
Community Plan) and system costs reducing, the modelling will need to be continually
adapted to take into account the current costs for an installed PV system and the overall
impact on the payback periods.
The degrees of energy efficiency will also likely increase following the start of a Feed in
Tariff and the customer’s usage profiles should be reviewed after the introduction of the
tariff to understand the current export levels and percentage.
78 Assessing the impacts of Feed in Tariffs and metering configuration (gross or net), on the payback period for an
average solar PV system in metropolitan Melbourne
8 Conclusion
The introduction of a defined rate for a Feed in Tariff will provide clarity regarding the
payback periods the customer should expect and realistically achieve from their investment
in the installation of a solar PV system.
The customers used for this study have all installed solar PV during 2007 or earlier, prior to
any clear expectations as to when a Feed in Tariff would be introduced.
Currently neither metering configuration provides a better nor worse outcome as all
exported PV electricity is effectively used as an offset at the same rate as the retail tariff.
Energy used internally in a net metered site provided the same financial benefit as energy
exported directly to the grid in a gross metered site. The impacts on the final electricity bill
would be financially the same with GST applied against both methods.
It is clear from both the modelling and the customer data that a gross metered site will
have a shorter payback than a net site at the same tariff, with the higher the Feed in Tariff,
the shorter the payback period.
The goals outlined for the Victorian scheme determined that a net Feed in Tariff is the only
realistic option due to tariff impacts for non PV customers and that a gross tariff provides
no additional energy efficiency incentive.
Customers will have better control of their individual payback periods due to the
introduction of a net metered Feed in Tariff and the key conclusions from this study are
summarised below.

79 Assessing the impacts of Feed in Tariffs and metering configuration (gross or net), on the payback period for an
average solar PV system in metropolitan Melbourne
1. The easiest way in which the payback period can be reduced is to increase the tariff
rate of the Feed in Tariff.
2. A net metered system provides opportunities for consumers to reduce the payback
period further as the outcomes have been calculated based at a time with no price
differential between ‘feed in’ and ‘retail’ tariffs during 2008.
3. A net metered customer can influence the amount of power exported to the grid.
The more effective implementation of these factors can further reduce the payback
period.
a. Reduce total consumption so that the PV export volumes become a greater
overall component of the energy bill – thereby increasing the value of the
export.
b. Minimise consumption during the periods when the PV is exporting at its
peak (11.00 to 15.00) by load shifting internal consumption away from this
period
c. Load shift consumption to an Off Peak period and be charged a lower retail
tariff, thereby further increasing the price differential between feed in rate
and retail rate.
d. Ensure the system is optimally positioned, operating and monitor the
export levels to ensure it is exporting what is expected and adjust
consumption accordingly to maximise output
80 Assessing the impacts of Feed in Tariffs and metering configuration (gross or net), on the payback period for an
average solar PV system in metropolitan Melbourne
4. Solar PV consumers are more efficient energy users with a net metered customer
only using on average 60% and a gross metered customer using 67% of the average
consumer. The modelling assumptions did not take into account any differences in
consumption between a PV and non PV customer.
5. The consumption difference has occurred despite there not being a Feed in Tariff as
an incentive to minimise consumption. This study recommends that the 2009, 2010
and 2011 data is also obtained for these sites so as to assess the impacts post
introduction of the Feed in Tariff and to enable comparison against the average non
solar PV consumer.
6. The annual consumption for both gross and net metered sites shows a slight drop
in overall usage and this would need to be studied post the implementation of a
Feed in Tariff to assess whether the drop in Net metered sites increase in rate as
the consumer aims to maximise their ability to export to the grid
7. Consumers who have previously installed gross metering may review the
effectiveness of their system configuration with the introduction of the Feed in
Tariff which is applicable only against net metered sites and there may be benefits
in switching to a net metered site to take advantage of the Feed in Tariff and not
just getting the buyback rate at the retail tariff.
8. Only two years worth of data provides for minimal comparison but should be part
of a longer term study which can review over an extended period the variation in
consumption as well as against a non solar PV customer
9. An education program is also recommended for solar PV consumers to enable them
to better understand their consumption and export profile and to enable them to
81 Assessing the impacts of Feed in Tariffs and metering configuration (gross or net), on the payback period for an
average solar PV system in metropolitan Melbourne
maximise the benefit of the proposed scheme. Energy efficiency advice can further
enhance the effectiveness of the scheme and in turn reduce further the payback
period.
10. Solar PV is not an effective demand management tool as the peak solar generation
period does not coincide with the peak usage periods and has there is minimal
export during peak network load.
11. Ongoing access to the metering data as well as the ability to interpret the data will
provide customers with a greater ability to impact their payback period. As all solar
customers will have an interval meter, customers should have a method to obtain
this data in addition to just receiving an electricity bill so as to best manage their
export.
12. With the rapid installation of solar PV installations during 200952 further
investigation is recommended to assess the consumption profiles against the new
installations and those from pre 2007.
With a smart meter roll out program commencing in 2009 across Victoria greater volumes
of data will be readily available for all customers. This will also likely see the introduction of
Time of Use tariffs with greater variation in price between Peak and Off Peak periods and
will likely have a further impact on the customer’s consumption profile when it becomes
more of an incentive to switch load out of the peak cost periods.
52 Department Environment, Water, Heritage Water and the Arts, 2009, Solar Homes Community Plan – Watts
Installed by month, http://www.environment.gov.au/sustainability/renewable/pv/pubs/wattsbymonth-
dec09.xls accessed Jan 2010

82 Assessing the impacts of Feed in Tariffs and metering configuration (gross or net), on the payback period for an
average solar PV system in metropolitan Melbourne
However with the planned Feed in Tariff set at $0.60 for 15 years, the price differential
between retail and feed in tariff to encourage customers to install solar PV needs to be
maintained. At the time of the modelling the average electricity price was $0.16 however
Time of Use prices for 2009 have already increased as far as $0.25753 for Peak rates and
may during the lifetime of the scheme become more expensive than the Feed in Tariff at
which point a customer may be better to switch back to a gross metered configuration and
sell the generated electricity back at a higher retail rate rather than the $0.60 set for the
Feed in Tariff.
This concern with the ability to react flexibly and quickly was identified by Wiser, Hamrin
and Wingate (2002)54, and it may eventuate that the 15 years life cycle of the scheme will
be found to be too long, as retail prices may increase to a level higher than the Feed in
Tariff. The impact of an Emissions Trading Scheme or carbon tax on retail electricity prices
was not factored into the PWC and DPI modelling which were developed using the
assumptions available at the time of modelling.
This paper only analyses the impacts on payback periods and demand management from a
simple energy usage aspect and doesn’t take into account the additional network
augmentation cost savings or the retailer impacts through pricing and the wholesale
market. However the clear outcome is that the most effective Solar PV Feed in Tariff for
Victoria is a net metered configuration with the Feed in Tariff set at $0.60. Although not
53 Your Choice – energy rate comparison website. Selecting Time of Use tariff in United Energy area,
highest price obtained from Australian Power and Gas of $0.2575 Peak and $0.1036 Off Peak
www.yourchoice.vic.gov.au
54 Wiser, R., Hamrin, J., Wingate, M., Renewable Energy Policy Options for China: A Comparison of
Renewable Portfolio Standard, Feed in Tariffs and Tendering Policies, Centre for Resource Solutions,
available on line at http://www.resource-solutions.org/pub_pdfs/IntPolicy-Feed-in_LawsandRPS.pdf
accessed July 2009.
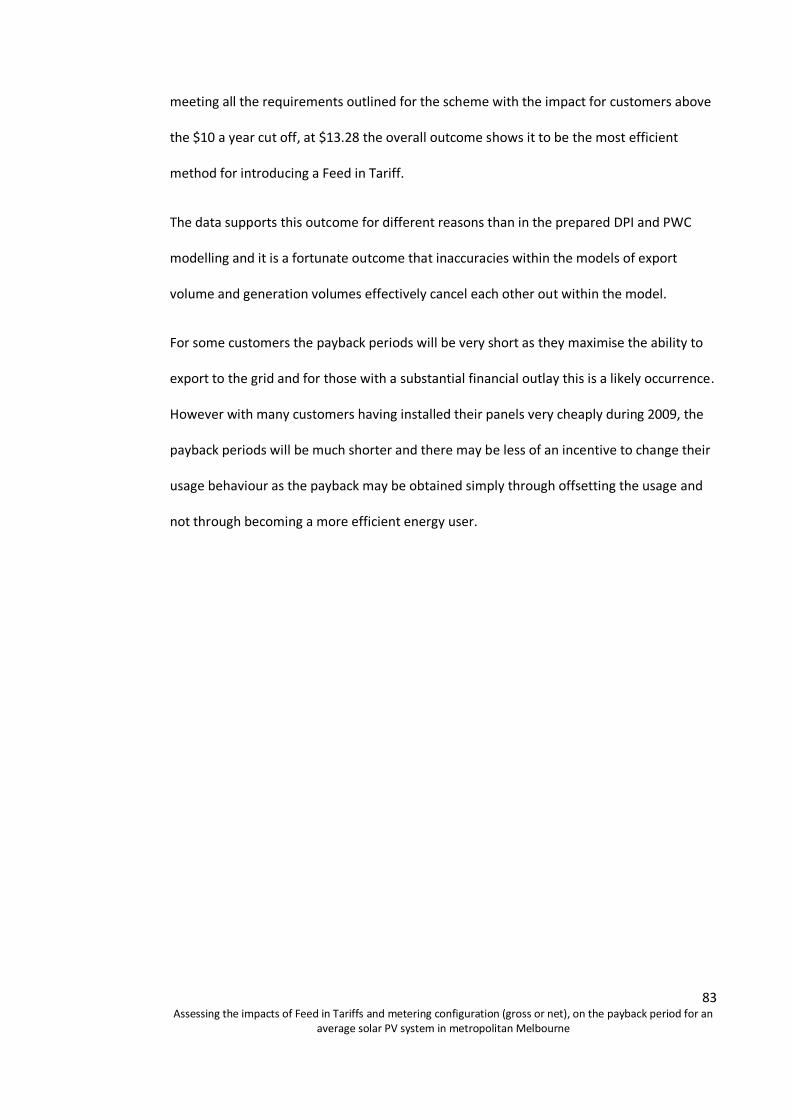
83 Assessing the impacts of Feed in Tariffs and metering configuration (gross or net), on the payback period for an
average solar PV system in metropolitan Melbourne
meeting all the requirements outlined for the scheme with the impact for customers above
the $10 a year cut off, at $13.28 the overall outcome shows it to be the most efficient
method for introducing a Feed in Tariff.
The data supports this outcome for different reasons than in the prepared DPI and PWC
modelling and it is a fortunate outcome that inaccuracies within the models of export
volume and generation volumes effectively cancel each other out within the model.
For some customers the payback periods will be very short as they maximise the ability to
export to the grid and for those with a substantial financial outlay this is a likely occurrence.
However with many customers having installed their panels very cheaply during 2009, the
payback periods will be much shorter and there may be less of an incentive to change their
usage behaviour as the payback may be obtained simply through offsetting the usage and
not through becoming a more efficient energy user.

84 Assessing the impacts of Feed in Tariffs and metering configuration (gross or net), on the payback period for an
average solar PV system in metropolitan Melbourne
References
Access Economics Pty Limited, 2008, The Economics of Feed in Tariffs for Solar PV in Australia - Report by Access Economics Pty Limited for Clean Energy Council, Access Economics http://www.cleanenergycouncil.org.au/cec/resourcecentre/reports/mainColumnParagraphs/00/text_files/file9/Access%20Economics%20-%20The%20Economics%20of%20Feed-in%20Tariffs%20for%20solar%20PV%20in%20Australia%20-%2020Nov08.pdf, accessed June 2009 Australian Energy Market Operator, 2009, MDM File Format and Load Process, Australian
Energy Market Operator, http://www.aemo.com.au/electricityops/0630-0014.pdf,
accessed August 2009
Australian Energy Market Operator (AEMO), www.aemo.com.au, The National Energy Market (NEM) supplies over $10 billion worth of electricity to 8 million end users annually. Australian Energy Market Operator (AEMO), www.aemo.com.au Australian Government, Department of Environment Water Heritage and the Arts, 2009,
Solar Homes and Communities Plan ‘applications grew to...approximately 6,043 per week in
May 2009’ and the scheme closed with 63,000 applications to be processed.
http://www.environment.gov.au/settlements/renewable/pv/history.html accessed Oct 09
Australian Government, Solar Homes and Communities Plan, background and statistics
available at. http://www.environment.gov.au/settlements/renewable/pv/index.html.
Graph has been created by separating Victorian connections from the national statistics.
Borenstein, S, 2005, Valuing the Time varying Electricity Production of Solar Photovoltaic
Cells, Centre for the Study of Energy Markets, University of California,
,http://repositories.cdlib.org/ucei/csem/CSEMWP-142 pg 7 accessed June 2009
Brumby, J, 2008, Feed in Tariff Media Release – Victorians to benefit from the fairest and
best solar feed in tariff scheme in Australia, Dept of the Premier, Victorian Government
http://www.premier.vic.gov.au/minister-for-energy-resources/victorians-to-benefit-from-
the-fairest-and-best-solar-feed-in-tariff-scheme-in-australia.html, accessed May 2009
Bureau of Meteorology, 2008, Monthly Weather Review, Victoria – October 2008, Bureau of
Meteorology, page 1, http://www.bom.gov.au/climate/mwr/vic/mwr-vic-200810.pdf,
accessed August 2009
Department Environment, Water, Heritage Water and the Arts, 2009, Solar Homes
Community Plan – Watts Installed by month,
http://www.environment.gov.au/sustainability/renewable/pv/pubs/wattsbymonth-
dec09.xls accessed Jan 2010

85 Assessing the impacts of Feed in Tariffs and metering configuration (gross or net), on the payback period for an
average solar PV system in metropolitan Melbourne
Department of Primary Industries, 2009, DPI_FitModelling_v2.xls, Department of Primary
Industries,
http://www.dpi.vic.gov.au/dpi/dpinenergy.nsf/LinkView/D34458A2CAFF8F4ACA25758A001
47A3D4CAC723B1D538D66CA25740C000D2004/$file/DPI_Fit%20Model.pdf, accessed April
2009
The Department of Primary Industries is responsible for agriculture, fisheries, earth
resources, energy and forestry in Victoria, Summary of DPI’s Feed in Tariff forum which
discussed the fair price and values for a Feed in Tariff is found at,
http://www.dpi.vic.gov.au/dpi/dpinenergy.nsf/LinkView/51D8BB7390CE8683CA257457000
CDFF74CAC723B1D538D66CA25740C000D2004/$file/Stakeholder%20Forum%2028%20Sep
t%202007%20Summary.pdf
Essential Services Commission, 2009, Electricity Customer metering Code, Essential Services
Commission http://www.esc.vic.gov.au/NR/rdonlyres/D6EF0BF2-EF8E-4C23-8FE8-
5620D2F6E204/0/CODElectricityCusomterMeteringCode20090603.pdf, accessed Dec 2009
Firecone Ventures Pty Ltd, 2008, Options to increase the update of small-scale solar power
by Victorian households, Firecone Ventures
http://www.dpi.vic.gov.au/dpi/dpinenergy.nsf/LinkView/0A73AE7F98408E28CA25758A001
3C1804CAC723B1D538D66CA25740C000D2004/$file/Firecone%20Report%20April%202008
.pdf, accessed April 2009
McLennan Magasanik Associates, August 2008, Final Report to Victorian Department of Primary Industries - Benefits and Costs of the Victorian FIT Scheme, Department of Primary Industries http://www.dpi.vic.gov.au/dpi/dpinenergy.nsf/LinkView/9AD12D2CDA7D0629CA257589007E79F14CAC723B1D538D66CA25740C000D2004/$file/MMA_DPI%20Final%20Report%2029%20Aug%2008.pdf, accessed April 2009
McLennan Magasanik Associates, November 2008, Final Report to Victorian Department of
Primary Industries - Benefits and Costs of the Victorian FIT Scheme, Department of Primary
Industries
http://www.dpi.vic.gov.au/dpi/dpinenergy.nsf/LinkView/C1A0F2EDE005305CCA257589007
E15D64CAC723B1D538D66CA25740C000D2004/$file/MMA_DPI%20Report%2017%20Nov
%2008.pdf, accessed April 2009
Perez, F. 2009, Internal Jemena document, not available externally
Pop, M., Watt, M., Rivier, J., Birch, A., Tariff Implications for the Value of PV to Residential
Customers, Centre for Energy & Environmental Markets, UNSW,
http://www.ceem.unsw.edu.au/content/documents/PopSolar2005Revised2.pdf, accessed
Jun 2009
Pop, M., 2005, The Value of Distributed Urban Residential PV Electricity in the Australian
NEM, Practicum report, Centre for Energy & Environmental Markets, UNSW Sydney.

86 Assessing the impacts of Feed in Tariffs and metering configuration (gross or net), on the payback period for an
average solar PV system in metropolitan Melbourne
Pricewaterhouse Coopers, 2008, Net Metering Analysis, Pricewaterhouse Coopers,
http://www.dpi.vic.gov.au/dpi/dpinenergy.nsf/LinkView/071B28828752D0EACA25758A001
405074CAC723B1D538D66CA25740C000D2004/$file/PWC%20Modelling.pdf, accessed
April 2009
United Energy Distribution, 2009, Distribution Area Map, United Energy Distribution
http://www.ue.com.au/industry/distributionMap.asp, accessed October 2009
Victorian Energy Networks Corporations (VENCORP), 2008, Electricity Distribution Annual
Tariff Report 2008, VENCORP, www.vencorp.com.au, accessed April 2008.
Watt. M., S. Partlin, M. Oliphant, H. Outhred, I. MacGill, E. Spooner, “The Value of PV
in Summer Peaks”, 19th European Photovoltaic Solar Energy Conference, Paris, France,
June 2004.
Watt, M., Passey, R. Barker, F. and Rivier, J., 2006, Newington Village – An Analysis of
Photovoltaic Output, Residential Load and PV’s ability to Reduce Peak Demand, Report for
the NSW Department of Planning, Centre for Energy & Environmental Markets UNSW.
Wiser, R, Hamrin, J, Wingate, M, 2002, Renewable Energy Policy Options for China: A
Comparison of Renewable Portfolio Standard, Feed in Tariffs and Tendering Policies, Centre
for Resource Solutions
Zahedi, A, 2008, Development of an economical model to determine an appropriate feed in
tariff for grid connected PV electricity in all states of Australia, Renewable & Sustainable
Energy Reviews.

87 Assessing the impacts of Feed in Tariffs and metering configuration (gross or net), on the payback period for an
average solar PV system in metropolitan Melbourne
Appendices

88 Assessing the impacts of Feed in Tariffs and metering configuration (gross or net), on the payback period for an
average solar PV system in metropolitan Melbourne
APPENDIX 1 DPI Feed in Tariff model
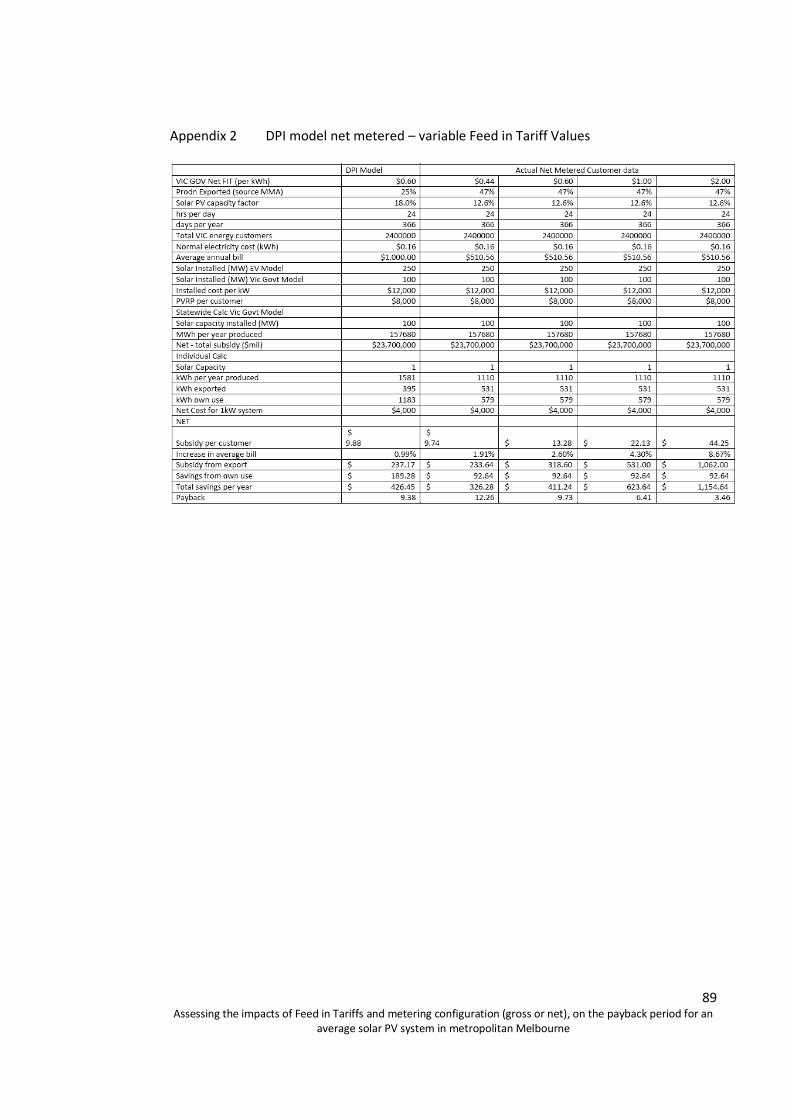
89 Assessing the impacts of Feed in Tariffs and metering configuration (gross or net), on the payback period for an
average solar PV system in metropolitan Melbourne
Appendix 2 DPI model net metered – variable Feed in Tariff Values

90 Assessing the impacts of Feed in Tariffs and metering configuration (gross or net), on the payback period for an
average solar PV system in metropolitan Melbourne
Appendix 3 DPI model gross metered – variable Feed in Tariff values

1 Assessing the impacts of Feed in Tariffs and metering configuration (gross or net), on the payback period for an average solar PV system in metropolitan Melbourne
Appendix 4 Data file example – de identifed
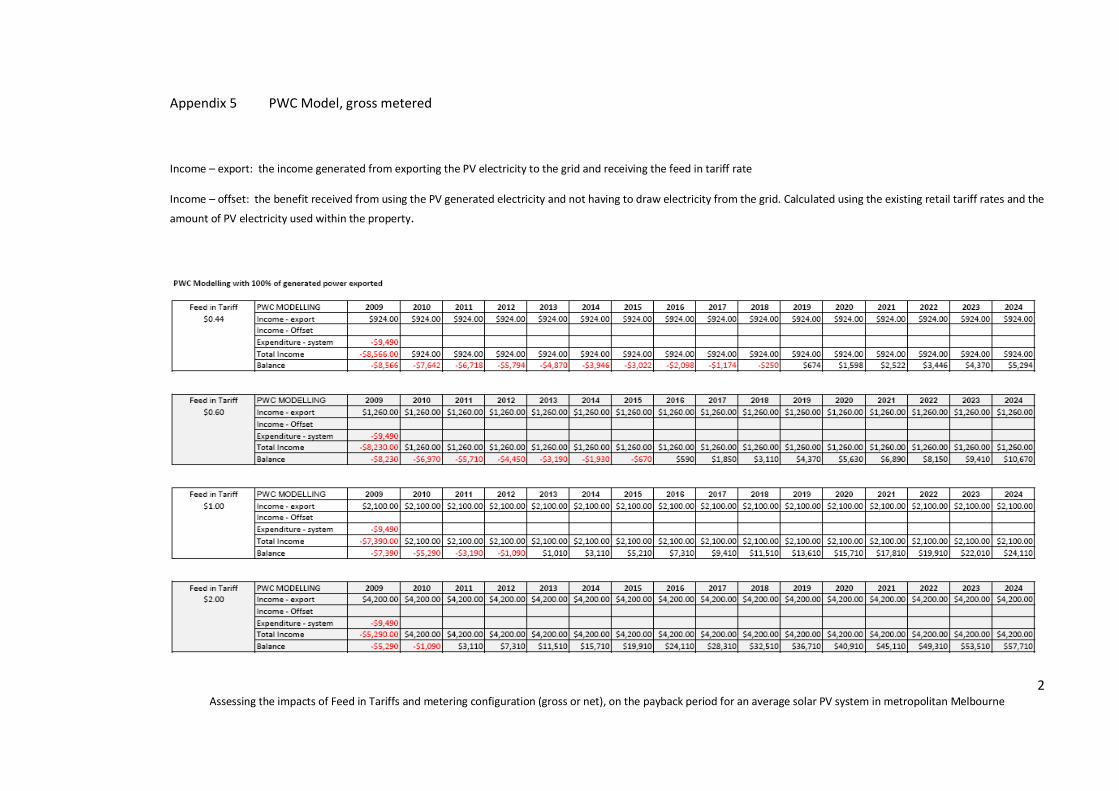
2 Assessing the impacts of Feed in Tariffs and metering configuration (gross or net), on the payback period for an average solar PV system in metropolitan Melbourne
Appendix 5 PWC Model, gross metered
Income – export: the income generated from exporting the PV electricity to the grid and receiving the feed in tariff rate
Income – offset: the benefit received from using the PV generated electricity and not having to draw electricity from the grid. Calculated using the existing retail tariff rates and the
amount of PV electricity used within the property.

3 Assessing the impacts of Feed in Tariffs and metering configuration (gross or net), on the payback period for an average solar PV system in metropolitan Melbourne
Appendix 6 PWC Model, net metered

4 Assessing the impacts of Feed in Tariffs and metering configuration (gross or net), on the payback period for an average solar PV system in metropolitan Melbourne
Appendix 7 PWC Model – gross metered – actual customer data
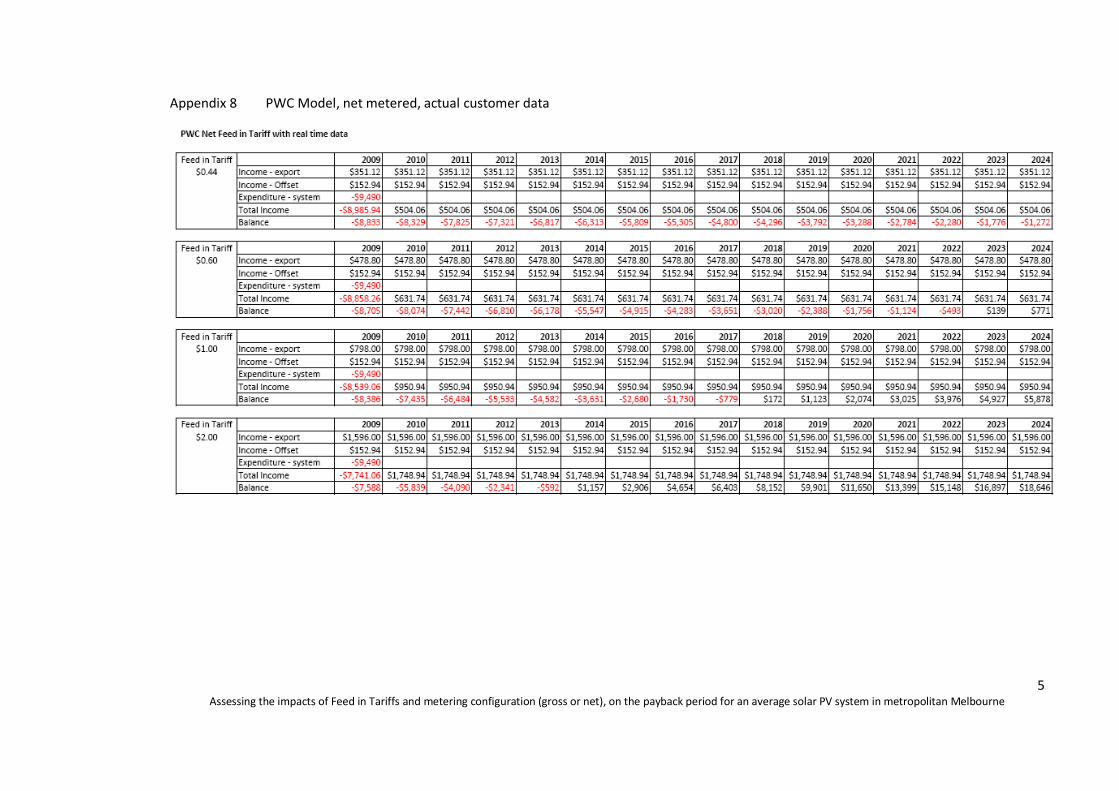
5 Assessing the impacts of Feed in Tariffs and metering configuration (gross or net), on the payback period for an average solar PV system in metropolitan Melbourne
Appendix 8 PWC Model, net metered, actual customer data

6 Assessing the impacts of Feed in Tariffs and metering configuration (gross or net), on the payback period for an average solar PV system in metropolitan Melbourne
Appendix 9 PWC Model, gross metered, 100% of generated power exported – Net Present Value
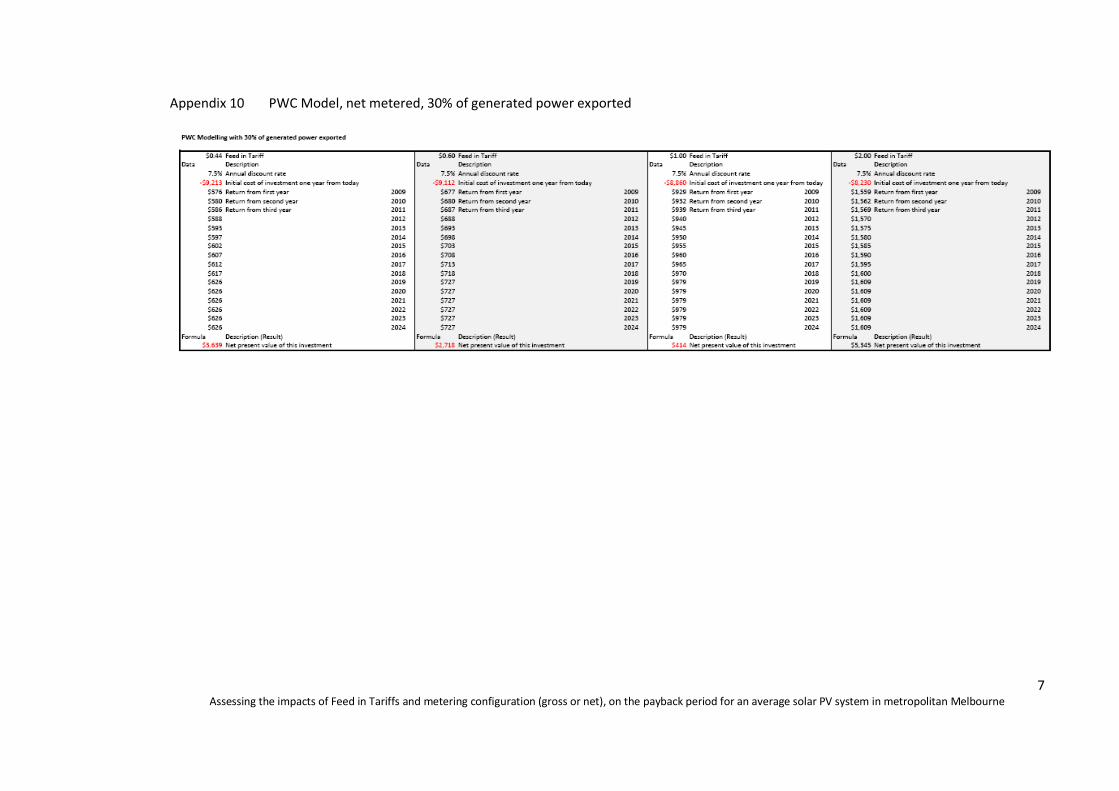
7 Assessing the impacts of Feed in Tariffs and metering configuration (gross or net), on the payback period for an average solar PV system in metropolitan Melbourne
Appendix 10 PWC Model, net metered, 30% of generated power exported

8 Assessing the impacts of Feed in Tariffs and metering configuration (gross or net), on the payback period for an average solar PV system in metropolitan Melbourne
Appendix 11 PWC Model, gross metered, Actual Customer data – Net Present Value
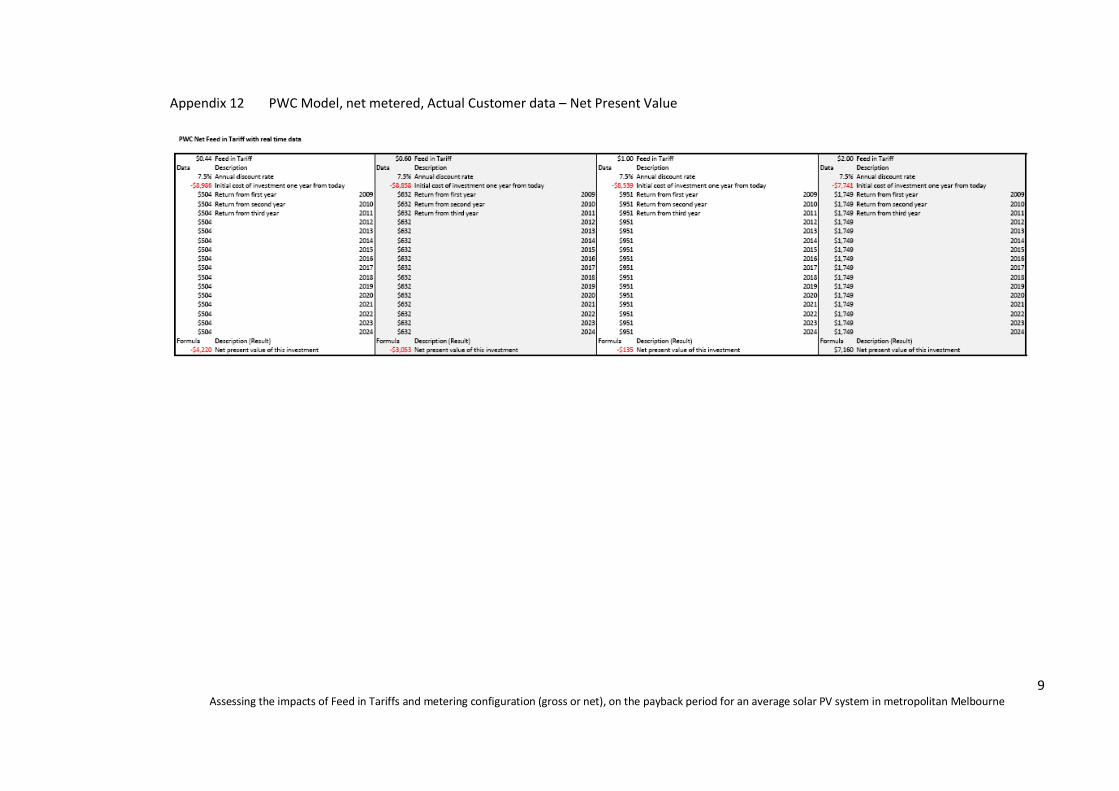
9 Assessing the impacts of Feed in Tariffs and metering configuration (gross or net), on the payback period for an average solar PV system in metropolitan Melbourne
Appendix 12 PWC Model, net metered, Actual Customer data – Net Present Value

1 Assessing the impacts of Feed in Tariffs and metering configuration (gross or net), on the payback period for an
average solar PV system in metropolitan Melbourne
Final Page – Deliberately Left blank