Pavemetrics - RPUG
75
Pavemetrics Vision Technology for Inspection of Transportation Infrastructures PAVEMETRICS Systems Inc. 150 Boulevard René-Lévesque Est, Suite 1820 Québec, Québec, CANADA G1R 5B1 www.pavemetrics.com
Transcript of Pavemetrics - RPUG

PavemetricsVision Technology for Inspection of Transportation Infrastructures
PAVEMETRICS Systems Inc.
150 Boulevard René-Lévesque Est, Suite 1820Québec, Québec, CANADAG1R 5B1
www.pavemetrics.com

PavemetricsVision Technology for Inspection of Transportation Infrastructures
There are lies,
PAVEMETRICS Systems Inc.
150 Boulevard René-Lévesque Est, Suite 1820Québec, Québec, CANADAG1R 5B1
www.pavemetrics.com

PavemetricsVision Technology for Inspection of Transportation Infrastructures
Damned lies…
PAVEMETRICS Systems Inc.
150 Boulevard René-Lévesque Est, Suite 1820Québec, Québec, CANADAG1R 5B1
www.pavemetrics.com

PavemetricsVision Technology for Inspection of Transportation Infrastructures
… and specifications !
PAVEMETRICS Systems Inc.
150 Boulevard René-Lévesque Est, Suite 1820Québec, Québec, CANADAG1R 5B1
www.pavemetrics.com

PavemetricsPavemetrics Pavemetrics product line
LRIS- Pavement Imaging
LCMS- 3D Pavement Imaging- Pavement Rutting- Macro-Texture- Pavement Cracking- Pavement Roughness- Road/Airport/Tunnel/Rail Inspection
LRMS- Pavement Rutting
5

PavemetricsPavemetrics 200+ systems in 30+ Countries
6

PavemetricsPavemetrics LCMS – Certified Technology
Is NOT a prototypeIt is a well used and certified system.

PavemetricsPavemetrics
USACalifornia - CaltransUtah DOTKentucky DOTKansas DOTTennessee DOTNevada DOTRhode Island DOTIllinois DOTGeorgia Tech UniversityVirginia TechUS Army Test TracksUniversity Mass. LowellPennDOTCity of Phoenix, AZSouth Dakota DOT
CanadaMTO – Ontario (Ministry of Transportation)MTQ – Quebec (Ministry of Transportation)Nova Scotia DOTSNC Lavalin - QualitasDessau - LVM TechnisolTetraTech – EBA
Denmark, Belgium,Italy, Netherlands,Spain, Ireland, China, Japan,Qatar, India,New Zealand, AustraliaSudan, Chile
LCMS Users 50+ systems

PavemetricsPavemetrics
Dynatest (www.dynatest.com)Enterinfo (www.enterinfo.com) Fugro-Roadware (www.roadware.com)ICC – (www.intlcybernetics.com)Mandli – (www.mandli.com)
Integrators – North America

PavemetricsPavemetrics LCMS - System configuration
4 m
2.2 m
2 m

PavemetricsPavemetrics Laser profiling (principle)

PavemetricsPavemetrics Image and Data Analysis
Rut
Crack
Macro-textureRut
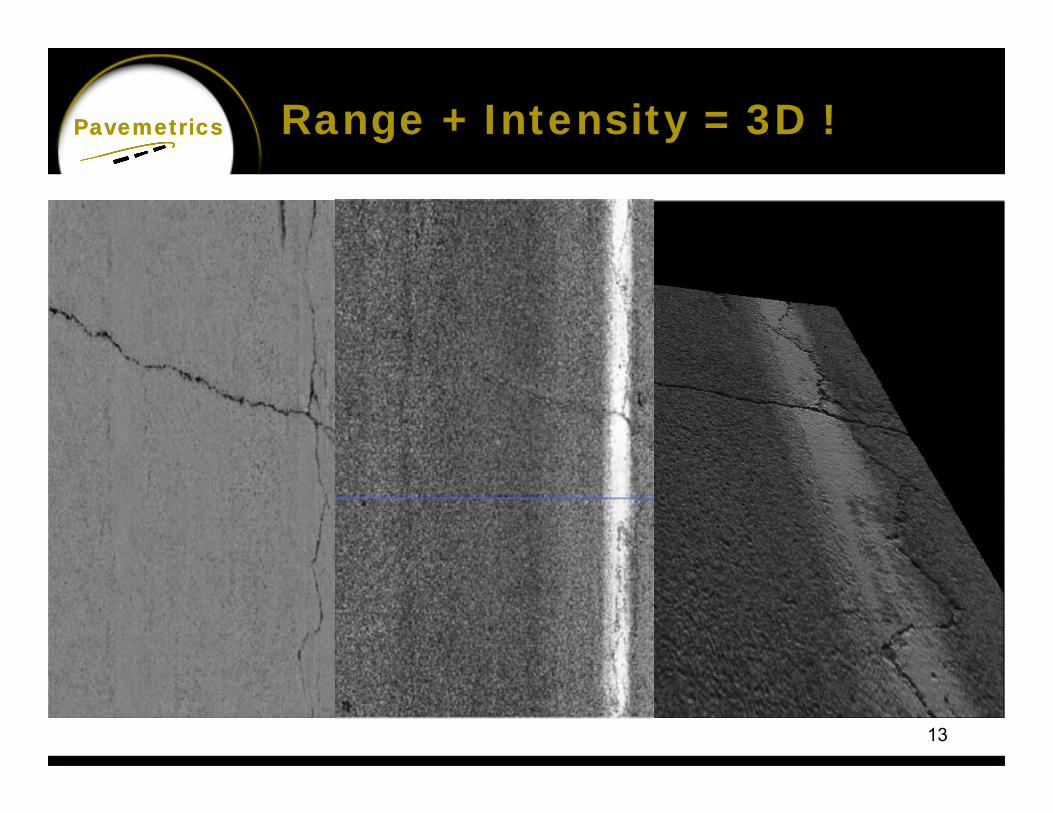
RANGEDistance between
Sensor and ground (in mm)
INTENSITYLaser
intensity(black = 0,
white = 255)
Crack
Right LaneMarking
Confidential 12
PavemetricsPavemetrics
13
Range + Intensity = 3D !

PavemetricsVision Technology for Inspection of Transportation Infrastructures

PavemetricsVision Technology for Inspection of Transportation Infrastructures

PavemetricsVision Technology for Inspection of Transportation Infrastructures

PavemetricsVision Technology for Inspection of Transportation Infrastructures

PavemetricsVision Technology for Inspection of Transportation Infrastructures
SOFTWAREIS
KEY !

PavemetricsPavemetrics
DISTRESS CLASSIFICATIONINTEGRATOR - LEVEL
19
LCMSData Processing Tree
LCMS Data
3D Intensity
Low-Frequency
High-Frequency
RUTs Macrotexture Cracks Potholes Raveling
Alligator cracks
Longitudinal cracks
Transversalcracks
Multiple cracks
Expansion joints
Other road features:
•Manholes•Curbs•Train rails•Etc.
Other lane markings
Lane line
condition
Sealed cracks
Lane markings

PavemetricsPavemetrics
20
Specifications
Low accuracy, good trueness, poor precision
Low accuracy, poor trueness, good precision

PavemetricsPavemetrics
21
Specifications
In addition to accuracy and precision, measurements may also have a measurement resolution, which is the smallest change in the underlying physical quantity that produces a response in the measurement.
When measurements are repeated and averaged. In that case, the term standard error is properly applied: the precision of the average is equal to the known standard deviation of the process divided by the square root of the number of measurements averaged.

PavemetricsPavemetrics
22
Specifications for DOT
Good Lateral Resolution over 4m
High Acquisition
RateExcellent 3D
Accuracy
What makes a good 3D sensor very good for road measurement?
DOT – USER NEEDS
Acquisition Rate 100 km/hRange Vertical Accuracy/Precision/Resolution
< 1mm
Lateral Resolution 1 mmWidth of lane to scan 4m

PavemetricsPavemetrics
23
Specifications
LCMS SpecificationsAcquisition Rate 11,200 profiles/s
Number of points per profile 4000Nbr of points/sec 45 MHzRange Accuracy/Precision 0.5mmRange Resolution 0.25mmLateral Resolution 1mm (FOV = 4m)
Single point lasersNbr of points/s 16 kHz, 32kHz, 64kHz
Number of points per profile 1Range Accuracy/Precision ?Range Resolution 0.1mm

PavemetricsPavemetrics
ASTM E950 – Longitudinal Profile
TABLE 1 Longitudinal Sampling
Class 1 less than or equal to 25 mm [1 in.]Class 2 greater than 25 mm [1 in.] to 150 mm [6 in.]Class 3 greater than 150 mm [6 in.] to 300 mm [12 in.]Class 4 greater than 300 mm [12 in.]
TABLE 2 Vertical Measurement Resolution
Class 1 less than or equal to 0.1 mm [0.005 in.]Class 2 greater than 0.1 mm [0.005 in.] to 0.2 mm [0.010 in.]Class 3 greater than 0.2 mm [0.010 in.] to 0.5 mm [0.020 in.]Class 4 greater than 0.5 mm [0.020 in.]
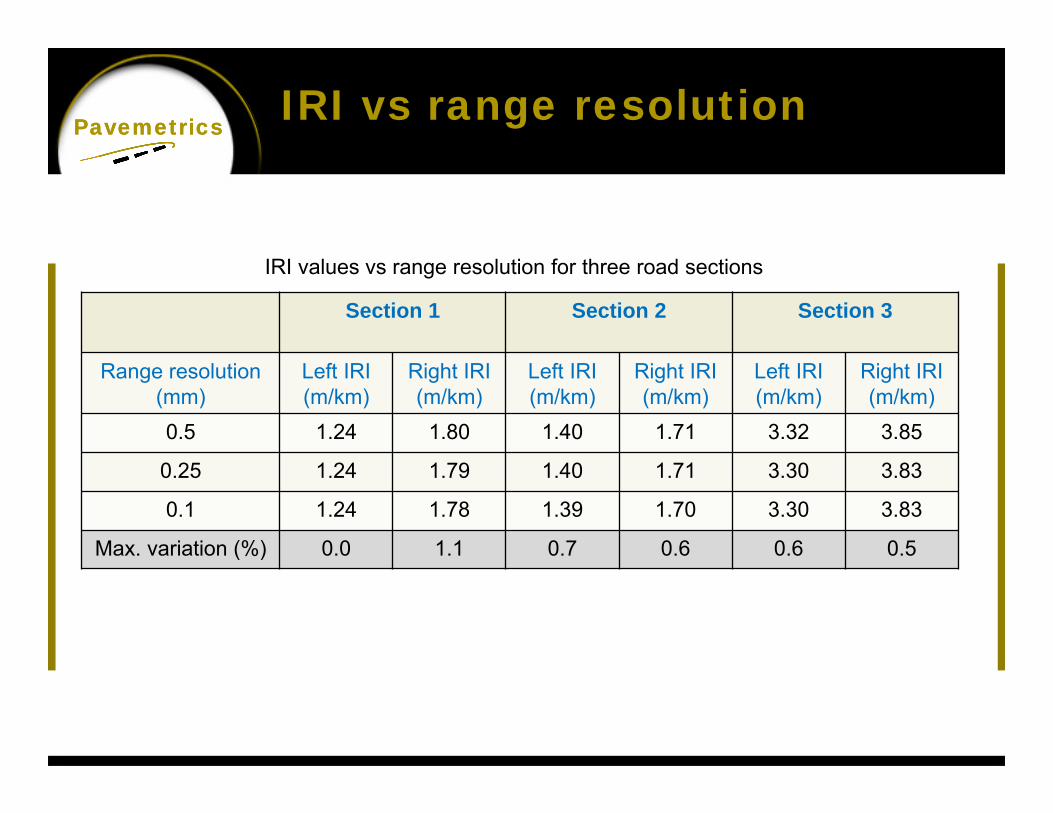
PavemetricsPavemetrics IRI vs range resolution
IRI values vs range resolution for three road sections
Section 1 Section 2 Section 3
Range resolution(mm)
Left IRI(m/km)
Right IRI(m/km)
Left IRI(m/km)
Right IRI(m/km)
Left IRI(m/km)
Right IRI(m/km)
0.5 1.24 1.80 1.40 1.71 3.32 3.85
0.25 1.24 1.79 1.40 1.71 3.30 3.83
0.1 1.24 1.78 1.39 1.70 3.30 3.83
Max. variation (%) 0.0 1.1 0.7 0.6 0.6 0.5

PavemetricsPavemetrics IRI vs range resolution
IRI values vs range resolution for three road sections
Section 1 Section 2 Section 3
Range resolution(mm)
Left IRI(m/km)
Right IRI(m/km)
Left IRI(m/km)
Right IRI(m/km)
Left IRI(m/km)
Right IRI(m/km)
0.5 1.24 1.79 1.40 1.71 3.30 3.83
1 1.25 1.79 1.40 1.71 3.31 3.83
2 1.26 1.79 1.40 1.73 3.32 3.83
3 1.27 1.84 1.42 1.72 3.32 3.84
4 1.41 1.93 1.53 1.82 3.35 3.85
5 1.62 2.19 1.69 1.93 3.45 3.86
6 1.93 2.47 1.97 2.19 3.54 4.03
Max. variation (%) 55.6 38.0 40.7 28.1 7.3 5.2
• Longitudinal resolution: 25 mm• Shaded cells: IRI variation > 5%
PavemetricsPavemetrics
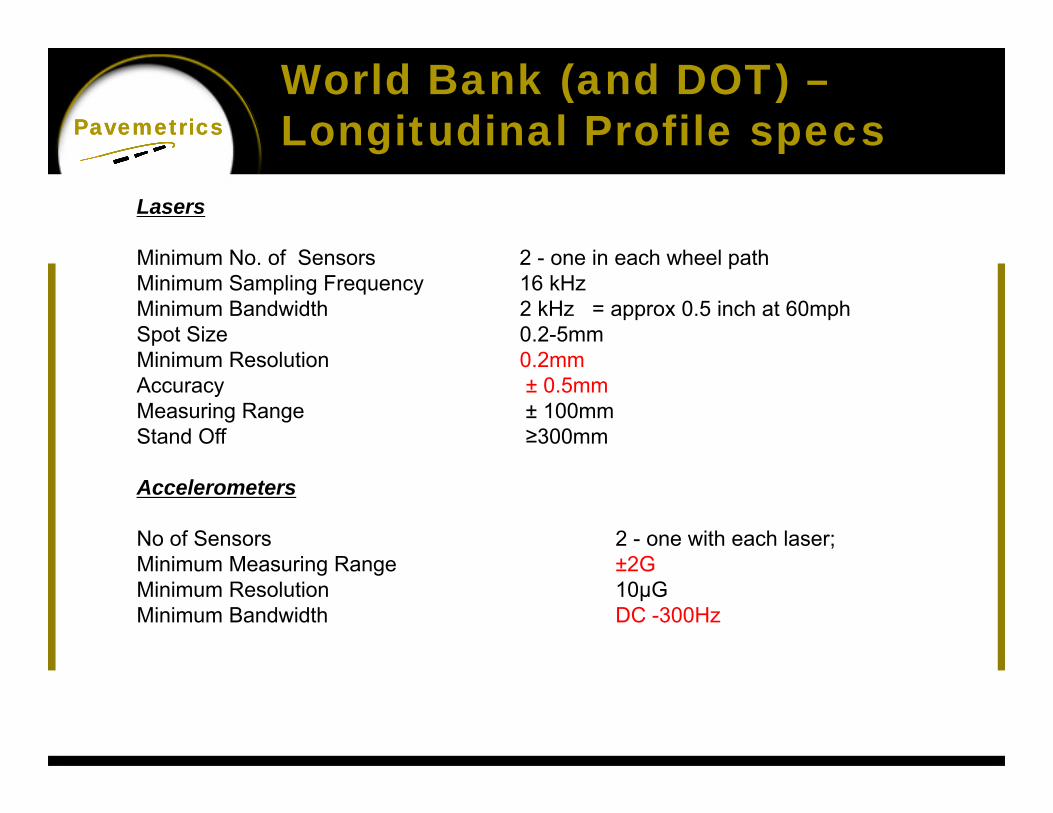
World Bank (and DOT) –Longitudinal Profile specs
Lasers
Minimum No. of Sensors 2 - one in each wheel pathMinimum Sampling Frequency 16 kHzMinimum Bandwidth 2 kHz = approx 0.5 inch at 60mphSpot Size 0.2-5mmMinimum Resolution 0.2mmAccuracy ± 0.5mm Measuring Range ± 100mmStand Off ≥300mm
Accelerometers
No of Sensors 2 - one with each laser; Minimum Measuring Range ±2G Minimum Resolution 10µGMinimum Bandwidth DC -300Hz

PavemetricsPavemetrics Ride quality - specs
Ride is perceived as most comfortable when the natural frequency is in the range of 60 to 90 cycles per minute (CPM), or about 1 Hz to 1.5 Hz.
When the frequency approaches 120 CPM (2 Hz), occupants perceive the ride as harsh. Consequently, the suspension of the average family sedan will have a natural frequency of about 60 to 90 CPM.
A high-performance sports car will have a stiffer suspension with a natural frequency of about 120 to 150 CPM (2 to 2.5 Hz).

PavemetricsPavemetrics
US DOT – Longitudinal Profile specs
An accelerometer with a minimum +/- 4G range shall be used to obtain vertical body movement, and a laser sensor shall be used for measuring the displacement between the vehicle body and the pavement for each wheel path. Road profile measurements are then obtained by summing the body movement with the appropriate body road displacements.
The lasers used for lRI measurements shall have spot size measurements seventeen (17) millimeter (mm) with a two hundred (200) mm measurement range and three hundred (300) mm standoff. The lRl is then calculated in accordance with the World Bank Specifications.

PavemetricsPavemetrics
IRI vs accelerometers dynamic range
IRI values vs dynamic range for three road sections
Section 1(low roughness)
Section 2(med. roughness)
Section 3(high roughness)
Range resolution(g)
Left IRI(m/km)
Right IRI(m/km)
Left IRI(m/km)
Right IRI(m/km)
Left IRI(m/km)
Right IRI(m/km)
±5 1.24 1.79 3.30 3.83 7.25 9.09
±3 1.24 1.79 3.30 3.83 7.25 9.09
±2 1.24 1.79 3.30 3.83 7.27 9.11
±1 1.24 1.77 3.33 3.81 7.30 9.32
Max. variation (%) 0.0 1.1 0.9 0.5 0.7 2.5

PavemetricsPavemetrics
31
Macrotexture : Mean Profile Depth (ASTM E1845-01)
Specifications:
•32kHz or 64kHz laser
• 1mm point spacing (minimum)
•0.05 mm vertical resolution
•Low pass filtering 2.5mm features removed. 5mm+ features kept intact.

PavemetricsPavemetrics
32
Macrotexture : Mean Profile Depth (ASTM E1845-01)

PavemetricsPavemetrics Macrotexture

PavemetricsPavemetrics Macrotexture

PavemetricsPavemetrics Macrotexture

PavemetricsPavemetrics
36
Macrotexture : Sand patch method (MTD) (ASTM E965)

PavemetricsPavemetrics MPD single profile vs surface

PavemetricsPavemetrics DOES IT WORK FOR YOU ?

PavemetricsPavemetrics Crack Detection

PavemetricsPavemetrics LCMS crack detection tests

PavemetricsPavemetricsLCMS repeatability DGA test site – ARRB - Australia
Run 1 Run 2 Run 3 Run 4 Run 5
Eastbound r2 0.968 0.997 0.972 0.983 0.992
Westbound r2 0.994 0.992 0.929 0.992 0.992
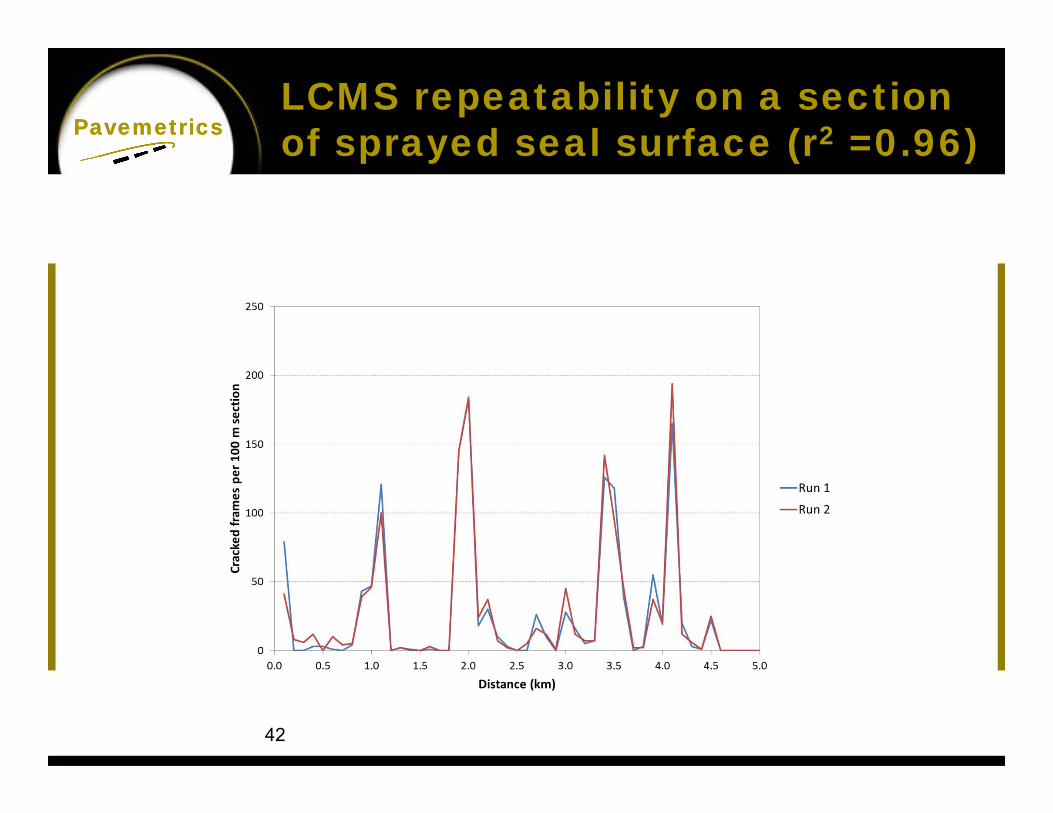
PavemetricsPavemetricsLCMS repeatability on a section of sprayed seal surface (r2 =0.96)
42

PavemetricsPavemetricsResults – network level visual evaluation
District #Total
( sections)
Results (manual classification)
Number of images (10m sections) Proportion (%)
Good Average Bad NA Good Average Bad NA
84 35288 34144 310 144 690 96,8 0,9 0,4 2,0
85 4243 4101 53 51 38 96,7 1,2 1,2 0,9
86 147903 144040 516 1520 1827 97,4 0,3 1,0 1,2
87 149926 138453 1170 5728 4575 92,3 0,8 3,8 3,1
88 189097 183010 1064 2002 3021 96,8 0,6 1,1 1,6
89 125003 121835 442 2015 711 97,5 0,4 1,6 0,6
90 123653 116930 2980 2434 1309 94,6 2,4 2,0 1,1
91 & 92 215513 213142 197 956 1218 98,9 0,1 0,4 0,6
Total 990626 955655 6732 14850 13389 96,5 0,7 1,5 1,4

PavemetricsPavemetrics
44
Macrotexture

PavemetricsPavemetrics
45
Macrotexture – RPIDigital Sand Patch Method
RPI - Road Porosity Index = (Volume under the surface –Ravelling - Cracks) divided by a surface area
RPI =( Volair void –Volravelling – Volcracks )__________________________________________
AreaTotal
Surface area (RPI) or Diameter (MTD)
Air void content (RPI) or Sand Volume (MTD)

PavemetricsPavemetrics
46
Macrotexture – LCMSDigital Sand Patch Method
Pros:
•Network survey is possible at 100kmh
•Full lane width is measured•5 AASHTO bands
•Great repeatability•Automatic lane marking detection

PavemetricsPavemetrics
47
Macrotexture – Correlation between MPD and RPI
0
0.5
1
1.5
2
0 0.01 0.02 0.03 0.04 0.05 0.06 0.07 0.08 0.09
MPD
(mm
)
RPI (mm)
MPD vs RPI
2100
3300
8300
r2 = 88%

PavemetricsPavemetrics
48
Repeatability – RPI measurement
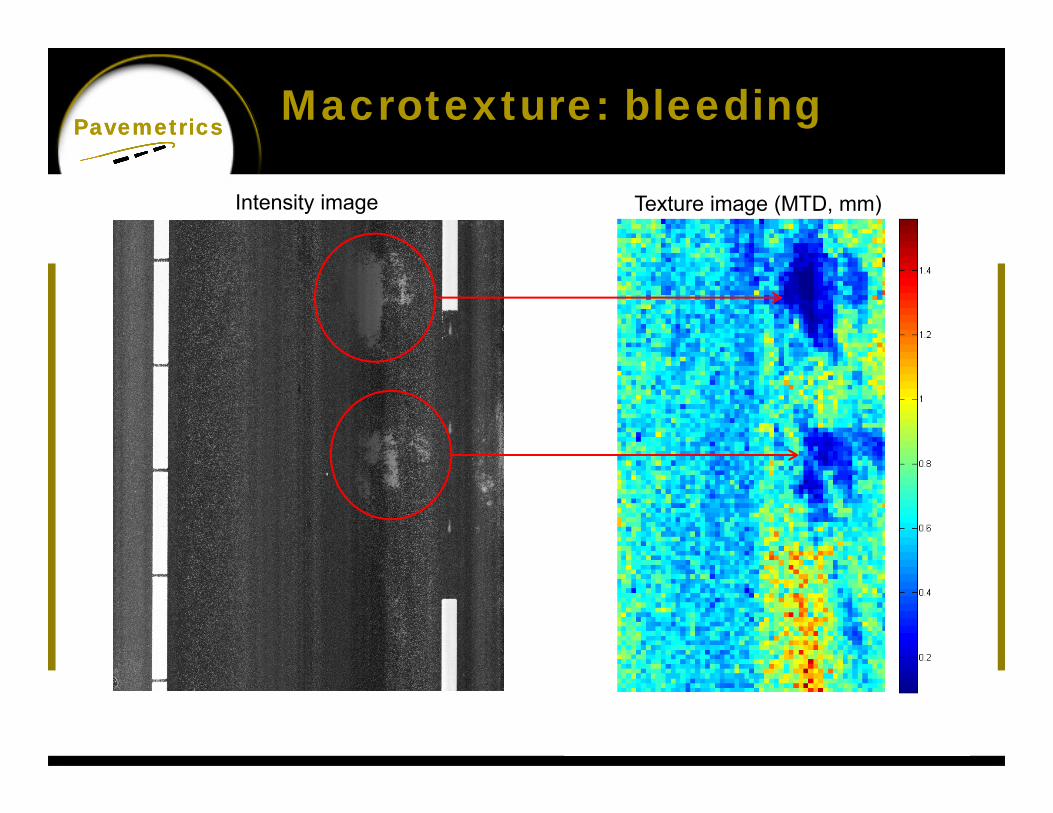
PavemetricsPavemetrics Macrotexture: bleeding
Intensity image Texture image (MTD, mm)

PavemetricsPavemetrics
50
Ravelling Index - RIRavelling Index (RI) = The volume of aggregate loss per surface area
RI =Vaggregate loss / ATotal

PavemetricsPavemetrics
5151
Aggregate loss detection

PavemetricsPavemetrics
5252
Aggregate loss detection

PavemetricsPavemetrics
53
RI – Road test – Porous Asphalt in the Netherlands
53

PavemetricsPavemetrics
54
Road Section #93 : Transition between Ravelling and new pavement (Range)
54

PavemetricsPavemetrics
55
Road Section #155 : Raveling patch
55

PavemetricsPavemetrics
56
Road Section #159 : Smooth texture
56

PavemetricsPavemetrics
57
Road Section #231 : Raveling patch
57

PavemetricsPavemetrics
58
RavelIing Index - Repeatability (Porous asphalt Netherlands)

PavemetricsPavemetrics IRI – Longitudinal profile
Longitudinal profile andInternational Roughness Index (IRI)
Distance
IRI
Accelerometer

PavemetricsPavemetrics UTAH DOT – Test sites

PavemetricsPavemetrics MassDOT

PavemetricsPavemetrics
Does it work? LCMS vs Surpro
•IRI values are stable and close to the values obtained with the reference instrument (Surpro).
Run IRI Left(m/km)
IRI Right(m/km)
1 1.19 1.64
2 1.16 1.51
3 1.19 1.54
4 1.21 1.55
Mean 1.19 1.56
Standard deviation 0.02 0.06
Surpro 1.21 1.54
IRI values calculated for 4 LCMS runs on a 400m validation test track

PavemetricsPavemetrics
LCMS passes Profiler certication in PROVAL

PavemetricsPavemetrics LCMS benefits
• LANE MARKINGS are used to correct profiles and compensate for driver wander.
• Simplifies certification procedures
• Eliminates the need to certify operators
Classic system: Results depend on the trajectory of the vehicle (subject to variation based on driver’s ability)
X m.
X m.
LCMS-IRI system: Erratic trajectory of the vehicle will still result in straight elevation profiles

PavemetricsPavemetrics Results: lane tracking
• Driver was asked to zigzag on validation track #1 (400 m).• Elevation profiles computed with and without lane tracking.
With lane tracking No lane tracking
Run IRI Left(m/km)
IRI Right(m/km)
IRI Left(m/km)
IRI Right(m/km)
1 1.33 1.50 1.16 1.43
Referencevalue
1.29 1.47 1.29 1.47
Difference 3.1% 2.0% 10.1% 2.7%

PavemetricsPavemetrics Results: IRI image (2 x 30m)
0.5
1
1.5
2
2.5
3
3.5
4
4.5
50
100
150
200
250
300
350
20 40 60 80 100 120 140 160 180
IRI (m/km)
Transversal axis (2 m)
Long
itudi
nal a
xis
(30
m)

PavemetricsPavemetrics Results: IRI image (2 x 30m)
0.5
1
1.5
2
2.5
3
3.5
4
4.5
50
100
150
200
250
300
350
20 40 60 80 100 120 140 160 180
IRI (m/km)
Transversal axis (2 m)
Long
itudi
nal a
xis
(30
m)

PavemetricsPavemetrics Road Geometry Measurement
IMU
Cross slope (Cross-fall)Super elevation
Horizontal Curvature

PavemetricsPavemetrics Road tests - Geometry
69
-6-5-4-3-2-1012345
0 500 1000 1500 2000 2500
Cro
ss-s
lope
(deg
ree)
Distance (m)
Cross-slopeCross-slope (LCMS)Cross-Slope
-2
-1
0
1
2
3
4
0 500 1000 1500 2000 2500
Slop
e (d
egre
e)
Distance (m)
Slope
Slope (LCMS)
Slope

PavemetricsPavemetrics
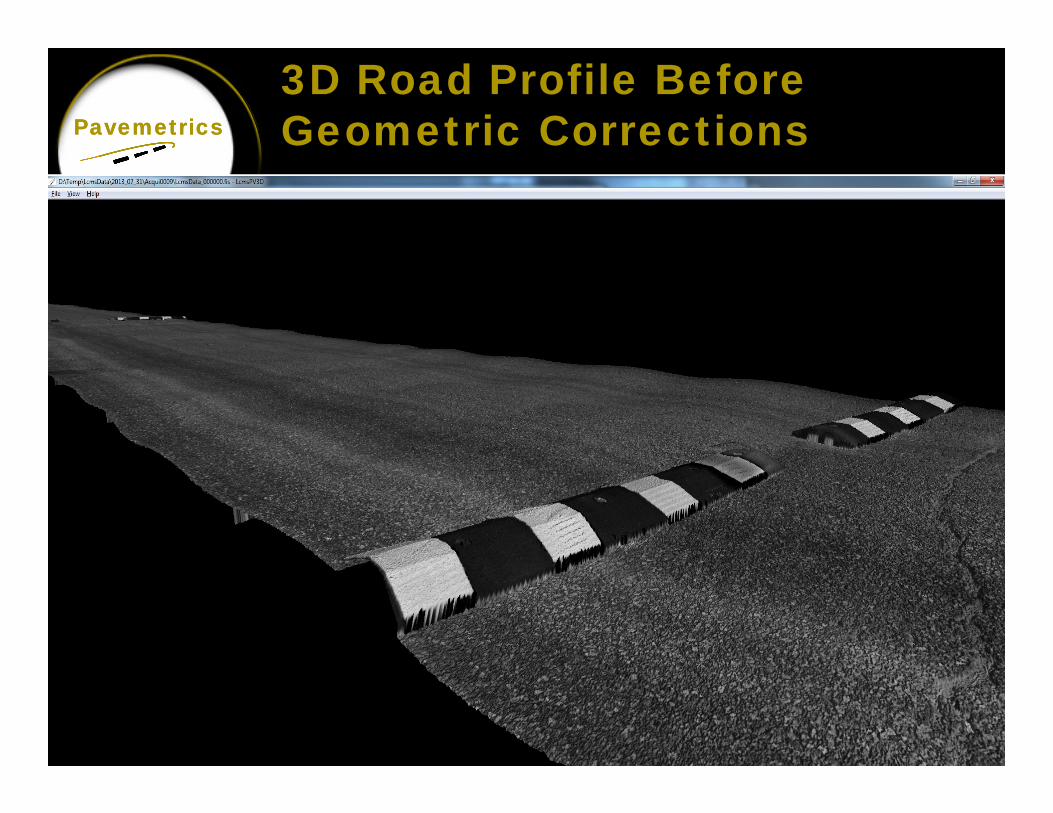
3D Road Profile Before Geometric Corrections

PavemetricsPavemetrics3D Road Profile After Geometric Corrections
PavemetricsPavemetrics
3D Road Profile Before Geometric Corrections

PavemetricsPavemetrics3D Road Profile After Geometric Corrections

PavemetricsPavemetrics Any questions ?
74

PavemetricsPavemetrics
75
IMPORTANT NOTICE
This slide pack is intended only for the use of the individual or entity to which it is addressed.
It contains information that is privileged, confidential and exempt from disclosure under applicable law.
If the reader of this message is not the intended recipient, or the employee or agent responsible for delivering the message to the intended recipient, you are notified that any dissemination, distribution or copying of this communication is strictly prohibited.
If you have received this communication in error, please notify [email protected] immediately.
Thank you.