Paul Gompers EMCF 2009 March 5, 2009. Examine two papers that use interesting cross sectional...
40
CROSS SECTIONAL AND PANELS III Paul Gompers EMCF 2009 March 5, 2009
-
Upload
miles-thornton -
Category
Documents
-
view
215 -
download
1
Transcript of Paul Gompers EMCF 2009 March 5, 2009. Examine two papers that use interesting cross sectional...

CROSS SECTIONAL AND
PANELS IIIPaul Gompers
EMCF 2009
March 5, 2009
TODAY Examine two papers that use interesting
cross sectional variation to identify their tests.
Find a discontinuity in the data. In how much you have to fund your pension
plan. In how easy

INVESTMENT AND FINANCING
CONSTRAINTS: EVIDENCE FROM THE
FUNDING OF CORPORATE PENSION
PLANSJosh Rauh
JF 2006
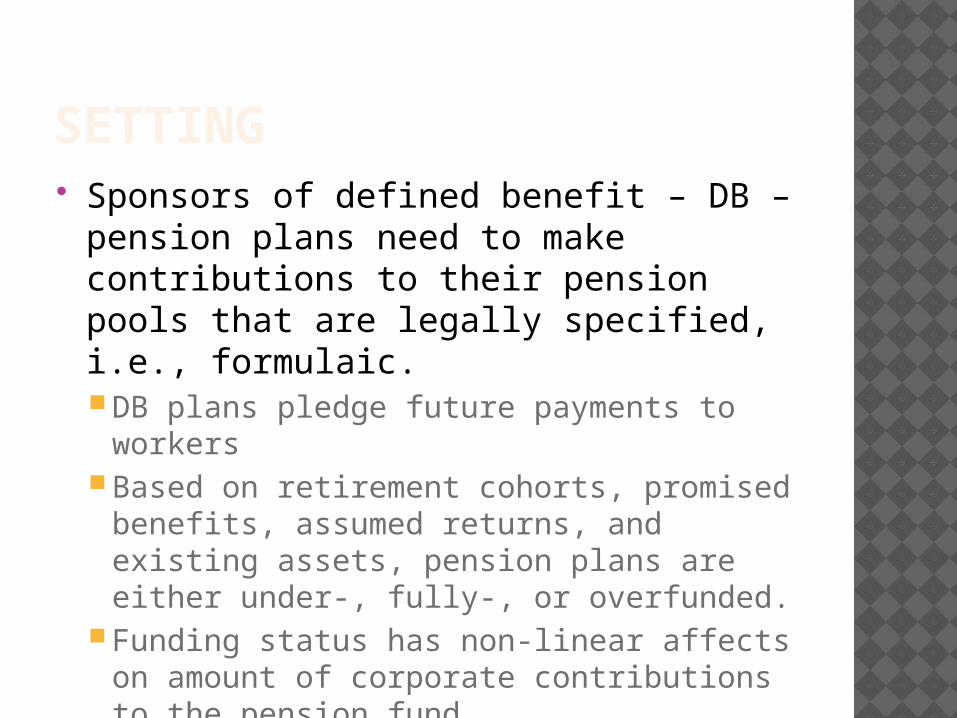
SETTING Sponsors of defined benefit – DB –
pension plans need to make contributions to their pension pools that are legally specified, i.e., formulaic.DB plans pledge future payments to
workersBased on retirement cohorts, promised
benefits, assumed returns, and existing assets, pension plans are either under-, fully-, or overfunded.
Funding status has non-linear affects on amount of corporate contributions to the pension fund.
This funding amount varies from year to year for a variety of reasons.
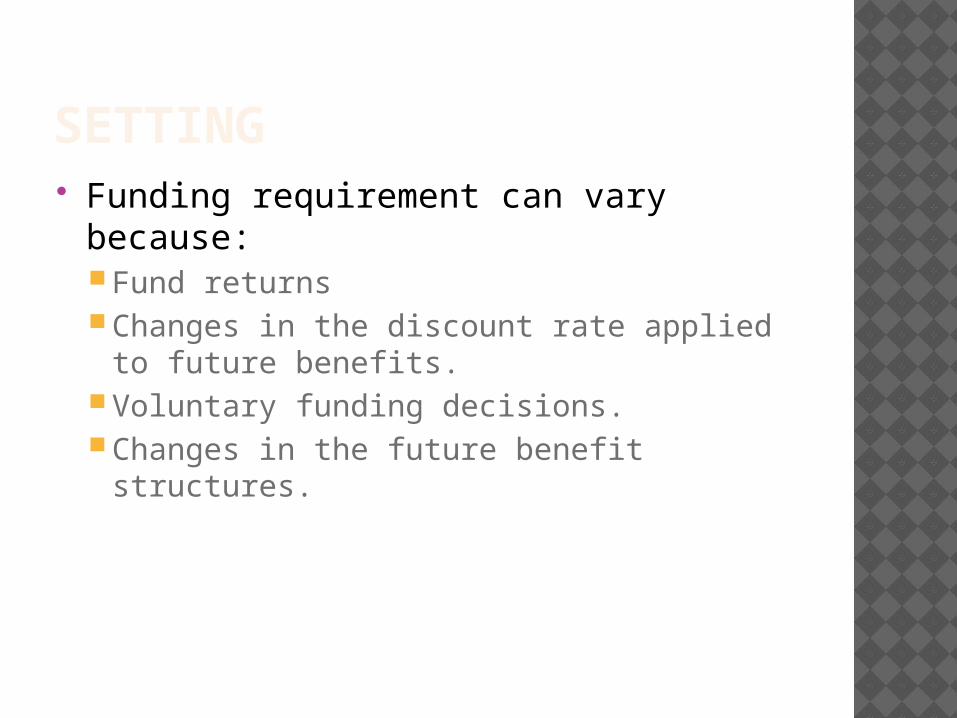
SETTING Funding requirement can vary because:
Fund returnsChanges in the discount rate applied to
future benefits.Voluntary funding decisions.Changes in the future benefit structures.
IDEA Does the required level of contributions to
the pension fund (Mandatory contributions – MC) affect the capital expenditure and R&D of public companies?
Changes in the contribution may be correlated with firm prospects, its cash flow, and its investment opportunities.
But… There are non-linearities in the contribution
requirements for certain levels of underfunded status.
Also for overfunded pensions, lose tax benefits of contributions.
IDEA Estimate the effect using these non-
linearities. Get identification of whether external
finance is costly. Instrument for internal cash.
FUNDING REQUIREMENTS Figure 1 – Funding status of all public
traded firms on Compustat.Big cross sectional and time series
variation.Data from SEC filings.
Unfortunately, SEC filings don’t give enough information to run test.
Get plan information from IRS form 5500 filings.Hence, sample runs from 1990 to 1998.
FUNDING REQUIREMENTS Underfunded plans must contribute amount
equal to new benefits accrued plus a fraciton of the funding shortfall. Contribute the larger of:
Minimum funding contribution (MFC) Deficit reduction contribution (DRC) Prior to 1994 = min{0.30, [0.30-0.25*(funding status-
0.35)] After1994 = min{0.30, [0.30-0.40*(funding status-
0.60)] Figure 2.
Overfunded plans are not required to contribute. Can make voluntary contributions, but big
contributions lose tax advantage.
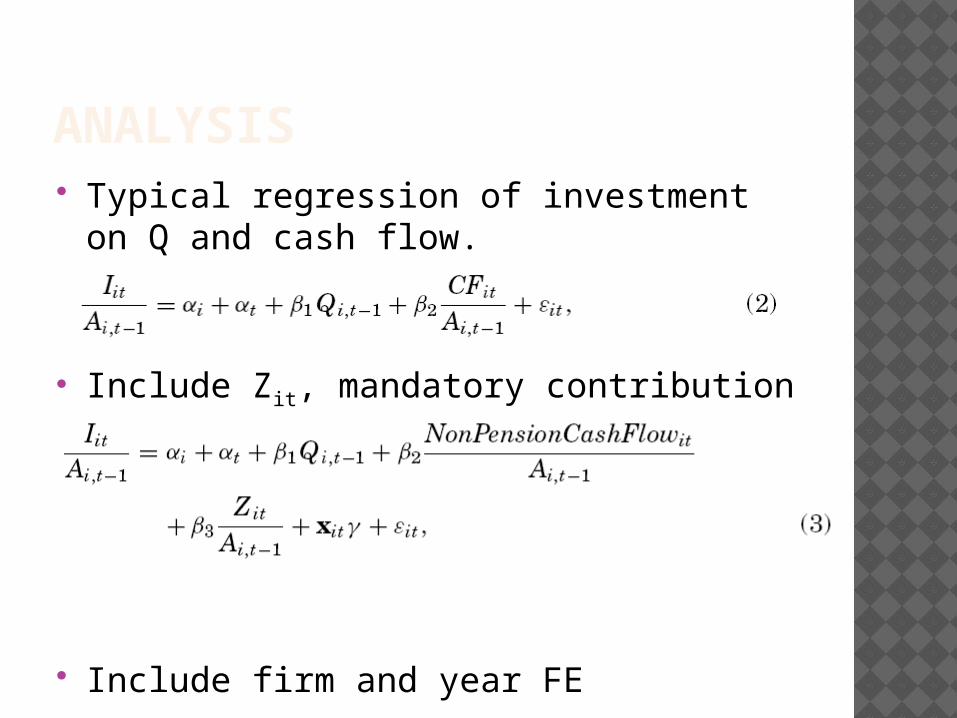
ANALYSIS Typical regression of investment on Q
and cash flow.
Include Zit, mandatory contribution (MC)
Include firm and year FE
INSIGHT Still endogeneity concerns, but will
utilize the kink in MC to identify exogenous variation in internal cash.
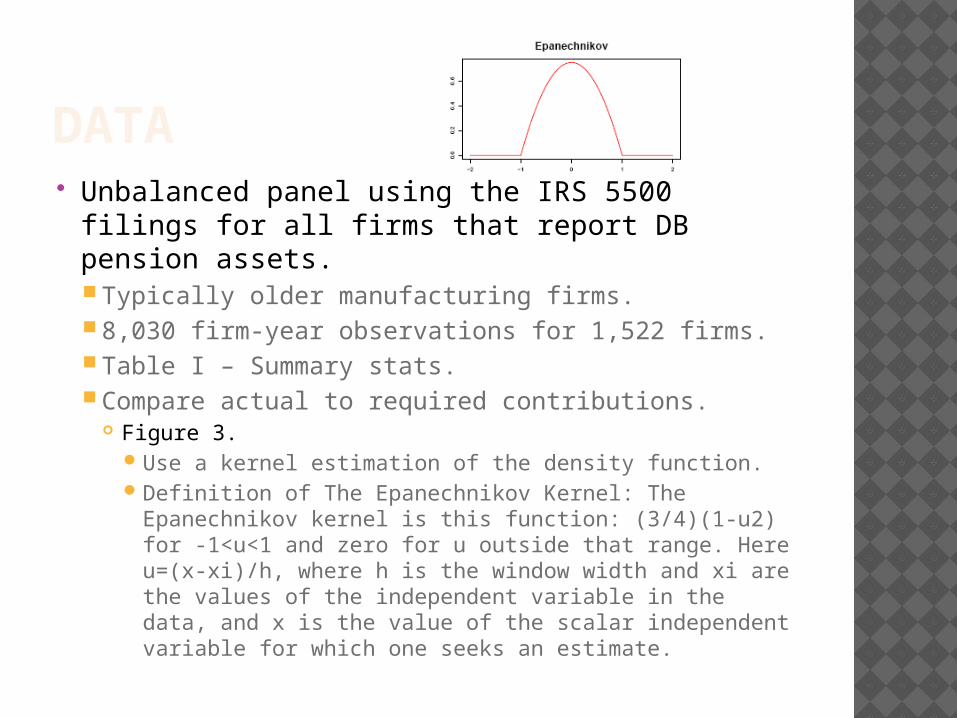
DATA Unbalanced panel using the IRS 5500 filings
for all firms that report DB pension assets. Typically older manufacturing firms. 8,030 firm-year observations for 1,522 firms. Table I – Summary stats. Compare actual to required contributions.
Figure 3. Use a kernel estimation of the density function. Definition of The Epanechnikov Kernel: The
Epanechnikov kernel is this function: (3/4)(1-u2) for -1<u<1 and zero for u outside that range. Here u=(x-xi)/h, where h is the window width and xi are the values of the independent variable in the data, and x is the value of the scalar independent variable for which one seeks an estimate.
DATA Graph mandatory contributions/book
assetsFigure 4
RESULTS Look at relationship between funding
status and capital expenditure and funding status and pension contributions, both scaled by assets.Do non-parametric univariate analysis using
the Epanechnikov kernel.Figure 5.
Looks as if there are similar inverted patterns in capex and pension contributions.
RESULTS Regression with a variety of specifications.
Baseline without MC. Breakout contributions into mandatory and total
contributions. Look at funding status of pension fund. Cluster standard errors by firm to correct for
within firm serial correlation of error terms. Alternatively, cluster by year (ala Fama-McBeth) or
use an arbitrary AR(1) correction in the panel. Table II.
Only mandatory contributions matter. Include funding status as an independent variable. Hence, it is the shape of the contribution curve that
identifies the effect, not funding status.
IV APPROACH Can instrument for pension
contributions by using MC as an instrument for either total pension contributions or total firm cash flow. Identifying that component of pension
contribution or cash flow that is correlated with MC.
Include funding status as an independent variable.
Hence, it is the shape of the contribution curve that identifies the effect, not funding status.
Table III.
DOES MC AFFECT OTHER USES OF CASH? Examine a variety of other uses of
corporate cash. R&D, Acquisitions, dividends, repurchases, and
changes in debt. Table IV.
No affect on R&D. Perhaps R&D has big startup and stopping costs.
Reduction in acquisitions. In Tobit regressions, reduction in dividends and
repurchases. Increase in debt. Reduction in trade credit. Increase in working capital.
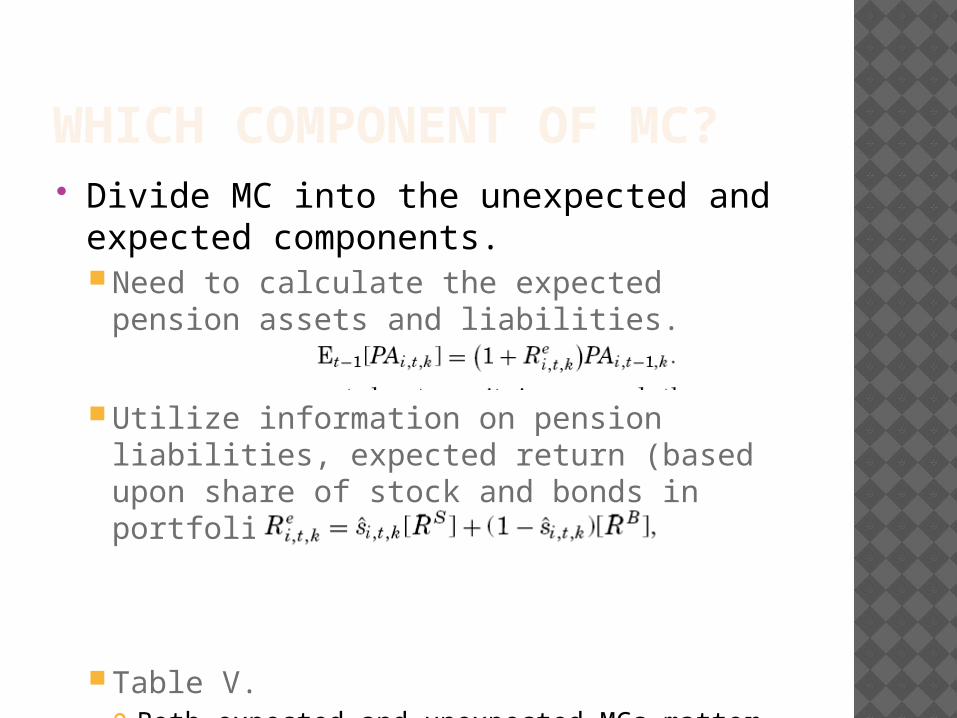
WHICH COMPONENT OF MC? Divide MC into the unexpected and
expected components.Need to calculate the expected pension
assets and liabilities.
Utilize information on pension liabilities, expected return (based upon share of stock and bonds in portfolio).
Table V. Both expected and unexpected MCs matter.
OBSERVABLE MEASURES OF FINANCING CONSTRAINTS Prior literature has utilized a variety of measures
of funding constraint proxies. These have been shown to be related to cash flow-
investment sensitivities in a variety of papers. Utilize:
Age Credit rating Dividend ratio Cash balances Those firms with Capex > cash flow.
Table VI. In general, variables that are proxies for financing
constraints are associated with greater sensitivity of investment to cash flow.

GENERAL EQUILIBRIUM CONSIDERATIONS
Is there a cost to the firm of MC? Level of investment around large MCs (>0.1% of
book value of assets). Figure 6.
Do other firms take up the slack? Estimate total industry pension requirements.
Table VII: Look at firms based upon cash and capex to CF. Unconstrained firms seem to increase investment.
CONCLUSION Kink in MC based on funding status is a
nice natural variation that allows for examination of Cash flow-investment puzzle.
Financing constraints do seem to matter for these types of firms.
Remember, these are DB companies which may have very different types of investment behavior.
DID SECURITIZATION LEAD TO LAX SCREENING?
EVIDENCE FROM SUBPRIME LOANS
Benjamin Keys, Tanmoy Mukherjee, Amit Seru, and Vikrant Vig
Working paper 2008
IDEA Incentive problems potentially exist
when banks/lenders originate loans and then sell them in a securitized pool.Perhaps less incentive to fully gather
information if you are selling the loan off.Papers have looked at this issue, but
endogeneity issues plague most of them. Exploit an industry “rule of thumb” to
identify any effects on monitoring/information gathering.
RULE OF THUMB Prominent rule of thumb is to not lend to
people with FICO scores less than 620.FICO scores
FICO is the acronym for Fair Isaac Corporation, a publicly-traded corporation (under the symbol "FIC") that created the best-known and most widely used credit score model in the United States.
Calculated statistically, with information from a consumer's credit files.
Primarily used in credit decisions made by banks and other providers of secured and unsecured credit.
Intended to show the likelihood that a borrower will default on a loan
Range is 400 to 900.

RULE OF THUMB (2) This rule of thumb makes securitizing
loans of borrowers with FICO scores less than 620 more difficult, i.e., they are less liquid.Guidelines by Freddie Mac – Cautious
Review Category Research design:
Look at borrowers just above and just below the 620 break.
Should have similar default probabilities.Look at quality of the loans, terms, etc.
620+
620-
ASSUMPTIONS Borrowers on either side of 620 should
look similar.Only small differences in characteristics.
Screening is costly for lenders.

TERMS Look at loans where collection of soft
information may be important.Low documentation loans.
More likely that soft information would be important to estimate default probabilities.
Full documentation loans.

BACKGROUND 60% of loans trade as mortgage-backed
securities. Most are agency-pass through pools.
Freddie Mac (Federal Home Loan Mortgage Corporation), Fannie Mae (Federal National Mortgage Association), Ginnie Mae (Government National Mortgage Association).
Agency eligibility is based upon loan size, credit score, and underwriting standards.
Implicit government guarantee. Non-agency loans – “subprime”
More expensive. Price of loan depends upon credit score, debt to
income, and documentation level. No guarantee of loan.

DATA LoanPerformance.
Detailed data on non-agency securities markets.
8,000 home equity and nonprime loan pools.
16.5 millionloans.$1.6 trillion outstanding.90% of all securitized subprime loans.
METHODOLOGY Hard information:
FICO ScoreLoan terms (LTV, interest rate)
Soft information:Measure of future income stability of
borrower, years of information provided by borrower, joint income status).
When securitized, only hard information provided.

METHODOLOGY
Y is number of loans of score I T = indicator if FICO>620 and 0 if
FICO<620. T*f(FICO) is a flexible seventh-order
polynomial.Fit smooth curve.Data recentered so that FICO = 620 is 0.At cutoff, polynomial is evaluated at 0.b is measure of discontinuity for FICO>620.

SUMMARY STATS Table I Focus only on low documentation loans.
Those where soft information will be important.
Figure 2 – Increase in number of loans above 620. Yearly.
Table 2 – b coefficient by year. Do permutation test.
Look for discontinuity at other places.Allow the 0 to be at different FICO scores.Do not find any other discontinuities.
BORROWER AND LOAN CHARACTERISTICS Look at LTV and interest rates.
Figures 3 and 4.
LOAN PERFORMANCE Look at whether or not performance of
loan differs around 620. Look at default rates.
Dollar weighted.Default within 10-15 months of origination.Collapse data into 1 point FICO bins.Figures 6A-F.Table III.Figure 7 – Delinquencies by age of loan.
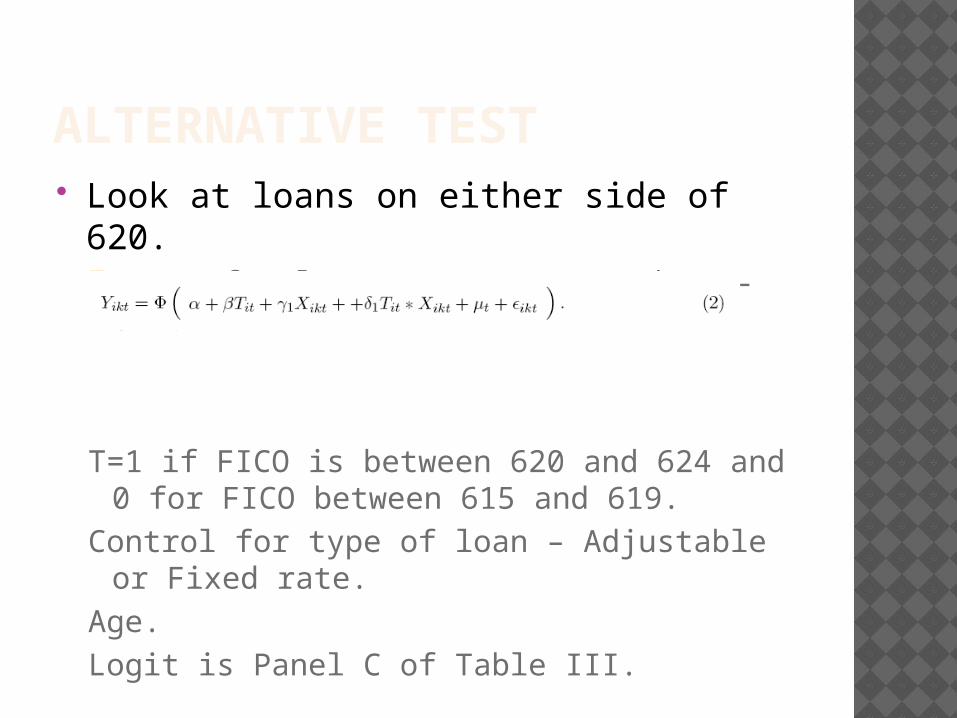
ALTERNATIVE TEST Look at loans on either side of 620.
Group for loans 615 to 619 and 620-624.
T=1 if FICO is between 620 and 624 and 0 for FICO between 615 and 619.
Control for type of loan – Adjustable or Fixed rate.
Age.Logit is Panel C of Table III.
ADDITIONAL TEST OF CAUSATION Look at Georgia and New Jersey.
Both passed Fair Lending Laws.Strong restrictions on predatory lending.Made securitizing loans very difficult when
law was in effect.Both laws later repealed.Run same regression and include
interaction for when Fair Lending law was in effect and not.
Table IV. Big increase in loans above 620 when law not in
effect in those states. No effect when Fair Lending law in place.
ENDOGENEITY OF FICO SCORE Do borrowers manipulate their FICO
score to be just above 620 Fair Isaac says that it takes time and is
hard to do. Look at six months immediately after
repeal of Fair Lending laws.Table IV Panel B.Change in delinquencies happens
immediately after law for loans with FICO > 620.

HARD INFORMATION Does the effect exist in full
documentation loans.Greater information about borrower’s ability
to repay.Fair Isaac advises lenders that below FICO
of 600, very troubled borrower.Figure 11 – Substantial increase in full
documentation loans with FICO>600.Look at default rates above and below FICO
600 for full documentation loans. Figures 12 and 13. Table VI.
INTERPRETATION Seems as if loan default differential in
low documentation loans is due to “soft information”
For full documentation loans, i.e., with more hard information, no difference at loan inflection point.

OVERALL Interesting use of kink in the behavior of
lenders. Find that this leads to an effect on loan
repayment. Nice set of robustness tests.