Paul Eisman President & Chief Executive Officer … What do lower crude prices mean for ALJ?...
28
Paul Eisman President & Chief Executive Officer Credit Suisse Annual Energy Summit February 2015
Transcript of Paul Eisman President & Chief Executive Officer … What do lower crude prices mean for ALJ?...

Paul Eisman President & Chief Executive Officer
Credit Suisse Annual Energy Summit February 2015

2
All statements contained in or made in connection with this presentation that are not statements of historical fact are forward-looking statements intended to be covered by the safe harbor provisions of the Securities Act of 1933 or the Securities Exchange Act of 1934. The words “believe”, “intend”, “plan”, “expect”, “should”, “estimate”, “anticipate”, “potential”, “future”, “will” and similar terms and phrases identify forward-looking statements. Forward-looking statements reflect the current expectations of the management of Alon USA Energy, Inc. (“Alon”) regarding future events, results or outcomes. These expectations may or may not be realized and actual results could differ materially from those projected in forward-looking statements. Alon’s businesses and operations involve numerous risks and uncertainties, many of which are beyond our control, which could result in the expectations reflected in forward-looking statements not being realized or which may otherwise affect Alon’s financial condition, results of operations and cash flows. These risks and uncertainties include, among other things, changes in price or demand for our products; changes in the availability or cost of crude oil and other feedstocks; changes in market conditions; actions by governments, competitors, suppliers and customers; operating hazards, natural disasters or other disruptions at our or third-party facilities; and the costs and effects of compliance with current and future state and federal regulations. For more information concerning factors that could cause actual results to differ from those expressed in forward-looking statements, see Alon’s Form 10-Q for the quarter ended September 30, 2014 which has been filed with the Securities and Exchange Commission and is available on the company’s web site at http://www.alonusa.com. Alon undertakes no obligation to update or publicly release the results of any revisions to any forward-looking statements that may be made to reflect events or circumstances that occur, or that we become aware of, after the date of this presentation or to reflect the occurrence of unanticipated events.
Forward-Looking Statements

3
Alon USA Energy - Overview
» YTD 3Q 2014, wholesale gasoline and diesel sales volumes exceeded 580 million gallons, including volumes sold to Alon USA’s retail locations
» Largest licensee of 7-Eleven in the U.S., operating nearly 300 convenience stores
» Leading marketer of asphalt in Texas and California
Alon is an independent refiner and marketer of petroleum products with 217,000 barrels per day of refining capacity focused on growth and innovation to meet both the energy and environmental needs of today, operating primarily in the western and south-central regions of the U.S.
Financial Highlights (in millions) 2013 YTD 3Q 20141
Revenue $7,046 $5,276
Adjusted EBITDA2 (see note below on turnaround impact) 271 257
Net cash provided by operating activities 162 145
Net debt at year end and quarter end 388 362
1Results for YTD 3Q 2014 were negatively impacted by the major turnaround at the Big Spring refinery in 2Q 2014. Pro forma for the turnaround in 2Q 2014, EBITDA would be higher by $55-65 million. 2 See page 28 for a reconciliation of Adjusted EBITDA to Net Income under GAAP.

4
Strategically Located Assets
Refinery
Crude Capacity
(bpd)
Nelson Complexity
Big Spring 73,000 10.5
Krotz Springs 74,000 8.3
California 70,000 9.2*
Refining
217,000 bpd of capacity
Retail
294 stores in Central and West Texas and New Mexico
Asphalt
10 terminals in the Southwestern and Western U.S.
* The Nelson complexity shown excludes the coker, which will not operate with a light crude slate.
California
Arizona
Texas
Oklahoma
Arkansas
Louisiana
Bakersfield
Tucson
El Paso
Nederland
Duncan
Abilene
Wichita Falls
Big Spring
Albuquerque
Bloomfield
Moriarty
Midland / Odessa
New Mexico
Nevada
Oregon
Washington
Paramount/
Long Beach
Richmond Beach
Elk Grove
Mojave
Fernley
Tulsa
Corpus Christi
Houston
Krotz Springs
Lubbock
DFW
Phoenix
Orla
South Marsh
Island Loop
Empire
Third-Party Terminal
Asphalt Terminal
Refinery
Key Retail Cities
Exchange Terminal
Alon Pipelines
Third Party Pipelines
Alon USA Terminal
Flagstaff

5
What do lower crude prices mean for ALJ?
» Profitability
› Absolute crude price does not determine profitability for a refiner like it does for an oil producer
› Refiners’ profitability depends on the difference between refined product prices and crude prices
› Retail fuel margins typically improve in a falling price environment
› Lower crude prices drive improved relative value in secondary products
» Balance Sheet
› Supply & offtake agreements at all locations limit inventory levels and thus exposure to oil volatility
Refining is more defensive than other energy sectors in falling crude environment

6
Alon USA’s Strategic Focus
• Reduced net debt by over $500 million since the start of 2012 to $362 million at the end of 3Q 2014
• Increased regular dividend by 67% to $0.10 per share per quarter in August 2014
• Announced a special dividend of $0.21 per share in October 2014
Strengthening Balance Sheet, Increasing Returns to
Shareholders
• Vacuum tower project at Big Spring implemented in June 2014 expected to have a payback period of less than two years
• Several projects identified at the Big Spring and Krotz Springs refineries with payback periods of two years or less
Focusing on High-return, Low-cost Projects to Enhance Gross Margin
• Will use assets currently utilized in our businesses
• Will construct a new 140,000 bpd rail unloading facility at Bakersfield, which will meaningfully increase the EBITDA of our logistics business
Developing Logistics Business

7
Where We Are Heading
» Expect to form a logistics MLP in late 2015 using existing assets across our businesses
» Expect to drop down Krotz Springs at accretive terms for both ALDW and ALJ
» After reducing net debt by over $500 million since the start of 2012 by mostly using cash from operations, refocusing cash flow to low-risk, high-return projects
» Transforming California assets from a drag on earnings to an earnings contributor by leveraging existing assets in growing logistics business
» Growing retail business through new builds and/or acquisitions
» Improving asphalt results by maximizing sales of high-performance grades, focusing on reducing costs and right-sizing operations
8
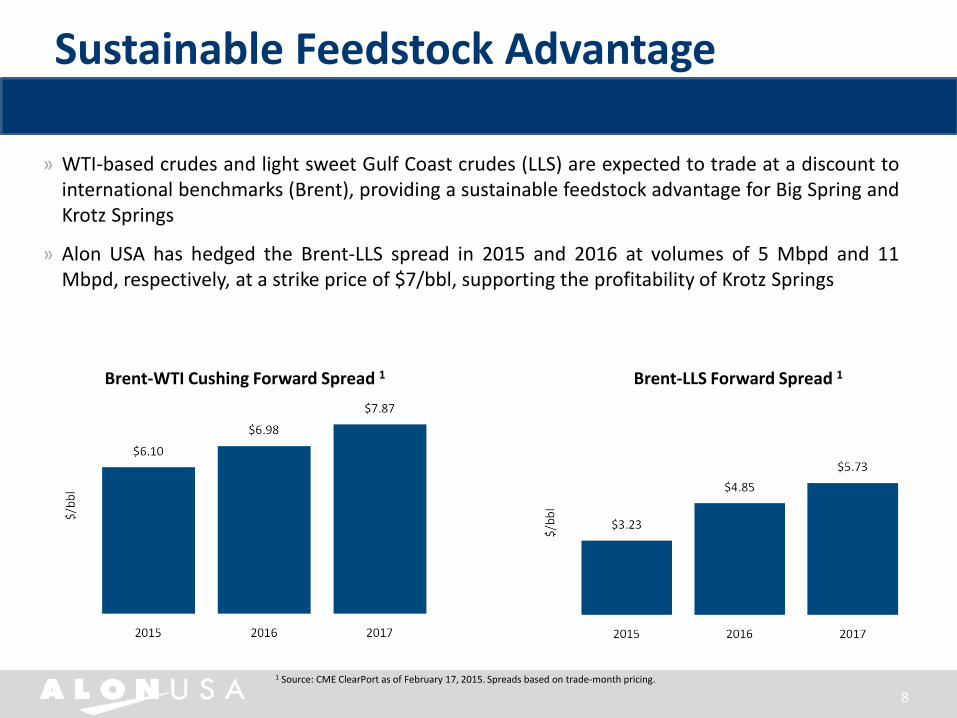
» WTI-based crudes and light sweet Gulf Coast crudes (LLS) are expected to trade at a discount to
international benchmarks (Brent), providing a sustainable feedstock advantage for Big Spring and Krotz Springs
» Alon USA has hedged the Brent-LLS spread in 2015 and 2016 at volumes of 5 Mbpd and 11 Mbpd, respectively, at a strike price of $7/bbl, supporting the profitability of Krotz Springs
Brent-WTI Cushing Forward Spread 1
1 Source: CME ClearPort as of February 17, 2015. Spreads based on trade-month pricing.
Brent-LLS Forward Spread 1
Sustainable Feedstock Advantage

9
Advantaged Crude Slate
Alon’s Consolidated Crude Slate 1
1 Other includes heavy crude, medium sour crude, and blendstocks. Chart includes California refining operations, which were suspended in Nov. 2012.
» Alon’s crude slate has shifted increasingly towards discounted Midland-priced crudes since 2011
» Processed 66% Midland-priced crudes YTD 3Q 2014, up from 42% in 2011
» With LLS becoming discounted to Brent, Alon’s crude slate is 100% advantaged, including 3% related to discounted blendstocks
» Long-term, these crudes are expected to be discounted to Brent, providing a sustainable feedstock advantage
Now discounted
n WTI Midland n WTS
n Gulf Coast Sweet n Other

10
» Permian activity is generally expected to be less impacted by lower crude prices than other U.S. shale plays, given stacked zones and more robust well economics
» 368 active rigs in the Permian in February 2015, including 20 oil rigs in Howard County1
» Local WTI supplied through Big Spring was 40 Mbpd in 3Q 2014 – up 17% from 2Q 2014
1 Source: Baker Hughes, RigData; Rig information as of February 13, 2015
Permian Basin Activity Overview 1
Oil Rig
Big Spring: In the Heart of the Permian Basin
Big Spring
Lubbock

11
63,614 68,946 67,103 62,382
99.8% 99.8% 99.8% 100.1%
Big Spring Refinery Overview
Refinery Operating Margin1
Refinery Throughput (bpd)1
Refinery Product Yield1
n Big Spring Operating Margin – – – Gulf Coast 321 Crack Spread
n WTS crude n WTI crude n Blendstocks
n Gasoline n Diesel/jet n Asphalt n Other
1 Refinery Operating Margin, Refinery Throughput and Refinery Product Yield for YTD 3Q 2014 were negatively impacted by the major turnaround at Big Spring in 2Q 2014. Pro forma for the turnaround in 2Q 2014, EBITDA would be higher by $55-65 million. Product yield percentages based on total production. Liquid recovery shown at top of column. Some numbers may not add due to rounding.
» Big Spring refinery:
› 73,000 bpd (~26 MMbbl/year) sour crude cracking refinery
› 10.5 Nelson Complexity
› Processes 100% Midland-priced crude
› Distillate yield of 38.6% and combined gasoline and distillate yield of 88% in 3Q 2014
» Integrated wholesale fuels marketing business supplies ~640 branded sites, including substantially all of Alon’s retail sites
› In 2013, over 90% of gasoline and over 90% of diesel produced at Big Spring was transferred to our wholesale business, including branded and unbranded marketing
› YTD 3Q 2014, wholesale gasoline and diesel sales volumes exceeded 580 million gallons, including volumes sold to Alon USA’s retail locations
› Alon’s retail gasoline and diesel sales represent ~30% and ~7%, respectively, of Big Spring’s gasoline and diesel production

12
How Big Spring Made Money 3Q 2014
1 Some numbers may not add due to rounding. “Other” includes costs relating to RINs, pipeline fees, supply related costs and other raw materials purchased at the refinery.
Charts are not to scale.
Product Yields Crude / Blendstocks Refining Operating Margin1
Per bbl Per bbl Per bbl
Sour Gasoline
Crude $21.49
Gasoline 50.2%
49.2%
Jet
$28.34
$117.87 Jet 4.9%
Sweet Diesel
Diesel Crude $27.76
33.7% 46.3%
Asphalt
$66.59 Asphalt 4.1% (23.53)$
Other Blendstocks Other
8.5% 3.5% $8.23
$111.25 $89.76 $19.98
(0.37)$ $98.34
$118.45
$111.60
(0.96)$
9.35$
1.38$
10.58$
Other $(8.23)

13
Organic Growth Opportunities at Big Spring
Short-term low-cost projects will drive meaningful returns at Big Spring
» Evaluating low-risk projects with payback periods of less than two years to enhance the refinery’s gross margin, focused on:
› LPG recovery, increased aromatics recovery, producing chemical-grade propylene
› Increasing ability to process WTI Midland crude, which traded below WTS in 2014
» Evaluating potential for significant expansion of the Big Spring refinery
» Vacuum tower project completed in 2Q 2014 increased diesel yield by over 3,000 bpd › Cost less than $30 million* and is expected to generate annual EBITDA of
$22 million1
* Includes $6 million of sustaining capital ¹ $22 million annual EBITDA uplift based on $10/bbl spread between diesel and gasoline, natural gas price of $3.80/MMBtu, and a Gulf Coast WTI-Based 3-2-1 benchmark crack spread of $16.90/bbl.

14
59,720 67,877 64,705 71,680
Krotz Springs Refinery Overview
» 74,000 bpd sweet crude residual cracking refinery
» 8.3 Nelson Complexity
» Historically processed a mix of LLS and HLS type crudes
» Transporting 30,000 bpd of WTI Midland-priced crude through the AMDEL pipeline to process at Krotz Springs
» High liquid recovery of 101-102%
» One of the newest refineries in the U.S. (1980)¹ with industry low operating costs
» High distillate yield capability of over 40%
¹ Source: US Energy Information Administration 2 Product yield percentages based on total production. Liquid recovery shown at top of column. Some numbers may not add due to rounding.
Refinery Operating Margin
Refinery Throughput (bpd)
Refinery Product Yield2
n Krotz Springs Operating Margin – – – Gulf Coast 211 (LLS) Crack Spread
n WTI crude n Gulf Coast Sweet Crude n Blendstocks
n Gasoline n Diesel/jet n Other
100.6% 101.2% 102.0% 102.1%

15
How Krotz Springs Made Money 3Q 2014
Product Yields Crude / Blendstocks Refining Operating Margin1
1 Some numbers may not add due to rounding. “Other” includes costs relating to RINs, pipeline fees, supply related costs and other raw materials purchased at the refinery.
Charts are not to scale.
Per bbl Per bbl Per bbl
Gasoline
WTI $7.84
Gasoline 40.5%
46.2%
Jet
Jet $16.63
20.6%
Light Sweet
Diesel Crude
23.9% 57.8% Diesel
$10.73
Other Other
11.5% Blendstocks 1.7% (29.02)$
$107.44 $99.13 $9.48
$112.02
$109.14
(0.13)$
2.56$
3.43$
3.62$
$117.93
$72.28

16
Improving Value Proposition of Krotz Springs
• Evaluating projects with less than two-year paybacks focused on:
• Increasing LPG value
• Improving distillate recovery
• Enhancing gasoline blending
Organic Growth Projects
• Processing 30,000 bpd of Midland-priced WTI
• Discount in LLS to Brent provides margin uplift
• Rail capacity provides optionality in crude sourcing Improved crude slate
• Achieved record quarterly throughput of almost 77,000 bpd in 3Q 2014
• Distillate yield was 44.5% and light product yield was over 90% in 3Q 2014
• Liquid recovery of 102.2% in 3Q 2014
Improved operations

17
California Refining Assets Overview
» In 4Q 2012, ceased refining operations due to unfavorable economics
» Focused on reducing operating expenses; leveraging logistics assets
» Received permit to construct a new 140,000 bpd rail unloading facility at the Bakersfield refinery
› Will allow shipments of light Mid-Continent crudes or heavy crudes
› Commercial discussions are ongoing
› Rail unloading facility now expected to startup in 2016
› Expect Bakersfield to generate ~$30 million in annual EBITDA unloading one unit train per day or ~$60 million unloading two unit trains per day
› Rail unloading facility and pipeline connectivity expected to cost $50-70 million
Terminal Current Permitted Rail Capacity Status
Long Beach 12,000 bpd Providing services to third party
Paramount 14,000 bpd In discussions with third parties

18
Improving the Asphalt Business
18
» U.S. asphalt demand in 2013 was down 41% from the peak in 2005
» Asphalt demand is largely driven by federal, state and local spending
» The country’s highways and bridges require capital investment of $120 billion annually over six years to meet current demand, but only $83 billion is currently being invested1
» Underinvestment in infrastructure is driving pent-up demand that will eventually spur a recovery
Steps Alon is taking to improve profitability:
» Focusing on premium products with better margins (recycled ground tire rubber blends)
» Working with suppliers to improve sourcing
» Right-sizing terminal system and leased railcar fleet
» Striving to be low-cost operator
Alon is positioned well when asphalt demand inevitably recovers 1 Source: The American Association of State Highway and Transportation Officials and the American Public Transportation Association’s “2015 Bottom Line Report”
Krotz Springs
Paramount
Phoenix
Elk Grove
(Sacramento) Bakersfield
Mojave
Fernley
(Reno)
Paramount /
Long Beach
Big Spring
Richmond Beach
(Seattle)
Refineries
Asphalt terminals
Legend
Flagstaff

19
Physically Integrated Retail Network
» Largest 7-Eleven licensee in the U.S. with 294 stores (~50% fee owned) in Central/West Texas and New Mexico
» Operating in one of the nation’s strongest areas for economic activity
» Remodel program continues to progress
» Expanding store count through new builds and/or acquisitions
» Retail gasoline and diesel sales represent approximately 30% and 7%, respectively, of Big Spring’s gasoline and diesel production
Locations in High Growth Markets1
Location Total
Big Spring, Texas 7
Wichita Falls, Texas 11
Waco, Texas 9
Midland, Texas 17
Lubbock, Texas 21
Albuquerque, New Mexico 23
Odessa, Texas 35
Abilene, Texas 40
El Paso, Texas 83
Other locations in Central and West Texas 48
Total Stores 294
1 Store count as of February 1, 2015.

20
Alon’s Strategic Advantages
» Strategically located refineries with advantageous sources of crude
» Existing assets have logistics EBITDA to support new logistics MLP; Bakersfield provides significant logistics EBITDA growth
» Backlog of low-risk projects with payback periods of less than two years
» Physically integrated refining and marketing system (wholesale and retail network) at Big Spring
» Diversified operations provide stability
» High quality assets with low operating costs
» Strong liquidity position and flexibility provided by supply & offtake agreements at each refinery
» Experienced management team

21
Growth Initiatives & Operational Improvements
• Opportunities to implement low-risk, high-return projects
• Increasing high margin distillate production
• Evaluating potential to increase throughput at Big Spring Refining
• Expanding retail store count through new builds and/or acquisitions
• Increasing volumes in integrated wholesale marketing business
Retail and Wholesale
• Plan to form a logistics MLP in late 2015 using existing assets across our businesses
• Developing Bakersfield rail unloading terminal, which provides significant logistics EBITDA growth
Logistics
Financial Summary
22

23
Key Financial Metrics
Adjusted EBITDA1
» Increase in capital expenditures in 2014 mainly relates to major five-year turnaround in 2Q 2014 at the Big Spring refinery and the vacuum tower project
» Alon has low sustaining capex requirements – Big Spring and Krotz Springs combined require ~$50 million in sustaining and regulatory spending and ~$20 million for turnarounds annually
$ m
illio
ns
Capital Expenditures & Turnarounds
Net Leverage (Net Debt/Adjusted EBITDA)2
1 See page 28 for a reconciliation of Adjusted EBITDA to Net Income under GAAP. Pro forma for the turnaround in 2Q 2014, YTD 3Q 2014 EBITDA would be higher by $55-65 million. 2 Net leverage for 3Q 2014 is based on LTM Adjusted EBITDA of $310 million.
$ m
illio
ns
$122
$105
$77
$165

24
Stacey Hudson, CFA Investor Relations Manager
972-367-3808 [email protected]
Investor Relations Contact

Appendix

26
Alon USA Partners – Cash Available for Distribution
ALL INFORMATION IS UNAUDITED For the Three Months Ended For the Year Ended
(dollars in thousands, except per unit data) December 31, 2014 December 31, 2014
Net sales $ 800,179 $ 3,221,373
Operating costs and expenses:
Cost of sales 697,919 2,823,694
Direct operating expenses 25,944 105,760
Selling, general and administrative expenses 6,941 26,446
Depreciation and amortization 14,067 47,494
Total operating costs and expenses 744,871 3,003,394
Operating income 55,308 217,979
Interest expense (12,229 ) (46,706 )
Other income, net 19 646
Income before state income tax expense 43,098 171,919
State income tax expense 999 2,784
Net income $ 42,099 $ 169,135
Adjustments to reconcile net income to Adjusted EBITDA:
Interest expense 12,229 46,706
State income tax expense 999 2,784
Depreciation and amortization 14,067 47,494
Adjusted EBITDA $ 69,394 $ 266,119
Adjustments to reconcile Adjusted EBITDA to cash available for distribution:
less: Maintenance/growth capital expenditures 2,133 16,064
less: Major and non-major turnaround and catalyst replacement capital expenditures 9,586 58,736
add: Major turnaround and catalyst replacement capital expenditures previously reserved — (23,000 )
less: Major turnaround reserve for future years 1,500 5,650
less: Principal payments 625 2,500
less: State income tax payments 342 2,127
less: Interest paid in cash 11,203 44,948
Cash available for distribution $ 44,005 $ 159,094
Cash available for distribution per unit $ 0.70 $ 2.54

27
Crude Differentials & Crack Spread Trends
¹ 5 Year Average of 2010 to 2014 * All crude differentials and WTI prices above are based on trade-month pricing.
WTI Cushing – WTS WTI Cushing – WTI Midland
January 2015 Average $1.56 $1.79
February 2015 Average $2.67 $2.92
West Texas Intermediate -
Cushing ("WTI")
Louisiana Light Sweet
("LLS")WTI Midland Brent
West Texas Sour
("WTS")
WTI 5 Year Average¹--$92.22
2013 ---$97.05 2014 ---$96.65
Q4 2014---$85.81
WTI Cushing - WTS 5 Year Average --$3.63
2013 ---$3.72 2014 ---$6.04
Q4 2014 ---$4.43
GC321 5 Year Average --$18.54
2013 ---$19.16 2014 ---$14.52
Q4 2014---$9.04
WTI Cushing - WTI Midland 5 Year Average --$2.63
2013 ---$2.59 2014 ---$6.93
Q4 2014 ---$5.79
Brent - WTI Midland 5 Year Average --$13.37
2013 ---$15.00 2014 ---$14.23
Q4 2014 ---$9.49
LLS - WTI Midland 5 Year Average --$12.89
2013 ---$13.65 2014 ---$10.78
Q4 2014 ---$8.95
Brent - LLS 5 Year Average --$0.48
2013 ---$1.35 2014 ---$3.45
Q4 2014 ---$0.54
GC321(Brent) 5 Year Average --$7.79
2013 ---$7.56 2014 ---$8.33
Q4 2014---$5.97
GC 211 (HSD/LLS) 5 Year Average --$8.24
2013 ---$7.89 2014 ---$9.76
Q4 2014 ---$4.80

28
Adjusted EBITDA Reconciliation
1 Results for YTD 3Q 2014 were negatively impacted by the major turnaround at the Big Spring refinery in 2Q 2014. Pro forma for the turnaround in 2Q 2014, EBITDA would be higher by $55-65 million.
(in $ 000's) 2011 2012 2013 YTD 3Q 20141
Net income available to stockholders 42,507 79,134 22,986 31,750 Net income attributable to non-controlling interest 1,241 11,463 25,129 23,662
Income tax expense 18,918 49,884 12,151 14,454
Interest expense 88,310 129,572 94,694 85,473
Depreciation and amortization 113,730 121,929 125,494 91,501
(Gain) loss on disposition of assets (729 ) 2,309 (9,558 ) (745 )
Unrealized (gains) losses on commodity swaps (31,936 ) 31,936 — 10,774 Loss on heating oil call option crack spread contracts 36,280 7,297 — —
Adjusted EBITDA 268,321 433,524 270,896 256,869