PATTERNS SERUM - dm5migu4zj3pb.cloudfront.net · Silicone grease wasspreadalongthe edge ... of...
8
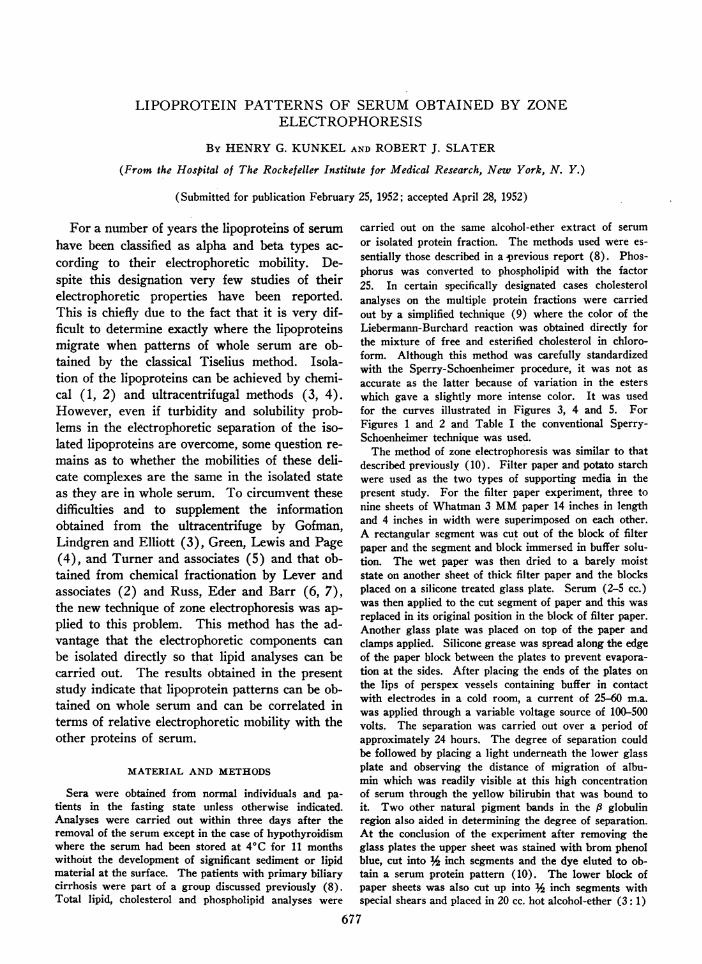
LIPOPROTEIN PATTERNS OF SERUM OBTAINED BY ZONE ELECTROPHORESIS By HENRY G. KUNKEL AND ROBERT J. SLATER (From the Hospital of The Rockefeller Institute for Medical Research, New York, N. Y.) (Submitted for publication February 25, 1952; accepted April 28, 1952) For a number of years the lipoproteins of serum have been classified as alpha and beta types ac- cording to their electrophoretic mobility. De- spite this designation very few studies of their electrophoretic properties have been reported. This is chiefly due to the fact that it is very dif- ficult to determine exactly where the lipoproteins migrate when patterns of whole serum are ob- tained by the classical Tiselius method. Isola- tion of the lipoproteins can be achieved by chemi- cal (1, 2) and ultracentrifugal methods (3, 4). However, even if turbidity and solubility prob- lems in the electrophoretic separation of the iso- lated lipoproteins are overcome, some question re- mains as to whether the mobilities of these deli- cate complexes are the same in the isolated state as they are in whole serum. To circumvent these difficulties and to supplement the information obtained from the ultracentrifuge by Gofman, Lindgren and Elliott (3), Green, Lewis and Page (4), and Turner and associates (5) and that ob- tained from chemical fractionation by Lever and associates (2) and Russ, Eder and Barr (6, 7), the new technique of zone electrophoresis was ap- plied to this problem. This method has the ad- vantage that the electrophoretic components can be isolated directly so that lipid analyses can be carried out. The results obtained in the present study indicate that lipoprotein patterns can be ob- tained on whole serum and can be correlated in terms of relative electrophoretic mobility with the other proteins of serum. MATERIAL AND METHODS Sera were obtained from normal individuals and pa- tients in the fasting state unless otherwise indicated. Analyses were carried out within three days after the removal of the serum except in the case of hypothyroidism where the serum had been stored at 40C for 11 months without the development of significant sediment or lipid material at the surface. The patients with primary biliary cirrhosis were part of a group discussed previously (8). Total lipid, cholesterol and phospholipid analyses were carried out on the same alcohol-ether extract of serum or isolated protein fraction. The methods used were es- sentially those described in a previous report (8). Phos- phorus was converted to phospholipid with the factor 25. In certain specifically designated cases cholesterol analyses on the multiple protein fractions were carried out by a simplified technique (9) where the color of the Liebermann-Burchard reaction was obtained directly for the mixture of free and esterified cholesterol in chloro- form. Although this method was carefully standardized with the Sperry-Schoenheimer procedure, it was not as accurate as the latter because of variation in the esters which gave a slightly more intense color. It was used for the curves illustrated in Figures 3, 4 and 5. For Figures 1 and 2 and Table I the conventional Sperry- Schoenheimer technique was used. The method of zone electrophoresis was similar to that described previously (10). Filter paper and potato starch were used as the two types of supporting media in the present study. For the filter paper experiment, three to nine sheets of Whatman 3 MM paper 14 inches in length and 4 inches in width were superimposed on each other. A rectangular segment was cut out of the block of filter paper and the segment and block immersed in buffer solu- tion. The wet paper was then dried to a barely moist state on another sheet of thick filter paper and the blocks placed on a silicone treated glass plate. Serum (2-5 cc.) was then applied to the cut segment of paper and this was replaced in its original position in the block of filter paper. Another glass plate was placed on top of the paper and clamps applied. Silicone grease was spread along the edge of the paper block between the plates to prevent evapora- tion at the sides. After placing the ends of the plates on the lips of perspex vessels containing buffer in contact with electrodes in a cold room, a current of 25-60 m.a. was applied through a variable voltage source of 100-500 volts. The separation was carried out over a period of approximately 24 hours. The degree of separation could be followed by placing a light underneath the lower glass plate and observing the distance of migration of albu- min which was readily visible at this high concentration of serum through the yellow bilirubin that was bound to it. Two other natural pigment bands in the fi globulin region also aided in determining the degree of separation. At the conclusion of the experiment after removing the glass plates the upper sheet was stained with brom phenol blue, cut into % inch segments and the dye eluted to ob- tain a serum protein pattern (10). The lower block of paper sheets was also cut up into t inch segments with special shears and placed in 20 cc. hot alcohol-ether (3: 1) 677
-
Upload
vuongquynh -
Category
Documents
-
view
216 -
download
0
Transcript of PATTERNS SERUM - dm5migu4zj3pb.cloudfront.net · Silicone grease wasspreadalongthe edge ... of...
LIPOPROTEIN PATTERNS OF SERUM OBTAINED BY ZONEELECTROPHORESIS
By HENRY G. KUNKEL AND ROBERT J. SLATER
(From the Hospital of The Rockefeller Institute for Medical Research, New York, N. Y.)
(Submitted for publication February 25, 1952; accepted April 28, 1952)
For a number of years the lipoproteins of serumhave been classified as alpha and beta types ac-cording to their electrophoretic mobility. De-spite this designation very few studies of theirelectrophoretic properties have been reported.This is chiefly due to the fact that it is very dif-ficult to determine exactly where the lipoproteinsmigrate when patterns of whole serum are ob-tained by the classical Tiselius method. Isola-tion of the lipoproteins can be achieved by chemi-cal (1, 2) and ultracentrifugal methods (3, 4).However, even if turbidity and solubility prob-lems in the electrophoretic separation of the iso-lated lipoproteins are overcome, some question re-mains as to whether the mobilities of these deli-cate complexes are the same in the isolated stateas they are in whole serum. To circumvent thesedifficulties and to supplement the informationobtained from the ultracentrifuge by Gofman,Lindgren and Elliott (3), Green, Lewis and Page(4), and Turner and associates (5) and that ob-tained from chemical fractionation by Lever andassociates (2) and Russ, Eder and Barr (6, 7),the new technique of zone electrophoresis was ap-plied to this problem. This method has the ad-vantage that the electrophoretic components canbe isolated directly so that lipid analyses can becarried out. The results obtained in the presentstudy indicate that lipoprotein patterns can be ob-tained on whole serum and can be correlated interms of relative electrophoretic mobility with theother proteins of serum.
MATERIAL AND METHODS
Sera were obtained from normal individuals and pa-tients in the fasting state unless otherwise indicated.Analyses were carried out within three days after theremoval of the serum except in the case of hypothyroidismwhere the serum had been stored at 40C for 11 monthswithout the development of significant sediment or lipidmaterial at the surface. The patients with primary biliarycirrhosis were part of a group discussed previously (8).Total lipid, cholesterol and phospholipid analyses were
carried out on the same alcohol-ether extract of serumor isolated protein fraction. The methods used were es-sentially those described in a previous report (8). Phos-phorus was converted to phospholipid with the factor25. In certain specifically designated cases cholesterolanalyses on the multiple protein fractions were carriedout by a simplified technique (9) where the color of theLiebermann-Burchard reaction was obtained directly forthe mixture of free and esterified cholesterol in chloro-form. Although this method was carefully standardizedwith the Sperry-Schoenheimer procedure, it was not asaccurate as the latter because of variation in the esterswhich gave a slightly more intense color. It was usedfor the curves illustrated in Figures 3, 4 and 5. ForFigures 1 and 2 and Table I the conventional Sperry-Schoenheimer technique was used.The method of zone electrophoresis was similar to that
described previously (10). Filter paper and potato starchwere used as the two types of supporting media in thepresent study. For the filter paper experiment, three tonine sheets of Whatman 3 MM paper 14 inches in lengthand 4 inches in width were superimposed on each other.A rectangular segment was cut out of the block of filterpaper and the segment and block immersed in buffer solu-tion. The wet paper was then dried to a barely moiststate on another sheet of thick filter paper and the blocksplaced on a silicone treated glass plate. Serum (2-5 cc.)was then applied to the cut segment of paper and this wasreplaced in its original position in the block of filter paper.Another glass plate was placed on top of the paper andclamps applied. Silicone grease was spread along the edgeof the paper block between the plates to prevent evapora-tion at the sides. After placing the ends of the plates onthe lips of perspex vessels containing buffer in contactwith electrodes in a cold room, a current of 25-60 m.a.was applied through a variable voltage source of 100-500volts. The separation was carried out over a period ofapproximately 24 hours. The degree of separation couldbe followed by placing a light underneath the lower glassplate and observing the distance of migration of albu-min which was readily visible at this high concentrationof serum through the yellow bilirubin that was bound toit. Two other natural pigment bands in the fi globulinregion also aided in determining the degree of separation.At the conclusion of the experiment after removing theglass plates the upper sheet was stained with brom phenolblue, cut into % inch segments and the dye eluted to ob-tain a serum protein pattern (10). The lower block ofpaper sheets was also cut up into t inch segments withspecial shears and placed in 20 cc. hot alcohol-ether (3: 1)
677
HENRY G. KUNKEL AND ROBERT J. SLATER
solution. The lipids were extracted over a ten hour pe-riod, the paper removed after pressing out the solvent,and the tubes centrifuged to remove precipitated proteinor paper fragments. Aliquots of the clear alcohol-etherextract were then taken for cholesterol, phospholipid ortotal lipid analysis. The recovery of lipid from the seg-ments was less than 100% because of removal of alcohol-ether with the paper. However, this error was relativelyconstant for each tube and was minimized by the excessof solvent.
Barbital buffer at pH 8.6, 0.1 was usually employedfor the separation. Some barbital was extracted withthe alcohol-ether but this did not interfere with the cho-lesterol or phospholipid analyses. However, total lipidcarbon could not be determined because of barbital carbon.Barbital also interfered with nitrogen analyses on thefractions. Phosphate buffers were used where total lipidanalyses were carried out. However, phospholipid analy-ses were difficult in this buffer and could only be carriedout after washing the dried alcohol-ether residue withacid water to remove buffer phosphorus.
In the experiments where potato starch (Amend) wasused as the supporting medium, a block of barely moiststarch was used between glass plates in the same manneras filter paper. This was prepared by pouring a starchbuffer mixture into a mold lined with wax paper. Thestarch was brought to a solid form by removing excessbuffer with porous filter paper applied at the sides of themold. The procedure will be described in detail else-where (11). The wax paper prevented sticking of thestarch to the glass plates and could be peeled from thestarch block readily at the conclusion of the experiment.Serum mixed with starch was placed in a rectangularspace cut out of the starch block just as in the case of thefilter paper block, or was applied directly with a pipettewhich penetrated into the starch. Contact at the elec-trode vessels was made with plastic sponges that pressedagainst the ends of the starch block. At the conclusionof the separation, the starch block was cut into segmentswith a thin spatula and the segments placed in test tubes.Saline was added to each tube (1 cc.) and after stirringthe starch and allowing it to settle, 0.05 cc. of supernatewas removed from each tube. This was used to obtaina protein curve of the serum segments. The modifiedFolin-Ciocalteu procedure (10, 12) was found most suit-able for this purpose. The starch did not contain ma-terial which interfered with this reaction. Ninhydrin andultraviolet absorption curves could also be obtained butthey required considerable washing of the starch to re-move interfering material. Hot alcohol-ether was thenadded to the saline starch mixture or preferably to par-tially dried starch segments and the lipids extracted.Aliquots were taken for cholesterol and phospholipidanalyses. Total lipid determinations were difficult be-cause of some carbon material in the starch which wasdifficult to remove. Good recoveries could be obtainedfrom the starch segments by further addition of solventon a ground glass filter. The fresh solvent then dis-placed that mixed with the starch by suction. However,
for most experiments a single extraction was used witha constant loss of solvent for each tube. Initial diffi-culties in the complete extraction of the cholesterol esterswere overcome by longer extraction of the starch seg-ments with hot solvent.
In the experiments where the lipoproteins were staineddirectly on filter paper after separation of the serum, thedried paper was immersed in a 50% ethanol solutionsaturated with Sudan III, placed at 370C for three hoursand washed with running water. Two superimposedfilter paper strips were run together in these experi-ments and one strip, stained by the conventional method,was compared with the strip where only the lipid of thelipoprotein was stained.Adsorption of proteins to the filter paper or starch was
measured by letting buffer flow through the mediumwithout an electric current. This was done by loweringthe liquid level in one electrode vessel producing a siphon-like arrangement. The protein was carried along, leavinga trail if significant adsorption occurred. No separationof the serum proteins was obtained unless current wasapplied.
RESULTS
Preliminary observations on the localization ofthe lipoproteins relative to the other protein com-ponents of serum were carried out by simplystaining the filter paper with Sudan III or othersimilar fat soluble dyes. Normal serum showedtwo distinct components, an intense spot in the /3globulin region and a more faintly staining spotin the albumin-a, region. By careful comparisonof the Sudan stained strips with an identical stripstained with brom phenol blue where all of theprotein peaks were visible, it could be seen thatthe ft Sudan spot was close to the 1P globulinpeak but usually with a slightly lower mobility.The fainter Sudan spot did not correspond to thea1 peak but showed a slightly more rapid mobility.It lay partially under the albumin peak. Patho-logical sera with high lipid concentration showedmany variations of the Sudan III patterns. In-tense spots were visible in new positions on thepattern. Nephrotic sera usually showed a singlespot moving in the region between the two mainspots visible in the normal pattern. There ap-peared to be a general tendency for the normallipid components to disappear and be replaced bynew components, usually single, with a differentmobility.To test the validity of these observations and to
determine whether the Sudan III was reallystaining the lipoprotein components selectively,
678
LIPOPROTEIN PATTERNS OF SERUM BY ZONE ELECTROPHORESIS
direct lipid analyses were made on paper seg-ments. To do this successfully it was necessaryto increase greatly the capacity of the procedureso that 2-5 cc. of serum could be separated in-stead of 0.01 cc. as in the simple pattern stainedwith Sudan III. This was found possible bysuperimposing a number of sheets of filter paper,forming a block between glass plates. Figure 1illustrates the protein pattern obtained by thebrom phenol blue dye elution method in segmentsof the paper and the cholesterol and phospholipidpatterns for the same segments. For this pat-tern 2.5 cc. of dialyzed serum were used withbarbital buffer at pH 8.6, u 0.1 and a current of40 m.a. over a period of 24 hours in the cold room.Two major lipid peaks are visible, one slightly be-hind the /8 globulin (designated /8) and the otherslightly behind the albumin but ahead of the a,globulin (designated a). This experiment con-firms the localization of the lipoproteins observedwith the Sudan staining. A third vague peak isvisible extending from the origin to the /3 peak.This vague area was also visible in the experi-ments with Sudan III. It has the appearance ofa trail left behind as the /3 component migratedfrom the origin. However, it is of interest that
Tube No.
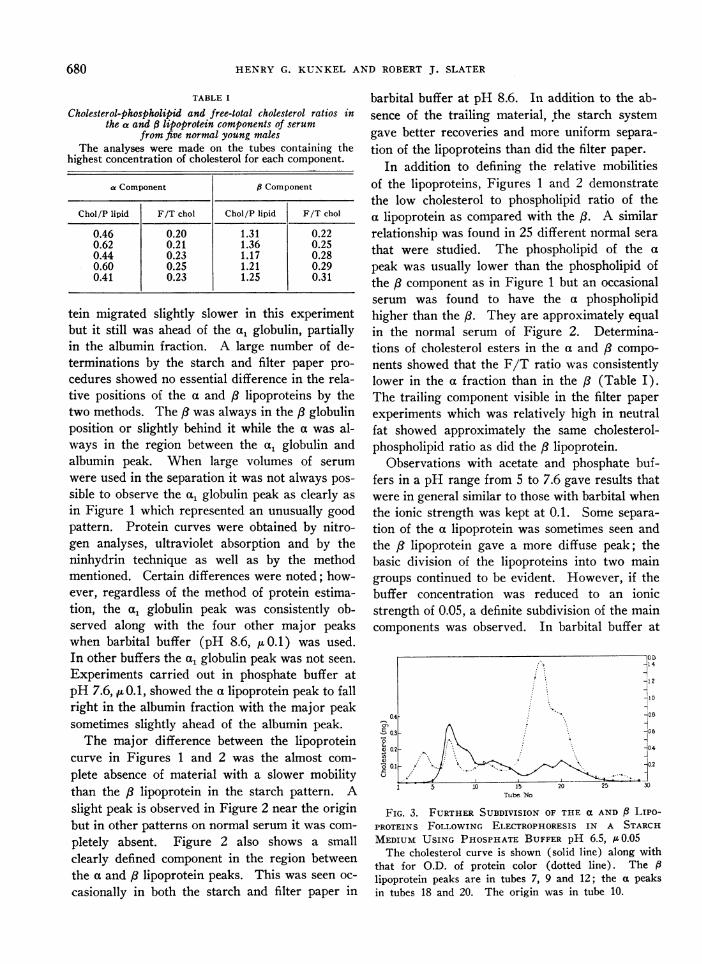
FIG. 1. CURVES SHOWING THE a AND 8 LIPOPROTEINSFOR A NORMAL SERUM SEPARATED BY ZONE ELECTRO-PHORESIS IN A FILTER PAPER MEDIUMThe upper curve represents the protein pattern ob-
tained by the brom phenol blue elution method, with O.D.referring to dye color. The lower curves represent thecholesterol and phospholipid values obtained in the same
experiment on identical segments of paper.
Tube No
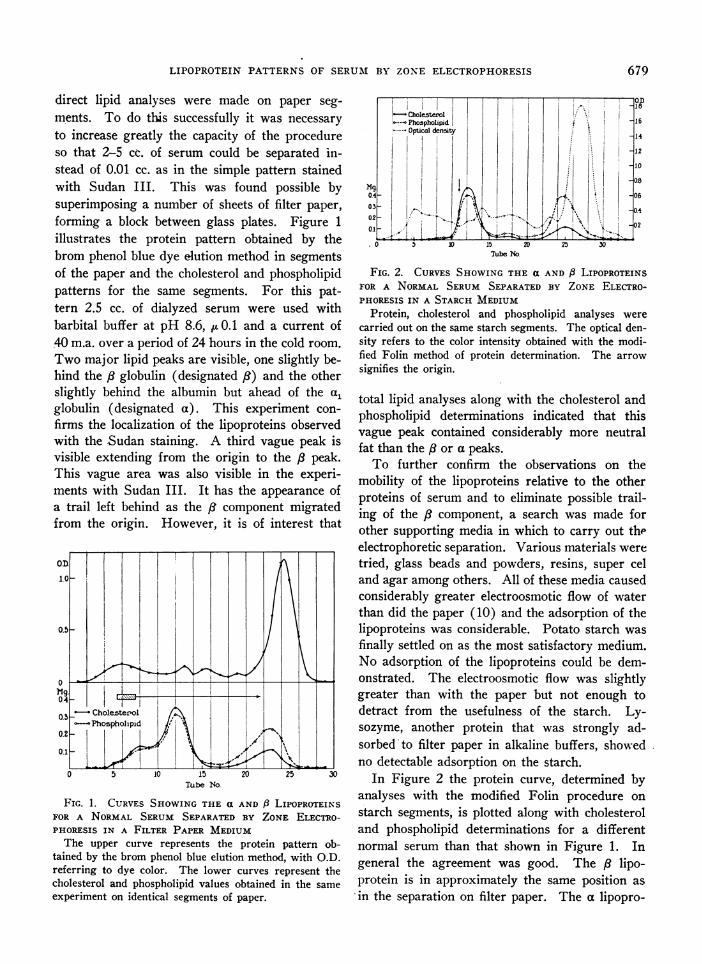
FIG. 2. CURVES SHOWING THE a AND 8 LIPOPROTEINSFOR A NORMAL SERUM SEPARATED BY ZONE ELECTRO-PHORESIS IN A STARCH MEDIUM
Protein, cholesterol and phospholipid analyses werecarried out on the same starch segments. The optical den-sity refers to the color intensity obtained with the modi-fied Folin method of protein determination. The arrowsignifies the origin.
total lipid analyses along with the cholesterol andphospholipid determinations indicated that thisvague peak contained considerably more neutralfat than the /8 or a peaks.To further confirm the observations on the
mobility of the lipoproteins relative to the otherproteins of serum and to eliminate possible trail-ing of the / component, a search was made forother supporting media in which to carry out theelectrophoretic separation. Various materials weretried, glass beads and powders, resins, super celand agar among others. All of these media causedconsiderably greater electroosmotic flow of waterthan did the paper (10) and the adsorption of thelipoproteins was considerable. Potato starch wasfinally settled on as the most satisfactory medium.No adsorption of the lipoproteins could be dem-onstrated. The electroosmotic flow was slightlygreater than with the paper but not enough todetract from the usefulness of the starch. Ly-sozyme, another protein that was strongly ad-sorbed-to filter paper in alkaline buffers, showedno detectable adsorption on the starch.
In Figure 2 the protein curve, determined byanalyses with the modified Folin procedure onstarch segments, is plotted along with cholesteroland phospholipid determinations for a differentnormal serum than that shown in Figure 1. Ingeneral the agreement was good. The A lipo-protein is in approximately the same position asin the separation on filter paper. The a lipopro-
679
HENRY G. KUNKEL AND ROBERT J. SLATER
TABLE I
Cholesterol-phospholipid and free-total cholesterol ratios inthe a and # lipoprotein components of serum
from five normal young malesThe analyses were made on the tubes containing the
highest concentration of cholesterol for each component.
a Component a Component
Chol/P lipid F/T chol Chol/P lipid F/T chol
0.46 0.20 1.31 0.220.62 0.21 1.36 0.250.44 0.23 1.17 0.280.60 0.25 1.21 0.290.41 0.23 1.25 0.31
tein migrated slightly slower in this experimentbut it still was ahead of the a, globulin, partiallyin the albumin fraction. A large number of de-terminations by the starch and filter paper pro-cedures showed no essential difference in the rela-tive positions of the a and /3 lipoproteins by thetwo methods. The /8 was always in the /3 globulinposition or slightly behind it while the a was al-ways in the region between the a, globulin andalbumin peak. When large volumes of serumwere used in the separation it was not always pos-sible to observe the a, globulin peak as clearly asin Figure 1 which represented an unusually goodpattern. Protein curves were obtained by nitro-gen analyses, ultraviolet absorption and by theninhydrin technique as well as by the methodmentioned. Certain differences were noted; how-ever, regardless of the method of protein estima-tion, the al globulin peak was consistently ob-served along with the four other major peakswhen barbital buffer (pH 8.6, pu0.1) was used.In other buffers the a, globulin peak was not seen.Experiments carried out in phosphate buffer atpH 7.6, ~t0.1, showed the a lipoprotein peak to fallright in the albumin fraction with the major peaksometimes slightly ahead of the albumin peak.The major difference between the lipoprotein
curve in Figures 1 and 2 was the almost com-plete absence of material with a slower mobilitythan the /8 lipoprotein in the starch pattern. Aslight peak is observed in Figure 2 near the originbut in other patterns on normal serum it was com-pletely absent. Figure 2 also shows a smallclearly defined component in the region betweenthe a and /3 lipoprotein peaks. This was seen oc-casionally in both the starch and filter paper in
barbital buffer at pH 8.6. In addition to the ab-sence of the trailing material, the starch systemgave better recoveries and more uniform separa-tion of the lipoproteins than did the filter paper.
In addition to defining the relative mobilitiesof the lipoproteins, Figures 1 and 2 demonstratethe low cholesterol to phospholipid ratio of thea lipoprotein as compared with the /3. A similarrelationship was found in 25 different normal serathat were studied. The phospholipid of the apeak was usually lower than the phospholipid ofthe /8 component as in Figure 1 but an occasionalserum was found to have the a phospholipidhigher than the /8. They are approximately equalin the normal serum of Figure 2. Determina-tions of cholesterol esters in the a and /3 compo-nents showed that the F/T ratio was consistentlylower in the a fraction than in the /8 (Table I).The trailing component visible in the filter paperexperiments which was relatively high in neutralfat showed approximately the same cholesterol-phospholipid ratio as did the / lipoprotein.
Observations with acetate and phosphate buf-fers in a pH range from 5 to 7.6 gave results thatwere in general similar to those with barbital whenthe ionic strength was kept at 0.1. Some separa-tion of the a lipoprotein was sometimes seen andthe /8 lipoprotein gave a more diffuse peak; thebasic division of the lipoproteins into two maingroups continued to be evident. However, if thebuffer concentration was reduced to an ionicstrength of 0.05, a definite subdivision of the maincomponents was observed. In barbital buffer at
0.4cn
0 0.2
*S 0.1uE
I 5 10 15Tube No
v v
14
12
10
08
06
04
02
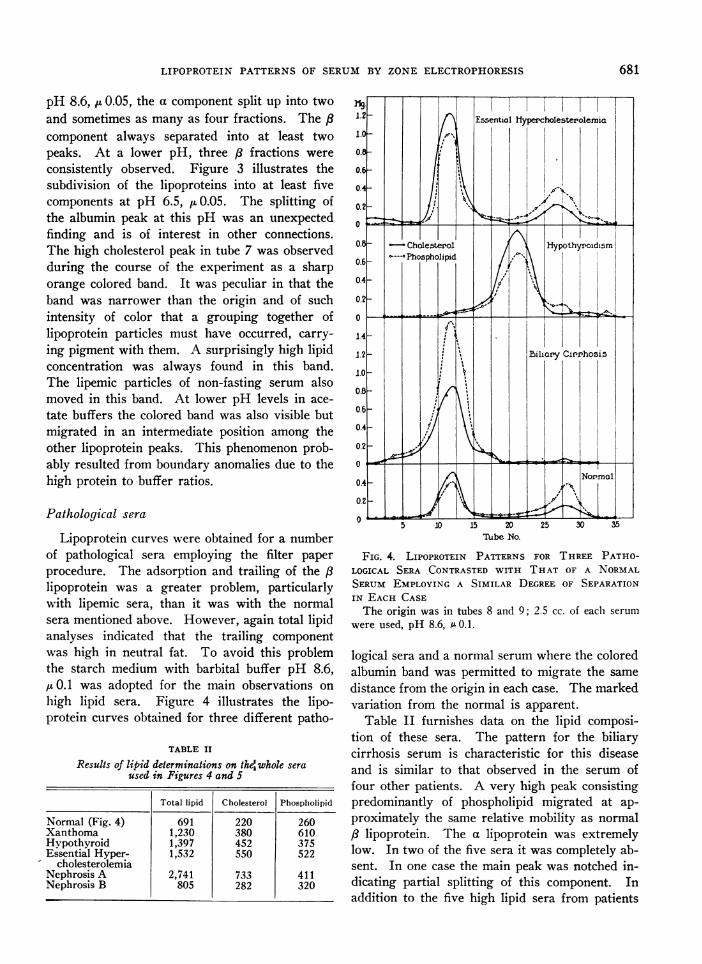
FIG. 3. FURTHER SUBDIVISION OF THE a AND P LiPO-PROTEINS FOLLOWING ELECTROPHORESIS IN A STARCHMEDIUM USING PHOSPHATE BUFFER pH 6.5, 1 0.05The cholesterol curve is shown (solid line) along with
that for O.D. of protein color (dotted line). The jSlipoprotein peaks are in tubes 7, 9 and 12; the a peaksin tubes 18 and 20. The origin was in tube 10.
680
LIPOPROTEIN PATTERNS OF SERUM BY ZONE ELECTROPHORESIS
pH 8.6, pt 0.05, the a component split up into twoand sometimes as many as four fractions. The /3component always separated into at least twopeaks. At a lower pH, three /8 fractions wereconsistently observed. Figure 3 illustrates thesubdivision of the lipoproteins into at least fivecomponents at pH 6.5, IL0.05. The splitting ofthe albumin peak at this pH was an unexpectedfinding and is of interest in other connections.The high cholesterol peak in tube 7 was observedduring the course of the experiment as a sharporange colored band. It was peculiar in that theband was narrower than the origin and of suchintensity of color that a grouping together oflipoprotein particles must have occurred, carry-ing pigment with them. A surprisingly high lipidconcentration was always found in this band.The lipemic particles of non-fasting serum alsomoved in this band. At lower pH levels in ace-tate buffers the colored band was also visible butmigrated in an intermediate position among theother lipoprotein peaks. This phenomenon prob-ably resulted from boundary anomalies due to thehigh protein to buffer ratios.
Pathological sera
Lipoprotein curves were obtained for a numberof pathological sera employing the filter paperprocedure. The adsorption and trailing of the Plipoprotein was a greater problem, particularlywith lipemic sera, than it was with the normalsera mentioned above. However, again total lipidanalyses indicated that the trailing componentwas high in neutral fat. To avoid this problemthe starch medium with barbital buffer pH 8.6,LO.1 was adopted for the main observations onhigh lipid sera. Figure 4 illustrates the lipo-protein curves obtained for three different patho-
TABLE II
Results of lipid determinations on thkewhole seraused in Figures 4 and 5
Total lipid Cholesterol Phospholipid
Normal (Fig. 4) 691 220 260Xanthoma 1,230 380 610Hypothyroid 1,397 452 375Essential Hyper- 1,532 550 522
cholesterolemiaNephrosisA 2,741 733 411Nephrosis B 805 282 320
20Tube No.
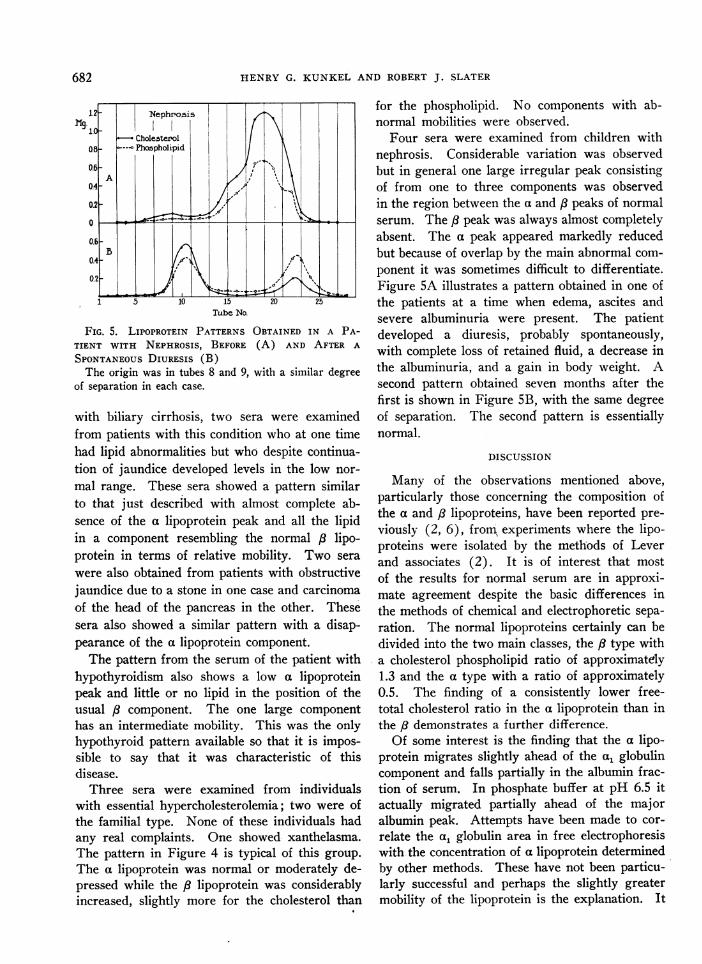
FIG. 4. LIPOPROTEIN PATTERNS FOR THREE PATHO-LOGICAL SERA CONTRASTED WITH THAT OF A NORMALSERUM EMPLOYING A SIMILAR DEGREE OF SEPARATIONIN EACH CASEThe origin was in tubes 8 and 9; 2.5 cc. of each serum
were used, pH 8.6, A 0.1.
logical sera and a normal serum where the coloredalbumin band was permitted to migrate the samedistance from the origin in each case. The markedvariation from the normal is apparent.
Table II furnishes data on the lipid composi-tion of these sera. The pattern for the biliarycirrhosis serum is characteristic for this diseaseand is similar to that observed in the serum offour other patients. A very high peak consistingpredominantly of phospholipid migrated at ap-proximately the same relative mobility as normal,8 lipoprotein. The a lipoprotein was extremelylow. In two of the five sera it was completely ab-sent. In one case the main peak was notched in-dicating partial splitting of this component. Inaddition to the five high lipid sera from patients
681
HENRY G. KUNKEL AND ROBERT J. SLATER
Tube No.
FIG. 5. LIPOPROTEIN PATTERNS OBTAINED IN A PA-TIENT WITH NEPHROSIS, BEFORE (A) AND AFTER A
SPONTANEOUS DIURESIS (B)The origin was in tubes 8 and 9, with a similar degree
of separation in each case.
with biliary cirrhosis, two sera were examinedfrom patients with this condition who at one timehad lipid abnormalities but who despite continua-tion of jaundice developed levels in the low nor-
mal range. These sera showed a pattern similarto that just described with almost complete ab-sence of the a lipoprotein peak and all the lipidin a component resembling the normal lipo-protein in terms of relative mobility. Two sera
were also obtained from patients with obstructivejaundice due to a stone in one case and carcinomaof the head of the pancreas in the other. Thesesera also showed a similar pattern with a disap-pearance of the a lipoprotein component.The pattern from the serum of the patient with
hypothyroidism also shows a low a lipoproteinpeak and little or no lipid in the position of theusual /8 component. The one large componenthas an intermediate mobility. This was the onlyhypothyroid pattern available so that it is impos-sible to say that it was characteristic of thisdisease.
Three sera were examined from individualswith essential hypercholesterolemia; two were ofthe familial type. None of these individuals hadany real complaints. One showed xanthelasma.The pattern in Figure 4 is typical of this group.
The a lipoprotein was normal or moderately de-pressed while the /8 lipoprotein was considerablyincreased, slightly more for the cholesterol than
for the phospholipid. No components with ab-normal mobilities were observed.
Four sera were examined from children withnephrosis. Considerable variation was observedbut in general one large irregular peak consistingof from one to three components was observedin the region between the a and /3 peaks of normalserum. The ,/ peak was always almost completelyabsent. The a peak appeared markedly reducedbut because of overlap by the main abnormal com-ponent it was sometimes difficult to differentiate.Figure 5A illustrates a pattern obtained in one ofthe patients at a time when edema, ascites andsevere albuminuria were present. The patientdeveloped a diuresis, probably spontaneously,with complete loss of retained fluid, a decrease inthe albuminuria, and a gain in body weight. Asecond pattern obtained seven months after thefirst is shown in Figure 5B, with the same degreeof separation. The second pattern is essentiallynormal.
DISCUSSION
Many of the observations mentioned above,particularly those concerning the composition ofthe a and /3 lipoproteins, have been reported pre-viously (2, 6), from experiments where the lipo-proteins were isolated by the methods of Leverand associates (2). It is of interest that mostof the results for normal serum are in approxi-mate agreement despite the basic differences inthe methods of chemical and electrophoretic sepa-ration. The normal lipoproteins certainly can bedivided into the two main classes, the /8 type witha cholesterol phospholipid ratio of approximately1.3 and the a type with a ratio of approximately0.5. The finding of a consistently lower free-total cholesterol ratio in the a lipoprotein than inthe /8 demonstrates a further difference.Of some interest is the finding that the a lipo-
protein migrates slightly ahead of the al globulincomponent and falls partially in the albumin frac-tion of serum. In phosphate buffer at pH 6.5 itactually migrated partially ahead of the majoralbumin peak. Attempts have been made to cor-relate the al globulin area in free electrophoresiswith the concentration of a lipoprotein determinedby other methods. These have not been particu-larly successful and perhaps the slightly greatermobility of the lipoprotein is the explanation. It
682
683LIPOPROTEIN PATTERNS OF SERUM BY ZONE ELECTROPHORESIS
should be mentioned that in free electrophoresisexperiments the lipid of the lipoproteins con-tributes to the refractive index increment of theproteins while in the present experiments the lipidwas not estimated by either the dye elution orthe modified Folin procedure. This accounts forsome of the differences in the protein curves ob-tained by the two types of electrophoresis dis-cussed previously (10). The slightly slower mo-bility of the /8 lipoprotein compared to the /3globulin peak may be explained in this way; and,if the lipid were measured as in free electro-phoresis experiments, these two peaks might fuse.A similar explanation might apply to the a, globu-lin peak although here the influence of the lipidwould be less marked.A large scale quantitative analysis of the nor-
mal fractions, such as that carried out by Russ,Eder and Barr (6) with their striking results ofsex and age differences, is more practically doneby the chemical methods. The results with thezone electrophoresis method certainly confirmthe validity of the chemical division for such rela-tively normal sera. For pathological sera withlarge lipid alterations the results of the chemicalmethod are more difficult to interpret and do notcorrelate as well with the results of zone electro-phoresis. Some of the pathological sera examinedin the present study, particularly those from pa-tients with nephrosis, showed the major lipopro-tein to have an intermediate mobility clearly dif-ferent from the a and /8 components of normalserum. By the chemical fractionation procedurethis abnormal component falls chiefly in the samefraction with the normal /8 lipoprotein. Sera frompatients with biliary obstruction, intrahepatic orextrahepatic in type, were studied particularly.Of nine such sera from different patients, not oneshowed a significant amount of the normal a com-ponent; it was either entirely absent or presentin very low concentrations. This was a generalphenomenon applying to other high lipid patho-logical states; in no case was an increase in the acomponent observed. Three patients with biliaryobstruction examined by the chemical procedurehave been reported (7) to have an increase inthe fraction showing the a component of normalserum. These results are difficult to understand;perhaps the high phospholipid content of the lipo-
protein of these sera alters their solubility so thatthey fall into the a fraction or perhaps the highlevels of bile salts are responsible. For thesepathological sera the method of zone electro-phoresis would appear to possess certain advan-tages, particularly in demonstrating new com-ponents.
Although the procedure utilizing filter paper asthe stabilizing medium showed adsorption of the,/ lipoprotein in the path of migration, it furnishedsome information not provided by the starch sys-tem. The trailing material showed a high neutralfat content relative to that of the main /8 compo-nent. Such a selective adsorption of the largerlipoprotein molecules containing increased amountsof neutral fat might be expected and these mole-cules probably correspond to the higher Sf com-ponents described by Gofman, Lindgren and El-liott (3). Of particular interest is the fact thatthe cholesterol-phospholipid ratio of the adsorb-ing component was very close to that of the /8lipoprotein. This, together with the fact that thehigh neutral fat material had the same mobilityas the /8 component when the nonadsorbing starchmedium was used, suggests a close relationship.The low cholesterol-phospholipid ratio obtained
for the /8 component in the sera of patients withbiliary obstruction differs strikingly from thecomposition of the ft lipoprotein in normal serum.It may be that this represents an entirely differ-ent lipoprotein that just happens to migrate withthe mobility of the normal component. However,it seems more likely that this protein is related tothe normal /8 lipoprotein with a slightly differentlipid composition. Isolation of this lipoproteinin the ultracentrifuge in preliminary experimentshas indicated that it has a lipid-protein ratio closeto but slightly higher than the normal /3 lipo-protein.
SUMMARY
1. Separation of a and /8 lipoproteins of normalserum into two main fractions was readily pos-sible by zone electrophoresis in a filter paper orstarch medium containing barbital buffer. Lipo-protein curves were obtained and the relativemobilities of the components correlated with themobilities of the other serum proteins.
2. The cholesterol-phospholipid ratios of thetwo major components showed approximate
HENRY G. KUNKEL AND ROBERT J. SLATER
agreement with the results obtained by otherworkers by chemical fractionation. A lower free-total cholesterol ratio was found in the a frac-tion than the pl.
3. Further subdivision of the a and /8 lipo-proteins was obtained with low ionic strength buf-fers in the starch medium. The a lipoproteinsconsistently separated into two and sometimesthree fractions. The /8 lipoproteins separated intoat least three fractions, one of which could beseen as a sharp orange band.
4. Marked variations from the normal patternwere found in pathological sera with elevatedlipid concentrations. These were characterizedby a general tendency of diminution or disappear-ance of the a lipoproteins and either an increaseof the ,6 type or the appearance of a large com-ponent with an abnormal mobility.
ACKNOWLEDGMENT
The senior author is indebted to Professor ArneTiselius for valuable suggestions in the early portion ofthis work which was carried out at the Institute of Bio-chemistry, Uppsala, Sweden.
REFERENCES
1. Oncley, J. L., Gurd, F. R. N., and Melin, M., Prepa-ration and properties of serum and plasma pro-teins.- XXV. Composition and properties of humanserum P-lipoprotein. J. Am. Chem. Soc., 1950, 72,458.
2. Lever, W. F., Gurd, F. R. N., lroma, E., Brown, R.K., Barnes, B. A., Schmid, K., and Schultz E. L.,Chemical, clinical, and immunological studies on
the products of human plasma fractionation. XXL.Quantitative separation and determination of theprotein components in small amounts of humanplasma. J. Clin. Invest., 1951, 30, 99.
3. Gofman, J. W., Lindgren, F. T., and Elliott, H., Ul-tracentrifugal studies of lipoproteins of human se-rum. J. Biol. Chem., 1949, 179, 973.
4. Green, A. A., Lewis, L. A., and Page, I. H., A methodfor the ultracentrifugal analysis of a and P serumlipoproteins. Federation Proc., 1951, 10, 191.
5. Turner, R. H., Snavely, J. R., Goldwater, W. H.,Randolph, M. L., Sprague, C. C., and Unglaub,W. G., The study of serum proteins and lipids withthe aid of the quantity ultracentrifuge. I. Proce-dure and principal features of the centrifugate ofuntreated normal serum as determined by quan-titative analysis of samples from ten levels. J. Clin.Invest., 1951, 30, 1071.
6. Russ, E. M., Eder, H. A., and Barr, D. P., Protein-lipid relationships in human plasma. I. In normalindividuals. Am. J. Med., 1951, 11, 468.
7. Barr, D. P., Russ, E. M., and Eder, H. A., Proteinlipid relationships in human plasma. II. In athero-sclerosis and related conditions. Am. J. Med., 1951,11, 480.
8. Ahrens, E. H., Jr., Payne, M. A., Kunkel, H. G.,Eisenmenger, W. J., and Blondheim, S. H., Pri-mary biliary cirrhosis. Medicine, 1950, 29, 299.
9. Kingsley, G. R., and Schaffert, R. R., Determinationof free and total cholesterol by direct chloroformextraction. J. Biol. Chem., 1949, 180, 315.
10. Kunkel, H. G., and Tiselius, A., Electrophoresis ofproteins on filter paper. J. Gen. Physiol., 1951, 35,89.
11. Kunkel, H. G., and Slater, R. J., Zone electrophoresisin a starch medium. Proc. Soc. Exper. Biol. &Med., in press.
12. Lowry, 0. H., Rosebrough, N. J., Farr, A. L., andRandall, R. J., Protein measurement with the Folinphenol reagent. J. Biol. Chem., 1951, 193, 265.
684