
Injury patterns and crowd behaviour at mass gathering events
1
Patterns of Work-Related Injury and Common Injury Experiences of Workers in the Low-Wage Labor Market
Report to the
Commission on Health and Safety and Workers’ Compensation California Department of Industrial Relations
March 2015
Authors: Kevin Riley, PhD MPH
Doug Morier, PhD MPH UCLA Labor Occupational Safety and Health Program
EXECUTIVE SUMMARY This report summarizes findings from analysis of the 2008 Unregulated Work Survey of workers in the low-wage labor market and their experiences with work-related injuries. The survey was conducted with 4,387 adult workers employed in low-wage jobs in Los Angeles, New York, and Chicago and originally sought to estimate the prevalence of employment and labor law violations across the three cities. The current analysis focuses on data from a subset of 613 respondents who indicated they had experienced one or more serious injuries on the job in the three years prior to the survey. The data were used to identify patterns of work-related injury and common injury experiences of workers in the low-wage labor market, including barriers to workers’ compensation. We also sought to identify similarities and differences between the experiences of injured low-wage workers in Los Angeles versus the other two study cities.
Summary of Findings The original Unregulated Work Survey research team reported that about 12% of low-wage workers across the three cities had experienced a serious work-related injury in the previous three years, and only 8% of injured workers filed a workers’ compensation claim. The team also estimated that 50% of injured workers experienced a violation of workers’ compensation law in their home state. Our subsequent analysis of Unregulated Work Survey data revealed the following regarding the patterns of work-related injury and common injury experiences within this worker population:
Rates of injury were significantly higher among men, undocumented immigrants, those whose primary language was Spanish, and those working in the construction industry. In Los Angeles, injury rates were also higher among those who worked in short-term, temporary and/or day labor situations. Respondents who reported receiving health and safety (H&S) training on the job were significantly less likely to experience work-related injuries.
About 11% of respondents indicated they did not notify their employers of their injury. The most
common reasons given for not reporting were fear of losing a job, not wanting to miss work, and not believing the injury was serious enough to report.
Over half of respondents indicated their employer reacted negatively when they knew about the
injury. Common employer reactions included pressuring workers to work despite injury, firing

2
them shortly after injury, and/or threatening them with deportation or firing. A small proportion of respondents (11%) reported that employers provided them with a workers’ compensation claim form and/or told them to file.
Undocumented residents were significantly more likely to experience negative reactions from
employers following injury and were significantly less likely to seek medical attention. They were also significantly less likely to receive workers’ compensation claim forms from employers or file for workers’ compensation.
Workers who reported they received H&S training on the job were more likely to seek medical
attention, more likely to notify their employers, less likely to report negative reactions, more likely to receive workers’ compensation claim forms from employers, and more likely to file for workers’ compensation.
Finally, respondents in Los Angeles were somewhat more likely than those in New York or Chicago to indicate they had avoided notifying employers of their injury because they were afraid of losing their jobs or did not want to miss work. Los Angeles was also the only city where respondents indicated they had not notified employers because they were unaware they could receive benefits. And Los Angeles respondents had the lowest proportion of accepted workers’ compensation claims. Employer reactions toward injured workers were roughly comparable across the three cities, suggesting that differences in rates of legal violations reported by the original study team are driven more by variations in state workers’ compensation laws than by different patterns of employer behaviors.
Implications The findings from this study provide a valuable window into the injury experiences of workers in the low-wage labor market in the three largest U.S. cities. The analysis shines light on the overlapping vulnerabilities faced by low-wage workers who experience work-related injuries. The combination of economic insecurity and adverse interactions with employers contributes to low rates of reporting and denial of workers’ compensation. These factors are particularly acute for undocumented residents, for whom the workers’ compensation system remains especially inadequate. Health and safety training appears to serve as a protective mechanism within this sample, encouraging more workers to come forward with their injuries and fewer employers to react with threats or intimidation. The specific mechanisms through which training produces these outcomes are unclear; more research is needed. But the findings underscore the need for additional education of low-wage workers regarding workplace hazards and their rights on the job, including the right to compensation for work-related injuries and protections from retaliatory employer behavior.
3
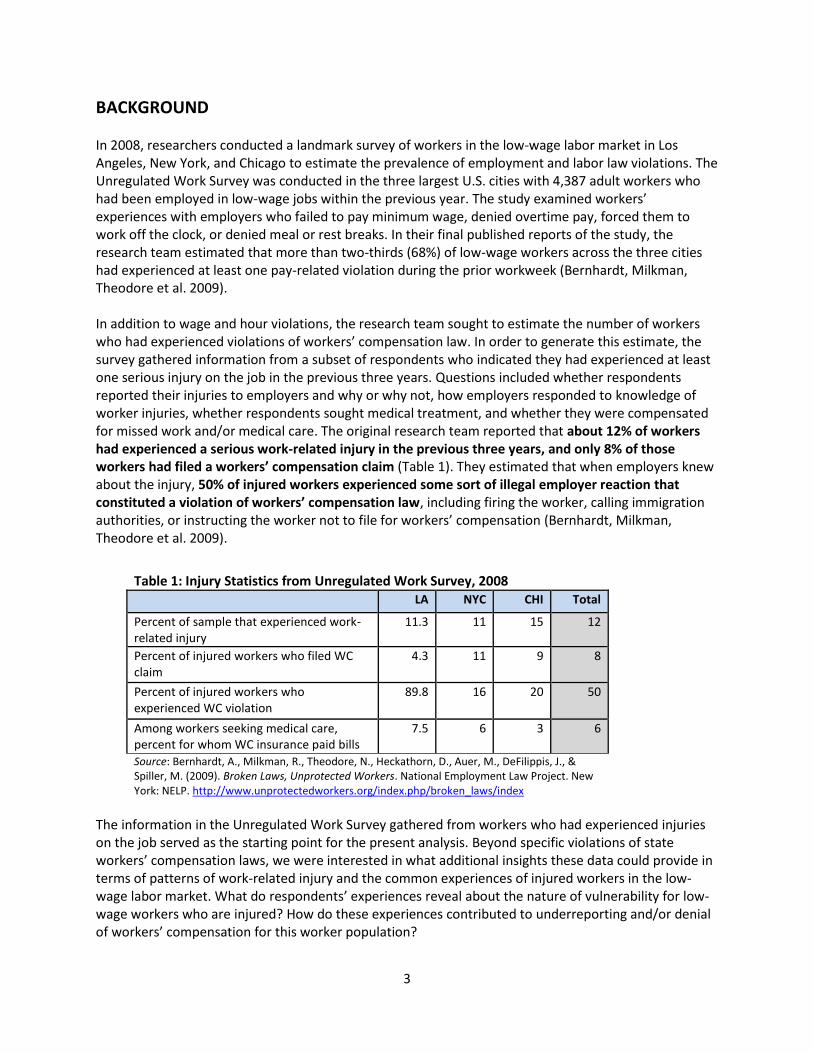
BACKGROUND In 2008, researchers conducted a landmark survey of workers in the low-wage labor market in Los Angeles, New York, and Chicago to estimate the prevalence of employment and labor law violations. The Unregulated Work Survey was conducted in the three largest U.S. cities with 4,387 adult workers who had been employed in low-wage jobs within the previous year. The study examined workers’ experiences with employers who failed to pay minimum wage, denied overtime pay, forced them to work off the clock, or denied meal or rest breaks. In their final published reports of the study, the research team estimated that more than two-thirds (68%) of low-wage workers across the three cities had experienced at least one pay-related violation during the prior workweek (Bernhardt, Milkman, Theodore et al. 2009). In addition to wage and hour violations, the research team sought to estimate the number of workers who had experienced violations of workers’ compensation law. In order to generate this estimate, the survey gathered information from a subset of respondents who indicated they had experienced at least one serious injury on the job in the previous three years. Questions included whether respondents reported their injuries to employers and why or why not, how employers responded to knowledge of worker injuries, whether respondents sought medical treatment, and whether they were compensated for missed work and/or medical care. The original research team reported that about 12% of workers had experienced a serious work-related injury in the previous three years, and only 8% of those workers had filed a workers’ compensation claim (Table 1). They estimated that when employers knew about the injury, 50% of injured workers experienced some sort of illegal employer reaction that constituted a violation of workers’ compensation law, including firing the worker, calling immigration authorities, or instructing the worker not to file for workers’ compensation (Bernhardt, Milkman, Theodore et al. 2009).
Table 1: Injury Statistics from Unregulated Work Survey, 2008 LA NYC CHI Total
Percent of sample that experienced work-related injury
11.3 11 15 12
Percent of injured workers who filed WC claim
4.3 11 9 8
Percent of injured workers who experienced WC violation
89.8 16 20 50
Among workers seeking medical care, percent for whom WC insurance paid bills
7.5 6 3 6
Source: Bernhardt, A., Milkman, R., Theodore, N., Heckathorn, D., Auer, M., DeFilippis, J., & Spiller, M. (2009). Broken Laws, Unprotected Workers. National Employment Law Project. New York: NELP. http://www.unprotectedworkers.org/index.php/broken_laws/index
The information in the Unregulated Work Survey gathered from workers who had experienced injuries on the job served as the starting point for the present analysis. Beyond specific violations of state workers’ compensation laws, we were interested in what additional insights these data could provide in terms of patterns of work-related injury and the common experiences of injured workers in the low-wage labor market. What do respondents’ experiences reveal about the nature of vulnerability for low-wage workers who are injured? How do these experiences contributed to underreporting and/or denial of workers’ compensation for this worker population?

4
Existing research on the injury experiences of low-wage workers and their attempts to access workers’ compensation has faced a number of challenges. Recruiting respondents is often difficult due to the “invisibility” of low-wage work and the widespread fear and precariousness many workers endure. The studies that exist have largely relied on small samples drawn from specific industries or worker groups (e.g., Levin & Ginsburg 1999; Brown et al. 2002; Walter, Bourgois, Margarita Loinaz & Schillinger 2002; Theodore, Valenzuela & Melendez 2006; Quandt, Grzywacz, Marin, et al. 2006; Seixas, Blecker, Camp & Neitzel 2008; Zoeckler, Lax, Gonos et al. 2014). Such studies offer useful insights, but they generally provide few opportunities to quantify the true scope of reporting problems or document commonalities across industries, geographic area, or diverse worker populations. In addition, while a number of studies have considered workers’ perceived fears in reporting injuries (e.g., Azaroff, Levenstein & Wegman 2002), few have had the chance to document the actual experiences of injured workers, their interactions with employers following injury, and their difficulties accessing appropriate care and workers’ compensation (but see Walter et al. 2002; Pransky et al. 2002; Zoeckler, Lax, Gonos et al. 2014). The 2008 Unregulated Work Survey provides a promising avenue for examining the experiences of injured low-wage workers in a broader and more systematic way. The innovative sampling of workers across three large cities and representing a variety of industries and job types can offer more generalizable lessons about the dynamics of injury underreporting and the failure of state workers’ compensation systems to reach many workers in the low-wage labor market. And the sizable portion of the sample from Los Angeles can shed insights on similarities and differences in the injury experiences of low-wage workers here as compared to other large metropolitan areas (Milkman, Gonzalez & Narro 2010).
METHODOLOGY This project focused exclusively on analysis of existing data from the 2008 Unregulated Work Survey. The data were made publicly available in January 2013, allowing for further analysis by researchers beyond the original study team. The Unregulated Work Survey was conducted with 4,387 adult workers in Los Angeles (Los Angeles County), New York City (the five boroughs), and Chicago (Cook County) who had been employed as frontline workers (i.e., not managers, professionals, or technical workers) in low-wage industries within the previous year. Low-wage industries were defined as those whose median wage for frontline workers was less than 85% of the city’s median wage. Median hourly wages for each city were identified using the Center for Economic Policy Research’s 2006 Current Population Survey; industries in each city that fell below the medians were identified using 2000 U.S. Census data.1
1 The study team had this to say regarding the timing of their data collection: “We fielded the survey at the start of the recession in 2008, but in all three cities, the recession had not yet fully set in when we were conducting our interviews. Unemployment rates—the most relevant measure in terms of labor market conditions—were just starting to edge upward in each of the three cities, and did not reach critical levels until late 2008 and early 2009, after we had completed our survey. Our assessment, therefore, is that the workplace violation rates documented in this study were not significantly influenced by the recession.” (Bernhardt, Milkman, Theodore, et al. 2009, p. 12).

5
Survey respondents were recruited using an innovative sampling strategy known as “respondent-driven sampling” (RDS), a form of chain-referral sampling that (a) can reach respondents from “hidden” populations that are often missed in standard survey approaches and (b) incorporates properties of probability sampling methods that allow one to make inferences about the population based on sample data (Heckathorn 1997; Heckathorn 2007; Salganik & Heckathorn 2008). RDS uses mathematical modeling to weight data based on respondents’ social network size—i.e., based on their probability of being captured by the survey technique—as well as other features of the network that can affect the sampling process. The use of this approach in the Unregulated Work Survey allowed the original study team to generate statistically representative prevalence estimates of various workplace violations (Bernhardt, Milkman, Theodore, et al. 2009).2 The large but concentrated low-wage labor markets in Los Angeles, New York, and Chicago provided the original study team the opportunity to survey a diverse population of low-wage workers in defined geographical areas and to capture a wide range of sectors, industries and occupations. Our analysis took advantage of the study scope and unique sampling characteristics to address the following three research questions:
1. How do rates of work-related injury vary by worker and job characteristics? 2. What are the most commonly reported experiences of workers in the low-wage labor market
who are injured on the job? How do those experiences vary by worker and job characteristics and across cities?
3. What factors support or undermine injury reporting and access to workers’ compensation among workers in the low-wage labor market?
The characteristics of the overall Unregulated Work Survey sample and population prevalence estimates based on this sample are described elsewhere (Bernhardt, Milkman, Theodore, et al. 2009; Bernhardt, Spiller & Polson 2013). Briefly, approximately 63% of the sample was Latino, 45% had less than high school education, and 39% were undocumented residents. The most common industries where respondents worked included restaurants and hotels (17%), private households (14%), apparel and textile manufacturing (13%), and retail and drug stores (10%). The median wage of respondents was $8.02 per hour (in 2008 dollars). For our analysis, the 4,387 respondents from the original survey were stratified according to whether they experienced a work-related injury in the three years prior to participation in the study. (A serious injury was defined as one requiring medical attention, regardless of whether the person actually sought medical attention.) A subset of 613 respondents indicated they had experienced one or more serious injuries on the job in the previous three years. These respondents were subsequently asked a series of additional questions, including whether they reported their injury to their employer and why or why not, how employers responded to the injury, whether they missed work and/or sought medical treatment as a result of the injury, and whether they received workers’ compensation. These data served as the basis for our analysis. We conducted all data analyses using R statistical software, Version 3.0.2. Weighted prevalence estimates of socio-demographic characteristics for the injured and uninjured strata and their corresponding 95% confidence intervals were generated using the Respondent-Driven Sampling Analysis
2 For additional details on the sampling and estimation techniques used in the original Unregulated Work Survey, see Spiller, Bernhardt, Perelshteyn & Heckathorn 2010.
6
Tool (RDSAT), Version 7.1.38. The default RDS-I weights with enhanced smoothing were used along with 15,000 bootstrap samples. A couple of important notes on the limitations of this dataset for examining questions regarding the injury experiences of workers in the low-wage labor market: The original research team did not ask any questions about the specific nature of the reported injuries, so we have few clues as to the kinds of workplace hazards respondents encountered that caused harm. Respondents in this study may have been hesitant to disclose work-related injuries or negative injury experiences to interviewers due to fears of employer retaliation or other concerns. Injuries may also be undercounted in this sample if respondents did not recognize injuries to be work related. Furthermore, reliance on self-reported information may reflect a degree of recall bias. For example, our analysis indicates that those who provided information about injuries longer ago tended to describe more severe injuries (i.e., they were more likely to miss work and/or seek medical attention). And self-reported information regarding employer behaviors and payment for missed days and/or medical care may also be shaped by one’s feelings about an employer, whether negative or positive. We have done our best to keep these considerations in mind in analyzing these survey results.
FINDINGS The original study reports for the Unregulated Work Survey included limited findings regarding the injury experiences of respondents (see Table 1). Our analysis delved further into the characteristics of these injured workers and their experiences following injury.
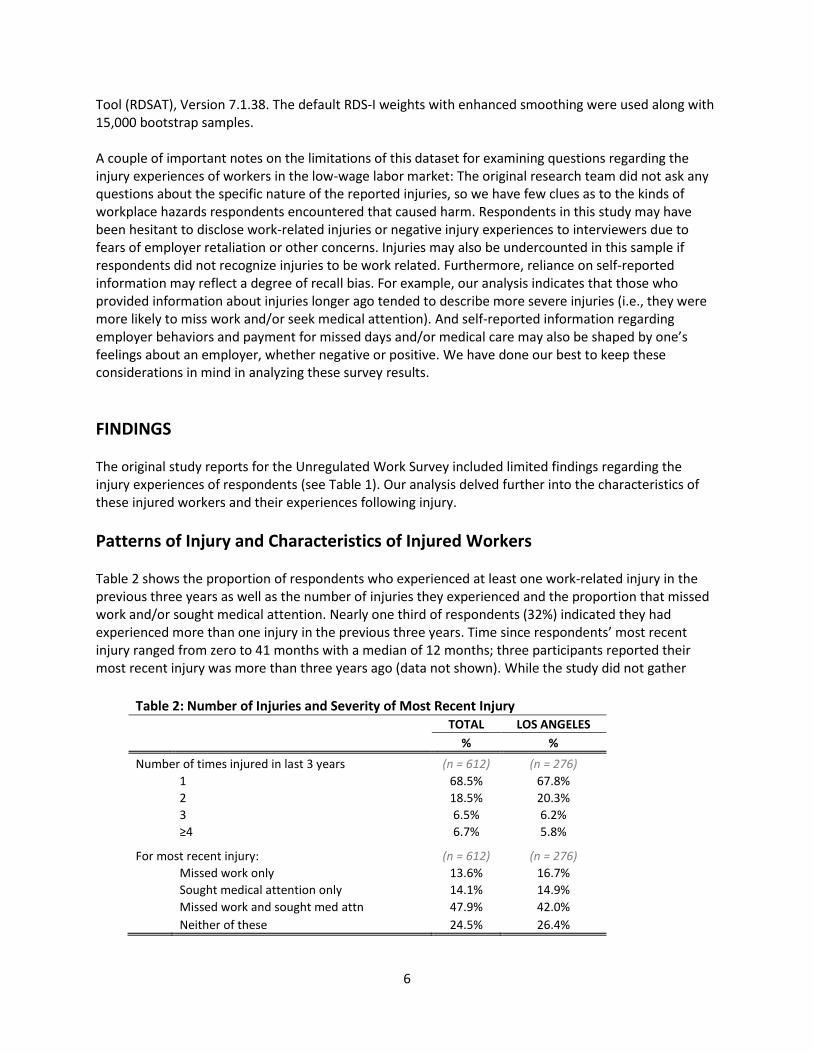
Patterns of Injury and Characteristics of Injured Workers Table 2 shows the proportion of respondents who experienced at least one work-related injury in the previous three years as well as the number of injuries they experienced and the proportion that missed work and/or sought medical attention. Nearly one third of respondents (32%) indicated they had experienced more than one injury in the previous three years. Time since respondents’ most recent injury ranged from zero to 41 months with a median of 12 months; three participants reported their most recent injury was more than three years ago (data not shown). While the study did not gather
Table 2: Number of Injuries and Severity of Most Recent Injury TOTAL LOS ANGELES
% %
Number of times injured in last 3 years (n = 612) (n = 276)
1 68.5% 67.8%
2 18.5% 20.3%
3 6.5% 6.2%
≥4 6.7% 5.8%
For most recent injury: (n = 612) (n = 276)
Missed work only 13.6% 16.7%
Sought medical attention only 14.1% 14.9%
Missed work and sought med attn 47.9% 42.0%
Neither of these 24.5% 26.4%
7
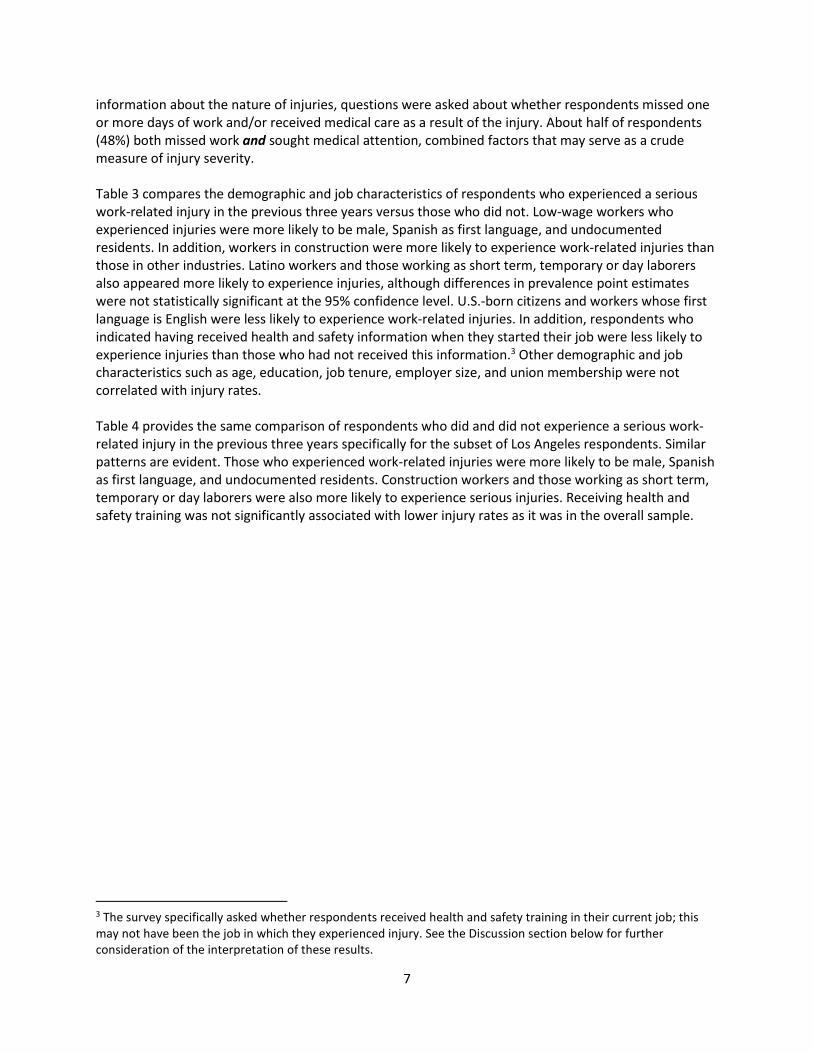
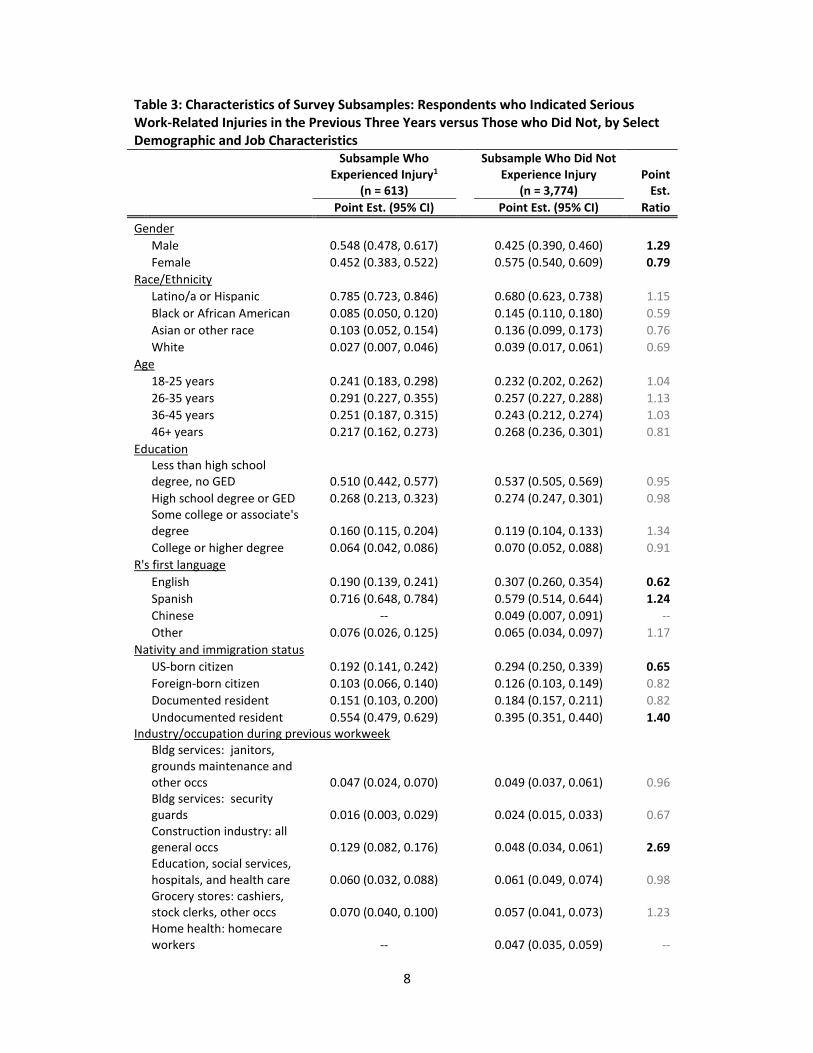
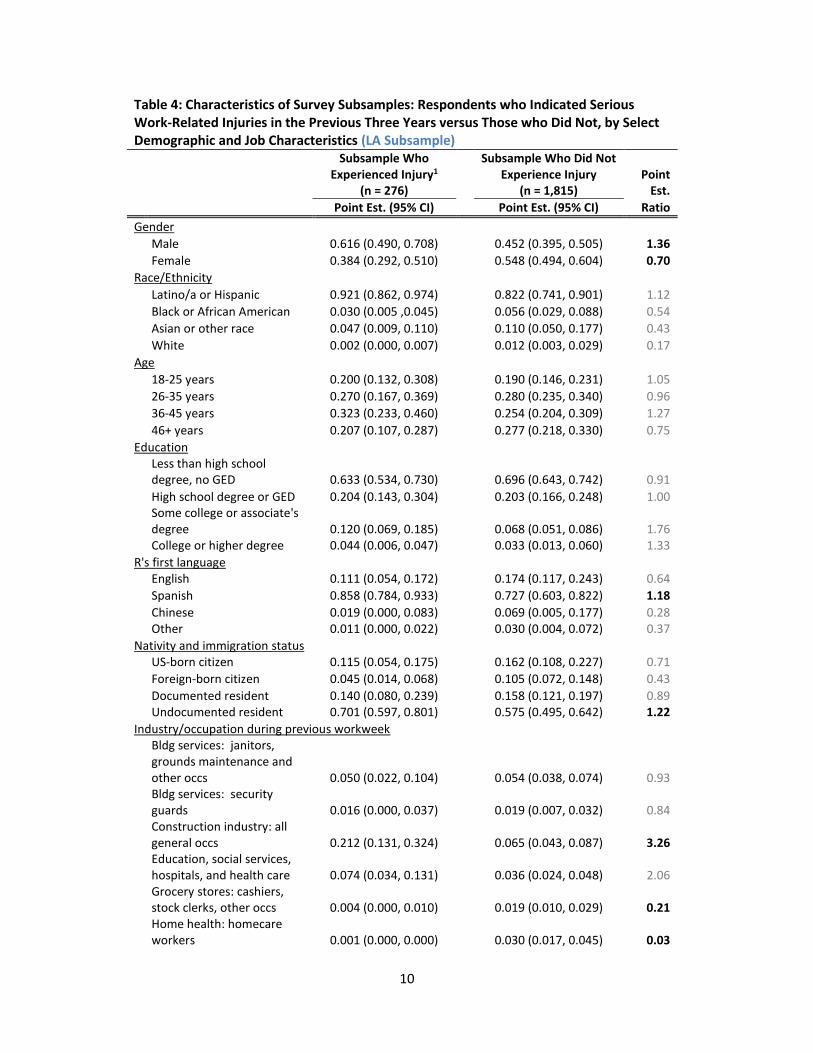
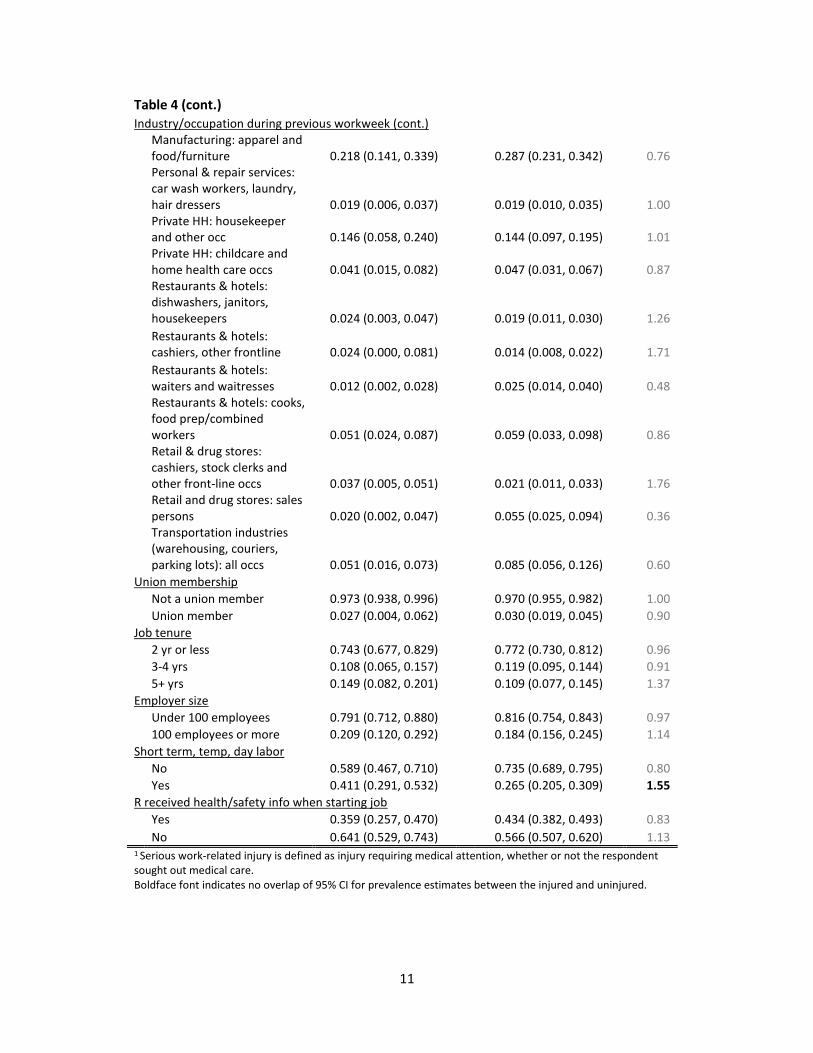
information about the nature of injuries, questions were asked about whether respondents missed one or more days of work and/or received medical care as a result of the injury. About half of respondents (48%) both missed work and sought medical attention, combined factors that may serve as a crude measure of injury severity. Table 3 compares the demographic and job characteristics of respondents who experienced a serious work-related injury in the previous three years versus those who did not. Low-wage workers who experienced injuries were more likely to be male, Spanish as first language, and undocumented residents. In addition, workers in construction were more likely to experience work-related injuries than those in other industries. Latino workers and those working as short term, temporary or day laborers also appeared more likely to experience injuries, although differences in prevalence point estimates were not statistically significant at the 95% confidence level. U.S.-born citizens and workers whose first language is English were less likely to experience work-related injuries. In addition, respondents who indicated having received health and safety information when they started their job were less likely to experience injuries than those who had not received this information.3 Other demographic and job characteristics such as age, education, job tenure, employer size, and union membership were not correlated with injury rates. Table 4 provides the same comparison of respondents who did and did not experience a serious work-related injury in the previous three years specifically for the subset of Los Angeles respondents. Similar patterns are evident. Those who experienced work-related injuries were more likely to be male, Spanish as first language, and undocumented residents. Construction workers and those working as short term, temporary or day laborers were also more likely to experience serious injuries. Receiving health and safety training was not significantly associated with lower injury rates as it was in the overall sample.
3 The survey specifically asked whether respondents received health and safety training in their current job; this may not have been the job in which they experienced injury. See the Discussion section below for further consideration of the interpretation of these results.
8
Table 3: Characteristics of Survey Subsamples: Respondents who Indicated Serious Work-Related Injuries in the Previous Three Years versus Those who Did Not, by Select Demographic and Job Characteristics
Subsample Who
Experienced Injury1 Subsample Who Did Not
Experience Injury Point (n = 613) (n = 3,774) Est.
Point Est. (95% CI) Point Est. (95% CI) Ratio
Gender
Male 0.548 (0.478, 0.617) 0.425 (0.390, 0.460) 1.29
Female 0.452 (0.383, 0.522) 0.575 (0.540, 0.609) 0.79
Race/Ethnicity
Latino/a or Hispanic 0.785 (0.723, 0.846) 0.680 (0.623, 0.738) 1.15
Black or African American 0.085 (0.050, 0.120) 0.145 (0.110, 0.180) 0.59
Asian or other race 0.103 (0.052, 0.154) 0.136 (0.099, 0.173) 0.76
White 0.027 (0.007, 0.046) 0.039 (0.017, 0.061) 0.69
Age
18-25 years 0.241 (0.183, 0.298) 0.232 (0.202, 0.262) 1.04
26-35 years 0.291 (0.227, 0.355) 0.257 (0.227, 0.288) 1.13
36-45 years 0.251 (0.187, 0.315) 0.243 (0.212, 0.274) 1.03
46+ years 0.217 (0.162, 0.273) 0.268 (0.236, 0.301) 0.81
Education
Less than high school degree, no GED 0.510 (0.442, 0.577) 0.537 (0.505, 0.569) 0.95
High school degree or GED 0.268 (0.213, 0.323) 0.274 (0.247, 0.301) 0.98
Some college or associate's degree 0.160 (0.115, 0.204) 0.119 (0.104, 0.133) 1.34
College or higher degree 0.064 (0.042, 0.086) 0.070 (0.052, 0.088) 0.91
R's first language
English 0.190 (0.139, 0.241) 0.307 (0.260, 0.354) 0.62
Spanish 0.716 (0.648, 0.784) 0.579 (0.514, 0.644) 1.24
Chinese -- 0.049 (0.007, 0.091) --
Other 0.076 (0.026, 0.125) 0.065 (0.034, 0.097) 1.17
Nativity and immigration status
US-born citizen 0.192 (0.141, 0.242) 0.294 (0.250, 0.339) 0.65
Foreign-born citizen 0.103 (0.066, 0.140) 0.126 (0.103, 0.149) 0.82
Documented resident 0.151 (0.103, 0.200) 0.184 (0.157, 0.211) 0.82
Undocumented resident 0.554 (0.479, 0.629) 0.395 (0.351, 0.440) 1.40 Industry/occupation during previous workweek
Bldg services: janitors, grounds maintenance and other occs 0.047 (0.024, 0.070) 0.049 (0.037, 0.061) 0.96
Bldg services: security guards 0.016 (0.003, 0.029) 0.024 (0.015, 0.033) 0.67
Construction industry: all general occs 0.129 (0.082, 0.176) 0.048 (0.034, 0.061) 2.69
Education, social services, hospitals, and health care 0.060 (0.032, 0.088) 0.061 (0.049, 0.074) 0.98
Grocery stores: cashiers, stock clerks, other occs 0.070 (0.040, 0.100) 0.057 (0.041, 0.073) 1.23
Home health: homecare workers -- 0.047 (0.035, 0.059) --

9
Table 3 (cont.)
Industry/occupation during previous workweek (cont.)
Manufacturing: apparel and food/furniture 0.175 (0.115, 0.234) 0.186 (0.157, 0.215) 0.94
Personal & repair services: car wash workers, laundry, hair dressers 0.041 (0.021, 0.061) 0.052 (0.040, 0.065) 0.79
Private HH: housekeeper and other occ 0.078 (0.034, 0.121) 0.094 (0.069, 0.119) 0.83
Private HH: childcare and home health care occs 0.053 (0.014, 0.093) 0.072 (0.055, 0.089) 0.74
Restaurants & hotels: dishwashers, janitors, housekeepers 0.057 (0.025, 0.090) 0.029 (0.020, 0.038) 1.97
Restaurants & hotels: cashiers, other frontline 0.032 (0.010, 0.055) 0.039 (0.029, 0.049) 0.82
Restaurants & hotels: waiters and waitresses 0.021 (0.004, 0.038) 0.034 (0.021, 0.046) 0.62
Restaurants & hotels: cooks, food prep/combined workers 0.079 (0.050, 0.107) 0.062 (0.042, 0.082) 1.27
Retail & drug stores: cashiers, stock clerks and other front-line occs 0.042 (0.015, 0.069) 0.047 (0.036, 0.058) 0.89
Retail and drug stores: sales persons 0.043 (0.021, 0.066) 0.055 (0.037, 0.073) 0.78
Transportation industries (warehousing, couriers, parking lots): all occs 0.034 (0.018, 0.049) 0.044 (0.028, 0.060) 0.77
Union membership
Not a union member 0.931 (0.898, 0.963) 0.943 (0.930, 0.957) 0.99
Union member 0.069 (0.037, 0.102) 0.057 (0.043, 0.070) 1.21
Job tenure
2 yr or less 0.693 (0.638, 0.748) 0.719 (0.692, 0.746) 0.96
3-4 yrs 0.125 (0.087, 0.162) 0.142 (0.124, 0.160) 0.88
5+ yrs 0.182 (0.137, 0.227) 0.139 (0.116, 0.162) 1.31
Employer size
Under 100 employees 0.699 (0.643, 0.755) 0.699 (0.667, 0.730) 1.00
100 employees or more 0.301 (0.245, 0.358) 0.301 (0.270, 0.333) 1.00
Short term, temp, day labor
No 0.698 (0.630, 0.766) 0.772 (0.740, 0.804) 0.90
Yes 0.302 (0.234, 0.370) 0.228 (0.197, 0.260) 1.32
R received health/safety info when starting job
Yes 0.383 (0.315, 0.450) 0.509 (0.474, 0.543) 0.75
No 0.617 (0.550, 0.684) 0.491 (0.457, 0.526) 1.26 1 Serious work-related injury is defined as injury requiring medical attention, whether or not the respondent sought out medical care. Boldface font indicates no overlap of 95% CI for prevalence estimates between the injured and uninjured.
10
Table 4: Characteristics of Survey Subsamples: Respondents who Indicated Serious Work-Related Injuries in the Previous Three Years versus Those who Did Not, by Select Demographic and Job Characteristics (LA Subsample)
Subsample Who
Experienced Injury1 Subsample Who Did Not
Experience Injury Point (n = 276) (n = 1,815) Est.
Point Est. (95% CI) Point Est. (95% CI) Ratio
Gender
Male 0.616 (0.490, 0.708) 0.452 (0.395, 0.505) 1.36
Female 0.384 (0.292, 0.510) 0.548 (0.494, 0.604) 0.70
Race/Ethnicity
Latino/a or Hispanic 0.921 (0.862, 0.974) 0.822 (0.741, 0.901) 1.12
Black or African American 0.030 (0.005 ,0.045) 0.056 (0.029, 0.088) 0.54
Asian or other race 0.047 (0.009, 0.110) 0.110 (0.050, 0.177) 0.43
White 0.002 (0.000, 0.007) 0.012 (0.003, 0.029) 0.17
Age
18-25 years 0.200 (0.132, 0.308) 0.190 (0.146, 0.231) 1.05
26-35 years 0.270 (0.167, 0.369) 0.280 (0.235, 0.340) 0.96
36-45 years 0.323 (0.233, 0.460) 0.254 (0.204, 0.309) 1.27
46+ years 0.207 (0.107, 0.287) 0.277 (0.218, 0.330) 0.75
Education
Less than high school degree, no GED 0.633 (0.534, 0.730) 0.696 (0.643, 0.742) 0.91
High school degree or GED 0.204 (0.143, 0.304) 0.203 (0.166, 0.248) 1.00
Some college or associate's degree 0.120 (0.069, 0.185) 0.068 (0.051, 0.086) 1.76
College or higher degree 0.044 (0.006, 0.047) 0.033 (0.013, 0.060) 1.33
R's first language English 0.111 (0.054, 0.172) 0.174 (0.117, 0.243) 0.64
Spanish 0.858 (0.784, 0.933) 0.727 (0.603, 0.822) 1.18
Chinese 0.019 (0.000, 0.083) 0.069 (0.005, 0.177) 0.28 Other 0.011 (0.000, 0.022) 0.030 (0.004, 0.072) 0.37
Nativity and immigration status US-born citizen 0.115 (0.054, 0.175) 0.162 (0.108, 0.227) 0.71
Foreign-born citizen 0.045 (0.014, 0.068) 0.105 (0.072, 0.148) 0.43
Documented resident 0.140 (0.080, 0.239) 0.158 (0.121, 0.197) 0.89 Undocumented resident 0.701 (0.597, 0.801) 0.575 (0.495, 0.642) 1.22
Industry/occupation during previous workweek
Bldg services: janitors, grounds maintenance and other occs 0.050 (0.022, 0.104) 0.054 (0.038, 0.074) 0.93
Bldg services: security guards 0.016 (0.000, 0.037) 0.019 (0.007, 0.032) 0.84
Construction industry: all general occs 0.212 (0.131, 0.324) 0.065 (0.043, 0.087) 3.26
Education, social services, hospitals, and health care 0.074 (0.034, 0.131) 0.036 (0.024, 0.048) 2.06
Grocery stores: cashiers, stock clerks, other occs 0.004 (0.000, 0.010) 0.019 (0.010, 0.029) 0.21
Home health: homecare workers 0.001 (0.000, 0.000) 0.030 (0.017, 0.045) 0.03
11
Table 4 (cont.)
Industry/occupation during previous workweek (cont.)
Manufacturing: apparel and food/furniture 0.218 (0.141, 0.339) 0.287 (0.231, 0.342) 0.76
Personal & repair services: car wash workers, laundry, hair dressers 0.019 (0.006, 0.037) 0.019 (0.010, 0.035) 1.00
Private HH: housekeeper and other occ 0.146 (0.058, 0.240) 0.144 (0.097, 0.195) 1.01
Private HH: childcare and home health care occs 0.041 (0.015, 0.082) 0.047 (0.031, 0.067) 0.87
Restaurants & hotels: dishwashers, janitors, housekeepers 0.024 (0.003, 0.047) 0.019 (0.011, 0.030) 1.26
Restaurants & hotels: cashiers, other frontline 0.024 (0.000, 0.081) 0.014 (0.008, 0.022) 1.71
Restaurants & hotels: waiters and waitresses 0.012 (0.002, 0.028) 0.025 (0.014, 0.040) 0.48
Restaurants & hotels: cooks, food prep/combined workers 0.051 (0.024, 0.087) 0.059 (0.033, 0.098) 0.86
Retail & drug stores: cashiers, stock clerks and other front-line occs 0.037 (0.005, 0.051) 0.021 (0.011, 0.033) 1.76
Retail and drug stores: sales persons 0.020 (0.002, 0.047) 0.055 (0.025, 0.094) 0.36
Transportation industries (warehousing, couriers, parking lots): all occs 0.051 (0.016, 0.073) 0.085 (0.056, 0.126) 0.60
Union membership
Not a union member 0.973 (0.938, 0.996) 0.970 (0.955, 0.982) 1.00
Union member 0.027 (0.004, 0.062) 0.030 (0.019, 0.045) 0.90
Job tenure
2 yr or less 0.743 (0.677, 0.829) 0.772 (0.730, 0.812) 0.96
3-4 yrs 0.108 (0.065, 0.157) 0.119 (0.095, 0.144) 0.91
5+ yrs 0.149 (0.082, 0.201) 0.109 (0.077, 0.145) 1.37
Employer size
Under 100 employees 0.791 (0.712, 0.880) 0.816 (0.754, 0.843) 0.97
100 employees or more 0.209 (0.120, 0.292) 0.184 (0.156, 0.245) 1.14
Short term, temp, day labor
No 0.589 (0.467, 0.710) 0.735 (0.689, 0.795) 0.80
Yes 0.411 (0.291, 0.532) 0.265 (0.205, 0.309) 1.55
R received health/safety info when starting job
Yes 0.359 (0.257, 0.470) 0.434 (0.382, 0.493) 0.83
No 0.641 (0.529, 0.743) 0.566 (0.507, 0.620) 1.13 1 Serious work-related injury is defined as injury requiring medical attention, whether or not the respondent sought out medical care. Boldface font indicates no overlap of 95% CI for prevalence estimates between the injured and uninjured.
12
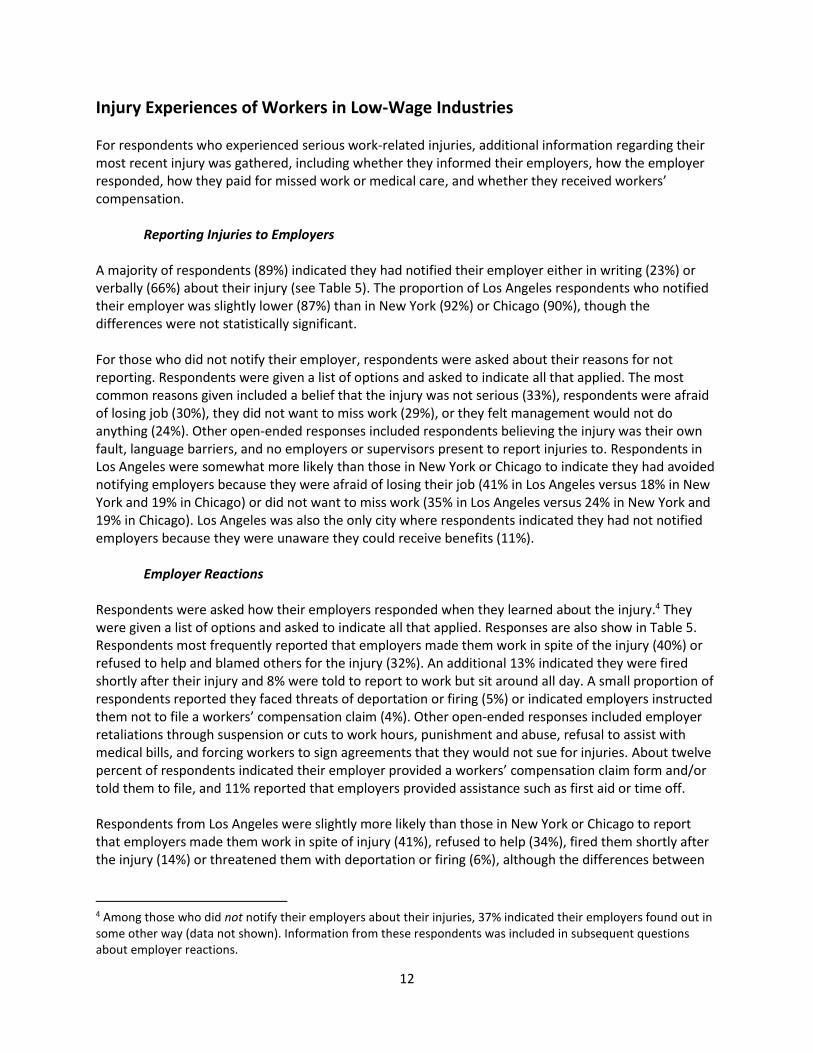
Injury Experiences of Workers in Low-Wage Industries For respondents who experienced serious work-related injuries, additional information regarding their most recent injury was gathered, including whether they informed their employers, how the employer responded, how they paid for missed work or medical care, and whether they received workers’ compensation.
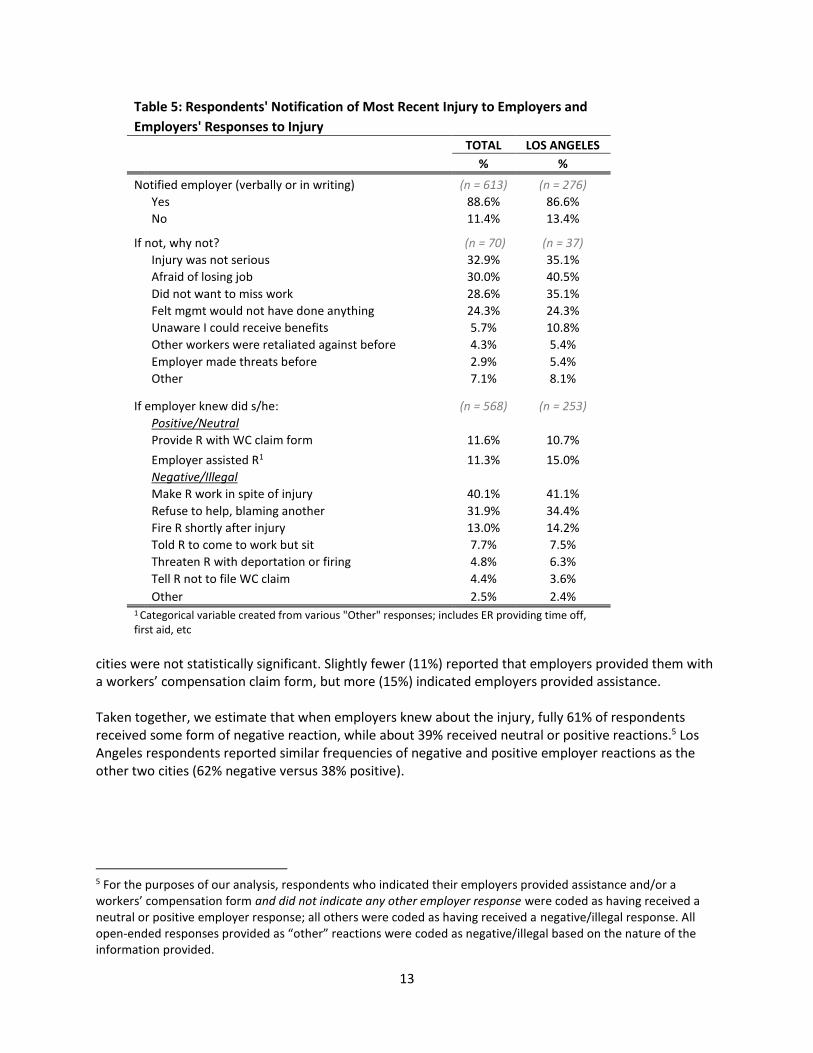
Reporting Injuries to Employers A majority of respondents (89%) indicated they had notified their employer either in writing (23%) or verbally (66%) about their injury (see Table 5). The proportion of Los Angeles respondents who notified their employer was slightly lower (87%) than in New York (92%) or Chicago (90%), though the differences were not statistically significant. For those who did not notify their employer, respondents were asked about their reasons for not reporting. Respondents were given a list of options and asked to indicate all that applied. The most common reasons given included a belief that the injury was not serious (33%), respondents were afraid of losing job (30%), they did not want to miss work (29%), or they felt management would not do anything (24%). Other open-ended responses included respondents believing the injury was their own fault, language barriers, and no employers or supervisors present to report injuries to. Respondents in Los Angeles were somewhat more likely than those in New York or Chicago to indicate they had avoided notifying employers because they were afraid of losing their job (41% in Los Angeles versus 18% in New York and 19% in Chicago) or did not want to miss work (35% in Los Angeles versus 24% in New York and 19% in Chicago). Los Angeles was also the only city where respondents indicated they had not notified employers because they were unaware they could receive benefits (11%).
Employer Reactions Respondents were asked how their employers responded when they learned about the injury.4 They were given a list of options and asked to indicate all that applied. Responses are also show in Table 5. Respondents most frequently reported that employers made them work in spite of the injury (40%) or refused to help and blamed others for the injury (32%). An additional 13% indicated they were fired shortly after their injury and 8% were told to report to work but sit around all day. A small proportion of respondents reported they faced threats of deportation or firing (5%) or indicated employers instructed them not to file a workers’ compensation claim (4%). Other open-ended responses included employer retaliations through suspension or cuts to work hours, punishment and abuse, refusal to assist with medical bills, and forcing workers to sign agreements that they would not sue for injuries. About twelve percent of respondents indicated their employer provided a workers’ compensation claim form and/or told them to file, and 11% reported that employers provided assistance such as first aid or time off.
Respondents from Los Angeles were slightly more likely than those in New York or Chicago to report that employers made them work in spite of injury (41%), refused to help (34%), fired them shortly after the injury (14%) or threatened them with deportation or firing (6%), although the differences between
4 Among those who did not notify their employers about their injuries, 37% indicated their employers found out in some other way (data not shown). Information from these respondents was included in subsequent questions about employer reactions.
13
Table 5: Respondents' Notification of Most Recent Injury to Employers and
Employers' Responses to Injury TOTAL LOS ANGELES
% %
Notified employer (verbally or in writing) (n = 613) (n = 276)
Yes 88.6% 86.6%
No 11.4% 13.4%
If not, why not? (n = 70) (n = 37)
Injury was not serious 32.9% 35.1%
Afraid of losing job 30.0% 40.5%
Did not want to miss work 28.6% 35.1%
Felt mgmt would not have done anything 24.3% 24.3%
Unaware I could receive benefits 5.7% 10.8%
Other workers were retaliated against before 4.3% 5.4%
Employer made threats before 2.9% 5.4%
Other 7.1% 8.1%
If employer knew did s/he: (n = 568) (n = 253)
Positive/Neutral
Provide R with WC claim form 11.6% 10.7%
Employer assisted R1 11.3% 15.0%
Negative/Illegal
Make R work in spite of injury 40.1% 41.1%
Refuse to help, blaming another 31.9% 34.4%
Fire R shortly after injury 13.0% 14.2%
Told R to come to work but sit 7.7% 7.5%
Threaten R with deportation or firing 4.8% 6.3%
Tell R not to file WC claim 4.4% 3.6%
Other 2.5% 2.4% 1 Categorical variable created from various "Other" responses; includes ER providing time off, first aid, etc
cities were not statistically significant. Slightly fewer (11%) reported that employers provided them with a workers’ compensation claim form, but more (15%) indicated employers provided assistance. Taken together, we estimate that when employers knew about the injury, fully 61% of respondents received some form of negative reaction, while about 39% received neutral or positive reactions.5 Los Angeles respondents reported similar frequencies of negative and positive employer reactions as the other two cities (62% negative versus 38% positive).
5 For the purposes of our analysis, respondents who indicated their employers provided assistance and/or a workers’ compensation form and did not indicate any other employer response were coded as having received a neutral or positive employer response; all others were coded as having received a negative/illegal response. All open-ended responses provided as “other” reactions were coded as negative/illegal based on the nature of the information provided.

14
Workers’ Compensation, Missed Work, and Medical Care Table 6 summarizes responses to questions related to workers’ compensation, missed work, and medical care for injuries. In total, 12% of respondents reported filing a workers’ compensation claim for their injury. Among those who filed claims, 81% of respondents indicated their claims were accepted. A greater proportion of respondents in New York filed claims (15%) than in the other two cities although the differences between cities were not statistically significant; the highest proportion of respondents with accepted claims were in New York (89%) and the lowest proportion was in Los Angeles (72%). Nearly two-thirds of injured respondents (62%) missed one or more days of work as a result of the injury and fewer than half of those respondents (40%) indicated they were paid for the workdays they missed.
Table 6: Workers’ Compensation, Missed Work, and Medical Care TOTAL LOS ANGELES
% %
Filed workers' comp claim (n = 612) (n = 276)
Yes 10.9% 9.9%
No 89.1% 90.1%
If filed WC, was claim accepted (n = 67) (n = 25)
Yes 80.6% 72.0%
No 13.4% 16.0%
Still waiting 6.0% 12.0%
Missed one or more days of work due to injury (n = 612) (n = 276)
Yes 61.8% 58.7%
No 38.4% 40.2%
If paid for missed days, who paid (n = 149) (n = 64)
Employer paid per usual 72.5% 68.8%
Employer gave cash 13.4% 21.9%
R received check from workers' comp 11.4% 12.5%
R used sick leave 10.1% 7.8%
R used temporary disability 0.7% 1.6%
Don't know 1.3% 1.6%
Other 4.0% 1.6%
Did you seek medical attention (n = 612) (n = 276)
Yes 62.3% 56.9%
No 38.6% 43.1%
If med attention sought, who paid (n = 374) (n = 157)
Employer paid med provider directly 41.7% 45.9%
R paid all or part out of pocket 29.9% 26.8%
R's health insurance paid 17.9% 12.7%
Employer gave R cash 10.2% 14.0%
WC paid all or part 7.5% 8.3%
Medicare/public aid 5.9% 7.0%
Bills unpaid 3.5% 3.8%
Other 4.3% 5.7%
Variable-specific values that do not sum to n and proportions that do not sum to 100% indicate missing observations.
15
Among those who were paid for missed work time, nearly three-quarters (73%) indicated the employer paid per usual and an additional 13% indicated employers paid them in cash. Only 11% of workers who were paid for missed work time reported receiving a check from workers’ compensation to cover their wages. Nearly two-thirds of injured respondents (62%) sought medical attention for their injury. Respondents most commonly indicated their employers paid the medical provider directly for care (42%) or they paid for all or part of the care out of pocket themselves (30%). Only 8% reported that workers’ compensation paid for all or part of the care. Other reported forms of payment included respondents’ medical insurance, Medicare or public aid, and employers who gave respondents cash.
Variations in Injury Experiences by Demographic and Job Characteristics In addition to examining injury experiences in the overall sample, we analyzed variations in injury experiences by various worker and job characteristics. We focused on seven specific experiences—missing work days, seeking medical attention, notifying employers of injury, receiving a negative/illegal reaction from employers, filing a workers’ compensation claim, and having the workers’ compensation claim accepted—and calculated crude odds ratios for worker and job characteristics that were associated with injury. We also calculated odds ratios for each city. The results are shown in Table 7. Our analysis finds that foreign-born workers, undocumented residents, and those for whom English is a foreign language were significantly less likely to seek medical attention as a result of their injuries. The same groups along with Latino respondents were significantly more likely to experience a negative reaction from employers, less likely to receive a workers’ compensation claims form from employers and/or told to file, and less likely to file a workers’ compensation claim. (There is clearly considerable overlap between these demographic characteristics; see the Discussion section below for further consideration of this overlap.) Those working in construction or as short-term, temporary and/or day laborers were also more likely to experience negative reactions from employers, although these results fell just short of statistical significance at the 95% confidence level. Workers who indicated they had received H&S training on the job were more likely to seek medical attention, more likely to notify their employer, less likely to report negative reactions from employers, more likely to receive a workers’ compensation claim form from the employer, and more likely to file for workers’ compensation. No significant variations were found among these worker and job characteristics for missed work days or for acceptance of claims submitted. Workers in Los Angeles were significantly less likely to seek medical attention, while those in New York City were significantly more likely to seek medical attention. No other significant differences in injury experiences of workers across the three cities were found in this sample.

16
Table 7: Associations (Crude Odds Ratios with 95% Wald CI) between Select Worker/Job Characteristics and Injury Experiences
Missed Work
Days
Sought Medical
Attention Notified
Employer1
Negative/ Illegal
Employer Reaction2
Received WC Form and/or Told to File Filed WC Claim WC Claim Accepted3
Exposure Category OR (95% CI) OR (95% CI) OR (95% CI) OR (95% CI) OR (95% CI) OR (95% CI) OR (95% CI)
Male 1.112 (0.799, 1.547)
0.967
(0.696, 1.345)
1.102 (0.666, 1.824)
0.837
(0.594, 1.179)
0.644 (0.385, 1.078)
0.876
(0.524, 1.463)
0.538 (0.122, 2.377)
Latino/a or Hispanic 0.992 (0.681, 1.445)
0.729
(0.497, 1.070)
1.041 (0.588, 1.843)
2.346
(1.597, 3.448)
0.498 (0.290, 0.856)
0.512
(0.299, 0.877)
0.403 (0.076, 2.125)
Foreign born 0.841 (0.571, 1.237)
0.594
(0.398, 0.887)
0.720 (0.381, 0.368)
2.753
(1.854, 4.087)
0.403 (0.236, 0.687)
0.358
(0.211, 0.607)
0.308 (0.059, 1.618)
Undocumented resident 0.825 (0.594, 1.146)
0.494
(0.354, 0.690)
0.784 (0.472, 1.302)
2.376
(1.680, 3.359)
0.148 (0.074, 0.296)
0.225
(0.122, 0.416)
0.400 (0.084, 1.903)
English as foreign language 0.858 (0.586, 1.258)
0.587
(0.395, 0.874)
0.692 (0.367, 1.305)
2.746
(1.857, 4.061)
0.422 (0.247, 0.719)
0.349
(0.206, 0.590)
0.286 (0.054, 1.502)
Construction 1.053 (0.629, 1.763)
0.640
(0.389, 1.053)
0.748 (0.364, 1.539)
1.741
(0.994, 3.049)
0.210 (0.050, 0.877)
0.206
(0.049, 0.861) NA
Short term, temp, day labor 0.846 (0.583, 1.228)
0.715
(0.494, 1.034)
0.700 (0.407, 1.204)
1.479
(0.993, 2.202)
0.623 (0.323, 1.201)
0.832
(0.453, 1.528)
0.455 (0.097, 2.134)
Rec'd H&S training 1.142 (0.820, 1.589)
2.408
(1.708, 3.395)
2.018 (1.166, 3.491)
0.312
(0.220, 0.444)
3.787 (2.142, 6.698)
3.576
(2.042, 6.262)
2.523 (0.589, 10.813)
LA vs. others 0.836 (0.602, 1.161)
0.687
(0.495, 0.953)
0.680 (0.411, 1.124)
1.119
(0.797, 1.571)
0.845 (0.502, 1.424)
0.713
(0.421, 1.205) NA
NYC vs. others 1.209 (0.847, 1.727)
1.437
(1.002, 2.060)
1.575 (0.876, 2.834)
0.915
(0.638, 1.312)
1.681 (0.995, 2.838)
1.521
(0.901, 2.567) NA
Chicago vs. others 1.022 (0.696, 1.501)
1.099
(0.747, 1.616)
1.032 (0.570, 1.868)
0.954
(0.642, 1.417)
0.616 (0.313, 1.215)
0.926
(0.503, 1.705) NA
Boldface font indicates significance at the 95% confidence level.
1 Includes notifying employer either in writing or verbally
2 Includes all employer reactions except when "Provided R with WC claim form" and/or "Employer assisted R" were only responses
3 Once WC claims were filed they were generally accepted, so some ORs are unstable due to cells with zero values
17
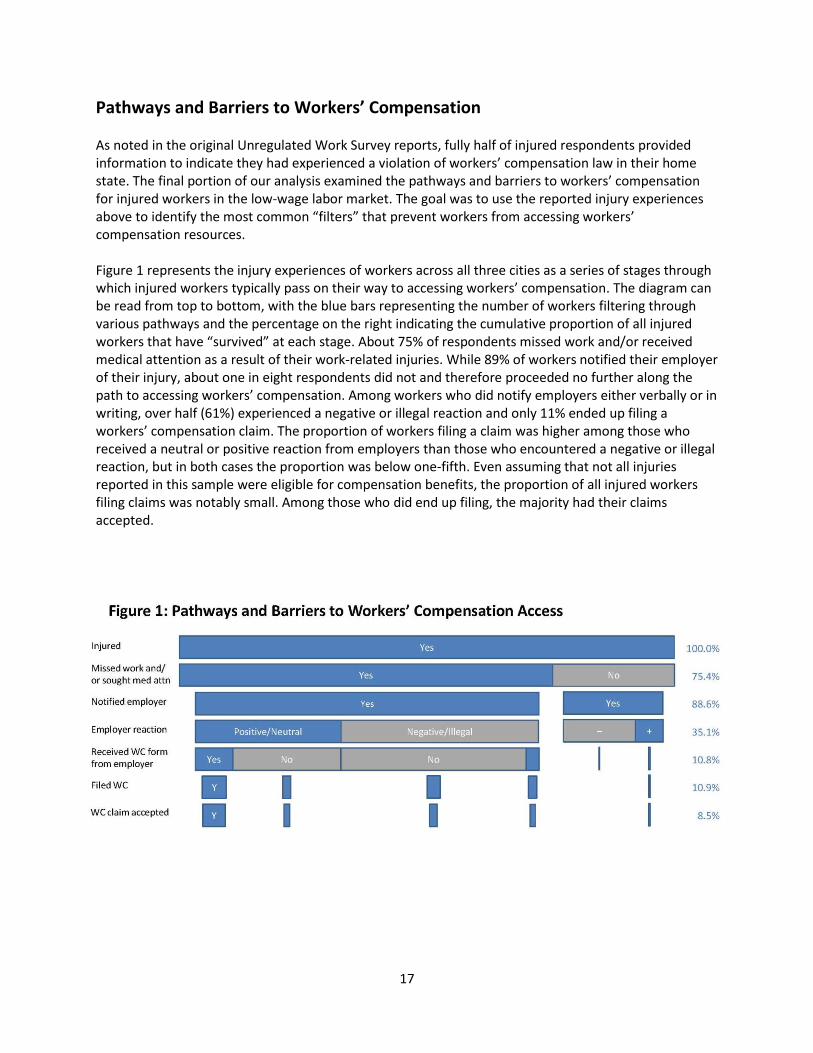
Pathways and Barriers to Workers’ Compensation As noted in the original Unregulated Work Survey reports, fully half of injured respondents provided information to indicate they had experienced a violation of workers’ compensation law in their home state. The final portion of our analysis examined the pathways and barriers to workers’ compensation for injured workers in the low-wage labor market. The goal was to use the reported injury experiences above to identify the most common “filters” that prevent workers from accessing workers’ compensation resources. Figure 1 represents the injury experiences of workers across all three cities as a series of stages through which injured workers typically pass on their way to accessing workers’ compensation. The diagram can be read from top to bottom, with the blue bars representing the number of workers filtering through various pathways and the percentage on the right indicating the cumulative proportion of all injured workers that have “survived” at each stage. About 75% of respondents missed work and/or received medical attention as a result of their work-related injuries. While 89% of workers notified their employer of their injury, about one in eight respondents did not and therefore proceeded no further along the path to accessing workers’ compensation. Among workers who did notify employers either verbally or in writing, over half (61%) experienced a negative or illegal reaction and only 11% ended up filing a workers’ compensation claim. The proportion of workers filing a claim was higher among those who received a neutral or positive reaction from employers than those who encountered a negative or illegal reaction, but in both cases the proportion was below one-fifth. Even assuming that not all injuries reported in this sample were eligible for compensation benefits, the proportion of all injured workers filing claims was notably small. Among those who did end up filing, the majority had their claims accepted.
18
Two additional issues to note in this diagram: First, even among workers who did not miss work or seek medical attention as a result of their injuries, a handful of respondents did proceed to file a workers’ compensation claim and find their claims were accepted (represented by the narrow blue bars on the bottom right side of the diagram). This suggests some workers sustained compensable injuries without taking time away from work, whether due to the nature of the injury or economic need. Second, a small number of injured workers (about 4%) successfully filed workers’ compensation claims without receiving paperwork from their employers—and in some cases after having received a negative reaction (represented by the blue bars at the bottom center of the diagram). This indicates alternative pathways to workers’ compensation resources among workers in the low-wage labor market even in the absence of employer cooperation.
DISCUSSION This analysis of data from the 2008 Unregulated Work Survey provides valuable insights into the patterns of injury among workers in low-wage industries across three U.S. cities, the common experiences of those who are injured, and the barriers workers encounter in accessing workers’ compensation. The findings highlight the considerable insecurities and vulnerabilities faced by injured workers in the low-wage labor market—in particular Latino immigrant workers—and shed light on specific mechanisms through which underreporting and denial of workers’ compensation occur within this workforce sector. They also reveal notable differences in the experiences of low-wage workers in Los Angeles as compared to the other study cities. Each of these issues is examined in more detail below.
Work-Related Injury and Injury Experiences Our analysis found that prevalence rates for work-related injuries were significantly higher for Latinos, undocumented residents, and speakers of Spanish as a first language, indicating clear vulnerabilities for Latino immigrants in low-wage industries across the three study cities. California, New York, and Illinois are among the states with the highest concentration of undocumented workers (Passel & Cohn 2009). These patterns of injury align with other research indicating proportionally higher injury and fatality rates among immigrant and Latino workers (e.g., Cierpich, Styles, Harrison et al. 2008). We also found higher injury rates in this survey were associated with employment in construction and loosely correlated with short-term, temporary and/or day labor work arrangements. These findings are consistent with recent studies showing health and safety risks for the blue-collar temporary workforce and other forms of precarious employment (Kalleberg 2009; Smith, Silverstein, Bonauto et al. 2010; Underhill & Quinlan 2011; Landsbergis, Grzywacz & LaMontagne 2012). Our analysis also indicates that respondents who received H&S training on the job were significantly less likely to experience serious injuries. This finding is more difficult to interpret given ambiguities in the survey data regarding the timing of training vis-à-vis reported injuries. The survey questionnaire design does not provide sufficient detail to determine what proportion of respondents received training in the same job in which they were injured. But 35% of all respondents indicated they have been in the same job for three or more years—and 60% indicated they have been in the same industry for three or more years—suggesting that at least some respondents would have received worksite- or industry-specific training before injuries occurred.
19
Findings on the experiences of injured workers reveal a combination of economic insecurity and employer pressures that render workers in low-wage industries particularly vulnerable. Although a majority of respondents indicated reporting their injuries to employers, fears of job loss or missed work days were among the most commonly reported reasons for not reporting (see Table 5), suggesting that basic economic concerns frequently took precedence over physical impairment or medical need. The survey results also reveal a large proportion of employers responding to workers’ injuries in negative or retaliatory ways, including making respondents work in spite of injuries, refusing to help, firing workers shortly after injury, threatening workers with job loss or deportation, or instructing workers not to file workers’ compensation (Table 5). Such employer responses to injury seem to play a strong role in limiting workers’ access to workers’ compensation; while nearly one-half of respondents indicated they missed one or more workdays and sought medical attention as a result of their injuries (Table 2), only 11% filed workers’ compensation claims (Table 6).
Pathways and Barriers to Workers’ Compensation Our analysis examined the various pathways low-wage workers follow in seeking workers’ compensation and the most common barriers they encounter. Our findings indicate that negative employer reactions play the greatest role in limiting access to workers’ compensation for low-wage workers. Notifying an employer of injury is clearly a prerequisite for workers’ compensation access in this survey; no respondents proceeded along the pathway to workers’ compensation without notifying their employer of their injury in some way. The majority of injured workers in this sample did notify their employer either verbally or in writing, and among those who did succeed in filing the majority (81%) reported that their claims were accepted. However, employer reactions ranging from active threats to more subtle forms of intimidation appear to have blocked most injured workers from filing in the first place. Even assuming that not all injuries reported in this survey would have been eligible for compensation under state law, the fact that some successful claims were filed without employer cooperation suggests there are a substantial number of legitimate compensable cases that are not being reported. About 4% of respondents indicated they were able to file a workers’ compensation claim on their own despite not receiving the appropriate forms from employers—and in some cases after having encountered negative employer reactions. This indicates that a small number of low-wage workers are securing compensation outside of the typical channels of access. These pathways are worth examining in greater detail through future research to better understand how these workers navigate the workers’ compensation system, whether they rely on resources such as worker centers or medical providers, and what role these organizations could play in supporting greater access to workers’ compensation for other workers in discouraging or hostile work environments.
Vulnerability of Immigrant Workers While the Unregulated Work Survey reveals insecurities faced by low-wage workers of various backgrounds and in a variety of industry sectors who experience injuries on the job, these vulnerabilities are particularly heightened for immigrant workers, particularly those who are undocumented. In addition to experiencing injuries at higher rates, these workers are less likely to seek medical attention, more likely to experience negative reactions from employers, and less likely to file workers’ compensation claims (Table 6). Interestingly, no respondents reported fear of deportation as a reason for failing to report injuries to employers, although responses to subsequent questions indicate that
20
some injured workers did receive deportation threats (Table 5), indicating the ways that vulnerabilities attending work-related injuries overlap with other vulnerabilities such as those associated with immigration status. These findings are consistent with other research demonstrating the interpersonal challenges immigrant workers encounter which combine with other legal and political factors to form formidable barriers to workers’ compensation (Smith 2012).
The Experiences of Low-Wage Workers in Los Angeles The Unregulated Work Survey provides an opportunity to compare the injury experiences of low-wage workers in Los Angeles with those in New York and Chicago. As the original study reports, low-wage workers in Los Angeles experienced injuries at a similar rate as workers in New York, although both cities had lower rates than Chicago (Table 1). Our analysis indicates similar demographic patterns of injury between low-wage workers in Los Angeles versus the other cities. The original Unregulated Work Survey research team estimated significantly higher violations of workers’ compensation law in Los Angeles compared with New York and Chicago (Milkman, Gonzalez & Narro 2010). Our analysis finds that these wide variations in violation rates mask similarities in injury experiences across the three cities. Employer reactions to workers’ injuries in Los Angeles were generally comparable to those of employers in other cities. Los Angeles respondents reported slightly more often that their employers had assisted with first aid or time off, but the frequency of reported negative or retributive reactions revealed few noteworthy differences. The findings suggest that the higher rate of workers’ compensation violations in Los Angeles reported by the original research team is likely driven less by different patterns of employer behaviors across the study cities and more by variations in state workers’ compensation laws that assign different legal statuses to employer behaviors. Specifically, California law stipulates that employers who fail to provide information about workers’ compensation to injured employees are in violation, whereas in New York State and Illinois violations occur only when employers explicitly discourage employees from submitting claims. This legal distinction seems to drive variations in violation rates, whereas interpersonal dynamics with employers rendering injured workers vulnerable vary little across the three cities. Despite these similarities in employer behaviors, low-wage workers in Los Angeles were slightly less likely than those in the other cities to report their work-related injuries to employers (Table 5) and they filed workers’ compensation claims at significantly lower rates than those in the other two cities (Table 1). These workers were more likely than others to express concerns about missing work or losing their jobs as result of reporting. They were also the only respondents to indicate they were unaware they could receive workers’ compensation benefits for their injuries. The findings may indicate stronger concerns about economic security among workers in Los Angeles and point to a heightened level of vulnerability that renders them less likely than their counterparts in other major U.S. cities to access workers’ compensation resources. Targeted education efforts for both workers and employers in the low-wage labor market in Los Angeles—and strategic enforcement efforts in these sectors—could address some of these apparent disparities in workers’ compensation access and overall insecurity for these workers.
21
CONCLUSION The findings from this research project provide a valuable window into the injury experiences of workers in the low-wage labor market in three large U.S. cities. The analysis shines light on the overlapping vulnerabilities faced by low-wage workers who experience work-related injuries. The combination of economic insecurity and adverse interactions with employers contribute to low rates of reporting and limited access to workers’ compensation. These factors are particularly acute for undocumented residents, who are less likely to seek support for their injuries and more likely to experience negative employer reactions when they do come forward. The results of this analysis reveal the extent to which the workers’ compensation system remains especially out of reach for immigrant workers, who constitute a large proportion of workers in the low-wage labor market across the three study cities. The experiences of injured workers in this study are connected to broader deteriorations of labor standards in the low-wage labor market (Bernhardt, Boushey, Dresser & Tilly 2008; Schulman 2011). Workers in these sectors face widespread precariousness and enjoy few protections against adverse working conditions. In particular, our analysis indicates that workers’ compensation programs are not functioning as intended to provide care and support for low-wage workers who are injured on the job. As a result, work-related injuries and illnesses are often undercounted in current surveillance systems, and a large proportion of the medical and indirect costs of work-related injuries and diseases are borne by society at large (Azaroff et al. 2002; Leigh, Marcin & Miller 2004; Leigh 2012). Finally, it is worth noting that health and safety training appears to serve as a protective mechanism within this survey sample, encouraging more workers to come forward with their injuries and fewer employers to react with threats or discouragement. The specific mechanisms through which training produces these outcomes is unclear. Additional research would be valuable for understanding how training contributes to lower rates of injury for low-wage workers, many of whom work in small businesses or in settings where H&S resources are limited. Research could also indicate how training contributes to fewer adverse interactions with employers and greater access to medical care and workers’ compensation resources. But the findings underscore the need for more education of low-wage workers around workplace hazards and their rights on the job, including the right to compensation for work-related injuries and protections from employer threats or retaliation.

22
REFERENCES Azaroff, L.S., Levenstein, C., & Wegman, D.H. (2002). Occupational injury and illness surveillance: conceptual filters explain underreporting. American Journal of Public Health, 92(9), 1421-1429. Bernhardt, A., Boushey, H., Dresser, L., & Tilly, C. (2008). The Gloves-Off Economy: Workplace Standards at the Bottom of America’s Labor Market. Labor and Employment Relations Series, Champaign, IL. Bernhardt, A., Milkman, R., Theodore, N., Heckathorn, D., Auer, M., DeFilippis, J., & Spiller, M. (2009). Broken Laws, Unprotected Workers. National Employment Law Project. New York: NELP. http://www.unprotectedworkers.org/index.php/broken_laws/index Bernhardt, A., Spiller, M. W., & Polson, D. (2013). All work and no pay: Violations of employment and labor laws in Chicago, Los Angeles and New York City. Social Forces, 91(3), 725-746. Brown, M.P., Domenzain, A., & Villoria-Siegert, N. (2002). Voices from the margins: Immigrant workers' perceptions of health and safety in the workplace. Los Angeles: UCLA Labor Occupational Safety and Health Program. Cierpich, H., Styles, L., Harrison, R., et al. (2008). Work-related injury deaths among Hispanics, United States, 1992-2006. Journal of the American Medical Association, 300(21), 2479-2480. Heckathorn, D. (1997). Respondent-Driven Sampling: A New Approach to the Study of Hidden Populations, Social Problems 44(2):174-199. Heckathorn, D. (2007). Extensions of Respondent-Driven Sampling: Analyzing Continuous Variables and Controlling for Differential Recruitment, Sociological Methodology 37(1):151-207. Kalleberg, A. L. (2009). Precarious work, insecure workers: Employment relations in transition. American Sociological Review, 74(1), 1-22. Landsbergis, P. A., Grzywacz, J. G., & LaMontagne, A. D. (2012). Work organization, job insecurity, and occupational health disparities. American Journal of Industrial Medicine 57(5): 495-515. Leigh, J. (2012). Numbers and Costs of Occupational Injury and Illness in Low-Wage Occupations. Washington, DC: Public Welfare Foundation. http://defendingscience.org/sites/default/files/Leigh_Low-wage_Workforce.pdf Leigh, J. P., Marcin, J. P., & Miller, T. R. (2004). An estimate of the US Government's undercount of nonfatal occupational injuries. Journal of Occupational and Environmental Medicine, 46(1), 10-18. Levin L, Ginsburg R. (1999). Sweatshops in Chicago: A Survey on Working Conditions in Low-Income and Immigrant Communities. Chicago, Ill: Center for Labor and Community Research. Milkman, R., Gonzalez, A.L., & Narro, V. (2010). Wage Theft and Workplace Violations in Los Angeles: The Failure of Employment and Labor Law for Low-Wage Workers. Los Angeles: UCLA Institute for Research on Labor and Employment.

23
Passel, J. & Cohn D. (2009). A Portrait of Unauthorized Immigrants in the United States. Washington, DC: Pew Research Center. http://www.pewhispanic.org/2009/04/14/a-portrait-of-unauthorized-immigrants-in-the-united-states/ Pransky, G., Moshenberg, D., Benjamin, K., Portillo, S., Thackrey, J. L., & Hill‐Fotouhi, C. (2002). Occupational risks and injuries in non‐agricultural immigrant Latino workers. American Journal of Industrial Medicine, 42(2), 117-123. Quandt, S. A., Grzywacz, J. G., Marin, A., Carrillo, L., Coates, M. L., Burke, B., & Arcury, T. A. (2006). Illnesses and injuries reported by Latino poultry workers in western North Carolina. American Journal of Industrial Medicine, 49(5), 343-351. Salganik, M. J. & Heckathorn, D. (2004). Sampling and Estimation in Hidden Populations Using Respondent-Driven Sampling. Sociological Methodology 34:193-239. Seixas, N. S., Blecker, H., Camp, J., & Neitzel, R. (2008). Occupational health and safety experience of day laborers in Seattle, WA. American Journal of Industrial Medicine, 51(6), 399-406. Shulman, B. (2011). The betrayal of work: How low-wage jobs fail 30 million Americans and their families. The New Press. Rebecca Smith, J. D. (2012). Immigrant workers and worker's compensation: The need for reform. American Journal of Industrial Medicine, 55(6), 537-544. Smith, C. K., Silverstein, B. A., Bonauto, D. K., Adams, D., & Fan, Z. J. (2010). Temporary workers in Washington state. American Journal of Industrial Medicine, 53(2), 135-145. Spiller, M., Bernhardt, A., Perelshteyn, J., & Heckathorn, D. (2010). Sampling, Fielding, and Estimation in the 2008 Unregulated Work Survey. Technical Report, Center for the Study of Economy and Society, Cornell University. Available at http://www.economyandsociety.org/publications/wp62_SpillerHeckathornetal_Sampling.pdf. Theodore, N., Valenzuela, A., & Melendez, E. (2006). La Esquina (the corner): Day Laborers on the Margins of New York’s Formal Economy. Working USA , 9:407–423. Underhill, E., & Quinlan, M. (2011). How precarious employment affects health and safety at work: the case of temporary agency workers. Relations industrielles/Industrial Relations, 397-421. Walter, N., Bourgois, P., Margarita Loinaz, H., & Schillinger, D. (2002). Social context of work injury among undocumented day laborers in San Francisco. Journal of General Internal Medicine, 17(3), 221-229. Zoeckler, J., Lax, M., Gonos, G., Mangino, M.E., Hart, G., & Goodness, D. (2014). Low-Wage Work in Syracuse: Worker Health in the New Economy. Syracuse, NY: Occupational Health Clinical Center.


