
Patterns of recorded offending behaviour amongst … 6, September 2016 Patterns of recorded...
12
Number 6, September 2016 Patterns of recorded offending behaviour amongst young Victorian offenders Paul Sutherland and Melanie Millsteed Previous research has identified that groups of young offenders follow diverse offending trajectories over their early offending careers. This paper uses a statistical technique, the semi-parametric group-based method, to identify the latent offending trajectories of a cohort of Victorian offenders born over a two year period between April 1996 and March 1998, across the first eight years of their offending as recorded by Victoria Police. The analysis identified four trajectory groups: ‘low’, ‘adolescent limited’, ‘late developing’ and ‘high’, with the vast majority of offenders falling into the low group. Risk factors for inclusion in one of the three higher rate trajectory groups included being male, identifying as Aboriginal or Torres Strait Islander, and living in one of the most socio-economically disadvantaged areas at the commencement of their offending record. Additional research is required to identify whether there are particular life events or characteristics that trigger escalation or desistance from offending across the groups identified. Keywords: trajectories, life-course criminology, youth offending, offender characteristics, crime types Introduction The ‘age-crime curve’, whereby criminal behaviour commences in late childhood or early adolescence, increases throughout adolescence and peaks in late adolescence or early adulthood, before declining, is a well-established phenomenon in criminology (Sweeten, Piquero & Steinberg, 2013). Early theorists hypothesised that the age-crime curve is invariable, that is, that it is universal and does not differ across individuals or groups of individuals (Hirschi & Gottfredson, 1983, Farrington, 1986). At an aggregate, population level at least, there is significant empirical evidence to suggest that the age crime-curve exists (Jennings and Reingle, 2012). However, others have suggested that in fact, distinct groups of offenders can be identified based on the different patterns of offending over the course of their lives (Moffitt, 1993; Patterson, 1993; Piquero, 2008). Moffitt’s (1993) enduring developmental taxonomy, for example, posits two groups of offenders who have different trajectories, characteristics and developmental histories. The ‘life-course persistent’ group consists of a very small number of offenders whose neuro-psychological issues interact with ineffective parenting and other adversities. This in turn contributes to their early commencement of and persistent participation in, all kinds of criminal and violent behaviour (Moffitt, 1993; Piquero, 2008). On the other hand, the ‘adolescent limited’ group consists of a larger group of individuals, whose offending is largely considered to be a result of a maturity-gap, which encourages them to imitate anti-social behaviour during adolescence. The majority of these adolescent limited offenders are not hypothesised to have experienced adverse childhoods. This group is thought to desist from crime by the time they reach adulthood as part of a typical maturation process (Moffitt, 1993; Piquero, 2008). With the advent of new statistical techniques, researchers have been able to show that sub-populations of offenders do indeed follow markedly different offending trajectories. Using offending data from either administrative or self- report longitudinal sources, the semi-parametric group-based method (SPGM) 1 has been used to identify the number of groups within a population that follow distinct, latent trajectories of offending frequency over the life course. 1 First developed by Nagin and Land (1993).
Transcript of Patterns of recorded offending behaviour amongst … 6, September 2016 Patterns of recorded...
Number 6, September 2016
Patterns of recorded offending behaviour amongst young Victorian offenders Paul Sutherland and Melanie Millsteed
Previous research has identified that groups of young offenders follow diverse offending trajectories over their early offending careers. This paper uses a statistical technique, the semi-parametric group-based method, to identify the latent offending trajectories of a cohort of Victorian offenders born over a two year period between April 1996 and March 1998, across the first eight years of their offending as recorded by Victoria Police. The analysis identified four trajectory groups: ‘low’, ‘adolescent limited’, ‘late developing’ and ‘high’, with the vast majority of offenders falling into the low group. Risk factors for inclusion in one of the three higher rate trajectory groups included being male, identifying as Aboriginal or Torres Strait Islander, and living in one of the most socio-economically disadvantaged areas at the commencement of their offending record. Additional research is required to identify whether there are particular life events or characteristics that trigger escalation or desistance from offending across the groups identified. Keywords: trajectories, life-course criminology, youth offending, offender characteristics, crime types
Introduction The ‘age-crime curve’, whereby criminal behaviour commences in late childhood or early adolescence, increases throughout adolescence and peaks in late adolescence or early adulthood, before declining, is a well-established phenomenon in criminology (Sweeten, Piquero & Steinberg, 2013). Early theorists hypothesised that the age-crime curve is invariable, that is, that it is universal and does not differ across individuals or groups of individuals (Hirschi & Gottfredson, 1983, Farrington, 1986). At an aggregate, population level at least, there is significant empirical evidence to suggest that the age crime-curve exists (Jennings and Reingle, 2012).
However, others have suggested that in fact, distinct groups of offenders can be identified based on the different patterns of offending over the course of their lives (Moffitt, 1993; Patterson, 1993; Piquero, 2008). Moffitt’s (1993) enduring developmental taxonomy, for example, posits two groups of offenders who have different trajectories, characteristics and developmental histories. The ‘life-course persistent’ group consists of a very small number of offenders whose neuro-psychological issues interact with ineffective parenting and other adversities. This in turn contributes to their early commencement of and persistent participation in, all kinds of criminal and violent behaviour (Moffitt, 1993; Piquero, 2008). On the other hand, the ‘adolescent limited’ group consists of a larger group of individuals, whose offending is largely considered to be a result of a maturity-gap, which encourages them to imitate anti-social behaviour during adolescence. The majority of these adolescent limited offenders are not hypothesised to have experienced adverse childhoods. This group is thought to desist from crime by the time they reach adulthood as part of a typical maturation process (Moffitt, 1993; Piquero, 2008).
With the advent of new statistical techniques, researchers have been able to show that sub-populations of offenders do indeed follow markedly different offending trajectories. Using offending data from either administrative or self-report longitudinal sources, the semi-parametric group-based method (SPGM)1 has been used to identify the number of groups within a population that follow distinct, latent trajectories of offending frequency over the life course.
1 First developed by Nagin and Land (1993).

2
A large number of studies have now been conducted using SPGM. In 2008, Piquero identified and reviewed 80 studies that had been conducted using this method to explore criminal activity over the life course, and in 2012, Jennings and Reingle identified 105 studies that had used these methods to examine trajectories of violence, aggression and delinquency. In summarising his review, Piquero (2008) noted that:
the number and shape of trajectories found was relatively consistent across studies. studies identified three and five groups on average, with slightly more groups identified in studies that use
self-report data rather than administrative data. in general, there tends to be a low-rate group, a high-rate group, a moderate but declining group, and a late
onset group. consistent with Moffitt’s (1993) developmental taxonomy, studies reveal an adolescent peaked pattern of
offending and a chronic pattern of offending. Studies also routinely identified a ‘late-onset chronic’ group that was not accounted for by extant criminological theory.
some studies have identified groups whose offending peaks at different ages (e.g., in early or middle adulthood instead of during adolescence), and sometimes these offending peaks differ across crime types (Sampson & Laub, 2003).
Jennings and Reingle’s (2012) review confirmed these findings, noting that for the studies they assessed, models generally contained three or four groups, and that most identified groups consistent with Moffitt’s (1993) taxonomy. Their review also found that where there was variation in the number of groups identified, this was often associated with the methodological aspects of the studies, including the population studied, the nature of the longitudinal data used to identify groups (i.e., self-report data versus administrative data), which developmental phase is captured by the data, length of observation and geographical context.
In addition to identifying offending trajectory groups, studies in this area have also focussed on identifying between-group differences in the characteristics and life-circumstances of group members in an attempt to identify risk factors for particular patterns of offending behaviour (Blokland & Nieuwbeerta, 2005; Ferrante, 2013; Livingston, 2008; Marshall, 2006). Focussing specifically on five Australian studies published to date which used SPGM (Allard et al., 2015; Broidy et al., 2015; Ferrante, 2013; Livingston et al., 2008; Marshall, 2006), the relationships between the offender groups and factors such as gender, age of onset of offending, Indigenous status, level of socio-economic disadvantage, residential location, and the criminal justice action taken in response to an individual’s first offence have all been analysed (although not in a Victorian context).
Across these Australian-based studies, gender and Indigenous status have consistently been found to be correlated with trajectory group assignment. Specifically, male offenders and Indigenous offenders are more likely to be statistically assigned to chronic offender groups than females and non-Indigenous offenders (Broidy et al., 2015). In addition, Marshall’s (2006) study using South Australian police apprehension data to examine the first ten years of offending for a 1984 birth cohort found that age of onset and the overall number and type of apprehension events differed between groups. Livingston et al. (2008) identified three trajectory groups for a 1983/84 birth cohort of offenders in Queensland, and found that socioeconomic disadvantage is related to group assignment, but remoteness of residence is not related. The relationship between group assignment and disadvantage was replicated for a 1990 Queensland cohort of offenders by Allard et al. (2015), who identified that their adult onset offenders group experienced significantly lower levels of disadvantage than all other groups. On the other hand, the early onset (chronic) group experienced the highest levels of disadvantage. Ferrante (2013) studied a large cohort of Western Australian Offenders who were born between 1977 and 1995, and developed separate group-based models for males, females, Indigenous and non-Indigenous offenders. She found that early-onset of offending was a
3
predictor for assignment to a higher rate offending group for both males and females, along with Indigenous status and more serious offending (evidenced through early violence and/or drug use). Interestingly, she also found that contrary to expectations, being diverted from the criminal justice system early in one’s criminal career increased the likelihood of belonging to a higher frequency offending trajectory, although this was only a significant risk factor for male offenders.
The present study
To our knowledge, analysis of young offenders’ early offending trajectories using SPGM has not been conducted in Victoria, and is the first step in identifying associated risk and protective factors in a local context. This is particularly pertinent because, despite recent Crime Statistics Agency (CSA) research showing that both the number of young Victorian offenders and the total volume of offences recorded for them has dropped over the past decade, there has been a slight increase in the number of young offenders recorded for high frequencies of incidents (Millsteed & Sutherland, 2016). Understanding the characteristics of offenders who follow diverse offending trajectories can, in turn, aid understanding of which groups would most benefit from interventions, at what age such interventions should be targeted, and, the nature of the interventions that may be most appropriate for different groups of offenders. In other words, as stated by Piquero (2008, p.52):
The correlates associated with…trajectories may differ and to the extent that they do, this would potentially imply different points of intervention (while at the same time recognising that the same intervention may not be applicable to all offenders…).
The aims of this study are therefore to:
develop a group-based trajectory model for young Victorian offenders. identify whether and how the known characteristics of higher frequency youth offenders differ from lower
frequency youth offenders. determine whether there are differences in the types of offences recorded for different trajectory groups,
including whether there are differences in the offences first recorded for different groups (i.e. differences in initiation offences).
Method
Data
This research draws on data about all criminal incidents recorded by Victoria Police in their Law Enforcement Assistance Program (LEAP) database for a cohort of alleged offenders born over a two year period from 1 April 1996 to 31 March 1998. This enabled analysis of the longitudinal alleged offending patterns of the cohort between the ages of ten and 17 (the first eight years of their possible criminal offending careers). The paper uses three counting units: offenders, offender incidents and offences. An offender incident can involve one or more alleged offences to which an individual has been linked as an offender. An incident represents a unit of work recorded by Victoria Police and may involve offences that occur over a period of time, but are recorded as part of a single incident by police. For the purpose of this research, in cases where offences within an incident took place over multiple dates, the earliest date was used. It should also be noted that the CSA does not receive data on court outcomes, so all references to offenders, incidents and offences refer to alleged rather than proven offenders, incidents and offences.

4
Statistical analysis
As already noted, this paper used SPGM to identify the latent trajectory groups of offending incident frequencies for the cohort. An intensive stepwise process was used to determine the model with the most appropriate number of trajectory groups. This included examination of diagnostic measures such as the Bayesian Information Criterion (BIC, which measures the fit of the model), the average posterior probabilities (which measures the certainty with which an individual is classified to a particular group), and the odds of correct classification (OCC, which measures the probability that an individual will be assigned to the correct group). Nagin (2005) also stresses the importance of considering both the parsimony of the number of groups and the substantive goal of the project when selecting the appropriate model. This means that the model selection process is, to some extent, intuitive as well as methodological2.
Following identification of the correct model, both chi square analyses and Kruskall-Wallis tests were applied to examine the statistical differences between trajectory groups in terms of their demographic characteristics or offending behaviours.
Results
Based on the results of the SPGM analysis, a four group model was selected. Table 1 shows the diagnostic results for the final model. Nagin (2005) suggests that when average posterior probability is higher than 0.7 and OCC values are higher than 5, the group assignment represents a high level of accuracy. Both of these criteria were fulfilled with the four group model selected.
Table 1: Diagnostic statistics for the four group model
Trajectory group Actual number of offenders
Actual percentage of total offenders
Predicted percentage of total
offenders
Average posterior
probability
Odds correct classification
Low Adolescent limited Late developing High
10,240 737 388 182
88.7% 6.4% 3.4% 1.6%
88.5% 6.5% 3.4% 1.6%
0.99 0.91 0.92 0.98
16.88 151.49 327.80
2951.51
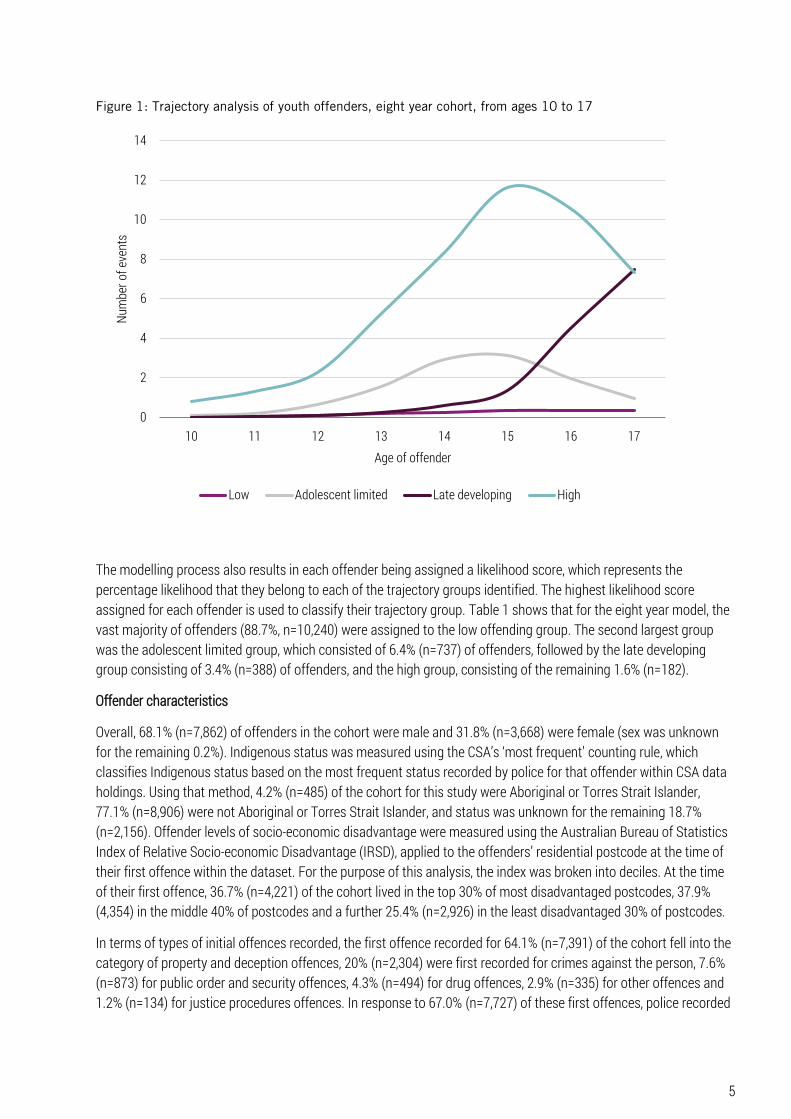
Overall, the model includes 11,547 unique offenders. Over their first eight years of offending this cohort were recorded for 39,680 incidents, and 58,918 offences in total. Figure 1 shows the trajectories of each of the four groups that emerged in the selected model. As shown, the modelling identified a ‘high’ offending group, whose offending increased rapidly from a young age. On average, this group was recorded for 0.8 incidents per individual at age 10, to a peak of 11.6 incidents at age 15, before declining to 7.3 incidents per offender at the end of the data series (age 17). The ‘adolescent limited’ group followed a similar offending pattern but their level of offending was much lower, peaking at an average of 3.1 incidents at the age of 15 before declining to an average of 1.0 incident per offender at age 17. The level of offending amongst the ‘late developing’ group remained low until around the age of 15 (where they were recorded for an average of 1.3 incidents per offender), before rapidly increasing to match the high group at age 17, with 7.5 incidents recorded on average per offender. Finally, the modelling identified a ‘low’ offending group who had a very low level of offending across all ages. The highest offending rate for this group, of only 0.4 incidents on average per offender, occurred at the age of 16.
2 For more information on model type selection, see Andruff et al. (2009); Jones et al. (2001) and Nagin (2005).
5
Figure 1: Trajectory analysis of youth offenders, eight year cohort, from ages 10 to 17
The modelling process also results in each offender being assigned a likelihood score, which represents the percentage likelihood that they belong to each of the trajectory groups identified. The highest likelihood score assigned for each offender is used to classify their trajectory group. Table 1 shows that for the eight year model, the vast majority of offenders (88.7%, n=10,240) were assigned to the low offending group. The second largest group was the adolescent limited group, which consisted of 6.4% (n=737) of offenders, followed by the late developing group consisting of 3.4% (n=388) of offenders, and the high group, consisting of the remaining 1.6% (n=182).
Offender characteristics
Overall, 68.1% (n=7,862) of offenders in the cohort were male and 31.8% (n=3,668) were female (sex was unknown for the remaining 0.2%). Indigenous status was measured using the CSA’s ‘most frequent’ counting rule, which classifies Indigenous status based on the most frequent status recorded by police for that offender within CSA data holdings. Using that method, 4.2% (n=485) of the cohort for this study were Aboriginal or Torres Strait Islander, 77.1% (n=8,906) were not Aboriginal or Torres Strait Islander, and status was unknown for the remaining 18.7% (n=2,156). Offender levels of socio-economic disadvantage were measured using the Australian Bureau of Statistics Index of Relative Socio-economic Disadvantage (IRSD), applied to the offenders’ residential postcode at the time of their first offence within the dataset. For the purpose of this analysis, the index was broken into deciles. At the time of their first offence, 36.7% (n=4,221) of the cohort lived in the top 30% of most disadvantaged postcodes, 37.9% (4,354) in the middle 40% of postcodes and a further 25.4% (n=2,926) in the least disadvantaged 30% of postcodes.
In terms of types of initial offences recorded, the first offence recorded for 64.1% (n=7,391) of the cohort fell into the category of property and deception offences, 20% (n=2,304) were first recorded for crimes against the person, 7.6% (n=873) for public order and security offences, 4.3% (n=494) for drug offences, 2.9% (n=335) for other offences and 1.2% (n=134) for justice procedures offences. In response to 67.0% (n=7,727) of these first offences, police recorded
0
2
4
6
8
10
12
14
10 11 12 13 14 15 16 17
Num
ber o
f eve
nts
Age of offender
Low Adolescent limited Late developing High
6
a caution or warning. They recorded a summons for a further 14.0% (n=1,616), an arrest for 8.8% (n=1,013), an intent to summons for 8.5% (n=981) and some other outcome for 1.7% (n=194).
Following assignment of alleged offenders to each of the four trajectory groups, the characteristics of offenders and their initial offences were compared across groups using chi-square tests to determine whether offenders from a particular group were statistically more likely to have a particular characteristic. The results of these tests are detailed in Table 2. In summary, compared to the overall cohort, the adolescent limited (74.4%, n=548), late developing (86.9%, n=337), and high (87.9%, n=160) groups contained significantly higher proportions of male offenders, and these groups also had significantly higher proportions of people who identified as Aboriginal or Torres Strait Islander (12.6%, n=93, 6.2%, n=24 and 14.8%, n=27 respectively). The adolescent limited, late developing and high groups were also more likely to include offenders whose residential postcode at the time of their first offence was in the top 30% of most socio-economically disadvantaged postcodes in Victoria.
Conversely, the low group had a higher proportion of female offenders (33.3%, n=3,406) and was less likely to include offenders who identified as Aboriginal or Torres Strait Islander (3.3%, n=341). The proportion of those whose Indigenous status was unknown was significantly higher in the low group than in the late developing group (19.8%, n=2,020 compared with 13.7%, n=53). However, this is not surprising given that the low group has, on average, had far fewer interactions with police compared with the other groups, which meant there were far fewer opportunities for this information to be recorded. Those in the low group were also more likely than those in other groups to reside in the middle 40% or least disadvantaged 30% of postcodes.
Average age at first offence was also compared across offenders using the non-parametric Kruskal-Wallis test. This analysis identified that high offenders were the youngest when they first came in contact with the police, with a median age of 12. Adolescent limited offenders had a median age of 13, while both low and late developing had a median age of 15 when they were recorded for their first incident. The Kruskal-Wallis test, found that the age in which the offender first came into contact with police significantly affected the group to which each offender was assigned3. Post hoc analysis (Wilcoxon two-sample tests, including a Bonferroni correction) identified significant differences between all groups, apart from between the low and late developing groups.
3 H(3) = 895.50, p<.0001

7
Table 2: Characteristics of young offenders, by group
Low Adolescent limited
Late developing High Signif.
n % n % n % n %
Sex Male Female
6,817 3,406
66.6 33.3
548 189
74.4 25.6
337 51
86.9 13.1
160 22
87.9 12.1
<.00014
Indigenous status Aboriginal or Torres Strait Islander
341
3.3
93
12.6
24
6.2
27
14.8
<.00015
Neither Aboriginal or Torres Strait Islander
7,879 76.9 575 78.0 311 80.2 141 77.5
Unknown 2,020 19.8 69 9.4 53 13.7 14 7.7
SEIFA index – residential address <.00016 Three most disadvantaged deciles Four middle deciles Three least disadvantaged deciles
3,610 3,918 2,671
35.4 38.4 26.2
355 251 129
48.3 34.2 17.6
166 124 95
43.1 32.2 24.7
90 61 31
49.5 33.5 17.0
First offence Crimes against the person
2,074
20.3
125
17.0
89
23.1
16
8.8
<.00017
Property and deception offences 6,431 62.9 550 74.9 255 66.1 155 85.6 Drug offences Public order and security offences
477 803
4.7 7.9
4 41
0.5 5.6
13 22
3.4 5.7
0 7
0.0 3.9
Justice procedures offences 121 1.2 7 1.0 5 1.3 1 0.6 Other offences 324 3.2 7 1.0 2 0.5 2 1.1
Outcome – first offence Arrest Summons Caution/Warning Penalty notice/Other Intent to Summons
790
1.377 6,979 184 900
7.7
13.5 68.2 1.8 8.8
110 126 450
4 44
15.0 17.2 61.3 0.5 6.0
83 79
194 6
24
21.5 20.5 50.3 1.6 6.2
30 34
104 0
13
16.6 18.8 57.5 0.0 7.2
<.00018
Volume and nature of offending
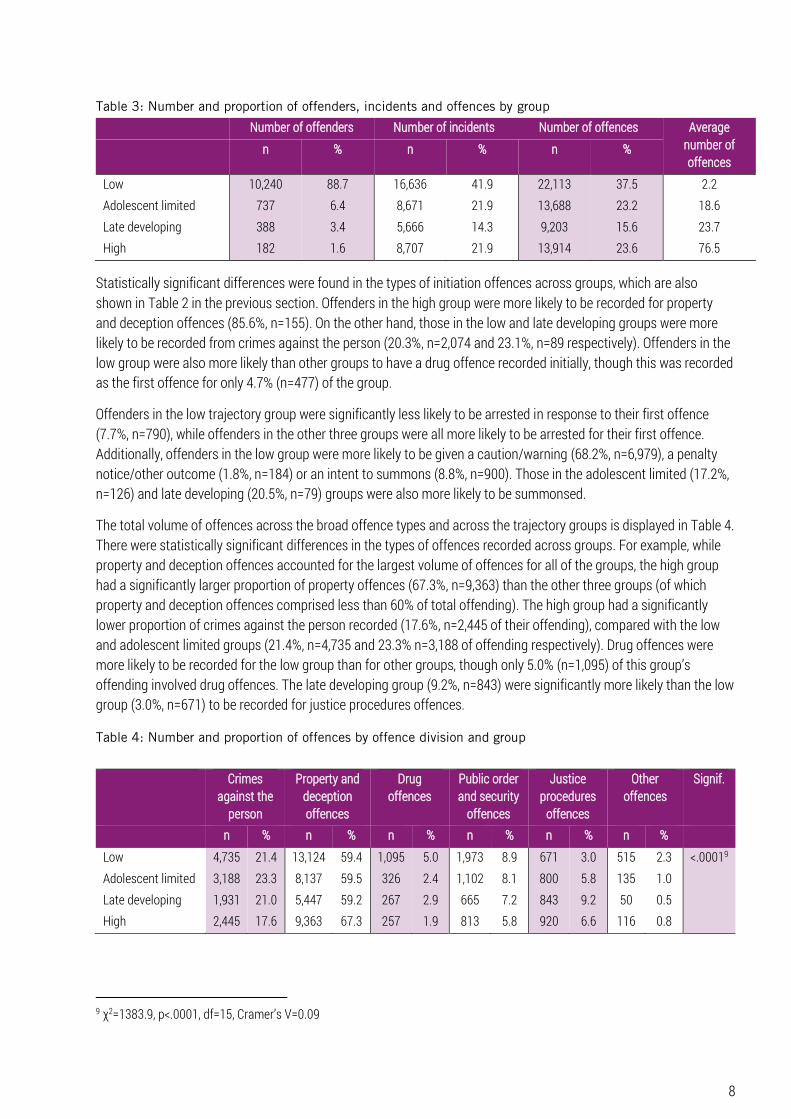
Despite making up just 1.6% (n=182) of the offenders in the cohort, Table 3 shows that the high group accounted for 23.6% (n=13,914) of all the offences recorded across the eight year period. This equates to an average of 76.5 offences per individual offender in the high group from the time of their tenth birthday through to their last day as a 17 year old. On the other hand, while 88.7% (n=10,240) of the offenders were classified as belonging to the low trajectory group, they were responsible for just 37.5% (n=22,113, an average of 2.2 offences per offender) of all offences committed.
4 χ2=118.6, p<.0001, df=3, Cramer’s V=0.10 5 χ2=253.3, p<.0001, df=6, Cramer’s V=0.10 6 χ2=77.1, p<.0001, df=6, Cramer’s V=0.06 7 χ2=114.3, p<.0001, df=15, Cramer’s V=0.06 8 χ2=192.1, p<.0001, df=12, Cramer’s V=0.07
8
Table 3: Number and proportion of offenders, incidents and offences by group
Number of offenders Number of incidents Number of offences Average number of offences
n % n % n %
Low Adolescent limited Late developing High
10,240 737 388 182
88.7 6.4 3.4 1.6
16,636 8,671 5,666 8,707
41.9 21.9 14.3 21.9
22,113 13,688 9,203
13,914
37.5 23.2 15.6 23.6
2.2 18.6 23.7 76.5
Statistically significant differences were found in the types of initiation offences across groups, which are also shown in Table 2 in the previous section. Offenders in the high group were more likely to be recorded for property and deception offences (85.6%, n=155). On the other hand, those in the low and late developing groups were more likely to be recorded from crimes against the person (20.3%, n=2,074 and 23.1%, n=89 respectively). Offenders in the low group were also more likely than other groups to have a drug offence recorded initially, though this was recorded as the first offence for only 4.7% (n=477) of the group.
Offenders in the low trajectory group were significantly less likely to be arrested in response to their first offence (7.7%, n=790), while offenders in the other three groups were all more likely to be arrested for their first offence. Additionally, offenders in the low group were more likely to be given a caution/warning (68.2%, n=6,979), a penalty notice/other outcome (1.8%, n=184) or an intent to summons (8.8%, n=900). Those in the adolescent limited (17.2%, n=126) and late developing (20.5%, n=79) groups were also more likely to be summonsed.
The total volume of offences across the broad offence types and across the trajectory groups is displayed in Table 4. There were statistically significant differences in the types of offences recorded across groups. For example, while property and deception offences accounted for the largest volume of offences for all of the groups, the high group had a significantly larger proportion of property offences (67.3%, n=9,363) than the other three groups (of which property and deception offences comprised less than 60% of total offending). The high group had a significantly lower proportion of crimes against the person recorded (17.6%, n=2,445 of their offending), compared with the low and adolescent limited groups (21.4%, n=4,735 and 23.3% n=3,188 of offending respectively). Drug offences were more likely to be recorded for the low group than for other groups, though only 5.0% (n=1,095) of this group’s offending involved drug offences. The late developing group (9.2%, n=843) were significantly more likely than the low group (3.0%, n=671) to be recorded for justice procedures offences.
Table 4: Number and proportion of offences by offence division and group
9 χ2=1383.9, p<.0001, df=15, Cramer’s V=0.09
Crimes against the
person
Property and deception offences
Drug offences
Public order and security
offences
Justice procedures
offences
Other offences
Signif.
n % n % n % n % n % n %
Low Adolescent limited Late developing High
4,735 3,188 1,931 2,445
21.4 23.3 21.0 17.6
13,124 8,137 5,447 9,363
59.4 59.5 59.2 67.3
1,095 326 267 257
5.0 2.4 2.9 1.9
1,973 1,102 665 813
8.9 8.1 7.2 5.8
671 800 843 920
3.0 5.8 9.2 6.6
515 135 50
116
2.3 1.0 0.5 0.8
<.00019
9
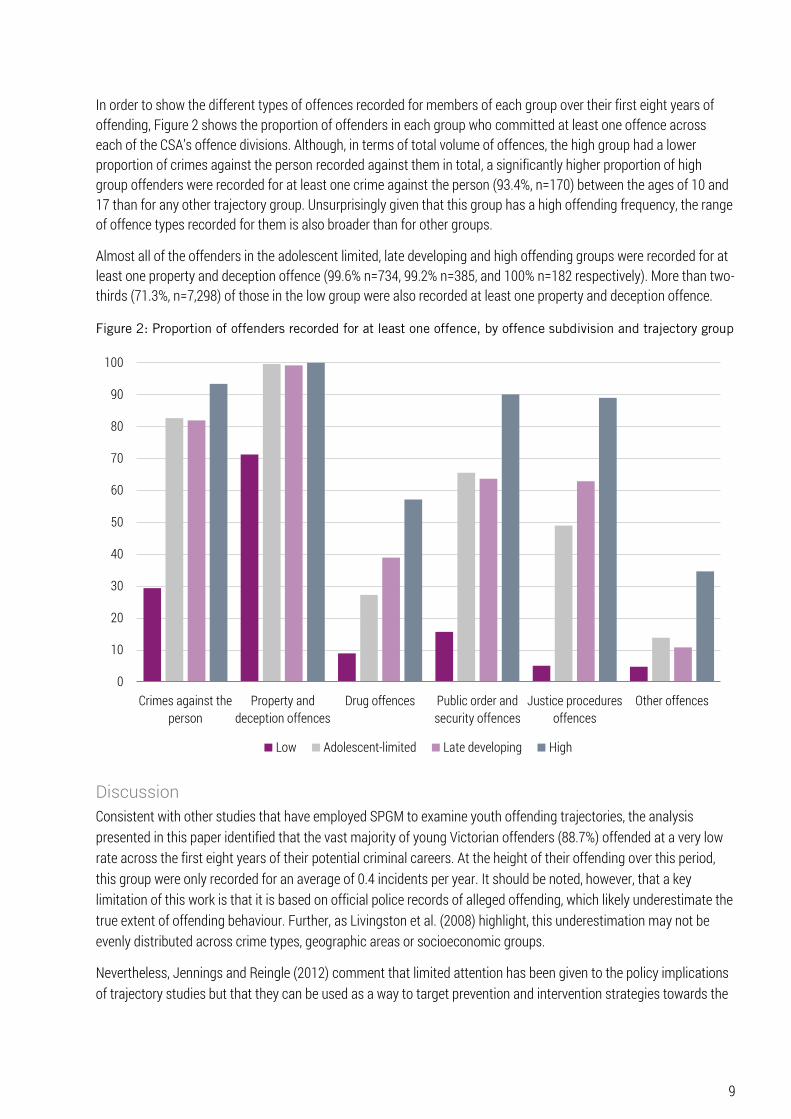
In order to show the different types of offences recorded for members of each group over their first eight years of offending, Figure 2 shows the proportion of offenders in each group who committed at least one offence across each of the CSA’s offence divisions. Although, in terms of total volume of offences, the high group had a lower proportion of crimes against the person recorded against them in total, a significantly higher proportion of high group offenders were recorded for at least one crime against the person (93.4%, n=170) between the ages of 10 and 17 than for any other trajectory group. Unsurprisingly given that this group has a high offending frequency, the range of offence types recorded for them is also broader than for other groups.
Almost all of the offenders in the adolescent limited, late developing and high offending groups were recorded for at least one property and deception offence (99.6% n=734, 99.2% n=385, and 100% n=182 respectively). More than two-thirds (71.3%, n=7,298) of those in the low group were also recorded at least one property and deception offence.
Figure 2: Proportion of offenders recorded for at least one offence, by offence subdivision and trajectory group
Discussion Consistent with other studies that have employed SPGM to examine youth offending trajectories, the analysis presented in this paper identified that the vast majority of young Victorian offenders (88.7%) offended at a very low rate across the first eight years of their potential criminal careers. At the height of their offending over this period, this group were only recorded for an average of 0.4 incidents per year. It should be noted, however, that a key limitation of this work is that it is based on official police records of alleged offending, which likely underestimate the true extent of offending behaviour. Further, as Livingston et al. (2008) highlight, this underestimation may not be evenly distributed across crime types, geographic areas or socioeconomic groups.
Nevertheless, Jennings and Reingle (2012) comment that limited attention has been given to the policy implications of trajectory studies but that they can be used as a way to target prevention and intervention strategies towards the
0
10
20
30
40
50
60
70
80
90
100
Crimes against theperson
Property anddeception offences
Drug offences Public order andsecurity offences
Justice proceduresoffences
Other offences
Low Adolescent-limited Late developing High

Authorised and published by the Crime Statistics Agency, 121 Exhibition Street, Melbourne. ISSN: 2205-6378 This work is licensed under a Creative Commons 4.0 International License. When reporting CSA data and publications, you must attribute the Crime Statistics Agency (or CSA) as the source. If you would like to receive this publication in an accessible format such as large print or audio, telephone 03 8684 1808 or email [email protected] This document is also available in Word format at www.crimestatistics.vic.gov.au
most costly and concerning young offenders. In this study, two trajectory groups emerged that had much higher rates of alleged offending. The first of these, termed the high group, consisted of 1.6% of the cohort and their offending escalated rapidly from about the age of 12, peaking at around age 15 with 11.6 incidents recorded on average during that year of age. Though this group consists of less than two percent of offenders, they are, overall, responsible for 24% of offences. Proportionally, they accounted for more property offences and less crimes against the person than other trajectory groups. However, over 90% had at least one crime against the person recorded over the eight-year analysis period. Compared to other groups, the high group includes a very large proportion of offenders recorded for the most serious offences.
The second high-rate offender group identified through this analysis was the late developing group, which comprised an additional 3.4% of offenders. The patterns observed for this group saw offending escalate from the age of 15 and continue to increase until the end of the analysis period (age 17) examined in this study. This group was statistically more likely than any other group to have a crime against the person recorded as their first offence when compared with other groups. Nevertheless, some research suggests that desistance from crime can often occur in the early twenties (Piquero, Farrington & Blumstein, 2007). Future research could consider following the late-developing group further throughout their offending career to examine whether this group desists in their 20s or continues to offend at a high rate.
Recent research has also identified that, contrary to prior criminological theory, a large number of offenders first have contact with the justice system as adults (DeLisi & Piquero, 2011; Thompson et al., 2014). In Queensland, Thomson et al. (2014) identified that half of a 1983/1984 birth cohort were adult-onset offenders who first came into contact with the criminal justice system between the ages of 18 and 25. Accumulation of longitudinal data will enable future CSA research to consider the prevalence and nature of adult-onset offending in Victoria.
Similar to other Australian studies (Marshall, 2006; Livingston et al., 2008), young people who fell into all but the low trajectory group were statistically more likely to be male, to identify as Aboriginal or Torres Strait Islander, and to live in the most socio-economically disadvantaged areas at the commencement of their offending record. However, our knowledge of the characteristics of these high-rate groups remains limited. Data was not available to consider, for example, whether particular life events, educational pathways or parenting styles influenced the trajectories young offenders followed. Further, our research included only a preliminary consideration of how criminal justice interventions might impact on the course of offending behaviour by considering the broad police outcome recorded for the first offence. Additionally, it was not possible to control for variations in policing responses across individuals, geographic areas, and offence types. For example, it may be the case that once an offender becomes known to police for a particular offence type, that offender may be more likely to have their further offending behaviour detected than other offenders, which in turn could potentially impact which trajectory group they are assigned to.
Researchers have stressed a need to move away from simply identifying trajectory groups and their key characteristics, to detailed examination of the risk and protective factors for particular offending trajectories, and whether these apply differentially across groups or over time (Jennings and Reingle, 2012; Piquero, 2008). In the context of this study, for example, further research could seek to unpack what factors influence members of the adolescent limited trajectory to desist from crime towards the end of adolescence, or whether there are particular events that trigger escalation of offending amongst the late-developing cohort.
References Abs.gov.au. (2016). 2033.0.55.001 - Census of Population and Housing: Socio-Economic Indexes for Areas (SEIFA), Australia, 2011. [online] Available at: http://www.abs.gov.au/ausstats/[email protected]/mf/2033.0.55.001 [Accessed 16 Jul. 2016].
Abs.gov.au. (2009). 1234.0.55.001 – National Offence Index, 2009. [online] Available at: http://www.abs.gov.au/ausstats/[email protected]/Products/1234.0.55.001~2009~Main+Features~Historical+development+of+NOI?OpenDocument [Accessed 8 Jul. 2016].
Allard, T., Chrzanowski, A. and Stewart, A. (2015). Integrating criminal careers and ecological research: The importance of geographic location for targeting interventions toward chronic and costly offenders. Crime and Delinquency, pp.1-25.
Andruff, H., Carraro, N., Thompson, A., Gaudreau, P. and Louvet, B. (2009). Latent class growth modelling: A tutorial. Tutorials in Quantitative Methods for Psychology, 5(1), pp.11-24.
Blokland, A. and Nieuwbeerta, P. (2005). The effects of life circumstances on longitudinal trajectories of offending. Criminology, 43, pp.1203-1240.
Broidy, L., Stewart, A., Thompson, C., Chrzanowski, A., Allard, T. and Dennison, S. (2015). Life course offending pathways across gender and race/ethnicity. Journal of Developmental and Life Course-Criminology, 1, pp.118-149.
DeLisi, M. & Piquero, A. (2011). New frontiers in criminal careers research, 2010-2011: a state of the art review. Journal of Criminal Justice, 39, pp.289-301.
Farrington, D. (2016). Age and crime. In: M. Tonry and N. Morris, ed., Crime and justice: An annual review of research, 1st ed. Chicago: University of Chicago Press, pp.185-250.
Ferrante, A. (2013). Assessing gender and ethnic differences in developmental trajectories of offending. Australian & New Zealand Journal of Criminology, 46(3), pp.379-402.
Hirschi, T. and Gottfredson, M. (1983). Age and the Explanation of Crime. The American Journal of Sociology, 89(3), pp.552-584.
Jennings, W. and Reingle, J. (2012). On the number and shape of developmental/life-course violence, aggression, and delinquency trajectories: A state-of-the-art review. Journal of Criminal Justice, 40, pp.472-489.
Jones, B., Nagin, D. and Roeder, K. (2001). A SAS procedure based on mixture models for estimating developmental trajectories. Sociological Methods & Research, 29(3), pp.374-393.
Livingston, M., Stewart, A., Allard, T. and Ogilvie, J. (2008). Understanding juvenile offending trajectories. The Australian and New Zealand Journal of Criminology, 41(3), pp.345-363.
Marshall, J. (2008). Juvenile offending trajectories: a South Australian study. Adelaide: Department of Justice.
Millsteed, M. and Sutherland, P. (2016). How has youth crime in Victoria changed over the past 10 years? Melbourne: Crime Statistics Agency.
Moffitt, T. (1993). Adolescence-limited and life-course-persistent antisocial behavior: A developmental taxonomy. Psychological Review, 100, pp.674-701.
12
Nagin, D. (2005). Group-based modeling of development. Cambridge, MA: Harvard University Press.
Nagin, D. and Land, K. (1993). Age, criminal careers, and population heterogeneity: Specification and estimation of a nonparametric, mixed poisson model. Criminology, 31, pp.327-362.
Patterson, G. (1993). Orderly change in a stable world: The antisocial trait as a chimera.Journal of Consulting and Clinical Psychology, 61, pp.911-919.
Piquero, A. (2008). Taking stock of developmental trajectories of criminal activity over the life course. In: A. Liberman, ed., The Long View of Crime: A Synthesis of Longitudinal Research, 1st ed. New York: Springer-Verlag, pp.23-78.
Piquero, A., Farrington, D. & Blumstein, A. (2007). Key issues in criminal career research: new analyses of the Cambridge Study in Delinquint Development. Cambridge: Cambridge University Press.
Sampson, R. and Laub, J. (2003). Life-course desisters? Trajectories of crime among delinquent boys followed to age 70. Criminology, 41, pp.555-592.
Sweeten, G., Piquero, A. and Steinberg, L. (2013). Age and the explanation of crime, revisited. Journal of Youth and Adolescence, 42(6), pp.921-938.
Thompson, C.M., Stewart, A.L., Allard, T.J., Chrzanowski, A., Luker, C. & Sveticic, J. (2014). Understanding the extent and nature of adult-onset offending: Implications for the effective and efficient use of criminal justice and crime reduction resources. Report to the Criminology Research Advisory Council. Canberra: Australian Institute of Criminology.


