
Patterns of Rare and Abundant Marine Microbial Eukaryotes · Patterns of Rare and Abundant Marine...
61
Patterns of Rare and Abundant Marine Microbial Eukaryotes Ramiro Logares, St´ ephane Audic, David Bass, Lucie Bittner, Christophe Boutte, Richard Christen, Jean-Michel Claverie, Johan Decelle, John R Dolan, Micah Dunthorn, et al. To cite this version: Ramiro Logares, St´ ephane Audic, David Bass, Lucie Bittner, Christophe Boutte, et al.. Pat- terns of Rare and Abundant Marine Microbial Eukaryotes. Current Biology - CB, Elsevier, 2014, 24 (8), pp.813-821. <10.1016/j.cub.2014.02.050>. <hal-01149637> HAL Id: hal-01149637 http://hal.upmc.fr/hal-01149637 Submitted on 7 May 2015 HAL is a multi-disciplinary open access archive for the deposit and dissemination of sci- entific research documents, whether they are pub- lished or not. The documents may come from teaching and research institutions in France or abroad, or from public or private research centers. L’archive ouverte pluridisciplinaire HAL, est destin´ ee au d´ epˆ ot et ` a la diffusion de documents scientifiques de niveau recherche, publi´ es ou non, ´ emanant des ´ etablissements d’enseignement et de recherche fran¸cais ou ´ etrangers, des laboratoires publics ou priv´ es.
Transcript of Patterns of Rare and Abundant Marine Microbial Eukaryotes · Patterns of Rare and Abundant Marine...
Patterns of Rare and Abundant Marine Microbial
Eukaryotes
Ramiro Logares, Stephane Audic, David Bass, Lucie Bittner, Christophe
Boutte, Richard Christen, Jean-Michel Claverie, Johan Decelle, John R
Dolan, Micah Dunthorn, et al.
To cite this version:
Ramiro Logares, Stephane Audic, David Bass, Lucie Bittner, Christophe Boutte, et al.. Pat-terns of Rare and Abundant Marine Microbial Eukaryotes. Current Biology - CB, Elsevier,2014, 24 (8), pp.813-821. <10.1016/j.cub.2014.02.050>. <hal-01149637>
HAL Id: hal-01149637
http://hal.upmc.fr/hal-01149637
Submitted on 7 May 2015
HAL is a multi-disciplinary open accessarchive for the deposit and dissemination of sci-entific research documents, whether they are pub-lished or not. The documents may come fromteaching and research institutions in France orabroad, or from public or private research centers.
L’archive ouverte pluridisciplinaire HAL, estdestinee au depot et a la diffusion de documentsscientifiques de niveau recherche, publies ou non,emanant des etablissements d’enseignement et derecherche francais ou etrangers, des laboratoirespublics ou prives.
1
Patterns of Rare and Abundant Marine Microbial Eukaryotes
Ramiro Logares1*, Stéphane Audic2,3, David Bass4, Lucie Bittner2,3,5, Christophe 5 Boutte2,3, Richard Christen6,7, Jean-Michel Claverie8, Johan Decelle2,3, John R. Dolan9,
Micah Dunthorn5, Bente Edvardsen10, Angélique Gobet2,3, Wiebe H.C.F. Kooistra11,
Frédéric Mahé2,3,5, Fabrice Not2,3, Hiroyuki Ogata8,12, Jan Pawlowski13, Massimo C.
Pernice1, Sarah Romac2,3, Kamran Shalchian-Tabrizi10, Nathalie Simon2,3, Thorsten
Stoeck5, Sébastien Santini8, Raffaele Siano14, Patrick Wincker15, Adriana Zingone11, 10 Thomas A. Richards16, Colomban de Vargas2,3, Ramon Massana1 1 Institut de Ciències del Mar, CSIC, Passeig Marítim de la Barceloneta 37-49, Barcelona ES-08003, Spain 2 ADMM UMR 7144, UPMC Paris 06, Station Biologique de Roscoff, Roscoff FR-29682, France 3 ADMM UMR 7144, CNRS, Station Biologique de Roscoff, Roscoff FR-29682, France 15 4 Department of Life Sciences, The Natural History Museum, Cromwell Road, London SW7 5BD, United Kingdom 5 Department of Ecology, University of Kaiserslautern, Kaiserslautern D-67663, Germany 6 SAE UMR 7138, CNRS, Parc Valrose BP71, Nice Cedex 02 FR-06108, France 7 SAE UMR 7138, Université de Nice-Sophia Antipolis, Parc Valrose BP71, Nice Cedex 02, FR-06108, France 8 IGS UMR 7256, CNRS, Aix-Marseille Université, Marseille FR-13288, France 20 9 LOV UMR 7093, CNRS, UPMC Paris 06, Villefranche-sur-Mer FR-06230, France 10 Department of Biosciences, University of Oslo, P.O. Box 1066 Blindern, Oslo N-0316, Norway 11 Ecology and Evolution of Plankton, Stazione Zoologica Anton Dohrn, Villa Comunale 1, Naples I-80121, Italy 12 Education Academy of Computational Life Sciences, Tokyo Institute of Technology, Tokyo 152-8552, Japan 13 Department of Genetics and Evolution, University of Geneva, Geneva CH-1211, Switzerland 25 14 Ifremer, Centre de Brest, DYNECO/Pelagos BP70, Plouzané FR-29280, France 15 CEA, Genoscope, 2 rue Gaston Crémieux , Evry FR-91000, France 16 Biosciences, Geoffrey Pope Building, University of Exeter, Exeter EX4 4QD, United Kingdom
*Corresponding Author: 30 Ramiro Logares
Institut de Ciències del Mar, CSIC
Passeig Marítim de la Barceloneta, 37-49
ES-08003, Barcelona, Spain
Office: +34 93 2309608; Fax: +34 93 2309555 35 Email: [email protected]
Running head: Patterns of rare and abundant marine protists
Keywords: microbial eukaryotes, community ecology, marine, abundance distribution, next-generation
sequencing 40 Manuscript for: Current Biology as Research Article (re-resubmission)
0DQXVFULSW
2
HIGHLIGHTS
x Regular proportions of abundant and rare microeukaryotes across space and time
x Contrasting structuring patterns in abundant and rare regional communities 45
x Considerable phylogenetic diversity in the rare microeukaryote biosphere
x Metabolically active taxa are present among rare planktonic microeukaryotes
3
SUMMARY 50
Background: Biological communities are normally composed of a few abundant and
many rare species. This pattern is particularly prominent in microbial communities,
where most constituent taxa are usually extremely rare. Yet, microbiologists normally
do not differentiate between abundant and rare sub-communities, although they may 55
present intrinsic characteristics that could be crucial for understanding community
dynamics and ecosystem functioning. Here we investigate abundant and rare sub-
communities of marine microbial eukaryotes, a crucial group of organisms in the oceans
that remain among the least explored biodiversity components of the biosphere. We
surveyed surface waters of six separated coastal locations in Europe, considering 60
independently the pico-, nano- and micro/meso- plankton organismal size fractions.
Results: Deep Illumina sequencing of the 18S rRNA indicated that the abundant
regional community was mostly structured by organismal size fraction, while the rare
regional community was mainly structured by geographic origin. Yet, some abundant
and rare taxa presented similar biogeography, pointing to spatiotemporal structure in the 65
rare microeukaryote biosphere. Abundant and rare sub-communities presented regular
proportions across samples, indicating similar species-abundance distributions despite
taxonomic compositional variation. Several taxa were abundant in one location and rare
in others, suggesting large oscillations in abundance. The substantial amount of
metabolically active lineages found in the rare biosphere suggests that this sub-70
community constitutes a diversity reservoir that can respond rapidly to environmental
change.

4
Conclusions: We propose that marine-planktonic microeukaryote assemblages
incorporate dynamic and metabolically active abundant and rare sub-communities with
contrasting structuring patterns but fairly regular proportions across space and time. 75
5
INTRODUCTION
Microbes are the dominant form of life in the oceans, playing fundamental roles in 80
ecosystem functioning and biogeochemical processes at local and global scales [1-4].
However, limited knowledge of their diversity and community structure across space
and time [5, 6] hinders our understanding of the links between microbial life and
ecosystem functioning [7]. During the last decade, technological progress in molecular
ecology and environmental sequencing has substantially boosted our understanding of 85
marine microbes, unveiling notable patterns of abundant and rare sub-communities [4,
8, 9], reminiscent of patterns observed in classical plant and animal ecology [10]. The
recently discovered large amount of rare taxa in microbial communities is now referred
as the “Rare Biosphere” [11], whose exploration is made feasible today by means of
High-Throughput Sequencing (HTS) technologies [12]. 90
Abundant and rare microbial sub-communities may have fundamentally
different characteristics and ecological roles. For example, rare marine microbes are
hypothesized to include ecologically redundant taxa that could increase in abundance
following environmental perturbation or change, and maintain continuous ecosystem
functioning [13]. Locally rare taxa can also act as seeds for seasonal succession or 95
sporadic blooms. Conversely, the drastic decrease in abundance or even extinction of a
globally abundant oceanic microbe with no ecologically comparable counterpart in the
rare biosphere could have significant and unpredictable effects on the global ecosystem.
Most of the studies to date that have differentiated between abundant and rare marine
microbial sub-communities concern bacteria. Abundant bacteria contribute mostly to 100
biomass, carbon flow and nutrient cycling, while the generally large numbers of rare
bacteria contribute predominantly to species richness [9]. Different strategies are
observed among rare bacteria, such as dormant or inactive taxa that grow exponentially
6
when the right conditions are met [8, 14-16] or taxa that seem to remain members of the
rare biosphere [15, 17] even when they have high relative metabolic activity. Rare 105
bacteria may perform crucial ecosystem functions [18] and some of them can be
metabolically more active than abundant taxa in the same community [14, 15]. Both
abundant and rare bacteria can present similar biogeographic patterns [17, 19]
indicating similar community assembly mechanisms.
Compared to bacteria, we know even less about abundant and rare marine 110
microbial eukaryote (protists) sub-communities and, overall, marine protists remain as
one of the least explored features of natural biodiversity [20]. Recent studies using 454
pyrosequencing [12] recovered few dominant protist taxa and a large number of rare
ones from specific marine and freshwater communities [21-25]. Little information is
available regarding protist metabolic activity. A recent study in freshwater lakes 115
comparing rRNA/rDNA ratios (a proxy of microbial activity) suggested that, in contrast
to bacteria, dormancy does not play an important role in planktonic protist communities
[14].
Here we explore fundamental patterns of rare and abundant marine-planktonic
protistan sub-communities occurring along the European coastline, from the North Sea 120
(Norway) to the Black Sea (Bulgaria) (Figure 1A). Using Illumina [12] and, to a more
limited extent, 454 HTS platforms, we generated a large dataset of both 18S rRNA and
rDNA tags based on total RNA and DNA extracts from three organismal size-fractions,
the pico- (0.8-3μm), nano- (3-20μm) and micro/meso- (20-2,000μm) plankton [3, 26].
The wide geographical and organismal scales of this dataset, combined with ultra-deep 125
sequencing, allowed us to address the following main questions: Are the relative
proportions of abundant and rare protist sub-communities fluctuating across space and
time? What structural and biogeographic patterns present these sub-communities? Do
7
locally abundant taxa tend to be regionally abundant? And, are there specific
phylogenetic and activity patterns associated to abundant and/or rare marine protistan 130
sub-communities? We found that abundant and rare assemblages present contrasting
structuring patterns and phylogenetic characteristics, despite a remarkable consistency
in their relative proportions across individual samples. Furthermore, rare sub-
communities included a large number of predominantly active lineages that presented
biogeography. 135
8
RESULTS
General patterns of richness and evenness
Unless stated otherwise, our results derive from the Illumina V9 18S rRNA tag dataset 140
clustered into 95% similarity Operational Taxonomic Units (OTUs; Table S1) and
prepared using RNA extracts. The 95% threshold was selected for all downstream
analyses in order to minimize any inflation of diversity estimates [27] caused by
remaining tags (if any) with misincorporated nucleotides. In a local community, we
defined OTUs as “abundant” when they reached relative abundances above 1% of the 145
tags and “rare” when their abundances were below 0.01%, following other studies in
bacteria [9, 17] and protists [25]. In the regional community (combination of local
communities), the thresholds for abundant or rare were >0.1% and <0.001%
respectively. In addition, we tested a 97% OTU clustering threshold and comparable
patterns regarding proportions of locally abundant and rare sub-communities were 150
obtained (Table S2).
In total, ~72% of all OTUs were found only in a single size fraction, being either
the pico- (0.8-3μm), nano- (3-20μm) or micro/meso- (20-2,000μm) plankton (Figure
S1). Similarly, ~75% of the rare and ~62% of the abundant OTUs in the regional
community were restricted to a single organismal size fraction. This indicates that our 155
sea-water filtering protocol used to separate total plankton communities into three
distinct organismal size fractions was effective.
In rarefaction analyses considering all reads (5.69 x 10⁶) and samples from the
regional community, richness (based on 95% similarity OTUs) approached saturation at
~9,000 OTUs (Figure S2). OTU-richness also approached saturation in most local 160
communities (between 800 – 3,000 OTUs; Figure S2A). The highest richness was
9
observed in the nano-plankton (3-20μm; 4,786 OTUs after normalization), and the
lowest in the micro/meso-plankton (20-2000μm; 2,941 OTUs; Table 1). Evenness was
low in the regional community, within different size fractions, and in all studied local
communities (Figures S3A,B & S4), with the majority of OTUs being rare and only a 165
few abundant. In the regional community, considering both pooled and separate size
fractions, abundant taxa were <3.5% of the total OTUs while rare taxa were >63.4% of
the OTUs (Table 1). When considering pooled normalized size fractions, the percentage
of total reads falling into rare OTUs in the regional community was 1.1% (20,000
reads), while the percentage of total reads falling into abundant OTUs was 80.7% 170
(1,448,079 reads).
Overall, a total of 20 out of 23 analyzed samples fitted the log-normal model
[10, 28] of Species Abundance Distribution (SAD) according to the Akaike’s
Information Criterion [29] (Figure S4). Assuming a log-normal distribution, we fitted
our regional community data to the truncated Preston log-normal model [10, 30] (Figure 175
S5A) and estimated that we recovered 64-67% of the OTUs in the European coastal
region (Figure S5B). Therefore, even though our deep Illumina sequencing approach
recovered the majority of OTUs from our sample-set, extra sampling effort is needed to
recover the total richness of the studied area.
180
Community structure across space, time, and organismal size-fractions
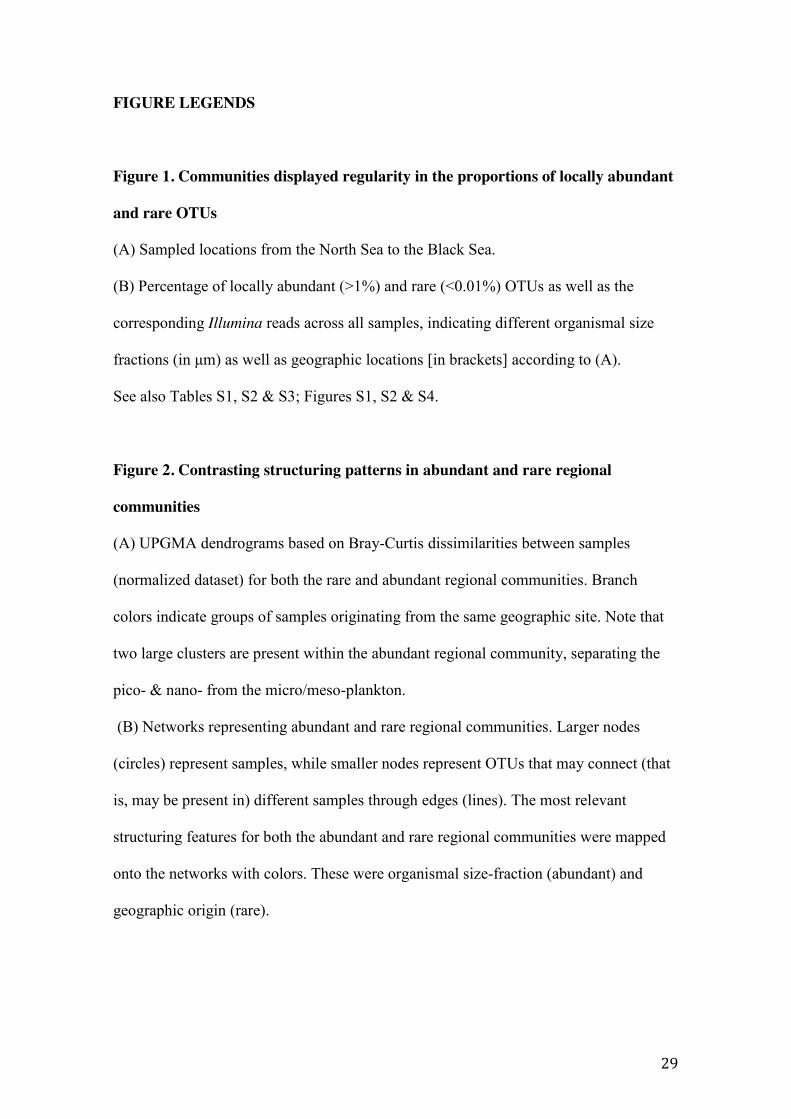
The proportions of locally rare (<0.01%) and abundant (>1%) OTUs (by our definition)
were relatively constant across communities (Figure 1B, Table S1), with ranges of 66.2
– 76.6% for rare OTUs and 0.9 – 2.7% for abundant ones (Figure 1B, Table S1). Reads
corresponding to locally abundant OTUs represented on average 70.1% (SD=9.5) of the 185
10
dataset, while reads corresponding to rare OTUs represented on average 1.9% (SD=0.7)
(Figure 1B).
β-diversity, as described by Bray-Curtis dissimilarities between samples, within
rare and abundant regional communities (i.e. pooled rare or abundant sub-communities)
showed a moderate but significant correlation when considering normalized OTUs from 190
all size fractions together (Mantel test r(abundant|rare)=0.73; p<0.001) as well as within the
pico-plankton (Mantel r(abundant | rare, 0.8-3)=0.69; p<0.05). The correlation was weaker, but
still significant, in the nano- and micro/meso-plankton (Mantel r(abundant | rare, 3-20)=0.44;
r(abundant | rare, 20-2000)=0.46; p<0.05). These correlations indicate that some abundant and
rare taxa share similar biogeography. Yet, the abundant regional community was 195
structured mostly by size fraction, as the OTU composition of abundant micro/meso-
plankton was more similar among samples of this fraction than to any sample of the
pico- and nano- plankton (Figure 2A). In contrast, the rare regional community was
mostly structured by sampling site, with samples from different organismal size
fractions but from the same site being normally more similar in OTU composition when 200
compared to samples from other sites (Figure 2A). Network analyses provided further
insight into these patterns by showing that within the abundant regional community, the
smaller size fractions (pico- and nano-plankton) shared more OTUs between them than
with the larger size fraction (micro/meso-plankton; Figure 2B). In contrast, the rare
regional community network showed that several OTUs were unique to single samples, 205
and that the few shared OTUs tended to be shared between samples of the same site
(Figure 2B).
Further exploration across samples of OTUs that were locally abundant in at
least one sample (total 175 OTUs) showed that none of them presented abundances
>1% in all samples. In analyses of individual size fractions, most OTUs with 210
11
abundances >1% were abundant at a single site/sample (Figure 3A-C), being often rare
or of intermediate abundance elsewhere. Only one OTU within the fraction 3-20μm
displayed abundances >1% in all samples (Figure 3B).
Phylogenetic patterning of abundant versus rare regional communities 215
The constructed phylogeny contained 11 reference OTUs that exclusively represented
regionally abundant OTUs, 107 reference OTUs that represented both regionally
abundant and rare OTUs, and 1,225 reference OTUs that exclusively represented
regionally rare OTUs (Figure 4). While the majority of the regionally abundant OTUs
had relatively close evolutionary relatives among the rare, the majority of the regionally 220
rare OTUs had no close evolutionary relatives among the abundant. BLASTing Illumina
representative reads from abundant and rare OTUs against each other supported this
pattern. About 90% of the abundant OTUs (n=154) produced significant BLAST hits
against the rare (that is, hits with coverage >97% and identity >70%), while only about
31% of the rare OTUs (n=5,329) produced significant hits against the abundant. Faith’s 225
Phylogenetic Diversity (PD) measure [31] was higher in the rare regional community
when compared with the abundant at a similar sampling depth (Figure 4B). Both the
Mean Phylogenetic Distance (MPD) and the Mean Nearest Taxon Distance (MNTD)
[32] indicated that regionally abundant OTUs included in the phylogeny (n=118)
clustered together at a higher frequency than what was expected by chance (Figure 4C). 230
Such a pattern is expected to occur when the environment selects related taxa that share
favorable traits [32, 33]. Conversely, the MPD and MNTD among regionally rare OTUs
(n=1,332) did not present deviations from a random distribution (Figure 4C).
235
12
Activity versus abundance
In order to check to what extent the community and phylogenetic patterns described
above are due to the use of RNA, and not DNA tags, and thus be partially explained by
cellular activity, we analyzed 15 samples for which both DNA- and RNA-based tags
(V4 18S, 454 tags) were obtained. The relative abundance of OTUs in the regional 240
community that were present in both the DNA and RNA datasets showed on average a
nearly 1:1 relationship (Figure 5A). Both the DNA and RNA recovered a number of
OTUs as consistently rare or abundant in the regional community (Figure 5A).
However, some OTUs were rare in the regional community according to the DNA
dataset but showed intermediate abundances within the RNA dataset and vice versa. 245
Approximately 25 OTUs were disproportionately underrepresented by RNA tags
(Figure 5B, grey area), suggesting low-activity or large numbers of rDNA copies in the
genome. On the contrary, ~20 OTUs were disproportionately overrepresented by RNA
tags, which may result from high ribosomal activity (Figure 5B, yellow area).
250
13
DISCUSSION
Marine microbial eukaryotes constitute arguably the most poorly characterized
biodiversity component in the biosphere [20]. Here we provide new insights into the
structural and phylogenetic organization of their communities using the first ultra-deep
sequencing dataset of 18S rRNA tags extracted from surface pico-, nano- and 255
micro/meso-plankton collected at six marine-coastal locations across Europe. Illumina
sequencing of >150 million V9 rRNA amplicons followed by highly-stringent sequence
quality filtering allowed us to approach richness saturation (OTUs 95%) in both the
entire regional community as well as in most local communities, therefore allowing the
exploration of the rare protist biosphere. The highest richness was observed in the 260
proximity of the smallest cell(body)-sizes (in the nano-plankton (3-20μm)), thus
resembling patterns observed in animals by early ecologists [34, 35]. We estimate a
recovery of ~64% of the total number of OTUs in the entire region, therefore more
samples are required to cover the total diversity of European coastal waters. As
observed in aquatic prokaryotes [9], most of the recovered OTUs (>63.0%) belonged to 265
the rare biosphere; since we used RNA as template, we can attest that these OTUs
represent living, ribosomically active cells.
Despite the strong spatio-temporal variability characterizing marine coastal
waters and the different β-diversity among sites, the proportion of locally rare and
abundant taxa was remarkably constant across all sampled communities. This pattern 270
suggests community self-organization arising from local species interactions, with the
observed regular proportions representing stable community configurations [36]. Given
this striking consistency observed in our data, we hypothesize that in other marine
planktonic communities >70% of protist OTUs are rare as well. Yet, it should be
considered that rarity was analyzed according to one pre-existing definition; future 275
14
studies should explore multiple definitions in order determine which one is the most
meaningful [10].
Both the abundant and rare regional communities demonstrated contrasting
patterns regarding their general structure. The abundant regional community was
predominantly structured by organismal size fraction, while the rare regional 280
community was structured mostly according to geographic site. On the one hand, size
fraction structuring reflects the fact that, excluding protists with complex cell cycles,
ontogenic processes, or cell shapes and colony forms markedly distinct from a sphere,
most taxa have rather constant cell sizes. On the other hand, site-associated clustering
indicates that the differences between communities from different sites are larger than 285
the differences between size fractions within the same site. Such groupings of the rare
pico-, nano- and micro/meso-plankton were generated by only a few OTUs that were
present in only one site and shared between the large and smaller size-fractions. These
OTUs could represent low abundance protists with life cycles that involve different cell
sizes, different lifestyles (host associated or not), as well as issues related to a non-290
optimal size fractionation during filtering. Site-associated clustering can be promoted by
historical contingencies occurring in different communities, such as local random
extinctions or stochastic immigration events [37], which are expected to have a larger
impact in rare sub-communities, making them generally more distinct between each
other than abundant counterparts. 295
Even though abundant and rare regional communities presented a markedly
different general structure, we found a moderate but significant correlation in their β-
diversity that points to similar biogeography for some rare and abundant taxa. This
suggests that similar structuring processes can affect both abundant and rare sub-
communities, and that the rare protist biosphere is not a random collection of taxa. 300
15
Comparable results have been reported for marine and lacustrine prokaryotes [17, 19,
38].
Underlying the β-diversity patterns at the regional level, locally abundant (>1%)
OTUs within the pico-, nano-, and micro/meso-plankton showed marked variations in
relative abundance between samples. Most locally abundant OTUs were abundant in 305
only one sample, having intermediate or low (<0.01%) abundances in the others. This
pattern, besides reflecting strong fluctuations in protistan abundance across
heterogeneous coastal locations or seasonality in the same site [23, 39], points to a
general decoupling between local and regional abundances, as most OTUs that are
abundant in only one location will not be regionally abundant. 310
Last but not least, the rare protistan biosphere presented a distinctive
phylogenetic composition, with a significant proportion of rare OTUs phylogenetically
unrelated to abundant ones. In particular, several clades contained exclusively rare
OTUs that were relatively distantly related in phylogenetic terms to the nearest
abundant taxon. Although we cannot exclude that some taxa from these exclusively rare 315
clades may be abundant in other locations/seasons, the overall pattern suggests that
permanent or semi-permanent rarity (achieved e.g. through a low cell division rate) may
be an evolutionary trait of some marine protist groups. Avoidance of competition,
predation and parasitism are potential advantages of a low-abundance life [8], which
could evolve through negative frequency-dependent selection [40]. On the contrary, rare 320
OTUs in the regional community that were phylogenetically closely related to abundant
ones could represent intra-genomic variation or erroneous variants of abundant OTUs
generated during PCR or sequencing [41, 42], although we minimized this bias by
working with a relatively loose definition of OTUs at 95% similarity threshold [27].
The structuring of the abundant regional community seems to have been influenced by 325
16
environmental selection of evolutionary related taxa presenting favorable traits, as
abundant taxa were phylogenetically more closely related than expected by chance [32,
33]. Our comparison of rRNA- versus rDNA-derived OTUs indicated that both types of
markers are broadly positively correlated, supporting the hypothesis that low metabolic
activity or dormancy is not common among planktonic microbial eukaryotes [14, 43]. 330
Thus, metabolically active taxa likely prevail in the protistan rare planktonic biosphere.
In addition, rRNA/rDNA comparisons suggested that a disproportionately high activity
is unusual in planktonic protists. Altogether, this contrasts markedly with planktonic
bacteria, where dormancy appears to be more prevalent [9, 14] and where, for some
taxa, activity can increase as abundance decreases [15]. 335
CONCLUSION
Overall, our results indicate that marine-planktonic protist communities are
composed of, predominantly active, abundant and rare sub-communities with
contrasting structuring patterns and phylogenetic characteristics, which nevertheless 340
display striking consistency in their local relative proportions, even in dissimilar coastal
waters. Further analyses of protist community structuring in contrasting oceanic biomes
will provide a wider test of the patterns we found in European coastal waters,
contributing altogether to a better understanding of the community organization
mechanisms in microbial eukaryotes and their links to local and global ecosystem 345
functioning.
17
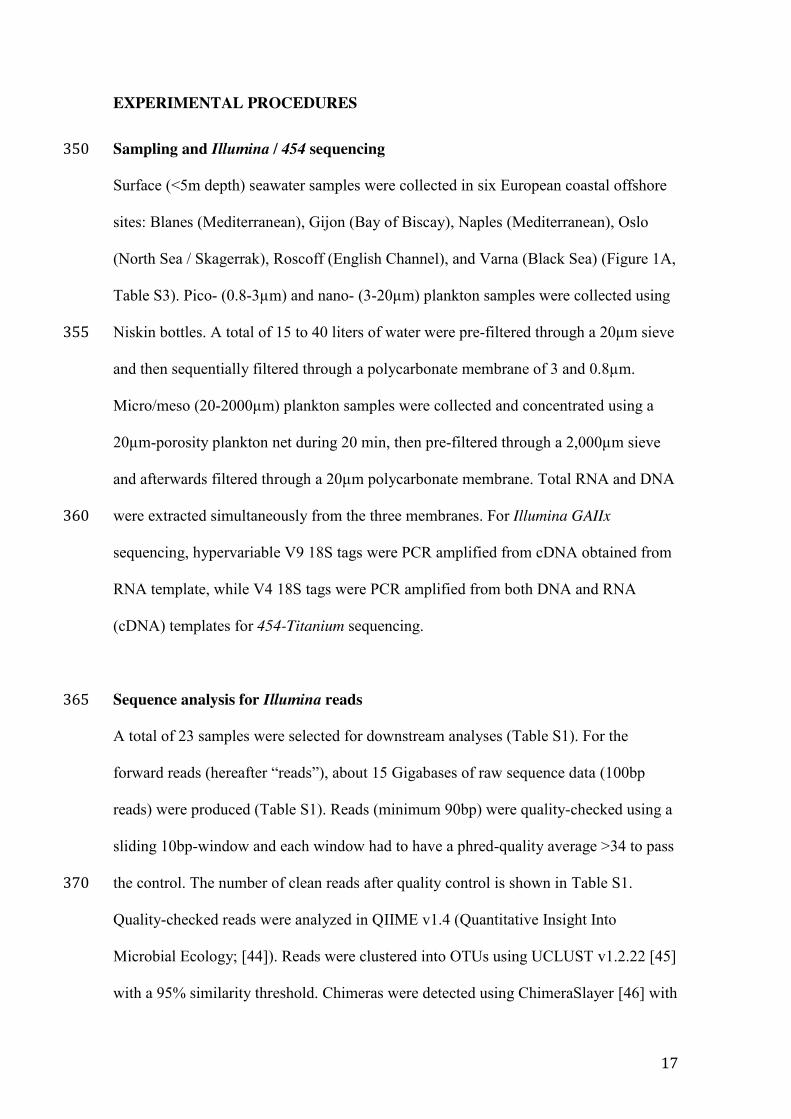
EXPERIMENTAL PROCEDURES Sampling and Illumina / 454 sequencing 350
Surface (<5m depth) seawater samples were collected in six European coastal offshore
sites: Blanes (Mediterranean), Gijon (Bay of Biscay), Naples (Mediterranean), Oslo
(North Sea / Skagerrak), Roscoff (English Channel), and Varna (Black Sea) (Figure 1A,
Table S3). Pico- (0.8-3µm) and nano- (3-20µm) plankton samples were collected using
Niskin bottles. A total of 15 to 40 liters of water were pre-filtered through a 20µm sieve 355
and then sequentially filtered through a polycarbonate membrane of 3 and 0.8µm.
Micro/meso (20-2000µm) plankton samples were collected and concentrated using a
20µm-porosity plankton net during 20 min, then pre-filtered through a 2,000µm sieve
and afterwards filtered through a 20µm polycarbonate membrane. Total RNA and DNA
were extracted simultaneously from the three membranes. For Illumina GAIIx 360
sequencing, hypervariable V9 18S tags were PCR amplified from cDNA obtained from
RNA template, while V4 18S tags were PCR amplified from both DNA and RNA
(cDNA) templates for 454-Titanium sequencing.
Sequence analysis for Illumina reads 365
A total of 23 samples were selected for downstream analyses (Table S1). For the
forward reads (hereafter “reads”), about 15 Gigabases of raw sequence data (100bp
reads) were produced (Table S1). Reads (minimum 90bp) were quality-checked using a
sliding 10bp-window and each window had to have a phred-quality average >34 to pass
the control. The number of clean reads after quality control is shown in Table S1. 370
Quality-checked reads were analyzed in QIIME v1.4 (Quantitative Insight Into
Microbial Ecology; [44]). Reads were clustered into OTUs using UCLUST v1.2.22 [45]
with a 95% similarity threshold. Chimeras were detected using ChimeraSlayer [46] with
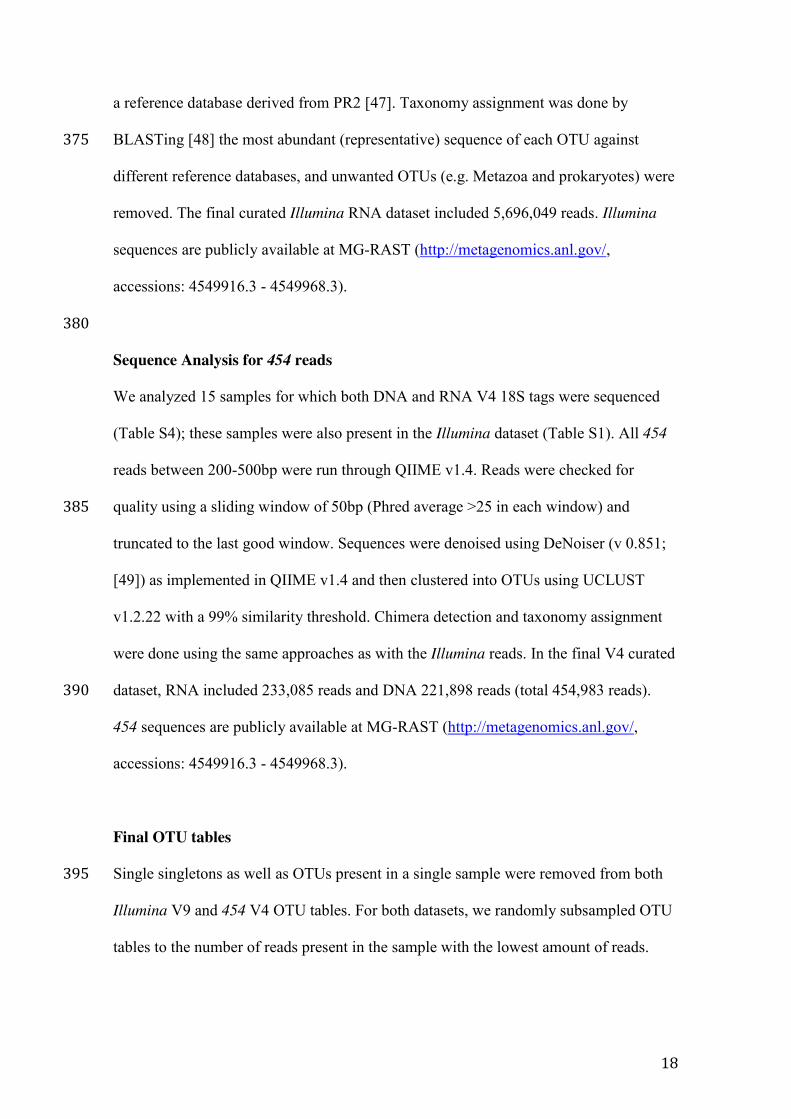
18
a reference database derived from PR2 [47]. Taxonomy assignment was done by
BLASTing [48] the most abundant (representative) sequence of each OTU against 375
different reference databases, and unwanted OTUs (e.g. Metazoa and prokaryotes) were
removed. The final curated Illumina RNA dataset included 5,696,049 reads. Illumina
sequences are publicly available at MG-RAST (http://metagenomics.anl.gov/,
accessions: 4549916.3 - 4549968.3).
380
Sequence Analysis for 454 reads
We analyzed 15 samples for which both DNA and RNA V4 18S tags were sequenced
(Table S4); these samples were also present in the Illumina dataset (Table S1). All 454
reads between 200-500bp were run through QIIME v1.4. Reads were checked for
quality using a sliding window of 50bp (Phred average >25 in each window) and 385
truncated to the last good window. Sequences were denoised using DeNoiser (v 0.851;
[49]) as implemented in QIIME v1.4 and then clustered into OTUs using UCLUST
v1.2.22 with a 99% similarity threshold. Chimera detection and taxonomy assignment
were done using the same approaches as with the Illumina reads. In the final V4 curated
dataset, RNA included 233,085 reads and DNA 221,898 reads (total 454,983 reads). 390
454 sequences are publicly available at MG-RAST (http://metagenomics.anl.gov/,
accessions: 4549916.3 - 4549968.3).
Final OTU tables
Single singletons as well as OTUs present in a single sample were removed from both 395
Illumina V9 and 454 V4 OTU tables. For both datasets, we randomly subsampled OTU
tables to the number of reads present in the sample with the lowest amount of reads.
19
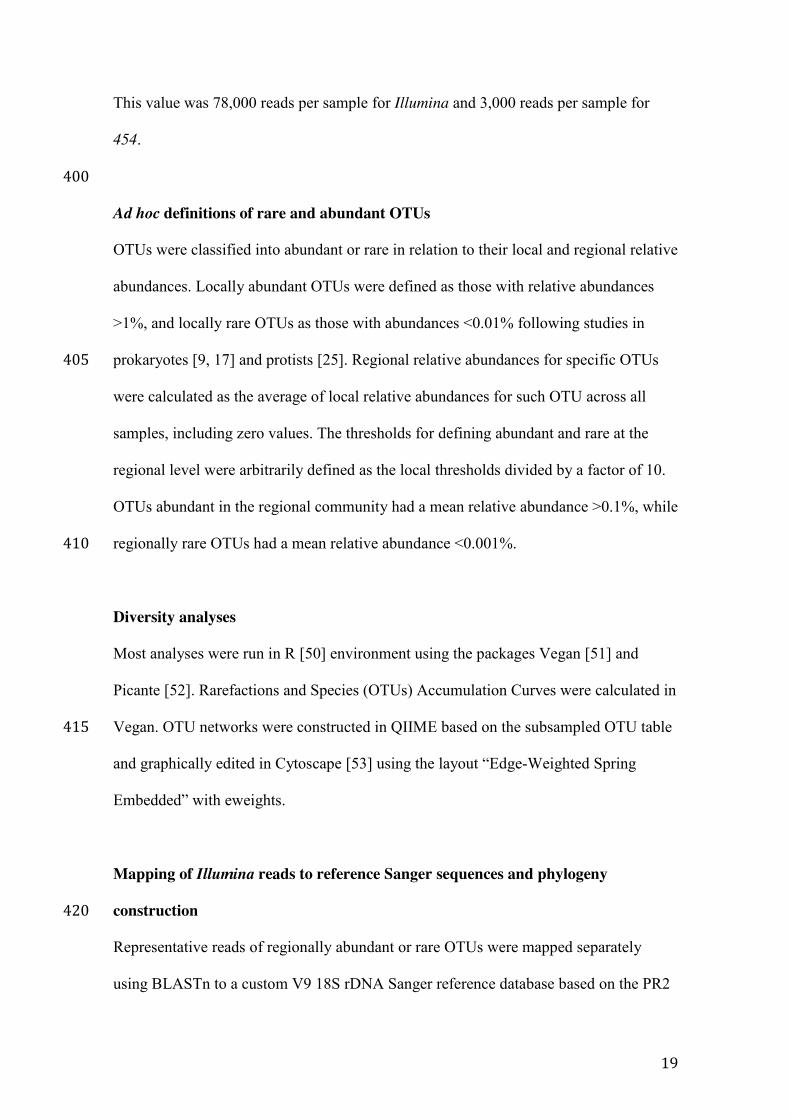
This value was 78,000 reads per sample for Illumina and 3,000 reads per sample for
454.
400
Ad hoc definitions of rare and abundant OTUs
OTUs were classified into abundant or rare in relation to their local and regional relative
abundances. Locally abundant OTUs were defined as those with relative abundances
>1%, and locally rare OTUs as those with abundances <0.01% following studies in
prokaryotes [9, 17] and protists [25]. Regional relative abundances for specific OTUs 405
were calculated as the average of local relative abundances for such OTU across all
samples, including zero values. The thresholds for defining abundant and rare at the
regional level were arbitrarily defined as the local thresholds divided by a factor of 10.
OTUs abundant in the regional community had a mean relative abundance >0.1%, while
regionally rare OTUs had a mean relative abundance <0.001%. 410
Diversity analyses
Most analyses were run in R [50] environment using the packages Vegan [51] and
Picante [52]. Rarefactions and Species (OTUs) Accumulation Curves were calculated in
Vegan. OTU networks were constructed in QIIME based on the subsampled OTU table 415
and graphically edited in Cytoscape [53] using the layout “Edge-Weighted Spring
Embedded” with eweights.
Mapping of Illumina reads to reference Sanger sequences and phylogeny
construction 420
Representative reads of regionally abundant or rare OTUs were mapped separately
using BLASTn to a custom V9 18S rDNA Sanger reference database based on the PR2
20
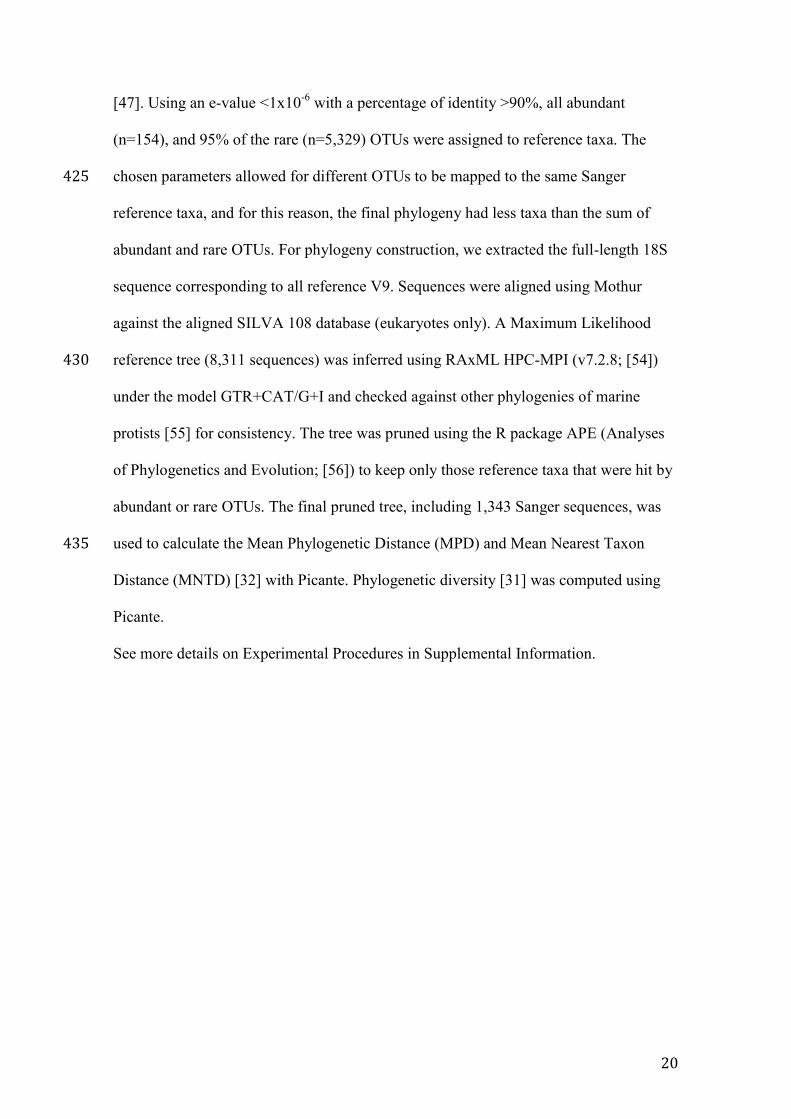
[47]. Using an e-value <1x10⁻⁶ with a percentage of identity >90%, all abundant
(n=154), and 95% of the rare (n=5,329) OTUs were assigned to reference taxa. The
chosen parameters allowed for different OTUs to be mapped to the same Sanger 425
reference taxa, and for this reason, the final phylogeny had less taxa than the sum of
abundant and rare OTUs. For phylogeny construction, we extracted the full-length 18S
sequence corresponding to all reference V9. Sequences were aligned using Mothur
against the aligned SILVA 108 database (eukaryotes only). A Maximum Likelihood
reference tree (8,311 sequences) was inferred using RAxML HPC-MPI (v7.2.8; [54]) 430
under the model GTR+CAT/G+I and checked against other phylogenies of marine
protists [55] for consistency. The tree was pruned using the R package APE (Analyses
of Phylogenetics and Evolution; [56]) to keep only those reference taxa that were hit by
abundant or rare OTUs. The final pruned tree, including 1,343 Sanger sequences, was
used to calculate the Mean Phylogenetic Distance (MPD) and Mean Nearest Taxon 435
Distance (MNTD) [32] with Picante. Phylogenetic diversity [31] was computed using
Picante.
See more details on Experimental Procedures in Supplemental Information.
21
440 ACKNOWLEDGEMENTS
We thank the BioMarKs (Biodiversity of Marine euKaryotes) consortium, which was
funded by the EU ERA-Net program BiodivERsA (2008-6530). Extra-Financial support
was provided by the Marie Curie IEF (PIEF-GA-2009-235365) and Juan de la Cierva
programmes (JCI-2010-06594) to R.L. and FLAME (CGL2010-16304, MICINN, 445
Spain) to R.M. The Barcelona Supercomputing Center (BSC) provided access to the
MareNostrum Supercomputer (grants BCV- 2011-2-0003/3-0005, 2012-1-0006/2-0002
to R.L. and R.M). We thank N. Le Bescot for assistance with Figure 1 and to the two
reviewers that helped to improve this work.
450
22
REFERENCES 1. Falkowski, P.G., Fenchel, T., and Delong, E.F. (2008). The microbial engines
that drive Earth's biogeochemical cycles. Science 320, 1034-1039. 455
2. DeLong, E.F. (2009). The microbial ocean from genomes to biomes. Nature
459, 200-206.
3. Massana, R. (2011). Eukaryotic picoplankton in surface oceans. Annual review
of microbiology 65, 91-110.
4. Caron, D., Countway, P., Jones, A., Kim, D., and Schnetzer, A. (2012). Marine 460
Protistan Diversity. Annual Review of Marine Science 4, 6.1-6.27.
5. Logares, R. (2006). Does the global microbiota consist of a few cosmopolitan
species? Ecología Austral 16, 85-90.
6. Martiny, J.B., Bohannan, B.J., Brown, J.H., Colwell, R.K., Fuhrman, J.A.,
Green, J.L., Horner-Devine, M.C., Kane, M., Krumins, J.A., Kuske, C.R., et al. 465
(2006). Microbial biogeography: putting microorganisms on the map. Nat Rev
Microbiol 4, 102-112.
7. Arrigo, K.R. (2005). Marine microorganisms and global nutrient cycles. Nature
437, 349-355.
8. Pedrós-Alió, C. (2006). Marine microbial diversity: can it be determined? 470
Trends in Microbiology 14, 257-263.
9. Pedrós-Alió, C. (2012). The rare bacterial biosphere. Annual Review of Marine
Science 4, 449-466.
10. Magurran, A.E., and McGill, B.J. (2011). Biological Diversity: Frontiers in
measurements and assessment, (Oxford University Press). 475
11. Sogin, M.L., Morrison, H.G., Huber, J.A., Mark Welch, D., Huse, S.M., Neal,
P.R., Arrieta, J.M., and Herndl, G.J. (2006). Microbial diversity in the deep sea
23
and the underexplored "rare biosphere". Proc Natl Acad Sci U S A 103, 12115-
12120.
12. Logares, R., Haverkamp, T.H., Kumar, S., Lanzen, A., Nederbragt, A.J., Quince, 480
C., and Kauserud, H. (2012). Environmental microbiology through the lens of
high-throughput DNA sequencing: Synopsis of current platforms and
bioinformatics approaches. J Microbiol Methods 91, 106-113.
13. Caron, D., and Countway, P. (2009). Hypotheses on the role of the protistan rare
biosphere in a changing world. Aquat Microb Ecol 57, 227-238. 485
14. Jones, S.E., and Lennon, J.T. (2010). Dormancy contributes to the maintenance
of microbial diversity. Proceedings of the National Academy of Sciences of the
United States of America 107, 5881-5886.
15. Campbell, B.J., Yu, L., Heidelberg, J.F., and Kirchman, D.L. (2011). Activity of
abundant and rare bacteria in a coastal ocean. Proceedings of the National 490
Academy of Sciences of the United States of America 108, 12776-12781.
16. Sjostedt, J., Koch-Schmidt, P., Pontarp, M., Canback, B., Tunlid, A., Lundberg,
P., Hagstrom, A., and Riemann, L. (2012). Recruitment of members from the
rare biosphere of marine bacterioplankton communities after an environmental
disturbance. Applied and environmental microbiology 78, 1361-1369. 495
17. Galand, P.E., Casamayor, E.O., Kirchman, D.L., and Lovejoy, C. (2009).
Ecology of the rare microbial biosphere of the Arctic Ocean. Proc Natl Acad Sci
U S A 106, 22427-22432.
18. Pester, M., Bittner, N., Deevong, P., Wagner, M., and Loy, A. (2010). A 'rare
biosphere' microorganism contributes to sulfate reduction in a peatland. ISME 500
Journal 4, 1591-1602.
24
19. Logares, R., Lindstrom, E.S., Langenheder, S., Logue, J.B., Paterson, H.,
Laybourn-Parry, J., Rengefors, K., Tranvik, L., and Bertilsson, S. (2013).
Biogeography of bacterial communities exposed to progressive long-term
environmental change. ISME J 7, 937-948. 505
20. Caron, D.A., Worden, A.Z., Countway, P.D., Demir, E., and Heidelberg, K.B.
(2009). Protists are microbes too: a perspective. The ISME journal 3, 4-12.
21. Stoeck, T., Behnke, A., Christen, R., Amaral-Zettler, L., Rodriguez-Mora, M.J.,
Chistoserdov, A., Orsi, W., and Edgcomb, V.P. (2009). Massively parallel tag
sequencing reveals the complexity of anaerobic marine protistan communities. 510
BMC Biol 7, 72.
22. Cheung, M.K., Au, C.H., Chu, K.H., Kwan, H.S., and Wong, C.K. (2010).
Composition and genetic diversity of picoeukaryotes in subtropical coastal
waters as revealed by 454 pyrosequencing. The ISME journal 4, 1053-1059.
23. Nolte, V., Pandey, R.V., Jost, S., Medinger, R., Ottenwalder, B., Boenigk, J., 515
and Schlotterer, C. (2010). Contrasting seasonal niche separation between rare
and abundant taxa conceals the extent of protist diversity. Mol Ecol 19, 2908-
2915.
24. Stoeck, T., Bass, D., Nebel, M., Christen, R., Jones, M.D., Breiner, H.W., and
Richards, T.A. (2010). Multiple marker parallel tag environmental DNA 520
sequencing reveals a highly complex eukaryotic community in marine anoxic
water. Mol Ecol 19 Suppl 1, 21-31.
25. Mangot, J.F., Domaizon, I., Taib, N., Marouni, N., Duffaud, E., Bronner, G.,
and Debroas, D. (2012). Short-term dynamics of diversity patterns: evidence of
continual reassembly within lacustrine small eukaryotes. Environ Microbiol. 525
25
26. Sieburth, J.M., Smetacek, V., and Lenz, J. (1978). Pelagic ecosystem structure:
Heterotrophic compartments of the plankton and their relationships to plankton
size fractions. Limnology and Oceanography 23, 1256-1263.
27. Kunin, V., Engelbrektson, A., Ochman, H., and Hugenholtz, P. (2010). Wrinkles
in the rare biosphere: pyrosequencing errors can lead to artificial inflation of 530
diversity estimates. Environ Microbiol 12, 118-123.
28. Magurran, A.E. (2004). Measuring Biological Diversity, (Blackwell Publishing).
29. Akaike, H. (1974). A new look at the statistical model identification. IEEE
Transactions on Automatic Control 19, 716-723.
30. Preston, F.W. (1948). The commonness, and rarity, of species. Ecology 29, 254-535
283.
31. Faith, D. (1992). Conservation evaluation and phylogenetic diversity. Biological
Conservation 61, 1-10.
32. Webb, C.O., Ackerly, D.D., McPeek, M.A., and Donoghue, M.J. (2002).
Phylogenies and Community Ecology. Annual Review of Ecology and 540
Systematics 33, 475-505.
33. Cavender-Bares, J., Kozak, K.H., Fine, P.V., and Kembel, S.W. (2009). The
merging of community ecology and phylogenetic biology. Ecology letters 12,
693-715.
34. Hutchinson, G.E., and MacArthur, R.H. (1959). A theoretical ecological model 545
of size distributions among species of animals. American Naturalist 93, 117-
125.
35. Rosenzweig, M.L. (1995). Species Diversity in Space and Time, (Cambridge:
Cambridge University Press).
26
36. Zimmermann, C.R., Fukami, T., and Drake, J.A. (2003). An experimentally-550
derived map of community assembly space. In Unifying Themes in Complex
Systems II: Proceedings of the Second International Conference on Complex
Systems, A. Minai and Y. Bar Yam, eds. (Cambridge, Massachusetts, USA:
Perseus Press).
37. Ricklefs, R.E. (1987). Community diversity: relative roles of local and regional 555
processes. Science 235, 167-171.
38. Gobet, A., Boer, S.I., Huse, S.M., van Beusekom, J.E., Quince, C., Sogin, M.L.,
Boetius, A., and Ramette, A. (2012). Diversity and dynamics of rare and of
resident bacterial populations in coastal sands. ISME J 6, 542-553.
39. Kim, D.Y., Countway, P.D., Jones, A.C., Schnetzer, A., Yamashita, W., Tung, 560
C., and Caron, D.A. (2013). Monthly to interannual variability of microbial
eukaryote assemblages at four depths in the eastern North Pacific. ISME J.
40. Hibbing, M.E., Fuqua, C., Parsek, M.R., and Peterson, S.B. (2010). Bacterial
competition: surviving and thriving in the microbial jungle. Nat Rev Microbiol
8, 15-25. 565
41. Huse, S.M., Welch, D.M., Morrison, H.G., and Sogin, M.L. (2010). Ironing out
the wrinkles in the rare biosphere through improved OTU clustering.
Environmental Microbiology 12, 1889-1898.
42. Quince, C., Lanzen, A., Davenport, R.J., and Turnbaugh, P.J. (2011). Removing
noise from pyrosequenced amplicons. Bmc Bioinformatics 12, 38. 570
43. Massana, R., and Logares, R. (2013). Eukaryotic versus prokaryotic marine
picoplankton ecology. Environ Microbiol 15, 1254-1261.
44. Caporaso, J.G., Kuczynski, J., Stombaugh, J., Bittinger, K., Bushman, F.D.,
Costello, E.K., Fierer, N., Pena, A.G., Goodrich, J.K., Gordon, J.I., et al. (2010).
27
QIIME allows analysis of high-throughput community sequencing data. Nat 575
Methods 7, 335-336.
45. Edgar, R.C. (2010). Search and clustering orders of magnitude faster than
BLAST. Bioinformatics 26, 2460-2461.
46. Haas, B.J., Gevers, D., Earl, A.M., Feldgarden, M., Ward, D.V., Giannoukos,
G., Ciulla, D., Tabbaa, D., Highlander, S.K., Sodergren, E., et al. (2011). 580
Chimeric 16S rRNA sequence formation and detection in Sanger and 454-
pyrosequenced PCR amplicons. Genome Res 21, 494-504.
47. Guillou, L., Bachar, D., Audic, S., Bass, D., Berney, C., Bittner, L., Boutte, C.,
Burgaud, G., de Vargas, C., Decelle, J., et al. (2013). The Protist Ribosomal
Reference database (PR2): a catalog of unicellular eukaryote small sub-unit 585
rRNA sequences with curated taxonomy. Nucleic Acids Res 41, D597-604.
48. Altschul, S.F., Gish, W., Miller, W., Myers, E.W., and Lipman, D.J. (1990).
Basic local alignment search tool. Journal of molecular biology 215, 403-410.
49. Reeder, J., and Knight, R. (2010). Rapidly denoising pyrosequencing amplicon
reads by exploiting rank-abundance distributions. Nature methods 7, 668-669. 590
50. R-Development-Core-Team (2008). R: A language and environment for
statistical computing., (Vienna, Austria: R Foundation for Statistical
Computing).
51. Oksanen, J., Kindt, R., Legendre, P., O'Hara, B., Simpson, G.L., Solymos, P.,
Stevens, M.H.H., and Wagner, H. (2008). vegan: Community Ecology Package. 595
R package version 1.15-0.
52. Kembel, S.W., Cowan, P.D., Helmus, M.R., Cornwell, W.K., Morlon, H.,
Ackerly, D.D., Blomberg, S.P., and Webb, C.O. (2010). Picante: R tools for
integrating phylogenies and ecology. Bioinformatics 26, 1463-1464.
28
53. Shannon, P., Markiel, A., Ozier, O., Baliga, N.S., Wang, J.T., Ramage, D., 600
Amin, N., Schwikowski, B., and Ideker, T. (2003). Cytoscape: a software
environment for integrated models of biomolecular interaction networks.
Genome Res 13, 2498-2504.
54. Stamatakis, A. (2006). RAxML-VI-HPC: Maximum likelihood-based
phylogenetic analyses with thousands of taxa and mixed models. Bioinformatics 605
22, 2688-2690.
55. Pernice, M.C., Logares, R., Guillou, L., and Massana, R. (2013). General
patterns of diversity in major marine microeukaryote lineages. PLoS One 8,
e57170.
56. Paradis, E., Claude, J., and Strimmer, K. (2004). APE: Analyses of 610
Phylogenetics and Evolution in R language. Bioinformatics 20, 289-290.
29
FIGURE LEGENDS
Figure 1. Communities displayed regularity in the proportions of locally abundant
and rare OTUs
(A) Sampled locations from the North Sea to the Black Sea.
(B) Percentage of locally abundant (>1%) and rare (<0.01%) OTUs as well as the
corresponding Illumina reads across all samples, indicating different organismal size
fractions (in μm) as well as geographic locations [in brackets] according to (A).
See also Tables S1, S2 & S3; Figures S1, S2 & S4.
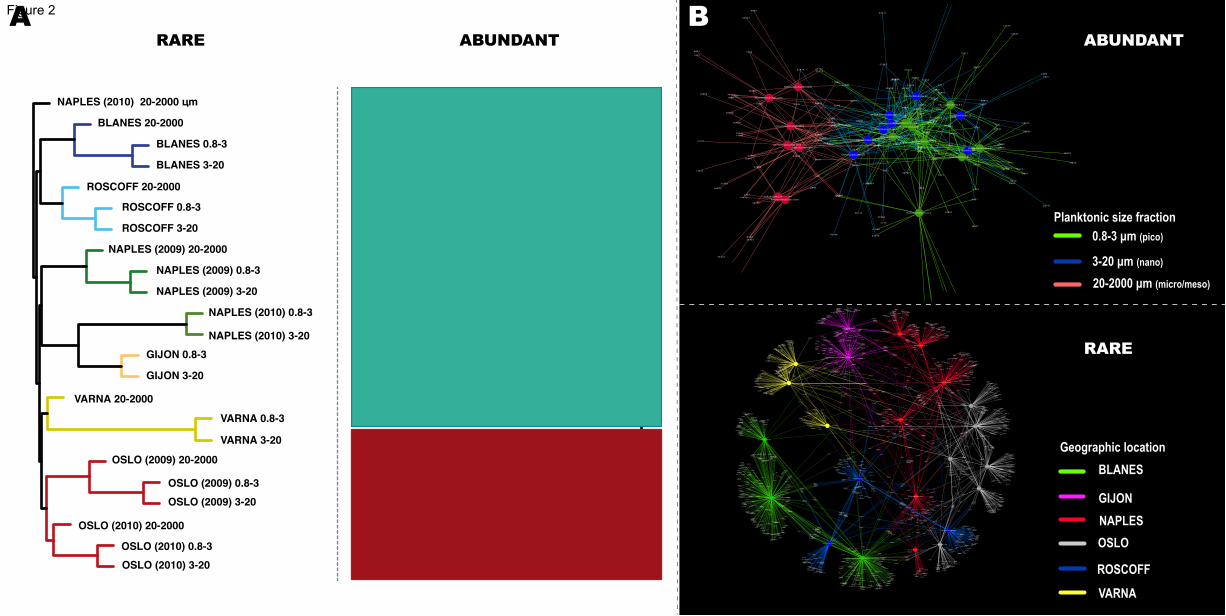
Figure 2. Contrasting structuring patterns in abundant and rare regional
communities
(A) UPGMA dendrograms based on Bray-Curtis dissimilarities between samples
(normalized dataset) for both the rare and abundant regional communities. Branch
colors indicate groups of samples originating from the same geographic site. Note that
two large clusters are present within the abundant regional community, separating the
pico- & nano- from the micro/meso-plankton.
(B) Networks representing abundant and rare regional communities. Larger nodes
(circles) represent samples, while smaller nodes represent OTUs that may connect (that
is, may be present in) different samples through edges (lines). The most relevant
structuring features for both the abundant and rare regional communities were mapped
onto the networks with colors. These were organismal size-fraction (abundant) and
geographic origin (rare).
30
Figure 3. Locally abundant OTUs (>1%) tended to be abundant in a single sample
(A-C) Abundance across samples/sites of OTUs that were locally abundant in at least
one sample, separated by size fractions. Heatmaps (left) indicate whether OTUs
(vertical lines) were abundant (>1%; black), rare (<0.01% white) or had intermediate
(grey) abundances in specific samples/locations. Histograms on the right indicate the
number of samples in which OTUs were abundant in each dataset.
Figure 4. Phylogenetic patterns in the abundant and rare regional communities
(A) Maximum Likelihood phylogenetic tree based on reference Sanger 18S sequences
(n=1,343) representing regionally abundant and rare OTUs (each branch of the tree
derives from a reference sequence that represents an OTU). Red indicates sequences
representing regionally abundant OTUs only, black points to sequences representing
regionally rare OTUs exclusively, and green indicates sequences representing both
regionally abundant and rare OTUs. The symbol “*” indicates some groups that were
formed entirely by rare OTUs.
(B) Rarefaction analysis of Faith’s Phylogenetic Diversity considering abundant and
rare OTUs in the regional community.
(C) Mean Phylogenetic Distance (MPD) and Mean Nearest Taxon Distance (MNTD)
estimates based on the phylogeny shown in (A). MPDobserved: observed MPD values;
MPDnull: MPD values obtained from a null model. MPDz: standardized effect size of
MPD = (MPDobserved-MPDnull model)/sd(MPDnull model); p = p-value. The same parameters
are shown for the MNTD. Negative MPDz & MNTDz values with p<0.05 indicate
phylogenetic over-clustering.
31
Note that in (B) & (C), sequences that represented both abundant and rare OTUs
(“shared”) were considered within both the abundant and rare datasets.
Figure 5. Abundance of OTUs in the regional community according to rDNA and
rRNA
(A) Average relative abundance of individual OTUs (dots) according to rRNA and
rDNA. The abundance thresholds for abundant (>0.1%) and rare (<0.001%) are
indicated with vertical and horizontal lines. The top-right grey corner indicates OTUs
that were both abundant in RNA and DNA, while the bottom-left green corner indicates
OTUs that were rare in both RNA and DNA. The yellow section indicates OTUs that
were rare according to DNA and not rare according to RNA; the light blue section
indicates the opposite. The best fitting linear regression is indicated, which was virtually
identical to the 1:1 line.
(B) OTU rank-abundance curve based on rDNA (blue line) and the corresponding
abundance for each OTU according to rRNA (red dots). Abundant (>0.1%) and rare (<
0.001%) thresholds are indicated with vertical lines. OTUs disproportionately over- or
underrepresented in RNA in comparison to DNA are indicated in the yellow and grey
areas respectively.
See also Table S4.
0.1
1.0
10.0
100.0
Bla
ne
s [
4]
Gijo
n [
3]
Nap
les (
200
9)
[5]
Nap
les (
201
0)
[5]
Oslo
(200
9)
[1]
Oslo
(201
0)
[1]
Ro
sco
ff [
2]
Varn
a [
6]
Bla
ne
s [
4]
Gijo
n [
3]
Nap
les (
200
9)
[5]
Nap
les (
201
0)
[5]
Oslo
(200
9)
[1]
Oslo
(201
0)
[1]
Ro
sc
off
[2
]
Va
rna
[6
]
Bla
ne
s [
4]
Nap
les (
200
9)
[5]
Nap
les (
201
0)
[5]
Oslo
(200
9)
[1]
Oslo
(201
0)
[1]
Ro
sco
ff [
2]
Varn
a [
6]
Perc
enta
ge
Samples
Rare OTUs
Rare reads
Abundant OTUs
Abundant reads
1 North Sea / Skagerrak (Oslo)
2 English Channel (Roscoff)
3 Bay of Biscay (Gijon)
4 Mediterranean 1 (Blanes)
5 Mediterranean 2 (Naples)
6 Black Sea (Varna)
A
B
0.8-3 µm 3-20 µm 20-2000 µm
)LJXUH��
NAPLES (2009) 0.8-3 Ǐm
NAPLES (2009) 3-20
BLANES 0.8-3
BLANES 3-20
OSLO (2010) 0.8-3
ROSCOFF 0.8-3
GIJON 3-20
GIJON 0.8-3
NAPLES (2010) 0.8-3
NAPLES (2010) 3-20
OSLO 2010 3-20
OSLO (2009) 0.8-3
OSLO (2009) 3-20
ROSCOFF 3-20
VARNA 0.8-3
VARNA 3-20
VARNA 20-2000
OSLO (2010) 20-2000
BLANES 20-2000
ROSCOFF 20-2000
OSLO (2009) 20-2000
NAPLES (2009) 20-2000
NAPLES (2010) 20-2000
NAPLES (2010) 20-2000 Ǐm
BLANES 20-2000
BLANES 0.8-3
BLANES 3-20
ROSCOFF 20-2000
ROSCOFF 0.8-3
ROSCOFF 3-20
NAPLES (2009) 20-2000
NAPLES (2009) 0.8-3
NAPLES (2009) 3-20
NAPLES (2010) 0.8-3
NAPLES (2010) 3-20
GIJON 0.8-3
GIJON 3-20
VARNA 20-2000
VARNA 0.8-3
VARNA 3-20
OSLO (2009) 20-2000
OSLO (2009) 0.8-3
OSLO (2009) 3-20
OSLO (2010) 20-2000
OSLO (2010) 0.8-3
OSLO (2010) 3-20
RARE ABUNDANT
20-2
000 Ǐ
m0.8
-3 /
3-2
0 Ǐ
m
2 7 1 7 2
1 7 9 9 6
4 0 0 2 0
3 1 2 6 2
2 8 5 7 22 1 2 6 3
2 5 2 4 33 0 1 1 6
4 2 4 2 5
3 8 0 4 2
2 3 7 5 6
2 0 2 5 2
2 5 1 2 6
2 9 6 3 0
2 5 4 0 1
2 6 1 6 4 8 1 0
1 6 4 61 7 8 2 4
4 2 7 4 1
OSL09cDNASUR0.8.3
ROS10cDNASUR3.20
OSL09cDNASUR3.20
BCN10cDNASUR3.20
1 5 3 3 2
3 0 7 8 4
1 2 9 7 9
3 6 2 6 1
VAR10cDNASUR3.20
1 1 5 5 5
4 7 1 1
3 2 6 4 2
1 3 3 5 3
2 0 3 9 2
3 4 1 4 0
3 9 7 0 2
2 3 0 1 8
1 4 8 5 7
OSL10cDNASUR3.20
4 2 2 8 6
ROS10cDNASUR0.8.3
1 0 9 6 0
1 9 3 5 4VAR10cDNASUR0.8.3
2 7 8 8 2
BCN10cDNASUR0.8.3
1 2 8 2 0
1 1 7 5 1
9 2 1 9
5 0 7 2
3 5 6 2 4
2 6 4 4 3
2 6 5 32 8 7 9 4
9 0 7 4
4 2 3 9
3 7 2 1 44 3 4 2 9
4 1 6 9 8
3 2 7 6 7
9 9 4 7
7 8 9 2
5 1 1 8
2 4 9 1 5
4 1 9 3 6
4 2 0 9 8
3 8 6 0 7
2 8 1 4 0 NAP09cDNASUR0.8.3
1 6 6 8 7
3 7 9 9 8
2 3 4 0 41 5 7 7 4
1 4 4 8 8
6 6 6 91 1 2 4 7
2 5 7 9 7
2 8 1 5 3
6 7 6 81 3 1 4 1
2 2 1 3 7
1 5 0 9 4
1 4 9 8
1 8 8 8 7
4 7 3 4 1 5 9 2 0
1 8 1 2 4
6 4 2 9
NAP10cDNASUR3.203 4 4 8
1 8 2 0 0
2 7 8 5 5
3 3 9 7 1
2 0 1 7 43 2 9 1 4
6 7 9 3
NAP10cDNASUR0.8.3
GIJ10cDNASUR0.8.3
1 2 8 9 1
1 2 6 1 5
1 9 8 5 4
2 0 8 9 6
1 3 2 7 0
7 4 9 8
7 4 3 1
2 0 6 9 0
6 9 4 7
1 9 0 7 5
3 4 4 4 1
3 5 9 0 4
4 1 8 48 4 2
GIJ10cDNASUR3.20
2 7 0 1
OSL10cDNASUR0.8.3
3 2 7 3 4
7 4 4 1
3 0 5 0 6
1 4 9 9 33 6 5 1 1
1 6 9 7
3 6 2 8 9
3 7 5 4 9
3 5 2 1 8
4 0 8 1 3
1 9 4 7 2
5 3 3 7
4 2 3 7 2
1 5 3 4 1
3 5 9 2 5
VAR10cDNASUR20.2000
NAP10cDNASUR20.2000
4 1 6 7 6
3 6 4 2 7
3 1 0 3 7
6 9 8 2
3 3 5 1 7
1 7 6 7 1
6 7 4 6
NAP09cDNASUR3.20
3 5 3 3 4
3 3 1 9 2
1 3 2 2
6 8 4 3
OSL10cDNASUR20.2000
1 4 6 7 3
2 3 7 5 2
1 2 5 8 5
3 8 0 9 5
7 6 0 2
3 2 8 4 3
2 1 9 7 8
3 5 9 1 5
1 4 0 8 6
ROS10cDNASUR20.2000
OSL09cDNASUR20.2000
NAP09cDNASUR20.2000
BCN10cDNASUR20.2000
2 5 6 2 2
3 2 9 7 4
2 2 1 8
1 6 2 2
8 8 5 1
1 0 1 7 1
1 9 3 1 4
1 6 3 7 6
1475 3 4 0 9 7 42 7 7 7 9 3 3 3 1 63 6 9 6 63 1 7 6 33 0 5 9 03 9 2 2 3 0 8 3 24 0 1 9 9
2 8 4 3 0
4 1 0 5 8 3 0 9 4 83 3 5 3 91 8 3 4 0 1 6 8 0 94 6 2 62 5 5 4 2
3 5 4 6 91 7 6 9 91 1 7 0 3
2 9 5 8 2
3 2 1 5 2
4 1 2 2 1NAP09cDNASUR3.20
4 5 9 7
2 6 9 5 8 3 1 7 0 9
6 4 4 1
8 5 4 6
4 3 4 5 31 2 6 6 7
2 0 7 2 51 1 2 6 4
2 1 52 4 4 0 7
9 4 1 9
2 0 7 6 7
3 9 3 4 51 8 2 2 4 2 8 0 9 9
2 0 1 8 9
7 4 7 7
2 4 5 26 5 6 6
3 4 2 3 5
6 8 2 5
8 3 7 01 9 3 0
1 5 7 7
2 6 7 0
1 8 6 3 8
7 4 7 1
2 1 0 2 0
1 2 5 9 9
2 6 1 3
1 3 8 6 0
VAR10cDNASUR20.20008 7 2 1
1 6 1 9 0
1 4 8 9 6
3 3 4 6 0
2 4 2 7 82 9 1 0
5 7 4 1
1 5 6 1 41 5 4 0 4
1 3 4 8 7
3 7 7 2 3
9 7 5 0
3 9 9 8 9
2 1 8 2 4
3 3 4 0 41 5 9 0 82 7 8 9 8
2 4 1 9 3
3 6 1 3 7
2 7 3 9 49 0 2 9
3 6 4 0 6
2 9 7 0 12 9 5 6 8
2 2 6 0 0
4 1 2 8 8
4 0 9 4 6
3 8 1 6 8
3 4 7 9 6
7 8 7
3 8 5 1 5
4 1 6 9 7
1 6 9 7 0
4 2 5 4 2
2 6 2 7 8
6 5 5 6
3 7 3 0 9
3 5 1 9 9
3 3 9 1
4 3 0 8 12 9 2 1 3
1 6 4 4 3
1 8 9 7 9
1 6 2 2 2
7 5 9 6
2 1 1 4 0
6 2 8 2
1 4 7 0 9
9 8 6 4
3 6 4 9 3
8 8 7 6
3 8 0 1 7
2 4 0 5 5
3 2 0 7 0
4 3 0 3 6
3 3 4 0 9
4 2 0 3
2 0 0 0 8
2 2 7 7 8
5 5 8 7
4 2 2 1 2
2 7 0 0 6
3 6 0 7 4
1 4 1 1 2
6 2 2 0
2 4 8 2 1
1 7 7 5 31 8 3 4 62 7 2 8 2
3 3 9 2
4 2 4 8 72 0 8 7 2
3 5 0 8 4
3 3 1 1 2
2 0 0 7 7
2 1 9 1 3
3 9 4 0
2 3 7 0 8
2 7 7 1 3
OSL09cDNASUR0.8.3
1 3 4 3 7
2 8 2 7 8
1 8 3 6 7
1 6 1 8 5
4 1 9 2 24 0 8 8 7
6 4 6 9
3 4 7 5 8
3 8 3 7 8
NAP09cDNASUR20.2000
3 3 9 4 5
1 8 9 9
1 4 6 2 4
3 6 0 2 4
3 6 6 7 9
3 1 6 6 8
1 4 9 5 3
1 7 4 5 6
3 7 3 1 7
3 0 0 8 7
3 4 7 0
2 7 3 8
OSL10cDNASUR0.8.3
1 0 1 3 9
3 1 2 8
1 3 6 5 4
1 0 7 8 8
9 4 2 8
1 7 3 5 7
1 4 3 4 1
3 4 9 3 9
1 8 5 52 2 9 63 0 2 2 3
2 4 1 5 6
1 5 9 3 2
4 8 1 4
2 3 8 5 1
3 8 9 1 4
2 2 7 8 4
4 1 6 8
OSL10cDNASUR3.20
3 5 6 5 3
4 1 0 2 2
3 5 2 9 1
3 8 9 6 61 9 0 1 2
6 0 1 43 0 1 8 0
6 0 64 7 3 1
3 2 4 7
1 3 6 5 7
8 5 7 3
4 1 1 2 6
1 9 6 9 8
1 3 3 9
3 3 2 4 6
3 5 5 4 3
6 4 4 2
1 4 1 6 2
8 0 6 47 4 3 2
3 2 0 6 3
4 0 4 4 6
1 6 0 4 9
1 3 2 1 7
1 8 3 2 5
3 5 8 9 13 9 3 9 5
1 0 3 1 8
7 4 4 0
3 4 8 73 4 7 6 6
1 8 2 4 3
2 9 2 2 8
2 8 9 6
6 5 2 4
3 7 9 3 1
5 3 41 7 0 4 2
1 5 0 7 7
2 9 9 4 2
3 3 5 3 14 8 8 8
2 4 6 1 2
3 6 1 03 6 2 2 0
1 3 9 2 9
3 2 1 2 22 4 4 0 22 7 2 7 2
1 0 9 12 7 0 7 54 2 9 0 4
1 5 2 5 62 2 1 1 3
1 3 8 2 9
4 2 8 8 6
4 6 5 5
2 6 3 5 5
2 1 3 3 1
1 3 9 0 34 2 8 7 2
4 2 4
1 9 6 02 7 6 9 01 6 1 9 72 4 6 0 8
7 9 7 83 7 2 0 33 5 8 1 61 6 3 4 6
2 5 0 9 5
2 2 8 2 93 6 7 7
3 8 7 6 2
5 8 8 0
2 2 4 1 46 8 7 0
2 5 7 8 8
2 0 0 1 9
1 7 3 1 7
4 2 2 9 4
5 3 8 4
6 6 5 83 1 4 3 3 1 9 8 7 43 4 5 2 41 5 7 9
1 5 3 5 0
4 0 3 5 65 4 8 4
3 5 1 2
2 4 2 7 2
2 8 3 4 1
3 6 8 6 4
3 6 1 3 6
3 2 8 9 8
3 3 5 9 6
3 5 2 7 3
5 4 6
2 9 1 0 06 6 6 0
3 7 3 1 61 5 0 4 6
4 0 6 1 1
1 3 8 4 41 3 6 4 73 3 3 5 0
4 0 6 8 12 7 3 5 2
2 1 5 1 8
1 6 0 7 9
1 5 2 9 6
BCN10cDNASUR0.8.3
3 3 4 8
3 2 7 9 0 9 7 4 4
1 5 1 9 1
3 4 3 6 7
5 3 4 7
1 0 3 0 4
1 5 5 8 4
4 1 2 1 1
1 0 9 5 8
1 7 7 4 3
5 8 5 8
3 8 3 8 5
2 1 5 0 8
3 0 2 2 6
1 8 4 4 1 2 8 9 3 44 8 0 5
1 6 2 4 62 6 9 0 03 8 4 2 94 1 6 6 1
2 4 4 8 5
1 8 3 1 2 2 7 37 5 5 6
3 7 9 1 0
2 5 1 0 2
2 5 4 8 3
1 1 6 5 3
1 8 8 3 7
3 6 6 0 3
8 9 0 4
2 6 8 0 8
3 4 2 8 51 1 8 7 02 9 1 8 9
6 2 1 8
3 5 5 0 4
3 0 5 3 3 2 9 1 4 5
1 4 7 7 9
7 2 7 2
4 2 0 1 51 2 2 7 73 7 4 8 5
OSL09cDNASUR20.2000
3 8 5
8 4 5 0
3 8 2 9 2
1 0 8 3 5
2 5 0 7 5
1 9 0 8 24 2 1 4 8
2 1 2 1 1
4 7 2 51 2 0 8 3 2 2 1 4
3 7 7 3 3
3 7 3 4 5
2 5 5 1
4 1 8 0 1
3 5 1 9 1
1 3 0 8 3
2 5 1 7 1
6 0 2 3
4 9 1 5
2 8 7 3 9
1 3 2 4 7
2 3 0 3 1
3 6 6 8 8
2 0 7 8 2
4 2 8 0 5
2 4 8 8 5
2 6 6 7 7
3 9 6 9 61 6 2 7 0
3 2 3 6 5
2 4 1 7 7
6 9 0 6
3 8 6 1 62 3 7 5 4
2 6 4 0 3
1 4 7 3 03 4 2 9 9
1 8 3 7
2 7 7 0 1
2 7 1 0 5
3 8 4 8 1
1 0 8 9 8
3 1 0 8 9
2 6 7 4 2
3 9 3 8 1
1 8 8 5 6
2 7 9 2 9
3 6 5 3 6
2 2 9 1 9
5 7 0 7
ROS10cDNASUR3.20
3 9 0 0 7
5 8 4 6
3 3 2 9 7
1 7 3 4 0
1 7 0 8 8
4 6 0
3 4 2 9 43 6 1 0 41 1 4 0 8
4 2 0 2 24 0 7 2 2
1 0 0 7 41 1 5 7 7
1 4 6 1 3
1 3 6 6 5
3 4 4 2 6
3 6 1 2 9
2 2 4 1 7
1 0 6 7 1
4 1 0 4 27 2 8 8
1 8 7 4 1
1 0 0 2 1
1 8 6 4 6
3 9 4 0 2
1 0 5 4 9
1 9 3 7 9
4 6 6 5
8 1 9 4
3 6 5 2 9
1 3 6 7 7
2 1 7 9 6
4 8 4 7
2 8 2 8 1
3 8 9 2 43 6 3 2 0
1 8 5 6 5
1 6 2 4 2
2 8 6 8 0
1 3 3 3 62 9 5 5 2
3 3 5 8 2
1 7 7 8 4
3 0 6 3 7
1 3 8 1 8
4 0 2 8 7
6 8 3 5
1 8 9 1 73 3 8 5 4
2 7 8 9 1
3 3 1 3 31 6 4 4 1
3 7 6 8 91 8 4 3 3
8 5 4 53 4 2 1 2
2 7 8 0 1
6 6 4 8
3 5 2 5 31 5 0 2 8
5 7 0 3
2 7 7 3 02 1 8 8 2
4 2 6 7 12 7 3 8 8
4 1 8 8 82 6 1 6 3
2 7 4 7 51 4 0 2 7
3 7 6 6 93 9 0 1 2
1 9 2 2 4
2 5 5 4 0
3 4 4 2 8
1 1 7 6 52 7 7 0 6
1 1 3 1 3
3 4 3 9 8
7 6 7 1
3 5 1 6 0
4 7 3 0
2 0 7 2 3
1 0 0 3 0
2 2 2 3 3
1 5 2 9 8
7 8 6 2
6 0 5 4
3 2 7 2 0
6 8 8 2
4 6 6 6
4 0 9 9 0
1 9 8 2 21 1 4 2
3 7 0 1 11 7 3 5 9
2 6 3 5 93 3 4 1 9
1 8 0 7 74
3 3 9 4 9
3 9 6 1 33 8 8 4 9
3 3 9 3 8
1 2 0 2 79 0 8 4
2 0 1 3 9
2 2 1 3 91 2 7 7 02 8 4 6 1
3 0 8 4 9
1 4 3 0 4
2 9 1 2 62 2 9 9 8
2 2 6 73 0 9 1 2
2 8 7 3 23 4 5 2 7
2 9 8 7 2
1 4 0 0
2 4 5 7 11 2 1 8 3
3 7 3 3 7
5 0 9
5 1 9 5
3 7 8 2 2
2 6 2 9 4
1 7 0 6 9
1 8 6 9 2
2 1 5 4 46 6 74 2 5 3 7
1 9 3 3 32 1 3 7 9
7 3 0 9
4 0 1 2 6
3 0 5 6 1
2 4 8 4 1
1 1 9 8
2 1 9 4 6
3 2 0 8 14 1 7 1 6 2 7 5 3 9
1 4 2 3 01 0 5 7 6
3 4 6 4 5
2 7 9 7 5
3 0 5 4 1
3 1 9 9 2
2 6 7 9
1 3 0 9 44 2 2 7 9
5 8 1 7
3 7 2 1 8
2 0 3 5 4
1 6 4 8 8
2 8 9 9 2
1 9 8 7 11 1 6 3 0
7 3 5 3
3 8 2 9 8
3 8 4 9 6
4 1 0 0
1 6 0 6 5
3 7 1 9 2
3 8 1 9 0
1 9 7 3 31 4 4 92 1 7 7 5
1 1 3 5 82 2 8 7 1
1 6 9 8 8
3 2 7 7 0
1 5 6 3 3
2 7 5 1 6 4 3 1 0 54 0 7 1
NAP09cDNASUR0.8.3
3 1 4 0 9
3 5 1 3 21 7 5 1 2
5 4 6 6
6 1 4 4
6 4 5 0
1 5 3 9 6
2 3 7 9 0
3 4 0 9 4
2 2 3 9 3
2 8 8 6 2
1 9 4 2 2
3 4 5 3 7
1 3 8 6 8
2 6 7 7 9
8 5 0 3
2 9 3 7 6
6 9 6 9
9 3 6 43 4 2 1 1
9 3 2 2
1 2 5 8 9
1 1 1 1 2
2 2 7 1 35 5 6 3
1 8 7 2 2
2 4 6 1 2 3 5 7 3
1 4 6 7 7
2 8 4 6 2
2 0 3 2 91 2 9 0 7
2 7 4 9 7
4 6 0 3
1 6 2 4 3
2 6 9 3 0
2 2 1 4 42 2 9 4 2
1 8 7 7 4
1 4 5 3 2
2 2 8 3 7
4 2 6 0 3
NAP10cDNASUR3.20
3 3 8 0 9
2 5 2 6 6
1 2 0 4 22 3 1 2 1
1 0 9 8 3
3 2 2 2 7
1 4 8 5
3 1 9 4
3 1 6 4 0
7 6 9 9
7 9 8 62 3 1 4 4
7 3 0 1
1 1 4 6 4
1 9 9 3
9 6 9 0
3 7 6 9 5
1 6 3 4 7
1 3 6 2 2
1 4 7 7 3
3 4 8 3 8
2 8 3 2 44 9 3 44 2 1 7 1
3 5 2 4 4
3 6 9 4 6
3 4 5 7 4
2 3 0 6 2
1 0 4 2 0
9 4 8 8
2 8 2 8 7
6 0 6 93 4 8 6 74 8 9 8
3 7 7 7 6
3 7 4 6 8
2 7 1 9 21 0 0 0 8
2 9 5 9 4
3 6 3 7 9
3 5 9 1 82 4 0 1 17 2 1 0
1 7 3 9 3
1 0 5 3 22 8 1 1
1 1 4 9 3
2 1 6 4 3
7 1 6 0
5 8 5 1
1 8 7 2 8
NAP10cDNASUR0.8.3
3 7 9 5 1
2 3 5 3 8
2 5 4 0 81 9 3 5 7
2 9 2 6 81 7 3 9 5
1 0 6 2 02 1 3 5 13 3 3 5 8
2 0 8 8
2 4 4 6 02 5 4 9
3 3 5 0 8
2 1 1 6 9
8 6 9 1
2 4 2 3 2
1 3 4 1
3 7 4 9 11 8 7 9 91 4 5 7 5
4 2 8 6 0
4 9 9 6
1 8 5 0 0
3 9 3 2 6
3 7 8 9 8
3 8 0 1 1
2 6 4 8
4 4 6
1 3 9 4 3
4 2 2 9 26 4 8 8
3 5 3 6 62 3 3 4 0
1 1 0 2 91 4 5 2 2
1 7 6 3
6 4 1 6
1 9 7 9 0
4 1 9 7
1 6 3 9 5
4 3 0 2 9
2 9 9 3 7
2 5 1 3 8
3 5 4 0
8 51 8 7 4 5
1 2 7 6
2 0 8 5 0
2 6 1 7 71 5 3 1 1
1 0 9 7 8
3 92 4 9 5 7
2 2 3 7 7
3 3 2 2 04 1 2 5 2
1 4 7 4 0
1 8 9 4
1 9 0 3 6
4 2 1 3 2
4 1 2 3 1
2 8 3 7 1
2 1 6 4 8
2 3 0 8 9
GIJ10cDNASUR3.20
2 3 5 3 0
1 7 5 7 0
8 4 4 4
2 1 5 2 3
1 3 7 6 5
4 0 5 6 7
1 2 5 9 3
1 5 1 4 3
3 4 1 3 33 6 9 6 5
3 2 7 6 01 8 9
2 8 4 1 7
3 7 6 0 9
2 8 4 9 5
3 0 9 5 7
1 7 5 3 4
2 2 1 7 74 4 1 4
3 1 0 5 7
1 4 5 5 8
7 8 6 1
1 5 4 3 8
2 1 8 7 2
3 7 8 4 11 3 9 0 5
4 1 2 6 9
2 0 8 9 7
1 9 3 9 2
3 7 4 6 4
4 0 6 6 5
3 6 4 9 4
3 1 4 2 2
2 2 8 7 5
1 8 5 1 8
1 9 6 7 61 5 8 4 5
6 6 9 5
4 1 1 5 3
2 0 5 3 9
1 7 2 5 1
3 4 3 6 5
3 4 3 4 9
6 7 6 7
1 7 2 0 1
2 3 8 5 5
6 0 4
4 3 2 8 2
GIJ10cDNASUR0.8.33 5 6 1 0
1 6 2 4 0
1 6 4 9 3
1 8 2 5 9
1 0 2 9 6
3 0 0 3 1
3 0 0 4 93 1 3 5
2 9 9 1 1
4 2 9 5 8
1 0 6 6 0
1 5 9 9 5
9 5 2 21 7 4 9 51 9 7 0 0
3 1 2 7 82 6 0 4 8
4 1 7 8 71 4 4 2 6
2 8 3 9 1
5 4 8
1 7 7 2 8
1 0 9 7 7
3 1 4 3 6
1 8 4 7 3
3 6 5 9 7
2 0 1 4 3
VAR10cDNASUR0.8.3
3 2 9 71 7 0 2 0
1 2 0 3 1
2 5 0 9 3
1 4 5 5 5
6 7 4 2
2 4 4 0 5
1 5 8 8 33 8 3 5 9
3 2 9 8 9
9 4 5 6
3 2 6 8 04 0 5 8 7
2 0 1 0 9
4 3 2 5 3
3 7 4 9 4
3 5 3 5 1
3 3 0 2
2 3 6 9 6
4 2 7 4 9
2 8 4 0 7
7 6 7
2 1 4 0 4
1 9 2 2
2 5 9 6
VAR10cDNASUR3.20
3 9 3 7 1
2 7 4 2 9
3 7 9 5 9
2 1 2 4 7
7 9 5 22 6 6 7 34 6 9 5
7 0 2 1
3 5 7 3 6
3 1 7 71 3 7 0
3 0 3 8 41 8 5 7 21 6 4 0 4
3 8 5 6 8
4 0 9 2 2
3 5 0 5 32 4 2 8 42 7 3 0 8
3 0 5 54 0 2 4 5
2 3 0 3 35 5 6 6
2 9 9
4 6 7 0
2 7 3 7 9
1 0 4 2 6
3 5 4 1 9
7 1 3 3
3 1 3 6 2
6 7 9 6
4 2 0 3 82 9 0 7 3
2 5 8 4 3
2 4 1 1 61 1 0 6 71 0 4 6 81 9 7 2 0
3 2 9 3 3
3 8 4 79 3 0 1
4 2 7
2 6 2 3 6
2 2 1 9 5
3 6 5 5 32 4 6 3 42 3 9 4
9 5 5
2 5 5 1 3
9 4 3 1
4 5 6 6
4 1 4 9 1
7 8 2 1
1 2 3 2 7
1 1 6 4 3
3 4 9 1 48 2 6 2
4 0 2 2 5
2 4 5 3 3
2 2 6 1 7
3 8 5 3 4
2 5 0 9 83 2 5 4 2
3 3 6 4 11 2 5 4
7 1 6 4
4 0 3 0 9
1 0 6 0 3
3 4 2 4 1
2 8 3 7 4
3 4 7 2 72 9 8 5 4
1 5 7 5 3
2 8 2 4 69 9 7 5
1 4 9 6 4
5 7 1 8
3 8 7 0 0
3 5 2 2 6
5 5 3 4
1 3 6 6 3
6 6 2 27 3 2 2
5 8 0 3
1 3 3 9 03 8 4 3 13 0 4 7 8
6 3 01 0 1 7 0
1 5 4 8 3
3 5 1 6 3
1 7 8 1 92 2 8 7 8
4 2 0 7 2
3 7 1 8 1
2 9 3 0 22 5 4 7 12 8 1 0 62 5 9 7 4
9 3 3 53 5 2 1 7
2 5 3 6 5
2 3 6 7 48 4 8 2
7 4 0 3
3 9 7 2 33 7 1 2 1
1 4 2 1 03 1 7 3 3
3 6 8 9
3 2 7 34 6 0 0
3 7 0 0 9
2 0 3 1 82 6 3 2 1
9 6 2 49 6 9 11 2 9 4 6
2 6 2 4 0
4 1 3 0 4 3 6 8 8 73 4 9 1 1
6 1 9 4
8 2 1 7
2 5 5 6 9
1 4 2 0 92 2 5 5 0
8 2 2 03 4 7 5 01 6 6 0 8
3 0 9 9 73 9 3 6 6
3 4 9 4 22 1 9 2 1
5 8 4 9
4 1 3 8 5 1 7 9 8 5
2 3 8 4 1
9 1 6 9
9 6 4 94 1 0 4 1
3 3 6 3 3
3 2 8 0 1
8 0 1 0
1 2 9 7 01 9 8 8
7 6 6 2
3 8 8 4 6
3 1 7 2
4 4 9 5
8 5 7 0
2 0 4 1 3
1 2 0 6 0
1 3 3 1 7
5 3 9 2
2 4 5 6 8
1 5 2 5 1
2 4 9 9 6
1 7 6 9 6
OSL09cDNASUR3.20
2 0 3 8 97 5 4 0
3 2 9 3 0
4 2 7 1 6
2 0 3 8 8
2 5 6 9 1
4 1 0 5 2 2 2 8 6 5
3 8 7 0 1 1 2 5 1 2
1 4 6 1 8
2 2 8 2 3
2 8 8 1
1 4 1 1 8
2 8 6 2 6
1 3 0 9 89 0 4 2
3 2 3 7 2
3 2 4 5 03 5 5 1 3
3 7 7 2 7
4 1 6 5
2 2 0 9 3
3 9 6 1 6
6 7 2 9
1 0 2 7 0
2 5 7 7 4
3 3 0 8 6
3 7 6 8 4
2 5 1 9 24 2 5 6 2
3 2 6 4 56 7 7 9
5 8 8 8
9 5 4 33 5 7 7 2
3 3 0 2 9
1 8 5 9 2
1 9 9 6 0
1 6 9 5 01 7 2 3 17 6 8 6
1 0 6 1 0
3 4 1 8 53 8 6 8 2
2 3 6 1
4 2 4 9 3
2 1 9 3 61 5 3 9
3 5 7 72 6 0 9 4
2 8 1 9 8
1 0 0 5 3
3 3 8 5 5
6 7 4 31 9 3 0 8
2 3 6 2 8
3 1 1 8 8
3 5 4 8 5
1 8 3 4 1
2 9 7 1 7 2 2 1 3 5
4 0 4 5 3
3 1 4 8 6
3 8 9 1 6
3 9 9 0 91 4 7 9 8
1 6 8 2 8
3 8 2 6 34 1 8 1 2
1 4 2 7 7
1 2 7 6 65 0 8 9
3 9 1 5 7 3 4 1 8 28 2 1 5
4 0 7 9 3
1 3 7 5 9
2 4 7 0 9
4 2 9 0 1
5 7 9 7
1 2 4 2 6
1 6 0 5 1
1 2 6 2 3
6 5 5 3 1 5 0 4
4 0 6 5 31 2 5 11 5 1 5 7
3 6 2 7 5
2 5 1 4 6
4 0 1 6
9 1 4 93 1 9 7 3
3 8 3 1 7
3 4 9 4 35 1 7 7
3 3 5 1 2
1 0 5 1 6
3 9 5 0 7
2 6 6 5 4
4 3 0 1 0
3 9 8 6 2
7 3 1 0
4 5 2 4
1 8 6 8 1
1 9 0 8 6
1 0 0 6 2
1 7 4 6 6
3 3 5 7 7
2 3 9 9 45 7 4 4
3 6 7
3 4 3 2 73 5 3 5 91 9 5 8 2
2 7 8 3 2
ROS10cDNASUR0.8.3
1 3 7 0 52 1 0 0 8
3 4 1 7 9
2 4 3 2 6
1 6 9 0 02 9 4 5 4 9 7 8
3 0 3 7 56 7 7 4
2 5 4 5 43 7 1 8 5
3 2 0 1 53 0 7 6 1
1 9 6 1 0
2 0 0 1 6
7 9 3 7
1 7 6 2 97 8 6 5
2 8 7 3 72 8 5 1
1 9 4 6 5
8 5 2 02 1 5 1 31 5 8 1 61 7 2 1 1
4 1 5 6 4
1 5 6 9 03 5 3 2 8
3 0 3 7 0
1 4 2 5 7
3 4 5 1 41 5 8 9 1
3 9 0 3 0
2 4 9 3 3
4 0 2 0 3
3 8 9
4 4 9 91 3 4 3 0
5 0 5 14 2 5 9 5
4 1 8 1 3
1 5 4 6
1 5 3 3 93 4 1 4 2
2 0 7 1 0
3 7 4 2 7
2 4 7 7
2 2 9 6 8
4 3 0 2 1
3 5 3 0 0
1 9 9 6 1
NAP10cDNASUR20.2000
2 5 5 7 6
OSL10cDNASUR20.2000
1 6 7 4 9
2 5 8 6 6
3 8 8 0 5
3 5 1 4
2 9 4 5 1
2 5 8 6 5
ROS10cDNASUR20.2000
2 2 1 4 8
7 0 7 9
2 5 5 3 8
2 3 9 7 3
9 2 4 9
5 3 0 61 6 6 1 9
3 9 5 0 4
2 8 8 9 35 2 8 3
9 1 5 21 5 1 4 5
4 6 5 6
1 3 0 51 1 4 3 2
2 7 9 9 2
3 4 8 7 4
3 2 3 9 7
1 6 2 6 9
2 9 4 4 3
1 8 8 03 7 2 6 42 3 5 5 0
3 3 7
1 3 3 2 0
3 7 5 5 8
3 9 2 1
2 0 5 5 82 5 9 4 4
5 9 5 9
1 0 9 8 27 8 0 3
2 9 5 3 5
3 6 7 7 3
1 5 9 3 6
4 0 6 1 7
3 8 9 3 8
1 1 1 7 0
8 5 4 9
4 2 3 9 5
3 1 5 7
2 6 2 4 62 4 7 6 4
3 7 9 2 4
4 2 3 8 1
3 3 9 9 9
3 0 9 7 0
2 6 9 3
3 1 6 17 5 6 7
2 0 6 4 8
3 0 5 7 4
4 2 6 2 5
2 9 3 1 0
3 5 4 7 13 9 6 3 22 8 6 6 0
2 0 4 4 4
3 9 0 9 9
1 0 8 5 3
6 6 0 7
3 4 4 0 8
8 5 7 2
3 7 0 0
7 9 3 9
2 6 8 1 21 9 7 0 4
3 9 1 9 9
1 0 3 5 4
1 6 2 6 22 5 7 1 5
3 4 5 6 53 1 8 5 4
6 2 5 7
1 1 1 8 1
3 8 8 2 83 2 5 9
1 8 3 7 7
3 9 6 6 9
3 7 5 2 0
2 0 1 7 84 1 1 3
4 7 8 92 3 6 6 0
3 8 8 6 21 8 2 7 9
1 6 7 1 1
4 0 9 2 1
9 0 4 37 8 1 92 8 4 3 1
1 5 0 0 9
4 2 9 0 32 3 0 5 8
4 2 3 4 96 2 9 0
1 4 2 4 32 3 9 1 1
8 7 5 9
3 9 1 1 93 7 8 4 33 9 2 5 1
9 5 0 71 0 8 9 2
8 0 3 1
1 9 0 5
3 5 1
3 7 8 8 7
2 2 2 6 4
7 5 0 7
3 0 2 9 82 8 1 1 6
3 8 7 8 8
1 1 4 5 52 0 8 4 5
5 8 8 1
1 3 9 8 64 9 9 3
3 7 9 8 4
2 1 2 4 2
1 8
3 9 1 2 1
3 3 6 2
1 9 2 9 94 3 1 1 42 7 1 1 9
3 0 1 5 9
1 2 8 9 6
3 1 8 4 0
1 4 4 8 9
3 4 4 1 9
6 9 8 4
1 2 9 2 92 5 1 3 2
3 0 7 2 44 7 8 31 9 2 3 7
1 8 2 2 73 2 7 9 7
3 2 1 6 6
2 8 3 5 8
1 8 3 2 9
2 3 1 1 2
3 1 9 5 37 6 1 4
3 8 6 6 6
3 0 9 4 62 2 5 6 3
4 0 2 2 03 4 5 0 9
8 2 3 3
1 4 9 5 2
4 1 2 7 0
2 1 2 1 9
4 2 5 8 6
2 5 7 6 0
5 8 4 29 9 8 1
2 8 7 0 06 5 9 0
3 6 9 6 9
2 6 0 0 4
3 6 2 1 2
2 6 4 0 0
3 7 3 7 21 3 5 8 3
1 4 2 8 62 2 0 7 71 4 1 58 8 5 6
3 7 2 8 3
3 8 0 8 31 1 5 1 8
2 3 7 9
1 8 0 9 5
1 7 2 0 9
1 6 1 0 0
5 4 2 8
4 1 9 7 2
2 1 1 3 8
2 2 1 7 2
1 7 3 5
3 1 2 1 1
4 0 0 6
4 2 4 0 61 9 9 2 0
3 6 9 1 9
4 1 1 8 5
4 2 3 5 03 8 9 9 5
2 9 5 0 2
2 9 1 4 7
4 2 4 6 8
1 4 1 08
2 3 5 6 6
1 7 2 4
3 2 1 7 7
1 2 2 4 7
1 9 0 3 7
3 0 2 7 93 7 0 2 8
3 3 8 6 6
3 7 0 2 6
6 1 3 42 4 3 7 2
4 2 5 6 4
2 8 5 4 8
1 9 5 3 6
3 4 5 2 3
2 7 4 7 3
1 1 1 2 63 9 3 8 5
1 1 2 4 3
4 9 0 0
3 8 5 2 8
3 6 4 6 6
4 3 2 8 7
2 6 7 6 1
4 3 1 4 6
2 2 2 5 21 4 9 3 9
2 2 0 0 23 6 7 7 5
2 7 3 3 11 8 9 1 3
7 8 4 4
3 6 3 6 7
2 5 7 3 1
6 2 0 9
2 5 3 0 6
3 4 8 4 4
1 9 3 3 8
1 7 2 5 9
8 5 4 7
4 1 8 6 4
3 6 2 1 1
2 0 9 7 4
5 1 3 4
2 5 7 7 1
6 9 4 5
1 5 1 1 5
7 6 1 0
4 2 9 4 4
7 3 5 8
3 8 2 6 4
3 6 3 8 6
2 9 1 6 2
3 1 4 1 9
4 0 5 8 8
3 2 2 4 32 8 6 9 72 6 7 7 2
2 2 9 4 1
3 9 1 6 3
1 1 1 0 3
6 2 5 2
2 3 3 4 3
2 1 3 8 4
2 9 6 4 0
3 0 3 1
4 0 0 6 01 4 0 4 9
3 9 5 2 47 4 4 2
2 0 5 5 26 6 9
6 8 4 1
1 6 2 9 2
3 4 0 6 4
7 5 4 32 6 0 1 4
2 0 9 3 4
1 6 3 3 5
1 8 2 4 9
1 0 7 4 5
1 4 3 0 3
8 8 1 8
2 4 0 1 91 4 7 8 92 8 4 9 93 4 5 9 1
4 3 3 7 88 5 9 02 9 8 1 1
3 8 8 1 0
3 6 5 3 0
7 9 0 2
3 5 6 9
3 8 8 2 5
6 4 7 84 3 1 5 3
3 4 0 3 6
3 2 9 0 8
4 3 1 2 7
3 7 5 0 9
3 2 9 3 5
2 3 6 9 3
3 9 6 5 4
2 2 8 4 73 0 5 4 2
4 0 9 92 8 0 2 1
4 2 8 4 5
2 1 2 5 9
3 5 3 5 8
3 7 1 1 42 3 2 8 5
2 7 8 0 0
1 5 6 8 3
3 1 0 81 6 4 8
1 7 4 5 9
2 8 2 2 6
3 4 8 0 04 0 7 3 2
2 4 8 1 9
3 2 4 1
2 9 2 7 4
3 1 1 1 4 2 8 0 1 3
4 0 8 9 2
3 1 2 5 1
3 7 9 6 0
1 0 5 7 92 5 6 3 1
2 3 6 4 6
1 2 8 5 4
3 1 6 4 7
1 7 2 9 13 5 3 6 1
2 6 2 5 9
3 4 6 9 9
2 4 7 3 7
3 9 7 0 0
3 3 9 8 7
2 8 1 4 73 5 9 7 7
4 0 1 2 2
5 7 4 6
8 0 6 6
1 5 1 8 5
2 6 9 8 11 7 0 2 3
2 8 0 0 04 5 0 0
1 5 3 1 8
1 3 6 9 9
1 0 3 0 7
1 2 8 4 4
4 2 6 0 0
BCN10cDNASUR3.20
1 1 7 9 93 3 2 2 5
1 1 1 8 7
8 7 9 0
2 6 9 9 43 5 9 5 4
3 0 4 0 4
2 3 8 6 81 9 0 5 2
1 2 1 3 8
3 7 1 7
2 3 8 9 73 4 0 2 54 1 1 6 51 2 2 8 08 7 1 52 8 4 1 5
5 1 1 32 9 7 62 4 5 7 02 8 9 4 7
1 1 3 5 73 6 6 8 9
2 1 2
2 4 6 4 1
2 2 6 6 1
1 9 7 7 8
1 7 2 3 3
2 5 5 6 6
1 2 8 7 2
2 2 3 0 2
1 8 5 0 73 1 9 4 1
3 9 6 6 41 0 2 8 2
4 4 3 75 8 5 33 4 7 4 8
1 3 1 9 3
4 9 0 2
1 1 7 2 8
2 2 5 0 64 0 5 5 61 9 6 8 32 9 0 3 7
3 8 6 7 4
2 7 9 7 9
BCN10cDNASUR20.2000
2 7 3 2
1 5 3 1 9
3 4 7 9 8
ABUNDANT
RARE
A B
������ȞP�(pico)
�����ȞP�(nano)
��������ȞP��PLFUR�PHVR�
BLANES
GIJON
NAPLES
OSLO
ROSCOFF
VARNA
3ODQNWRQLF�VL]H�IUDFWLRQ
*HRJUDSKLF�ORFDWLRQ
)LJXUH��
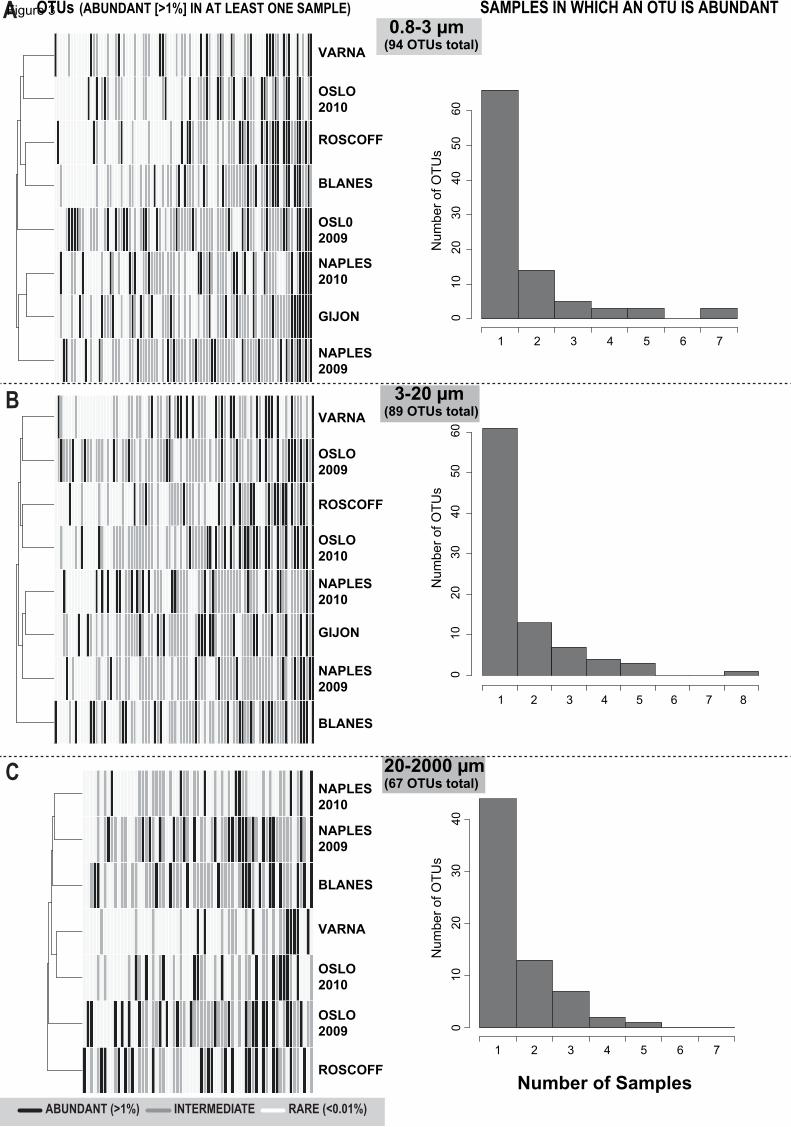
NAPLES
2009
GIJON
NAPLES
2010
OSL0
2009
BLANES
ROSCOFF
OSLO
2010
VARNA
SAMPLES IN WHICH AN OTU IS ABUNDANT
Num
ber
of
OT
Us
1 2 3 4 5 6 7
01
02
03
04
05
06
0
BLANES
NAPLES
2009
GIJON
NAPLES
2010
OSLO
2010
ROSCOFF
OSLO
2009
VARNA
Num
ber
of O
TU
s
8
010
20
30
40
50
60
ROSCOFF
OSLO
2009
OSLO
2010
VARNA
BLANES
NAPLES
2009
NAPLES
2010
Number of Samples
Num
ber
of O
TU
s
1 2 3 4 5 6 7
010
20
30
40
0.8-3 µm (94 OTUs total)
3-20 µm (89 OTUs total)
20-2000 µm (67 OTUs total)
OTUs (ABUNDANT [>1%] IN AT LEAST ONE SAMPLE)
ABUNDANT (>1%) INTERMEDIATE RARE (<0.01%)
A
B
C
1 2 3 4 5 6 7
)LJXUH��
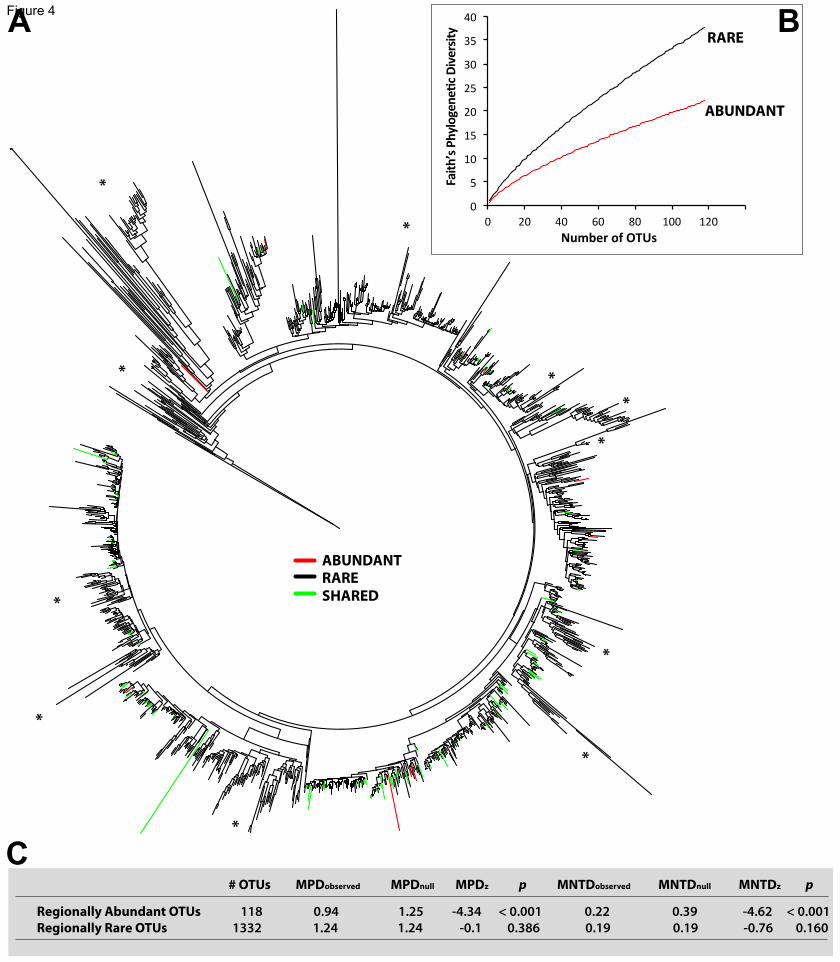
*
*
*
**
*
*
*
*
*
ABUNDANTRARESHARED
0
5
10
15
20
25
30
35
40
0 20 40 60 80 100 120
&ĂŝƚŚ
Ɛ�WŚLJůŽŐĞŶĞ
ƟĐ��ŝǀĞƌƐŝƚLJ
EƵŵďĞƌ�ŽĨ�KdhƐ
ABUNDANT
RAREA B
# OTUs MPDobserved MPDnull MPDz p MNTDobserved MNTDnull MNTDz p
Regionally Abundant OTUs 118 0.94 1.25 -4.34 < 0.001 0.22 0.39 -4.62 < 0.001 Regionally Rare OTUs 1332 1.24 1.24 -0.1 0.386 0.19 0.19 -0.76 0.160
C*
)LJXUH��
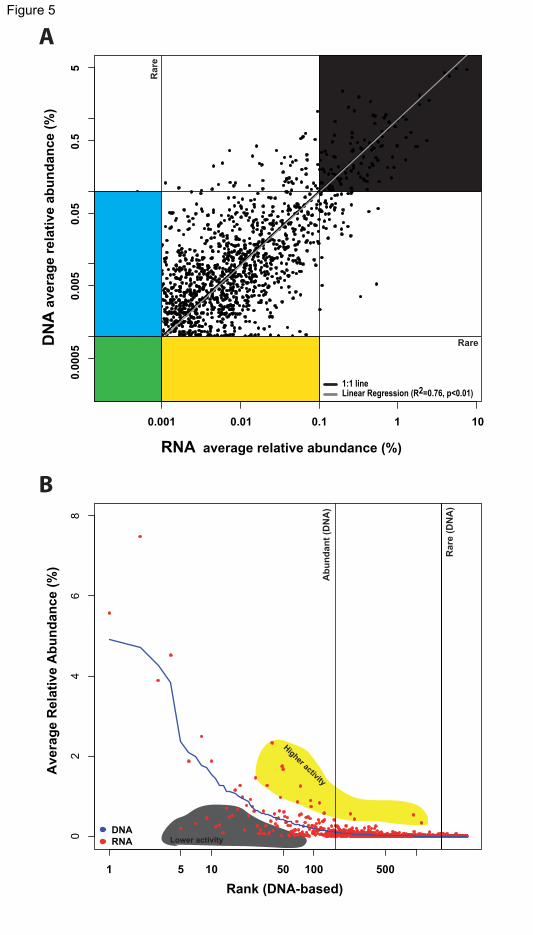
0.001 0.01 0.1 1 10
0.0
00
50
.00
50
.05
0.5
5
RNA average relative abundance (%)
DN
A a
verag
e r
ela
tive a
bu
nd
an
ce (
%)
1:1 lineLinear Regression (R2=0.76, p<0.01)
1 5 10 50 100 500
02
46
8
Rank (DNA-based)
Averag
e R
ela
tive A
bu
nd
an
ce (
%)
DNA
RNA
A
B
Abundant
Rare
Ra
re
Ab
un
da
nt
Ab
un
dan
t (D
NA
)
Rare (
DN
A)
Lower activity
Hig
her a
ctiv
ity
)LJXUH��
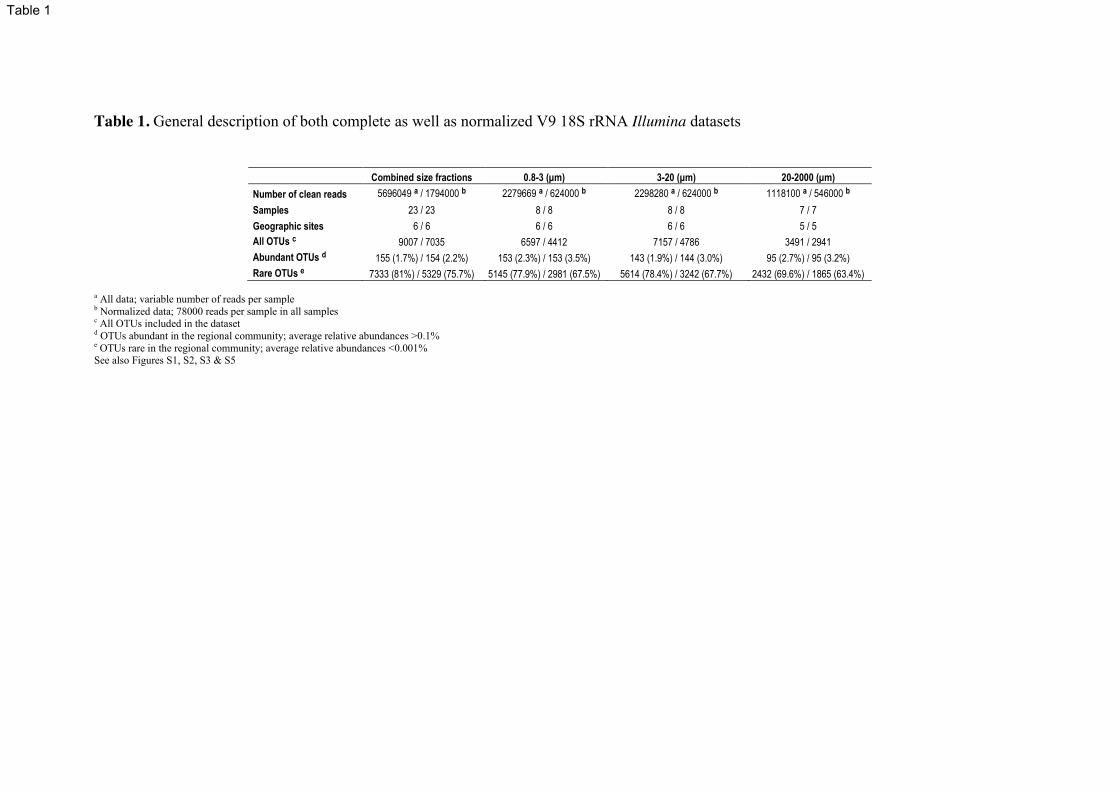
Table 1. General description of both complete as well as normalized V9 18S rRNA Illumina datasets
Combined size fractions 0.8-3 (μm) 3-20 (μm) 20-2000 (μm) Number of clean reads 5696049 a / 1794000 b 2279669 a / 624000 b 2298280 a / 624000 b 1118100 a / 546000 b Samples 23 / 23 8 / 8 8 / 8 7 / 7 Geographic sites 6 / 6 6 / 6 6 / 6 5 / 5 All OTUs c 9007 / 7035 6597 / 4412 7157 / 4786 3491 / 2941 Abundant OTUs d 155 (1.7%) / 154 (2.2%) 153 (2.3%) / 153 (3.5%) 143 (1.9%) / 144 (3.0%) 95 (2.7%) / 95 (3.2%) Rare OTUs e 7333 (81%) / 5329 (75.7%) 5145 (77.9%) / 2981 (67.5%) 5614 (78.4%) / 3242 (67.7%) 2432 (69.6%) / 1865 (63.4%)
a All data; variable number of reads per sample b Normalized data; 78000 reads per sample in all samples c All OTUs included in the dataset d OTUs abundant in the regional community; average relative abundances >0.1% e OTUs rare in the regional community; average relative abundances <0.001% See also Figures S1, S2, S3 & S5
7DEOH��
Inventory of Supplemental Information SUPPLEMENTAL DATA Supplemental Figures Figure S1: Distribution of all OTUs as well as regionally abundant and rare OTUs
across the different organismal size fractions. Related to Figure 1, Table 1 & Experimental Procedures.
Figure S2: Rarefaction curves pointing to richness saturation. Related to Figure 1 &
Table 1. Figure S3: Regional Species (OTUs) Abundance Distributions (SADs) with different
SAD models fitted, as well as regional SADs for the different organismal size fractions. Related to Table 1.
Figure S4: Species (OTUs) Abundance Distributions (SADs) with different SAD
models fitted for each individual sample. Related to Figure 1. Figure S5: Regional community data fitted to the Preston log-normal model and the
associated calculation of the “veiled” OTUs. Related to Table 1. Supplemental Tables Table S1: General description of the community sequencing approach (using Illumina
V9 18S rRNA) and the obtained OTUs (95 % clustering). Related to Figure 1 and Experimental Procedures.
Table S2: Comparison between 95% and 97% OTU clustering thresholds for the Illumina dataset. Related to Figure 1 and Results.
Table S3: Description of the sampling sites. Related to Figure 1 and Experimental
Procedures. Table S4: Description of samples where both the rDNA and rRNA were sequenced
using 454. Related to Figure 5 and Experimental Procedures. SUPPLEMENTAL EXPERIMENTAL PROCEDURES Supplemental information on sampling, molecular methods and data analyses. SUPPLEMENTAL REFERENCES Includes all references mentioned in the Supplemental Information section.
,QYHQWRU\�RI�6XSSOHPHQWDO�,QIRUPDWLRQ
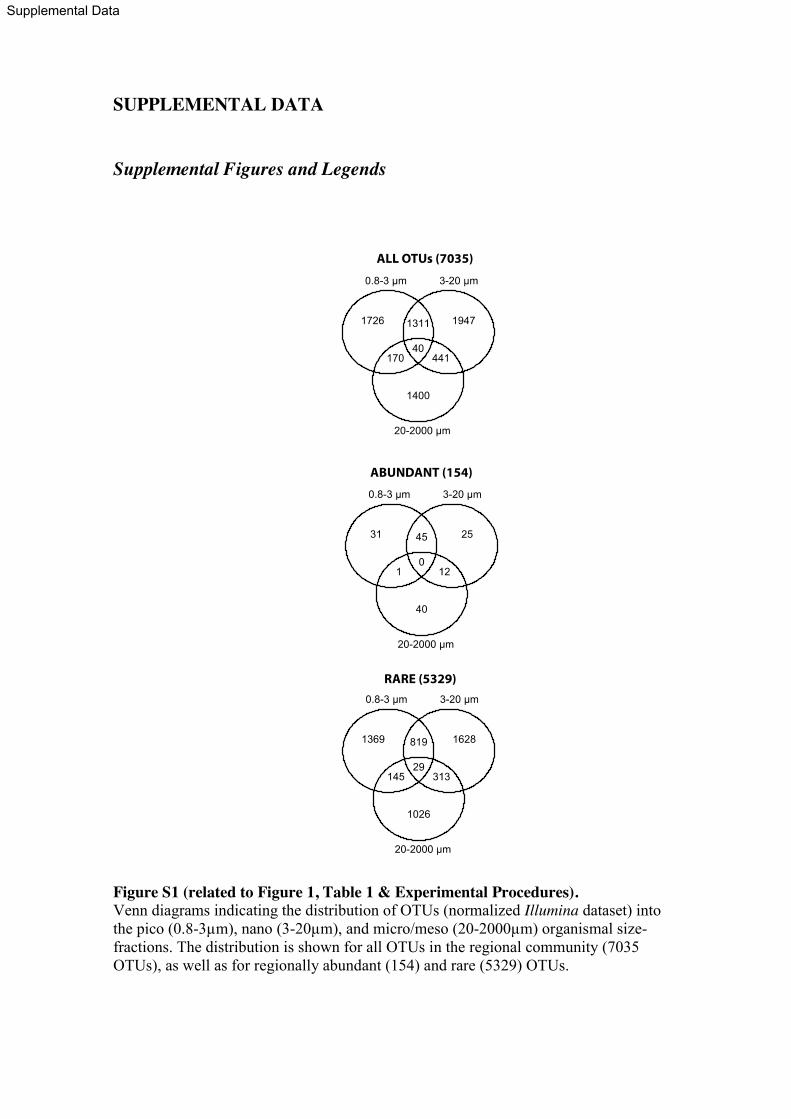
SUPPLEMENTAL DATA Supplemental Figures and Legends
Figure S1 (related to Figure 1, Table 1 & Experimental Procedures). Venn diagrams indicating the distribution of OTUs (normalized Illumina dataset) into the pico (0.8-3µm), nano (3-20µm), and micro/meso (20-2000µm) organismal size-fractions. The distribution is shown for all OTUs in the regional community (7035 OTUs), as well as for regionally abundant (154) and rare (5329) OTUs.
6XSSOHPHQWDO�'DWD
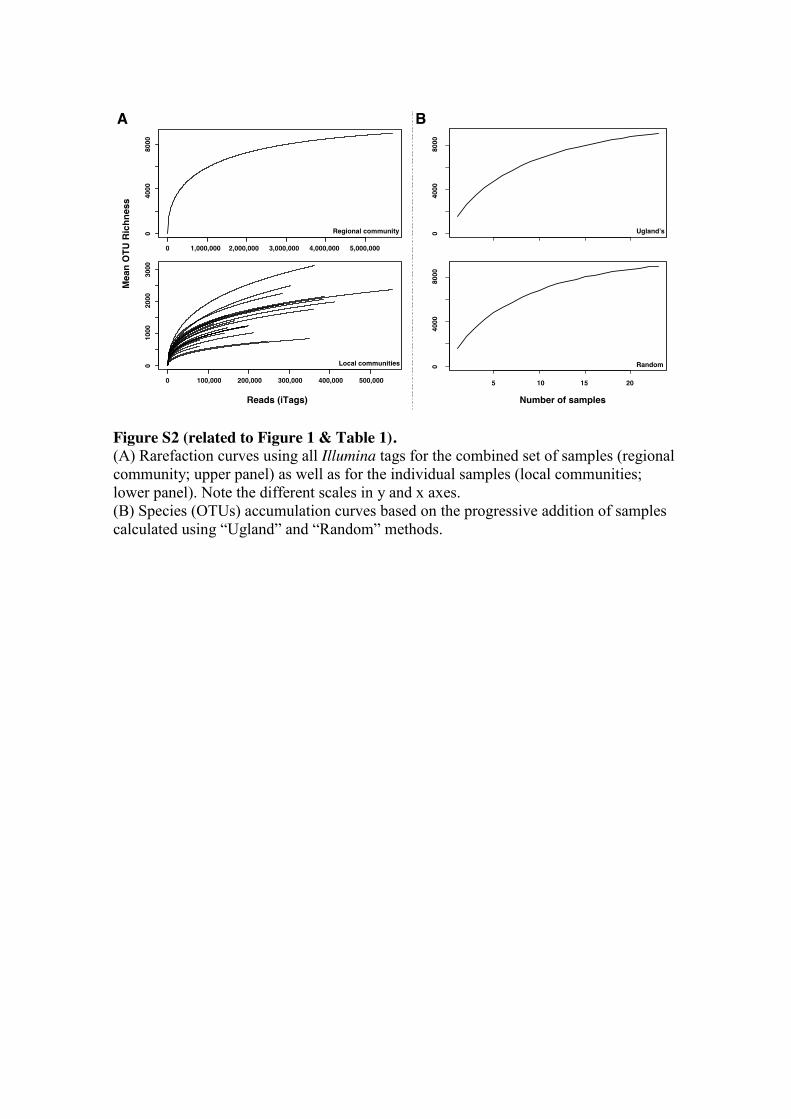
Figure S2 (related to Figure 1 & Table 1). (A) Rarefaction curves using all Illumina tags for the combined set of samples (regional community; upper panel) as well as for the individual samples (local communities; lower panel). Note the different scales in y and x axes. (B) Species (OTUs) accumulation curves based on the progressive addition of samples calculated using “Ugland” and “Random” methods.
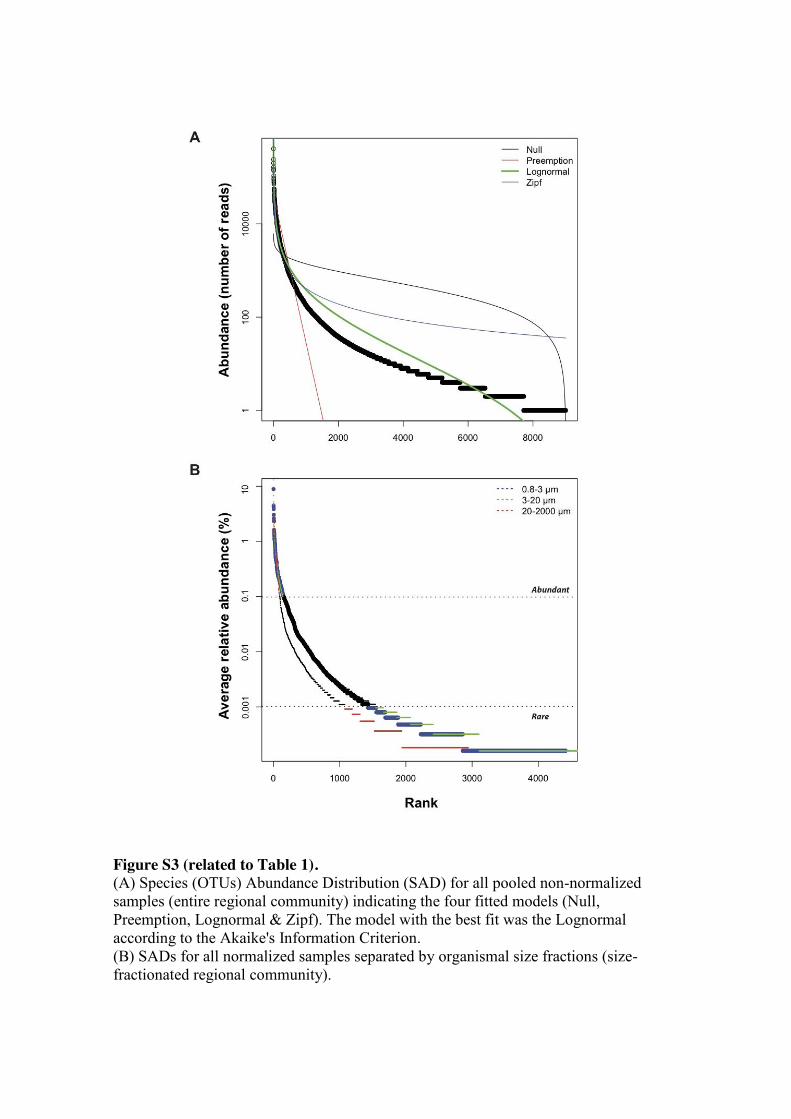
Figure S3 (related to Table 1). (A) Species (OTUs) Abundance Distribution (SAD) for all pooled non-normalized samples (entire regional community) indicating the four fitted models (Null, Preemption, Lognormal & Zipf). The model with the best fit was the Lognormal according to the Akaike's Information Criterion. (B) SADs for all normalized samples separated by organismal size fractions (size-fractionated regional community).
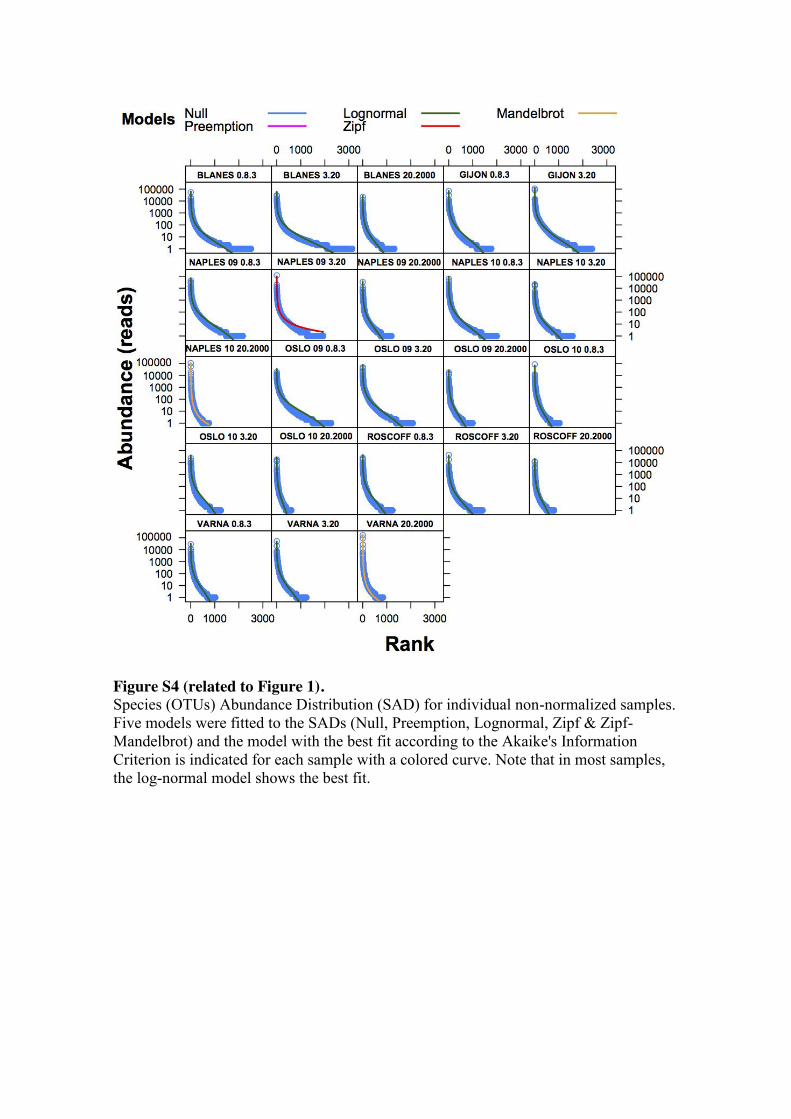
Figure S4 (related to Figure 1). Species (OTUs) Abundance Distribution (SAD) for individual non-normalized samples. Five models were fitted to the SADs (Null, Preemption, Lognormal, Zipf & Zipf-Mandelbrot) and the model with the best fit according to the Akaike's Information Criterion is indicated for each sample with a colored curve. Note that in most samples, the log-normal model shows the best fit.
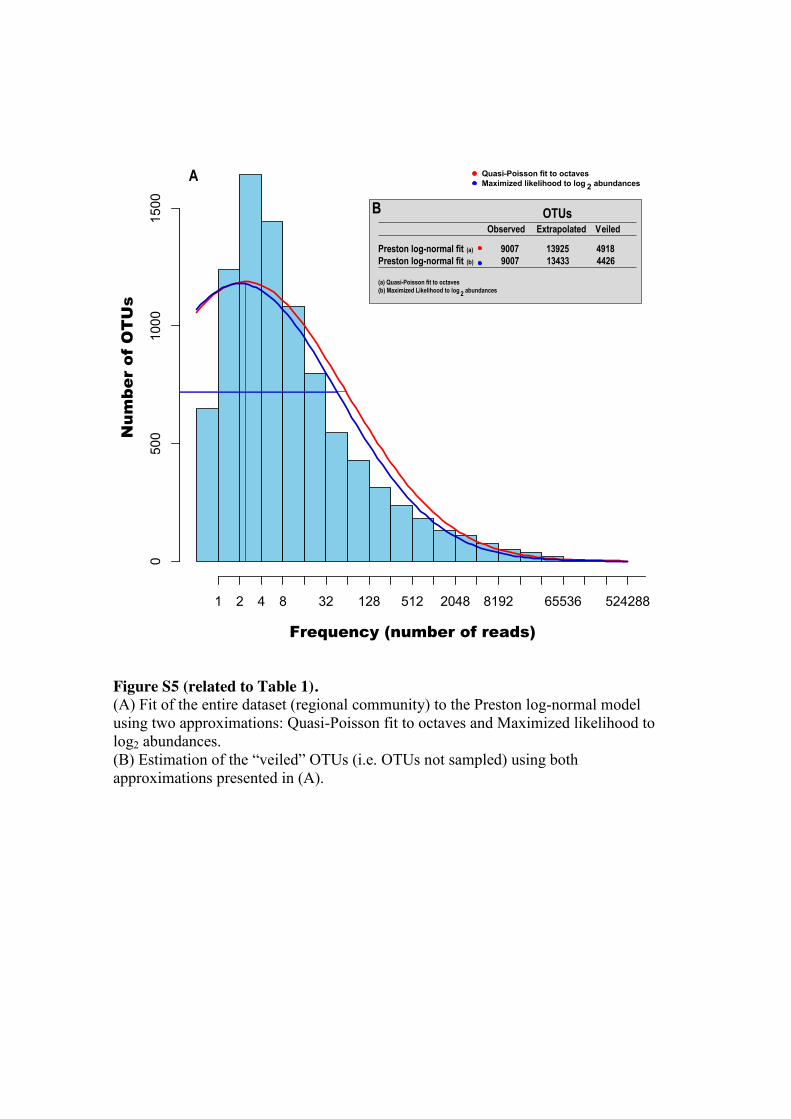
Figure S5 (related to Table 1). (A) Fit of the entire dataset (regional community) to the Preston log-normal model using two approximations: Quasi-Poisson fit to octaves and Maximized likelihood to log2 abundances. (B) Estimation of the “veiled” OTUs (i.e. OTUs not sampled) using both approximations presented in (A).
Frequency (number of reads)
Num
ber
of O
TU
s
0500
1000
1500
1 2 4 8 32 128 512 2048 8192 65536 524288
Quasi-Poisson fit to octavesMaximized likelihood to log 2 abundances
Observed Extrapolated Veiled
Preston log-normal fit (a) 9007 13925 4918Preston log-normal fit (b) 9007 13433 4426
(a) Quasi-Poisson fit to octaves(b) Maximized Likelihood to log 2 abundances
OTUs
A
B

Supplemental Tables
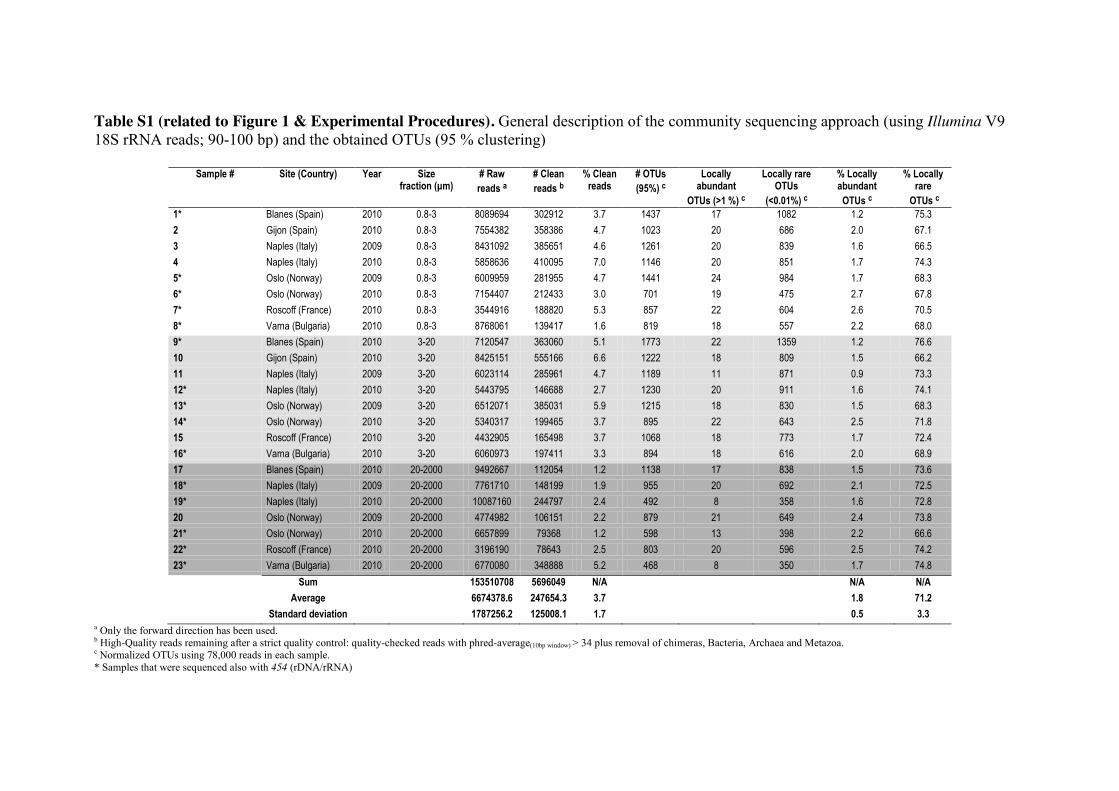
Table S1 (related to Figure 1 & Experimental Procedures). General description of the community sequencing approach (using Illumina V9 18S rRNA reads; 90-100 bp) and the obtained OTUs (95 % clustering)
Sample # Site (Country) Year Size fraction (μm)
# Raw reads a
# Clean reads b
% Clean reads
# OTUs (95%) c
Locally abundant
OTUs (>1 %) c
Locally rare OTUs
(<0.01%) c
% Locally abundant
OTUs c
% Locally rare
OTUs c 1* Blanes (Spain) 2010 0.8-3 8089694 302912 3.7 1437 17 1082 1.2 75.3 2 Gijon (Spain) 2010 0.8-3 7554382 358386 4.7 1023 20 686 2.0 67.1 3 Naples (Italy) 2009 0.8-3 8431092 385651 4.6 1261 20 839 1.6 66.5 4 Naples (Italy) 2010 0.8-3 5858636 410095 7.0 1146 20 851 1.7 74.3 5* Oslo (Norway) 2009 0.8-3 6009959 281955 4.7 1441 24 984 1.7 68.3 6* Oslo (Norway) 2010 0.8-3 7154407 212433 3.0 701 19 475 2.7 67.8 7* Roscoff (France) 2010 0.8-3 3544916 188820 5.3 857 22 604 2.6 70.5 8* Varna (Bulgaria) 2010 0.8-3 8768061 139417 1.6 819 18 557 2.2 68.0 9* Blanes (Spain) 2010 3-20 7120547 363060 5.1 1773 22 1359 1.2 76.6 10 Gijon (Spain) 2010 3-20 8425151 555166 6.6 1222 18 809 1.5 66.2 11 Naples (Italy) 2009 3-20 6023114 285961 4.7 1189 11 871 0.9 73.3 12* Naples (Italy) 2010 3-20 5443795 146688 2.7 1230 20 911 1.6 74.1 13* Oslo (Norway) 2009 3-20 6512071 385031 5.9 1215 18 830 1.5 68.3 14* Oslo (Norway) 2010 3-20 5340317 199465 3.7 895 22 643 2.5 71.8 15 Roscoff (France) 2010 3-20 4432905 165498 3.7 1068 18 773 1.7 72.4 16* Varna (Bulgaria) 2010 3-20 6060973 197411 3.3 894 18 616 2.0 68.9 17 Blanes (Spain) 2010 20-2000 9492667 112054 1.2 1138 17 838 1.5 73.6 18* Naples (Italy) 2009 20-2000 7761710 148199 1.9 955 20 692 2.1 72.5 19* Naples (Italy) 2010 20-2000 10087160 244797 2.4 492 8 358 1.6 72.8 20 Oslo (Norway) 2009 20-2000 4774982 106151 2.2 879 21 649 2.4 73.8 21* Oslo (Norway) 2010 20-2000 6657899 79368 1.2 598 13 398 2.2 66.6 22* Roscoff (France) 2010 20-2000 3196190 78643 2.5 803 20 596 2.5 74.2 23* Varna (Bulgaria) 2010 20-2000 6770080 348888 5.2 468 8 350 1.7 74.8
Sum 153510708 5696049 N/A N/A N/A Average 6674378.6 247654.3 3.7 1.8 71.2 Standard deviation 1787256.2 125008.1 1.7 0.5 3.3
a Only the forward direction has been used. b High-Quality reads remaining after a strict quality control: quality-checked reads with phred-average(10bp window) > 34 plus removal of chimeras, Bacteria, Archaea and Metazoa. c Normalized OTUs using 78,000 reads in each sample. * Samples that were sequenced also with 454 (rDNA/rRNA)
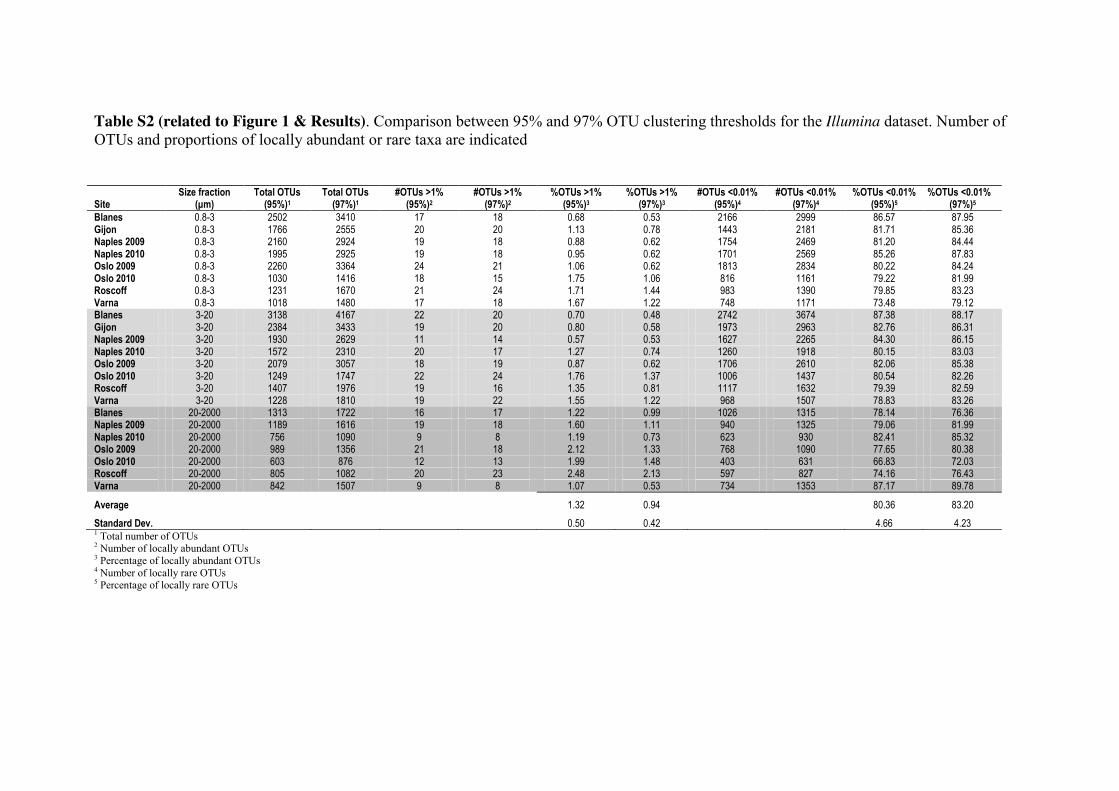
Table S2 (related to Figure 1 & Results). Comparison between 95% and 97% OTU clustering thresholds for the Illumina dataset. Number of OTUs and proportions of locally abundant or rare taxa are indicated
Site Size fraction
(μm) Total OTUs
(95%)1 Total OTUs
(97%)1 #OTUs >1%
(95%)2 #OTUs >1%
(97%)2 %OTUs >1%
(95%)3 %OTUs >1%
(97%)3 #OTUs <0.01%
(95%)4 #OTUs <0.01%
(97%)4 %OTUs <0.01%
(95%)5 %OTUs <0.01%
(97%)5
Blanes 0.8-3 2502 3410 17 18 0.68 0.53 2166 2999 86.57 87.95 Gijon 0.8-3 1766 2555 20 20 1.13 0.78 1443 2181 81.71 85.36 Naples 2009 0.8-3 2160 2924 19 18 0.88 0.62 1754 2469 81.20 84.44 Naples 2010 0.8-3 1995 2925 19 18 0.95 0.62 1701 2569 85.26 87.83 Oslo 2009 0.8-3 2260 3364 24 21 1.06 0.62 1813 2834 80.22 84.24 Oslo 2010 0.8-3 1030 1416 18 15 1.75 1.06 816 1161 79.22 81.99 Roscoff 0.8-3 1231 1670 21 24 1.71 1.44 983 1390 79.85 83.23 Varna 0.8-3 1018 1480 17 18 1.67 1.22 748 1171 73.48 79.12 Blanes 3-20 3138 4167 22 20 0.70 0.48 2742 3674 87.38 88.17 Gijon 3-20 2384 3433 19 20 0.80 0.58 1973 2963 82.76 86.31 Naples 2009 3-20 1930 2629 11 14 0.57 0.53 1627 2265 84.30 86.15 Naples 2010 3-20 1572 2310 20 17 1.27 0.74 1260 1918 80.15 83.03 Oslo 2009 3-20 2079 3057 18 19 0.87 0.62 1706 2610 82.06 85.38 Oslo 2010 3-20 1249 1747 22 24 1.76 1.37 1006 1437 80.54 82.26 Roscoff 3-20 1407 1976 19 16 1.35 0.81 1117 1632 79.39 82.59 Varna 3-20 1228 1810 19 22 1.55 1.22 968 1507 78.83 83.26 Blanes 20-2000 1313 1722 16 17 1.22 0.99 1026 1315 78.14 76.36 Naples 2009 20-2000 1189 1616 19 18 1.60 1.11 940 1325 79.06 81.99 Naples 2010 20-2000 756 1090 9 8 1.19 0.73 623 930 82.41 85.32 Oslo 2009 20-2000 989 1356 21 18 2.12 1.33 768 1090 77.65 80.38 Oslo 2010 20-2000 603 876 12 13 1.99 1.48 403 631 66.83 72.03 Roscoff 20-2000 805 1082 20 23 2.48 2.13 597 827 74.16 76.43 Varna 20-2000 842 1507 9 8 1.07 0.53 734 1353 87.17 89.78 Average 1.32 0.94 80.36 83.20 Standard Dev. 0.50 0.42 4.66 4.23 1 Total number of OTUs 2 Number of locally abundant OTUs 3 Percentage of locally abundant OTUs 4 Number of locally rare OTUs 5 Percentage of locally rare OTUs
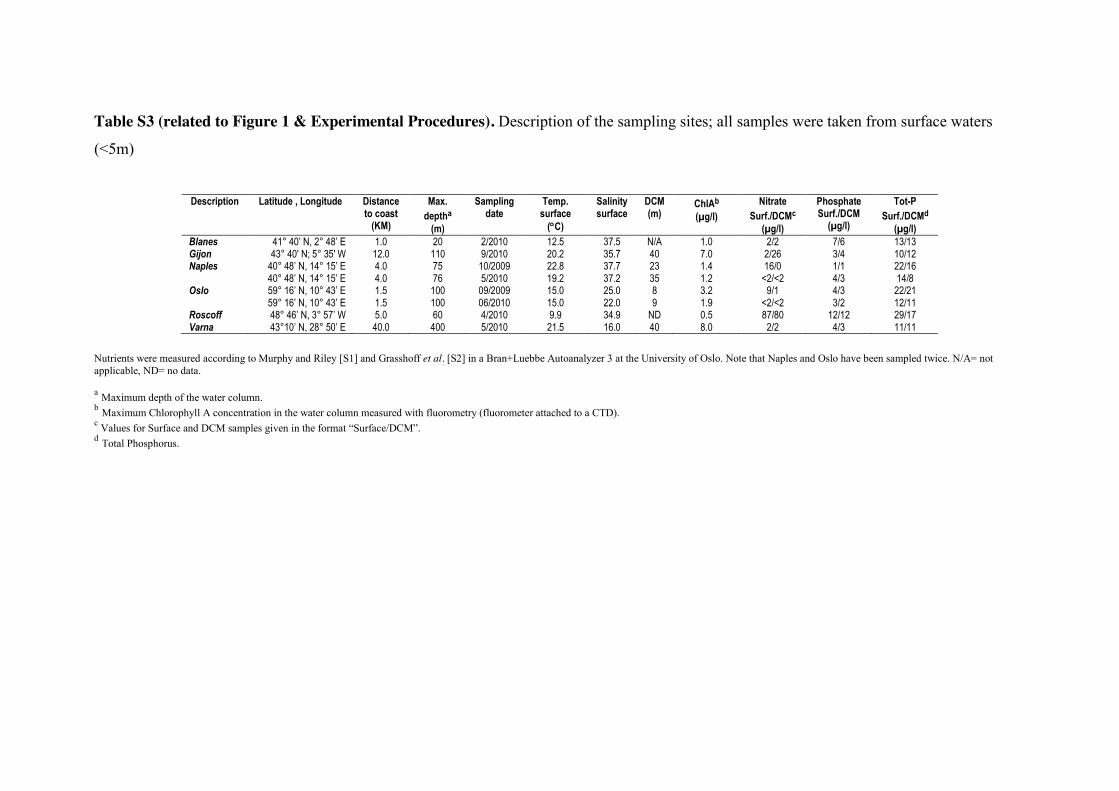
Table S3 (related to Figure 1 & Experimental Procedures). Description of the sampling sites; all samples were taken from surface waters
(<5m)
Description Latitude , Longitude Distance
to coast (KM)
Max. deptha
(m)
Sampling date
Temp. surface
(qC)
Salinity surface
DCM (m)
ChlAb
(µg/l)
Nitrate Surf./DCMc
(µg/l)
Phosphate Surf./DCM
(µg/l)
Tot-P Surf./DCMd
(µg/l) Blanes 41° 40’ N, 2° 48’ E 1.0 20 2/2010 12.5 37.5 N/A 1.0 2/2 7/6 13/13 Gijon 43° 40' N; 5° 35' W 12.0 110 9/2010 20.2 35.7 40 7.0 2/26 3/4 10/12 Naples 40° 48’ N, 14° 15’ E
40° 48’ N, 14° 15’ E 4.0 4.0
75 76
10/2009 5/2010
22.8 19.2
37.7 37.2
23 35
1.4 1.2
16/0 <2/<2
1/1 4/3
22/16 14/8
Oslo 59° 16’ N, 10° 43’ E 59° 16’ N, 10° 43’ E
1.5 1.5
100 100
09/2009 06/2010
15.0 15.0
25.0 22.0
8 9
3.2 1.9
9/1 <2/<2
4/3 3/2
22/21 12/11
Roscoff 48° 46’ N, 3° 57’ W 5.0 60 4/2010 9.9 34.9 ND 0.5 87/80 12/12 29/17 Varna 43°10’ N, 28° 50’ E 40.0 400 5/2010 21.5 16.0 40 8.0 2/2 4/3 11/11
Nutrients were measured according to Murphy and Riley [S1] and Grasshoff et al. [S2] in a Bran+Luebbe Autoanalyzer 3 at the University of Oslo. Note that Naples and Oslo have been sampled twice. N/A= not applicable, ND= no data. a Maximum depth of the water column. b Maximum Chlorophyll A concentration in the water column measured with fluorometry (fluorometer attached to a CTD). c Values for Surface and DCM samples given in the format “Surface/DCM”. d Total Phosphorus.
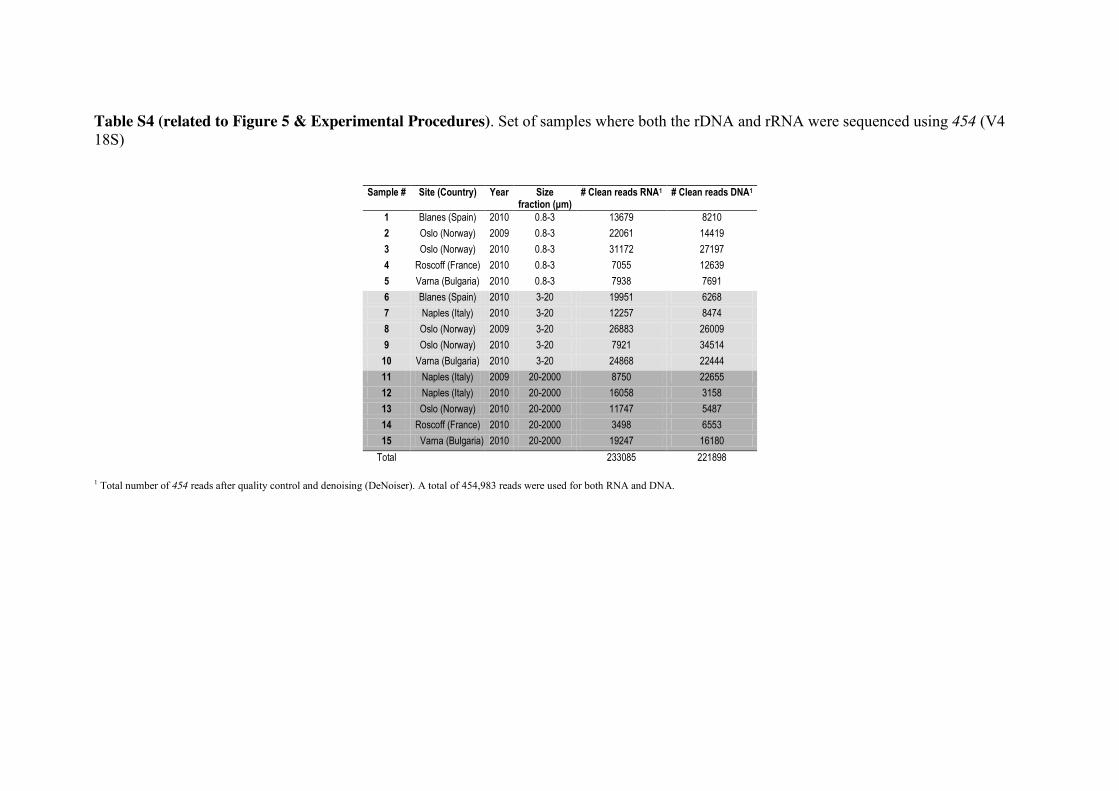
Table S4 (related to Figure 5 & Experimental Procedures). Set of samples where both the rDNA and rRNA were sequenced using 454 (V4 18S)
Sample # Site (Country) Year Size fraction (μm)
# Clean reads RNA1 # Clean reads DNA1
1 Blanes (Spain) 2010 0.8-3 13679 8210 2 Oslo (Norway) 2009 0.8-3 22061 14419 3 Oslo (Norway) 2010 0.8-3 31172 27197 4 Roscoff (France) 2010 0.8-3 7055 12639 5 Varna (Bulgaria) 2010 0.8-3 7938 7691 6 Blanes (Spain) 2010 3-20 19951 6268 7 Naples (Italy) 2010 3-20 12257 8474 8 Oslo (Norway) 2009 3-20 26883 26009 9 Oslo (Norway) 2010 3-20 7921 34514
10 Varna (Bulgaria) 2010 3-20 24868 22444 11 Naples (Italy) 2009 20-2000 8750 22655 12 Naples (Italy) 2010 20-2000 16058 3158 13 Oslo (Norway) 2010 20-2000 11747 5487 14 Roscoff (France) 2010 20-2000 3498 6553 15 Varna (Bulgaria) 2010 20-2000 19247 16180
Total 233085 221898 1 Total number of 454 reads after quality control and denoising (DeNoiser). A total of 454,983 reads were used for both RNA and DNA.
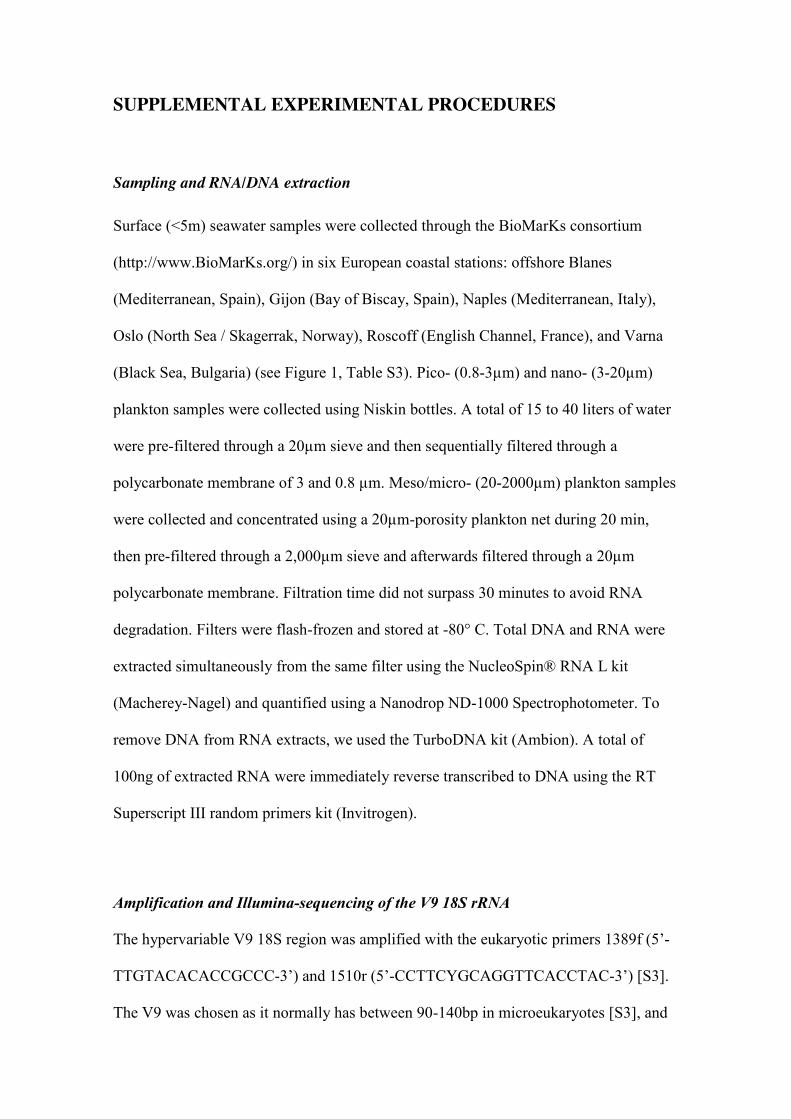
SUPPLEMENTAL EXPERIMENTAL PROCEDURES
Sampling and RNA/DNA extraction
Surface (<5m) seawater samples were collected through the BioMarKs consortium
(http://www.BioMarKs.org/) in six European coastal stations: offshore Blanes
(Mediterranean, Spain), Gijon (Bay of Biscay, Spain), Naples (Mediterranean, Italy),
Oslo (North Sea / Skagerrak, Norway), Roscoff (English Channel, France), and Varna
(Black Sea, Bulgaria) (see Figure 1, Table S3). Pico- (0.8-3µm) and nano- (3-20µm)
plankton samples were collected using Niskin bottles. A total of 15 to 40 liters of water
were pre-filtered through a 20µm sieve and then sequentially filtered through a
polycarbonate membrane of 3 and 0.8 µm. Meso/micro- (20-2000µm) plankton samples
were collected and concentrated using a 20µm-porosity plankton net during 20 min,
then pre-filtered through a 2,000µm sieve and afterwards filtered through a 20µm
polycarbonate membrane. Filtration time did not surpass 30 minutes to avoid RNA
degradation. Filters were flash-frozen and stored at -80° C. Total DNA and RNA were
extracted simultaneously from the same filter using the NucleoSpin® RNA L kit
(Macherey-Nagel) and quantified using a Nanodrop ND-1000 Spectrophotometer. To
remove DNA from RNA extracts, we used the TurboDNA kit (Ambion). A total of
100ng of extracted RNA were immediately reverse transcribed to DNA using the RT
Superscript III random primers kit (Invitrogen).
Amplification and Illumina-sequencing of the V9 18S rRNA
The hypervariable V9 18S region was amplified with the eukaryotic primers 1389f (5’-
TTGTACACACCGCCC-3’) and 1510r (5’-CCTTCYGCAGGTTCACCTAC-3’) [S3].
The V9 was chosen as it normally has between 90-140bp in microeukaryotes [S3], and
therefore most of it can be covered by 100bp Illumina GAIIx reads. Amplifications
were conducted with Phusion® High-Fidelity DNA Polymerase (Finnzymes). The PCR
mixture (25µL final volume) contained about 5ng of cDNA template with 0.35µM final
concentration of each primer, 3% of DMSO and 2X of GC buffer Phusion Master Mix
(Finnzymes). Amplifications were done following the PCR program: initial
denaturation step at 98°C for 30 sec, followed by 25 cycles of 10 sec at 98°C, 30 sec at
57°C, 30 sec at 72°C, and a final elongation step at 72°C for 10 minutes. Each sample
was amplified in triplicates to get enough concentration of amplicons and reduce
potential biases. Products of the reactions were run on 1.5% agarose gels to check for
successful amplification within the expected sequence length. Amplicons were then
pooled and purified using the NucleoSpin® Extract II kit (Macherey-Nagel). Ligation
of amplicons with Illumina adapters and library construction were performed according
to Illumina instructions. Paired-end 100bp sequencing was performed using a Genome
Analyzer IIx (GAIIx) system (Illumina) located at Genoscope
(http://www.genoscope.cns.fr/spip/, France).
Amplification and 454-sequencing of the V4 18S rDNA/rRNA
The universal primers TAReuk454FWD1 (5’-CCAGCASCYGCGGTAATTCC-3’) and
TAReukREV3 (5’-ACTTTCGTTCTTGATYRA-3’) were used to amplify the
hypervariable V4 region (~380 bp) of the eukaryotic 18S rDNA/rRNA [S4]. The
primers were adapted for 454 using the manufacturers specifications for Lib-L
unidirectional sequencing, and had the configuration A-adapter-Tag (7 or 8bp)- forward
primer, and B-adapter-reverse primer. PCR reactions were performed in 25μl, and
consisted in 1X MasterMix Phusion® High-Fidelity DNA Polymerase (Finnzymes),
0.35µM of each primer, and 3% DMSO. We added a total of 5ng of template
DNA/cDNA to each PCR reaction. PCR reactions consisted of an initial denaturation
step at 98°C during 30 sec, followed by 10 cycles of 10 sec at 98°C, 30 sec at 53°C and
30 sec at 72°C, and afterwards by 15 cycles of 10 sec at 98°C, 30 sec at 48°C and 30
sec at 72°C, including a final elongation step at 72°C for 10 minutes. Amplicons were
checked in 1.5% agarose gels for successful amplification within the expected length.
Triplicate amplicon reactions were pooled and purified using NucleoSpin® Extract II
(Macherey-Nagel). Purified amplicons were eluted in 30µl of elution buffer and
quantified using Quant-it dsDNA Picogreen kit (Invitrogen). The final total amount of
pooled amplicons for 454 tag-sequencing was approximately 1µg. Amplicon
sequencing was carried out on a 454 GS FLX Titanium system (454 Life Sciences,
USA) installed at Genoscope (http://www.genoscope.cns.fr/spip/, France).
Sequence analysis for Illumina reads
A total of 23 samples sequenced with Illumina GAIIx and based on RNA (cDNA)
template were used (Table S1). We used RNA as this molecule is much less stable than
DNA in extracellular conditions. Therefore, most RNA recovered from the environment
should have originated from living cells (ensuring that nucleic acids originate from
living cells is particularly relevant when investigating the rare biosphere). Furthermore,
there are studies indicating that RNA provides a better representation of community
composition than DNA in microbial eukaryotes (less biases due to uneven rDNA copy
number between taxa) [S5].
Despite using paired-end reads (2x100bp), we opted for using the forward reads
only, as some merged (assembled) reads presented reduced quality; similar strategies
have been used in other works [S6]. Illumina GAIIx fastq files (Phred +64) were
translated into different fasta and phred-quality files. The number of raw (i.e. not quality
checked) reads obtained per sample is indicated in Table S1. Reads were quality-
checked using a sliding window (window length = 10bp) and each window had to have
a phred-quality average >34 to pass the control (see [S7]). Quality-checked reads had a
minimum length of 90bp with a maximum homopolymer size = 10bp; no ambiguous
bases were allowed. This highly stringent cleaning protocol insured only reads of the
highest quality were retained for downstream analysis. All quality checks were run in
Mothur v1.2X [S8]. The number of clean reads after quality control is shown in Table
S1. Quality-checked reads were analyzed in QIIME v1.4 [S9]. Reads were clustered
into OTUs using UCLUST v1.2.22 with a 95% similarity threshold and the parameters
--max_accepts =20 and --max_rejects =500. This conservative clustering threshold was
selected in order to reduce any artifactual increase in richness produced by sequencing
errors that could remain in our dataset (see [S10]). Chimeras were detected using
ChimeraSlayer [S11] with a reference database derived from PR2 [S12], and
subsequently removed. One representative sequence per OTU (the most abundant) was
selected. OTU representative sequences were assigned taxonomy by BLASTing them
(blastn; [S13]) against the databases SILVA v108 (BLAST threshold e-value=e-6) as
well as a PR2-derived database [S12] (BLAST threshold e-value=e-100). Both the
SILVA v108 and the PR2-derived reference databases were pre-clustered at 97%
similarity to reduce the chances of ambiguous classifications (hereafter referred as
SILVA v108(97%) & PR2(97%)). The initial BLAST against SILVA v108(97%) served to
detect and remove unwanted taxa (e.g. Bacteria, Archaea and Metazoa). Further OTU
removal was done using the classifications obtained with the PR2(97%). The final curated
Illumina RNA dataset included 5,696,049 reads.
Sequence Analysis for 454 reads
A total of 15 samples, where both DNA and RNA (cDNA) were sequenced using 454
(V4 18S), were used in downstream analyses (Table S4). Note that these samples were
all included in the main Illumina dataset (Table S1). All 454 reads were run through
QIIME v1.4. Only reads between 200-500bp were used. Reads were checked for quality
using a sliding window of 50bp (Phred average >25 in each window), truncated to the
last good window and subsequently checked again for minimum length. Reads that
passed the quality control were denoised using DeNoiser (v 0.851; [S14]) as
implemented in QIIME v1.4. Subsequently, reads were clustered into OTUs using
UCLUST v1.2.22 with a 99% threshold of sequence similarity (compared to Illumina
reads, a higher clustering threshold was used since this region is longer, less
hypervariable and furthermore, this dataset was denoised). UCLUST was run with the
parameters --max_accepts =20 and --max_rejects =500. One representative read per
OTU (the most abundant) was selected. Chimeras were detected using ChimeraSlayer
with a reference database derived from PR2 [S12], and subsequently removed.
Representative reads were assigned taxonomy by BLASTing them against the databases
SILVA v108 (97%) (BLAST threshold e-value=e-6), the custom PR2(97%) (BLAST
threshold e-value=e-100), as well as the MP database (BLAST threshold e-value=e-100).
MP is an in-house 18S V4 database that contains only marine microeukaryotes, with
improved taxonomy for specific groups [S15]. The MP database was also pre-clustered
at 97% to prevent ambiguous classifications. Thus, each database provided different
degrees of taxonomic resolution. After taxonomy assignment, Metazoan sequences were
removed (Bacteria and Archaea were not present). In the final dataset, after all
unwanted sequences were removed, RNA included 233,085 reads and DNA 221,898
reads (total 454,983 reads).
Construction of OTU tables
Single singletons as well as OTUs present in only one sample were removed from the
global dataset (i.e. the dataset including samples that were not considered in our work,
such as deeper planktonic or sediment samples). After the exclusion of samples that
were not considered in our analyses, single singletons were present again in both the
Illumina and 454 datasets, but these were included in downstream analyses as they were
already validated by other reads in unused samples.
Diversity and network analyses
Most analyses were run in the R [S16] environment. Venn diagrams were calculated
using the R-package Limma [S17]. Rarefactions as well as Species (OTUs)
Accumulation Curves (SAC) were calculated using the R-package Vegan [S18]. SACs
were estimated using the methods “Ugland” and “Random”. Ugland’s method finds the
expected SAC using the method proposed by Ugland et al. [S19]. The “Random”
method calculates the mean SAC from random permutations of the data [S20]. Rank-
abundance (or Species Abundance Distribution) plots were produced in R and different
models were fitted using the “radfit” function in Vegan. The fitted models were “Null”
(brokenstick), “Preemption” (niche preemption model [geometric series] or Motomura
model), “Lognormal” (log-normal model), “Zipf” (Zipf model) and “Mandelbrot” (Zipf-
Mandelbrot model) (see [S21]); the “Mandelbrot” model could not be fitted to all
datasets. In addition, we fitted our data to the Preston log-normal model [S22] using the
functions “prestonfit” (fit estimation using second degree log-polynomial with Poisson
error) and “prestondistr” (fit estimation using direct maximization of log-likelihood) in
Vegan (see Vegan user manual for more details). OTU networks were constructed in
QIIME using the subsampled OTU table and graphically edited in Cytoscape [S23]
using the layout “Edge-Weighted Spring Embedded” with eweights. Networks were
filtered using eweight values (eweight thresholds: “Abundant”=500, “Rare”=3,
“All”=200).
Mapping of short Illumina reads to longer reference sequences and phylogeny
construction
Regionally abundant or rare OTUs (one representative read per OTU) were mapped
using BLASTn to a V9 18S rDNA Sanger reference database based on the custom
PR2(97%) database. We did not BLAST OTUs against the custom PR2 database
containing areas other than V9 as this produced poorer results. To construct the
reference phylogeny, we used the full-length 18S sequences corresponding to the entire
custom V9 PR2(97%) database. Only sequences >1,500bp were used for phylogeny
construction, leaving a dataset of 8,311 reference sequences. Sequences were aligned
using Mothur against the aligned SILVA 108 (eukaryotes only). A Maximum
Likelihood tree (FULL-TREE) was inferred using RAxML HPC-MPI (v7.2.8; [S24])
under the model GTR+CAT/G+I and checked against other phylogenies of marine
protists [S15]. The FULL-TREE was pruned using the R-package APE (Analyses of
Phylogenetics and Evolution; [S25]) to keep only those reference taxa that were hit by
abundant or rare OTUs (PRUNED-TREE). The PRUNED-TREE had 1,343 Sanger
sequences (the tree had less taxa than the sum of rare and abundant OTUs [5,483] since
we allowed for the mapping of multiple OTUs to the same reference taxa). The
PRUNED-TREE and the corresponding annotation were uploaded to iTol [S26] for
graphical representation. In addition, the PRUNED-TREE was used for the calculation
of phylogenetic metrics. The Mean Phylogenetic Distance (MPD) and Mean Nearest
Taxon Distance (MNTD) [S27] were calculated using the R-package Picante [S28] and
compared to a null model that shuffled taxa-labels 1,000 times across all taxa included
in the phylogeny-based distance matrix (see [S29]).
SUPPLEMENTAL REFERENCES S1. Murphy, J., and Riley, J.P. (1962). A modified single solution method for the
determination of phosphate in natural waters. Anal. Chim. Acta 27, 31-36.
S2. Grasshoff, K., Ehrhardt, M., and Kremling, K. (1983). Methods of Seawater
Analysis, (Weinheim: Verlag Chemie).
S3. Amaral-Zettler, L.A., McCliment, E.A., Ducklow, H.W., and Huse, S.M.
(2009). A method for studying protistan diversity using massively parallel
sequencing of V9 hypervariable regions of small-subunit ribosomal RNA genes.
PLoS One 4, e6372.
S4. Stoeck, T., Bass, D., Nebel, M., Christen, R., Jones, M.D., Breiner, H.W., and
Richards, T.A. (2010). Multiple marker parallel tag environmental DNA
sequencing reveals a highly complex eukaryotic community in marine anoxic
water. Mol Ecol 19 Suppl 1, 21-31.
S5. Not, F., del Campo, J., Balague, V., de Vargas, C., and Massana, R. (2009).
New insights into the diversity of marine picoeukaryotes. PLoS One 4, e7143.
S6. Caporaso, J.G., Lauber, C.L., Walters, W.A., Berg-Lyons, D., Lozupone, C.A.,
Turnbaugh, P.J., Fierer, N., and Knight, R. (2011). Global patterns of 16S rRNA
diversity at a depth of millions of sequences per sample. Proceedings of the
National Academy of Sciences of the United States of America 108 Suppl 1,
4516-4522.
S7. Minoche, A.E., Dohm, J.C., and Himmelbauer, H. (2011). Evaluation of
genomic high-throughput sequencing data generated on Illumina HiSeq and
Genome Analyzer systems. Genome biology 12, R112.
S8. Schloss, P.D., Westcott, S.L., Ryabin, T., Hall, J.R., Hartmann, M., Hollister,
E.B., Lesniewski, R.A., Oakley, B.B., Parks, D.H., Robinson, C.J., et al. (2009).
Introducing mothur: open-source, platform-independent, community-supported
software for describing and comparing microbial communities. Appl Environ
Microbiol 75, 7537-7541.
S9. Caporaso, J.G., Kuczynski, J., Stombaugh, J., Bittinger, K., Bushman, F.D.,
Costello, E.K., Fierer, N., Pena, A.G., Goodrich, J.K., Gordon, J.I., et al. (2010).
QIIME allows analysis of high-throughput community sequencing data. Nat
Methods 7, 335-336.
S10. Claesson, M.J., Wang, Q., O'Sullivan, O., Greene-Diniz, R., Cole, J.R., Ross,
R.P., and O'Toole, P.W. (2010). Comparison of two next-generation sequencing
technologies for resolving highly complex microbiota composition using tandem
variable 16S rRNA gene regions. Nucleic acids research 38, e200.
S11. Haas, B.J., Gevers, D., Earl, A.M., Feldgarden, M., Ward, D.V., Giannoukos,
G., Ciulla, D., Tabbaa, D., Highlander, S.K., Sodergren, E., et al. (2011).
Chimeric 16S rRNA sequence formation and detection in Sanger and 454-
pyrosequenced PCR amplicons. Genome Res 21, 494-504.
S12. Guillou, L., Bachar, D., Audic, S., Bass, D., Berney, C., Bittner, L., Boutte, C.,
Burgaud, G., de Vargas, C., Decelle, J., et al. (2013). The Protist Ribosomal
Reference database (PR2): a catalog of unicellular eukaryote small sub-unit
rRNA sequences with curated taxonomy. Nucleic Acids Res 41, D597-604.
S13. Altschul, S.F., Gish, W., Miller, W., Myers, E.W., and Lipman, D.J. (1990).
Basic local alignment search tool. Journal of molecular biology 215, 403-410.
S14. Reeder, J., and Knight, R. (2010). Rapidly denoising pyrosequencing amplicon
reads by exploiting rank-abundance distributions. Nature methods 7, 668-669.
S15. Pernice, M.C., Logares, R., Guillou, L., and Massana, R. (2013). General
patterns of diversity in major marine microeukaryote lineages. PLoS One 8,
e57170.
S16. R-Development-Core-Team (2008). R: A language and environment for
statistical computing., (Vienna, Austria: R Foundation for Statistical
Computing).
S17. Smyth, G.K. (2005). Limma: linear models for microarray data. In
Bioinformatics and Computational Biology Solutions using R and Bioconductor,
R. Gentleman, V. Carey, S. Dudoit, R. Irizarry and W. Huber, eds. (New York:
Springer).
S18. Oksanen, J., Kindt, R., Legendre, P., O'Hara, B., Simpson, G.L., Solymos, P.,
Stevens, M.H.H., and Wagner, H. (2008). vegan: Community Ecology Package.
R package version 1.15-0.
S19. Ugland, K.I., Gray, J.S., and Ellingsen, K.E. (2003). The species-accumulation
curve and estimation of species richness. Journal of Animal Ecology 72.
S20. Gotelli, N.J., and Colwell, R.K. (2001). Quantifying biodiversity: procedures
and pitfalls in measurement and comparison of species richness. Ecology Letters
4, 379-391.
S21. Wilson, J.B. (1991). Methods for fitting dominance/diversity curves. Journal of
Vegetation Science 2, 35-46.
S22. Preston, F.W. (1948). The commonness, and rarity, of species. Ecology 29, 254-
283.
S23. Shannon, P., Markiel, A., Ozier, O., Baliga, N.S., Wang, J.T., Ramage, D.,
Amin, N., Schwikowski, B., and Ideker, T. (2003). Cytoscape: a software
environment for integrated models of biomolecular interaction networks.
Genome Res 13, 2498-2504.
S24. Stamatakis, A. (2006). RAxML-VI-HPC: Maximum likelihood-based
phylogenetic analyses with thousands of taxa and mixed models. Bioinformatics
22, 2688-2690.
S25. Paradis, E., Claude, J., and Strimmer, K. (2004). APE: Analyses of
Phylogenetics and Evolution in R language. Bioinformatics 20, 289-290.
S26. Letunic, I., and Bork, P. (2007). Interactive Tree Of Life (iTOL): an online tool
for phylogenetic tree display and annotation. Bioinformatics 23, 127-128.
S27. Webb, C.O., Ackerly, D.D., McPeek, M.A., and Donoghue, M.J. (2002).
Phylogenies and Community Ecology. Annual Review of Ecology and
Systematics 33, 475-505.
S28. Kembel, S.W., Cowan, P.D., Helmus, M.R., Cornwell, W.K., Morlon, H.,
Ackerly, D.D., Blomberg, S.P., and Webb, C.O. (2010). Picante: R tools for
integrating phylogenies and ecology. Bioinformatics 26, 1463-1464.
S29. Kembel, S.W. (2009). Disentangling niche and neutral influences on community
assembly: assessing the performance of community phylogenetic structure tests.
Ecol Lett 12, 949-960.


![Multi-relational Data Mining for Tetratricopeptide Repeats ... · proteins (PPRPs) occur predominantly in eukaryotes [10] (particularly abundant in plants), while it has been suggested](https://static.fdocuments.net/doc/165x107/5c34aced09d3f2f3288c2c7d/multi-relational-data-mining-for-tetratricopeptide-repeats-proteins-pprps.jpg)


