Patterns of Mental Illness Disorder Diagnoses & Service Use · Patterns of Mental Illness Disorder...
133
Patterns of Mental Illness Disorder Diagnoses & Service Use: A Population-Based Study of the Winnipeg Regional Health Authority January 2008 Robert Penfold, PhD Lesley Alagar, MSc Murray Enns, MD, FRCPC Susan Chipperfield, MSc, CPRP Carolyn Strutt Sarah Bowen, PhD This report is an in-depth analysis of the Winnipeg Region data utilizing the data & report from the Manitoba Centre for Health Policy (September 2004) The results and conclusions of this report are those of the authors and no official endorsement by Manitoba Health or the Manitoba Centre for Health Policy was intended or should be inferred.
Transcript of Patterns of Mental Illness Disorder Diagnoses & Service Use · Patterns of Mental Illness Disorder...

Patterns of Mental Illness Disorder
Diagnoses & Service Use: A Population-Based Study
of the Winnipeg Regional Health Authority
January 2008
Robert Penfold, PhD Lesley Alagar, MSc
Murray Enns, MD, FRCPC Susan Chipperfield, MSc, CPRP
Carolyn Strutt Sarah Bowen, PhD
This report is an in-depth analysis of the Winnipeg Region data utilizing the data & report from the Manitoba Centre for Health Policy (September 2004)
The results and conclusions of this report are those of the authors and no official endorsement by Manitoba Health or the Manitoba Centre for Health Policy was intended or should be inferred.

Table of Contents Introduction----------------------------------------------------------------------------------------- 3 Key findings------------------------------------------------------------------------------------------ 6 Premature Mortality Rates----------------------------------------------------------------- 6 Treatment prevalence of mental disorders----------------------------------------------- 10 Use of Physician Services by those with mental illness diagnoses----------------- 36 Use of Hospital Services by those with a mental illness diagnosis----------------- 50 Home Care Use by those with a mental illness diagnosis--------------------------- 68 Personal Care Home (Nursing Home) Use by those with a mental illness Diagnosis-------------------------------------------------------------------- 91 Pharmaceutical Use for Mental Illness Disorders------------------------------------- 100 Suicide and Suicide Attempts------------------------------------------------------------- 112 Overall observations and recommendations------------------------------------------------- 124

Patterns of Mental Illness Disorder Diagnoses & Service Use: A Population-Based Study of Winnipeg
March 2007
This report is an in-depth analysis of the Winnipeg Region data utilizing the data & report from the Manitoba Centre for Health Policy Mental Illness, September 2004
Executive Summary Introduction: Mental illness is a profound problem in Winnipeg, yet there has been a lack of community area information available on the prevalence of mental disorders or use of health care resources. Data was collected province wide and reported on by the Provincial “Need To Know” Team in 2004, however, the focus was on the rural and northern RHAs. The provincial report gave Winnipeg rates only in the aggregate as a comparative grouping, without the community area or neighbourhood data. This report is designed to provide an overview of Winnipeg population-based indicators on the prevalence of mental illness, and the patterns of health care use of those diagnosed with mental illness. Utilizing the work of the Provincial “Need To Know Team”, the population-based information on mental illness was reviewed for critical aspects related to planning region wide, within community areas and in neighbourhoods within Winnipeg. The original data collection and research occurred through The Need To Know Team, funded through the Canadian Institutes of Health Research (CIHR) and directed by Dr. Patricia Martens. The team was comprised of researchers from the Manitoba Centre for Health Policy’s (MCHP) academic research unit, and high-level planners of each of the non-Winnipeg RHAs and Manitoba Health. The review team at the Winnipeg Regional Health Authority has conducted an in-depth analysis to look at the community areas and neighbourhood data in Winnipeg. The Winnipeg team was comprised of members from the WRHA Research Unit, the WRHA Mental Health Program Director and planning staff and both hospital and community services including psychiatrists and researchers. A research analyst from the WRHA Research unit was placed at the MCHP Center to analyze the data from the Winnipeg perspective.
The MCHP has given access to the WRHA to work within the datasets collected to reanalysis the data in accordance with community areas and neighbourhoods in Winnipeg. The WRHA team of mental health experts have collaborated with the MCHP in the development of this report specific to Winnipeg. Psychiatry has played an integral role on the Winnipeg research team and has resulted in some new conclusions and new approved research questions that will be addressed in a future research project in conjunction with the MCHP.
3

The contents of the report, indicators and comparisons This report contains both the prevalence of mental illness diagnoses, as well as the health care use patterns of services such as physicians, hospitals, home care, personal care homes (PCHs) and pharmaceuticals. These areas have been examined at a population-level for Winnipeg. The provincial report also included information on the Mental Health Management Information System (MHMIS) however, in Winnipeg, few of the services utilize this provincial system, so this section was excluded in the Winnipeg analysis as it was not found to be useful. Finally, data on suicide and suicide attempts has been studied at the population level within Winnipeg. The Winnipeg Report, like the provincial report, has shown every indicator separately for males and females, since patterns can differ substantially between sexes. Geographical comparisons are given for the majority of indicators, including comparisons by neighbourhoods, by community areas, and by aggregate. For many of the indicators in this report, two further socio-demographic comparisons are provided: (a) by age grouping; and (b) by five neighbourhood income groupings (called “income quintiles”) based on the average household income of the area. What population is described in this report? This report is a population-based report. This means that the prevalence and the rates are based upon every person registered to receive health care benefits who has a Winnipeg address listed with Manitoba Health. For most analyses, the population consists of all people 10 years of age or older, who lived in Winnipeg for at least one year during the five fiscal years of 1997/98 through 2001/02. All indicators are age-adjusted to reflect the overall Winnipeg population age structure. Where people live, not where they go for treatment, is how the information is presented in this report. For example, a person living in a remote area may be hospitalized in Winnipeg for a certain illness, but the hospitalization is “attributed back” to the population living in that remote area. The Winnipeg data will therefore not indicate people who receive service in Winnipeg but live elsewhere in the province. By doing this, the report limits the insights into the health and health care use patterns of the population to the geographical region of residents in Winnipeg and does not take into account the use of Winnipeg health services by non-Winnipeg residents. The key comparisons by mental disorder grouping – “cumulative” versus “no disorder” In most of the graphs of this report, the rates of service use of those having one or more of the cumulative mental illness disorders is compared to the rate of service use of those having no disorder. The “cumulative disorders” group includes those diagnosed with one or more of the following mental illness conditions: depression, anxiety disorders, substance abuse, schizophrenia, and personality disorders. The “no disorders” group are those people aged 10 or more having no diagnostic indication for a mental disorder during the five-year period. There is a third group which is occasionally referred to in this report – those having “other disorders”. This group has at least one mental illness diagnosis in the five-year period, but not one of the five
4
“cumulative” disorders. For example, someone who has dementia only, with no other mental illness comorbidity, would be in the “other” group. Why “treatment prevalence” rather than just prevalence? “Prevalence” refers to that proportion of the population who has a certain condition during a given period of time (in our case, in a five-year time period). The data used for this report does not indicate who ‘has’ which disorder, but rather who received treatment for a mental illness from a physician, hospital or other service. Therefore, the results indicate treatment for the disorder rather than the prevalence per se, so we refer to the results as “treatment prevalence”. The data sources used for this report The Population Health Research Data Repository, housed at MCHP, was the main source of data used in this report. This includes anonymized hospital claims, medical claims, home care and personal care homes (also known as nursing homes) data, the registry files, vital statistics, pharmaceutical claims, and public use data from the 2001 Census of Canada. For selected indicators, we also used aggregate data from the Canadian Community Health Survey (CCHS) Cycle 1.1 2000-2001. This paper is a population based report which includes every person living in Winnipeg with a provincial health card, who is 10 years of age or older and has lived in Winnipeg at least one year during the 5 year period between April 1997 to March 2002. The report generally makes compares by area, by gender, by age and by income quintiles of the average household income in the area. The provincial MCHP report shows that there are 595,311 individuals age 10 years or older during the period of April 1997 to March 2002, who have a provincial heath card. The WRHA demographic profile report Volume 1 (2000), shows the 1998 population of Winnipeg was 646,733. The total of all persons under age 10 years was 85,260. There were 5.6 % of the population identified as Aboriginal. Those persons with a Treaty Number and no Manitoba Health card would not be included in this report. Also, this report includes persons who were residents during any one-year period during April 1997 to March 2002.
5

Key findings: Premature Mortality Rates (Chapter 1)
• Premature Mortality Rate (PMR) is a standardized rate of premature death prior to the age of 75. The numbers are represented with adjustments for age and sex per 1000 residents’ aged 0 to 74. The PMR is often used as a proxy for the overall health status of an area because those who die before the age of 75 generally have underlying health needs requiring health care.
• PMR for Winnipeg is approximately 3.5 premature deaths for every 1000 residents, which is the same as the overall provincial rate.
• Each Winnipeg Region graph shows the 12 community areas listed in the order of increasing overall PMR with the lowest rates having the best overall PMR as a proxy for the best overall health.
• While the overall Winnipeg premature mortality rates match the overall provincial rates, there are significantly differences within Winnipeg at both the community areas level and at the neighbourhood level.
• The following community areas have the lowest overall PMR (proxy for best health status) as follows:
− 1st Fort Garry, − 2nd Assiniboine South and − 3rd St Vital.
Community Areas with the highest overall PMR (proxy for poorest overall health status) is:
− 1st Point Douglas, − 2nd Downtown and − 3rd Inkster.
• At the neighbourhood level, the lowest PMR and best health status is: − 1st River East north, − 2nd Inkster west, − 3rd Fort Garry south, − 4th Fort Garry north, − 5th Assiniboine South. The neighbourhoods with the highest PMR and worst health status is: − 1st Point Douglas west, − 2nd Downtown east, − 3rd Inkster east, − 4th River East south, − 5th St Boniface west.
6

0 1 2 3 4 5 6 7 8 9
Fort Garry *
Assiniboine South *
St. Vital *
River Heights *
St. Boniface *
River East *
Seven Oaks *
St. James-Assiniboia
Transcona
Inkster
Downtown *
Point Douglas *
Winnipeg
Rural South (n)
North (n)
10
1991-2000
WPG avg
* indicates area's rate was statistically different from Winnipeg average'n' indicates Rural South and North not statistically tested
Figure 1.1.1: Winnipeg Premature Mortality Rates by Community Areas Age- and sex- adjusted rate of deaths per 1000 residents aged 0-74
7

0 1 2 3 4 5 6 7 8 9 1
Fort Garry S *Fort Garry N *
Assiniboine South *
St. Vital S *St. Vital N
River Heights W *River Heights E
St. Boniface E *St. Boniface W *
River East N *River East E *
River East W *River East S *
Seven Oaks NSeven Oaks WSeven Oaks E
St. James-Assiniboia W *St. James-Assiniboia E *
Transcona
Inkster W *Inkster E *
Downtown W *Downtown E *
Point Douglas N *Point Douglas S *
Winnipeg
0
1991-2000WPG avg
Figure 1.1.2: Winnipeg Premature Mortality Rates by Neighbourhood Clusters Age- and sex- adjusted rate of deaths per 1000 residents aged 0-74
8

Figure 1.2.1: Percent of Residents (aged 10 years +) Within Each Category of Mental Illness Groupings
0% 10% 20% 30% 40% 50% 60% 70% 80% 90% 100%
5 Major Disorders'Cumulative' 25.0%
Residents with one or more of: Depression, Anxiety, Substance Abuse, Personality
Disorders, or Schizophrenia
None61.2%
Residents with no service use formental health disorders of any kind
(This is the comparison group in all analyses)
Residents with service use for mental health disorders, but
excluding people in the 'Cumulative'
group
Other13.9%
'Any' group = 'Cumulative' + 'Other'
Percent of total Winnipeg population
9

Treatment prevalence of mental disorders (Chapter 2)
• Of all Winnipeg residents, the five-year treatment prevalence for any mental illness shows that:
− 61.15 % have no diagnosed mental illness (Approx pop. 363,467) with Males at 67.5% (194,734) and Females at 55.1% (168,733)
− 38.86 % show a five-year treatment prevalence for any mental illness (Approx pop. 231,842) with Males at 32.5% (93,841) and Females at 44.9% (137,336)
− 24.99 % have one or more of the five major disorders referred to as the “cumulative disorders” group (i.e. Depression, Anxiety, Substance Abuse, Personality Disorder and Schizophrenia). (Approx pop. 149,145) with Males at 20% (57,579) and Females at 29.9% (91,566)
− 13.87 % have a mental health diagnosis other than one of the five major disorders and are in the “other” group. (Approx pop. 82,699) with Males at 12.7% (36,646) and Females at 15.1% (46,053)
• The treatment prevalence in general in Winnipeg is higher for females compared with males for the following: “cumulative disorders” (29.9% female or 91,566 versus 20% for males or 57,579).
• Winnipeg treatment prevalence figures are significantly higher than the Manitoba average for each of depression, anxiety, schizophrenia, personality disorders, dementia, ADD/ADHD and “other” disorders.
• The breakdown across the five diagnoses is as follows: − Depression: 24.3% females (75,010) and 13.7% males (37660); − Anxiety disorders: 9.5% females (28,409) versus 5.5% males (15,272); − Personality disorder: 1.2 % females (3,619) versus 1.0% males (2,941);
• The treatment prevalence in Winnipeg is also higher for females compared with males within the “other disorders”: (15.0 % versus 12.8%).
• The treatment prevalence of schizophrenia is similar for females 1.4 % (4,250). and males 1.4 % (4,182).
• Only Substance Abuse is lower than the provincial average. • The treatment prevalence shows a pattern reversal with higher rates for males than
females in each of Substance Abuse and ADD/ ADHD as follows: Substance Abuse is slightly lower for females 4.8 % (14,625) than males 6.2 % (17,894). The treatment prevalence of ADD/ADHD in children ages four to 18 is significantly higher in Winnipeg with much lower rates in females 1.5% (967) compared to males 5.2% (3,506).
• Older adults have a particularly high treatment prevalence of dementia at aged 80-84 with over one third of the population treated for dementia by age 90.
• There is a strong relationship between neighbourhood income and the prevalence of mental illness, generally with poorer areas having the highest treatment prevalence. The one exception is the childhood treatment prevalence of ADD/ADHD, where there is no relationship with neighbourhood income.
• Of those treated for any mental illness (38.86 % in Winnipeg), over one-third had at least one other mental illness diagnosis or co-morbid condition, but this varies by
10

condition with nearly half of those in the group treated for depression; three quarters of those treated for schizophrenia and almost all of those treated for personality disorders.
• Treatment Prevalence for Cumulative Disorders was higher in females than males and increased up to age 45 then decreased to age 65 with a sharp decline at age 80, The expected pattern of lowest treatment prevalence in the highest income quintile was found. The treatment prevalence did not vary greatly by neighbourhood although the greatest treatment prevalence rates were in the areas of:
− Point Douglas west for both males and females − Downtown east for both males and females − Point Douglas north for both males and females − River East south for both males and females − River Heights east for both males and females
• Treatment Prevalence for Other Disorders is slightly higher for females than males in the younger years, but is about equal from age 35 on and shows a sharp increase after the age of 75 for both males and females. There appears to be no relationship to income quintile for “other disorders” where the highest income quintile has the same treatment prevalence as the lowest income quintile. Dementia is suggested as the diagnosis that may be contributing to this pattern, as dementia is one of the few diagnoses that appear to be equal across income quintiles. The treatment prevalence did not vary greatly by neighbourhood although the greatest treatment prevalence rates were in the areas of:
− St Vital south for both males and females − Seven Oaks north for females only − Transcona for males and females − Seven Oaks west for males and females − Inkster west for females only
• Neighbourhood area data showed some variation by diagnosis that could not easily be explained however, given the relationship between income and treatment prevalence, there is likely a link with low-income housing, residential care settings and senior housing, as well as perhaps some link to physician practices in specific neighbourhoods.
11

Figure 2.1.1: Winnipeg Treatment Prevalence of Cumulative Disorders by Community Areas, 1997/98-2001/02
Age-adjusted percentage of residents (aged 10 years +) with disorder
0% 10% 20% 30% 40% 50% 60%
Fort Garry (m, f, d)
Assiniboine South (m, d)
St. Vital (m, d)
River Heights (m, f, d)
St. Boniface (d)
River East (m, d)
Seven Oaks (d)
St. James-Assiniboia (f, d)
Transcona (f, d)
Inkster (m, f, d)
Downtown (m, d)
Point Douglas (m, f, d)
Winnipeg (d)
Rural South (n)
North (n)
malesfemalesWPG avg malesWPG avg females
'm' indicates area's rate for males with the disorder was statistically different from Winnipeg average for males 'f' indicates area's rate for females with disorder was statistically different from Winnipeg average for females'd' indicates difference between two groups' rates was statistically significant for that area's' indicates data suppressed due to small numbers'n' indicates Rural South and North not statistically tested
12

Figure 2.1.2: Winnipeg Treatment Prevalence of Cumulative Disorders by Neighbourhood Clusters, 1997/98-2001/02
Age adjusted percentage of residents (aged 10 years+) w ith disorder
0% 10% 20% 30% 40% 50% 60%
Fort Garry S (m, f , d)
Fort Garry N (m, f , d)
Assiniboine South (m, d)
St . Vital S (m, f , d)
St. Vital N (f , d)
River Heights W (d)
River Heights E (m, f , d)
St . Boniface E (m, d)
St. Boniface W (m, f , d)
River East N (m, f , d)
River East E (m, d)
River East W (m, f , d)
River East S (m, f , d)
Seven Oaks N (m, d)
Seven Oaks W (m, f , d)
Seven Oaks E (m, f , d)
St. James-Assiniboia W (m, f , d)
St. James-Assiniboia E (f , d)
Transcona (f , d)
Inkster W (m, f , d)
Inkster E (d)
Downtown W (f , d)
Downtown E (m, f , d)
Point Douglas N (m, f , d)
Point Douglas S (m, f , d)
Winnipeg (d)
males
females
WPG avg males
WPG avg females
13

Figure 2.1.3: WinnipegTreatment Prevalence of Cumulative Disorders by Age and Sex, 1997/98-2001/02
0%
5%
10%
15%
20%
25%
30%
35%
40%
45%
50%
55%
60%
10 15 20 25 30 35 40 45 50 55 60 65 70 75 80 90
Age Groups (years)
male
female
Figure 2.1.4: Winnipeg Treatment Prevalence of Cumulative Disorders by Income Quintile, 1997/98-2001/02
Age-adjusted percentage of residents (aged 10 years +) with disorder
0% 10% 20% 30% 40% 50% 60%
Income Not Found
Lowest Winnipeg W1
W2
W3
W4
Highest Winnipeg W5malesfemales
Linear Trend Test ResultsFemale: Winnipeg: Significant (p<.001) Male: Winnipeg: Significant (p<.001)
Male: 2.7% Female: 3.0%
14

Figure 2.2.1: Winnipeg Treatment Prevalance of Other Disorders by Community Areas, 1997/98-2001/02
Age-adjusted percentage of residents (aged 10 years +) with disorder
0% 10% 20% 30% 40% 50% 60%
Fort Garry (m, d)
Assiniboine South (m, d)
St. Vital (m, f, d)
River Heights (m, f, d)
St. Boniface (m, d)
River East (m, f, d)
Seven Oaks (d)
St. James-Assiniboia (f, d)
Transcona (m, f, d)
Inkster (f, d)
Downtown (f, d)
Point Douglas (m, d)
Winnipeg (d)
Rural South (n)
North (n)
malesfemalesWPG avg malesWPG avg females
'm' indicates area's rate for males with the disorder was statistically different from Winnipeg average for males 'f' indicates area's rate for females with disorder was statistically different from Winnipeg average for females'd' indicates difference between two groups' rates was statistically significant for that area's' indicates data suppressed due to small numbers 'n' indicates Rural South and North not statistically tested
15

Figure 2.2.2: Winnipeg Treatment Prevalence of Other Disorders by Neighbourhood Clusters, 1997/98-2001/02
Age-adjusted percentage of residents (aged 10 years+) with disorder
0% 10% 20% 30% 40% 50% 60%
Fort Garry S (m, d)
Fort Garry N (m, d)
Assiniboine South (m, d)
St. Vital S (m, f, d)
St. Vital N (d)
River Heights W (m, f, d)
River Heights E (d)
St. Boniface E (m)
St. Boniface W (d)
River East N (f)
River East E (d)
River East W (m, f, d)
River East S (m, f, d)
Seven Oaks N (d)
Seven Oaks W (m, f, d)
Seven Oaks E (f, d)
St. James-Assiniboia W (f)
St. James-Assiniboia E (f, d)
Transcona (m, f, d)
Inkster W (f, d)
Inkster E (d)
Downtown W (f, d)
Downtown E (m, f, d)
Point Douglas N (m, f, d)
Point Douglas S (m, d)
Winnipeg (d)
malesfemalesWPG avg malesWPG avg females
16

Figure 2.2.3: Winnipeg Treatment Prevalence of Other Disorders by Age and Sex, 1997/98-2001/02
0%
5%
10%
15%
20%
25%
30%
35%
40%
45%
50%
55%
60%
10 15 20 25 30 35 40 45 50 55 60 65 70 75 80 90
Age Groups (years)
male
female
Figure 2.2.4: Winnipeg Treatment Prevalence of Other Disorders by
Income Quintile, 1997/98-2001/02Age-adjusted percentage of residents (aged 10 years +) with disorder
0% 10% 20% 30% 40% 50% 60%
Income Not Found
Lowest Winnipeg W1
W2
W3
W4
Highest Winnipeg W5 malesfemales
Linear Trend Test ResultsFemale: Winnipeg: Not Significant Male: Winnipeg: Not Significant
Male: 3.2% Female: 5.6%
17

Dementia is the top diagnosis in the “other diagnosis” category,. There is a strong similarly in treatment prevalence for females and males up to age 75 then an increase in the female treatment prevalence. There is of course a sharp increase in treatment prevalence after age 70. There is little correlation in treatment prevalence by income quintile, however there is a slight treatment prevalence increase in the lowest income quintile. Significantly higher rates of dementia were found in the neighbourhoods of: − Point Douglas west for both males and females − Seven Oaks north for both males and females − River East east for females only − Assiniboine south for females only − St Vital south for females only
Figure 2.3.1: Winnipeg Treatment Prevalence of Dementia by Community Areas, 1997/98-2001/02
Age-adjusted percentage of residents (aged 55 years +) with disorder
0% 2% 4% 6% 8% 10% 12% 14% 16% 18% 20%
Fort Garry (m, f, d)Assiniboine South (f, d)
St. Vital (d)
River Heights (d)St. Boniface (m, f, d)
River East (m, f, d)Seven Oaks (f, d)
St. James-Assiniboia (d)
Transcona (m, f, d)Inkster (m, f, d)
Dow ntow n (m, d)Point Douglas (f, d)
Winnipeg (d)Rural South (n)
North (n)
males
females
WPG avg males
WPG avg females
'm' indicates area's rate for males with the disorder was stat ist ically dif ferent from Winnipeg average for males 'f ' indicates area's rate for females with disorder was stat ist ically dif ferent f rom Winnipeg average for females'd' indicates dif ference between two groups' rates was stat ist ically signif icant for that area's' indicates data suppressed due to small numbers'n' indicates Rural South and North not stat ist ically tested
18

Figure 2.3.2: Winnipeg Treatment Prevalence of Dementia by Neighbourhood Clusters, 1997/98-2001/02
Age-adjusted percentage of residents (aged 55 years+) with disorder
0% 2% 4% 6% 8% 10% 12% 14% 16% 18% 20%
Fort Garry S (m, f, d)
Fort Garry N (m, f, d)
Assiniboine South (f, d)
St. Vital S (f, d)
St. Vital N (f, d)
River Heights W (d)
River Heights E (d)_
St. Boniface E (m, f)
St. Boniface W (d)
River East N (m, f)
River East E (f, d)
River East W (m, f, d)
River East S (f)
Seven Oaks N (m, f, d)
Seven Oaks W (d)
Seven Oaks E (f, d)
St. James-Assiniboia W (m, d)
St. James-Assiniboia E (d)
Transcona (m, f, d)
Inkster W (m, f)
Inkster E (d)
Downtown W (f, d)
Downtown E (m, d)
Point Douglas N (m, f)
Point Douglas S (m, f, d)
Winnipeg (d)
malesfemalesWPG avg malesWPG avg females
21.79
19

Figure 2.3.3: Treatment Prevalence of Dementia by Age and Sex, 1997/98-2001/02
0%
5%
10%
15%
20%
25%
30%
35%
40%
45%
50%
55%
60%
55 60 65 70 75 80 90
Age Groups (years)
male
female
Figure 2.3.4: Winnipeg Treatment Prevalence of Dementia by Income Quintile, 1997/98-2001/02
Age-adjusted percentage of residents (aged 55 years +) with disorder
0% 10% 20% 30% 40% 50% 60%
Income Not Found
Lowest Winnipeg W1
W2
W3
W4
Highest Winnipeg W5 malesfemales
Linear Trend Test ResultsFemale: Winnipeg: Significant (p<.001)
Male: Winnipeg: Significant (p<.001)
Male: 20.8% Female: 32.8%
20

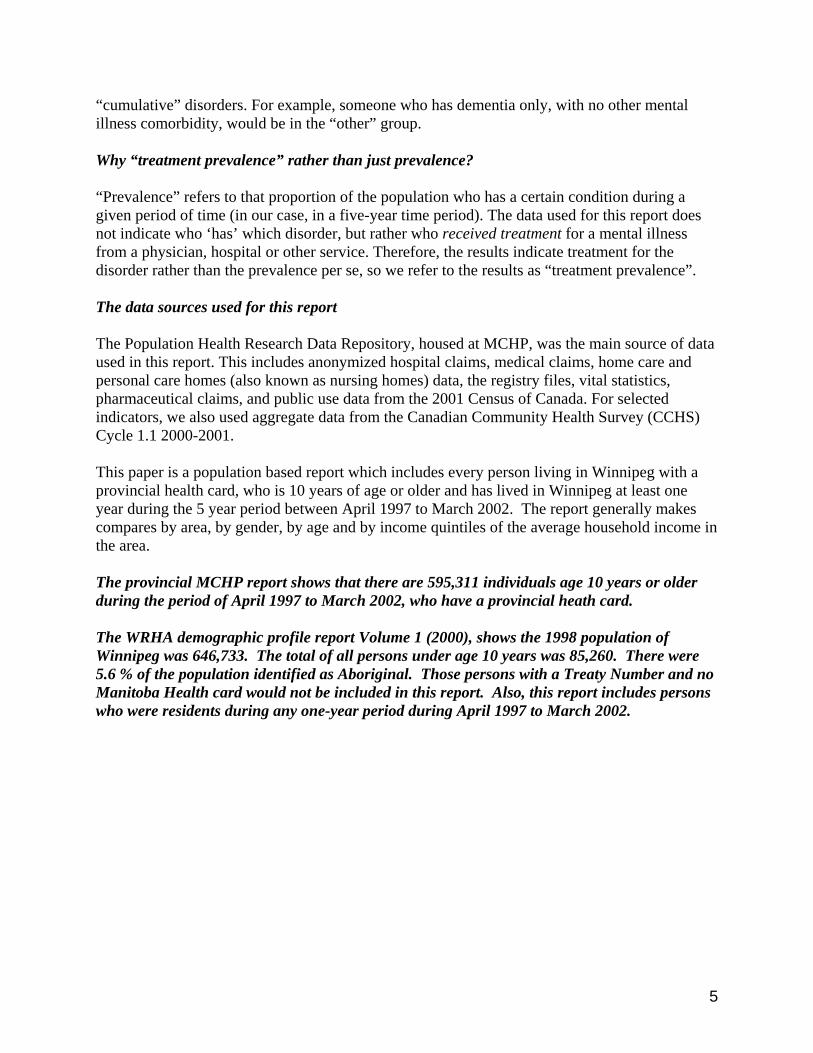
Depression is much more frequent in females than males and increase up to the age of 45 then decreases to age 65 when there is a slight increase, greater for males than females, following the expected pattern of lowest treatment prevalence in the highest income quintile. Significantly higher rates of depression were found in the neighbourhoods of: − Point Douglas west for both males and females − River Heights east for both males and females − St Boniface west for both males and females − Downtown east for females only − River Heights west for both males and females
Figure 2.4.1: Winnipeg Treatment Prevalence of Depression by Community Areas, 1997/98-2001/02
Age-adjusted percentage of residents (aged 10 years +) with disorder
0% 5% 10% 15% 20% 25% 30% 35% 40% 45% 50% 55% 60%
Fort Garry (m, f, d)
Assiniboine South (d)
St. Vital (m, d)River Heights (m, f, d)
St. Boniface (d)River East (m, d)
Seven Oaks (d)
St. James-Assiniboia (f, d)Transcona (d)
Inkster (m, f, d)
Dow ntow n (m, f, d)Point Douglas (m, f, d)
Winnipeg (d)
Rural South (n)
North (n)
males
females
WPG avg males
WPG avg females
'm' indicates area's rate for males with the disorder was stat ist ically dif ferent from Winnipeg average for males 'f ' indicates area's rate for females with disorder was stat ist ically dif ferent from Winnipeg average for females'd' indicates dif ference between two groups' rates was stat ist ically signif icant for that area's' indicates data suppressed due to small numbers'n' indicates Rural South and North not stat ist ically tested
21
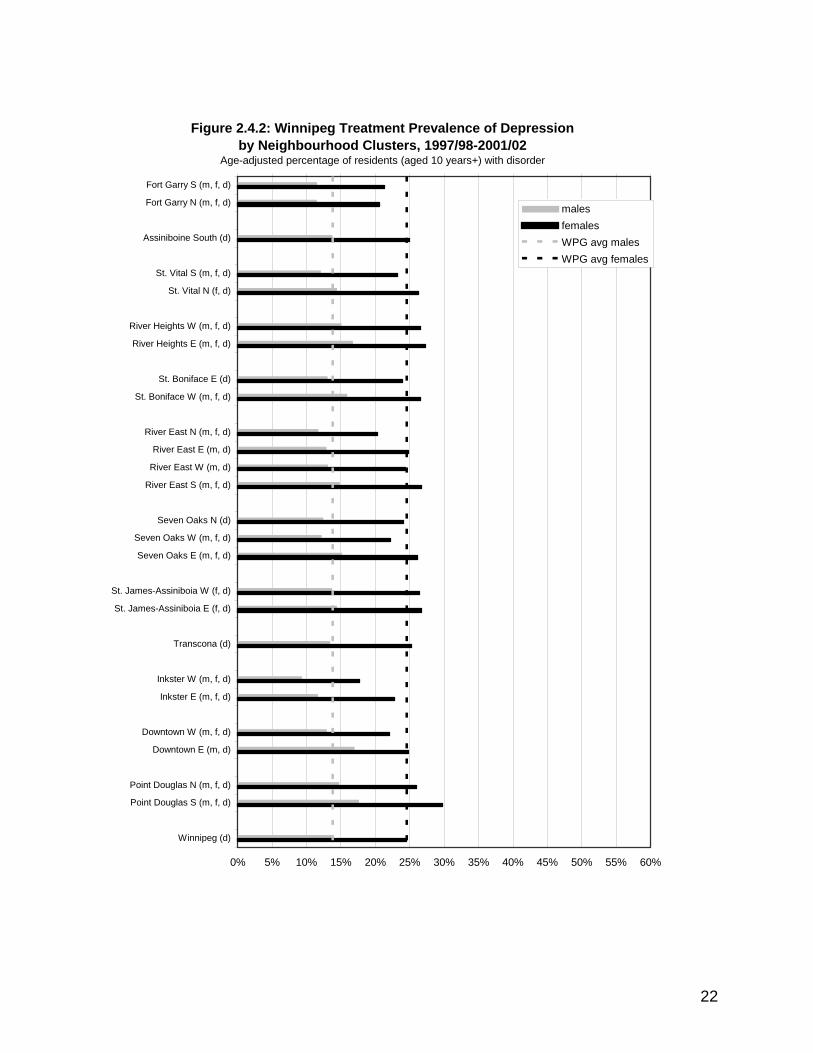
Figure 2.4.2: Winnipeg Treatment Prevalence of Depression by Neighbourhood Clusters, 1997/98-2001/02
Age-adjusted percentage of residents (aged 10 years+) with disorder
0% 5% 10% 15% 20% 25% 30% 35% 40% 45% 50% 55% 60%
Fort Garry S (m, f, d)
Fort Garry N (m, f, d)
Assiniboine South (d)
St. Vital S (m, f, d)
St. Vital N (f, d)
River Heights W (m, f, d)
River Heights E (m, f, d)
St. Boniface E (d)
St. Boniface W (m, f, d)
River East N (m, f, d)
River East E (m, d)
River East W (m, d)
River East S (m, f, d)
Seven Oaks N (d)
Seven Oaks W (m, f, d)
Seven Oaks E (m, f, d)
St. James-Assiniboia W (f, d)
St. James-Assiniboia E (f, d)
Transcona (d)
Inkster W (m, f, d)
Inkster E (m, f, d)
Downtown W (m, f, d)
Downtown E (m, d)
Point Douglas N (m, f, d)
Point Douglas S (m, f, d)
Winnipeg (d)
malesfemalesWPG avg malesWPG avg females
22

Figure 2.4.3: Winnipeg Treatment Prevalence of Depression by Age and Sex, 1997/98-2001/02
0%
5%
10%
15%
20%
25%
30%
35%
40%
45%
50%
55%
60%
10 15 20 25 30 35 40 45 50 55 60 65 70 75 80 90
Age Groups (years)
male
female
Figure 2.4.4: Winnipeg Treatment Prevalence of Depression by Income Quintile, 1997/98-2001/02
Age-adjusted percentage of residents (aged 10 years +) with disorder
0% 10% 20% 30% 40% 50% 60%
Income Not Found
Lowest Winnipeg W1
W2
W3
W4
Highest Winnipeg W5 malesfemales
Linear Trend Test ResultsFemale: Winnipeg: Significant (p<.001)Male: Winnipeg: Significant (p<.001)
Male: 2.4% Female: 2.8%
23

Anxiety Disorders were more frequent in females than males and fairly consistent across the life span, following the expected pattern of lowest treatment prevalence in the highest income quintile. Significantly higher rates of anxiety were found in the neighbourhoods of: − Point Douglas west for both females and males − Transcona for both females and males − Downtown east for both females and males − Point Douglas north for females only − St Vital north for females only
Figure 2.5.1: Winnipeg Treatment Prevalence of Anxiety Disorders by Community Areas, 1997/98-2001/02
Age-adjusted percentage of residents (aged 10 years +) with disorder
0% 10% 20% 30% 40% 50% 60%
Fort Garry (m, f, d)
Assiniboine South (d)
St. Vital (f, d)
River Heights (m, d)
St. Boniface (m, d)River East (m, f, d)
Seven Oaks (m, f, d)
St. James-Assiniboia (m, d)
Transcona (m, f, d)
Inkster (m, d)
Dow ntow n (m, f, d)Point Douglas (m, f, d)
Winnipeg (d)
Rural South (n)
North (n)
males
females
WPG avg males
WPG avg females
'm' indicates area's rate for males with the disorder was stat ist ically dif ferent f rom Winnipeg average for males 'f ' indicates area's rate for females with disorder was stat ist ically dif ferent from Winnipeg average for females'd' indicates dif ference between two groups' rates was stat ist ically signif icant for that area's' indicates data suppressed due to small numbers'n' indicates Rural South and North not stat ist ically tested
24

Figure 2.5.2: Winnipeg Treatment Prevalence of Anxiety Disorders by Neighbourhood Cluster, 1997/98-2001/02
Age-adjusted percentage of residents (aged 10 years+) with disorder
0% 10% 20% 30% 40% 50% 60%
Fort Garry S (m, f, d)
Fort Garry N (m, f, d)
Assiniboine South (d)
St. Vital S (m, d)
St. Vital N (f, d)
River Heights W (f, d)
River Heights E (m, d)
St. Boniface E (d)
St. Boniface W (d)
River East N (m, f, d)
River East E (m, f, d)
River East W (m, f, d)
River East S (m, f, d)
Seven Oaks N (d)
Seven Oaks W (f, d)
Seven Oaks E (m, f, d)
St. James-Assiniboia W (m, d)
St. James-Assiniboia E (m, f, d)
Transcona (m, f, d)
Inkster W (m, d)
Inkster E (m, d)
Downtown W (d)
Downtown E (m, f, d)
Point Douglas N (f, d)
Point Douglas S (m, f, d)
Winnipeg (d)
malesfemalesWPG avg malesWPG avg females
25
Figure 2.5.3: Winnipeg Treatment Prevalence of Anxiety Disorders by Age and Sex, 1997/98-2001/02
0%
10%
20%
30%
40%
50%
60%
10 15 20 25 30 35 40 45 50 55 60 65 70 75 80 90
Age Groups (years)
male
female
Figure 2.5.4: Winnipeg Treatment Prevalence of Anxiety Disorders by Income Quintile, 1997/98-2001/02
Age-adjusted percentage of residents (aged 10 years +) with disorder
0% 10% 20% 30% 40% 50% 60%
Income Not Found
Lowest Winnipeg W1
W2
W3
W4
Highest Winnipeg W5malesfemales
Linear Trend Test ResultsFemale: Winnipeg: Significant (p<.001) Male: Winnipeg: Significant (p<.001)
Male: 1.4% Female: 1.6%
26

Substance Abuse Disorders were only slightly more frequent in males than females and show an incline up to age 30 then a steady decline into the elder years, with the lowest treatment prevalence in the highest income quintile. Significantly higher rates of Substance Abuse Disorders were found in the neighbourhoods of: − Point Douglas west for both males and females − Downtown east for both males and females − Inkster east for both males and females − St Boniface west for both males and females − River East south for both males and females
Figure 2.6.1: Winnipeg Treatment Prevalance of Substance Abuse by Community Areas, 1997/98-2001/02
Age-adjusted percentage of residents (aged 10 years +) with disorder
0% 5% 10% 15% 20% 25% 30% 35% 40% 45% 50% 55% 60%
Fort Garry (m, f, d)
Assiniboine South (m, f, d)
St. Vital (m)
River Heights (m, f, d)
St. Boniface (d)River East (m, d)
Seven Oaks (m, f, d)
St. James-Assiniboia (m, d)
Transcona (d)
Inkster (d)
Dow ntow n (m, f, d)Point Douglas (m, f, d)
Winnipeg (d)
Rural South (n)
North (n)
males
females
WPG avg males
WPG avg females
'm' indicates area's rate for males with the disorder was stat ist ically dif ferent f rom Winnipeg average for males 'f ' indicates area's rate for females with disorder was stat ist ically dif ferent f rom Winnipeg average for females'd' indicates dif ference between two groups' rates was stat ist ically signif icant for that area's' indicates data suppressed due to small numbers'n' indicates Rural South and North not stat ist ically tested
27
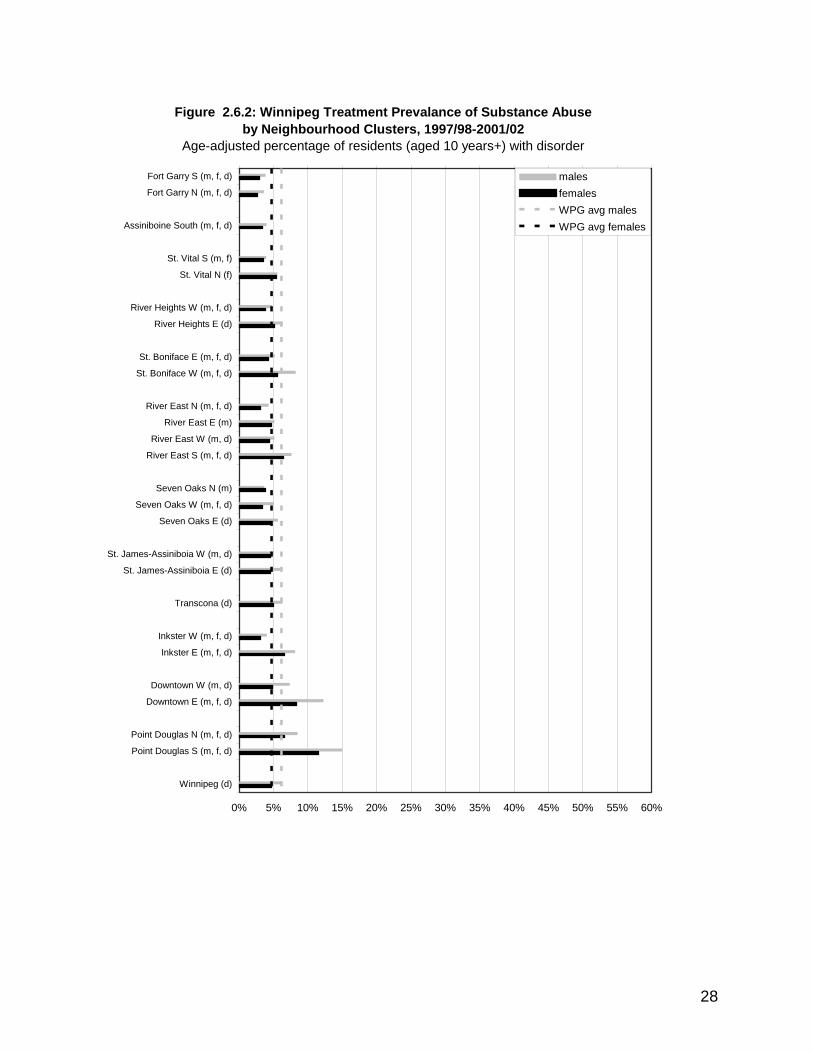
Figure 2.6.2: Winnipeg Treatment Prevalance of Substance Abuse by Neighbourhood Clusters, 1997/98-2001/02
Age-adjusted percentage of residents (aged 10 years+) with disorder
0% 5% 10% 15% 20% 25% 30% 35% 40% 45% 50% 55% 60%
Fort Garry S (m, f, d)
Fort Garry N (m, f, d)
Assiniboine South (m, f, d)
St. Vital S (m, f)
St. Vital N (f)
River Heights W (m, f, d)
River Heights E (d)
St. Boniface E (m, f, d)
St. Boniface W (m, f, d)
River East N (m, f, d)
River East E (m)
River East W (m, d)
River East S (m, f, d)
Seven Oaks N (m)
Seven Oaks W (m, f, d)
Seven Oaks E (d)
St. James-Assiniboia W (m, d)
St. James-Assiniboia E (d)
Transcona (d)
Inkster W (m, f, d)
Inkster E (m, f, d)
Downtown W (m, d)
Downtown E (m, f, d)
Point Douglas N (m, f, d)
Point Douglas S (m, f, d)
Winnipeg (d)
malesfemalesWPG avg malesWPG avg females
28

Figure 2.6.3:Winnipeg Treatment Prevalence of Substance Abuse by Age and Sex, 1997/98-2001/02
0%
5%
10%
15%
20%
25%
30%
35%
40%
45%
50%
55%
60%
10 15 20 25 30 35 40 45 50 55 60 65 70 75 80 90
Age Groups (years)
male
female
Figure 2.6.4: Winnipeg Treatment Prevalence of Substance Abuse Disorders by Income Quintile, 1997/98-2001/02
Age-adjusted percentage of residents (aged 10 years +) with disorder
0% 10% 20% 30% 40% 50% 60%
Income Not Found
Lowest Winnipeg W1
W2
W3
W4
Highest Winnipeg W5malesfemales
Linear Trend Test ResultsFemale: Winnipeg: Significant (p<.001)Male: Winnipeg: Significant (p<.001)
Male: 2.8% Female: 2.0%
29

Schizophrenia treatment prevalence is similar in females and males with an increase in treatment prevalence over age for females and a decrease for males after age 45. There is a strong relationship between treatment prevalence and income quintile with the highest prevalence in the lowest income quintile. Significantly higher rates of schizophrenia were found in the neighbourhoods of: − Downtown east for both males and females − Point Douglas west for both males and females − Downtown west for both males and females − River Heights east for both males and females − St Boniface west for both males and females
0.0% 1.0% 2.0% 3.0% 4.0% 5.0% 6.0% 7.0% 8.0% 9.0% 10.0%
Fort Garry (m, f)Assiniboine South (m, f)
St. Vital (m, f, d)River Heights (f)St. Boniface (f)River East(m, f)
Seven Oaks (m, d)St. James-Assiniboia (m, f)
Transcona (m, f, d)Inkster (m)
Dow ntow n (m, f, d)Point Douglas (m, f)
Winnipeg Rural South (n)
North (n)
males
females
WPG avg males
WPG avg females
'm' indicates area's rate for males with the disorder was stat ist ically dif ferent from Winnipeg average for males 'f ' indicates area's rate for females with disorder was stat ist ically dif ferent f rom Winnipeg average for females'd' indicates dif ference between two groups' rates was stat ist ically signif icant for that area's' indicates data suppressed due to small numbers'n' indicates Rural South and North not stat ist ically tested
Figure 2.7.1: Winnipeg Treatment Prevalence of Schizophrenia by Community Areas, 1997/98-2001/02
Age-adjusted percentage of residents (aged 10 years +) w ith disorder
30

Figure 2.7.2: Winnipeg Treatment Prevalence of Schizophrenia by Neighbourhood Clusters, 1997/98-2001/02
Age-adjusted percentage of residents (aged 10 years+) with disorder
0.0% 1.0% 2.0% 3.0% 4.0% 5.0% 6.0% 7.0% 8.0% 9.0% 10.0%
Fort Garry S (m, f)
Fort Garry N (m, f)
Assiniboine South (m, f)
St. Vital S (m, f, d)
St. Vital N (m, d)
River Heights W (m)
River Heights E (m, f)
St. Boniface E (m, f)
St. Boniface W (m, f)
River East N (m, f)
River East E (m, d)
River East W (m, f)
River East S
Seven Oaks N (m)
Seven Oaks W
Seven Oaks E (m)
St. James-Assiniboia W (m, f)
St. James-Assiniboia E (m)
Transcona (m, f, d)
Inkster W (m, f)
Inkster E
Downtown W (m, f, d)
Downtown E (m, f, d)
Point Douglas N
Point Douglas S (m, f, d)
Winnipeg
malesfemalesWPG avg malesWPG avg females
31

Figure 2.7.3: Winnipeg Treatment Prevalence of Schizophrenia by Age and Sex, 1997/98-2001/02
0%
1%
2%
3%
4%
5%
6%
7%
8%
9%
10%
10 15 20 25 30 35 40 45 50 55 60 65 70 75 80 90
Age Groups (years)
male
female
Figure 2.7.4: Winnipeg Treatment Prevalence of Schizophrenia by Income Quintile, 1997/98-2001/02
Age-adjusted percentage of residents (aged 10 years +) with disorder
0% 1% 2% 3% 4% 5% 6% 7% 8% 9% 10%
Income Not Found
Lowest Winnipeg W1
W2
W3
W4
Highest Winnipeg W5malesfemales
Linear Trend Test ResultsFemale: Winnipeg: Significant (p<.001)
Male: Winnipeg: Significant (p<.001)
Male: 9.6% Female: 13.2%
32

Personality Disorder treatment prevalence is slightly greater for females than males with a similar pattern across the life span for both females and males. There is a sharp increase in prevalence in early adulthood, followed by a fairly static pattern through to age 35, then a decrease in treatment prevalence to age 60 and a slight increase in treatment prevalence after age 65. There is a strong relationship between treatment prevalence and income quintile with the highest prevalence in the lowest income quintile. Significantly higher rates of personality disorder were found in the neighbourhoods of: − Downtown east for both males and females − River Heights east for both males and females − St Boniface west for both males and females − Point Douglas west for both males and females − River Heights west for both males and females
Figure 2.8.1: Winnipeg Treatment Prevalence of Personality Disorder by Community Areas, 1997/98-2001/02
Age-adjusted percentage of residents (aged 10 years +) with disorder
0.0% 0.5% 1.0% 1.5% 2.0% 2.5% 3.0% 3.5% 4.0% 4.5% 5.0%
Fort Garry (m, f, d)Assiniboine South
St. Vital (m, f, d)River Heights (m, f)
St. Boniface (d)River East (d)
Seven Oaks (m, f, d)St. James-Assiniboia (d)
Transcona (m, f, d)Inkster (m, f)
Dow ntow n (m, f)Point Douglas (m)
Winnipeg (d)Rural South (n)
North (n)
males
females
WPG avg males
WPG avg females
'm' indicates area's rate for males with the disorder was stat ist ically dif ferent from Winnipeg average for males 'f ' indicates area's rate for females with disorder was stat ist ically dif ferent f rom Winnipeg average for females'd' indicates dif ference between two groups' rates was stat ist ically signif icant for that area's' indicates data suppressed due to small numbers'n' indicates Rural South and North not stat ist ically tested
33

Figure 2.8.2: Winnipeg Treatment Prevalence of Personality Disorder by Neighbourhood Clusters, 1997/98-2001/02
Age-adjusted percentage of residents (aged 10 years+) with disorder
0.0% 0.5% 1.0% 1.5% 2.0% 2.5% 3.0% 3.5% 4.0% 4.5% 5.0%
Fort Garry S (m, f, d)
Fort Garry N (m, f)
Assiniboine South
St. Vital S (m, f, d)
St. Vital N (d)
River Heights W (m)
River Heights E (m, f)
St. Boniface E (m, f)
St. Boniface W (m, f, d)
River East N (m)
River East E (d)
River East W
River East S
Seven Oaks N
Seven Oaks W (m, f, d)
Seven Oaks E
St. James-Assiniboia W (m, d)
St. James-Assiniboia E
Transcona (m, f, d)
Inkster W (m, f)
Inkster E
Downtown W
Downtown E (m, f)
Point Douglas N
Point Douglas S (m, f)
Winnipeg (d)
malesfemalesWPG avg malesWPG avg females
34

Figure 2.8.3: Winnipeg Treatment Prevalence of Personality Disorders by Age and Sex, 1997/98-2001/02
0.0%
0.5%
1.0%
1.5%
2.0%
2.5%
3.0%
3.5%
4.0%
4.5%
5.0%
10 15 20 25 30 35 40 45 50 55 60 65 70 75 80 90
Age Groups (years)
Perc
ent
male
female
Figure 2.8.4: Winnipeg Treatment Prevalence of Personality Disorders by Income Quintile, 1997/98-2001/02
Age-adjusted percentage of residents (aged 10 years +) with disorder
0% 1% 2% 3% 4% 5%
Income Not Found
Lowest Winnipeg W1
W2
W3
W4
Highest Winnipeg W5malesfemales
Linear Trend Test ResultsFemale: Winnipeg: Significant (p<.001)
Male: Winnipeg: Significant (p<.001)
Male: 7.3% Female: 6.1%
35

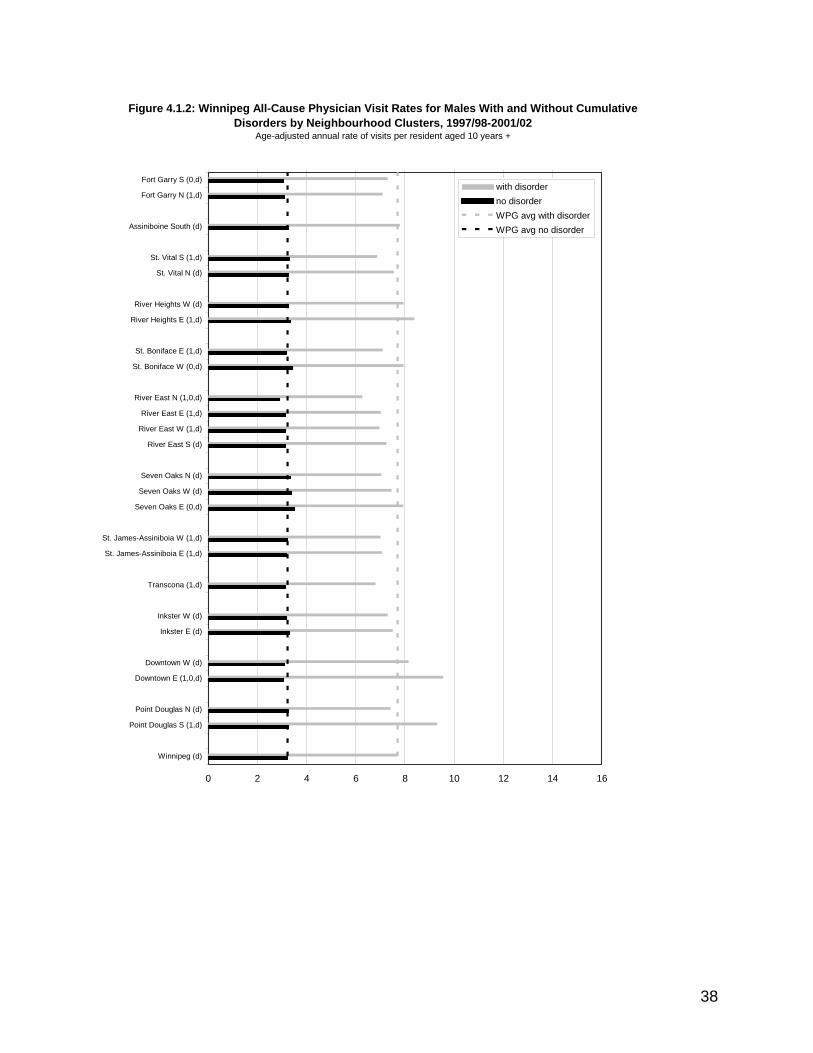
Use of Physician Services by those with mental illness diagnoses (Chapter 4) Males and females in the "cumulative disorders" group visit physicians more than twice as often as those with no mental illnesses (males 7.7 versus 3.2; females 9.2 versus 4.1 visits per person per year). Visits for mental illness do not make up the entire difference in rates; people with mental illness visit physicians almost twice as often for every kind of physical illness as well (for example, respiratory illnesses). About one in 10 physician visits for all Manitobans was coded as being 'for' mental illness. The Winnipeg data equivalence for the provincial data is 10.4%1 for males, 11.5%2 for females. While the pattern is similar in Winnipeg, overall, there is slightly high physician visit rate for all reasons for Winnipeg residents than for Manitoba as a whole. Among those with mental illness for all Manitobans, about one in five of their visits were for mental illness (i.e., had a mental illness diagnosis associated with the visit). The Winnipeg data equivalence for the provincial data is 24.5%3 for males, 21.7% for females. The 'total burden' of mental illness on the medical care system is high: males in the "cumulative disorders" group account for about 37.6%4 of all visits for males, even though they comprise only 19% of the male population. Females in the "cumulative disorders" group account for about 48%5 of all visits for females, even though they comprise only 29% of the female population. There is no relationship between neighbourhood income and all-cause physician visit rate, except for people in "cumulative disorders" group where there both the highest income group and the lowest income group visit physicians equally and more than the middle income groups. The highest rate of visit to physicians for mental illness disorders is for the cumulative disorders group showing the following outcomes by neighbourhood: - River Heights east for both females and males - River Heights west for both females and males - Downtown east for both females and males - St Boniface west for both females and males - Assiniboine South for both females and males The pattern of visits to all physicians for mental illnesses with a cumulative disorder by age and sex shows a steady increase to age 40 followed by an equally steady decrease to age 65, then a sharp increase throughout the remaining years of life. This pattern is identical for females and males. The pattern for visits to psychiatrist for mental disorders shows more males than females attending up to age 30 then more females that males attending to age 45. From age 45 on, there
1 This found in either tables 5.1.1, 5.1.2 or 5.1.3 in MCHP Mental Illness Report 2 This found in either tables 5.1.1, 5.1.2 or 5.1.3 in MCHP Mental Illness Report 3 This found in either tables 5.1.1, 5.1.2 or 5.1.3 in MCHP Mental Illness Report 4 This found in either tables 5.1.1, 5.1.2 or 5.1.3 in MCHP Mental Illness Report 5 This found in either tables 5.1.1, 5.1.2 or 5.1.3 in MCHP Mental Illness Report
36

are equal numbers of males and females attending and a continual decrease in visit rate to psychiatrists throughout the rest of the life span. There is a strong income gradient in the use of psychiatrists and a reversed pattern from the expected, showing the highest visit rates being in the highest neighbourhood income areas for both males and females. The neighbourhoods with the highest psychiatrist visit rates are: - River Heights west for both females and males - River Heights east for both females and males - Assiniboine South for both females and males - Downtown east for males only - Fort Gary south for males only Population-based visit rates to psychiatrists are much higher in the urban areas compared to the non-urban areas (Winnipeg 0.8 visits per person; compared to Brandon: 0.4 visits per person; North about 0.04 visits per person; Rural South 0.2 visits per person).
0 2 4 6 8 10 12 14 16
Fort Garry (1,0,d)
Assiniboine South (d)
St. Vital (1,d)
River Heights (1,d)
St. Boniface (d)
River East (1,0,d)
Seven Oaks (0,d)
St. James-Assiniboia (1,d)
Transcona (1,d)
Inkster (d)
Downtown (1,0,d)
Point Douglas (1,d)
Winnipeg (d)
Rural South (n)
North (n)
with disorderno disorderWPG avg with disorderWPG avg no disorder
Figure 4.1.1: Winnipeg All-Cause Physician Visit Rates for Males With and Without Cumulative Disorders by Community Area, 1997/98-2001/02
Age-adjusted annual rate of visits per resident aged 10 years +
'1' indicates area's rate for those with disorder was statistically different from Manitoba average with disorder'0' indicates area's rate for those without disorder was statistically different from Manitoba average without disorder'd' indicates difference between two groups' rates was statistically significant for that area's' indicates data suppressed due to small numbers'n' indicates Rural South and North not statistically tested
37
0 2 4 6 8 10 12 14 16
Fort Garry S (0,d)
Fort Garry N (1,d)
Assiniboine South (d)
St. Vital S (1,d)
St. Vital N (d)
River Heights W (d)
River Heights E (1,d)
St. Boniface E (1,d)
St. Boniface W (0,d)
River East N (1,0,d)
River East E (1,d)
River East W (1,d)
River East S (d)
Seven Oaks N (d)
Seven Oaks W (d)
Seven Oaks E (0,d)
St. James-Assiniboia W (1,d)
St. James-Assiniboia E (1,d)
Transcona (1,d)
Inkster W (d)
Inkster E (d)
Downtown W (d)
Downtown E (1,0,d)
Point Douglas N (d)
Point Douglas S (1,d)
Winnipeg (d)
with disorderno disorderWPG avg with disorderWPG avg no disorder
Figure 4.1.2: Winnipeg All-Cause Physician Visit Rates for Males With and Without Cumulative Disorders by Neighbourhood Clusters, 1997/98-2001/02
Age-adjusted annual rate of visits per resident aged 10 years +
38

0
2
4
6
8
10
12
14
16
10 15 20 25 30 35 40 45 50 55 60 65 70 75 80 90
Age Groups (years)
with disorder
no disorder
Figure 4.1.3: Winnipeg All-Cause Physician Visit Rates for Males With and Without Cumulative Disorders by Age and Sex, 1997/98-2001/02
Average annual rate of visits per resident aged 10 years +
Figure 4.1.4: Winnipeg All-Cause Physician Visit Rates for Males With and Without Cumulative Disorders by Income Quintile, 1997/98-2001/02
Age-adjusted annual rate of visits per residents aged 10 years +
0 2 4 6 8 10
Income Not Found (1.9%)
Lowest Winnipeg W1
W2
W3
W4
Highest Winnipeg W5
12
with disorderno disorder
Linear Trend Test Results Winnipeg with disorder: Significant (p<.05)
Winnipeg no disorder: Not Significant
39

0 2 4 6 8 10 12 14 16
Fort Garry (1,0,d)
Assiniboine South (d)
St. Vital (d)
River Heights (1,d)
St. Boniface (d)
River East (1,0,d)
Seven Oaks (0,d)
St. James-Assiniboia (1,d)
Transcona (1,d)
Inkster (d)
Downtown (1,d)
Point Douglas (1,0,d)
Winnipeg (d)
Rural South (n)
North (n)
with disorderno disorderWPG avg with disorderWPG avg no disorder
'1' indicates area's rate for those with disorder was statistically different from Manitoba average with disorder'0' indicates area's rate for those without disorder was statistically different from Manitoba average without disorder'd' indicates difference between two groups' rates was statistically significant for that area's' indicates data suppressed due to small numbers'n' indicates Rural South and North not statistically tested
Figure 4.1.5: Winnipeg All-Cause Physician Visit Rates for Females With and Without Cumulative Disorders by Community Areas, 1997/98-2001/02
Age-adjusted annual rate of visits per resident aged 10 years +
40

0 2 4 6 8 10 12 14 1
Fort Garry S (1,0,d)
Fort Garry N (1,0,d)
Assiniboine South (d)
St. Vital S (1,d)
St. Vital N (d)
River Heights W (d)
River Heights E (1,d)
St. Boniface E (1,d)
St. Boniface W (0,d)
River East N (1,0,d)
River East E (d)
River East W (1,0,d)
River East S (d)
Seven Oaks N (d)
Seven Oaks W (d)
Seven Oaks E (0,d)
St. James-Assiniboia W (1,d)
St. James-Assiniboia E (1,d)
Transcona (1,d)
Inkster W (d)
Inkster E (d)
Downtown W (1,d)
Downtown E (1,d)
Point Douglas N (0,d)
Point Douglas S (1,0,d)
Winnipeg (d)
6
with disorderno disorderWPG avg with disorderWPG avg no disorder
Figure 4.1.6: Winnipeg All-Cause Physician Visit Rates for Females With and Without Cumulative Disorders by Neighbourhood Clusters, 1997/98-2001/02
Age-adjusted annual rate of visits per resident aged 10 years +
41

0
2
4
6
8
10
12
14
16
10 15 20 25 30 35 40 45 50 55 60 65 70 75 80 90
Age Groups (years)
with disorder
no disorder
Figure 4.1.7: Winnipeg All-Cause Physician Visit Rates for Females With and Without Cumulative Disorders by Age and Sex, 1997/98-2001/02
Average annual rate of visits per resident aged 10 years +
Figure 4.1.8: Winnipeg All-Cause Physician Visit Rates for Females With and Without Cumulative Disorders by Income Quintile, 1997/98-2001/02
Age-adjusted annual rate of visits per residents aged 10 years +
0 2 4 6 8 10
Income Not Found (2.5%)
Lowest Winnipeg W1
W2
W3
W4
Highest Winnipeg W5
12
with disorderno disorder
Linear Trend Test Results Winnipeg with disorder: Significant (p<.05) Winnipeg no disorder: Significant (p<.05)
42

Figure 4.1.9: Winnipeg All-Cause Physician Visit Rates by Sex and Cause Cumulative Disorders vs. No Disorders , 1997/98-2001/02
RespiratoryRespiratory
RespiratoryRespiratory
Circulatory
Circulatory
Circulatory
Circulatory
Musculoskeletal
Musculoskeletal
Musculoskeletal
Musculoskeletal
Ill-Defined
Ill-Defined
Ill-Defined
Ill-Defined
Nervous
Nervous
Nervous
Nervous
Endocrine & Metab
Endocrine & Metab
Endocrine & Metab
Endocrine & Metab
Genitourinary
Genitourinary
Injury & Poison
Injury & Poison
Injury & Poison
All Others
All Others
All Others
All Others
Mental
Mental
Genitourinary
Genitourinary
Injury & Poison
Pregnancy & Birth
Pregnancy & Birth
0
1
2
3
4
5
6
7
8
9
10
Cumulative No Disorders Cumulative No Disorders
Age
-adj
uste
d an
nual
rate
of v
isits
to a
ll ph
ysic
ians
, per
resi
dent
MalesFemales
43

0.0 0.5 1.0 1.5 2.0 2.5 3.0
Fort Garry
Assiniboine South (m)
St. Vital (m,d)
River Heights (m,f)
St. Boniface
River East (m,f,d)
Seven Oaks (d)
St. James-Assiniboia (m,f,d)
Transcona (m,f,d)
Inkster (m,f)
Downtown (m,f)
Point Douglas (m,d)
Winnipeg (d)
Rural South (n)
North (n)
malesfemalesWPG avg malesWPG avg females
'm' indicates area's rate for males with the disorder was statistically different from Winnipeg average for males 'f' indicates area's rate for females with disorder was statistically different from Winnipeg average for females'd' indicates difference between two groups' rates was statistically significant for that area's' indicates data suppressed due to small numbers'n' indicates Rural South and North not statistically tested
Figure 4.2.1: Winnipeg Visit Rates to All Physicians for Mental illness Disorders for those With Cumulative Disorders by Community Areas, 1997/98-2001/02
Age-adjusted annual rate of residents aged 10 years +
44

0.0 0.5 1.0 1.5 2.0 2.5 3.0
Fort Garry S (f)
Fort Garry N
Assiniboine South (m)
St. Vital S (m,d)
St. Vital N
River Heights W (m,f)
River Heights E (m,f)
St. Boniface E (m,d)
St. Boniface W (m)
River East N
River East E (m,d)
River East W
River East S
Seven Oaks N
Seven Oaks W (m,d)
Seven Oaks E
St. James-Assiniboia W (m,f)
St. James-Assiniboia E (m)
Transcona (m,f,d)
Inkster W (m,f)
Inkster E (m,f)
Downtown W
Downtown E (m,f)
Point Douglas N (m,f,d)
Point Douglas S
Winnipeg (d)
malesfemalesWPG avg malesWPG avg females
Figure 4.2.2: Winnipeg Visit Rates to All Physicians for Mental illness Disorders for those With Cumulative Disorders by Neighbourhood Clusters, 1997/98-2001/02
Age-adjusted annual rate of residents aged 10 years+
45

0.0
0.5
1.0
1.5
2.0
2.5
3.0
10 15 20 25 30 35 40 45 50 55 60 65 70 75 80 90
Age Groups (years)
male
female
Figure 4.2.3: Winnipeg Visit Rates to All Physicians for Mental Illness Disorders for those with Cumulative Disorders by Age and Sex, 1997/98-2001/02
Average annual rate of visits per resident aged 10 years+
0.0 0.5 1.0 1.5 2.0 2.5 3.0
Income Not Found
Lowest Winnipeg W1
W2
W3
W4
Highest Winnipeg W5 malesfemales
Linear Trend Test ResultsFemale: Winnipeg: Not Significant Male: Winnipeg: Not Significant
Male:3.5% Female:3.9%
Figure 4.2.4: Winnipeg Visit Rates to All Physicians for Mental Illness Disorders for those With Cumulative Disorders by Income Quintile, 1997/98-2001/02
Age-adjusted annual rate of visits per residents aged 10 years +
46

0.0 0.2 0.4 0.6 0.8 1.0 1.2 1.4 1.6
Fort Garry
Assiniboine South (m,f,d)
St. Vital (m)
River Heights (m,f)
St. Boniface
River East (m,f)
Seven Oaks
St. James-Assiniboia
Transcona (m,f)
Inkster (m,f)
Downtown
Point Douglas (m,f)
Winnipeg (d)
Rural South (n)
North (n)
malesfemalesWPG avg malesWPG avg females
'm' indicates area's rate for males with the disorder was statistically different from Winnipeg average for males 'f' indicates area's rate for females with disorder was statistically different from Winnipeg average for females'd' indicates difference between two groups' rates was statistically significant for that area's' indicates data suppressed due to small numbers'n' indicates Rural South and North not statistically tested
Figure 4.3.1: Winnipeg Visit Rates to Psychiatrists for Mental Illness Disorders for those with Cumulative Disorders by Community Areas, 1997/98-2001/02
Age-adjusted annual rate of vists per resident aged 10 years +
47

0.0 0.2 0.4 0.6 0.8 1.0 1.2 1.4 1.6
Fort Garry S (d)
Fort Garry N
Assiniboine South (m,f,d)
St. Vital S (m)
St. Vital N
River Heights W (m,f,d)
River Heights E (m,f)
St. Boniface E
St. Boniface W
River East N
River East E (m)
River East W
River East S (m)
Seven Oaks N
Seven Oaks W (m)
Seven Oaks E
St. James-Assiniboia W
St. James-Assiniboia E
Transcona (m,f)
Inkster W (m,f)
Inkster E (f)
Downtown W
Downtown E (m)
Point Douglas N (m,f)
Point Douglas S (m,f)
Winnipeg (d)
males
females
WPG avg males
WPG avg females
Figure 4.3.2: Winnipeg Visit Rates to Psychiatrists for Mental Illness Disorders forthose with Cumulative Disorders by Neighbourhood Clusters, 1997/98-2001/02
Age-adjusted annual rate of vists per resident aged 10 years +
48

0.0
0.2
0.4
0.6
0.8
1.0
1.2
1.4
1.6
10 15 20 25 30 35 40 45 50 55 60 65 70 75 80 90
Age Groups (years)
male
female
Figure 4.3.3: Winnipeg Visit Rates to Psychiatrists for Mental Illness Disorders for those with Cumulative Disorders by Age and Sex, 1997/98-2001/02
Average annual rate of visits per resident aged 10 years+
0.0 0.2 0.4 0.6 0.8 1.0 1.2 1.4 1.6 1.8 2.0
Income Not Found
Lowest Winnipeg W1
W2
W3
W4
Highest Winnipeg W5 malesfemales
Linear Trend Test ResultsFemale: Winnipeg: Significant (p<.05)Male: Winnipeg: Significant (p<.05)
Male: 2.7% Female: 1.6%
Figure 4.3.4: Winnipeg Visit Rates to Psychiatrists for Mental Illness Disorders for those with Cumulative Disorders by Income Quintile, 1997/98-2001/02
Age-adjusted annual rate of visits per residents aged 10 years +
49

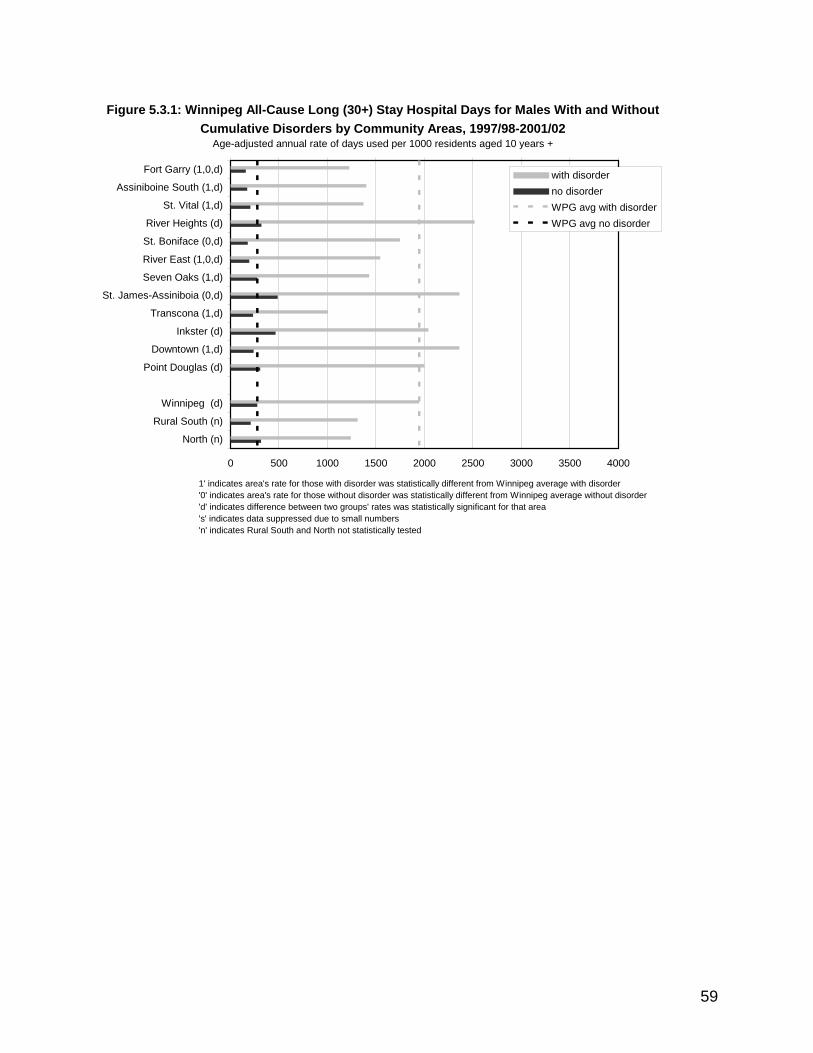
Use of Hospital Services by those with a mental illness diagnosis (Chapter 5) In comparison to the provincial average, males and females in Winnipeg had significantly fewer all-cause hospital separations with and without cumulative disorders. The patterns of hospitalization between males and females differ only with females using more hospital services during the years between 15 to 35 with a peak at age 20 to 25 and is likely accounted for by the childbearing years. Males and females in the "cumulative disorders" group were hospitalized more than twice as often as those in the "no disorders" group (males 0.196 versus 0.087; females 0.258 versus 0.139 hospital separations per person per year). Those in the "cumulative group" were also physically sicker; with hospitalization rates for every physical illness nearly double those of the "no disorders" group. For all hospitalizations of Manitobans, about one in 10 had a mental illness diagnosis as the most responsible cause (13% for males, 8% for female hospitalizations) which was similar to Winnipeg data which shows 14% in males for Winnipeg and 8% for females. Those in the "cumulative disorders" group" used short stay days in acute facilities at more than double the rate of those with no disorders. For long stay days, the rate difference was even higher: four-fold for females, and almost seven-fold for males. The 'total burden' on the acute hospital system attributable to mental illness is high: males in the "cumulative disorders" group used 38.3% of all separations, despite comprising only 19% of the male population. They also used 44.1% of all short stay hospital days, and 54.8% of all long stay days. Females in the "cumulative disorders" group used 44.1% of all separations, despite comprising only 29% of the female population. They also used 47.8% of all short stay hospital days, and 55.1% of all long stay days. There is a strong income gradient in hospital separation rates for males and females in both the "cumulative" and "no disorder" groups, with the highest rates in the lowest neighbourhood income areas. Those diagnosed with schizophrenia and with personality disorders have a substantially higher use of acute hospital and mental health centre services than any other mental disorder group. • All cause hospital separations by neighborhood for males with and without cumulative
disorders show the highest number of hospitalization separations from: - Point Douglas west for those with cumulative disorders only - Downtown east for those with cumulative disorders only - Inkster east for those with cumulative disorders only - River East south for those with cumulative disorders only
6 Figure 5.1.1 7 Figure 5.1.1 8 Figure 5.1.5 9 Figure 5.1.5
50

- St James Assiniboine east those without disorders are higher users All cause hospital separations by neighborhood for females with and without cumulative disorders is nearly identical to males differing only in the fifth highest hospital separations for females being in: - Downtown west for those with cumulative disorders only
0 100 200 300 400 500 600 700 800
Fort Garry (1,0,d)
Assiniboine South (1,d)
St. Vital (1,d)
River Heights (d)
St. Boniface (1,d)
River East (0,d)
Seven Oaks (d)
St. James-Assiniboia (0,d)
Transcona (1,d)
Inkster (d)
Downtown (1,0,d)
Point Douglas (1,d)
Winnipeg (d)
Rural South (n)
North (n)
with disorderno disorderWPG avg with disorderWPG avg no disorder
1' indicates area's rate for those with disorder was statistically different from Winnipeg average with disorder'0' indicates area's rate for those without disorder was statistically different from Winnipeg average without disorder'd' indicates difference between two groups' rates was statistically significant for that area's' indicates data suppressed due to small numbers'n' indicates Rural South and North not statistically tested
Figure 5.1.1: Winnipeg All-Cause Hospital Separations for Males With and Without Cumulative Disorders by Community Areas, 1997/98-2001/02
Age-adjusted annual rate of separations per 1000 residents aged 10 years +
51

0 100 200 300 400 500 600 700 800
Fort Garry S (0,d)
Fort Garry N (d)
Assiniboine South (1,d)
St. Vital S (1,d)
St. Vital N (d)
River Heights W (d)
River Heights E (d)
St. Boniface E (1,0,d)
St. Boniface W (d)
River East N (d)
River East E (d)
River East W (0,d)
River East S (0,d)
Seven Oaks N (d)
Seven Oaks W (0,d)
Seven Oaks E (0,d)
St. James-Assiniboia W (1,d)
St. James-Assiniboia E (0,d)
Transcona (1,d)
Inkster W (1,0,d)
Inkster E (1,d)
Downtown W (0,d)
Downtown E (1,d)
Point Douglas N (d)
Point Douglas S (1,d)
Winnipeg (d)
with disorderno disorderWPG avg with disorderWPG avg no disorder
Figure 5.1.2: Winnipeg All-Cause Hospital Separation for Males With and Without Cumulative Disorders by Neighbourhood Clusters, 1997/98-2001/02
Age-adjusted annual rate of separations per 1000 residents aged 10 years +
52

0
100
200
300
400
500
600
700
800
900
1000
10 15 20 25 30 35 40 45 50 55 60 65 70 75 80 90
Age Groups (years)
with disorder
no disorder
Figure 5.1.3:Winnipeg All-Cause Hospital Separations for Males With and Without Cumulative Disorders by Age and Sex, 1997/98-2001/02
Annual average rate of separations per 1000 residents aged 10 years +
Figure 5.1.4: Winnipeg All Cause Hospital Separation for Males With and Without Cumulative Disorders by Income Quintile, 1997/98-2001/02
Age-adjusted annual rate of separations per 1000 resdidents aged 10 +
0 50 100 150 200 250 300 350 400 450 500
Income Not Found (3.3%)
Lowest Winnipeg W1
W2
W3
W4
Highest Winnipeg W5 with disordersno disorder
Linear Trend Test Results Winnipeg With: Significant (p<.001)
Winnipeg No Disorders: Significant (p<.05)
53

0 100 200 300 400 500 600 700 800
Fort Garry (1,0,d)Assiniboine South (1,0,d)
St. Vital (0,d)
River Heights (1,0,d)St. Boniface (1,d)
River East (0,d)
Seven Oaks (1,d)St. James-Assiniboia (d)
Transcona (1,d)Inkster (d)
Downtown (1,d)
Point Douglas (1,0,d)
Winnipeg (d)
Rural South (n)North (n)
with disorderno disorderWPG avg with disorderWPG avg no disorder
1' indicates area's rate for those with disorder was statistically different from Winnipeg average with disorder'0' indicates area's rate for those without disorder was statistically different from Winnipeg average without disorder'd' indicates difference between two groups' rates was statistically significant for that area's' indicates data suppressed due to small numbers'n' indicates Rural South and North not statistically tested
Figure 5.1.5: Winnipeg All-Cause Hospital Separation for Females With and Without Cumulative Disorders by Community Areas, 1997/98-2001/02
Age-adjusted annual rate of separations per 1000 residents aged 10 years +
54

0 100 200 300 400 500 600 700 800
Fort Garry S (0,d)
Fort Garry N (1,d)
Assiniboine South (1,0,d)
St. Vital S (1,0,d)
St. Vital N (d)
River Heights W (1,d)
River Heights E (d)
St. Boniface E (1,0,d)
St. Boniface W (d)
River East N (1,d)
River East E (d)
River East W (d)
River East S (1,0,d)
Seven Oaks N (d)
Seven Oaks W (d)
Seven Oaks E (1,d)
St. James-Assiniboia W (0,d)
St. James-Assiniboia E (0,d)
Transcona (1,d)
Inkster W (1,d)
Inkster E (1,0,d)
Downtown W (1,d)
Downtown E (1,0,d)
Point Douglas N (1,0,d)
Point Douglas S (1,0,d)
Winnipeg (d)
with disorderno disorderWPG avg with disorderWPG avg no disorder
Figure 5.1.6: Winnipeg All-Cause Hospital Separation for Females With and Without Cumulative Disorders by Neighbourhood Clusters, 1997/98-2001/02
Age-adjusted annual rate of separations per 1000 residents aged 10 years +
55

0
100
200
300
400
500
600
700
800
900
1000
10 15 20 25 30 35 40 45 50 55 60 65 70 75 80 90
Age Groups (years)
with disorder
no disorder
Figure 5.1.7: Winnipeg All-Cause Hospital Separations for Females With and Without Cumulative Disorders by Age and Sex, 1997/98-2001/02
Annual average rate of separations per 1000 residents aged 10 years +
Figure 5.1.8: Winnipeg All Cause Hospital Separation for Females With and Without Cumulative Disorders by Income Quintile, 1997/98-2001/02
Age-adjusted annual rate of separations per 1000 resdidents aged 10 +
0 50 100 150 200 250 300 350 400 450 500
Income Not Found (3.0%)
Lowest Winnipeg W1
W2
W3
W4
Highest Winnipeg W5 with disordersno disorder
Linear Trend Test Results Winnipeg With: Significant (p<.001)
Winnipeg No Disorders: Significant (p<.001)
56

0 500 1000 1500 2000 2500 3000 3500 4000
Fort Garry (0,d)
Assiniboine South (1,0,d)
St. Vital (1,d)
River Heights (d)
St. Boniface (d)
River East (d)
Seven Oaks (d)
St. James-Assiniboia (1,d)
Transcona (1,d)
Inkster (d)
Downtown (1,d)
Point Douglas (1,0,d)
Winnipeg (d)
Rural South (n)
North (n)
with disorderno disorderWPG avg with disorderWPG avg no disorder
Figure 5.2.1: Winnipeg All-Cause Short (<30) Stay Hospital Days for Males With and Without Cumulative Disorders by Community Areas, 1997/98-2001/02
Age-adjusted annual rate of days used per 1000 residents aged 10 years +
1' indicates area's rate for those with disorder was statistically different from Winnipeg average with disorder'0' indicates area's rate for those without disorder was statistically different from Winnipeg average without disorder'd' indicates difference between two groups' rates was statistically significant for that area's' indicates data suppressed due to small numbers'n' indicates Rural South and North not statistically tested
57

0 500 1000 1500 2000 2500 3000 3500 4000
Fort Garry S (0,d)
Fort Garry N (0,d)
Assiniboine South (1,0,d)
St. Vital S (1,d)
St. Vital N (d)
River Heights W (d)
River Heights E (d)
St. Boniface E (1,d)
St. Boniface W (d)
River East N (0,d)
River East E (d)
River East W (d)
River East S (0,d)
Seven Oaks N (d)
Seven Oaks W (d)
Seven Oaks E (0,d)
St. James-Assiniboia W (1,0,d)
St. James-Assiniboia E (0,d)
Transcona (1,d)
Inkster W (1,d)
Inkster E (d)
Downtown W (1,d)
Downtown E (1,d)
Point Douglas N (d)
Point Douglas S (1,0,d)
Winnipeg (d)
with disorderno disorderWPG avg with disorderWPG avg no disorder
Figure 5.2.2:Winnipeg All-Cause Short (<30) Stay Hospital Days for Males With andWithout Cumulative Disorders by Neighbourhood Clusters, 1997/98-2001/02
Age-adjusted annual rate of days used per 1000 residents aged 10 years +
58
0 500 1000 1500 2000 2500 3000 3500 4000
Fort Garry (1,0,d)
Assiniboine South (1,d)
St. Vital (1,d)
River Heights (d)
St. Boniface (0,d)
River East (1,0,d)
Seven Oaks (1,d)
St. James-Assiniboia (0,d)
Transcona (1,d)
Inkster (d)
Downtown (1,d)
Point Douglas (d)
Winnipeg (d)
Rural South (n)
North (n)
with disorderno disorderWPG avg with disorderWPG avg no disorder
Figure 5.3.1: Winnipeg All-Cause Long (30+) Stay Hospital Days for Males With and Without Cumulative Disorders by Community Areas, 1997/98-2001/02
Age-adjusted annual rate of days used per 1000 residents aged 10 years +
1' indicates area's rate for those with disorder was statistically different from Winnipeg average with disorder'0' indicates area's rate for those without disorder was statistically different from Winnipeg average without disorder'd' indicates difference between two groups' rates was statistically significant for that area's' indicates data suppressed due to small numbers'n' indicates Rural South and North not statistically tested
59

0 500 1000 1500 2000 2500 3000 3500 4000 4500 5000
Fort Garry S (1,0,d)
Fort Garry N (d)
Assiniboine South (1,d)
St. Vital S (1,d)
St. Vital N (1,d)
River Heights W (0,d)
River Heights E (1,0,d)
St. Boniface E (1,0,d)
St. Boniface W (1,d)
River East N (0,d)
River East E (d)
River East W (d)
River East S (d)
Seven Oaks N (d)
Seven Oaks W (1,0,d)
Seven Oaks E (1,d)
St. James-Assiniboia W (0,d)
St. James-Assiniboia E (1,0,d)
Transcona (1,d)
Inkster W (d)
Inkster E (d)
Downtown W (d)
Downtown E (1,d)
Point Douglas N (d)
Point Douglas S (1,d)
Winnipeg (d)
with disorderno disorderWPG avg with disorderWPG avg no disorder
Figure 5.3.2: Winnipeg All-Cause Long (30+) Stay Hospital Days for Males With andWithout Cumulative Disorders by Neighbourhood Clusters, 1997/98-2001/02
Age-adjusted annual rate of days used per 1000 residents aged 10 years +
60

0 10 20 30 40 50 60 70 80 90 10
Fort Garry (m)
Assiniboine South (f)
St. Vital (m,f)
River Heights
St. Boniface
River East (m,f)
Seven Oaks (m)
St. James-Assiniboia
Transcona (m,f)
Inkster
Downtown (m,f)
Point Douglas (m,f)
Winnipeg
Rural South (n)
North (n)
0
malesfemalesWPG avg with disorderWPG avg no disorder
'm' indicates area's rate for males with the disorder was statistically different from Winnipeg average for males'f' indicates area's rate for females with disorder was statistically different from Winnipeg average for females'd' indicates difference between two groups' rates was statistically significant for that area's' indicates data suppressed due to small numbers'n' indicates Rural South and North not statistically tested
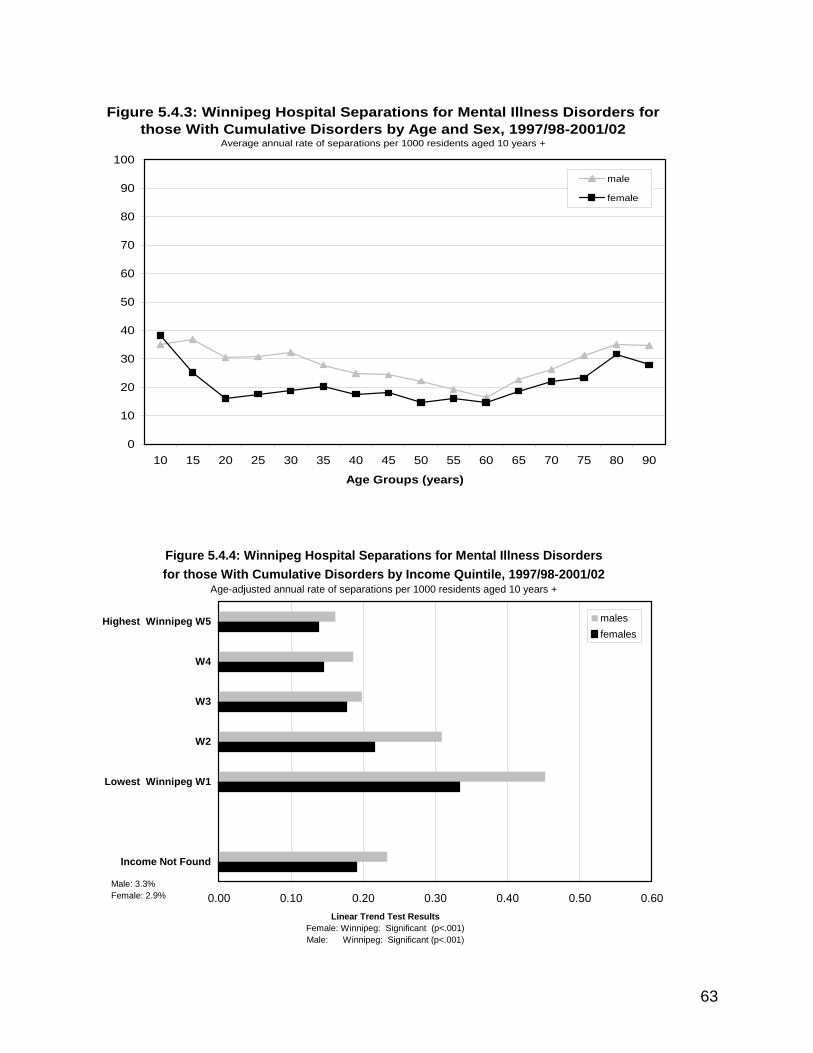
Figure 5.4.1:Winnipeg Hospital Separations for Mental Illness Disorders for those with Cumulative Disorders by Community Areas, 1997/98-2001/02
Age-adjusted annual rate of separations per 1000 residents aged 10 years +
61

0 10 20 30 40 50 60 70 80 90 1
Fort Garry S
Fort Garry N (m)
Assiniboine South (f)
St. Vital S (m,f)
St. Vital N (m)
River Heights W
River Heights E
St. Boniface E (m,f)
St. Boniface W
River East N (m)
River East E
River East W
River East S
Seven Oaks N
Seven Oaks W
Seven Oaks E (f)
St. James-Assiniboia W (m)
St. James-Assiniboia E
Transcona (m,f)
Inkster W (m,f)
Inkster E
Downtown W (m)
Downtown E (m,f)
Point Douglas N
Point Douglas S (m,f)
Winnipeg
00
malesfemalesWPG avg with disorderWPG avg no disorder
Figure 5.4.2: Winnipeg Hospital Separations for Mental Illness Disorders for those with Cumulative Disorders by Neighbourhood Clusters, 1997/98-2001/02
Age-adjusted annual rate of separation per 1000 residents aged 10 years +
62
0
10
20
30
40
50
60
70
80
90
100
10 15 20 25 30 35 40 45 50 55 60 65 70 75 80 90
Age Groups (years)
male
female
Figure 5.4.3: Winnipeg Hospital Separations for Mental Illness Disorders for those With Cumulative Disorders by Age and Sex, 1997/98-2001/02
Average annual rate of separations per 1000 residents aged 10 years +
Figure 5.4.4: Winnipeg Hospital Separations for Mental Illness Disorders for those With Cumulative Disorders by Income Quintile, 1997/98-2001/02
Age-adjusted annual rate of separations per 1000 residents aged 10 years +
0.00 0.10 0.20 0.30 0.40 0.50 0.60
Income Not Found
Lowest Winnipeg W1
W2
W3
W4
Highest Winnipeg W5 malesfemales
Linear Trend Test ResultsFemale: Winnipeg: Significant (p<.001) Male: Winnipeg: Significant (p<.001)
Male: 3.3% Female: 2.9%
63

0 50 100 150 200 250 300 350 400 450 500
Fort Garry (m)
Assiniboine South (f,d)
St. Vital (m)
River Heights (d)
St. Boniface (d)
River East (f,d)
Seven Oaks (d)
St. James-Assiniboia (d)
Transcona (m,f)
Inkster (d)
Downtown (m,f,d)
Point Douglas (m,d)
Winnipeg (d)
Rural South (n)
North (n)
malesfemalesWPG avg with disorderWPG avg no disorder
'm' indicates area's rate for males with the disorder was statistically different from Winnipeg average for males'f' indicates area's rate for females with disorder was statistically different from Winnipeg average for females'd' indicates difference between two groups' rates was statistically significant for that area's' indicates data suppressed due to small numbers'n' indicates Rural South and North not statistically tested
Figure 5.5.1: Winnipeg Short (<30) Stay Hospital Days for Mental Illness Disorders for those With Cumulative Disorders by Community Areas, 1997/98-2001/02
Age-adjusted annual rate of days used per 1000 residents aged 10 years +
64

0 50 100 150 200 250 300 350 400 450 500
Fort Garry S
Fort Garry N
Assiniboine South (d)
St. Vital S (m)
St. Vital N (m)
River Heights W (d)
River Heights E (d)
St. Boniface E (d)
St. Boniface W (d)
River East N
River East E (d)
River East W (d)
River East S (d)
Seven Oaks N (d)
Seven Oaks W (d)
Seven Oaks E (d)
St. James-Assiniboia W (m)
St. James-Assiniboia E (f,d)
Transcona (m,f)
Inkster W (m,f)
Inkster E (d)
Downtown W (m,f,d)
Downtown E (m,f,d)
Point Douglas N (d)
Point Douglas S (m,f,d)
Winnipeg (d)
malesfemalesWPG avg with disorderWPG avg no disorder
Figure 5.5.2: Winnipeg Short (<30) Stay Hospital Days for Mental Illness Disorders for those With Cumulative Disorders by Neighbourhood Clusters, 1997/98-2001/02
Age-adjusted annual rate of days used per 1000 residents aged 10 years +
65

0 100 200 300 400 500 600 700 800 900 1000 1100 1200 1300 1400 1500
Fort Garry (m)
Assiniboine South
St. Vital (m)
River Heights (d)
St. Boniface
River East
Seven Oaks (m)
St. James-Assiniboia (m,d)
Transcona (m,f)
Inkster (d)
Downtown (m,f,d)
Point Douglas (d)
Winnipeg (d)
Rural South (n)
North (n)
malesfemalesWPG avg with disorderWPG avg no disorder
Figure 5.6.1: Winnipeg Long (30+) Stay Hospital Days for Mental Illness Disorders for those With Cumulative Disorders by Community Areas, 1997/98-2001/02
Age-adjusted annual rate of days used per 1000 residents aged 10 years +
'm' indicates area's rate for males with the disorder was statistically different from Winnipeg average for males'f' indicates area's rate for females with disorder was statistically different from Winnipeg average for females'd' indicates difference between two groups' rates was statistically significant for that area's' indicates data suppressed due to small numbers'n' indicates Rural South and North not statistically tested
66

0 100 200 300 400 500 600 700 800 900 1000 1100 1200 1300 1400 1500
Fort Garry S
Fort Garry N
Assiniboine South
St. Vital S (f,d)
St. Vital N (m,d)
River Heights W (f,d)
River Heights E (d)
St. Boniface E (m,d)
St. Boniface W (m)
River East N (d)
River East E (d)
River East W (d)
River East S
Seven Oaks N (d)
Seven Oaks W (d)
Seven Oaks E (m,f,d)
St. James-Assiniboia W (d)
St. James-Assiniboia E (m,d)
Transcona (m,f)
Inkster W (f,d)
Inkster E
Downtown W (d)
Downtown E (m,f)
Point Douglas N (d)
Point Douglas S (m,d)
Winnipeg (d)
malesfemalesWPG avg with disorderWPG avg no disorder
Figure 5.6.2: Winnipeg Long (30+) Stay Hospital Days for Mental Illness Disorders for those With Cumulative Disorders by Neighbourhood Clusters, 1997/98-2001/02
Age-adjusted annual rate of days used per 1000 residents aged 10 years +
67

Home Care Use by those with a mental illness diagnosis (Chapter 6) • Similar to the Manitoba averages, Winnipeg people in the “cumulative disorders”
group used home care services at a rate 2.5 times higher than people in the “no disorders” group: 48 versus 14 cases per thousand for males; 60 versus 27 cases per thousand for females).
• For males, the average annual open home care cases is 2.9 times higher and in females, twice as high for those in the cumulative disorder group compared to the no disorder group.
• Those living in the lowest income neighbourhoods had the highest rate of home care use.
o At the community Area level, statistically more persons are open to Home Care both with disorders as well as those without disorders than the Winnipeg average in Downtown and Point Douglas.
o At the neighbourhood area, statistically more persons are open to Home Care with disorders as well as those without disorders than the Winnipeg average in the neighbourhoods of: River Heights East; St. Boniface East; Inkster East; Downtown East and Point Douglas West
o At the community Area level, statistically less persons are open to Home Care both with disorders as well as those without disorders than the Winnipeg average in Fort Garry, Assiniboine South.
o At the neighbourhood area, statistically less persons are open to Home Care both with disorders as well as those without disorders than the Winnipeg average in Fort Garry North; St. Vital North; St Boniface West; Seven Oaks West and Inkster West
• Those aged 55+ with dementia diagnoses are more likely to have an open home care case compared to those in the “cumulative disorders” group, who in turn are more likely than those in the “no disorders” group (Males: dementia 391.2; cumulative 47.8, no disorder 13.9 cases per thousand males age 55+; Females: dementia 407.3, cumulative 60.3, no disorders 13.9 cases per thousand females age 55+).
• Once a Winnipeg resident is receiving home care, the average length of a case is not dependent upon mental illness conditions. Males: dementia 258.5; cumulative 225.8, no disorder 204.9 cases per thousand males age 55+; Females: dementia 286.5, cumulative 264.4, no disorders 248.8 cases.
68

0 10 20 30 40 50 60 70 80 90 10
Fort Garry (1,0,d)
Assiniboine South (1,0,d)
St. Vital (d)
River Heights (d)
St. Boniface (d)
River East (d)
Seven Oaks (d)
St. James-Assiniboia (1,d)
Transcona (1,d)
Inkster (d)
Downtown (1,0,d)
Point Douglas (1,0,d)
Winnipeg (d)
Rural South (n)
North (n)
0
with disorderno disorderWPG avg with disorderWPG avg no disorder
'1' indicates area's rate for those with disorder was statistically different from Manitoba average with disorder'0' indicates area's rate for those without disorder was statistically different from Manitoba average without disorder'd' indicates difference between two groups' rates was statistically significant for that area's' indicates data suppressed due to small numbers'n' indicates Rural South and North not statistically tested
Figure 6.1.1:Winnipeg Open Home Care Cases for Males With and Without Cumulative Disorders by Community Areas, 1997/98-2001/02
Age-adjusted annual rate per 1000 residents aged 10 years +
69
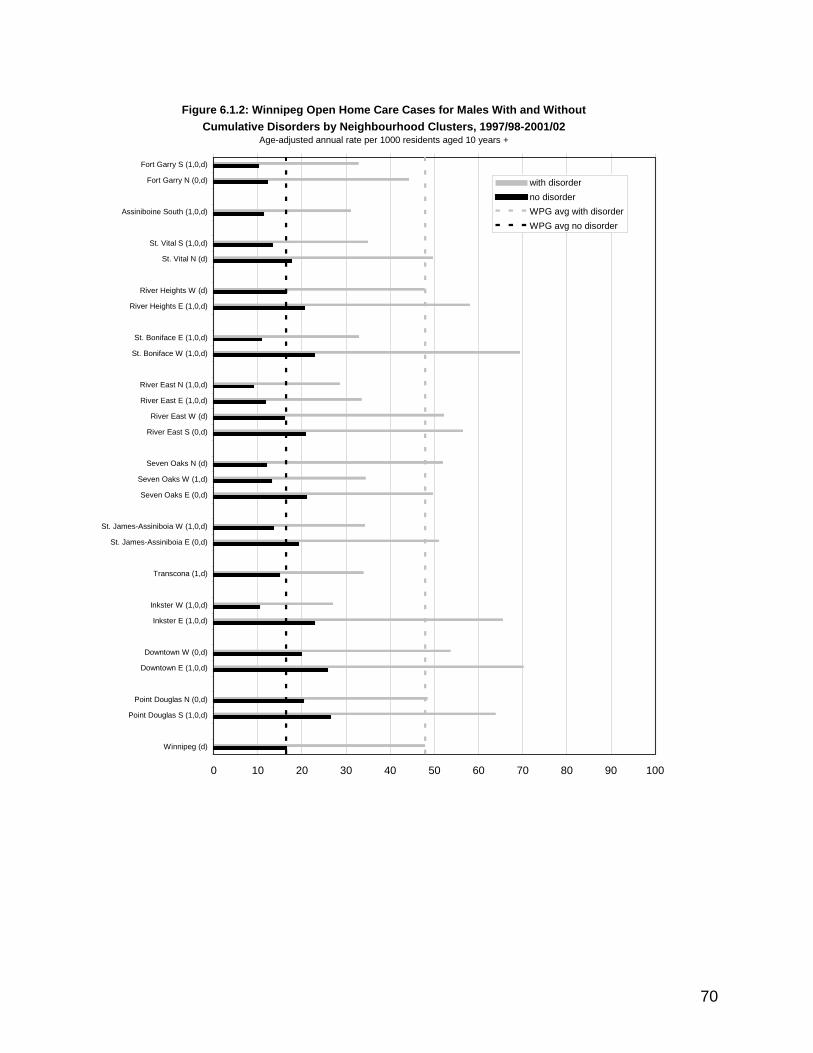
Figure 6.1.2: Winnipeg Open Home Care Cases for Males With and Without Cumulative Disorders by Neighbourhood Clusters, 1997/98-2001/02
Age-adjusted annual rate per 1000 residents aged 10 years +
0 10 20 30 40 50 60 70 80 90 10
Fort Garry S (1,0,d)
Fort Garry N (0,d)
Assiniboine South (1,0,d)
St. Vital S (1,0,d)
St. Vital N (d)
River Heights W (d)
River Heights E (1,0,d)
St. Boniface E (1,0,d)
St. Boniface W (1,0,d)
River East N (1,0,d)
River East E (1,0,d)
River East W (d)
River East S (0,d)
Seven Oaks N (d)
Seven Oaks W (1,d)
Seven Oaks E (0,d)
St. James-Assiniboia W (1,0,d)
St. James-Assiniboia E (0,d)
Transcona (1,d)
Inkster W (1,0,d)
Inkster E (1,0,d)
Downtown W (0,d)
Downtown E (1,0,d)
Point Douglas N (0,d)
Point Douglas S (1,0,d)
Winnipeg (d)
0
with disorderno disorderWPG avg with disorderWPG avg no disorder
70

0
50
100
150
200
250
300
350
400
450
500
550
600
10 15 20 25 30 35 40 45 50 55 60 65 70 75 80 90
Age Groups (years)
with disorder
no disorder
Figure 6.1.3: Winnipeg Open Home Care Cases for Males With and Without Cumulative Disorders by Age and Sex, 1997/98-
2001/02
0.00 0.10 0.20 0.30 0.40 0.50 0.60 0.70 0.80 0.90 1.00
Income Not Found (5.8%)
Lowest Winnipeg W1
W2
W3
W4
Highest Winnipeg W5 with disorderno disorder
Linear Trend Test Results Winnipeg with disorder: Significant (p<.001) Winnipeg no disorder: Significant (p<.001)
Figure 6.1.4: Winnipeg Open Home Care Cases for Males With and WithoutCumulative Disorders by Income Quintile, 1997/98-2001/02
Age-adjusted annual percentage of open home care cases over period (prevalence)
71

0 10 20 30 40 50 60 70 80 90 100
Fort Garry (1,0,d)
Assiniboine South (1,0,d)
St. Vital (d)
River Heights (0,d)
St. Boniface (0,d)
River East (d)
Seven Oaks (d)
St. James-Assiniboia (1,0,d)
Transcona (1,d)
Inkster (1,0,d)
Downtown (1,0,d)
Point Douglas (1,0,d)
Winnipeg (d)
Rural South (n)
North (n)
with disorderno disorderWPG avg with disorderWPG avg no disorder
Figure 6.1.5: Winnipeg Open Home Care Cases for Females With andWithout Cumulative Disorders by Community Areas, 1997/98-2001/02
Age-adjusted annual rate per 1000 residents aged 10 years +
'1' indicates area's rate for those with disorder was statistically different from Winnipeg average with disorder'0' indicates area's rate for those without disorder was statistically different from Winnipeg average without disorder'd' indicates difference between two groups' rates was statistically significant for that area's' indicates data suppressed due to small numbers'n' indicates Rural South and North not statistically tested
72

0 10 20 30 40 50 60 70 80 90 100
Fort Garry S (1,0,d)
Fort Garry N (0,d)
Assiniboine South (1,0,d)
St. Vital S (1,0,d)
St. Vital N (1,d)
River Heights W (0,d)
River Heights E (1,0,d)
St. Boniface E (1,0,d)
St. Boniface W (1,0,d)
River East N (1,0,d)
River East E (0,d)
River East W (1,0,d)
River East S (d)
Seven Oaks N (d)
Seven Oaks W (1,0,d)
Seven Oaks E (0,d)
St. James-Assiniboia W (1,0,d)
St. James-Assiniboia E (d)
Transcona (1,d)
Inkster W (1,0,d)
Inkster E (d)
Downtown W (1,0,d)
Downtown E (1,0,d)
Point Douglas N (0,d)
Point Douglas S (1,0,d)
Winnipeg (d)
with disorderno disorderWPG avg with disorderWPG avg no disorder
Figure 6.1.6: Winnipeg Open Home Care Cases for Females With andWithout Cumulative Disorders by Neighbourhood Clusters, 1997/98-2001/02
Age-adjusted annual rate per 1000 residents aged 10 years +
73

0
50
100
150
200
250
300
350
400
450
500
550
600
650
10 15 20 25 30 35 40 45 50 55 60 65 70 75 80 90
Age Groups (years)
with disorder
no disorder
Figure 6.1.7: Winnipeg Open Home Care Cases for Females With and Without Cumulative Disorders by Age and Sex, 1997/98-2001/02
Average annual rate per 1000 residents aged 10 years +
0% 10% 20% 30% 40% 50% 60% 70% 80% 90% 100%
Income Not Found (5.9%)
Lowest Winnipeg W1
W2
W3
W4
Highest Winnipeg W5 w ith disorder
no disorder
Linear T rend T est R esult sWinnipeg with disorder: Signif icant (p<.001)
Winnipeg no disorder: Signif icant (p<.001)
Figure 6.1.8: Winnipeg Open Home Care Cases for Females With and WithoutCumulative Disorders by Income Quintile, 1997/98-2001/02
Average annual rate per 1000 residents aged 10 years +
74

0 5 10 15 20 25 30 35 40
Fort Garry (0,d)
Assiniboine South (1,0,d)
St. Vital (d)
River Heights (d)
St. Boniface (d)
River East (d)
Seven Oaks (d)
St. James-Assiniboia (1,d)
Transcona (1,d)
Inkster (d)
Downtown (1,0,d)
Point Douglas (1,0,d)
Winnipeg (d)
Rural South (n)
North (n)
with disorderno disorderWPG avg with disorderWPG avg no disorder
Figure 6.2.1: Winnipeg New Home Care Cases for Males With andWithout Cumulative Disorders by Community Areas, 1997/98-2001/02
Age-adjusted annual rate per 1000 residents aged 10 years +
'1' indicates area's rate for those with disorder was statistically different from Manitoba average with disorder'0' indicates area's rate for those without disorder was statistically different from Manitoba average without disorder'd' indicates difference between two groups' rates was statistically significant for that area's' indicates data suppressed due to small numbers'n' indicates Rural South and North not statistically tested
75
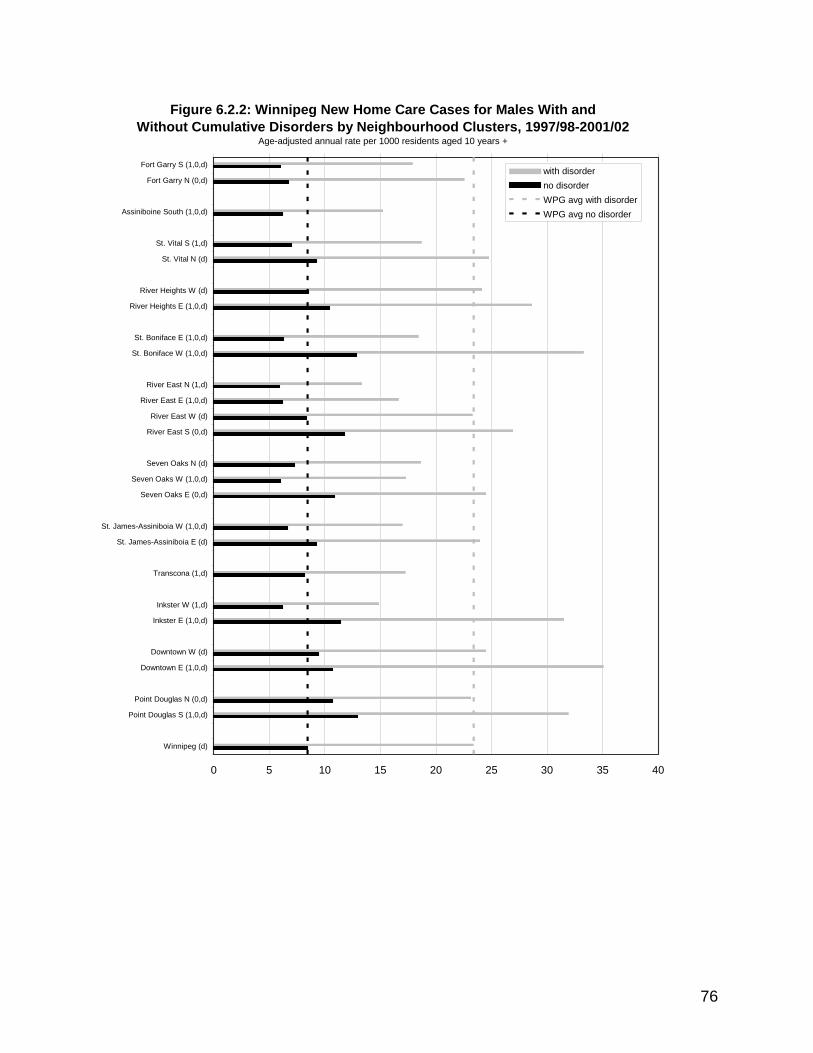
0 5 10 15 20 25 30 35 40
Fort Garry S (1,0,d)
Fort Garry N (0,d)
Assiniboine South (1,0,d)
St. Vital S (1,d)
St. Vital N (d)
River Heights W (d)
River Heights E (1,0,d)
St. Boniface E (1,0,d)
St. Boniface W (1,0,d)
River East N (1,d)
River East E (1,0,d)
River East W (d)
River East S (0,d)
Seven Oaks N (d)
Seven Oaks W (1,0,d)
Seven Oaks E (0,d)
St. James-Assiniboia W (1,0,d)
St. James-Assiniboia E (d)
Transcona (1,d)
Inkster W (1,d)
Inkster E (1,0,d)
Downtown W (d)
Downtown E (1,0,d)
Point Douglas N (0,d)
Point Douglas S (1,0,d)
Winnipeg (d)
with disorderno disorderWPG avg with disorderWPG avg no disorder
Figure 6.2.2: Winnipeg New Home Care Cases for Males With and Without Cumulative Disorders by Neighbourhood Clusters, 1997/98-2001/02
Age-adjusted annual rate per 1000 residents aged 10 years +
76

0 5 10 15 20 25 30 35 40
Fort Garry (1,0,d)
Assiniboine South (1,0,d)
St. Vital (d)
River Heights (0,d)
St. Boniface (d)
River East (d)
Seven Oaks (d)
St. James-Assiniboia (1,d)
Transcona (1,d)
Inkster (0,d)
Downtown (1,0,d)
Point Douglas (1,0,d)
Winnipeg (d)
Rural South (n)
North (n)
with disorderno disorderWPG avg with disorderWPG avg no disorder
Figure 6.2.3: Winnipeg New Home Care Cases for Females With andWithout Cumulative Disorders by Community Areas, 1997/98-2001/02
Age-adjusted annual rate per 1000 residents aged 10 years +
'1' indicates area's rate for those with disorder was statistically different from Winnipeg average with disorder'0' indicates area's rate for those without disorder was statistically different from Winnipeg average without disorder'd' indicates difference between two groups' rates was statistically significant for that area's' indicates data suppressed due to small numbers'n' indicates Rural South and North not statistically tested
77

0 5 10 15 20 25 30 35 40
Fort Garry S (1,0,d)
Fort Garry N (d)
Assiniboine South (1,0,d)
St. Vital S (1,0,d)
St. Vital N (1,0,d)
River Heights W (d)
River Heights E (1,0,d)
St. Boniface E (1,0,d)
St. Boniface W (1,0,d)
River East N (0,d)
River East E (0,d)
River East W (0,d)
River East S (1,d)
Seven Oaks N (d)
Seven Oaks W (1,0,d)
Seven Oaks E (0,d)
St. James-Assiniboia W (1,0,d)
St. James-Assiniboia E (d)
Transcona (1,d)
Inkster W (1,0,d)
Inkster E (d)
Downtown W (1,d)
Downtown E (1,0,d)
Point Douglas N (1,0,d)
Point Douglas S (1,0,d)
Winnipeg (d)
with disorderno disorderWPG avg with disorderWPG avg no disorder
Figure 6.2.4: Winnipeg New Home Care Cases for Females With and Without Cumulative Disorders by Neighbourhood Clusters, 1997/98-2001/02
Age-adjusted annual rate per 1000 residents aged 10 years +
78

0 5 10 15 20 25 30 35 40
Fort Garry (1,0,d)
Assiniboine South (1,0,d)
St. Vital (d)
River Heights (0,d)
St. Boniface (d)
River East (d)
Seven Oaks (d)
St. James-Assiniboia (1,d)
Transcona (1,d)
Inkster (d)
Downtown (1,0,d)
Point Douglas (1,0,d)
Winnipeg (d)
Rural South (n)
North (n)
with disorder
no disorder
WPG avg with disorder
WPG avg no disorder
'1' indicates area's rate for those with disorder was statistically different from Winnipeg average with disorder'0' indicates area's rate for those without disorder was statistically different from Winnipeg average without disorder'd' indicates difference between two groups' rates was statistically significant for that area's' indicates data suppressed due to small numbers'n' indicates Rural South and North not statistically tested
Figure 6.3.1: Winnipeg Home Care Case Closing Rates for Males With and Without Cumulative Disorders by Community Areas, 1997/98-2001/02
Age-adjusted annaul rate of home care case closures over period per 1000 male residents
79

0 5 10 15 20 25 30 35 40
Fort Garry S (1,0,d)
Fort Garry N (0,d)
Assiniboine South (1,0,d)
St. Vital S (1,0,d)
St. Vital N (d)
River Heights W (d)
River Heights E (1,0,d)
St. Boniface E (1,0,d)
St. Boniface W (1,0,d)
River East N (1,0,d)
River East E (1,0,d)
River East W (d)
River East S (0,d)
Seven Oaks N (d)
Seven Oaks W (1,d)
Seven Oaks E (0,d)
St. James-Assiniboia W (1,0,d)
St. James-Assiniboia E (0,d)
Transcona (1,d)
Inkster W (1,0,d)
Inkster E (1,0,d)
Downtown W (d)
Downtown E (1,0,d)
Point Douglas N (0,d)
Point Douglas S (1,0,d)
Winnipeg (d)
with disorderno disorderWPG avg with disorderWPG avg no disorder
40.72
Figure 6.3.2: Winnipeg Home Care Case Closing Rates for Males With and Without Cumulative Disorders by Neighbourhood Clusters, 1997/98-2001/02
Age-adjusted annaul rate of home care case closures over period per 1000 male residents
80

0 5 10 15 20 25 30 35 40
Fort Garry (1,0,d)
Assiniboine South (1,0,d)
St. Vital (d)
River Heights (1,0,d)
St. Boniface (d)
River East (d)
Seven Oaks (d)
St. James-Assiniboia (1,0,d)
Transcona (1,d)
Inkster (0,d)
Downtown (1,0,d)
Point Douglas (1,0,d)
Winnipeg (d)
Rural South (n)
North (n)
with disorderno disorderWPG avg with disorderWPG avg no disorder
Figure 6.3.3: Winnipeg Home Care Case Closing Rates for Females With and WithoutCumulative Disorders by Community Areas, 1997/98-2001/02
Age-adjusted annual rate of home care case closures over period per 1000 male residents
'1' indicates area's rate for those with disorder was statistically different from Winnipeg average with disorder'0' indicates area's rate for those without disorder was statistically different from Winnipeg average without disorder'd' indicates difference between two groups' rates was statistically significant for that area's' indicates data suppressed due to small numbers'n' indicates Rural South and North not statistically tested
81

0 5 10 15 20 25 30 35 40
Fort Garry S (1,0,d)
Fort Garry N (0,d)
Assiniboine South (1,0,d)
St. Vital S (1,0,d)
St. Vital N (d)
River Heights W (d)
River Heights E (1,0,d)
St. Boniface E (1,0,d)
St. Boniface W (1,0,d)
River East N (1,0,d)
River East E (0,d)
River East W (0,d)
River East S (d)
Seven Oaks N (d)
Seven Oaks W (1,0,d)
Seven Oaks E (0,d)
St. James-Assiniboia W (1,0,d)
St. James-Assiniboia E (d)
Transcona (1,d)
Inkster W (1,0,d)
Inkster E (d)
Downtown W (d)
Downtown E (1,0,d)
Point Douglas N (0,d)
Point Douglas S (1,0,d)
Winnipeg (d)
with disorderno disorderWPG avg with disorderWPG avg no disorder
Figure 6.3.4: Winnipeg Home Care Case Closing Rates for Females With and Without Cumulative Disorders by Neighbourhood Clusters, 1997/98-2001/02Age-adjusted annual rate of home care case closures over period per 1000 male residents
40.5
43.6
45.0
82

0 50 100 150 200 250 300
Fort Garry
Assiniboine South
St. Vital
River Heights
St. Boniface
River East (0)
Seven Oaks
St. James-Assiniboia
Transcona
Inkster
Downtown
Point Douglas
Winnipeg
Rural South (n)
North (n)
with disorderno disorderWPG avg with disorderWPG avg no disorder
Figure 6.4.1: Winnipeg Average Length of Home Care Cases for Males With and Without Cumulative Disorders by Community Areas, 1997/98-2001/02
Age-adjusted mean length of open home care cases per year (days)
'1' indicates area's rate for those with disorder was statistically different from Winnipeg average with disorder'0' indicates area's rate for those without disorder was statistically different from Winnipeg average without disorder'd' indicates difference between two groups' rates was statistically significant for that area's' indicates data suppressed due to small numbers'n' indicates Rural South and North not statistically tested
83

0 50 100 150 200 250 300
Fort Garry S
Fort Garry N (0)
Assiniboine South
St. Vital S
St. Vital N
River Heights W
River Heights E
St. Boniface E
St. Boniface W
River East N (0)
River East E
River East W
River East S
Seven Oaks N
Seven Oaks W
Seven Oaks E
St. James-Assiniboia W
St. James-Assiniboia E
Transcona
Inkster W
Inkster E
Downtown W
Downtown E
Point Douglas N (0)
Point Douglas S
Winnipeg
with disorderno disorderWPG avg with disorderWPG avg no disorder
Figure 6.4.2: Winnipeg Average Length of Home Care Cases for Males With andWithout Cumulative Disorders by Neighbourhood Clusters, 1997/98-2001/02
Age-adjusted mean length of open home care cases per year (days)
84
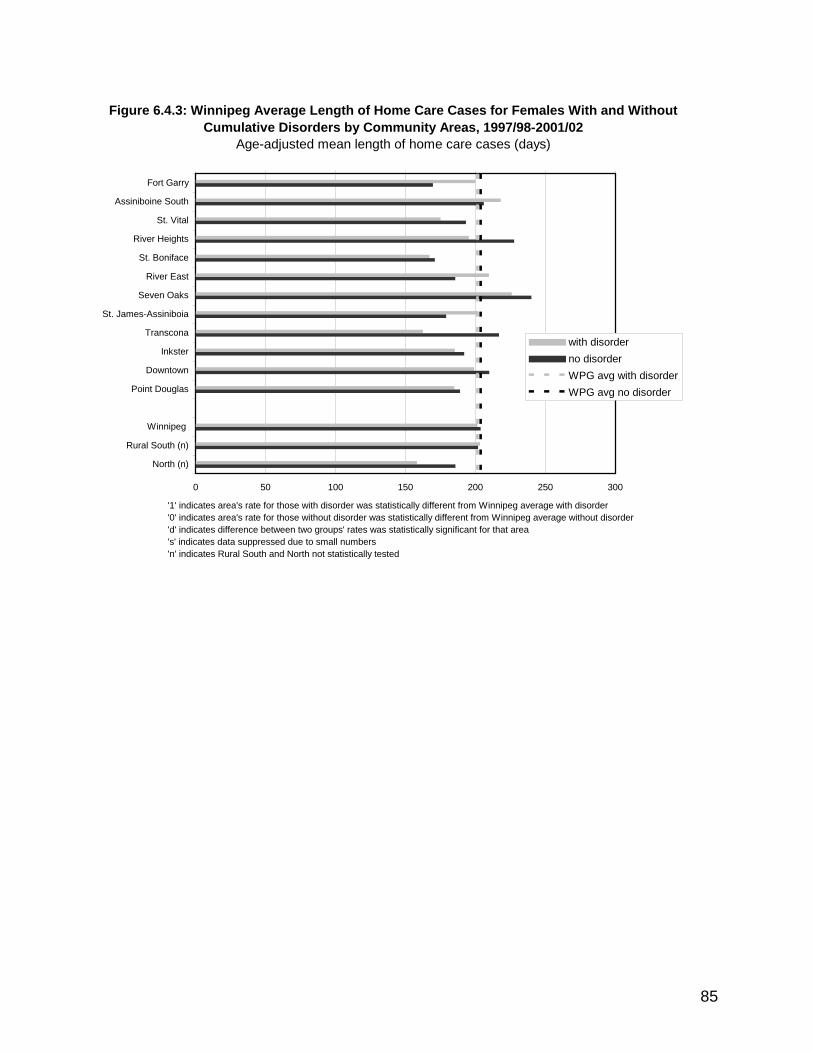
0 50 100 150 200 250 300
Fort Garry
Assiniboine South
St. Vital
River Heights
St. Boniface
River East
Seven Oaks
St. James-Assiniboia
Transcona
Inkster
Downtown
Point Douglas
Winnipeg
Rural South (n)
North (n)
with disorderno disorderWPG avg with disorderWPG avg no disorder
Figure 6.4.3: Winnipeg Average Length of Home Care Cases for Females With and Without Cumulative Disorders by Community Areas, 1997/98-2001/02
Age-adjusted mean length of home care cases (days)
'1' indicates area's rate for those with disorder was statistically different from Winnipeg average with disorder'0' indicates area's rate for those without disorder was statistically different from Winnipeg average without disorder'd' indicates difference between two groups' rates was statistically significant for that area's' indicates data suppressed due to small numbers'n' indicates Rural South and North not statistically tested
85

0 50 100 150 200 250 300
Fort Garry S
Fort Garry N
Assiniboine South
St. Vital S (1)
St. Vital N
River Heights W
River Heights E
St. Boniface E (1)
St. Boniface W
River East N
River East E (0,d)
River East W
River East S
Seven Oaks N
Seven Oaks W
Seven Oaks E
St. James-Assiniboia W
St. James-Assiniboia E
Transcona
Inkster W
Inkster E
Downtown W
Downtown E
Point Douglas N
Point Douglas S
Winnipeg
with disorderno disorderWPG avg with disorderWPG avg no disorder
Figure 6.4.4: Winnipeg Average Length of Home Care Cases for Females With andWithout Cumulative Disorders by Neighbourhood Clusters, 1997/98-2001/02
Age-adjusted mean length of home care cases (days)
86

0 10 20 30 40 50 60 70 80 90 100 110 120
Fort Garry (m,f,d)
Assiniboine South (m,f,d)
St. Vital (d)
River Heights (d)
St. Boniface (d)
River East (d)
Seven Oaks (d)
St. James-Assiniboia (f,d)
Transcona (m,f,d)
Inkster
Downtown (m,f,d)
Point Douglas (f,d)
Winnipeg (d)
Rural South (n)
North (n)
malesfemalesWPG avg malesWPG avg females
Figure 6.5.1: Winnipeg Open Home Care Cases for those WithDepression by Community Areas, 1997/98-2001/02
Age-adjusted annual rate per 1000 residents aged 10 years +
'm' indicates area's rate for males with the disorder was statistically different from Winnipeg average for males 'f' indicates area's rate for females with disorder was statistically different from Winnipeg average for females'd' indicates difference between two groups' rates was statistically significant for that area's' indicates data suppressed due to small numbers'n' indicates Rural South and North not statistically tested
87

0 10 20 30 40 50 60 70 80 90 100 110 120
Fort Garry S (m,f,d)
Fort Garry N
Assiniboine South (m,f,d)
St. Vital S (m,f,d)
St. Vital N (f,d)
River Heights W (d)
River Heights E (f,d)
St. Boniface E (m,f,d)
St. Boniface W (m,f)
River East N (f)
River East E (d)
River East W (f,d)
River East S (d)
Seven Oaks N
Seven Oaks W (f)
Seven Oaks E (d)
St. James-Assiniboia W (m,f,d)
St. James-Assiniboia E (d)
Transcona (m,f,d)
Inkster W (f)
Inkster E (m)
Downtown W (f,d)
Downtown E (m,f,d)
Point Douglas N (d)
Point Douglas S (m,f,d)
Winnipeg (d)
malesfemalesWPG avg malesWPG avg females
Figure 6.5.2: Winnipeg Open Home Care Cases for those with Depressionby Neighbourhood Clusters, 1997/98-2001/02
Age-adjusted annual rate per 1000 residents aged 10 years +
88

0 100 200 300 400 500 600 700 800 900 1000
Fort Garry (d)
Assiniboine South
St. Vital (d)
River Heights (d)
St. Boniface (d)
River East (d)
Seven Oaks (d)
St. James-Assiniboia (d)
Transcona
Inkster
Downtown (m,f,d)
Point Douglas
Winnipeg (d)
Rural South (n)
North (n)
malesfemalesWPG avg with malesWPG avg females
Figure 6.6.1: Winnipeg Open Home Care Cases for those with Dementia by Community Areas, 1997/98-2001/02 Age-adjusted annual rate per 1000 residents aged 10 years +
'm' indicates area's rate for males with the disorder was statistically different from Winnipeg average for males 'f' indicates area's rate for females with disorder was statistically different from Winnipeg average for females'd' indicates difference between two groups' rates was statistically significant for that area's' indicates data suppressed due to small numbers'n' indicates Rural South and North not statistically tested
89

0 100 200 300 400 500 600 700 800 900 1000
Fort Garry S
Fort Garry N
Assiniboine South
St. Vital S
St. Vital N
River Heights W (d)
River Heights E
St. Boniface E (d)
St. Boniface W
River East N
River East E (d)
River East W (d)
River East S (d)
Seven Oaks N
Seven Oaks W
Seven Oaks E (d)
St. James-Assiniboia W (d)
St. James-Assiniboia E
Transcona
Inkster W
Inkster E
Downtown W (f,d)
Downtown E (f)
Point Douglas N (d)
Point Douglas S
Winnipeg (d)
malesfemalesWPG avg malesWPG avg females
Figure 6.6.2: Open Home Care Cases for those with Dementiaby Neighbourhood Clusters, 1997/98-2001/02
Age-adjusted annual rate per 1000 residents aged 10 years +
90

Personal Care Home (Nursing Home) Use by those with a mental illness diagnosis (Chapter 7) • Winnipeg data mirrors Manitoba data in nearly all categories of Personal Care Home data
including the following: o Individuals aged 75+ in the “cumulative disorders” group are about five times
more likely to be personal care home (PCH) residents compared to those with no mental disorder (34.7% versus 6.9%), for both males (30.5% versus 5.3%) and females (37.3% versus 7.8%).
o Among PCHs residents, 43% had one or more of the five “cumulative” mental illness disorders, 67% had dementia, 35% had depression, and 83% had at least one mental illness diagnosis (that is, “any” disorder).
o Waitlist data by community area does not follow conventions and may be based more on availability of PCH placements for example: there are significantly longer wait times for males with no disorders in the community areas of River Heights; River East and Seven Oaks, while for females the significant wait times for those with no disorder are in the community areas of: St Vital, River Heights, Seven Oaks and Inkster. Those with a disorder are waiting longest in Point Douglas where the wait list is less than the Winnipeg average for males both with and without disorders.
• Specific Winnipeg data shows:
o Residents aged 75+ with a diagnosis of dementia, 54.2% of males and 67.5% of females were PCH residents for some time during 1997/98-2001/02.
o Residents aged 75+ with a diagnosis of depression, 31.0% of males and 38.7% of females were PCH residents for some time during 1997/98-2001/02.
o Over eight times the proportion of people aged 75+ in the “cumulative disorders” group were admitted to PCHs compared to those with no mental disorder (58.3 per thousand versus 4.3 per thousand) – both for males (56.2 versus 3.7 per thousand) and females (58.0 versus 7.4 per thousand). There was a similar waiting time (around 10 weeks) for people aged 75+ for those in the “cumulative” and “no” disorders groups, and similar median length of stay (2.8 versus 3.3 years).
o In the five years prior to their admission in 2002/03, 39% of all people admitted to PCH had one or more of the five “cumulative” mental illness disorders, 46% had dementia, and 75% had at least one mental illness diagnosis.
91

0 50 100 150 200 250 300 350 400 450 500
Fort Garry (1,d)
Assiniboine South (d)
St. Vital (1,d)
River Heights (d)
St. Boniface (d)
River East (d)
Seven Oaks (d)
St. James-Assiniboia (2,d)
Transcona (d)
Inkster (d)
Downtown (d)
Point Douglas (d)
Winnipeg (d)
Rural South (n)
North (n)
with disorderwithout disorderWPG avg with disorderWPG avg no disorder
'1' indicates area's rate for those with disorder was statistically different from Winnipeg average with disorder'0' indicates area's rate for those without disorder was statistically different from Winnipeg average without disorder'd' indicates difference between two groups' rates was statistically significant for that area's' indicates data suppressed due to small numbers'n' Rural South and North not statistically tested
Figure 7.1.1: Winnipeg PCH Residents: Males 75+ With and Without Cumulative Disorders by Community Areas, 1997/98-2001/02
Crude annual rate per 1000 male residents aged 75+
92

Figure 7.1.2: Winnipeg PCH Residents: Females 75+ With and Without Cumulative Disorders by Community Areas, 1997/98-2001/02
Crude annual rate per 1000 female residents aged 75+
0 50 100 150 200 250 300 350 400 450 500
Fort Garry (m,d)
Assiniboine South (m,d)
St. Vital (d)
River Heights (m,f,d)
St. Boniface (m,f,d)
River East (d)
Seven Oaks (f,d)
St. James-Assiniboia (d)
Transcona (d)
Inkster (d)
Downtown (m,f,d)
Point Douglas (m,d)
Winnipeg (d)
Rural South (n)
North (n)
with disorderno disorderWPG avg with disorderWPG avg no disorder
'1' indicates area's rate for those with disorder was statistically different from Winnipeg average with disorder'0' indicates area's rate for those without disorder was statistically different from Winnipeg average without disorder'd' indicates difference between two groups' rates was statistically significant for that area's' indicates data suppressed due to small numbers'n' indicates Rural South and North not statistically tested
93
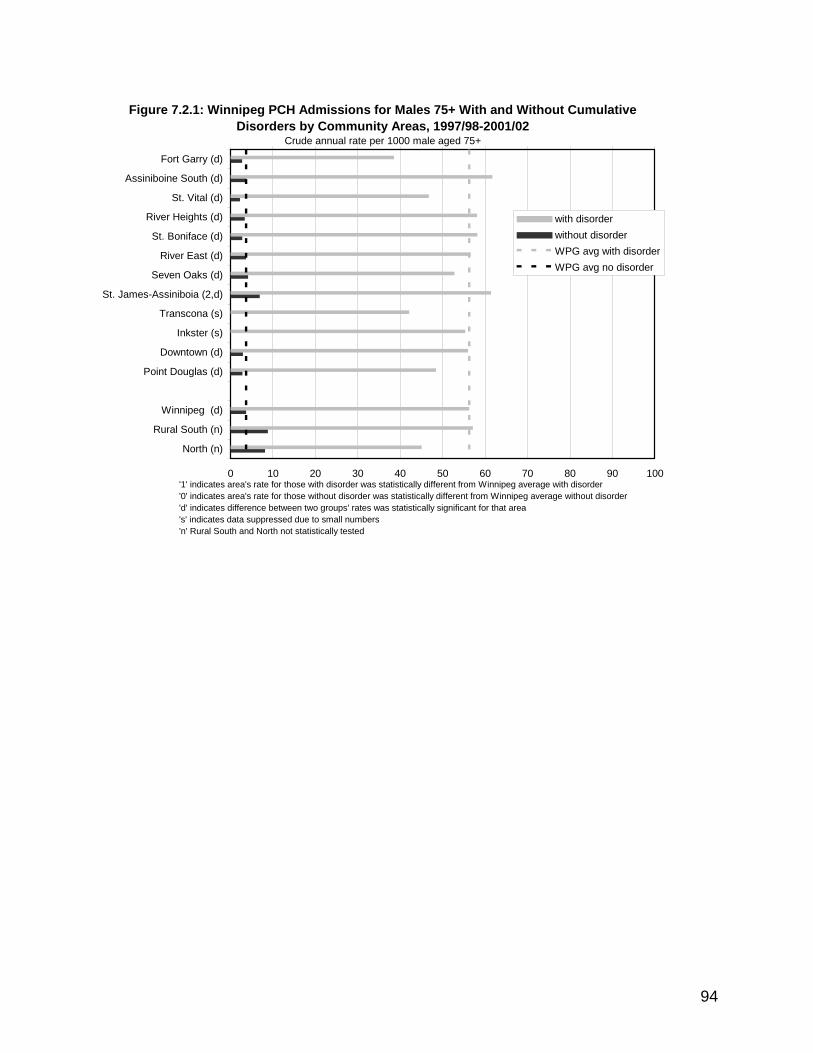
0 10 20 30 40 50 60 70 80 90 10
Fort Garry (d)
Assiniboine South (d)
St. Vital (d)
River Heights (d)
St. Boniface (d)
River East (d)
Seven Oaks (d)
St. James-Assiniboia (2,d)
Transcona (s)
Inkster (s)
Downtown (d)
Point Douglas (d)
Winnipeg (d)
Rural South (n)
North (n)
0
with disorderwithout disorderWPG avg with disorderWPG avg no disorder
'1' indicates area's rate for those with disorder was statistically different from Winnipeg average with disorder'0' indicates area's rate for those without disorder was statistically different from Winnipeg average without disorder'd' indicates difference between two groups' rates was statistically significant for that area's' indicates data suppressed due to small numbers'n' Rural South and North not statistically tested
Figure 7.2.1: Winnipeg PCH Admissions for Males 75+ With and Without Cumulative Disorders by Community Areas, 1997/98-2001/02
Crude annual rate per 1000 male aged 75+
94
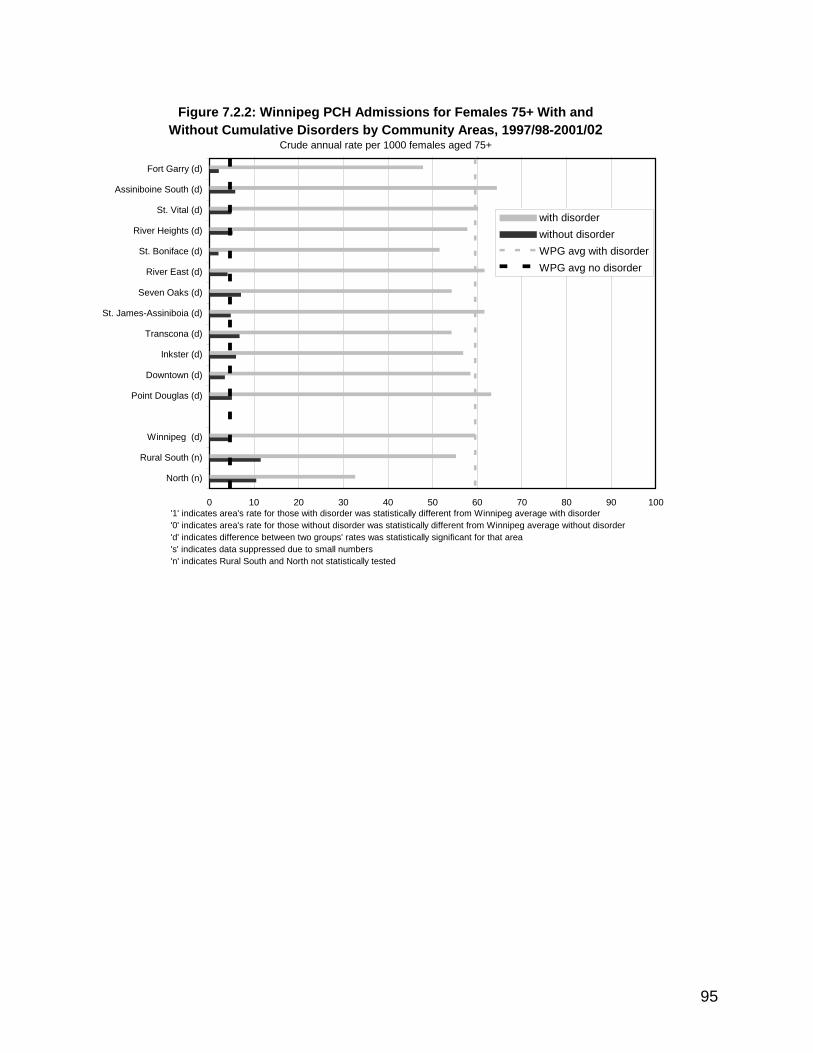
Figure 7.2.2: Winnipeg PCH Admissions for Females 75+ With and Without Cumulative Disorders by Community Areas, 1997/98-2001/02
Crude annual rate per 1000 females aged 75+
0 10 20 30 40 50 60 70 80 90 10
Fort Garry (d)
Assiniboine South (d)
St. Vital (d)
River Heights (d)
St. Boniface (d)
River East (d)
Seven Oaks (d)
St. James-Assiniboia (d)
Transcona (d)
Inkster (d)
Downtown (d)
Point Douglas (d)
Winnipeg (d)
Rural South (n)
North (n)
0
with disorderwithout disorderWPG avg with disorderWPG avg no disorder
'1' indicates area's rate for those with disorder was statistically different from Winnipeg average with disorder'0' indicates area's rate for those without disorder was statistically different from Winnipeg average without disorder'd' indicates difference between two groups' rates was statistically significant for that area's' indicates data suppressed due to small numbers'n' indicates Rural South and North not statistically tested
95

0 5 10 15 20 25 30 35 40 45 50
Fort Garry
Assiniboine South
St. Vital
River Heights
St. Boniface (1)
River East
Seven Oaks
St. James-Assiniboia (0)
Transcona (s)
Inkster (s)
Downtown (1)
Point Douglas
Winnipeg
Rural South (n)
North (n)
with disorderno disorderWPG avg with disorderWPG avg no disorder
Figure 7.3.1: Winnipeg Median Waiting Times for PCH Admission for Males With and Without Cumulative Disorders by Community Areas, 1997/98-2001/02
Median # weeks from assessment to admission, age 75+
'1' indicates area's rate for those with disorder was statistically different from Winnipeg average with disorder'0' indicates area's rate for those without disorder was statistically different from Winnipeg average without disorder's' indicates data suppressed due to small numbers'n' indicates Rural South and North not statistically tested*statistical testing was not done on the differences between the two groups
96

0 5 10 15 20 25 30 35 40 45 50 55 60
Fort Garry
Assiniboine South
St. Vital (1)
River Heights
St. Boniface (1)
River East (1)
Seven Oaks
St. James-Assiniboia (1)
Transcona
Inkster
Downtown (1)
Point Douglas (1)
Winnipeg
Rural South (n)
North (n)
with disorderno disorderWPG avg with disorderWPG avg no disorder
Figure 7.3.2: Winnipeg Median Waiting Times for PCH Admission for Females With and Without Cumulative Disorders by CA, 1997/98-2001/02Median # weeks from assessment to admission, age 75+
'1' indicates area's rate for those with disorder was statistically different from Winnipeg average with disorder'0' indicates area's rate for those without disorder was statistically different from Winnipeg average without disorder'd' indicates difference between two groups' rates was statistically significant for that area's' indicates data suppressed due to small numbers'n' indicates Rural South and North not statistically tested
97
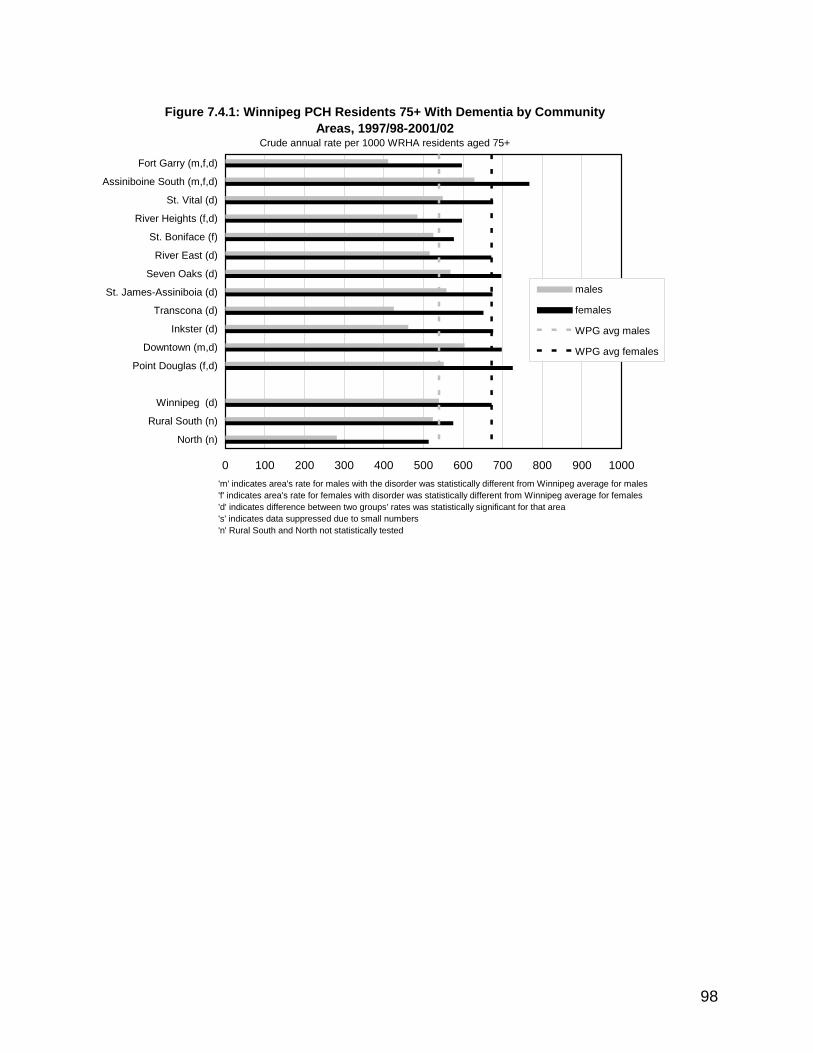
Figure 7.4.1: Winnipeg PCH Residents 75+ With Dementia by Community Areas, 1997/98-2001/02
Crude annual rate per 1000 WRHA residents aged 75+
0 100 200 300 400 500 600 700 800 900 1000
Fort Garry (m,f,d)
Assiniboine South (m,f,d)
St. Vital (d)
River Heights (f,d)
St. Boniface (f)
River East (d)
Seven Oaks (d)
St. James-Assiniboia (d)
Transcona (d)
Inkster (d)
Downtown (m,d)
Point Douglas (f,d)
Winnipeg (d)
Rural South (n)
North (n)
males
females
WPG avg males
WPG avg females
'm' indicates area's rate for males with the disorder was statistically different from Winnipeg average for males 'f' indicates area's rate for females with disorder was statistically different from Winnipeg average for females'd' indicates difference between two groups' rates was statistically significant for that area's' indicates data suppressed due to small numbers'n' Rural South and North not statistically tested
98

0 50 100 150 200 250 300 350 400 450 500 550 600 650 700
Fort Garry (m,f)
Assiniboine South (f,d)
St. Vital (d)
River Heights (f)
St. Boniface (f)
River East (d)
Seven Oaks (d)
St. James-Assiniboia (d)
Transcona
Inkster
Downtown (m,f)
Point Douglas (f,d)
Winnipeg (d)
Rural South (n)
North (n)
males
females
WPG avg males
WPG avg females
'm' indicates area's rate for males with the disorder was statistically different from Winnipeg average for males 'f' indicates area's rate for females with disorder was statistically different from Winnipeg average for females'd' indicates difference between two groups' rates was statistically significant for that area's' indicates data suppressed due to small numbers'n' Rural South and North not statistically tested
Figure 7.5.1: Winnipeg PCH Residents 75+ With Depression by Community Areas, 1997/98-2001/02
Crude annual rate per 1000 residents aged 75+
99

Pharmaceutical Use for Mental Illness Disorders (Chapter 8)
• Winnipeg data is nearly identical to the Manitoba average showing a greater proportion of people in the “cumulative mental disorders” group had at least one prescription per year compared to those in the “no mental disorders” group (females 88.3% versus 67.8%; males 77.3% versus 54.2%).
• In general there is one drug more prescribed for females than for males • About 1.5 times the number of different drugs were used for those in the “cumulative
disorders” group compared with those in the “no mental disorders” group, for both females and males (females 5.1 versus 3.3 drugs per user per year; males 4.2 versus 2.8 drugs per user per year).
• There was also a strong relationship with neighbourhood income, with those living in lower income areas being prescribed a higher number of different drugs.
• Community Area variability is slight in all areas but Point Douglas and Downtown where there is at least one more prescription drugs given to females with disorders. The most striking differences are in Point Douglas West (with 2.5 more prescription drugs given to females with disorders) and Downtown East (1.5 more prescription drugs given to females with disorders) than for the city average. This data is mirrored for males but with half the increase (Point Douglas West (with 1.5 more prescription drugs given to males with disorders) and Downtown East (nearly 1 more prescription drugs given to males with disorders)
• Those in the cumulative disorders group are being dispensed about 1.6 times the defined daily doses or DDDs (all drugs included) compared with those having no mental disorder, for both males (391 versus 235 per year) and females (432 versus 263 DDDs per year). For both males and females diagnosed with depression, anxiety disorder, schizophrenia or personality disorder, their mental-illness-specific drugs represent about three-quarters of their total DDDs dispensed in a year.
• Female adolescents were twice as likely as males to be prescribed Selective Serotonin Reuptake Inhibitors (SSRIs) for depression (1.58% females, 0.64% males).
• Winnipeg had a slightly higher percentage of adolescents prescribed SSRIs (1.86% females, 0.86% males) over the provincial average (1.70 females, 0.76 males).
• The Community Areas with significantly higher rates of SSRIs prescribed are: Assiniboine South, River Heights and St James- Assiniboia. At the neighbourhood level, areas with significantly higher rates of SSRIs prescribed for both males and females are: Seven Oaks North, Assiniboine South, River Heights West
• The Community Areas with significantly lower rates of SSRI prescribing are Inkster, Seven Oaks and Pont Douglas. At the neighbourhood level, areas with significantly lower rates of SSRIs prescribed for both males and females are: Seven Oaks West, Inkster West, Inkster East and Point Douglas North.
• Only 17% of all SSRIs dispensed to adolescents was fluoxetine, the only SSRI currently recommended for adolescent depression, though the data reflect 1997/98-2001/02, which was before this issue become a concern. However, this needs further monitoring to determine current prescribing practices for adolescents.
100

0% 10% 20% 30% 40% 50% 60% 70% 80% 90% 100%
Fort Garry (0,d)
Assiniboine South (d)
St. Vital (0,d)
River Heights (d)
St. Boniface (d)
River East (d)
Seven Oaks (d)
St. James-Assiniboia
Transcona (0,d)
Inkster (d)
Downtown (0,d)
Point Douglas (d)
Winnipeg (d)
Rural South (n)
North (n)
with disorderno disorderWPG avg with disorderWPG avg no disorder
Figure 8.1.1: Winnipeg Proportion of Females with at Least One PrescriptionWith and Without Cumulative Disorders by Community Areas, 1997/98-2001/02
Age-adjusted annual percentage of residents aged 10 years +
'1' indicates area's rate for those with disorder was statistically different from Winnipeg average with disorder'0' indicates area's rate for those without disorder was statistically different from Winnipeg average without disorder'd' indicates difference between two groups' rates was statistically significant for that area's' indicates data suppressed due to small numbers'n' indicates Rural South and North not statistically tested
101

0% 10% 20% 30% 40% 50% 60% 70% 80% 90% 100%
Fort Garry S (0,d)
Fort Garry N (d)
Assiniboine South
St. Vital S (d)
St. Vital N (d)
River Heights W (d)
River Heights E (d)
St. Boniface E (d)
St. Boniface W (d)
River East N (d)
River East E (d)
River East W (d)
River East S (d)
Seven Oaks N (d)
Seven Oaks W (d)
Seven Oaks E (0,d)
St. James-Assiniboia W (d)
St. James-Assiniboia E (d)
Transcona (0,d)
Inkster W (0,d)
Inkster E (d)
Downtown W (0,d)
Downtown E (0,d)
Point Douglas N (d)
Point Douglas S (d)
Winnipeg (d)
with disorderno disorderWPG avg with disorderWPG avg no disorder
Figure 8.1.2: Winnipeg Proportion of Females with at Least One PrescriptionWith and Without Cumulative Disorders by Neighbourhood Clusters, 1997/98-2001/02
Age-adjusted annual percentage of residents aged 10 years +
102
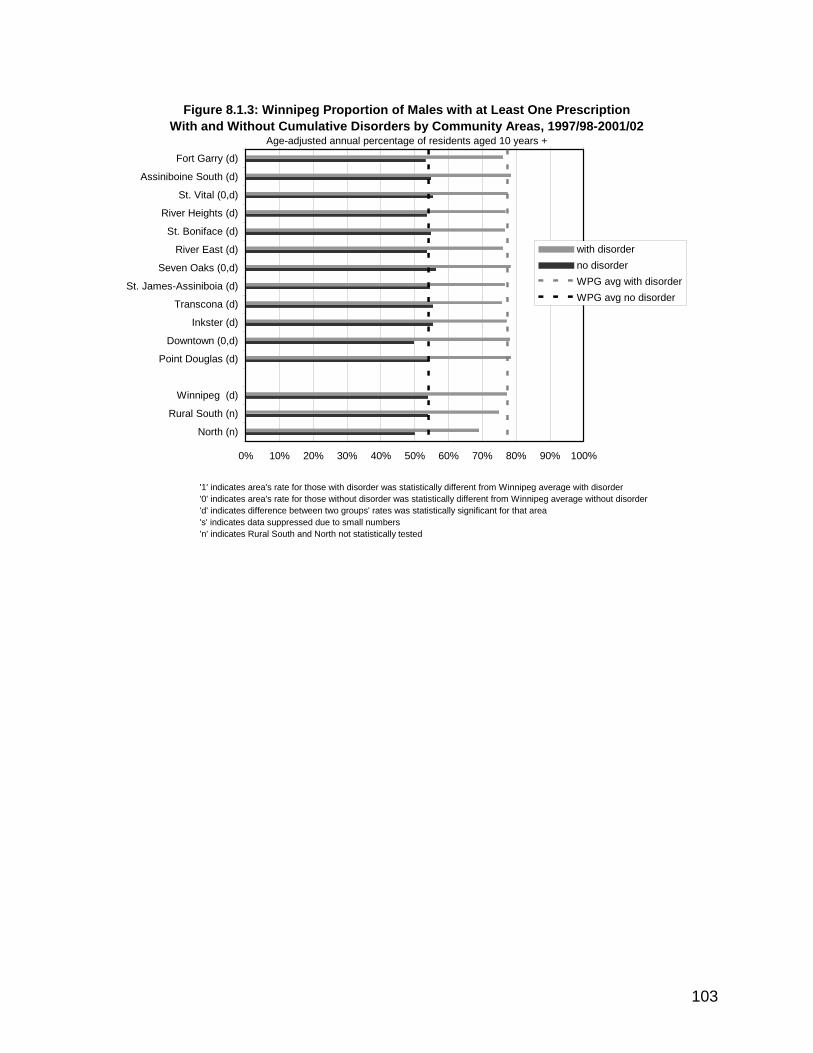
0% 10% 20% 30% 40% 50% 60% 70% 80% 90% 100%
Fort Garry (d)
Assiniboine South (d)
St. Vital (0,d)
River Heights (d)
St. Boniface (d)
River East (d)
Seven Oaks (0,d)
St. James-Assiniboia (d)
Transcona (d)
Inkster (d)
Downtown (0,d)
Point Douglas (d)
Winnipeg (d)
Rural South (n)
North (n)
with disorderno disorderWPG avg with disorderWPG avg no disorder
Figure 8.1.3: Winnipeg Proportion of Males with at Least One PrescriptionWith and Without Cumulative Disorders by Community Areas, 1997/98-2001/02
Age-adjusted annual percentage of residents aged 10 years +
'1' indicates area's rate for those with disorder was statistically different from Winnipeg average with disorder'0' indicates area's rate for those without disorder was statistically different from Winnipeg average without disorder'd' indicates difference between two groups' rates was statistically significant for that area's' indicates data suppressed due to small numbers'n' indicates Rural South and North not statistically tested
103

0% 10% 20% 30% 40% 50% 60% 70% 80% 90% 100%
Fort Garry S (0,d)
Fort Garry N (d)
Assiniboine South (d)
St. Vital S (0,d)
St. Vital N (d)
River Heights W (d)
River Heights E (d)
St. Boniface E (d)
St. Boniface W (d)
River East N (d)
River East E (d)
River East W (d)
River East S (d)
Seven Oaks N (d)
Seven Oaks W (d)
Seven Oaks E (0,d)
St. James-Assiniboia W (d)
St. James-Assiniboia E (d)
Transcona (d)
Inkster W (d)
Inkster E (d)
Downtown W (0,d)
Downtown E (0,d)
Point Douglas N (d)
Point Douglas S (d)
Winnipeg (d)
with disorderno disorderWPG avg with disorderWPG avg no disorder
Figure 8.1.4: Winnipeg Proportion of Males with at Least One PrescriptionWith and Without Cumulative Disorders by Neighbourhood Clusters, 1997/98-2001/02
Age-adjusted annual percentage of residents aged 10 years +
104

0 1 2 3 4 5 6 7 8
Fort Garry (1,0,d)
Assiniboine South (1,0,d)
St. Vital (1,d)
River Heights (1,d)
St. Boniface (d)
River East (1,0,d)
Seven Oaks (d)
St. James-Assiniboia (1)
Transcona (1,d)
Inkster (d)
Downtown (1,0,d)
Point Douglas (1,0,d)
Winnipeg (d)
Rural South (n)
North (n)
with disorderno disorderWPG avg with disorderWPG avg no disorder
Figure 8.2.1: Winnipeg Number of Different Drugs per User for Females With andWithout Cumulative Disorders by Community Areas, 1997/98-2001/02Average number of different drugs dispensed, per resident (age 10+) with 1+ prescriptions
'1' indicates area's rate for those with disorder was statistically different from Winnipeg average with disorder'0' indicates area's rate for those without disorder was statistically different from Winnipeg average without disorder'd' indicates difference between two groups' rates was statistically significant for that area's' indicates data suppressed due to small numbers'n' indicates Rural South and North not statistically tested
105

0 1 2 3 4 5 6 7 8
Fort Garry S (1,0,d)
Fort Garry N (1,0,d)
Assiniboine South (1,0)
St. Vital S (1,0,d)
St. Vital N (d)
River Heights W (1,d)
River Heights E (d)
St. Boniface E (1,0,d)
St. Boniface W (1,d)
River East N (1,0,d)
River East E (d)
River East W (1,0,d)
River East S (d)
Seven Oaks N (d)
Seven Oaks W (d)
Seven Oaks E (d)
St. James-Assiniboia W (1,d)
St. James-Assiniboia E (1,d)
Transcona (1,d)
Inkster W (d)
Inkster E (1,0,d)
Downtown W (1,d)
Downtown E (1,0,d)
Point Douglas N (1,0,d)
Point Douglas S (1,0,d)
Winnipeg (d)
with disorderno disorderWPG avg with disorderWPG avg no disorder
Figure 8.2.2: Winnipeg Number of Different Drugs per User for Females With andWithout Cumulative Disorders by Neighbourhood Clusters, 1997/98-2001/02
Average number of different drugs dispensed, per resident (age 10+) with 1+ prescriptions
106

0
1
2
3
4
5
6
7
8
9
10
10 15 20 25 30 35 40 45 50 55 60 65 70 75 80 90
Age Groups (years)
with disorder
no disorder
Figure 8.2.3: Winnipeg Number of Different Drugs Per User for Females With and Without Cumulative Disorders by Age and Sex, 1997/98-2001/02
107
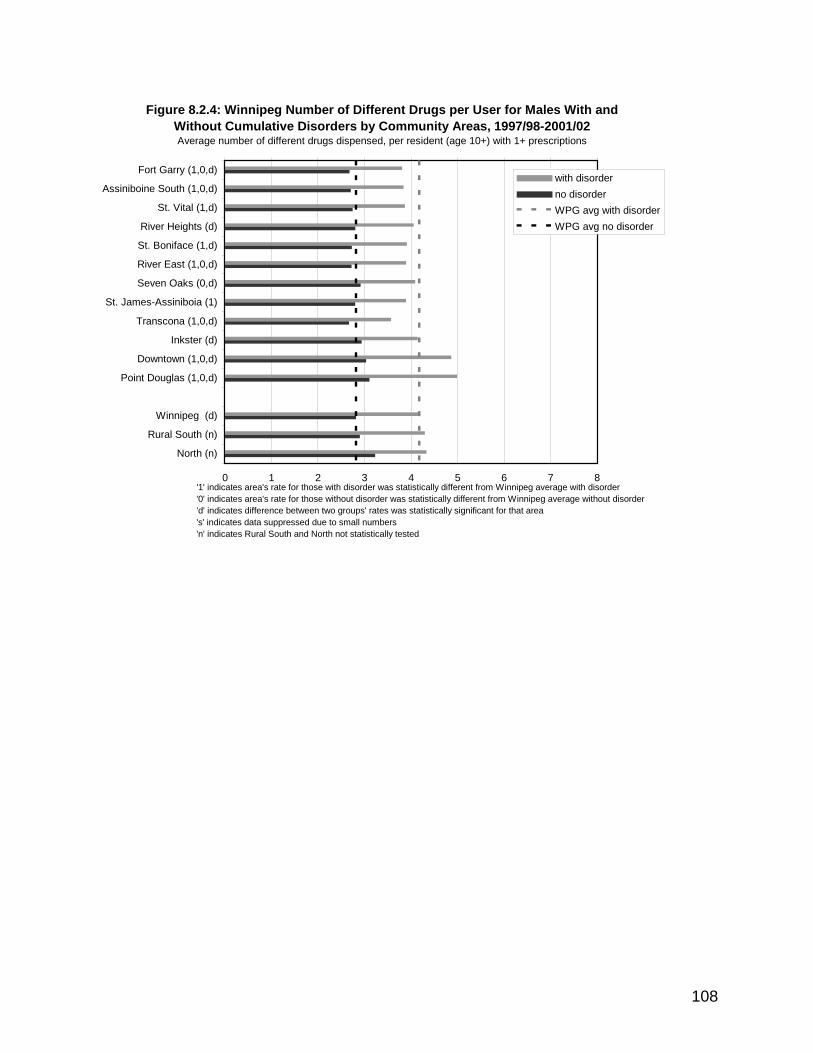
0 1 2 3 4 5 6 7 8
Fort Garry (1,0,d)
Assiniboine South (1,0,d)
St. Vital (1,d)
River Heights (d)
St. Boniface (1,d)
River East (1,0,d)
Seven Oaks (0,d)
St. James-Assiniboia (1)
Transcona (1,0,d)
Inkster (d)
Downtown (1,0,d)
Point Douglas (1,0,d)
Winnipeg (d)
Rural South (n)
North (n)
with disorderno disorderWPG avg with disorderWPG avg no disorder
Figure 8.2.4: Winnipeg Number of Different Drugs per User for Males With andWithout Cumulative Disorders by Community Areas, 1997/98-2001/02Average number of different drugs dispensed, per resident (age 10+) with 1+ prescriptions
'1' indicates area's rate for those with disorder was statistically different from Winnipeg average with disorder'0' indicates area's rate for those without disorder was statistically different from Winnipeg average without disorder'd' indicates difference between two groups' rates was statistically significant for that area's' indicates data suppressed due to small numbers'n' indicates Rural South and North not statistically tested
108

0 1 2 3 4 5 6 7 8
Fort Garry S (1,0,d)
Fort Garry N (1,0,d)
Assiniboine South (1,0)
St. Vital S (1,d)
St. Vital N (d)
River Heights W (d)
River Heights E (d)
St. Boniface E (1,0,d)
St. Boniface W (d)
River East N (1,0,d)
River East E (1,0,d)
River East W (1,0,d)
River East S (d)
Seven Oaks N (d)
Seven Oaks W (d)
Seven Oaks E (d)
St. James-Assiniboia W (1,d)
St. James-Assiniboia E (d)
Transcona (1,0,d)
Inkster W (d)
Inkster E (0,d)
Downtown W (d)
Downtown E (1,0,d)
Point Douglas N (d)
Point Douglas S (1,0,d)
Winnipeg (d)
with disorderno disorderWPG avg with disorderWPG avg no disorder
Figure 8.2.5: Winnipeg Number of Different Drugs per User for Males With andWithout Cumulative Disorders by Neighbourhood Clusters, 1997/98-2001/02
Average number of different drugs dispensed, per resident (age 10+) with 1+ prescriptions
109

0% 1% 2% 3% 4% 5%
Fort Garry (d)
Assiniboine South (f,d)
St. Vital (d)
River Heights (f,d)
St. Boniface (d)
River East (d)
Seven Oaks (f,d)
St. James-Assiniboia (d)
Transcona (d)
Inkster (m,f,d)
Downtown (d)
Point Douglas (d)
Winnipeg (d)
Rural South (n)
North (n)
malesfemalesWPG avg malesWPG avg females
Figure 8.3.1: Winnipeg Teenagers on SSRI's by Community Areas, 1997/98-2001/02Age-Adjusted annual percentage of 12-19 year olds with at least one SSRI prescription
'm' indicates area's rate for males with the disorder was statistically different from Winnipeg average for males 'f' indicates area's rate for females with disorder was statistically different from Winnipeg average for females'd' indicates difference between two groups' rates was statistically significant for that area's' indicates data suppressed due to small numbers'n' indicates Rural South and North not statistically tested
110

0% 1% 2% 3% 4% 5%
Fort Garry S (d)
Fort Garry N (d)
Assiniboine South (f,d)
St. Vital S (d)
St. Vital N (d)
River Heights W (f,d)
River Heights E (d)
St. Boniface E (d)
St. Boniface W (d)
River East N (d)
River East E (d)
River East W (d)
River East S (d)
Seven Oaks N (d)
Seven Oaks W (m,f,d)
Seven Oaks E (d)
St. James-Assiniboia W (d)
St. James-Assiniboia E (d)
Transcona (d)
Inkster W (m,f,d)
Inkster E (m,d)
Downtown W (d)
Downtown E (d)
Point Douglas N (d)
Point Douglas S (d)
Winnipeg (d)
malesfemalesWPG avg malesWPG avg females
Figure 8.3.2: Teenagers on SSRI's by Neighbourhood Clusters, 1997/98-2001/02Age-adjusted annual percentage of 12-19 year olds with at least one SSRI prescription
111

Suicide and Suicide Attempts (Chapter 9)
• The age- and sex-adjusted suicide rate is 1.2 per 10,000 Winnipeggers per year, just under the provincial average of 1.32 and on par with the Canadian average which is 1.2 per 10,000 death by suicide.(statistics Canada 1999)
• In the community area data, Point Douglas has double the rate of suicide as Winnipeg (2.4 vs 1.2 per 10,000). This would place Point Douglas tied with Burntwood region as second highest rate of suicide in the Province, only behind North Eastman which is 2.89 per 10,000. The Downtown rate is 1.6 per 10,000, placing it fourth in the province, coming after Norman Region at 2.05 per 10,000. River Heights ranks third in Winnipeg at about 1.3 which is equal to the provincial average.
• Suicide rates by age and sex differ in Winnipeg from the provincial picture where Winnipeg data shows an increase in males completing suicide by age from teens to age 45 then a sharp decline to age 65. Females show only a slight increase in rates of suicide up to the at of 25 to 44 then a slow decline. The provincial picture shows a peak for both males and females in the teen years of 15 to 19, which is not present in the Winnipeg data.
• Income Quintile shows a strong relationship with suicide. Nearly 3 times as many suicides occur in the lowest income quintile as compared to the highest, however the rates are not nearly as high as they are in the lowest rural quintile 2.4 per 10,000 in Winnipeg verses 3.6 per 10,000 in the lowest rural quintile
• Potential Years of Life Lost (PYLL) for Suicide by Community Area shows a significant difference only for Point Douglas where both males and females have more than double the years of lost life from the Winnipeg average. Point Douglas data mirrors the provincial North data and in fact PYLL is higher for females in Winnipeg than the northern average for females.
• Neighbourhoods with significantly higher rates of suicide include: River East South for males, Downtown East for females, and Point Douglas South for both
• Neighbourhoods with significantly lower rates of suicide are typically suppressed so no information is available.
• Suicide attempts by community area having similar results with Point Douglas and Downtown showing significantly higher rates of attempts.
• Suicide attempts by age and sex show a very different pattern than completed suicides. Females show higher rates than males throughout the life cycle. The peak for both male and females is earlier in life. Females have more attempts in adolescence, age 15 to 19, while males have more attempts in at age 20 to 24. Both male and female attempts drop sharply by age 25 and continue to decline to being identical at age 65.
• The % of attempters in highest in Downtown and equal for both males and females while Inkster is second for males only. Point Douglas is the only other community are with significantly higher rates of attempts.
• The prevalence of suicide attempts by income reflects the largest number of attempts in the lowest income quintile.
• When adding together the completed and attempted suicides, Downtown and Inkster are the only two areas showing significantly higher rates.
• Assiniboine South, St, Vital and Fort Garry show significantly fewer combined attempts and completed suicides.
112

• Male rates are nearly three times higher than female rates (males 1.72/10,000/yr and females 0.67/10,000/yr).
• The most common suicide method for males is by hanging (37.4% of suicides), and for females, by poisoning (50.9% of suicides).
• Potential Years of Life Lost (PYLL) due to suicide is 38.9 years lost per 10,000 residents in Winnipeg. Point Douglas and Downtown have higher PYLLs, indicating that suicide accounts for a greater loss of young people there than elsewhere.
• When risk factors are considered simultaneously in a regression analysis, the key factors predicting suicide are: being male, having a mental illness diagnosis in the previous year, being young, and having poorer health.
• Region of residence and average household income are not statistically significant predictors of suicide when other risk factors (such as having a mental illness diagnosis or other health problems) are simultaneously considered.
• Winnipeg had lower than the provincial average rates of attempted suicide. • The suicide-attempt rate is 5.5 per 10,000 Winnipeg residents per year, with females
attempting twice as often as males (6.6 versus 4.3 per 10,000 per year. • The most common means of attempting suicide was by poisoning (usually a drug
overdose) for both males (71.7%) and females (87.0%). • Self-reports from the 2000-2001 Canadian Community Health Survey Cycle 1.1 suggest
that there are about four times more suicide attempts in the province than are coded in the administrative databases.
• The prevalence of suicide attempters by people from the lowest income quintile is at least three times that of people from the highest neighbourhood income areas. The pattern is the same for males and females.
• When risk factors are considered simultaneously in a regression analysis, the key factors predicting a suicide attempt are having a mental illness diagnosis in the previous year, poor health, being young, female, and living in a low income area.
• When combining the data of attempts and completed suicides, it includes .08% of the population on average per year.
• In general females are more likely to attempt or complte suicide up to the age of 65 when males are then more likely to attempt of complete suicide.
• All factors considered, being female, being young, being diagnosed with a mental illness in the previous year, and living in a low neighbourhood income area are risk factors for attempting or completing suicide.
Prevalence of Self Report of Suicide Thoughts and Behaviours was included in the Provincial report with Winnipeg data as follows: 2% of the population responded that they had had serious suicidal thoughts in the past year and 7% within their life time (Community Health Survey in 2001). This suggests that about 4 times as many people attempt suicide as is captured in the administrative data systems. The number of males verses females was equal in the ever-attempted suicide category in the survey verses the administrative data sets that conclude there are twice as many females who attempt as males.
113

0.0 0.5 1.0 1.5 2.0 2.5 3.0
Fort Garry (s)
Assiniboine South (s)
St. Vital
River Heights
St. Boniface (s)
River East
Seven Oaks
St. James-Assiniboia
Transcona (s)
Inkster (s)
Dow ntow n
Point Douglas (*)
Winnipeg
Rural South (n)
North (n)
Figure 9.1.1 Winnipeg Suicide Rate by Community Areas, 1997-2001 Age and Sex adjusted annual rate per 10,000 residents aged 10 years+
'*' indicates area's rate was statistically different from the Winnipeg average's' indicates data suppressed due to small numbers'n' indicates Rural South and North not statistically tested
114

0
1
2
3
10-24 25-44 45+
Age Groups (years)
males
females
Figure 9.1.2: WinnipegSuicide Rate by Age and Sex, Winnipeg, 1997-2001
Crude annual rate per 10,000 residents
115

0 50 100 150 200 250 300 350
Fort Garry
Assiniboine South
St. Vital
River Heights
St. Boniface
River East
Seven Oaks
St. James-Assiniboia
Transcona
Inkster
Downtown
Point Douglas (m, f)
Winnipeg
Rural South (n)
North (n)
malesfemalesWPG avg malesWPG avg females
Figure 9.2.1:Winnipeg Potential Years of Life Lost (PYLL) for Suicide by Community Areas, 1997-2001
Age-adjusted annual rate of PYLL per 10,000 residents aged 10+
'm' indicates area's rate for males with the disorder was statistically different from Winnipeg average for males 'f' indicates area's rate for females with disorder was statistically different from Winnipeg average for females'd' indicates difference between two groups' rates was statistically significant for that area's' indicates data suppressed due to small numbers'n' indicates Rural South and North not statistically tested
116

0 50 100 150 200 250 300 350
Fort Garry SFort Garry N (s)
Assiniboine South
St. Vital SSt. Vital N
River Heights W
River Heights E
St. Boniface ESt. Boniface W
River East N (s)River East E
River East W (s)River East S (m)
Seven Oaks N (s)
Seven Oaks WSeven Oaks E
St. James-Assiniboia W
St. James-Assiniboia E
Transcona
Inkster W
Inkster E
Downtown W (s)Downtown E (f)
Point Douglas NPoint Douglas S (m,f)
Winnipeg
malesfemalesWPG avg malesWPG ave females
Figure 9.2.2:Winnipeg Potential Years of Life Lost (PYLL) for Suicide by Neighbourhood Clusters, 1997-2001
Age-adjusted annual rate of PYLL per 10,000 residents aged 10+
117

0 10 20 30 40 50 60 70 80 90 10
Fort Garry (m)
Assiniboine South (s)
St. Vital (f)
River Heights
St. Boniface
River East
Seven Oaks
St. James-Assiniboia (f)
Transcona
Inkster (s)
Downtown (m,f)
Point Douglas (m,f)
Winnipeg
Rural South (n)
North (n)
0
males femalesWPG ave malesWPG ave females
Figure 9.3.1: Winnipeg Rate of Suicide Attempts by Community Areas, 1997-2001Age-adjusted annual rate per 10,000 residents aged 10 years + (per year)
'm' indicates area's rate for males with the disorder was statistically different from Winnipeg average for males'f' indicates area's rate for females with disorder was statistically different from Winnipeg average for females'd' indicates difference between two groups' rates was statistically significant for that area's' indicates data suppressed due to small numbers'n' indicates Rural South and North not statistically tested
118

0
5
10
15
20
25
30
10-14 15-19 20-24 25-44 45-64 65+
Age Groups (years)
malesfemales
Figure 9.3.2: Winnipeg Suicide Attempt Rates by Age and Sex, 1997-2001Crude annual rate per 10,000 residents
119

0.0% 0.1% 0.2% 0.3% 0.4% 0.5% 0.6% 0.7% 0.8%
Fort Garry (m)
Assiniboine South (s)
St. Vital (f)
River Heights
St. Boniface
River East
Seven Oaks
St. James-Assiniboia
Transcona (s)
Inkster (s)
Downtown (m,f)
Point Douglas (m,f)
Winnipeg
Rural South (n)
North (n)
malesfemalesWPG ave malesWPG ave females
Figure 9.4.1:Winnipeg Prevalence of Suicide Attempters by Community Areas,1997-2001
Age-adjusted annual percentage of residents (aged 10 years +)
'm' indicates area's rate for males with the disorder was statistically different from Winnipeg average for males'f' indicates area's rate for females with disorder was statistically different from Winnipeg average for females'd' indicates difference between two groups' rates was statistically significant for that area's' indicates data suppressed due to small numbers'n' indicates Rural South and North not statistically tested

Figure 9.4.2: Winnipeg Prevalence of Suicide Attempters by Age and Sex, 1997-2001
Crude annual percent of residents
0.00%
0.05%
0.10%
0.15%
0.20%
0.25%
10-14 15-19 20-24 25-44 45-64 65+
Age Groups (years)
malesfemales
121

0.0% 0.1% 0.2% 0.3% 0.4% 0.5% 0.6% 0.7% 0.8%
Fort Garry (m)
Assiniboine South (s)
St. Vital (f)
River Heights
St. Boniface
River East
Seven Oaks
St. James-Assiniboia
Transcona
Inkster
Downtown (m,f)
Point Douglas (m,f)
Winnipeg
Rural South (n)
North (n)
malesfemalesWPG ave maleWPG ave female
Figure 9.5.1: Winnipeg Prevalence of Individuals who Completed or Attempted Suicide by Community Areas, 1997-2001
Age-adjusted annual percentage of residents (aged 10 years +)
'm' indicates area's rate for males with the disorder was statistically different from Winnipeg average for males'f' indicates area's rate for females with disorder was statistically different from Winnipeg average for females'd' indicates difference between two groups' rates was statistically significant for that area's' indicates data suppressed due to small numbers'n' indicates Rural South and North not statistically tested

Figure 9.5.2: Winnipeg Prevalence of Individuals who Completed or Attempted Suicide by Age and Sex, 1997-2001
Crude annual percent of residents
0.00%
0.05%
0.10%
0.15%
0.20%
0.25%
10-14 15-19 20-24 25-44 45-64 65+
Age Groups (years)
malesfemales
123

Overall observations and recommendations This report provides useful information about patterns of mental illness in Winnipeg by community area and neighbourhood on:
o Premature Mortality Rates o Treatment Prevalence of Mental Disorders o Use of Physician Services by those with mental illness diagnoses o Use of Hospital Services by those with a mental illness diagnosis o Home Care Use by those with a mental illness diagnosis o Personal Care Home (Nursing Home) Use by those with a mental illness diagnosis o Pharmaceutical Use for Mental Illness Disorders o Suicide and Suicide Attempts
The burden of mental illness The burden of mental illness in Winnipeg is huge. Mental health services are critical to the health care system given that we know that 39% of the population in Winnipeg aged 10+ had at least one health care contact coded with a mental illness diagnoses over the five-year period from 1997/98-2001/02. Moreover, 25% of Winnipeg residents were diagnosed as having one or more of the “cumulative” mental disorders (i.e. depression, anxiety disorders, substance abuse, schizophrenia, and personality disorders). More than one in ten visits to physicians, and one in ten hospitalizations are related to issues of mental illness. Those having diagnoses for mental illness are also using home care and personal care homes at much higher rates compared to the rest of Winnipeggers. Given the fact that mental illness is a critical area of interest to health care planners and policy-makers in Winnipeg, there are several issues that arise from this report that should be addressed. Is our health care system “needs-based” in its response to people with mental illnesses? If health services for mental illness were truly “needs-based”, one would expect the rate of health care service use to be higher for people living in the lower income neighbourhoods, since that is where the prevalence is highest. As well, one would expect those community areas with the poorest overall health status to show the highest health services use rates. For those people having mental illness diagnoses (i.e. the “cumulative” mental disorders group):
• The rates of hospitalization for mental illness do show a strong needs-based relationship, with people in low income areas and areas of poor overall health status having the highest hospitalization rates.
• Overall physician visits for mental illness reasons do not show a needs-based relationship in Winnipeg, where rates are similar in all income areas.
• Visit rates to psychiatrists do not show needs-based patterns. In fact, psychiatrist visit rates show the exact opposite pattern by neighbourhood income and by health status. Those in the highest income areas, and in general the areas of best overall health status, have the highest psychiatrist visit rates. As well, the most frequent users of psychiatrists are 35-55 year olds, with low rates for young adults, and extremely low rates for people aged 60 or more. Given the fact that a high proportion of the elderly have mental illness diagnoses, and very high visit rates to physicians for reasons of mental illness, it is particularly surprising that the psychiatric visit rate in this age group is so low. It is
124

therefore important for health planners to look at issues of access to psychiatrists for the older adults.
• Home care use is somewhat needs-based, with highest rates of open home care cases in the lowest income areas.
At times, the information raises questions that will require further study. For example, while hospital stay data and physician utilization data fit the expected pattern, the utilization of psychiatric resources does not follow the expected pattern. In the later case, the highest quintile utilized the most psychiatric resources, rather than the lowest quintile as might be expected. Mixed quintile neighborhoods such as River Heights, which includes both an inner city and suburban area may contribute to the findings; however, further exploration of the information would be useful. Cultural or ethic differences in resource use may also play a role in the unexpected pattern. Further exploration of the patterns of psychiatric resource utilization is suggested by studying hospital based psychiatric resource use verse non-hospital based psychiatric resources use, as well as, sorting the patterns of inpatient service utilization by persons who utilize psychiatric resources. We will need to further analyze the data and consider alternative sources of data to enhance our understand of the psychiatric resource utilization pattern in Winnipeg. It is assumed that help seeking behaviors play a roll in service utilization and that wealthier persons have fewer barriers to seeking services. It is also noteworthy that data has not been included from Aboriginal services, psychological services or from any mental health or addictions agencies. What are the Mental Health Needs in Personal Care Homes? Having a mental health diagnosis is the rule not the exception, given the high prevalence (83%) of mental illness in PCH. This burden of mental illness among people residing in PCHs requires PCH planners ensure that the staff are appropriately trained. Care provided in PCHs must address both physical and mental health needs of residents. It is suggested that a high level of expertise in mental health is required to meet needs in PCH’s. Are there opportunities for Suicide Prevention? In our analyses of individuals who attempted or completed suicide, risk factors such as age, sex, community area and neighbourhood income were important factors. This data can give us important information about who is likely to attempt or complete suicide. Another highly predictive risk factor was having a diagnosis of a mental illness in the previous year – in other words, persons completing or attempting suicide are highly likely to have contacted a health care provider for mental health issues in the year prior to the event. This is a ‘window of opportunity’ for the health care system to intervene. Therefore, it is important to ensure that the referral system for those at high risk of attempting suicide is adequate. There are striking findings within areas of Winnipeg, namely, Point Douglas, Downtown and River Heights that are tied in suicide rates with the Burntwood region, North Eastman and Norman Region, respectively. The extraordinarily high rate of suicide in Point Douglas area requires further study. Along with high
125

treatment prevalence, significant factors may be poverty, social economic status, ethnicity and substance abuse. River Heights ranks 3rd in Winnipeg and calls into question some of the analysis that this area represents one of the highest income quintile and would therefore be expected to have the lowest treatment prevalence. There are considerable differences between River Heights east and River Heights west. We suggest that in fact we have a very mixed income quintile and treatment prevalence rates in this area that results in rates about equal to the provincial averages. Do we have adequate data to monitor and evaluate mental health services in Manitoba? Adequate data collection is critical to ensure evaluation of the way in which our health care system addresses issues of mental illness. Given the fact that this report was based mainly on administrative claims data available through the Population Health Research Data Repository housed at MCHP, we have been able to do extensive research into the patterns of mental illness and health care use patterns. The data proved to be extremely useful despite its limitations, and demonstrated a high degree of validity. However, there are some key recommendations for future data collection to facilitate future reports on mental health services:
• It is important to ensure that Vital Statistics data are updated to include post-mortem cause of death as determined by the Medical Examiner’s Office, since under-reporting of suicide is a concern.
• Winnipeg needs a mental health database system that connects hospital and community based data systems utilizing mandated fields which are consistently and accurately coded throughout the Region and made available for province wide data comparisons, including salaried psychiatrists in the mental health care system and ideally would include salaried psychologists and other care providers.
Other areas of interest for future research include:
- Service utilization for persons with depression by community area and neighbourhood, including hospital days, all physician visit, psychiatrist visits and Mediation use including a focused look at using SSRI’s by age, income sex and Neighbourhood to get at depression severity for resource utilization in depression (e.g. hospital treatment vs. exclusively outpatient therapy)
- In keeping with the Co-occurring Disorders Initiative (CODI) implemented in the region, resource utilization for persons with comorbid Substance Use disorder plus a diagnosis of one or more of depression, anxiety disorder, personality disorder or schizophrenia by community area and neighbourhood, including hospital days, all physician visit, psychiatrist visits and Pharmacology use
- Further analysis of suicide and suicide attempt by age, sex, MH diagnoses, time since last MH visit, number of hospitalizations, pharmacological use and other comorbid conditions and to further explore windows of opportunity for more appropriate suicide intervention
Given that we don’t have complete data, better information sources would make a big difference to understanding the issues in mental health. Data collection is generally inconsistent and not well linked. There are issues in collecting physician data across salaried and non-salaried
126

127
physicians. There is a lack of data collection in outpatient services and community agencies. Documentation is often discipline specific or service specific and remains unlinked to regional data sets. The lack of data has implications for being able to appropriately locating services and for the development of unique services to meet particular needs. Getting better data can help target service needs more appropriately such as locating suicide prevention services in Point Douglas and Downtown and providing anxiety disorders services in Transcona. This report gives us an opportunity to assess the service needs by community area and by neighbourhood clusters, to correct disparities and to begin to address the wide range of mental health needs by planning and implementing services based on the best evidence available. Since the time of this data collection, several new service initiatives have been developed and implemented in Winnipeg:
o Early Psychosis Prevention and Intervention Services (EPPIS), o Program for Assertive Community Treatment (PACT), o Shared Care o Brief Treatment o Community Psychiatry On-Call Consultation (CPOCC) o Suicide Prevention Strategy o Co-Occurring Disorders Initiative (CODI) Systems Change Strategy o CODI Outreach Team o Mental Health Addictions Unit o Child and Adolescent Mental Health Services Redevelopment Initiative
Further study is required to address the impact of these initiatives on the mental health outcomes and will be helpful in providing direction for further service development. While the inability to collect other provider data continues to limit the analysis, replication of the current analysis with more recent cohorts will still provide further insight into the evolving patterns of mental health needs in the community. The entire document, as well as each graph in Excel spreadsheet format, is available on line at WRHA “link to website” or at MCHP’s website www.umanitoba.ca/centres/mchp/ under “Reports”. Hard copies of the report may be requested through the WRHA website form, or by contacting the WRHA directly.
The results and conclusions of this report are those of the authors and no official endorsement by Manitoba Health or the Manitoba Centre for Health Policy was intended or should be inferred.

List of Figures Figure 1.1.1: Winnipeg Premature Mortality Rates by Community Areas --------------------------7Figure 1.1.2: Winnipeg Premature Mortality Rates by Neighbourhood Clusters-----------------8 Figure 1.2.1: Percent of Residents (aged 10 years +) Within Each Category of Mental Illness Groupings----------------------------------------------------------9 Figure 2.1.1: Winnipeg Treatment Prevalence of Cumulative Disorders by Community Areas, 1997/ 98-2001/ 02-------------------------------------------------------------------------12 Figure 2.1.2: Winnipeg Treatment Prevalence of Cumulative Disorders by Neighbourhood Clusters, 1997/ 98-2001/ 02----------------------------------------------------------------13 Figure 2.1.3: WinnipegTreatment Prevalence of Cumulative Disorders by Age and Sex, 1997/ 98-2001/ 02----------------------------------------------------------------------------------14 Figure 2.1.4: Winnipeg Treatment Prevalence of Cumulative Disorders by Income Q uintile, 1997/ 98-2001/ 02-----------------------------------------------------------------------------14 Figure 2.2.1: Winnipeg Treatment Prevalance of O ther Disorders by Community Areas, 1997/ 98-2001/ 02--------------------------------------------------------------------------15 Figure 2.2.2: Winnipeg Treatment Prevalence of O ther Disorders by Neighbourhood Clusters, 1997/ 98-2001/ 02----------------------------------------------------------------16 Figure 2.2.3: Winnipeg Treatment Prevalence of O ther Disorders by Age and Sex, 1997/ 98-2001/ 02-----------------------------------------------------------------------------------17 Figure 2.2.4: Winnipeg Treatment Prevalence of O ther Disorders by Income Q uintile, 1997/ 98-2001/ 02-----------------------------------------------------------------------------17 Figure 2.3.1: Winnipeg Treatment Prevalence of Dementia by Community Areas, 1997/ 98-2001/ 02--------------------------------------------------------------------------18 Figure 2.3.2: Winnipeg Treatment Prevalence of Dementia by Neighbourhood Clusters, 1997/ 98-2001/ 02-----------------------------------------------------------------19 Figure 2.3.3: Treatment Prevalence of Dementia by Age and Sex, 1997/ 98-2001/ 02----------------------------------------------------------------------------------20 Figure 2.3.4: Treatment Prevalence of Dementia by Income Q uintile, 1997/ 98-2001/ 02-----------------------------------------------------------------------------20 Figure 2.4.1: Winnipeg Treatment Prevalence of Depression by Community Areas, 1997/ 98-2001/ 02--------------------------------------------------------------------------21 Figure 2.4.2: Winnipeg Treatment Prevalence of Depression by Neighbourhood Clusters, 1997/ 98-2001/ 02----------------------------------------------------------------22 Figure 2.4.3: Winnipeg Treatment Prevalence of Depression by Age and Sex, 1997/ 98-2001/ 02----------------------------------------------------------------------------------23 Figure 2.4.4: Winnipeg Treatment Prevalence of Depression by Income Q uintile, 1997/ 98-2001/ 02-----------------------------------------------------------------------------23 Figure 2.5.1: Winnipeg Treatment Prevalence of Anxiety Disorders by Community Areas, 1997/ 98-2001/ 02--------------------------------------------------------------------------24 Figure 2.5.2: Winnipeg Treatment Prevalence of Anxiety Disorders by Neighbourhood Cluster, 1997/ 98-2001/ 02------------------------------------------------------------------25 Figure 2.5.3: Winnipeg Treatment Prevalence of Anxiety Disorders by Age and Sex, 1997/ 98-2001/ 02-----------------------------------------------------------------------------------26

Figure 2.5.4: Winnipeg Treatment Prevalence of Anxiety Disorders by Income Q uintile, 1997/ 98-2001/ 02-----------------------------------------------------------------------------------------26 Figure 2.6.1: Winnipeg Treatment Prevalance of Substance Abuse by Community Areas, 1997/ 98-2001/ 02--------------------------------------------------------------------------------------27 Figure 2.6.2: Winnipeg Treatment Prevalance of Substance Abuse by Neighbourhood Clusters, 1997/ 98-2001/ 02-----------------------------------------------------------------------------28Figure 2.6.3:Winnipeg Treatment Prevalence of Substance Abuse by Age and Sex, 1997/ 98-2001/ 02-----------------------------------------------------------------------------------------------29 Figure 2.6.4: Winnipeg Treatment Prevalence of Substance Abuse Disorders by Income Q uintile, 1997/ 98-2001/ 02-----------------------------------------------------------------------------------------29 Figure 2.7.1: Winnipeg Treatment Prevalence of Schizophrenia by Community Areas, 1997/ 98-2001/ 02--------------------------------------------------------------------------------------30Figure 2.7.2: Winnipeg Treatment Prevalence of Schizophrenia by Neighbourhood Clusters, 1997/ 98-2001/ 02------------------------------------------------------------------------------31Figure 2.7.3: Winnipeg Treatment Prevalence of Schizophrenia by Age and Sex, 1997/ 98-2001/ 02-----------------------------------------------------------------------------------------------32Figure 2.7.4: Winnipeg Treatment Prevalence of Schizophrenia by Income Q uintile, 1997/ 98-2001/ 02-----------------------------------------------------------------------------------------32 Figure 2.8.1: Winnipeg Treatment Prevalence of Personality Disorder by Community Areas, 1997/ 98-2001/ 02--------------------------------------------------------------------------------------33Figure 2.8.2: Winnipeg Treatment Prevalence of Personality Disorder by Neighbourhood Clusters, 1997/ 98-2001/ 02-----------------------------------------------------------------------------34Figure 2.8.3: Winnipeg Treatment Prevalence of Personality Disorders by Age and Sex, 1997/ 98-2001/ 02-----------------------------------------------------------------------------------------------35 Figure 2.8.4: Winnipeg Treatment Prevalence of Personality Disorders by Income Q uintile, 1997/ 98-2001/ 02------------------------------------------------------------------------------------------35Figure 4.1.1: Winnipeg All-Cause Physician Visit Rates for Males With and Without Cumulative Disorders by Community Area, 1997/ 98-2001/ 02-----------------------------------------37Figure 4.1.2: Winnipeg All-Cause Physician Visit Rates for Males With and Without Cumulative Disorders by Neighbourhood Clusters, 1997/ 98-2001/ 02------------------------------38Figure 4.1.3: Winnipeg All-Cause Physician Visit Rates for Males With and Without Cumulative Disorders by Age and Sex, 1997/ 98-2001/ 02------------------------------------------------39 Figure 4.1.4: Winnipeg All-Cause Physician Visit Rates for Males With and Without Cumulative Disorders by Income Q uintile, 1997/ 98-2001/ 02-----------------------------------------39 Figure 4.1.5: Winnipeg All-Cause Physician Visit Rates for Females With and Without Cumulative Disorders by Community Areas, 1997/ 98-2001/ 02---------------------------------------40Figure 4.1.6: Winnipeg All-Cause Physician Visit Rates for Females With and Without Cumulative Disorders by Neighbourhood Clusters, 1997/ 98-2001/ 02-------------------------------41Figure 4.1.7: Winnipeg All-Cause Physician Visit Rates for Females With and Without Cumulative Disorders by Age and Sex, 1997/ 98-2001/ 02------------------------------------------------42Figure 4.1.8: Winnipeg All-Cause Physician Visit Rates for Females With and Without Cumulative Disorders by Income Q uintile, 1997/ 98-2001/ 02-----------------------------------------42Figure 4.1.9: Winnipeg All-Cause Physician Visit Rates by Sex and Cause Cumulative Disorders vs. No Disorders , 1997/ 98-2001/ 02-----------------------------------------------------------43 Figure 4.2.1: Winnipeg Visit Rates to All Physicians for Mental illness Disorders for those With Cumulative Disorders by Community Areas, 1997/ 98-2001/ 02-----------------------------------44Figure 4.2.2: Winnipeg Visit Rates to All Physicians for Mental illness Disorders for

those With Cumulative Disorders by Neighbourhood Clusters, 1997/ 98-2001/ 02-------------------------45Figure 4.2.3: Winnipeg Visit Rates to All Physicians for Mental Illness Disorders for those with Cumulative Disorders by Age and Sex, 1997/ 98-2001/ 02---------------------------------------------46Figure 4.2.4: Winnipeg Visit Rates to All Physicians for Mental Illness Disorders for those With Cumulative Disorders by Income Q uintile, 1997/ 98-2001/ 02--------------------------------------46 Figure 4.3.1: Winnipeg Visit Rates to Psychiatrists for Mental Illness Disorders for those with Cumulative Disorders by Community Areas, 1997/ 98-2001/ 02------------------------------------47Figure 4.3.2: Winnipeg Visit Rates to Psychiatrists for Mental Illness Disorders for those with Cumulative Disorders by Neighbourhood Clusters, 1997/ 98-2001/ 02---------------------------48Figure 4.3.3: Winnipeg Visit Rates to Psychiatrists for Mental Illness Disorders for those with Cumulative Disorders by Age and Sex, 1997/ 98-2001/ 02---------------------------------------------49Figure 4.3.4: Winnipeg Visit Rates to Psychiatrists for Mental Illness Disorders for those with Cumulative Disorders by Income Q uintile, 1997/ 98-2001/ 02---------------------------------------49 Figure 5.1.1: Winnipeg All-Cause Hospital Separations for Males With and Without Cumulative Disorders by Community Areas, 1997/ 98-2001/ 02----------------------------------------51 Figure 5.1.2: Winnipeg All-Cause Hospital Separation for Males With and Without Cumulative Disorders by Neighbourhood Clusters, 1997/ 98-2001/ 02------------------------------52Figure 5.1.3:Winnipeg All-Cause Hospital Separations for Males With and Without Cumulative Disorders by Age and Sex, 1997/ 98-2001/ 02------------------------------------------------53 Figure 5.1.4: Winnipeg All Cause Hospital Separation for Males With and Without Cumulative Disorders by Income Q uintile, 1997/ 98-2001/ 02-------------------------------------------53Figure 5.1.5: Winnipeg All-Cause Hospital Separation for Females With and Without Cumulative Disorders by Community Areas, 1997/ 98-2001/ 02---------------------------------------54 Figure 5.1.6: Winnipeg All-Cause Hospital Separation for Females With and Without Cumulative Disorders by Neighbourhood Clusters, 1997/ 98-2001/ 02------------------------------55 Figure 5.1.7: Winnipeg All-Cause Hospital Separations for Females With and Without Cumulative Disorders by Age and Sex, 1997/ 98-2001/ 02------------------------------------------------56 Figure 5.1.8: Winnipeg All Cause Hospital Separation for Females With and Without Cumulative Disorders by Income Q uintile, 1997/ 98-2001/ 02-------------------------------------------56Figure 5.2.1: Winnipeg All-Cause Short (<30) Stay Hospital Days for Males With and Without Cumulative Disorders by Community Areas, 1997/ 98-2001/ 02---------------------------------------57 Figure 5.2.2:Winnipeg All-Cause Short (<30) Stay Hospital Days for Males With and Without Cumulative Disorders by Neighbourhood Clusters, 1997/ 98-2001/ 02------------------------------58 Figure 5.3.1: Winnipeg All-Cause Long (30+) Stay Hospital Days for Males With and Without Cumulative Disorders by Community Areas, 1997/ 98-2001/ 02---------------------------------------59 Figure 5.3.2: Winnipeg All-Cause Long (30+) Stay Hospital Days for Males With and Without Cumulative Disorders by Neighbourhood Clusters, 1997/ 98-2001/ 02------------------------------60Figure 5.4.1:Winnipeg Hospital Separations for Mental Illness Disorders for those with Cumulative Disorders by Community Areas, 1997/ 98-2001/ 02----------------------------------------------61 Figure 5.4.2: Winnipeg Hospital Separations for Mental Illness Disorders for those with Cumulative Disorders by Neighbourhood Clusters, 1997/ 98-2001/ 02------------------------------------62Figure 5.4.3: Winnipeg Hospital Separations for Mental Illness Disorders for those With Cumulative Disorders by Age and Sex, 1997/ 98-2001/ 02-----------------------------------------------------63 Figure 5.4.4: Winnipeg Hospital Separations for Mental Illness Disorders for those With Cumulative Disorders by Income Q uintile, 1997/ 98-2001/ 02---------------------------------63Figure 5.5.1: Winnipeg Short (<30) Stay Hospital Days for Mental Illness Disorders for those With Cumulative Disorders by Community Areas, 1997/ 98-2001/ 02------------------------------64

Figure 5.5.2: Winnipeg Short (<30) Stay Hospital Days for Mental Illness Disorders for those With Cumulative Disorders by Neighbourhood Clusters, 1997/ 98-2001/ 02---------------------65Figure 5.6.1: Winnipeg Long (30+) Stay Hospital Days for Mental Illness Disorders for those With Cumulative Disorders by Community Areas, 1997/ 98-2001/ 02------------------------------66Figure 5.6.2: Winnipeg Long (30+) Stay Hospital Days for Mental Illness Disorders for those With Cumulative Disorders by Neighbourhood Clusters, 1997/ 98-2001/ 02---------------------67Figure 6.1.1:Winnipeg O pen Home Care Cases for Males With and Without Cumulative Disorders by Community Areas, 1997/ 98-2001/ 02-----------------------------------------------------69Figure 6.1.2: Winnipeg O pen Home Care Cases for Males With and Without Cumulative Disorders by Neighbourhood Clusters, 1997/ 98-2001/ 02--------------------------------------------70Figure 6.1.3: Winnipeg Open Home Care Cases for Males With and Without Cumulative Disorders by Age and Sex, 1997/ 98-2001/ 02---------------------------------------------------------------71Figure 6.1.4: Winnipeg O pen Home Care Cases for Males With and Without Cumulative Disorders by Income Q uintile, 1997/ 98-2001/ 02---------------------------------------------------------71Figure 6.1.5: Winnipeg Open Home Care Cases for Females With and Without Cumulative Disorders by Community Areas, 1997/ 98-2001/ 02---------------------------------------72 Figure 6.1.6: Winnipeg Open Home Care Cases for Females With and Without Cumulative Disorders by Neighbourhood Clusters, 1997/ 98-2001/ 02------------------------------73Figure 6.1.7: Winnipeg Open Home Care Cases for Females With and Without Cumulative Disorders by Age and Sex, 1997/ 98-2001/ 02--------------------------------------------------------------74Figure 6.1.8: Winnipeg Open Home Care Cases for Females With and Without Cumulative Disorders by Income Q uintile, 1997/ 98-2001/ 02--------------------------------------------------------74Figure 6.2.1: Winnipeg New Home Care Cases for Males With and Without Cumulative Disorders by Community Areas, 1997/ 98-2001/ 02---------------------------------------75 Figure 6.2.2: Winnipeg New Home Care Cases for Males With and Without Cumulative Disorders by Neighbourhood Clusters, 1997/ 98-2001/ 02------------------------------76 Figure 6.2.3: Winnipeg New Home Care Cases for Females With and Without Cumulative Disorders by Community Areas, 1997/ 98-2001/ 02---------------------------------------77 Figure 6.2.4: Winnipeg New Home Care Cases for Females With and Without Cumulative Disorders by Neighbourhood Clusters, 1997/ 98-2001/ 02------------------------------78 Figure 6.3.1: Winnipeg Home Care Case Closing Rates for Males With and Without Cumulative Disorders by Community Areas, 1997/ 98-2001/ 02---------------------------------------79 Figure 6.3.2: Winnipeg Home Care Case Closing Rates for Males With and Without Cumulative Disorders by Neighbourhood Clusters, 1997/ 98-2001/ 02------------------------------80Figure 6.3.3: Winnipeg Home Care Case Closing Rates for Females With and Without Cumulative Disorders by Community Areas, 1997/ 98-2001/ 02----------------------------------------81 Figure 6.3.4: Winnipeg Home Care Case Closing Rates for Females With and Without Cumulative Disorders by Neighbourhood Clusters, 1997/ 98-2001/ 02------------------------------82Figure 6.4.1: Winnipeg Average Length of Home Care Cases for Males With and Without Cumulative Disorders by Community Areas, 1997/ 98-2001/ 02---------------------------------83Figure 6.4.2: Winnipeg Average Length of Home Care Cases for Males With and Without Cumulative Disorders by Neighbourhood Clusters, 1997/ 98-2001/ 02------------------------------84Figure 6.4.3: Winnipeg Average Length of Home Care Cases for Females With and Without Cumulative Disorders by Community Areas, 1997/ 98-2001/ 02---------------------------------85Figure 6.4.4: Winnipeg Average Length of Home Care Cases for Females With and Without Cumulative Disorders by Neighbourhood Clusters, 1997/ 98-2001/ 02------------------------------86 Figure 6.5.1: Winnipeg Open Home Care Cases for those With

Depression by Community Areas, 1997/ 98-2001/ 02---------------------------------------------------------------------87Figure 6.5.2: Winnipeg Open Home Care Cases for those with Depression by Neighbourhood Clusters, 1997/ 98-2001/ 02----------------------------------------------------------------------------88Figure 6.6.1: Winnipeg Open Home Care Cases for those with Dementia by Community Areas, 1997/ 98-2001/ 02--------------------------------------------------------------------------------------89 Figure 6.6.2: Open Home Care Cases for those with Dementia by Neighbourhood Clusters, 1997/ 98-2001/ 02-----------------------------------------------------------------------------90Figure 7.1.1: Winnipeg PCH Residents: Males 75+ With and Without Cumulative Disorders by Community Areas, 1997/ 98-2001/ 02-----------------------------------------------------92Figure 7.1.2: Winnipeg PCH Residents: Females 75+ With and Without Cumulative Disorders by Community Areas, 1997/ 98-2001/ 02-----------------------------------------------------93Figure 7.2.1: Winnipeg PCH Admissions for Males 75+ With and Without Cumulative Disorders by Community Areas, 1997/ 98-2001/ 02-----------------------------------------------------94Figure 7.2.2: Winnipeg PCH Admissions for Females 75+ With and Without Cumulative Disorders by Community Areas, 1997/ 98-2001/ 02-----------------------------------------------------95Figure 7.3.1: Winnipeg Median Waiting Times for PCH Admission for Males With and Without Cumulative Disorders by Community Areas, 1997/ 98-2001/ 02---------------------------------96Figure 7.3.2: Winnipeg Median Waiting Times for PCH Admission for Females With and Without Cumulative Disorders by CA, 1997/ 98-2001/ 02-------------------------------------------------------97 Figure 7.4.1: Winnipeg PCH Residents 75+ With Dementia by Community Areas, 1997/ 98-2001/ 02--------------------------------------------------------------------------------------98 Figure 7.5.1: Winnipeg PCH Residents 75+ With Depression by Community Areas, 1997/ 98-2001/ 02--------------------------------------------------------------------------------------99 Figure 8.1.1: Winnipeg Proportion of Females with at Least O ne Prescription With and Without Cumulative Disorders by Community Areas, 1997/ 98-2001/ 02------------------------101Figure 8.1.2: Winnipeg Proportion of Females with at Least O ne Prescription With and Without Cumulative Disorders by Neighbourhood Clusters, 1997/ 98-2001/ 02-----------------------------------------------------------------------------------------------------------------------102Figure 8.1.3: Winnipeg Proportion of Males with at Least One Prescription With and Without Cumulative Disorders by Community Areas, 1997/ 98-2001/ 02-----------------------103Figure 8.1.4: Winnipeg Proportion of Males with at Least One Prescription With and Without Cumulative Disorders by Neighbourhood Clusters, 1997/ 98-2001/ 02------------------------------------------------------------------------------------------------------------------------104Figure 8.2.1: Winnipeg Number of Different Drugs per User for Females With and Without Cumulative Disorders by Community Areas, 1997/ 98-2001/ 02--------------------------------------105Figure 8.2.2: Winnipeg Number of Different Drugs per User for Females With and Without Cumulative Disorders by Neighbourhood Clusters, 1997/ 98-2001/ 02-----------------------------106Figure 8.2.3: Winnipeg Number of Different Drugs Per User for Females With and Without Cumulative Disorders by Age and Sex, 1997/ 98-2001/ 02--------------------------------107Figure 8.2.4: Winnipeg Number of Different Drugs per User for Males With and Without Cumulative Disorders by Community Areas, 1997/ 98-2001/ 02-----------------------108Figure 8.2.5: Winnipeg Number of Different Drugs per User for Males With and Without Cumulative Disorders by Neighbourhood Clusters, 1997/ 98-2001/ 02-----------------------------109Figure 8.3.1: Winnipeg Teenagers on SSRI's by Community Areas, 1997/ 98-2001/ 02---------------------110Figure 8.3.2: Teenagers on SSRI's by Neighbourhood Clusters, 1997/ 98-2001/ 02---------------------------111 Figure 9.1.1 Winnipeg Suicide Rate by Community Areas, 1997-2001----------------------------------------------114Figure 9.1.2: WinnipegSuicide Rate by Age and Sex, Winnipeg, 1997-2001--------------------------------------115

Figure 9.2.1:Winnipeg Potential Years of Life Lost (PYLL) for Suicide by Community Areas, 1997-2001--------------------------------------------------------------------------------------------------116Figure 9.2.2:Winnipeg Potential Years of Life Lost (PYLL) for Suicide by Neighbourhood Clusters, 1997-2001-----------------------------------------------------------------------------------------117Figure 9.3.1: Winnipeg Rate of Suicide Attempts by Community Areas, 1997-2001-------------------------118Figure 9.3.2: Winnipeg Suicide Attempt Rates by Age and Sex, 1997-2001------------------------------------119Figure 9.4.1:Winnipeg Prevalence of Suicide Attempters by Community Areas,1997-2001--------------------------------------------------------------------------------------------------120Figure 9.4.2:Winnipeg Prevalence of Suicide Attempters by Age and Sex,1997-2001------------------------------------------------------------------------------------------------------------121Figure 9.5.1: Winnipeg Prevalence of Individuals who Completed or Attempted Suicide by Community Areas, 1997-2001--------------------------------------------------------------------122Figure 9.5.2: Winnipeg Prevalence of Individuals who Completed or Attempted Suicide by Age and Sex, 1997-2001-----------------------------------------------------------------------------123