Patterns of International Capital Raisings - IMF · Patterns of International Capital Raisings* ......
56
C C ONFERENCE ON I I NTERNATIONAL M M ACRO - - F F INANCE A PRIL 24-25, 2008 Patterns of International Capital Raisings Juan Carlos Gozzi, Ross Levine, and Sergio L. Schmukler Presented by Sergio Schmukler
Transcript of Patterns of International Capital Raisings - IMF · Patterns of International Capital Raisings* ......

CCOONNFFEERREENNCCEE OONN IINNTTEERRNNAATTIIOONNAALL MMAACCRROO--FFIINNAANNCCEE
AAPPRRIILL 2244--2255,, 22000088
Patterns of International Capital Raisings
Juan Carlos Gozzi, Ross Levine,
and Sergio L. Schmukler
Presented by Sergio Schmukler

Patterns of International Capital Raisings*
Juan Carlos Gozzi,a Ross Levine,a,b Sergio L. Schmuklerc
June 27, 2008
Abstract This paper documents several new patterns associated with firms issuing stocks and bonds in foreign markets that motivate the need for and help guide future research. Besides noting that these international capital raisings grew almost four-fold from 1991 to 2005, accounting for 35% of all capital raised through security issuances, we find: (1) a large and growing fraction of capital raisings, especially debt issuances, occurs in international markets, but a very small number of firms accounts for the bulk of international capital raisings, highlighting the distributional implications of financial globalization; (2) changes in firm performance following equity and debt issuances in international markets are qualitatively similar to those following domestic issuances, suggesting that capital raisings abroad are not intrinsically different from those domestically; and (3) after firms start accessing international markets, they significantly increase the amount raised in domestic markets, suggesting that international and domestic markets are complements. JEL classification codes: G15, F36, F20 Keywords: international finance; bonding; segmentation; market timing; corporate finance a Brown University, b NBER, c World Bank * We received very helpful comments from Chris Meissner and participants at the ESRC-WEFRP/IMF International Macro-Finance Conference (Washington, DC). We are grateful to Francisco Ceballos, Tomislav Ladika, Mercedes Politi, and Aleksandar Zaklan for excellent research assistance. We thank the World Bank Finance Research Program and Research Support Budget for ample financial support. The findings, interpretations, and conclusions expressed in this paper are entirely those of the authors and do not necessarily represent the views of the World Bank. E-mail addresses: [email protected], [email protected], [email protected].

1. Introduction
Financial globalization has reshaped international and corporate finance over the last two
decades. About 30 percent of all capital raised by firms through issuances of stocks and bonds
over the period 1991-2005 occurred in securities markets outside their home countries. Obstfeld
and Taylor (2004) show that a historically unprecedented percentage of the world’s financial
capital now flows across international borders. Furthermore, the amount raised by firms in
foreign markets grew almost four-fold after 1991, approaching one trillion U.S. dollars in 2005.
Yet, basic questions about the internationalization of capital markets remain incompletely
answered. Why do firms sell stocks and bonds in foreign markets? What are the effects of firms
issuing securities in foreign markets on firm performance? What are the cross-firm distributional
effects from international capital raisings? The lack of firm-level information on equity and debt
issuances in both foreign and domestic markets limits our understanding of the causes and effects
of financial globalization at the macro and micro level.
To help address these questions, we provide the first documentation of several salient
firm-level patterns associated with international capital raisings.1 First, we illustrate the
characteristics of firms that raise capital through the issuance of equity and debt abroad and
document how these firms differ from both firms that only raise capital domestically and firms
that do not issue securities locally or internationally. We analyze numerous firm-level
characteristics, including firm size, growth, investment, profitability, capital structure, exports,
and corporate valuation. Second, we show what happens to firms after issuing equity or debt
abroad and compare these patterns to firms that raise capital domestically. Third, we compare
1 In fact, the international finance literature increasingly stresses the desirability of using firm-level evidence to understand the underpinning of financial globalization, which has been studied extensively at the aggregate level. See, for example, Forbes (2006), Kose, Prasad, Rogoff, and Wei (2006), and Henry (2007). Moreover, a separate, though complementary, literature studies firm-level patterns in international trade. For a survey, see Bernard, Jensen, Redding, and Schott (2007).
1
how firms use domestic bond and equity markets before and after they internationalize. Rather
than testing hypotheses or formulating new theories, we contribute to the literature by
documenting new patterns and relating them to existing theories. As a result, our research both
advertises the need for and helps guide the direction of future research.
This paper contributes to a rich literature on the internationalization of capital markets. In
particular, Henderson, Jegadeesh, and Weisbach (2006) analyze aggregate patterns of capital
raising activity around the world and document how internationalization varies across security
types and regions. We extend their work by analyzing the extent of internationalization at the
firm level. This allows us (1) to compare the characteristics of firms that raise equity or debt
internationally with those of firms that only raise equity or debt domestically, (2) to trace the
evolution of firm performance following capital raisings both at home and abroad, and (3) to
analyze changes in the capital raising activities of firms after they internationalize.
Our research also relates to studies of the international cross-listing of stocks. Several
papers analyze the characteristics of firms that list their shares abroad, either through direct
cross-listings or depositary receipts (Pagano, Roell, and Zechner, 2002; Lang, Lins, and Miller,
2003; Lang, Raedy, and Yetman, 2003; and Claessens and Schmukler, 2007). In contrast, we
focus on capital raisings, not on equity market cross-listings. Moreover, while most studies
ignore debt issuances, we analyze both equity and debt markets. Indeed, we find that debt issues
in public markets are a much more important source of capital for firms than equity issues, and
debt markets are far more internationalized than equity markets.
Three broad categories of findings emerge from our analysis. We first summarize the
findings and then relate these patterns to existing theories of international capital raisings.
2
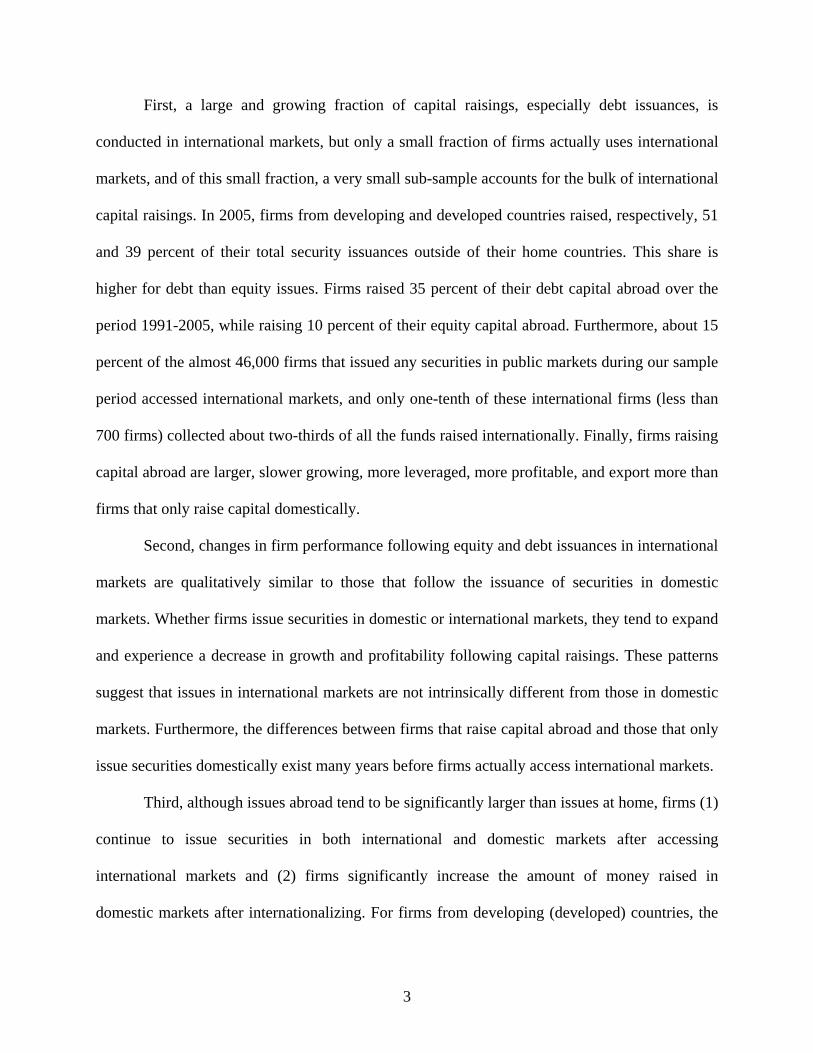
First, a large and growing fraction of capital raisings, especially debt issuances, is
conducted in international markets, but only a small fraction of firms actually uses international
markets, and of this small fraction, a very small sub-sample accounts for the bulk of international
capital raisings. In 2005, firms from developing and developed countries raised, respectively, 51
and 39 percent of their total security issuances outside of their home countries. This share is
higher for debt than equity issues. Firms raised 35 percent of their debt capital abroad over the
period 1991-2005, while raising 10 percent of their equity capital abroad. Furthermore, about 15
percent of the almost 46,000 firms that issued any securities in public markets during our sample
period accessed international markets, and only one-tenth of these international firms (less than
700 firms) collected about two-thirds of all the funds raised internationally. Finally, firms raising
capital abroad are larger, slower growing, more leveraged, more profitable, and export more than
firms that only raise capital domestically.
Second, changes in firm performance following equity and debt issuances in international
markets are qualitatively similar to those that follow the issuance of securities in domestic
markets. Whether firms issue securities in domestic or international markets, they tend to expand
and experience a decrease in growth and profitability following capital raisings. These patterns
suggest that issues in international markets are not intrinsically different from those in domestic
markets. Furthermore, the differences between firms that raise capital abroad and those that only
issue securities domestically exist many years before firms actually access international markets.
Third, although issues abroad tend to be significantly larger than issues at home, firms (1)
continue to issue securities in both international and domestic markets after accessing
international markets and (2) firms significantly increase the amount of money raised in
domestic markets after internationalizing. For firms from developing (developed) countries, the
3

median security issuance of both equity and debt is about 18 (2) times larger in international
markets than in domestic markets. Furthermore, firms do not opt out of domestic markets once
they internationalize. Indeed, after accessing international markets, firms significantly increase
their capital raisings at home, while continuing to use international markets. For example, the
typical developed country firm increases the average annual amount raised in domestic markets
by 200 percent following internationalization, and also captures a larger fraction of the total
domestic market.
Our findings relate to three theories of the causes and effects of international capital
raisings. First, the segmentation view argues that firms internationalize to circumvent
regulations, poor accounting systems, taxes, and illiquid domestic markets that discourage
foreign investors from purchasing their shares (Black, 1974; Solnik, 1974; Stapleton and
Subrahmanyam, 1977; Errunza and Losq, 1985; Alexander, Eun, and Janakiramanan, 1987; and
Domowitz, Glen, and Madhavan, 1998). Thus, firms internationalize to gain access to less
expensive capital (Miller, 1999 and Foerster and Karolyi, 1999). Second, the ‘‘bonding’’ view
argues that firms internationalize to bond themselves to a better corporate governance framework
that limits the extraction of private benefits by corporate insiders (Stulz, 1999; Coffee, 2002;
Reese and Weisbach, 2002; and Doidge, Karolyi, and Stulz, 2004). This makes firms more
attractive to potential investors, reducing their cost of capital, and inducing an enduring
improvement in firm performance. Third, the market timing view suggests that firms raise capital
abroad to exploit temporarily high prices for their securities during ‘‘hot’’ markets (Errunza and
Miller, 2000 and Henderson, Jegadeesh and Weisbach, 2006).
While the patterns we document do not formally reject or confirm existing theories, they
suggest that there are large gaps in the ability of these theories to account for noteworthy features
4

of international capital raisings. For instance, the finding that the evolution of firm characteristics
following international capital raisings are qualitatively similar to those that follow domestic
capital raisings are difficult to reconcile with the bonding view, which argues that capital raisings
in international markets are intrinsically different from capital raisings in domestic markets and
should therefore have qualitatively different effects on firm performance. Similarly, our finding
that firms do not opt out of domestic markets after raising capital abroad, but actually increase
their participation in these capital markets both in absolute and relative terms, does not fit the
predictions of simple segmentation arguments that international markets offer unambiguously
better services and/or less expensive capital than local markets. In terms of market timing, the
argument that hot international markets for firms’ securities are driving the decision to raise
capital abroad does not fully explain why only a very few firms actually raise capital abroad.2
Finally, as we discuss in great depth below, corporate finance theory does not yet fully account
for why firms issue debt and equity in both foreign and domestic markets.
Furthermore, theories of internationalization need to account for two patterns associated
with international capital raisings that are not the focus of existing research. First, debt markets
tend to be more internationalized than equity markets. Second, firms that raise capital abroad are
different from firms that only raise capital at home before they internationalize; these differences
in firm characteristics do not emerge after firms internationalize. In sum, our findings indicate
that current theories have substantive limitations in accounting for the firm-level experiences and
highlight directions for developing more precise theories of the internationalization process and
its implications.
2 DeAngelo, DeAngelo, and Stulz (2007) make a similar argument when analyzing SEOs in the U.S., arguing that many firms do not issue stocks during an open financing window, which is inconsistent with theories that highlight market timing as the driving force for stock issues.
5

Our findings relate to research on lowering the barriers to international capita flows.
Chari and Henry (2004a,b) find that equity market liberalizations reduce the cost of capital and
increase investment, while Patro and Wald (2005) find that firms’ stock returns increase during
stock market liberalizations and that a majority of firms have lower mean returns and lower
dividend yields after liberalization. Schmukler and Vesperoni (2006) find that stock market
integration is associated with a decrease in long-term debt and a shortening of debt maturities for
the average firm in seven emerging economies. In this paper, we do not directly study the effects
of relaxing regulatory barriers to capital flows. Instead, we analyze the changes in firm
performance and capital raising activity associated with security issuances in international capital
markets.3
This paper also identifies patterns relevant for the large corporate finance literature on the
motivations of issuing debt and equity. For instance, Pagano, Panetta, and Zingales (1998)
analyze Italian IPOs and find capital structure rebalancing and mispricing exploitation as
predominant reasons for going public. Loughran and Ritter (1995, 1997) and Baker and Wurgler
(2000, 2002), among others, stress that market timing drives security issuances. On the other
hand, Kim and Weisbach (2006) and DeAngelo, DeAngelo, and Stulz (2007) find that
investment financing is an important motivation for equity issues. We contribute to this literature
by tracing the evolution of firm characteristics, including firm capital structure, investment, and
profitability, after firms issue debt and equity securities in domestic and international markets.
3 There is also considerable research on the portfolio allocation decisions of international investors. Edison and Warnock (2004) find that U.S. investors tend to purchase shares from larger firms, firms with fewer restrictions on foreign ownership, and firms that are cross-listed on U.S. exchanges. Aggarwal, Klapper, and Wysocki (2004) find that actively managed U.S. mutual funds tend to invest more in firms from countries with better legal environments and in firms that increase transparency. Ferreira and Matos (2007) analyze institutional investors’ equity holdings in 27 countries and find that foreign institutions tend to invest on firms that are globally visible, either through higher foreign sales, analyst coverage, or cross-listings abroad. Didier, Schmukler, and Rigobon (2008) find that U.S. mutual funds hold only a small set of countries and companies when investing abroad. In this paper, we do not analyze the portfolio allocation decisions of U.S. or institutional investors, but rather firms’ decision to issue securities abroad.
6
These time-series patterns for a broad array of firms from around the world provide new
evidence regarding the motivation for security issuances. As shown above, we also find that
firms issue debt and equity securities in both domestic and foreign markets following
internationalization, suggesting that future research needs to account for these corporate
financing patterns.
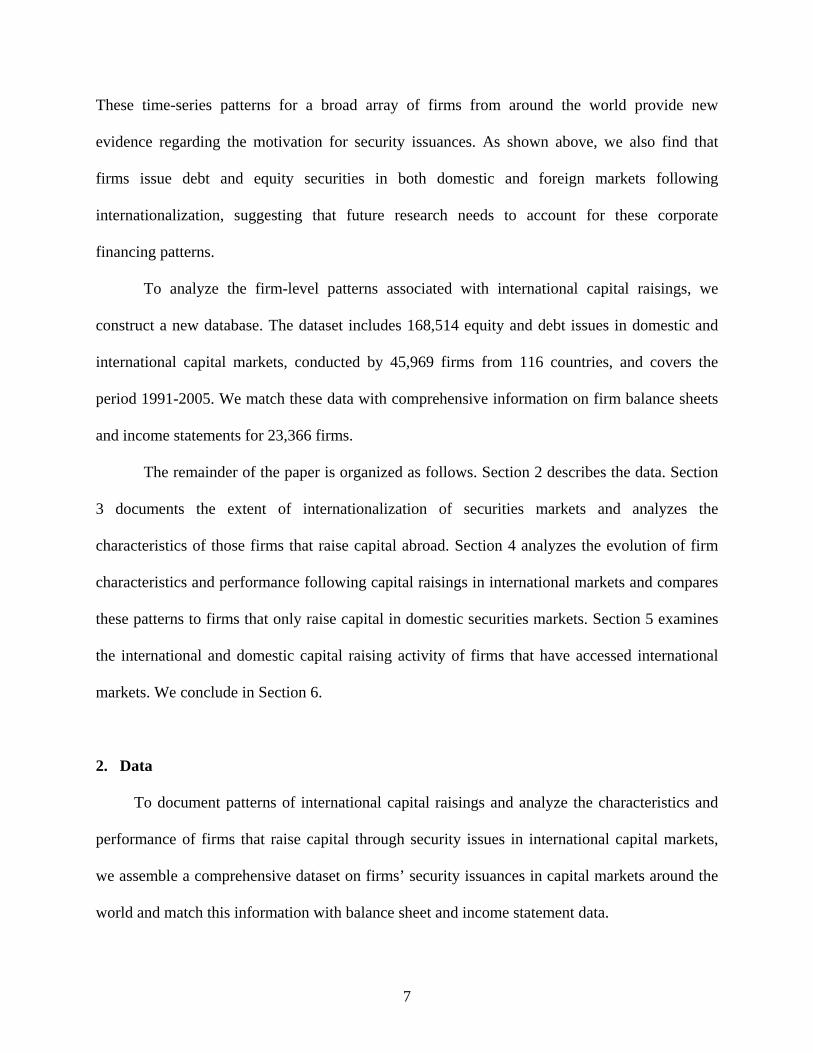
To analyze the firm-level patterns associated with international capital raisings, we
construct a new database. The dataset includes 168,514 equity and debt issues in domestic and
international capital markets, conducted by 45,969 firms from 116 countries, and covers the
period 1991-2005. We match these data with comprehensive information on firm balance sheets
and income statements for 23,366 firms.
The remainder of the paper is organized as follows. Section 2 describes the data. Section
3 documents the extent of internationalization of securities markets and analyzes the
characteristics of those firms that raise capital abroad. Section 4 analyzes the evolution of firm
characteristics and performance following capital raisings in international markets and compares
these patterns to firms that only raise capital in domestic securities markets. Section 5 examines
the international and domestic capital raising activity of firms that have accessed international
markets. We conclude in Section 6.
2. Data
To document patterns of international capital raisings and analyze the characteristics and
performance of firms that raise capital through security issues in international capital markets,
we assemble a comprehensive dataset on firms’ security issuances in capital markets around the
world and match this information with balance sheet and income statement data.
7

Our data on firms’ capital raising activity come from Security Data Corporation’s (SDC)
New Issues Database, which provides transaction-level information on new issues of common
and preferred equity and bonds with an original maturity of more than one year, starting in the
1970s. Given that SDC does not collect data on debt issues with a maturity of less than one year,
our dataset does not include commercial paper issues with such short-term maturities. Moreover,
since we focus on security issues, we do not consider bank lending.
The SDC database is divided into twelve regional sub-databases covering different
markets: Asian Pacific Domestic (Hong Kong, Indonesia, Malaysia, Philippines, Singapore,
Taiwan, and Thailand,); Australian/New Zealand Domestic (Australia, New Zealand, and Papua
New Guinea); Canadian Domestic (Canada); Continental European Domestic (Austria, Belgium,
Bulgaria, Czech Republic, Denmark, Finland, France, Germany, Greece, Hungary, Ireland, Italy,
Luxembourg, Netherlands, Norway, Poland, Portugal, Slovakia, Spain, Sweden, and
Switzerland); Indian and Subcontinent (Bangladesh, India, Pakistan, and Sri Lanka);
International (Eurobonds and other cross-border issues); Japanese Domestic (Japan); Korean
Domestic (South Korea); Latin American Domestic (Argentina, Bolivia, Brazil, Colombia, Costa
Rica, Ecuador, Guatemala, Mexico, Panama, Peru, Uruguay, and Venezuela); United States
(United States); United Kingdom Domestic (United Kingdom); and Rest of the World (countries
not included in other SDC regional sub-databases, such as China). The academic version of SDC
to which we have access does not include the Canadian and Korean Domestic sub-databases.
Therefore, we exclude all Canadian and South Korean firms from our analysis. While data for
public issues in the U.S. start in the 1970s, coverage of other markets starts later, with most
regional databases starting in 1991. Therefore, we restrict our sample to the period 1991-2005.
8
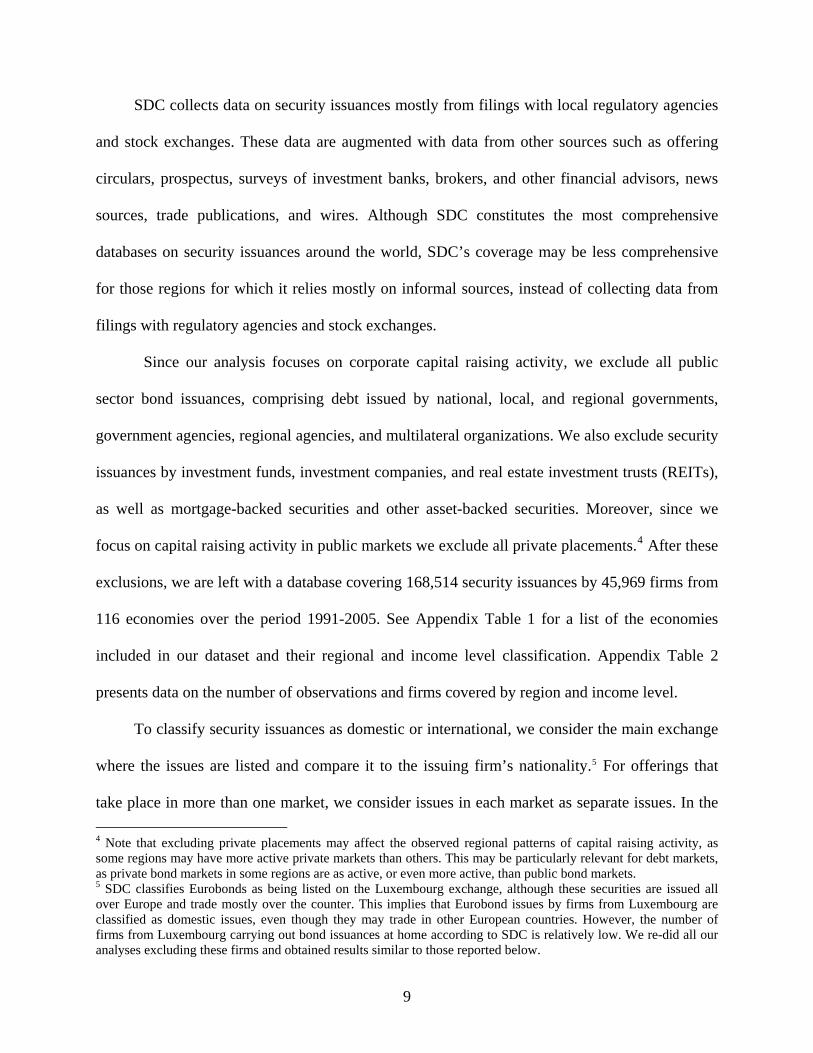
SDC collects data on security issuances mostly from filings with local regulatory agencies
and stock exchanges. These data are augmented with data from other sources such as offering
circulars, prospectus, surveys of investment banks, brokers, and other financial advisors, news
sources, trade publications, and wires. Although SDC constitutes the most comprehensive
databases on security issuances around the world, SDC’s coverage may be less comprehensive
for those regions for which it relies mostly on informal sources, instead of collecting data from
filings with regulatory agencies and stock exchanges.
Since our analysis focuses on corporate capital raising activity, we exclude all public
sector bond issuances, comprising debt issued by national, local, and regional governments,
government agencies, regional agencies, and multilateral organizations. We also exclude security
issuances by investment funds, investment companies, and real estate investment trusts (REITs),
as well as mortgage-backed securities and other asset-backed securities. Moreover, since we
focus on capital raising activity in public markets we exclude all private placements.4 After these
exclusions, we are left with a database covering 168,514 security issuances by 45,969 firms from
116 economies over the period 1991-2005. See Appendix Table 1 for a list of the economies
included in our dataset and their regional and income level classification. Appendix Table 2
presents data on the number of observations and firms covered by region and income level.
To classify security issuances as domestic or international, we consider the main exchange
where the issues are listed and compare it to the issuing firm’s nationality.5 For offerings that
take place in more than one market, we consider issues in each market as separate issues. In the 4 Note that excluding private placements may affect the observed regional patterns of capital raising activity, as some regions may have more active private markets than others. This may be particularly relevant for debt markets, as private bond markets in some regions are as active, or even more active, than public bond markets. 5 SDC classifies Eurobonds as being listed on the Luxembourg exchange, although these securities are issued all over Europe and trade mostly over the counter. This implies that Eurobond issues by firms from Luxembourg are classified as domestic issues, even though they may trade in other European countries. However, the number of firms from Luxembourg carrying out bond issuances at home according to SDC is relatively low. We re-did all our analyses excluding these firms and obtained results similar to those reported below.
9
case of subsidiaries, one could consider the nationality of the firm’s parent company instead of
its own nationality for classifying issues as foreign or domestic. That is, for instance, an equity
issue by a British subsidiary of a U.S. firm in the London Stock Exchange would be classified as
international, instead of domestic as in our classification. Which approach provides a better
criterion for classifying security issues depends on the degree of integration of financing
decisions between firms and their subsidiaries, among other factors. If financial decisions are
highly integrated, considering firms’ parent nationality may provide a more accurate
classification of security issuances. On the other hand, if financing decisions are relatively
decentralized, considering subsidiaries’ own nationality may be a better criterion. All the results
reported in the paper are obtained classifying issues as foreign or domestic based on issuers’
nationality. In unreported robustness tests, we classified issues by subsidiaries based on their
parents’ nationality and obtained results similar to those reported throughout the paper.
To analyze the characteristics and performance of firms that raise capital through security
issues in international capital markets, and compare them to firms that raise capital in domestic
markets and to firms that do not raise capital, we match the data on security issuances from SDC
with firm-level accounting and income statement data from Worldscope.6 After eliminating firms
with missing data, outliers, and firms with less than three annual observations for our variables
of interest, we are left with a sample of 23,366 firms from 58 economies covering the period
1991-2005, totaling 201,543 firm-year observations.7,8 Of these firms, 14,228 issued securities in
6 We exclude U.S. firms from this analysis, given that Worldscope’s coverage of U.S. firms is very limited. Also, note that the U.S. is one of the main markets where foreign firms raise capital. Moreover, as reported below, U.S. firms tend to raise significantly less capital in international markets than firms from other countries. Therefore, excluding U.S. firms is not likely to affect our conclusions on the characteristics and performance of firms that raise capital in international markets. As a robustness test, we included the small sample of U.S. firms with firm-level data available from Worldscope and obtained results similar to those reported below. 7 Appendix Table 3 shows the number of observations and firms classified by their capital raising activity by region and income level.
10
public markets over the sample period according to SDC, while the remaining 9,138 did not raise
capital in public capital markets over this period.9
Throughout the paper we group issues into equity and debt. Equity issues include initial
public offerings (IPOs) and seasoned equity offerings (SEOs). Debt issues include convertible
and non-convertible debt issues and preferred shares issues. Preferred shares have features of
both equity and debt securities and therefore could be classified in either of the two categories.
Given that these issues represent a relatively low percentage of capital raisings, the criterion used
to classify them does not affect the observed patterns of capital raising activity. All the results
reported in the paper classify preferred shares issues as debt issues. As a robustness test, we
classified preferred shares issues as equity issues and obtained results similar to those reported
throughout the paper.
3. Which Firms Raise Capital Abroad?
This section analyzes the extent of internationalization of capital raising activity around the
world and the characteristics of those firms that issue securities in international capital markets.
In particular, we address three questions. First, what is the role of international capital markets
relative to domestic markets in providing firm financing and has this changed over time? Second,
what fraction of domestic firms raises capital in international markets? Third, what are the
characteristics of firms that raise capital abroad, compared to firms that only raise capital
8 Firms from Japan and the U.K. represent about 22 and 12 percent of the observations in our dataset of firm-level characteristics, respectively. This reflects mostly Worldscope’s data coverage. We re-did all our analyses excluding firms from both countries and reached the same conclusions reported below. 9 The number of firms with capital raising activity in our merged dataset is lower than the number of firms included in the SDC dataset because the merged dataset excludes U.S. firms and because several firms that raise capital through security issuances according to SDC do not have accounting data available from Worldscope.
11

domestically and to firms that are listed in their domestic stock markets but do not raise capital
by issuing securities over our sample period?
3.1 Patterns of Global Capital Raising Activity10
As a first step towards analyzing the extent of internationalization of capital markets,
Figure 1 shows the evolution of the aggregate amount of capital raised by firms from developed
and developing economies through security issues in public markets over the period 1991-2005,
differentiating between issues at home and abroad.
Figure 1 shows that the aggregate amount of capital raised in public markets by firms from
developed and developing economies increased significantly over our sample period. The total
amount raised by firms from developed economies increased from 825.5 billion U.S. dollars at
2005 prices in 1991 to more than two trillion U.S. dollars in 2005. The amount of capital raised
in public capital markets by firms from developing economies over this period showed
significant volatility, with large decreases associated with the 1994-1995 Mexican crisis, the
1997-1998 East Asian and Russian crises, and the 2001 Argentine crisis.11 Despite these
setbacks, the total amount raised in capital markets by firms from developing economies
increased more than three-fold over the sample period, from 40.9 billion U.S. dollars at 2005
prices in 1991 to 137.6 billion U.S. dollars in 2005.
Figure 1 also shows that security issuances abroad grew faster than issuances in domestic
markets over the period 1991-2005. This pattern was particularly marked in the case of
developing economies, where the aggregate ratio of the amount of capital raised abroad to total
capital raised increased from 25.3 percent in 1991 to 50.8 percent in 2005. In the case of
10 Henderson, Jeegadesh, and Weisbach (2004) also analyze the aggregate patterns of global capital raising activity and present descriptive evidence similar to that discussed in this section. 11 See, among many others, Sachs, Tornell, and Velasco (1996), Chang and Velasco (1998), and Ortiz (2002) for accounts of the causes and lessons learned from these crises.
12

developed economies, the aggregate share of capital raised abroad increased from 25.3 in 1991 to
39.4 percent in 2005. For both groups of countries, issuances in international capital markets
represent a significant share of the total amount raised by firms in public markets.
Figure 2 indicates that debt markets are more internationalized than equity markets, and
that developing country firms are more intensive users of international markets than firms from
developed economies. Figure 2 presents data on the aggregate share of capital raised abroad for
developing and developed economies for selected years, differentiating between equity and debt
issues. The top panel of Figure 2 shows that equity issues by developing country firms are far
more internationalized than those of firms from developed economies. Also, the degree of
internationalization of equity issues for developing economies has increased over our sample
period. The amount raised through equity issues outside firms’ home country represented 15
percent of the total amount raised through equity issues by developing country firms in 1995, and
this ratio increased to 59.4 percent in 2005. In the case of developed economies, the share of
equity issues abroad has remained relatively stable over this period, standing at nine percent in
1995 and 8.6 percent in 2005.
The bottom panel of Figure 2 shows that debt issues are highly internationalized in both
developed and developing economies. For both groups of countries the amount raised through
corporate debt offerings abroad represented almost half of the total amount raised through
corporate debt issues in 2005, reaching 46.1 percent in the case of developed economies and 43.5
percent for developing economies.
Table 1 further stresses the importance of international securities markets for capital
raisings and the comparatively high degree of internationalization of debt markets relative to
equity markets, while also showing that debt markets are a much larger source of corporate
13
finance than equity markets around the world. Table 1 provides information on the aggregate
amounts raised through security issuances in domestic and international markets over the period
1991-2005 for different regions, differentiating between equity and debt issues. Three main
features of the aggregate patterns of capital raisings are visible from the data.
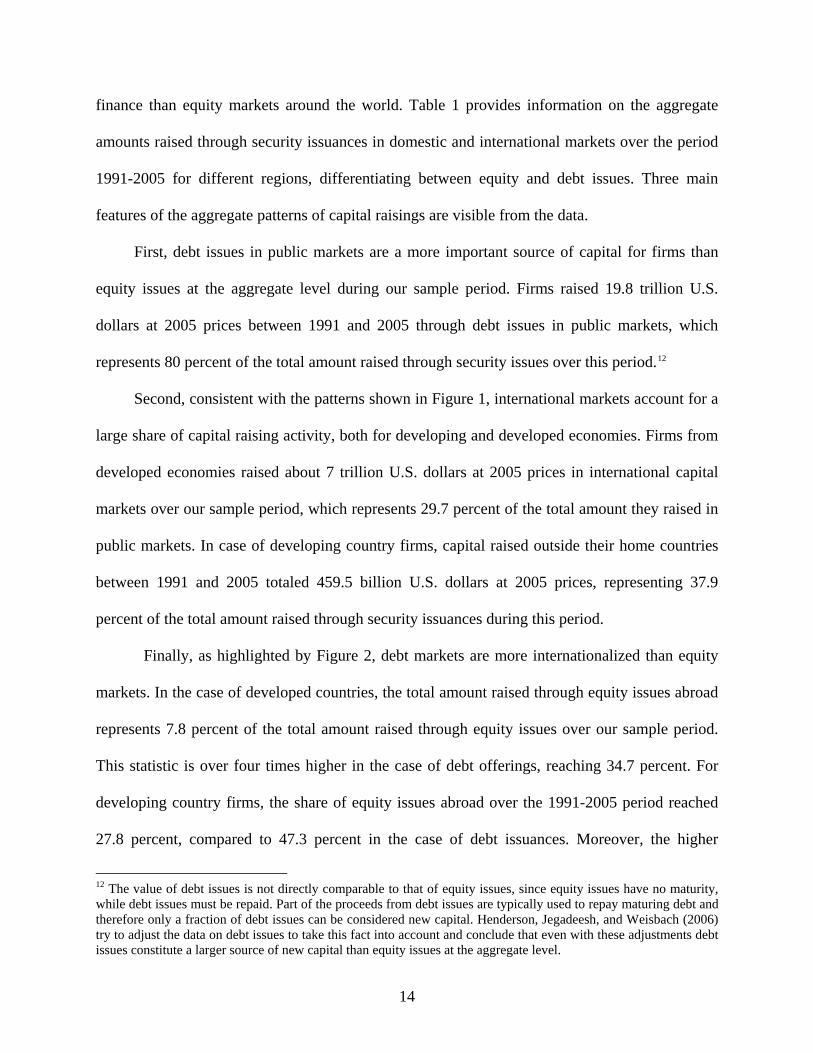
First, debt issues in public markets are a more important source of capital for firms than
equity issues at the aggregate level during our sample period. Firms raised 19.8 trillion U.S.
dollars at 2005 prices between 1991 and 2005 through debt issues in public markets, which
represents 80 percent of the total amount raised through security issues over this period.12
Second, consistent with the patterns shown in Figure 1, international markets account for a
large share of capital raising activity, both for developing and developed economies. Firms from
developed economies raised about 7 trillion U.S. dollars at 2005 prices in international capital
markets over our sample period, which represents 29.7 percent of the total amount they raised in
public markets. In case of developing country firms, capital raised outside their home countries
between 1991 and 2005 totaled 459.5 billion U.S. dollars at 2005 prices, representing 37.9
percent of the total amount raised through security issuances during this period.
Finally, as highlighted by Figure 2, debt markets are more internationalized than equity
markets. In the case of developed countries, the total amount raised through equity issues abroad
represents 7.8 percent of the total amount raised through equity issues over our sample period.
This statistic is over four times higher in the case of debt offerings, reaching 34.7 percent. For
developing country firms, the share of equity issues abroad over the 1991-2005 period reached
27.8 percent, compared to 47.3 percent in the case of debt issuances. Moreover, the higher
12 The value of debt issues is not directly comparable to that of equity issues, since equity issues have no maturity, while debt issues must be repaid. Part of the proceeds from debt issues are typically used to repay maturing debt and therefore only a fraction of debt issues can be considered new capital. Henderson, Jegadeesh, and Weisbach (2006) try to adjust the data on debt issues to take this fact into account and conclude that even with these adjustments debt issues constitute a larger source of new capital than equity issues at the aggregate level.
14

degree of debt market internationalization, compared to equity markets, is a consistent pattern
across all regions shown in Table 1.13, 14
3.2 Firms’ Access to International Markets
Although the aggregate patterns documented in Section 3.1 show that equity and debt
markets are highly internationalized and that the amount of capital raised in international markets
has grown significantly over the last 15 years, these observations do not provide information on
developments at the firm level. To address this issue, this section provides information about
firms’ access to international capital markets.
The results presented in Table 2 show that the proportion of firms that raise capital abroad
is relatively low, suggesting that internationalization is restricted to a small set of firms. Table 2
provides information on the total number of firms that issued securities in domestic and
international markets over the period 1991-2005 for different regions, differentiating between
equity and debt issues. Out of a total of 45,969 firms raising capital in public markets between
1991 and 2005, only 6,661 (14.5 percent) issued securities outside their home market.
Differentiating by type of security issuance, Table 2 shows that a small percentage of those
firms that issue equity tend to do so in international markets. Only 5.2 percent of the firms from
developed economies that raised capital through equity issues did so through offerings outside
their home markets. In the case of developing countries, this statistic reaches 6.3 percent. This
suggests that only a relatively small set of firms may be able to meet the requirements to access
13 Out of 99 economies for which we have data on bond issuances, only in nine (mostly Latin American countries) the internationalization of equity markets is higher than the internationalization of debt markets. 14 One could argue that we may observe a higher share of international debt issues in the aggregate data not due to underlying differences between equity and debt issuances, but rather because those firms that tend to access international markets are also more likely to issue debt securities, both at home and abroad. However, when analyzing only those firms that raise capital outside their home countries we find that the share of capital raised abroad is on average higher for debt than for equity issues. This suggests that debt issuances abroad may be less costly or more beneficial for firms than equity issues in international markets.
15
equity markets outside their home country. This is consistent with the results from Claessens and
Schmukler (2007), who show that the firms that cross-list and raise equity capital abroad
represent a relatively low share of the total number of firms listed in local stock exchanges in
most countries. Moreover, the percentage of firms raising equity abroad is lower than the share
of equity capital raised in international markets reported in Table 1, suggesting that equity issues
in these markets are larger than those in domestic markets.
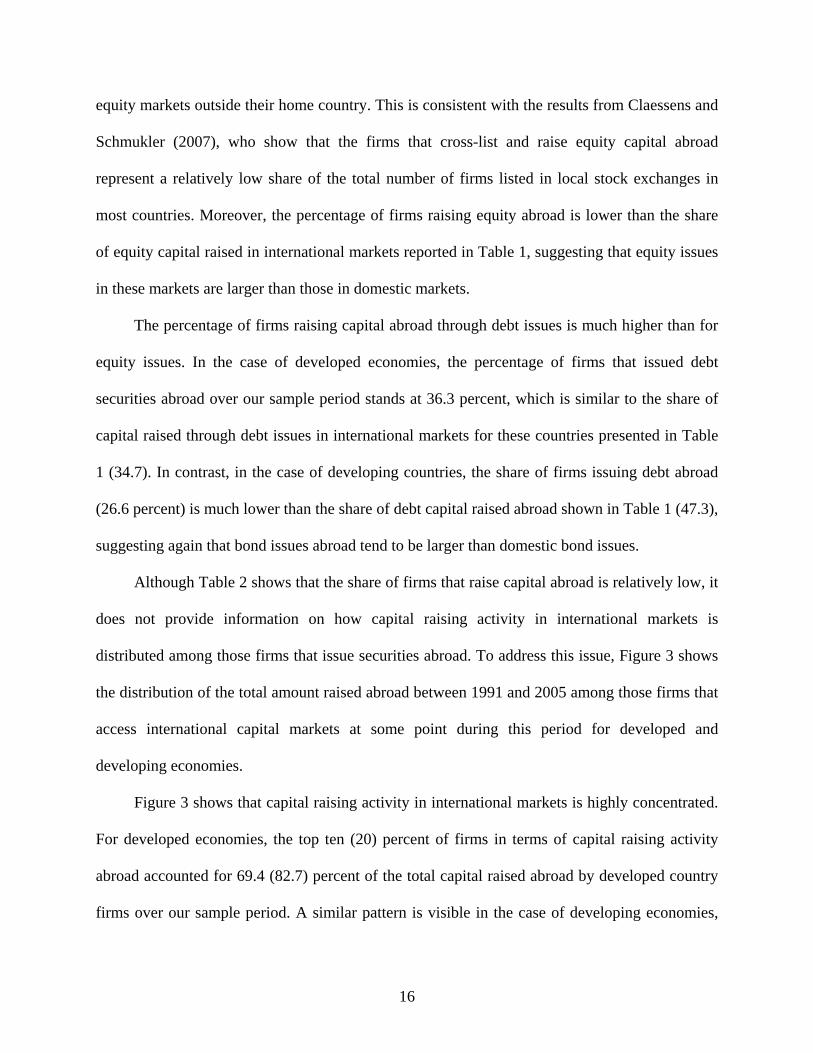
The percentage of firms raising capital abroad through debt issues is much higher than for
equity issues. In the case of developed economies, the percentage of firms that issued debt
securities abroad over our sample period stands at 36.3 percent, which is similar to the share of
capital raised through debt issues in international markets for these countries presented in Table
1 (34.7). In contrast, in the case of developing countries, the share of firms issuing debt abroad
(26.6 percent) is much lower than the share of debt capital raised abroad shown in Table 1 (47.3),
suggesting again that bond issues abroad tend to be larger than domestic bond issues.
Although Table 2 shows that the share of firms that raise capital abroad is relatively low, it
does not provide information on how capital raising activity in international markets is
distributed among those firms that issue securities abroad. To address this issue, Figure 3 shows
the distribution of the total amount raised abroad between 1991 and 2005 among those firms that
access international capital markets at some point during this period for developed and
developing economies.
Figure 3 shows that capital raising activity in international markets is highly concentrated.
For developed economies, the top ten (20) percent of firms in terms of capital raising activity
abroad accounted for 69.4 (82.7) percent of the total capital raised abroad by developed country
firms over our sample period. A similar pattern is visible in the case of developing economies,
16
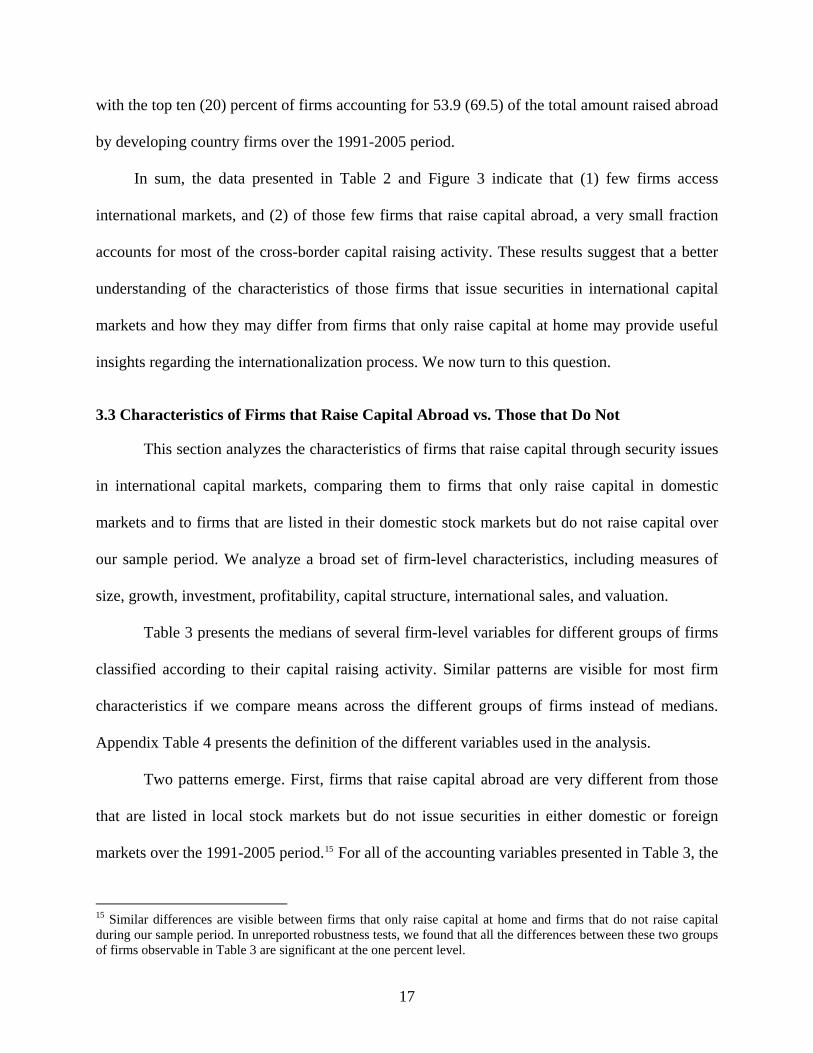
with the top ten (20) percent of firms accounting for 53.9 (69.5) of the total amount raised abroad
by developing country firms over the 1991-2005 period.
In sum, the data presented in Table 2 and Figure 3 indicate that (1) few firms access
international markets, and (2) of those few firms that raise capital abroad, a very small fraction
accounts for most of the cross-border capital raising activity. These results suggest that a better
understanding of the characteristics of those firms that issue securities in international capital
markets and how they may differ from firms that only raise capital at home may provide useful
insights regarding the internationalization process. We now turn to this question.
3.3 Characteristics of Firms that Raise Capital Abroad vs. Those that Do Not
This section analyzes the characteristics of firms that raise capital through security issues
in international capital markets, comparing them to firms that only raise capital in domestic
markets and to firms that are listed in their domestic stock markets but do not raise capital over
our sample period. We analyze a broad set of firm-level characteristics, including measures of
size, growth, investment, profitability, capital structure, international sales, and valuation.
Table 3 presents the medians of several firm-level variables for different groups of firms
classified according to their capital raising activity. Similar patterns are visible for most firm
characteristics if we compare means across the different groups of firms instead of medians.
Appendix Table 4 presents the definition of the different variables used in the analysis.
Two patterns emerge. First, firms that raise capital abroad are very different from those
that are listed in local stock markets but do not issue securities in either domestic or foreign
markets over the 1991-2005 period.15 For all of the accounting variables presented in Table 3, the
15 Similar differences are visible between firms that only raise capital at home and firms that do not raise capital during our sample period. In unreported robustness tests, we found that all the differences between these two groups of firms observable in Table 3 are significant at the one percent level.
17

differences in medians among firms that raise capital abroad and non-capital raising firms are
significant at the one percent level. In particular, firms that raise capital abroad tend to be larger,
grow at a faster pace, and have higher capital expenditures and R&D investments, both in
absolute terms and as a percentage of sales. In terms of profitability, firms that issue securities in
international markets tend to have lower returns on assets, but higher returns on equity. Firms
that raise capital abroad also differ from non-capital raising firms in terms of their capital
structure. They have higher levels of indebtedness and their debt tends to have longer maturity (a
lower ratio of short-term debt to total debt). Also, firms that raise capital abroad tend to conduct
a higher percentage of their business activities (sales) abroad and have higher valuations (as
measured by Tobin’s q).
Second, Table 3 indicates that there are significant differences between firms that raise
capital at home and abroad. Firms that raise capital abroad are significantly larger than firms that
only raise capital at home, with the difference in median assets between both sets of firms
reaching 1.4 billion U.S. dollars. Firms that raise capital abroad also tend to grow slower than
firms that only raise capital in domestic markets. In terms of their investment, firms that raise
capital in international markets show higher capital expenditures and R&D investments, both in
absolute terms and as a percentage of sales. Firms that raise capital abroad also show higher
levels of indebtedness and exhibit longer debt maturities. In terms of valuation, firms that raise
capital outside their home countries have lower Tobin’s q than firms that only raise capital at
home. Finally, firms that raise capital abroad conduct a larger percentage of their business
outside their home country, as measured by the ratio of foreign sales to total sales.16
16 Similar results are obtained if we use the ratio of foreign assets to total assets as a measure of international activity.
18

4. What Happens to Firms after Raising Capital Abroad?
This section analyzes the evolution of the characteristics and performance of firms that
raise capital through debt and equity issuances. First, we compare the characteristics of firms that
raise capital abroad relative to firms that only raise capital in domestic markets, making these
comparisons before and after firms first access international markets. Second, we provide a
detailed dynamic analysis. We trace the performance of firms over time after capital raisings,
differentiating between equity and debt issues and capital raisings at home and abroad. These
analyses allow us to better understand how raising capital abroad affects firms and whether these
effects differ from those of domestic capital raisings.
These analyses also allow us to enhance the findings in Table 3, which show that there
are significant differences between firms that raise capital abroad and firms that only raise capital
at home. By tracing firms through time, we are able to test whether firms differ before they raise
capital abroad or whether the cross-firm differences we observe in Table 3 materialize after
internationalization.
4.1 Changes in Firm-Level Variables after Raising Capital Abroad
Tables 4 and 5 present regressions of the firm-level characteristics analyzed in Table 3 on
dummies that identify firms’ activity in international capital markets for SEOs and debt issues,
respectively. These regressions include both those firms that conduct the specific type of capital
raising under analysis in each case and a control group. In the case of SEOs abroad, the control
group includes those firms that conducted SEOs in their home markets. Similarly, in the case of
debt issues abroad, the control group includes those firms that issued debt securities at home.17
17 Similar results are obtained if we use as a control group firms that conducted any type of capital raising at home or if we use as control group both firms that raised capital at home and firms that were listed in their domestic stock markets but did not raise capital over our sample period.
19
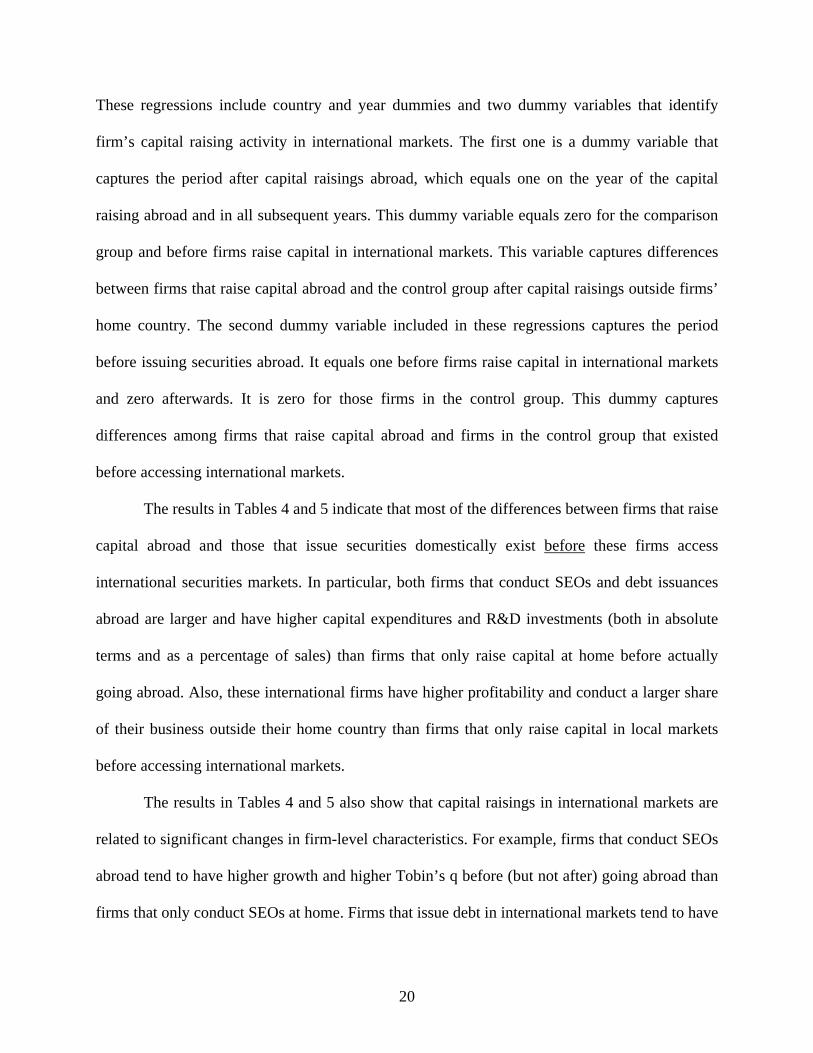
These regressions include country and year dummies and two dummy variables that identify
firm’s capital raising activity in international markets. The first one is a dummy variable that
captures the period after capital raisings abroad, which equals one on the year of the capital
raising abroad and in all subsequent years. This dummy variable equals zero for the comparison
group and before firms raise capital in international markets. This variable captures differences
between firms that raise capital abroad and the control group after capital raisings outside firms’
home country. The second dummy variable included in these regressions captures the period
before issuing securities abroad. It equals one before firms raise capital in international markets
and zero afterwards. It is zero for those firms in the control group. This dummy captures
differences among firms that raise capital abroad and firms in the control group that existed
before accessing international markets.
The results in Tables 4 and 5 indicate that most of the differences between firms that raise
capital abroad and those that issue securities domestically exist before these firms access
international securities markets. In particular, both firms that conduct SEOs and debt issuances
abroad are larger and have higher capital expenditures and R&D investments (both in absolute
terms and as a percentage of sales) than firms that only raise capital at home before actually
going abroad. Also, these international firms have higher profitability and conduct a larger share
of their business outside their home country than firms that only raise capital in local markets
before accessing international markets.
The results in Tables 4 and 5 also show that capital raisings in international markets are
related to significant changes in firm-level characteristics. For example, firms that conduct SEOs
abroad tend to have higher growth and higher Tobin’s q before (but not after) going abroad than
firms that only conduct SEOs at home. Firms that issue debt in international markets tend to have
20
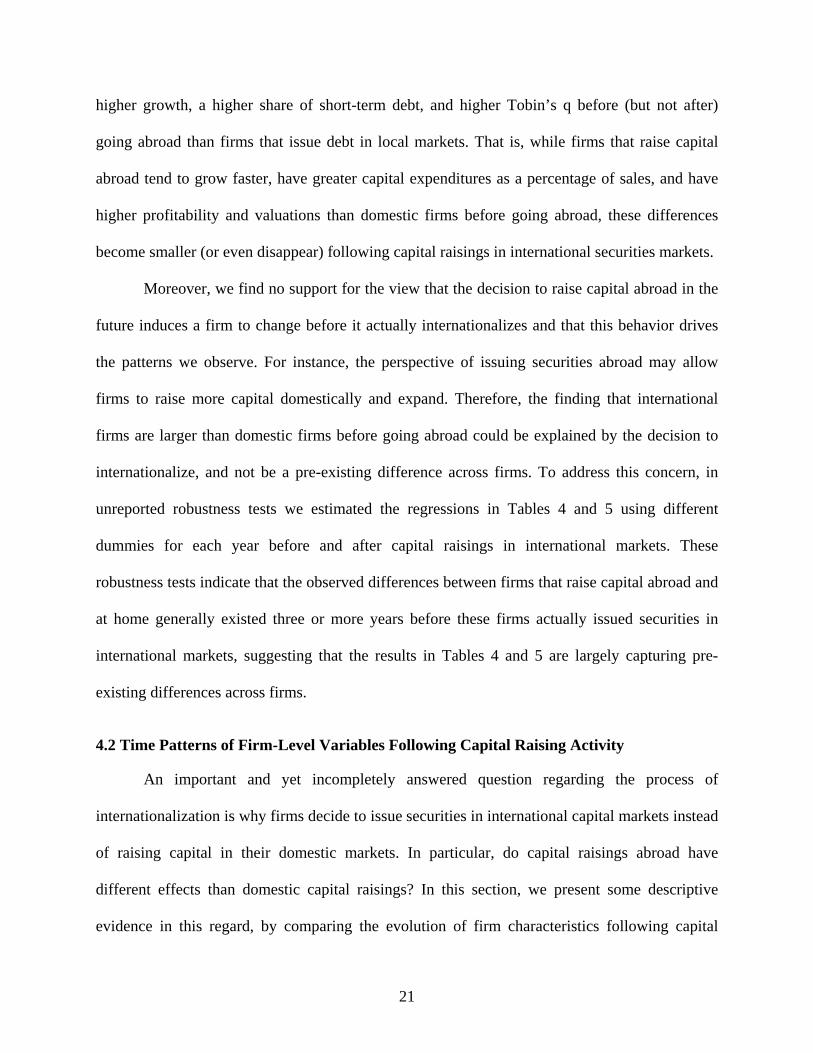
higher growth, a higher share of short-term debt, and higher Tobin’s q before (but not after)
going abroad than firms that issue debt in local markets. That is, while firms that raise capital
abroad tend to grow faster, have greater capital expenditures as a percentage of sales, and have
higher profitability and valuations than domestic firms before going abroad, these differences
become smaller (or even disappear) following capital raisings in international securities markets.
Moreover, we find no support for the view that the decision to raise capital abroad in the
future induces a firm to change before it actually internationalizes and that this behavior drives
the patterns we observe. For instance, the perspective of issuing securities abroad may allow
firms to raise more capital domestically and expand. Therefore, the finding that international
firms are larger than domestic firms before going abroad could be explained by the decision to
internationalize, and not be a pre-existing difference across firms. To address this concern, in
unreported robustness tests we estimated the regressions in Tables 4 and 5 using different
dummies for each year before and after capital raisings in international markets. These
robustness tests indicate that the observed differences between firms that raise capital abroad and
at home generally existed three or more years before these firms actually issued securities in
international markets, suggesting that the results in Tables 4 and 5 are largely capturing pre-
existing differences across firms.
4.2 Time Patterns of Firm-Level Variables Following Capital Raising Activity
An important and yet incompletely answered question regarding the process of
internationalization is why firms decide to issue securities in international capital markets instead
of raising capital in their domestic markets. In particular, do capital raisings abroad have
different effects than domestic capital raisings? In this section, we present some descriptive
evidence in this regard, by comparing the evolution of firm characteristics following capital
21

raisings at home and abroad. Note, however, that we do not attempt to deal formally with
identifying the exogenous effects of international capital raisings on firm performance.
Therefore, the patterns presented in this section are a first step towards addressing this question.
Tables 6 and 7 analyze the time-series patterns of firm-level variables following SEOs
and debts issuances, respectively. Specifically, these tables present regressions of firm
characteristics on a series of dummy variables that trace out annual patterns after capital raisings.
The variable “SEO at home year dummy,” for instance, equals one on the year that a firm
conducts a SEO in its domestic market, and zero otherwise. Similarly the “More than three years
after SEO at home dummy” equals one more than three years after a firm conducts a SEO at
home, and zero afterwards. We construct corresponding dummy variables for the years following
each type of capital raising. The sample in these regressions includes only the firms that conduct
the specific capital raising under analysis in each case. These regressions include year dummies
and firm-level fixed effects. By using firm-level fixed effects, we compare each firm to itself
before raising capital.
The regression results in Tables 6 and 7 indicate that the time-series patterns of firm-level
variables are broadly similar for issues at home and abroad. In the case of SEOs, Table 6 shows
that firms expand following both SEOs at home and abroad. Also, firms tend to experience a
long-term decrease in growth and profitability following SEOs. Loughran and Ritter (1997) also
find evidence of a decrease in profitability following domestic SEOs by U.S. firms. They
interpret this evidence as consistent with market timing arguments that emphasize that firms
raise capital after periods of high performance, which may make their securities more attractive
to investors. The observed decrease in profitability could also be the result of earnings
management, as insiders may have incentives to window-dress company accounts before raising
22

capital (Teoh, Welch, and Wong, 1998 and Rangan, 1998).18 In terms of investment, although
the absolute size of capital expenditures and R&D investments increases, when scaling
expenditures by sales and assets the results show that investment does not increase permanently
(and even tends to decrease) following SEOs both at home and abroad. The results also indicate
that firm valuation, as measured by Tobin’s q, decreases permanently following SEOs.
In the case of debt issuances, Table 7 shows that the time patterns of firm-level variables
are broadly similar for issues at home and abroad. Firms tend to expand following debt issues
and experience a long-term decrease in profitability and growth. Debt issues, both at home and
abroad, are associated with temporary increases in investments. Also, debt issues are associated
with increases in indebtedness levels, improvements in debt maturity profiles, and decreases in
Tobin’s q. As mentioned above, the finding that the changes in firm performance that follow
equity and debt issuances in international markets are broadly similar to those that follow equity
and debt issuances at home suggests that issues in international markets are not intrinsically
different from issues in the domestic market.
Furthermore, the patterns presented in Tables 6 and 7 are not affected by other capital
raisings coinciding with the timing of the specific issuances analyzed in the tables. For instance,
if following capital raisings abroad firms also issue securities at home, then the observed patterns
of firm performance may be partially reflecting the effects of these subsequent domestic capital
raisings. To address this concern, we re-estimated all the regressions from Tables 6 and 7
including only capital raisings that took place without other concurrent security issuances.
Specifically, we considered only those capital raisings in which firms did not carry out other
18 Inflated expectations by investors and earnings management that leads investors to overestimate the earnings potential of issuing firms are not the only possible reason for poor post-issue operating performance. Jensen and Meckling (1976) argue that the interests of managers and other stockholders become less closely aligned as managers’ stakes decline and ownership becomes more disperse. These increased agency problems may result in worse post-issue performance.
23

security issuances in a five-year window around the capital raising under analysis. The results
obtained using this reduced sample of capital raisings are qualitatively similar to those reported
in Tables 6 and 7: Firms tend to expand and experience a decrease in growth and profitability
following capital raisings. Moreover, the time-series patterns of firm-level variables are broadly
similar for issues at home and abroad.
5. The Capital Raising Activity of Firms that Raise Capital Abroad
This section addresses three broad questions about internationalization: Are issues in
international markets different from domestic issues in terms of their size? How do firms that
raise capital abroad distribute their capital raising activity among domestic and international
markets? After firms raise capital abroad, does their use of domestic capital markets change and
if so, how?
5.1 Size Differences between Issues at Home and Abroad
Although the aggregate evidence presented in Tables 1 and 2 suggests that issues in
international markets are larger than domestic issues, we now provide more direct evidence in
this regard by analyzing the distribution of the amount raised per issue for issues at home and
abroad and comparing median issue sizes across markets. Figure 4 shows the cumulative
distribution of the amount raised per issue by firms from developed and developing economies,
differentiating between issues at home and abroad.
Figure 4 illustrates that issues at home tend to be smaller than issues abroad. In the case of
developed country firms, for instance, while 63 percent of issues at home during our sample
period raised 100 million U.S. dollars at 2005 prices or less, only 39.6 percent of issues abroad
were below this size threshold. In the case of firms from developing economies, more than 91
24
percent of issues at home during our sample period raised 100 million U.S. dollars at 2005 prices
or less. In the case of issues abroad, only 49.5 percent of issues by developing country firms
were below this size threshold. To analyze the size differences among issues abroad and at home
in more detail, Table 8 compares the median proceeds of issues in domestic and international
markets for firms from developed and developing economies, differentiating between equity and
debt issues. Similar results are obtained when analyzing differences across means instead of
medians.
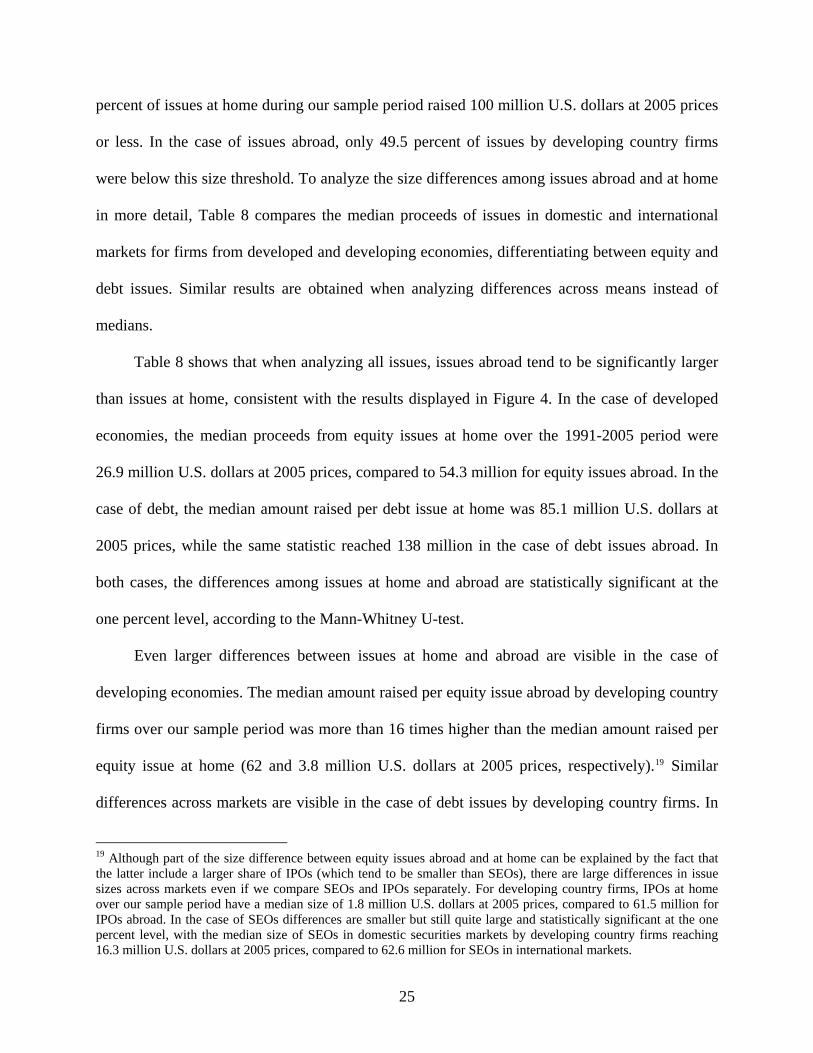
Table 8 shows that when analyzing all issues, issues abroad tend to be significantly larger
than issues at home, consistent with the results displayed in Figure 4. In the case of developed
economies, the median proceeds from equity issues at home over the 1991-2005 period were
26.9 million U.S. dollars at 2005 prices, compared to 54.3 million for equity issues abroad. In the
case of debt, the median amount raised per debt issue at home was 85.1 million U.S. dollars at
2005 prices, while the same statistic reached 138 million in the case of debt issues abroad. In
both cases, the differences among issues at home and abroad are statistically significant at the
one percent level, according to the Mann-Whitney U-test.
Even larger differences between issues at home and abroad are visible in the case of
developing economies. The median amount raised per equity issue abroad by developing country
firms over our sample period was more than 16 times higher than the median amount raised per
equity issue at home (62 and 3.8 million U.S. dollars at 2005 prices, respectively).19 Similar
differences across markets are visible in the case of debt issues by developing country firms. In
19 Although part of the size difference between equity issues abroad and at home can be explained by the fact that the latter include a larger share of IPOs (which tend to be smaller than SEOs), there are large differences in issue sizes across markets even if we compare SEOs and IPOs separately. For developing country firms, IPOs at home over our sample period have a median size of 1.8 million U.S. dollars at 2005 prices, compared to 61.5 million for IPOs abroad. In the case of SEOs differences are smaller but still quite large and statistically significant at the one percent level, with the median size of SEOs in domestic securities markets by developing country firms reaching 16.3 million U.S. dollars at 2005 prices, compared to 62.6 million for SEOs in international markets.
25

both cases, the differences among issues at home and abroad are statistically significant at the
one percent level.
The bigger size of capital raisings in international markets could be explained by the fact
that firms that raise capital abroad are much larger than firms that only raise capital at home, as
shown in Table 3. Therefore, the size difference between issues at home and abroad may be just
capturing differences in firm size and not any relevant difference among cross-border and
domestic issues.
To address this issue, Table 8 shows the median amount raised per issue in domestic and
international markets, restricting the sample only to issues by firms that raise capital both at
home and abroad at some point during our sample period.20 The results from Table 8 show that
in the case of developed economies, the median amount raised per equity issue at home over the
1991-2005 period by firms that raise capital both at home and abroad was 126.5 million U.S.
dollars at 2005 prices, compared to 116.2 million for equity issues abroad, although the
difference is not statistically significant. In the case of debt issues, the median amount raised per
issue at home by these firms was 105.9 million U.S. dollars at 2005 prices, while the same
statistic reached 155.8 million in the case of debt issues abroad, with the difference being
statistically significant at the one percent level. In the case of developing economies, Table 8
shows that both equity and debt issues abroad are larger than issues at home when analyzing only
issues by firms that raise capital both at home and abroad.
20 In the results reported in Table 8, issues at home by firms that raise capital both at home and abroad include issues carried out by these firms before their first capital raising abroad. There could be some concerns that these issues may not be directly comparable to issues abroad by these firms, as firms may expand and experience other relevant changes after accessing international markets that might affect the size of their security issues, both at home and abroad. As a robustness test, we restricted the sample of domestic issues by these firms only to issues carried out after their first capital raising in international markets and obtained similar results to those reported in Table 8.
26
In sum, the results indicate that even if we restrict the sample to issues by firms that raise
capital both at home and abroad, issues abroad tend to be larger than domestic issues in most
cases. This is consistent with the idea that firms tend to raise larger amounts when issuing
securities in international markets. The differences are smaller, however, when disaggregating
the data and examining firms that issue securities in both markets.21
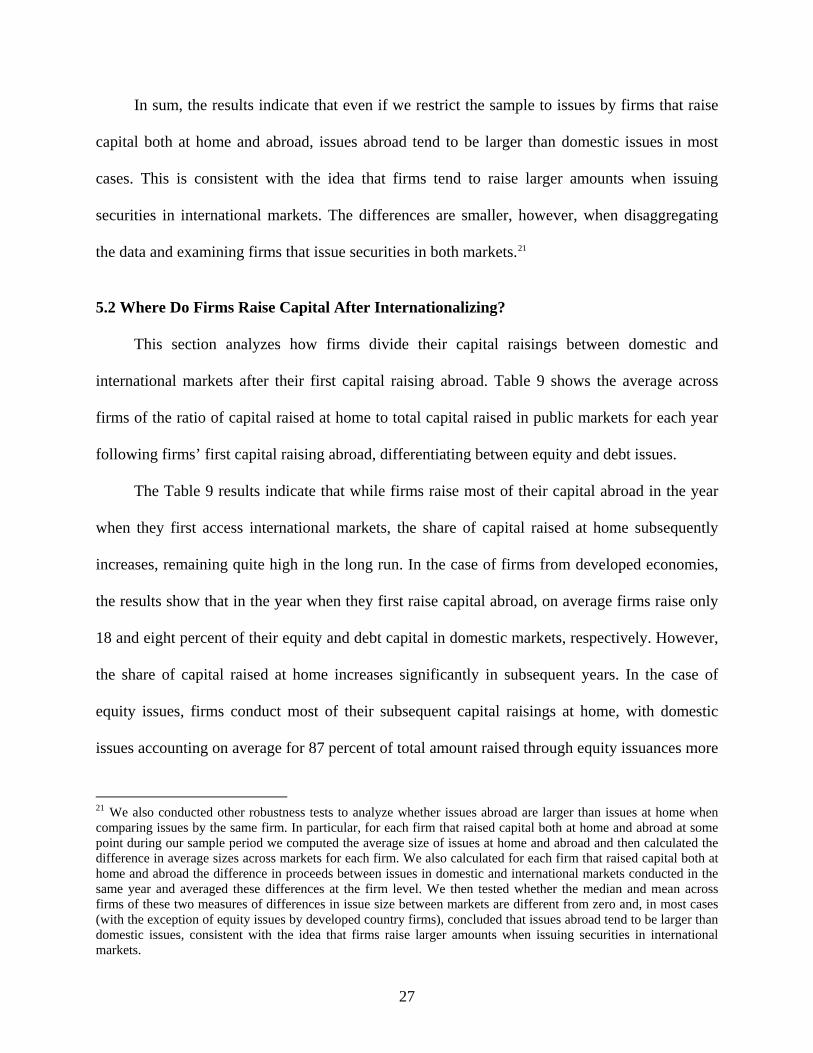
5.2 Where Do Firms Raise Capital After Internationalizing?
This section analyzes how firms divide their capital raisings between domestic and
international markets after their first capital raising abroad. Table 9 shows the average across
firms of the ratio of capital raised at home to total capital raised in public markets for each year
following firms’ first capital raising abroad, differentiating between equity and debt issues.
The Table 9 results indicate that while firms raise most of their capital abroad in the year
when they first access international markets, the share of capital raised at home subsequently
increases, remaining quite high in the long run. In the case of firms from developed economies,
the results show that in the year when they first raise capital abroad, on average firms raise only
18 and eight percent of their equity and debt capital in domestic markets, respectively. However,
the share of capital raised at home increases significantly in subsequent years. In the case of
equity issues, firms conduct most of their subsequent capital raisings at home, with domestic
issues accounting on average for 87 percent of total amount raised through equity issuances more
21 We also conducted other robustness tests to analyze whether issues abroad are larger than issues at home when comparing issues by the same firm. In particular, for each firm that raised capital both at home and abroad at some point during our sample period we computed the average size of issues at home and abroad and then calculated the difference in average sizes across markets for each firm. We also calculated for each firm that raised capital both at home and abroad the difference in proceeds between issues in domestic and international markets conducted in the same year and averaged these differences at the firm level. We then tested whether the median and mean across firms of these two measures of differences in issue size between markets are different from zero and, in most cases (with the exception of equity issues by developed country firms), concluded that issues abroad tend to be larger than domestic issues, consistent with the idea that firms raise larger amounts when issuing securities in international markets.
27
than three years after firms first access international markets. In the case of debt issues, firms that
internationalize tend to conduct most of their issuances in international markets, but domestic
markets remain significant, accounting on average for 40 percent of the total amount raised by
these firms through debt issues more than three years after internationalizing. Similar patterns are
visible in the case of developing economies. Firms from developing economies that access
international markets tend to raise most of their capital at home in the long run, with average
ratio of capital raised at home to total capital raised in public markets reaching 60 (63) percent
for equity (debt) issues more than three years after firms first raise capital abroad.
The results from Table 9 indicate that firms that access international capital markets
remain active in domestic markets, conducting a significant share of their capital raisings in
domestic markets. This suggests that these firms are not just opting out of domestic markets, but
rather that they are choosing to use both domestic and international markets. This is consistent
with the idea that these markets may provide different services and firms will access one or the
other depending on their particular financing needs.
5.3 Changes in Capital Raising Activity in Domestic Markets after Raising Capital Abroad
Having shown that firms continue using domestic capital markets quite actively after they
access international markets, we now test whether firms change their use of domestic markets
after raising capital abroad. Table 10 compares the average amount raised per year by firms that
raise capital abroad before and after these firms first access international markets, differentiating
between equity and debt issues.
Table 10 shows that there is an increase in the amount of capital raised in domestic markets
per year after a firm first raises capital abroad. In the case of developed economies, the amount
raised at home per year through equity issues by these firms averages 7.7 million U.S. dollars at
28

2005 prices before raising capital abroad and increases to 20.5 million afterwards. A similar
pattern is visible for debt issues, with the average amount raised per year by firms that issue
securities abroad increasing from 36.8 million U.S. dollars at 2005 prices to 129.8 million
following internationalization. In both cases the differences are significant at the one percent
level.
Similar results are obtained in the case of firms from developing economies. For equity
issues, the average amount raised per year by firms that raise capital abroad increases from 3.2
million U.S. dollars at 2005 prices to 5.6 million following internationalization. Similarly, the
average amount raised at home per year through debt issuances by these firms increases more
than four-fold after firms’ first capital raising abroad, from 1.6 million U.S. dollars at 2005
prices to 6.9 million.
While these results indicate that firms tend to raise more capital in their domestic markets
after accessing international markets, this does not necessarily imply that firms increase their
relative participation in domestic capital raising activity after they internationalize. In other
words, do firms capture a larger share of total domestic market activity following security
issuances in international markets?
The results from Table 10 show that firms are indeed capturing a larger percentage of total
domestic market capital raising activity following their first capital raising abroad. In the case of
developed economies, firms that raise capital abroad raise on average 0.1 percent of the total
capital raised in their domestic markets per year before internationalization and this share
increases to 0.3 percent afterwards. A similar pattern is visible in the case of developing
economies, with the average share of domestic market activity accounted by each firm that raises
29

capital in international markets increasing from 0.3 percent to 0.5 percent following the first
capital raising abroad.
The observed increases in the absolute and relative participation of international firms in
domestic markets following their first capital raising abroad coincide with an increase in firm
size. As discussed above, firms tend to expand following capital raisings in international
markets. The results in Table 10 suggest that the corresponding expansion in financing needs is
at least partially satisfied by domestic markets. Once we scale the amount raised at home by the
firm’s assets, we do not find evidence of a significant change in firms’ capital raisings at home.
6. Conclusions
In this paper, we characterize patterns of equity and debt issuance activities in domestic
and international capital markets, and also document the dynamics of firm performance
following these distinct corporate financing activities. To do so, we compile a new database on
worldwide capital raisings that allows us to compare firms that issue securities abroad with firms
that issue securities domestically. We also compare these capital raising firms with corporations
that are listed in the local stock markets but do not issue new securities over our sample period.
This provides new firm-level information about the patterns of international capital raisings.
Several findings relate to existing theories of international finance and motive future
research. First, debt markets dwarf equity markets both in terms of how corporations raise capital
and in terms of the internationalization of securities markets. Over the period 1991-2005,
corporations raised almost five times more money through bond sales relative to equity issues.
Moreover, bonds markets are more internationalized. About 35 percent of all debt issues occur in
markets other than the firm’s home market, while the corresponding figure for equity issues is 10
30
percent. Since most empirical studies of financial globalization ignore debt markets and since
major theories, such as market segmentation, bonding, and market timing, focus on the cross-
listing of equities and the integration of equity markets, our findings (1) suggest that financial
markets are more internationalized than suggested by only considering equity markets and (2)
advertise the need for additional work on the internationalization of debt markets.
Second, while firms grow and invest more after raising debt or equity abroad, they (1) do
not become more profitable or experience an increase in Tobin’s q and (2) these changes in firm
performance are qualitatively similar to the changes that firms experience when they issue debt
or equity domestically. These findings first suggest firms get bigger, but not necessarily “better”
following internationalization. Second, capital raisings abroad are not intrinsically different from
capital raisings at home. While capital raisings abroad are bigger, the changes in firm
performance following debt and equity issuance in international markets are broadly similar to
those in domestic markets. These findings are difficult to reconcile with arguments that firms
access international markets to bond themselves to a better corporate governance system because
internationalization does not spark enduring improvements in corporate performance that differ
from the dynamic patterns ignited by domestic issuances. This is consistent with the findings in
Gozzi, Levine, and Schmukler (2008).
Third, firms continue to use domestic debt and equity markets after they raise capital
abroad and indeed significantly expand their use of domestic securities markets. Thus, after firms
internationalize, they issue debt and equity securities in both the domestic and foreign markets,
using foreign markets for relatively large issuances. These observations are difficult to reconcile
with the view that international markets provide less expensive capital, but there are high fixed
costs associated with initially accessing these markets. Furthermore, these patterns complicate
31

the study of corporate finance since firms participate in multiple debt and equity markets
simultaneously, which is not the focus of research on the determinants of corporate financing
choices. Along these lines, future research may assess differences in the costs of raising capital
through different instruments in different markets as Ljungqvist, Jenkinson, and Wilhem (2003)
and Torstila (2001, 2003) have done for IPOs around the world.
Finally, very few firms use international markets, and of the few that access international
debt or equity markets, a very small number raises most of the capital garnered through the sale
of securities in international markets. As emphasized by Levine and Schmukler (2006, 2007),
this suggests that financial internationalization could have cross-firm distributional effects that
affect the firms that rely solely on local markets. Firms that access international markets both
grow relative to other corporations in the local market and raise a higher percentage of the total
capital raised in domestic markets. Future research could assess whether these changes affect the
ability of smaller firms to obtain financing for growth.
32

References Alexander, G. J., C. S. Eun, and S. Janakiramanan, 1987. Asset Pricing and Dual Listing on
Foreign Capital Markets: A Note. Journal of Finance 42, pp. 151–158.
Aggarwal, R., L. Klapper, and P. D. Wysocki, 2005. Portfolio Preferences of Foreign Institutional Investors. Journal of Banking and Finance 29, pp. 2919-2946.
Baker, M., and J. Wurgler, 2000. The Equity Share in New Issues and Aggregate Stock Returns. Journal of Finance 55, pp. 2219-2257.
Baker, M., and J. Wurgler, 2002. Market Timing and Capital Structure. Journal of Finance 57, pp. 1-32.
Bernard, A., J. B. Jensen, S. Redding, and P. Schott, 2007. Firms in International Trade. Journal of Economic Perspectives 21, pp. 105-130.
Black, F., 1974. International Capital Market Equilibrium with Investment Barriers. Journal of Financial Economics 1, pp. 337–352.
Chang, R., and A. Velasco, 1998. Financial Crises in Emerging Markets. NBER Working Paper No. 6606.
Chari, A. and P. B. Henry, 2004a. Is the Invisible Hand Discerning or Indiscriminate? Investment and Stock Prices in the Aftermath of Capital Account Liberalizations. NBER Working Paper No. 10318.
Chari, A. and P. B. Henry, 2004b. Risk Sharing and Asset Prices: Evidence from a Natural Experiment. The Journal of Finance 59, pp. 1295–1324.
Claessens, S. and S. L. Schmukler, 2007. International Financial Integration through Equity Markets: Which Firms from Which Countries Go Global? Journal of International Money and Finance 26, pp. 788-813.
Coffee, J. C. Jr, 2002. Racing Towards the Top? The Impact of Cross-Listings and Stock Market Competition on International Corporate Governance. Columbia Law Review 102, pp. 1757-1831.
DeAngelo, H., L. DeAngelo, and R. M. Stulz, 2007. Fundamentals, Market Timing, and Seasoned Equity Offerings. NBER Working Paper No. 13285.
Didier, T., R. Rigobon, and S. Schmukler, 2008. Unexploited Gains from International Diversification? Mimeo MIT.
Doidge, C., G. A. Karolyi, and R. M. Stulz, 2004. Why Are Firms That List in the U.S. Worth More? Journal of Financial Economics 71, pp. 205–238.
33

Domowitz, I., J. Glen, and A. Madhavan, 1998. International Cross-Listing and Order Flow Migration: Evidence from an Emerging Market. Journal of Finance 53, pp. 2001-2027.
Edison, H., and F. Warnock, 2004. U.S. Investors’ Emerging Market Equity Portfolios: A Security-Level Analysis. Review of Economics and Statistics 86, pp. 691-708.
Errunza, V. and E. Losq, 1985. International Asset Pricing under Mild Segmentation: Theory and Test. Journal of Finance 40, pp. 105–124.
Errunza, V. and D. P. Miller, 2000. Market Segmentation and the Cost of Capital in International Equity Markets. Journal of Financial and Quantitative Analysis 35, pp. 577–600.
Ferreira, M. A., and P. Matos, 2007. The Colors of Investors’ Money: The Role of Institutional Investors Around the World. Journal of Financial Economics, forthcoming.
Foerster, S. R. and G. A. Karolyi, 1999. The Effects of Market Segmentation and Investor Recognition on Asset Prices: Evidence from Foreign Stocks Listing in the United States. Journal of Finance 54, pp. 981–1013.
Forbes, K., 2006. The Microeconomic Evidence on Capital Controls: No Free Lunch in Capital Controls and Capital Flows. In Emerging Economies: Policies, Practices, and Consequences, Sebastian Edwards (ed.), University of Chicago Press.
Gozzi, J.C., R. Levine, and S. L. Schmukler, 2008. Internationalization and the Evolution of Corporate Valuation. Journal of Financial Economics, forthcoming.
Henderson, B. J., N. Jegadeesh, and M. S. Weisbach, 2006. World Markets for Raising New Capital. Journal of Financial Economics 82, pp. 63–101.
Henry, P. B., 2007. Capital Account Liberalization: Theory, Evidence, and Speculation. Journal of Economic Literature 45, pp. 887-935.
Jensen, M. C., and W. H. Meckling, 1976. Theory of the Firm: Managerial Behavior, Agency Costs and Ownership Structure. Journal of Financial Economics 3, pp. 305-360
Kim, W. and M.S. Weisbach, 2006. Motivations for Public Equity Offers: An International Perspective. Journal of Financial Economics, forthcoming.
Kose, M. A., E. Prasad, K. Rogoff, and S. J. Wei, 2006. Financial Globalization: A Reappraisal. NBER Working Paper No. 12484
Lang, M., V. Lins, and D. Miller, 2003. ADRs, Analysts, and Accuracy. Does Cross Listing in the United States Improve a Firm's Information Environment and Increase Market Value? Journal of Accounting Research 41, pp. 317-345.
Lang, M., J. S. Raedy, and M. H. Yetman, 2003. How Representative Are Firms That Are Cross-Listed in the United States? An Analysis of Accounting Quality. Journal of Accounting Research 41, pp. 363-386.
34
Levine, R. and S. Schmukler, 2006. Internationalization and Stock Market Liquidity. Review of Finance-Journal of the European Finance Association 10:1, pp. 153-187, March.
Levine, R. and S. Schmukler, 2007. Migration, Liquidity Spillovers, and Trade Diversion: The Effects of Internationalization on Stock Market Activity. Journal of Banking and Finance 31:6, pp. 1595-1612.
Ljungqvist, A. P., T. Jenkinson, and W. J. Wilhelm, Jr., 2003. Global Integration in Primary Equity Markets: The Role of U.S. Banks and U.S. Investors. Review of Financial Studies 16, pp. 63-99.
Loughran, T. and J.R. Ritter, 1995. The New Issues Puzzle. Journal of Finance 50, pp. 23-51.
Loughran, T. and J.R. Ritter, 1997. The Operating Performance of Firms Conducting Seasoned Equity Offerings, The Journal of Finance 52, pp. 1823-1850.
Miller, D., 1999. The Market Reaction to International Cross-Listings: Evidence from Depository Receipts. Journal of Financial Economics 51, pp. 103-123.
Obstfeld, M., and A. M. Taylor, 2004. Global Capital Markets: Integration, Crises, and Growth. Cambridge University Press.
Ortiz, G. 2002. Recent Emerging Market Crises: What Have We Learned? Per Jacobson Lecture, Basle, Switzerland.
Pagano, M., F. Panetta, and L. Zingales, 1998. Why Do Companies Go Abroad? An Empirical Analysis. Journal of Finance 53, pp. 27-64.
Pagano, M., A. Roëll, and J. Zechner, 2002. The Geography of Equity Listing: Why Do Companies List Abroad? Journal of Finance 57, pp. 2651–2694.
Patro, D., and J. Wald, 2005. Firm Characteristics and the Impact of Emerging Market Liberalizations. Journal of Banking and Finance 29, pp. 1671-1695.
Rangan, S., 1998. Earnings Management and the Performance of Seasoned Equity Offerings. Journal of Financial Economics 50, pp. 101-122.
Reese, W. A. Jr. and M. S. Weisbach, 2002. Protection of Minority Shareholder Interests, Cross-listings in the United States, and Subsequent Equity Offerings. Journal of Financial Economics 66, pp. 65–104.
Sachs, J. D., A. Tornell, and A. Velasco. 1996. Financial Crises in Emerging Markets: The Lessons from 1995. Brookings Papers on Economic Activity, No. 1, pp. 147–198.
Schmukler, S. L., and E. Vesperoni, 2006. Financial Globalization and Debt Maturity in Emerging Economies. Journal of Development Economics 79, pp. 183-207.
35

Solnik, B. H., 1974. Why Not Diversify Internationally Rather than Domestically? Financial Analysts Journal 30, pp. 48-54.
Stapleton, R., and M. Subrahmanyam, 1977. Market Imperfections, Capital Market Equilibrium, and Corporate Finance. Journal of Finance 32, pp. 307-319
Stulz, R., 1999. Globalization, Corporate Finance, and the Cost of Capital. Journal of Applied Corporate Finance 12, pp. 8–25.
Teoh, S. H., I. Welch, and T. J. Wong, 1998. Earnings Management and the Long-Run Market Performance of Initial Public Offerings. Journal of Finance 53, pp. 1935-1974.
Torstila, S., 2001. What Determines IPO Gross Spreads in Europe? European Financial Management 7, pp. 523-541.
Torstila, S., 2003. The Clustering of IPO Gross Spreads: International Evidence. Journal of Financial and Quantitative Analysis 38, pp. 673-694.
36
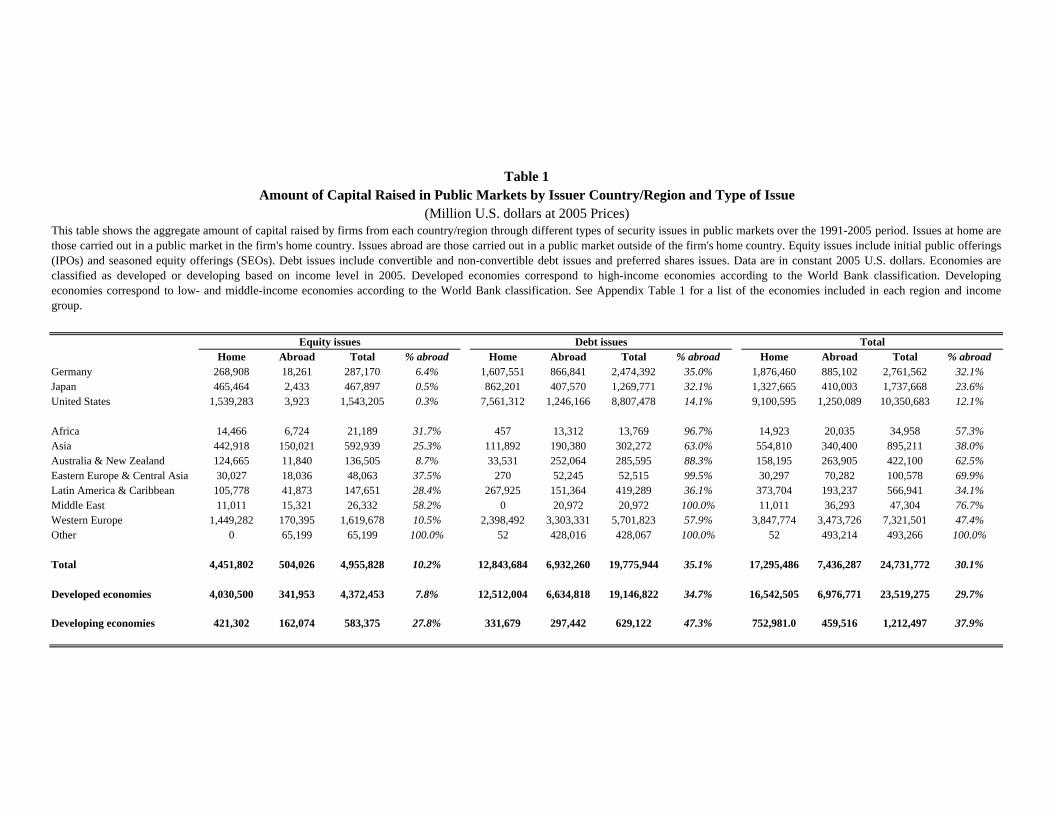
Home Abroad Total % abroad Home Abroad Total % abroad Home Abroad Total % abroadGermany 268,908 18,261 287,170 6.4% 1,607,551 866,841 2,474,392 35.0% 1,876,460 885,102 2,761,562 32.1%Japan 465,464 2,433 467,897 0.5% 862,201 407,570 1,269,771 32.1% 1,327,665 410,003 1,737,668 23.6%United States 1,539,283 3,923 1,543,205 0.3% 7,561,312 1,246,166 8,807,478 14.1% 9,100,595 1,250,089 10,350,683 12.1%
Africa 14,466 6,724 21,189 31.7% 457 13,312 13,769 96.7% 14,923 20,035 34,958 57.3%Asia 442,918 150,021 592,939 25.3% 111,892 190,380 302,272 63.0% 554,810 340,400 895,211 38.0%Australia & New Zealand 124,665 11,840 136,505 8.7% 33,531 252,064 285,595 88.3% 158,195 263,905 422,100 62.5%Eastern Europe & Central Asia 30,027 18,036 48,063 37.5% 270 52,245 52,515 99.5% 30,297 70,282 100,578 69.9%Latin America & Caribbean 105,778 41,873 147,651 28.4% 267,925 151,364 419,289 36.1% 373,704 193,237 566,941 34.1%Middle East 11,011 15,321 26,332 58.2% 0 20,972 20,972 100.0% 11,011 36,293 47,304 76.7%Western Europe 1,449,282 170,395 1,619,678 10.5% 2,398,492 3,303,331 5,701,823 57.9% 3,847,774 3,473,726 7,321,501 47.4%Other 0 65,199 65,199 100.0% 52 428,016 428,067 100.0% 52 493,214 493,266 100.0%
Total 4,451,802 504,026 4,955,828 10.2% 12,843,684 6,932,260 19,775,944 35.1% 17,295,486 7,436,287 24,731,772 30.1%
Developed economies 4,030,500 341,953 4,372,453 7.8% 12,512,004 6,634,818 19,146,822 34.7% 16,542,505 6,976,771 23,519,275 29.7%
Developing economies 421,302 162,074 583,375 27.8% 331,679 297,442 629,122 47.3% 752,981.0 459,516 1,212,497 37.9%
Debt issues
This table shows the aggregate amount of capital raised by firms from each country/region through different types of security issues in public markets over the 1991-2005 period. Issues at home arethose carried out in a public market in the firm's home country. Issues abroad are those carried out in a public market outside of the firm's home country. Equity issues include initial public offerings(IPOs) and seasoned equity offerings (SEOs). Debt issues include convertible and non-convertible debt issues and preferred shares issues. Data are in constant 2005 U.S. dollars. Economies areclassified as developed or developing based on income level in 2005. Developed economies correspond to high-income economies according to the World Bank classification. Developingeconomies correspond to low- and middle-income economies according to the World Bank classification. See Appendix Table 1 for a list of the economies included in each region and incomegroup.
Table 1Amount of Capital Raised in Public Markets by Issuer Country/Region and Type of Issue
TotalEquity issues
(Million U.S. dollars at 2005 Prices)
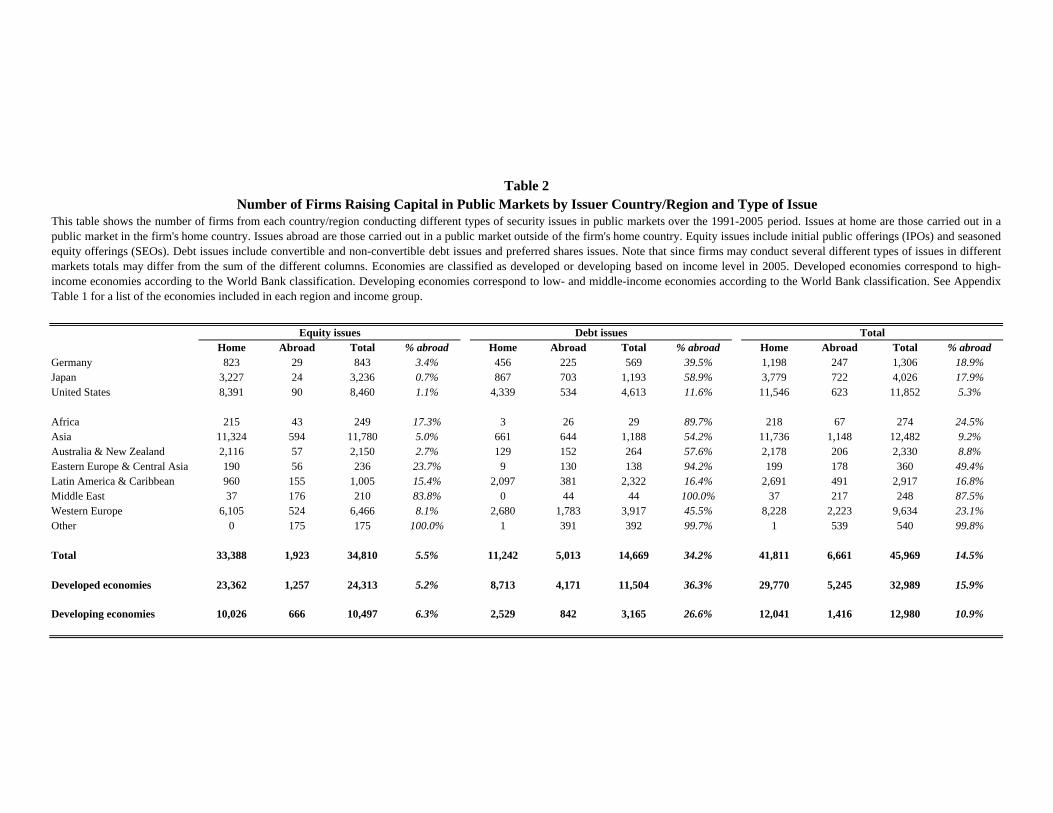
Home Abroad Total % abroad Home Abroad Total % abroad Home Abroad Total % abroadGermany 823 29 843 3.4% 456 225 569 39.5% 1,198 247 1,306 18.9%Japan 3,227 24 3,236 0.7% 867 703 1,193 58.9% 3,779 722 4,026 17.9%United States 8,391 90 8,460 1.1% 4,339 534 4,613 11.6% 11,546 623 11,852 5.3%
Africa 215 43 249 17.3% 3 26 29 89.7% 218 67 274 24.5%Asia 11,324 594 11,780 5.0% 661 644 1,188 54.2% 11,736 1,148 12,482 9.2%Australia & New Zealand 2,116 57 2,150 2.7% 129 152 264 57.6% 2,178 206 2,330 8.8%Eastern Europe & Central Asia 190 56 236 23.7% 9 130 138 94.2% 199 178 360 49.4%Latin America & Caribbean 960 155 1,005 15.4% 2,097 381 2,322 16.4% 2,691 491 2,917 16.8%Middle East 37 176 210 83.8% 0 44 44 100.0% 37 217 248 87.5%Western Europe 6,105 524 6,466 8.1% 2,680 1,783 3,917 45.5% 8,228 2,223 9,634 23.1%Other 0 175 175 100.0% 1 391 392 99.7% 1 539 540 99.8%
Total 33,388 1,923 34,810 5.5% 11,242 5,013 14,669 34.2% 41,811 6,661 45,969 14.5%
Developed economies 23,362 1,257 24,313 5.2% 8,713 4,171 11,504 36.3% 29,770 5,245 32,989 15.9%
Developing economies 10,026 666 10,497 6.3% 2,529 842 3,165 26.6% 12,041 1,416 12,980 10.9%
Equity issues Debt issues Total
This table shows the number of firms from each country/region conducting different types of security issues in public markets over the 1991-2005 period. Issues at home are those carried out in apublic market in the firm's home country. Issues abroad are those carried out in a public market outside of the firm's home country. Equity issues include initial public offerings (IPOs) and seasonedequity offerings (SEOs). Debt issues include convertible and non-convertible debt issues and preferred shares issues. Note that since firms may conduct several different types of issues in differentmarkets totals may differ from the sum of the different columns. Economies are classified as developed or developing based on income level in 2005. Developed economies correspond to high-income economies according to the World Bank classification. Developing economies correspond to low- and middle-income economies according to the World Bank classification. See AppendixTable 1 for a list of the economies included in each region and income group.
Table 2Number of Firms Raising Capital in Public Markets by Issuer Country/Region and Type of Issue

Firms with no capital raising
activity
Firms that only raise capital at
home
Difference in medians
Difference in medians
SizeTotal assets in million U.S. dollars 129.0 139.4 1,548.4 1,419.4 0.000 *** 1,409.0 0.000 ***
(79,719) (94,828) (21,021)Sales in million U.S. dollars 80.3 96.1 835.9 755.6 0.000 *** 739.8 0.000 ***
(80,676) (95,818) (21,040)GrowthLog of (1+annual percentage change in assets 0.047 0.072 0.068 0.021 0.000 *** -0.004 0.000 ***in U.S. dollars) (69,350) (80,549) (19,957)Log of (1+annual percentage change in sales 0.054 0.086 0.071 0.017 0.000 *** -0.015 0.000 ***in U.S. dollars) (67,477) (79,077) (19,789)InvestmentCapital expenditures in million U.S. dollars 3.2 3.9 46.7 43.5 0.000 *** 42.8 0.000 ***
(67,006) (83,276) (18,581)R&D expenditures in million U.S. dollars 1.3 2.1 15.8 14.4 0.000 *** 13.6 0.000 ***
(16,586) (21,185) (8,285)Capital expenditures/sales 0.039 0.039 0.059 0.020 0.000 *** 0.020 0.000 ***
(53,851) (72,833) (16,104)R&D expenditures/sales 0.008 0.014 0.016 0.008 0.000 *** 0.002 0.000 ***
(16,662) (21,008) (8,682)ProfitabilityReturn on assets 0.036 0.036 0.027 -0.009 0.000 *** -0.009 0.000 ***
(71,507) (82,231) (20,811)Return on equity 0.063 0.068 0.071 0.008 0.000 *** 0.002 0.000 ***
(69,988) (79,879) (20,604)Capital structureTotal debt/total assets 0.176 0.198 0.295 0.119 0.000 *** 0.097 0.000 ***
(79,807) (94,507) (22,231)Short term debt/total debt 0.575 0.549 0.424 -0.151 0.000 *** -0.125 0.000 ***
(67,869) (83,276) (21,292)OtherForeign sales/total sales 0.000 0.089 0.147 0.147 0.000 *** 0.058 0.000 ***
(39,410) (44,238) (13,638)Tobin's q 1.087 1.151 1.119 0.032 0.000 *** -0.032 0.000 ***
(71,879) (81,788) (20,339)
Difference with firms with no capital raising activity
Difference with firms that only raise capital at home
Test p-value Test p-value
Table 3Firm Characteristics by Capital Raising Activity
This table reports the median of different firm-level characteristics for different groups of firms classified according to their capital raising activity over the 1991-2005period. Firms with no capital raising activity are those identified as not having raised capital through security issues in public markets neither at home nor abroad over thesample period. Firms that only raise capital at home are those identified as having raised capital through security issues in public markets in their home country at somepoint during the sample period but that did not raise capital through security issues outside of their home country during the sample period. Firms that raise capital abroadare those identified as having raised capital through security issues in public markets outside of their home country at some point during the sample period. These includefirms that raised capital both at home and abroad. The number of observations used to calculate the medians in each case is in parentheses. The reported tests are Mann-Whitney U-test of equality of medians for the different firm characteristics across the different groups of firms. See Appendix Table 4 for the definition of the variables.*, **, *** mean significance at ten, five, and one percent, respectively.
Firms characteristics
Firms thtat raise capital abroad
Median Median Median
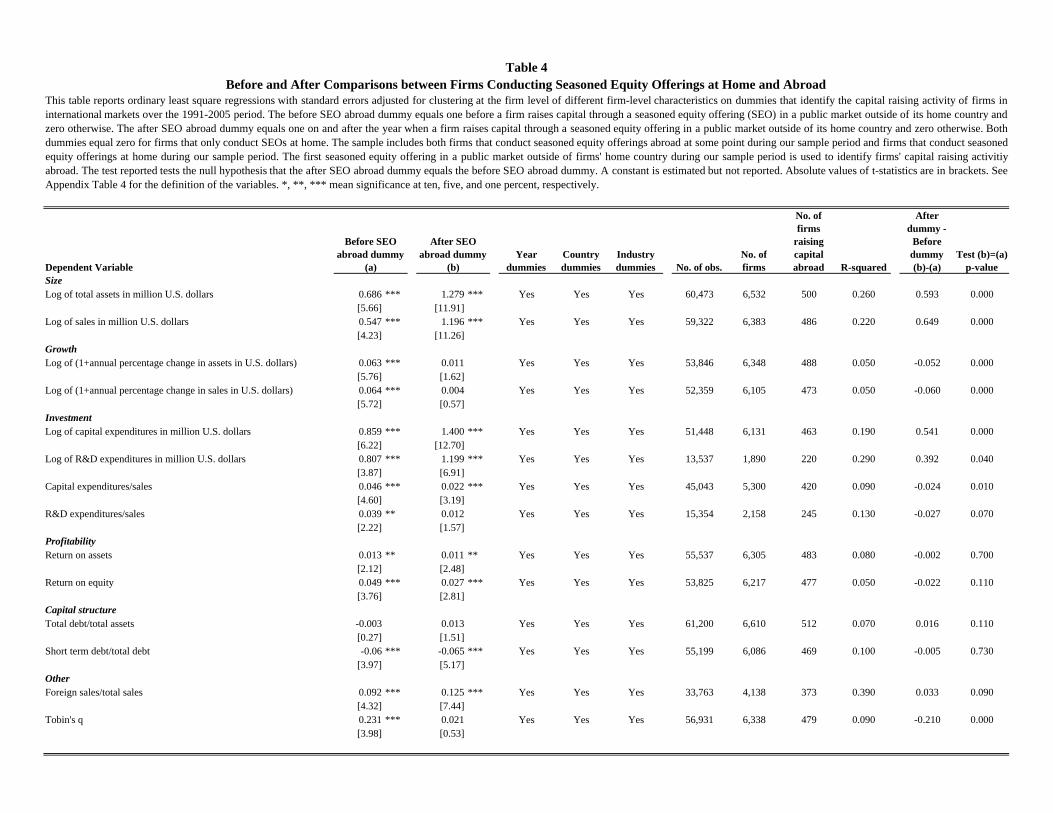
Dependent VariableYear
dummiesCountry dummies
Industry dummies No. of obs.
No. of firms
No. of firms
raising capital abroad R-squared
After dummy -
Before dummy (b)-(a)
Test (b)=(a) p-value
SizeLog of total assets in million U.S. dollars 0.686 *** 1.279 *** Yes Yes Yes 60,473 6,532 500 0.260 0.593 0.000
[5.66] [11.91]Log of sales in million U.S. dollars 0.547 *** 1.196 *** Yes Yes Yes 59,322 6,383 486 0.220 0.649 0.000
[4.23] [11.26]GrowthLog of (1+annual percentage change in assets in U.S. dollars) 0.063 *** 0.011 Yes Yes Yes 53,846 6,348 488 0.050 -0.052 0.000
[5.76] [1.62]Log of (1+annual percentage change in sales in U.S. dollars) 0.064 *** 0.004 Yes Yes Yes 52,359 6,105 473 0.050 -0.060 0.000
[5.72] [0.57]InvestmentLog of capital expenditures in million U.S. dollars 0.859 *** 1.400 *** Yes Yes Yes 51,448 6,131 463 0.190 0.541 0.000
[6.22] [12.70]Log of R&D expenditures in million U.S. dollars 0.807 *** 1.199 *** Yes Yes Yes 13,537 1,890 220 0.290 0.392 0.040
[3.87] [6.91]Capital expenditures/sales 0.046 *** 0.022 *** Yes Yes Yes 45,043 5,300 420 0.090 -0.024 0.010
[4.60] [3.19]R&D expenditures/sales 0.039 ** 0.012 Yes Yes Yes 15,354 2,158 245 0.130 -0.027 0.070
[2.22] [1.57]ProfitabilityReturn on assets 0.013 ** 0.011 ** Yes Yes Yes 55,537 6,305 483 0.080 -0.002 0.700
[2.12] [2.48]Return on equity 0.049 *** 0.027 *** Yes Yes Yes 53,825 6,217 477 0.050 -0.022 0.110
[3.76] [2.81]Capital structureTotal debt/total assets -0.003 0.013 Yes Yes Yes 61,200 6,610 512 0.070 0.016 0.110
[0.27] [1.51]Short term debt/total debt -0.06 *** -0.065 *** Yes Yes Yes 55,199 6,086 469 0.100 -0.005 0.730
[3.97] [5.17]OtherForeign sales/total sales 0.092 *** 0.125 *** Yes Yes Yes 33,763 4,138 373 0.390 0.033 0.090
[4.32] [7.44]Tobin's q 0.231 *** 0.021 Yes Yes Yes 56,931 6,338 479 0.090 -0.210 0.000
[3.98] [0.53]
Table 4
This table reports ordinary least square regressions with standard errors adjusted for clustering at the firm level of different firm-level characteristics on dummies that identify the capital raising activity of firms ininternational markets over the 1991-2005 period. The before SEO abroad dummy equals one before a firm raises capital through a seasoned equity offering (SEO) in a public market outside of its home country andzero otherwise. The after SEO abroad dummy equals one on and after the year when a firm raises capital through a seasoned equity offering in a public market outside of its home country and zero otherwise. Bothdummies equal zero for firms that only conduct SEOs at home. The sample includes both firms that conduct seasoned equity offerings abroad at some point during our sample period and firms that conduct seasonedequity offerings at home during our sample period. The first seasoned equity offering in a public market outside of firms' home country during our sample period is used to identify firms' capital raising activitiyabroad. The test reported tests the null hypothesis that the after SEO abroad dummy equals the before SEO abroad dummy. A constant is estimated but not reported. Absolute values of t-statistics are in brackets. SeeAppendix Table 4 for the definition of the variables. *, **, *** mean significance at ten, five, and one percent, respectively.
Before and After Comparisons between Firms Conducting Seasoned Equity Offerings at Home and Abroad
Before SEO abroad dummy
(a)
After SEO abroad dummy
(b)
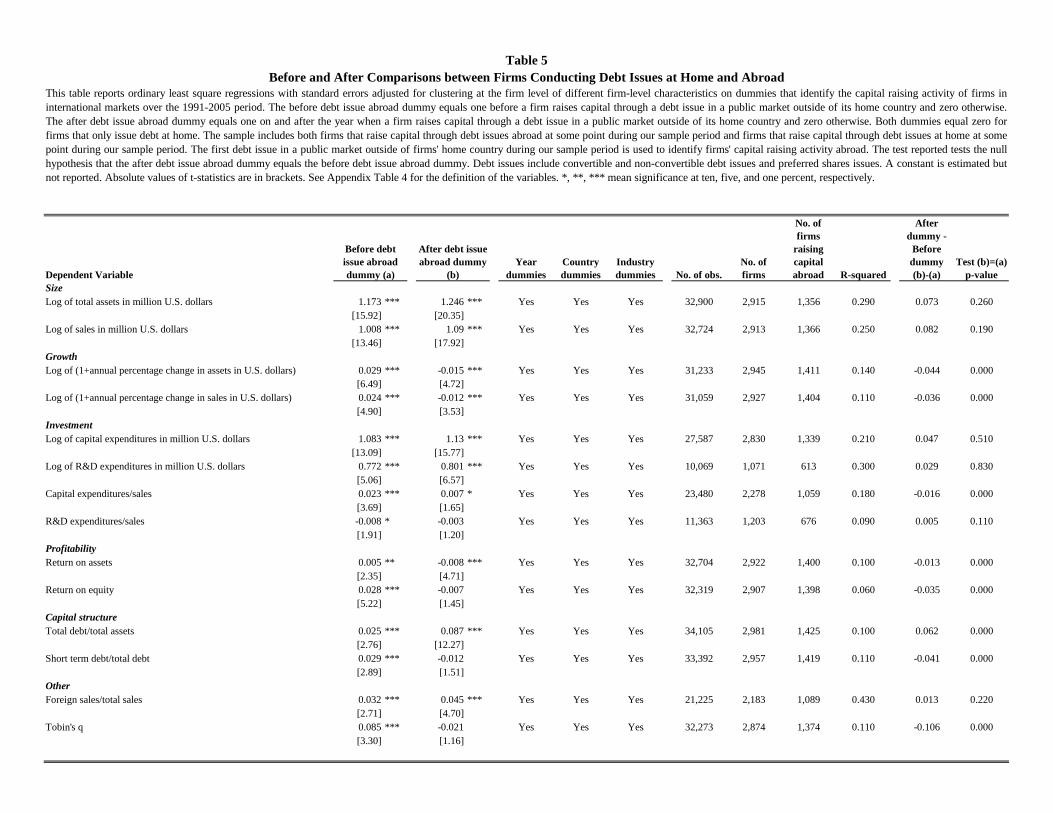
Dependent VariableYear
dummiesCountry dummies
Industry dummies No. of obs.
No. of firms
No. of firms
raising capital abroad R-squared
After dummy -
Before dummy (b)-(a)
Test (b)=(a) p-value
SizeLog of total assets in million U.S. dollars 1.173 *** 1.246 *** Yes Yes Yes 32,900 2,915 1,356 0.290 0.073 0.260
[15.92] [20.35]Log of sales in million U.S. dollars 1.008 *** 1.09 *** Yes Yes Yes 32,724 2,913 1,366 0.250 0.082 0.190
[13.46] [17.92]GrowthLog of (1+annual percentage change in assets in U.S. dollars) 0.029 *** -0.015 *** Yes Yes Yes 31,233 2,945 1,411 0.140 -0.044 0.000
Table 5Before and After Comparisons between Firms Conducting Debt Issues at Home and Abroad
This table reports ordinary least square regressions with standard errors adjusted for clustering at the firm level of different firm-level characteristics on dummies that identify the capital raising activity of firms ininternational markets over the 1991-2005 period. The before debt issue abroad dummy equals one before a firm raises capital through a debt issue in a public market outside of its home country and zero otherwise.The after debt issue abroad dummy equals one on and after the year when a firm raises capital through a debt issue in a public market outside of its home country and zero otherwise. Both dummies equal zero forfirms that only issue debt at home. The sample includes both firms that raise capital through debt issues abroad at some point during our sample period and firms that raise capital through debt issues at home at somepoint during our sample period. The first debt issue in a public market outside of firms' home country during our sample period is used to identify firms' capital raising activity abroad. The test reported tests the nullhypothesis that the after debt issue abroad dummy equals the before debt issue abroad dummy. Debt issues include convertible and non-convertible debt issues and preferred shares issues. A constant is estimated butnot reported. Absolute values of t-statistics are in brackets. See Appendix Table 4 for the definition of the variables. *, **, *** mean significance at ten, five, and one percent, respectively.
Before debt issue abroad dummy (a)
After debt issue abroad dummy
(b)
[6.49] [4.72]Log of (1+annual percentage change in sales in U.S. dollars) 0.024 *** -0.012 *** Yes Yes Yes 31,059 2,927 1,404 0.110 -0.036 0.000
[4.90] [3.53]InvestmentLog of capital expenditures in million U.S. dollars 1.083 *** 1.13 *** Yes Yes Yes 27,587 2,830 1,339 0.210 0.047 0.510
[13.09] [15.77]Log of R&D expenditures in million U.S. dollars 0.772 *** 0.801 *** Yes Yes Yes 10,069 1,071 613 0.300 0.029 0.830
[5.06] [6.57]Capital expenditures/sales 0.023 *** 0.007 * Yes Yes Yes 23,480 2,278 1,059 0.180 -0.016 0.000
[3.69] [1.65]R&D expenditures/sales -0.008 * -0.003 Yes Yes Yes 11,363 1,203 676 0.090 0.005 0.110
[1.91] [1.20]ProfitabilityReturn on assets 0.005 ** -0.008 *** Yes Yes Yes 32,704 2,922 1,400 0.100 -0.013 0.000
[2.35] [4.71]Return on equity 0.028 *** -0.007 Yes Yes Yes 32,319 2,907 1,398 0.060 -0.035 0.000
[5.22] [1.45]Capital structureTotal debt/total assets 0.025 *** 0.087 *** Yes Yes Yes 34,105 2,981 1,425 0.100 0.062 0.000
[2.76] [12.27]Short term debt/total debt 0.029 *** -0.012 Yes Yes Yes 33,392 2,957 1,419 0.110 -0.041 0.000
[2.89] [1.51]OtherForeign sales/total sales 0.032 *** 0.045 *** Yes Yes Yes 21,225 2,183 1,089 0.430 0.013 0.220
[2.71] [4.70]Tobin's q 0.085 *** -0.021 Yes Yes Yes 32,273 2,874 1,374 0.110 -0.106 0.000
[3.30] [1.16]
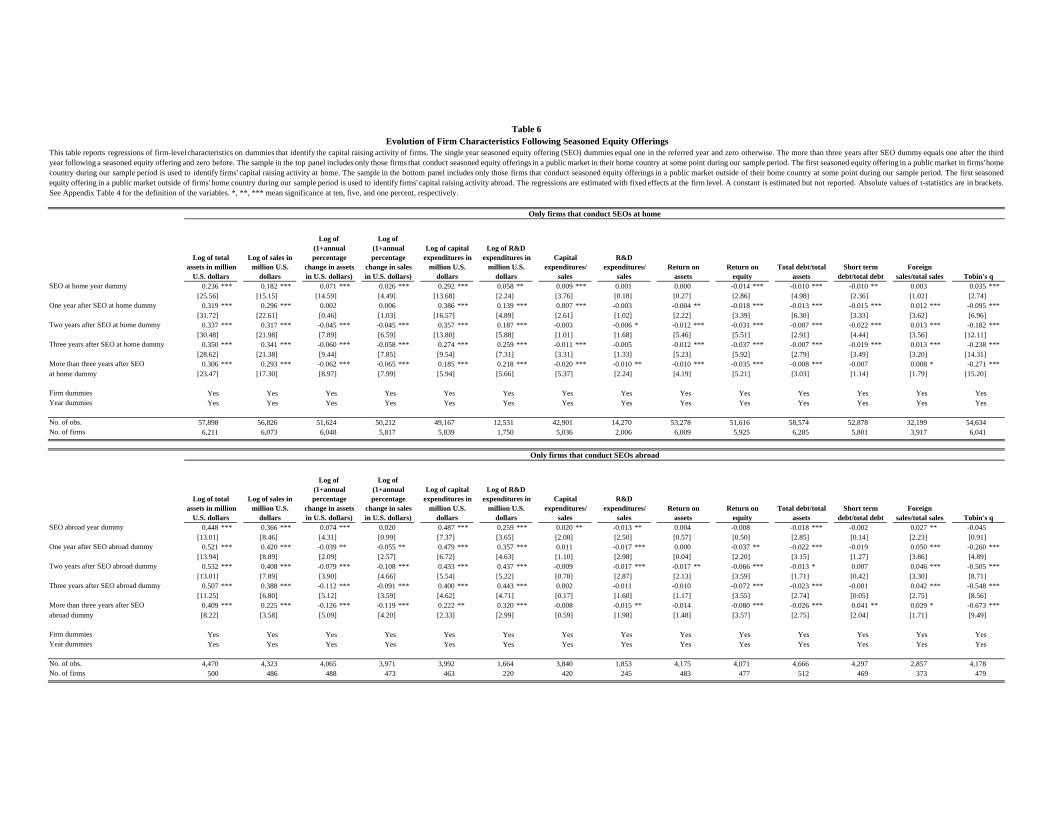
SEO at home year dummy 0.236 *** 0.182 *** 0.071 *** 0.026 *** 0.292 *** 0.058 ** 0.009 *** 0.001 0.000 -0.014 *** -0.010 *** -0.010 ** 0.003 0.035 ***[25.56] [15.15] [14.59] [4.49] [13.68] [2.24] [3.76] [0.18] [0.27] [2.86] [4.98] [2.36] [1.02] [2.74]
One year after SEO at home dummy 0.319 *** 0.296 *** 0.002 0.006 0.386 *** 0.139 *** 0.007 *** -0.003 -0.004 ** -0.018 *** -0.013 *** -0.015 *** 0.012 *** -0.095 ***[31.72] [22.61] [0.46] [1.03] [16.57] [4.89] [2.61] [1.02] [2.22] [3.39] [6.30] [3.33] [3.62] [6.96]
Two years after SEO at home dummy 0.337 *** 0.317 *** -0.045 *** -0.045 *** 0.357 *** 0.187 *** -0.003 -0.006 * -0.012 *** -0.031 *** -0.007 *** -0.022 *** 0.013 *** -0.182 ***[30.48] [21.98] [7.89] [6.59] [13.80] [5.88] [1.01] [1.68] [5.46] [5.51] [2.91] [4.44] [3.56] [12.11]
Three years after SEO at home dummy 0.350 *** 0.341 *** -0.060 *** -0.058 *** 0.274 *** 0.259 *** -0.011 *** -0.005 -0.012 *** -0.037 *** -0.007 *** -0.019 *** 0.013 *** -0.238 ***[28.62] [21.38] [9.44] [7.85] [9.54] [7.31] [3.31] [1.33] [5.23] [5.92] [2.79] [3.49] [3.20] [14.31]
More than three years after SEO 0.306 *** 0.293 *** -0.062 *** -0.065 *** 0.185 *** 0.218 *** -0.020 *** -0.010 ** -0.010 *** -0.035 *** -0.008 *** -0.007 0.008 * -0.271 ***at home dummy [23.47] [17.30] [8.97] [7.99] [5.94] [5.66] [5.37] [2.24] [4.19] [5.21] [3.03] [1.14] [1.79] [15.20]
Firm dummies Yes Yes Yes Yes Yes Yes Yes Yes Yes Yes Yes Yes Yes YesYear dummies Yes Yes Yes Yes Yes Yes Yes Yes Yes Yes Yes Yes Yes Yes
No. of obs. 57,898 56,826 51,624 50,212 49,167 12,531 42,901 14,270 53,278 51,616 58,574 52,878 32,199 54,634No. of firms 6,211 6,073 6,048 5,817 5,839 1,750 5,036 2,006 6,009 5,925 6,285 5,801 3,917 6,041
SEO abroad year dummy 0.448 *** 0.366 *** 0.074 *** 0.020 0.487 *** 0.259 *** 0.020 ** -0.013 ** 0.004 -0.008 -0.018 *** -0.002 0.027 ** -0.045[13.01] [8.46] [4.31] [0.99] [7.37] [3.65] [2.08] [2.50] [0.57] [0.50] [2.85] [0.14] [2.23] [0.91]
One year after SEO abroad dummy 0.521 *** 0.420 *** -0.039 ** -0.055 ** 0.479 *** 0.357 *** 0.011 -0.017 *** 0.000 -0.037 ** -0.022 *** -0.019 0.050 *** -0.260 ***[13.94] [8.89] [2.09] [2.57] [6.72] [4.63] [1.10] [2.98] [0.04] [2.20] [3.15] [1.27] [3.86] [4.89]
Two years after SEO abroad dummy 0.532 *** 0.408 *** -0.079 *** -0.108 *** 0.433 *** 0.437 *** -0.009 -0.017 *** -0.017 ** -0.066 *** -0.013 * 0.007 0.046 *** -0.505 ***[13.01] [7.89] [3.90] [4.66] [5.54] [5.22] [0.78] [2.87] [2.13] [3.59] [1.71] [0.42] [3.30] [8.71]
Three years after SEO abroad dummy 0.507 *** 0.388 *** -0.112 *** -0.091 *** 0.400 *** 0.443 *** 0.002 -0.011 -0.010 -0.072 *** -0.023 *** -0.001 0.042 *** -0.548 ***[11.25] [6.80] [5.12] [3.59] [4.62] [4.71] [0.17] [1.60] [1.17] [3.55] [2.74] [0.05] [2.75] [8.56]
More than three years after SEO 0.409 *** 0.225 *** -0.126 *** -0.119 *** 0.222 ** 0.320 *** -0.008 -0.015 ** -0.014 -0.080 *** -0.026 *** 0.041 ** 0.029 * -0.673 ***abroad dummy [8.22] [3.58] [5.09] [4.20] [2.33] [2.99] [0.59] [1.98] [1.48] [3.57] [2.75] [2.04] [1.71] [9.49]
Firm dummies Yes Yes Yes Yes Yes Yes Yes Yes Yes Yes Yes Yes Yes YesYear dummies Yes Yes Yes Yes Yes Yes Yes Yes Yes Yes Yes Yes Yes Yes
No. of obs. 4,470 4,323 4,065 3,971 3,992 1,664 3,840 1,853 4,175 4,071 4,666 4,297 2,857 4,178No. of firms 500 486 488 473 463 220 420 245 483 477 512 469 373 479
Foreign sales/total sales
R&D expenditures/
salesReturn on
assetsReturn on
equity
R&D expenditures/
salesReturn on
assetsReturn on
equity
Log of sales in million U.S.
dollars
Log of (1+annual percentage
change in assets in U.S. dollars)
Log of sales in million U.S.
dollars
Log of (1+annual percentage
change in assets in U.S. dollars)
Log of capital expenditures in
million U.S. dollars
Log of R&D expenditures in
million U.S. dollars
Tobin's q
Only firms that conduct SEOs abroad
Log of total assets in million
U.S. dollars
Log of (1+annual percentage
change in sales in U.S. dollars)
Log of capital expenditures in
million U.S. dollars
Log of R&D expenditures in
million U.S. dollars
Capital expenditures/
salesShort term
debt/total debtForeign
sales/total salesTotal debt/total
assets
This table reports regressions of firm-levelcharacteristics on dummies that identify the capital raising activity of firms. The single year seasoned equity offering (SEO) dummies equal one in the referred year and zero otherwise. The more than three years after SEO dummy equals one after the thirdyear following a seasoned equity offering and zero before. The sample in the top panel includes only those firms that conduct seasoned equity offerings in a public market in their home country at some point during our sample period. The first seasoned equity offering in a public market in firms' homecountry during our sample period is used to identify firms' capital raising activity at home. The sample in the bottom panel includes only those firms that conduct seasoned equity offerings in a public market outside of their home country at some point during our sample period. The first seasonedequity offering in a public market outside of firms' home country during our sample period is used to identify firms' capital raising activity abroad. The regressions are estimated with fixed effects at the firm level. A constant is estimated but not reported. Absolute values of t-statistics are in brackets.See Appendix Table 4 for the definition of the variables. *, **, *** mean significance at ten, five, and one percent, respectively.
Table 6Evolution of Firm Characteristics Following Seasoned Equity Offerings
Only firms that conduct SEOs at home
Tobin's q
Log of total assets in million
U.S. dollars
Log of (1+annual percentage
change in sales in U.S. dollars)
Capital expenditures/
salesTotal debt/total
assetsShort term
debt/total debt
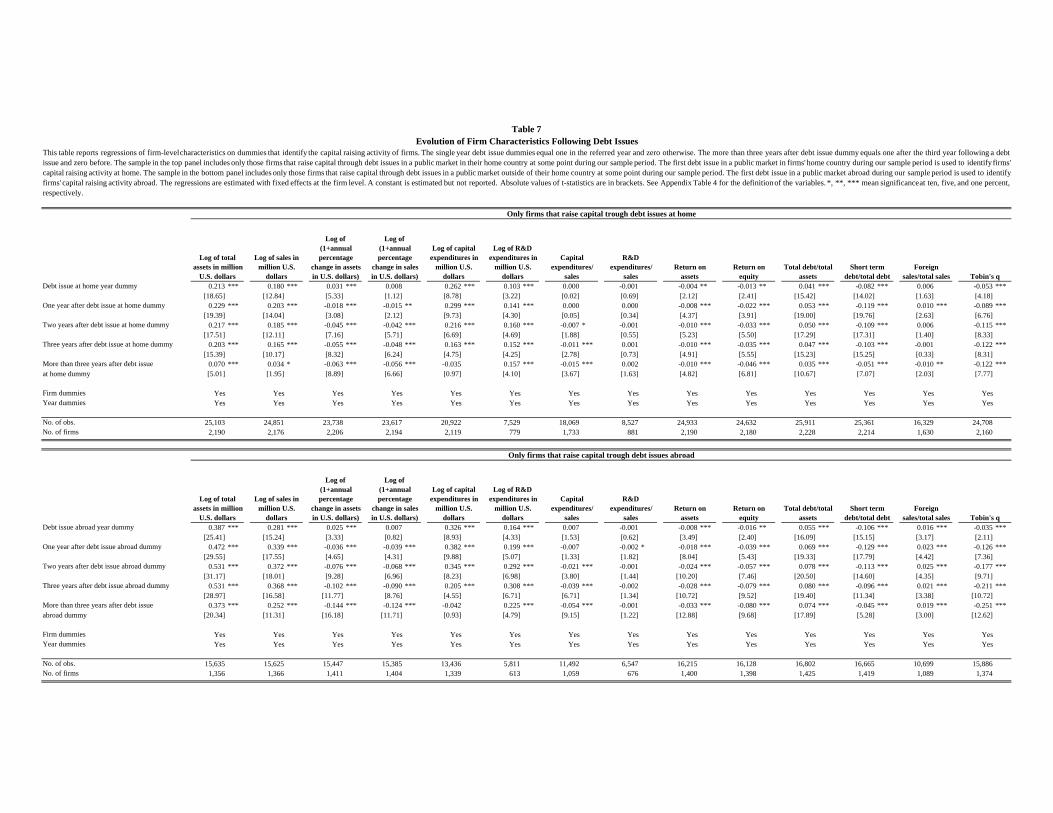
Debt issue at home year dummy 0.213 *** 0.180 *** 0.031 *** 0.008 0.262 *** 0.103 *** 0.000 -0.001 -0.004 ** -0.013 ** 0.041 *** -0.082 *** 0.006 -0.053 ***[18.65] [12.84] [5.33] [1.12] [8.78] [3.22] [0.02] [0.69] [2.12] [2.41] [15.42] [14.02] [1.63] [4.18]
One year after debt issue at home dummy 0.229 *** 0.203 *** -0.018 *** -0.015 ** 0.299 *** 0.141 *** 0.000 0.000 -0.008 *** -0.022 *** 0.053 *** -0.119 *** 0.010 *** -0.089 ***[19.39] [14.04] [3.08] [2.12] [9.73] [4.30] [0.05] [0.34] [4.37] [3.91] [19.00] [19.76] [2.63] [6.76]
Two years after debt issue at home dummy 0.217 *** 0.185 *** -0.045 *** -0.042 *** 0.216 *** 0.160 *** -0.007 * -0.001 -0.010 *** -0.033 *** 0.050 *** -0.109 *** 0.006 -0.115 ***[17.51] [12.11] [7.16] [5.71] [6.69] [4.69] [1.88] [0.55] [5.23] [5.50] [17.29] [17.31] [1.40] [8.33]
Three years after debt issue at home dummy 0.203 *** 0.165 *** -0.055 *** -0.048 *** 0.163 *** 0.152 *** -0.011 *** 0.001 -0.010 *** -0.035 *** 0.047 *** -0.103 *** -0.001 -0.122 ***[15.39] [10.17] [8.32] [6.24] [4.75] [4.25] [2.78] [0.73] [4.91] [5.55] [15.23] [15.25] [0.33] [8.31]
More than three years after debt issue 0.070 *** 0.034 * -0.063 *** -0.056 *** -0.035 0.157 *** -0.015 *** 0.002 -0.010 *** -0.046 *** 0.035 *** -0.051 *** -0.010 ** -0.122 ***at home dummy [5.01] [1.95] [8.89] [6.66] [0.97] [4.10] [3.67] [1.63] [4.82] [6.81] [10.67] [7.07] [2.03] [7.77]
Firm dummies Yes Yes Yes Yes Yes Yes Yes Yes Yes Yes Yes Yes Yes YesYear dummies Yes Yes Yes Yes Yes Yes Yes Yes Yes Yes Yes Yes Yes Yes
No. of obs. 25,103 24,851 23,738 23,617 20,922 7,529 18,069 8,527 24,933 24,632 25,911 25,361 16,329 24,708No. of firms 2,190 2,176 2,206 2,194 2,119 779 1,733 881 2,190 2,180 2,228 2,214 1,630 2,160
Debt issue abroad year dummy 0.387 *** 0.281 *** 0.025 *** 0.007 0.326 *** 0.164 *** 0.007 -0.001 -0.008 *** -0.016 ** 0.055 *** -0.106 *** 0.016 *** -0.035 ***[25.41] [15.24] [3.33] [0.82] [8.93] [4.33] [1.53] [0.62] [3.49] [2.40] [16.09] [15.15] [3.17] [2.11]
One year after debt issue abroad dummy 0.472 *** 0.339 *** -0.036 *** -0.039 *** 0.382 *** 0.199 *** -0.007 -0.002 * -0.018 *** -0.039 *** 0.069 *** -0.129 *** 0.023 *** -0.126 ***[29.55] [17.55] [4.65] [4.31] [9.88] [5.07] [1.33] [1.82] [8.04] [5.43] [19.33] [17.79] [4.42] [7.36]
Two years after debt issue abroad dummy 0.531 *** 0.372 *** -0.076 *** -0.068 *** 0.345 *** 0.292 *** -0.021 *** -0.001 -0.024 *** -0.057 *** 0.078 *** -0.113 *** 0.025 *** -0.177 ***[31.17] [18.01] [9.28] [6.96] [8.23] [6.98] [3.80] [1.44] [10.20] [7.46] [20.50] [14.60] [4.35] [9.71]
Three years after debt issue abroad dummy 0.531 *** 0.368 *** -0.102 *** -0.090 *** 0.205 *** 0.308 *** -0.039 *** -0.002 -0.028 *** -0.079 *** 0.080 *** -0.096 *** 0.021 *** -0.211 ***[28.97] [16.58] [11.77] [8.76] [4.55] [6.71] [6.71] [1.34] [10.72] [9.52] [19.40] [11.34] [3.38] [10.72]
More than three years after debt issue 0.373 *** 0.252 *** -0.144 *** -0.124 *** -0.042 0.225 *** -0.054 *** -0.001 -0.033 *** -0.080 *** 0.074 *** -0.045 *** 0.019 *** -0.251 ***abroad dummy [20.34] [11.31] [16.18] [11.71] [0.93] [4.79] [9.15] [1.22] [12.88] [9.68] [17.89] [5.28] [3.00] [12.62]
Firm dummies Yes Yes Yes Yes Yes Yes Yes Yes Yes Yes Yes Yes Yes YesYear dummies Yes Yes Yes Yes Yes Yes Yes Yes Yes Yes Yes Yes Yes Yes
No. of obs. 15,635 15,625 15,447 15,385 13,436 5,811 11,492 6,547 16,215 16,128 16,802 16,665 10,699 15,886No. of firms 1,356 1,366 1,411 1,404 1,339 613 1,059 676 1,400 1,398 1,425 1,419 1,089 1,374
Tobin's q
Only firms that raise capital trough debt issues abroad
Log of total assets in million
U.S. dollars
Log of (1+annual percentage
change in sales in U.S. dollars)
Log of capital expenditures in
million U.S. dollars
Log of R&D expenditures in
million U.S. dollars
Capital expenditures/
sales
R&D expenditures/
salesReturn on
assetsReturn on
equityForeign
sales/total sales
Foreign sales/total sales
Log of (1+annual percentage
change in assets in U.S. dollars)
R&D expenditures/
salesReturn on
assetsReturn on
equity
Log of capital expenditures in
million U.S. dollars
Log of R&D expenditures in
million U.S. dollars
Capital expenditures/
sales
Total debt/total assets
Log of sales in million U.S.
dollars
Log of (1+annual percentage
change in assets in U.S. dollars)
Total debt/total assets
Short term debt/total debt
Log of sales in million U.S.
dollars
Short term debt/total debt
This table reports regressions of firm-levelcharacteristics on dummies that identify the capital raising activity of firms. The single year debt issue dummies equal one in the referred year and zero otherwise. The more than three years after debt issue dummy equals one after the third year following a debtissue and zero before. The sample in the top panel includes only those firms that raise capital through debt issues in a public market in their home country at some point during our sample period. The first debt issue in a public market in firms' home country during our sample period is used to identifyfirms'capital raising activity at home. The sample in the bottom panel includes only those firms that raise capital through debt issues in a public market outside of their home country at some point during our sample period. The first debt issue in a public market abroad during our sample period is used to identifyfirms' capital raising activity abroad. The regressions are estimated with fixed effects at the firm level. A constant is estimated but not reported. Absolute values of t-statistics are in brackets. See Appendix Table 4 for the definition of the variables. *, **, *** mean significanceat ten, five, and one percent,respectively.
Tobin's q
Table 7Evolution of Firm Characteristics Following Debt Issues
Only firms that raise capital trough debt issues at home
Log of total assets in million
U.S. dollars
Log of (1+annual percentage
change in sales in U.S. dollars)

Issues at home
Issues abroad
Issues at home
Issues abroad
Issues at home
Issues abroad
Median amount raised per security issue(million U.S. dollars at 2005 prices)
All issues
Developed economies 26.9 54.3 0.000 *** 85.1 138.0 0.000 *** 57.3 131.2 0.000 ***(40,697) (2,182) (71,986) (26,671) (112,683) (28,853)
Developing economies 3.8 62.0 0.000 *** 7.2 122.4 0.000 *** 5.6 101.5 0.000 ***(11,577) (1,092) (9,260) (1,778) (20,837) (2,870)
Issues by firms that raise capital both at home and abroad
Developed economies 126.5 116.2 0.123 105.9 155.8 0.000 *** 106.2 154.5 0.000 ***(2,882) (600) (32,067) (16,681) (34,949) (17,281)
Developing economies 57.3 82.8 0.000 *** 32.0 132.8 0.000 *** 42.2 124.0 0.000 ***(650) (389) (1,243) (695) (1,893) (1,084)
Mann-Whitney U-
Test p-value
Mann-Whitney U-
Test p-value
Mann-Whitney U-
Test p-value
Table 8Size of Capital Raisings in Public Markets by Type of Issue
This table shows the median amount raised per security issue for different types of security issues in public markets over the 1991-2005 period. The number of observations used to calculate themedians in each case is in parentheses. The reported test is the Mann-Whitney U-test of equality of medians between issues at home and abroad. Firms that raise capital both at home and abroadare those that issue securities both outside of their home country and in their home country at some point during the sample period. Issues at home are those carried out in a public market in thefirm's home country. Issues abroad are those carried out in a public market outside of the firm's home country. Equity issues include initial public offerings (IPOs) and seasoned equity offerings(SEOs). Debt issues include convertible and non-convertible debt issues and preferred shares issues. Economies are classified as developed or developing based on income level in 2005.Developed economies correspond to high-income economies according to the World Bank classification. Developing economies correspond to low- and middle-income economies according tothe World Bank classification. See Appendix Table 1 for a list of the economies included in each income group. *, **, *** mean significance at ten, five, and one percent, respectively.
Equity issues Debt issues All issues
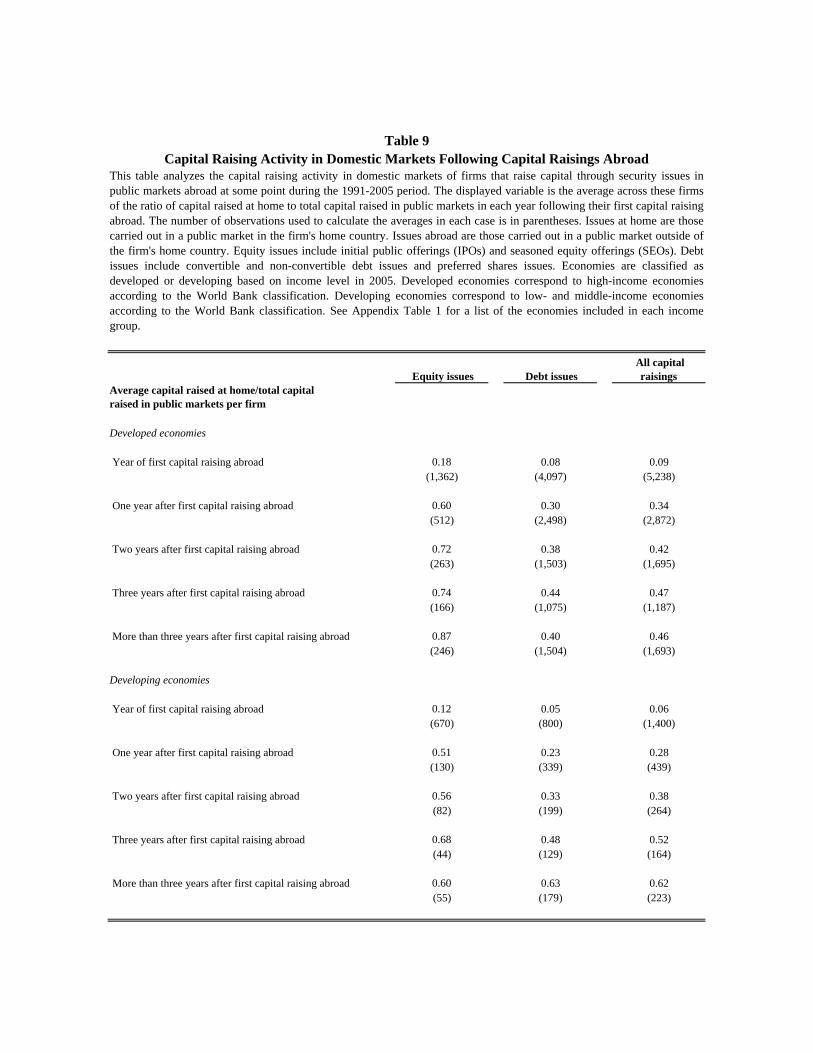
Equity issues Debt issues All capital
raisingsAverage capital raised at home/total capital raised in public markets per firm
Developed economies
Year of first capital raising abroad 0.18 0.08 0.09(1,362) (4,097) (5,238)
One year after first capital raising abroad 0.60 0.30 0.34(512) (2,498) (2,872)
Two years after first capital raising abroad 0.72 0.38 0.42(263) (1,503) (1,695)
Three years after first capital raising abroad 0.74 0.44 0.47(166) (1,075) (1,187)
More than three years after first capital raising abroad 0.87 0.40 0.46(246) (1,504) (1,693)
Developing economies
Year of first capital raising abroad 0.12 0.05 0.06(670) (800) (1,400)
One year after first capital raising abroad 0.51 0.23 0.28(130) (339) (439)
Two years after first capital raising abroad 0.56 0.33 0.38(82) (199) (264)
Three years after first capital raising abroad 0.68 0.48 0.52(44) (129) (164)
More than three years after first capital raising abroad 0.60 0.63 0.62(55) (179) (223)
Table 9Capital Raising Activity in Domestic Markets Following Capital Raisings Abroad
This table analyzes the capital raising activity in domestic markets of firms that raise capital through security issues inpublic markets abroad at some point during the 1991-2005 period. The displayed variable is the average across these firmsof the ratio of capital raised at home to total capital raised in public markets in each year following their first capital raisingabroad. The number of observations used to calculate the averages in each case is in parentheses. Issues at home are thosecarried out in a public market in the firm's home country. Issues abroad are those carried out in a public market outside ofthe firm's home country. Equity issues include initial public offerings (IPOs) and seasoned equity offerings (SEOs). Debtissues include convertible and non-convertible debt issues and preferred shares issues. Economies are classified asdeveloped or developing based on income level in 2005. Developed economies correspond to high-income economiesaccording to the World Bank classification. Developing economies correspond to low- and middle-income economiesaccording to the World Bank classification. See Appendix Table 1 for a list of the economies included in each incomegroup.
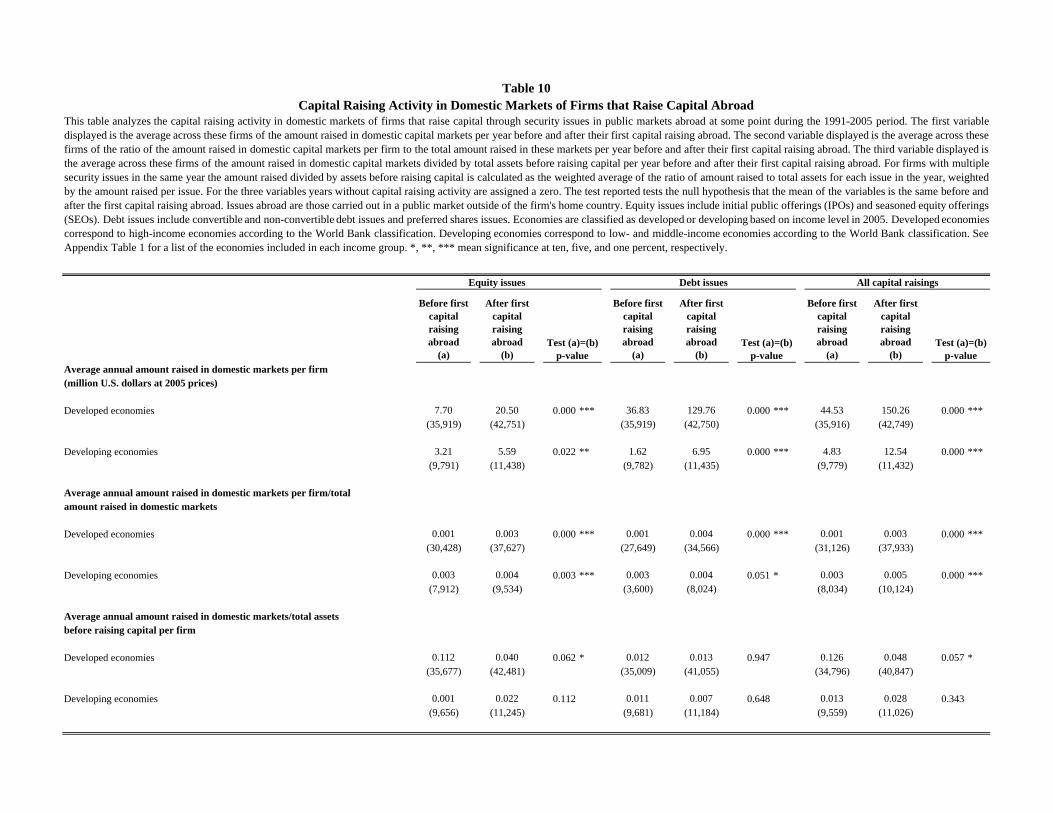
Before first capital raising abroad
(a)
After first capital raising abroad
(b)
Before first capital raising abroad
(a)
After first capital raising abroad
(b)
Before first capital raising abroad
(a)
After first capital raising abroad
(b)Average annual amount raised in domestic markets per firm(million U.S. dollars at 2005 prices)
Developed economies 7.70 20.50 0.000 *** 36.83 129.76 0.000 *** 44.53 150.26 0.000 ***(35,919) (42,751) (35,919) (42,750) (35,916) (42,749)
Developing economies 3.21 5.59 0.022 ** 1.62 6.95 0.000 *** 4.83 12.54 0.000 ***(9,791) (11,438) (9,782) (11,435) (9,779) (11,432)
Average annual amount raised in domestic markets per firm/totalamount raised in domestic markets
Developed economies 0.001 0.003 0.000 *** 0.001 0.004 0.000 *** 0.001 0.003 0.000 ***(30,428) (37,627) (27,649) (34,566) (31,126) (37,933)
Developing economies 0.003 0.004 0.003 *** 0.003 0.004 0.051 * 0.003 0.005 0.000 ***(7,912) (9,534) (3,600) (8,024) (8,034) (10,124)
Average annual amount raised in domestic markets/total assetsbefore raising capital per firm
Developed economies 0.112 0.040 0.062 * 0.012 0.013 0.947 0.126 0.048 0.057 *(35,677) (42,481) (35,009) (41,055) (34,796) (40,847)
Developing economies 0.001 0.022 0.112 0.011 0.007 0.648 0.013 0.028 0.343 (9,656) (11,245) (9,681) (11,184) (9,559) (11,026)
Test (a)=(b) p-value
Test (a)=(b) p-value
Test (a)=(b) p-value
Table 10Capital Raising Activity in Domestic Markets of Firms that Raise Capital Abroad
This table analyzes the capital raising activity in domestic markets of firms that raise capital through security issues in public markets abroad at some point during the 1991-2005 period. The first variabledisplayed is the average across these firms of the amount raised in domestic capital markets per year before and after their first capital raising abroad. The second variable displayed is the average across thesefirms of the ratio of the amount raised in domestic capital markets per firm to the total amount raised in these markets per year before and after their first capital raising abroad. The third variable displayed isthe average across these firms of the amount raised in domestic capital markets divided by total assets before raising capital per year before and after their first capital raising abroad. For firms with multiplesecurity issues in the same year the amount raised divided by assets before raising capital is calculated as the weighted average of the ratio of amount raised to total assets for each issue in the year, weightedby the amount raised per issue. For the three variables years without capital raising activity are assigned a zero. The test reported tests the null hypothesis that the mean of the variables is the same before andafter the first capital raising abroad. Issues abroad are those carried out in a public market outside of the firm's home country. Equity issues include initial public offerings (IPOs) and seasoned equity offerings(SEOs). Debt issues include convertible and non-convertible debt issues and preferred shares issues. Economies are classified as developed or developing based on income level in 2005. Developed economiescorrespond to high-income economies according to the World Bank classification. Developing economies correspond to low- and middle-income economies according to the World Bank classification. SeeAppendix Table 1 for a list of the economies included in each income group. *, **, *** mean significance at ten, five, and one percent, respectively.
Equity issues Debt issues All capital raisings
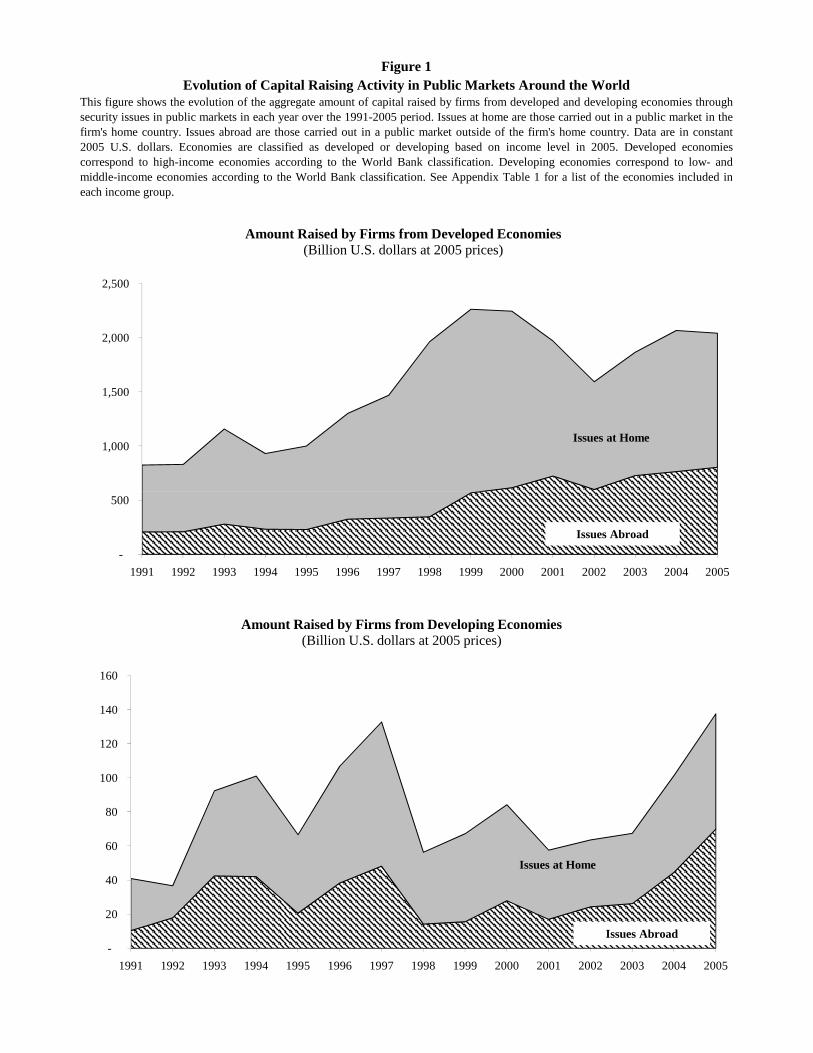
Figure 1Evolution of Capital Raising Activity in Public Markets Around the World
This figure shows the evolution of the aggregate amount of capital raised by firms from developed and developing economies throughsecurity issues in public markets in each year over the 1991-2005 period. Issues at home are those carried out in a public market in thefirm's home country. Issues abroad are those carried out in a public market outside of the firm's home country. Data are in constant2005 U.S. dollars. Economies are classified as developed or developing based on income level in 2005. Developed economiescorrespond to high-income economies according to the World Bank classification. Developing economies correspond to low- andmiddle-income economies according to the World Bank classification. See Appendix Table 1 for a list of the economies included ineach income group.
1,000
1,500
2,000
2,500
Amount Raised by Firms from Developed Economies(Billion U.S. dollars at 2005 prices)
Issues at Home
-
500
1991 1992 1993 1994 1995 1996 1997 1998 1999 2000 2001 2002 2003 2004 2005
Issues Abroad
-
20
40
60
80
100
120
140
160
1991 1992 1993 1994 1995 1996 1997 1998 1999 2000 2001 2002 2003 2004 2005
Amount Raised by Firms from Developing Economies(Billion U.S. dollars at 2005 prices)
Issues at Home
Issues Abroad

Figure 2Degree of Internationalization of Capital Markets
This figure shows the aggregate amount of capital raised abroad as a percentage of the total amount of capital raised by firms fromdeveloped and developing economies through security issues in public markets for different types of issues. Issues abroad are thosecarried out in a public market outside of the firm's home country. Economies are classified as developed or developing based on incomelevel in 2005. Developed economies correspond to high-income economies according to the World Bank classification. Developingeconomies correspond to low- and middle-income economies according to the World Bank classification. See Appendix Table 1 for a listof the economies included in each income group.
15.0%
36.1%
59.4%
20%
40%
60%
80%Equity Issues
(Amount Raised Abroad/Total Amount Raised)
9.0% 6.8% 8.6%
0%Developed Economies Developing Economies
27.0%
44.0%
33.9%
28.8%
46.1%43.5%
0%
10%
20%
30%
40%
50%
60%
Developed Economies Developing Economies
Debt Issues(Amount Raised Abroad/Total Amount Raised)
1995 2000 2005
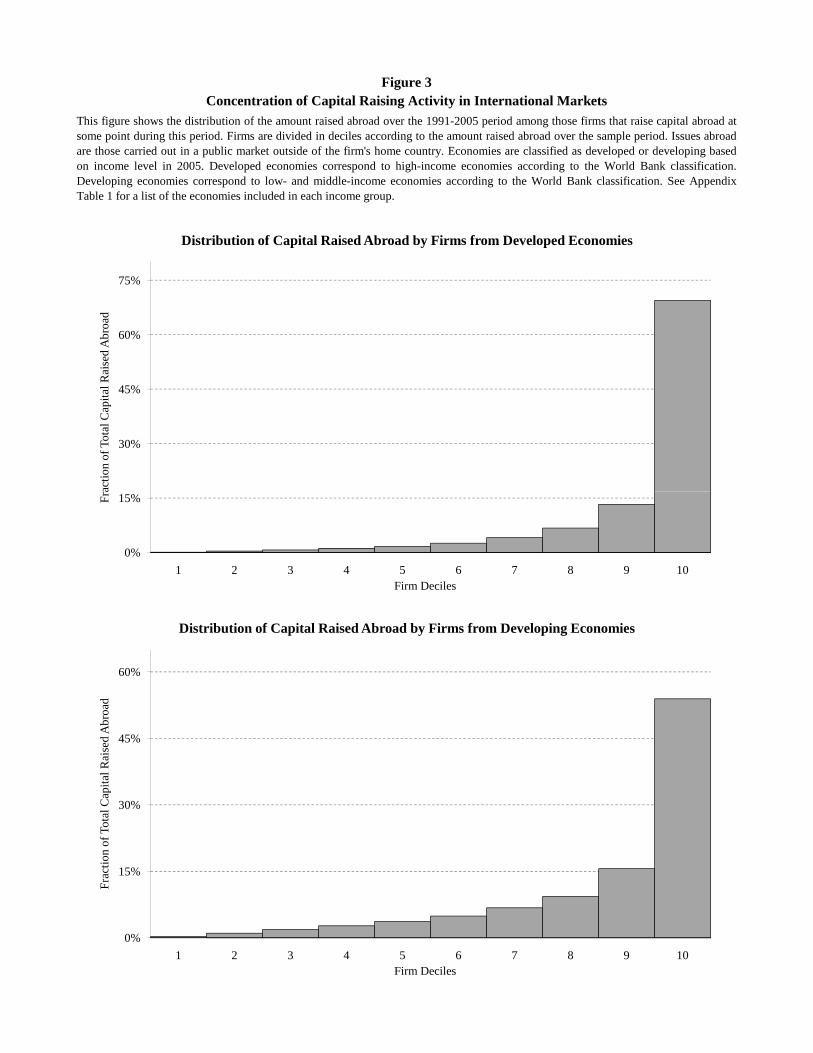
Figure 3Concentration of Capital Raising Activity in International Markets
This figure shows the distribution of the amount raised abroad over the 1991-2005 period among those firms that raise capital abroad atsome point during this period. Firms are divided in deciles according to the amount raised abroad over the sample period. Issues abroadare those carried out in a public market outside of the firm's home country. Economies are classified as developed or developing basedon income level in 2005. Developed economies correspond to high-income economies according to the World Bank classification.Developing economies correspond to low- and middle-income economies according to the World Bank classification. See AppendixTable 1 for a list of the economies included in each income group.
30%
45%
60%
75%
actio
n of
Tot
al C
apita
l Rai
sed
Abr
oad
Distribution of Capital Raised Abroad by Firms from Developed Economies
0%
15%
1 2 3 4 5 6 7 8 9 10
Fra
Firm Deciles
0%
15%
30%
45%
60%
1 2 3 4 5 6 7 8 9 10
Frac
tion
of T
otal
Cap
ital R
aise
d A
broa
d
Firm Deciles
Distribution of Capital Raised Abroad by Firms from Developing Economies
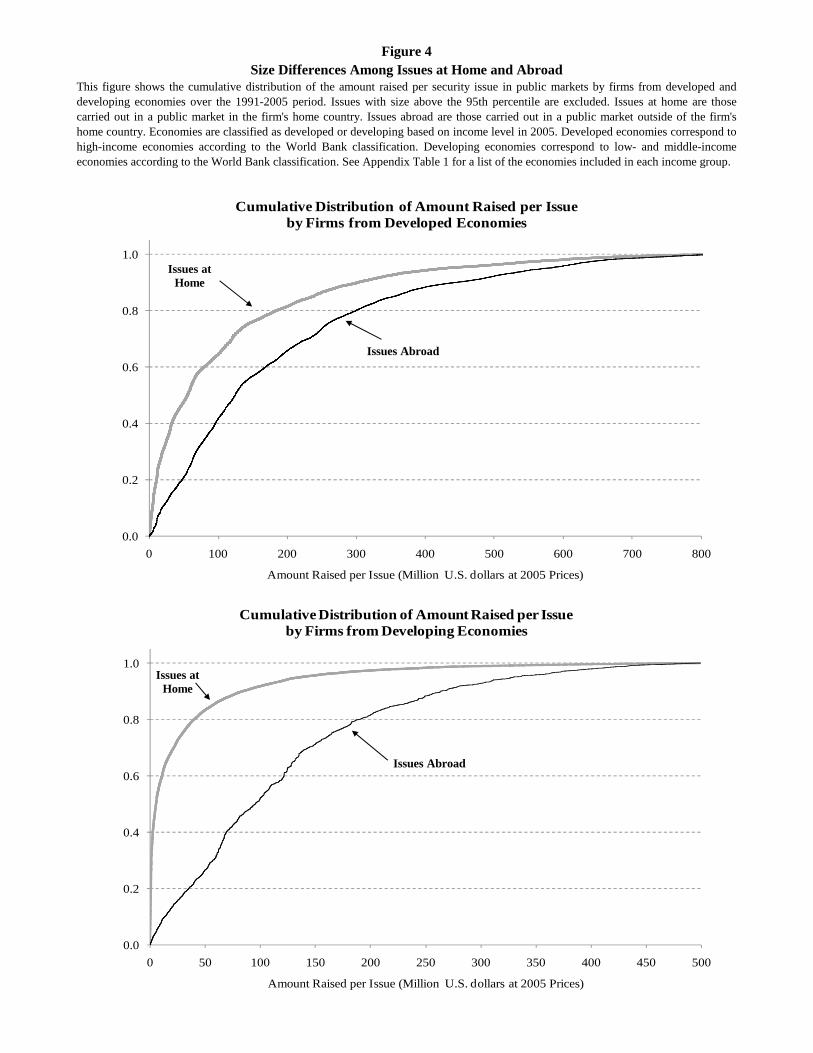
Figure 4Size Differences Among Issues at Home and Abroad
This figure shows the cumulative distribution of the amount raised per security issue in public markets by firms from developed anddeveloping economies over the 1991-2005 period. Issues with size above the 95th percentile are excluded. Issues at home are thosecarried out in a public market in the firm's home country. Issues abroad are those carried out in a public market outside of the firm'shome country. Economies are classified as developed or developing based on income level in 2005. Developed economies correspond tohigh-income economies according to the World Bank classification. Developing economies correspond to low- and middle-incomeeconomies according to the World Bank classification. See Appendix Table 1 for a list of the economies included in each income group.
0.2
0.4
0.6
0.8
1.0
Cumulative Distribution of Amount Raised per Issue by Firms from Developed Economies
Issues at Home
Issues Abroad
0.0
0.2
0.4
0.6
0.8
1.0
0 50 100 150 200 250 300 350 400 450 500
Amount Raised per Issue (Million U S dollars at 2005 Prices)
Cumulative Distribution of Amount Raised per Issue by Firms from Developing Economies
0.00 100 200 300 400 500 600 700 800
Amount Raised per Issue (Million U.S. dollars at 2005 Prices)
Issues at Home
Issues Abroad
Amount Raised per Issue (Million U.S. dollars at 2005 Prices)
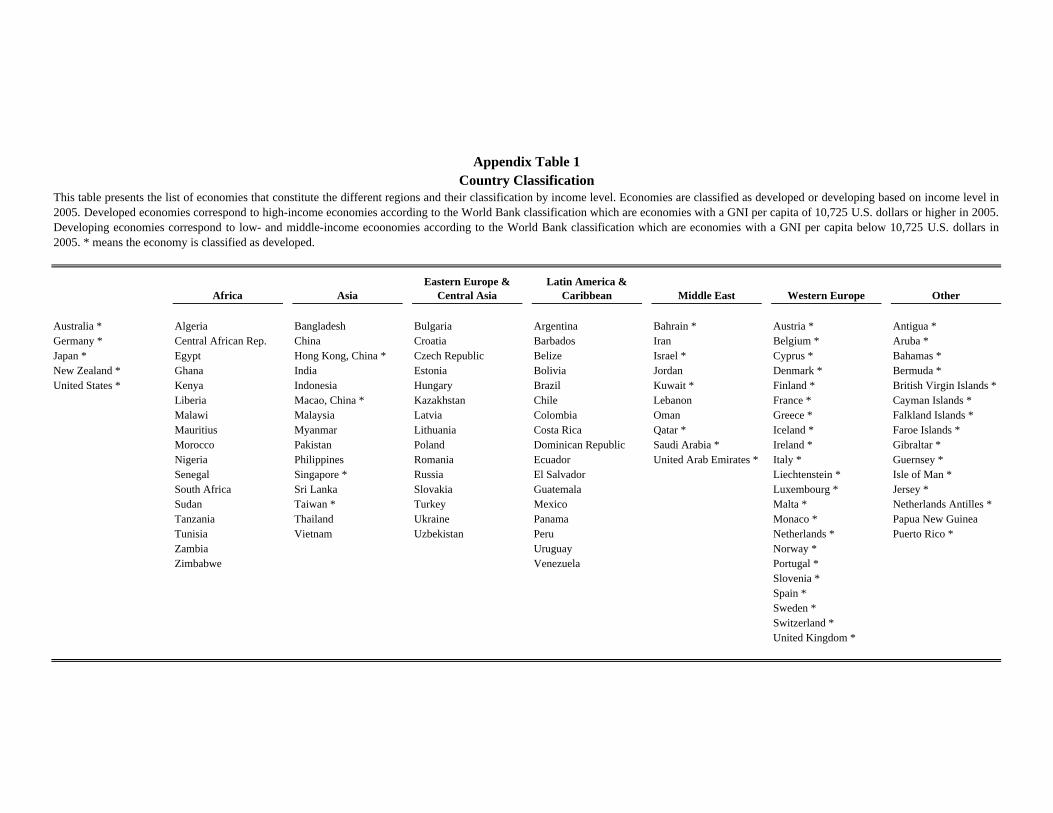
Africa AsiaEastern Europe &
Central AsiaLatin America &
Caribbean Middle East Western Europe Other
Australia * Algeria Bangladesh Bulgaria Argentina Bahrain * Austria * Antigua *Germany * Central African Rep. China Croatia Barbados Iran Belgium * Aruba *Japan * Egypt Hong Kong, China * Czech Republic Belize Israel * Cyprus * Bahamas *New Zealand * Ghana India Estonia Bolivia Jordan Denmark * Bermuda *United States * Kenya Indonesia Hungary Brazil Kuwait * Finland * British Virgin Islands *
Liberia Macao, China * Kazakhstan Chile Lebanon France * Cayman Islands *Malawi Malaysia Latvia Colombia Oman Greece * Falkland Islands *Mauritius Myanmar Lithuania Costa Rica Qatar * Iceland * Faroe Islands *Morocco Pakistan Poland Dominican Republic Saudi Arabia * Ireland * Gibraltar *Nigeria Philippines Romania Ecuador United Arab Emirates * Italy * Guernsey *Senegal Singapore * Russia El Salvador Liechtenstein * Isle of Man *South Africa Sri Lanka Slovakia Guatemala Luxembourg * Jersey *Sudan Taiwan * Turkey Mexico Malta * Netherlands Antilles *Tanzania Thailand Ukraine Panama Monaco * Papua New GuineaTunisia Vietnam Uzbekistan Peru Netherlands * Puerto Rico *Zambia Uruguay Norway *Zimbabwe Venezuela Portugal *
Slovenia *Spain *Sweden *Switzerland *United Kingdom *
Appendix Table 1Country Classification
This table presents the list of economies that constitute the different regions and their classification by income level. Economies are classified as developed or developing based on income level in2005. Developed economies correspond to high-income economies according to the World Bank classification which are economies with a GNI per capita of 10,725 U.S. dollars or higher in 2005.Developing economies correspond to low- and middle-income ecoonomies according to the World Bank classification which are economies with a GNI per capita below 10,725 U.S. dollars in2005. * means the economy is classified as developed.

Number % of total Number % of totalGermany 10,906 6.5% 1,306 2.8%Japan 10,871 6.5% 4,026 8.8%United States 68,121 40.4% 11,852 25.8%
Africa 431 0.3% 274 0.6%Asia 18,668 11.1% 12,482 27.2%Australia & New Zealand 4,981 3.0% 2,330 5.1%Eastern Europe & Central Asia 649 0.4% 360 0.8%Latin America & Caribbean 13,591 8.1% 2,917 6.3%Middle East 666 0.4% 248 0.5%Western Europe 36,917 21.9% 9,634 21.0%Other 2,713 1.6% 540 1.2%
Total 168,514 45,969
Developed economies 141,833 84.2% 32,989 71.8%
Developing economies 26,681 15.8% 12,980 28.2%
This table shows the number of observations and firms from each country/region included in ourdataset on capital raising activity. The dataset includes only security issues by firms in public markets. Each observation corresponds to a security issue. Data cover the period 1991-2005. Economies areclassified as developed or developing based on income level in 2005. Developed economiescorrespond to high-income economies according to the World Bank classification. Developingeconomies correspond to low- and middle-income economies according to the World Bankclassification. See Appendix Table 1 for a list of the economies included in each region and incomegroup.
Appendix Table 2Data on Capital Raisings - Data Coverage
Observations Firms
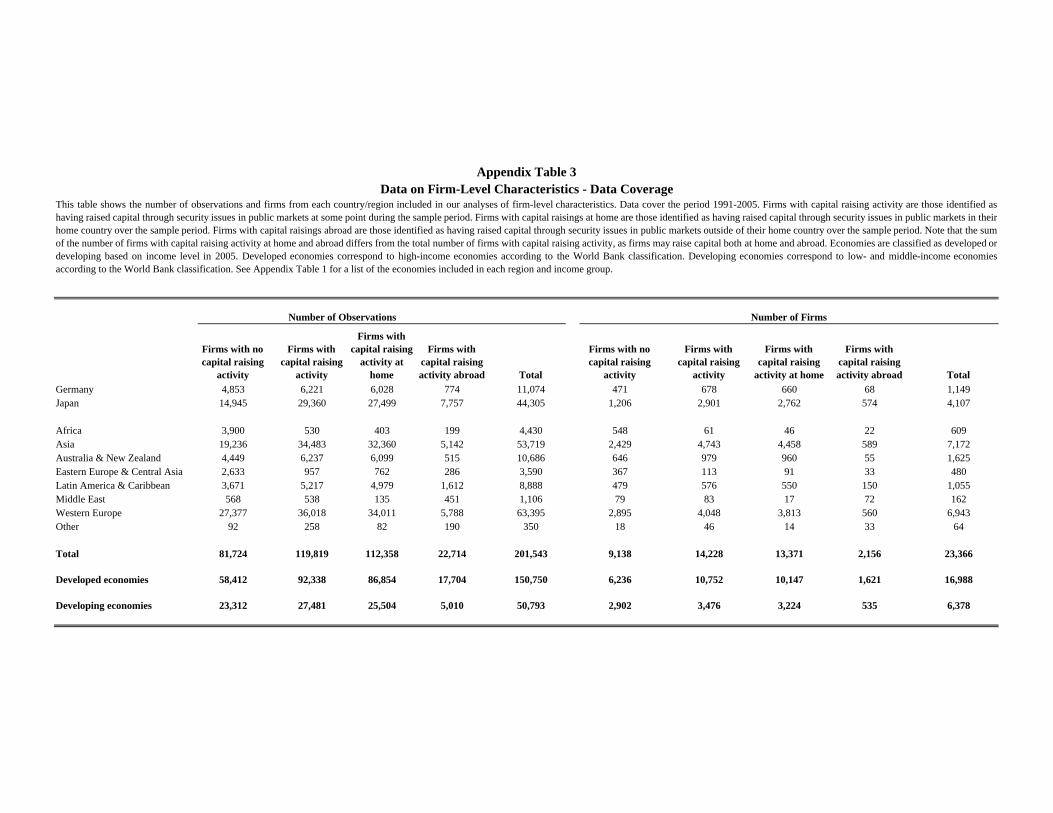
Firms with no capital raising
activity
Firms with capital raising
activity
Firms with capital raising
activity at home
Firms with capital raising activity abroad Total
Firms with no capital raising
activity
Firms with capital raising
activity
Firms with capital raising
activity at home
Firms with capital raising activity abroad Total
Germany 4,853 6,221 6,028 774 11,074 471 678 660 68 1,149Japan 14,945 29,360 27,499 7,757 44,305 1,206 2,901 2,762 574 4,107
Africa 3,900 530 403 199 4,430 548 61 46 22 609Asia 19,236 34,483 32,360 5,142 53,719 2,429 4,743 4,458 589 7,172Australia & New Zealand 4,449 6,237 6,099 515 10,686 646 979 960 55 1,625Eastern Europe & Central Asia 2,633 957 762 286 3,590 367 113 91 33 480Latin America & Caribbean 3,671 5,217 4,979 1,612 8,888 479 576 550 150 1,055Middle East 568 538 135 451 1,106 79 83 17 72 162Western Europe 27,377 36,018 34,011 5,788 63,395 2,895 4,048 3,813 560 6,943Other 92 258 82 190 350 18 46 14 33 64
Total 81,724 119,819 112,358 22,714 201,543 9,138 14,228 13,371 2,156 23,366
Developed economies 58,412 92,338 86,854 17,704 150,750 6,236 10,752 10,147 1,621 16,988
Developing economies 23,312 27,481 25,504 5,010 50,793 2,902 3,476 3,224 535 6,378
This table shows the number of observations and firms from each country/region included in our analyses of firm-level characteristics. Data cover the period 1991-2005. Firms with capital raising activity are those identified ashaving raised capital through security issues in public markets at some point during the sample period. Firms with capital raisings at home are those identified as having raised capital through security issues in public markets in theirhome country over the sample period. Firms with capital raisings abroad are those identified as having raised capital through security issues in public markets outside of their home country over the sample period. Note that the sumof the number of firms with capital raising activity at home and abroad differs from the total number of firms with capital raising activity, as firms may raise capital both at home and abroad. Economies are classified as developed ordeveloping based on income level in 2005. Developed economies correspond to high-income economies according to the World Bank classification. Developing economies correspond to low- and middle-income economiesaccording to the World Bank classification. See Appendix Table 1 for a list of the economies included in each region and income group.
Appendix Table 3Data on Firm-Level Characteristics - Data Coverage
Number of Observations Number of Firms

Series Name Description Source
Amount of capital raised in public markets
Gross proceeds from security issues in public markets by firms in constant 2005 U.S.dollars. Data include only capital raisings by firms. Debt issues include only issues with anoriginal maturity greater than one year. Data exclude debt issued by the public sector(including national, local and regional governments, government agencies, regionalagencies, and non-government agencies), and capital raisings by investment funds,investment companies, and REITs. Data also exclude issues of mortgage-backed securitiesand other asset-backed securities. Amounts are converted to constant 2005 U.S. dollarsfrom data in current U.S. dollars using the U.S. CPI.
SDC Global New Issues Database.
Total assets before raising capital
Total assets at the end of the fiscal quarter prior to issuing securities in public markets incurrent U.S. dollars.
SDC Global New Issues Database.
Total assets (million U.S. dollars)
Total assets at the end of the most recent fiscal year, converted to U.S. dollars using thefiscal year end exchange rate.
Worldscope
Sales (million U.S. dollars) Net sales or revenues, converted to U.S. dollars using the fiscal year end exchange rate. Worldscope
Capital expenditures (million U.S. dollars)
Funds used to acquire fixed assets other than those associated with acquisitions. It includes,but is not restricted to, additions to property, plant and equipment and investments inmachinery and equipment. Data are converted to U.S. dollars using the fiscal year endexchange rate.
Worldscope
R&D expenditures (million U.S. dollars)
All direct and indirect costs related to the creation and development of new processes,techniques, applications and products with commercial possibilities. Data are converted toU.S. dollars using the fiscal year end exchange rate.
Worldscope
Return on assets Sum of net income (before preferred dividends) and interest expenses on capitalized debt(after tax), over previous year's total assets.
Worldscope
Return on equity Net income before preferred dividends minus preferred dividend requirement, overprevious year's common equity.
Worldscope
Total debt Interest bearing and capitalized lease obligations. It is the sum of long and short term debt. Worldscope
Short term debt Portion of debt payable within one year including current portion of long term debt andsinking fund requirements of preferred stock or debentures.
Worldscope
Foreign sales Sales generated from operations in foreign countries. Worldscope
Tobin's q Ratio of market value of a firm's assets to their replacement cost, at the end of the mostrecent fiscal year. Market value of assets is calculated as the book value of debt, computedas book value of assets minus book value of equity, plus market capitalization of equity.The replacement value of assets is proxied by the book value of assets.
Worldscope
Appendix Table 4Series Description and Data Sources
This table shows the description of the data used and their sources.


![]Three raisings from the dead vol 2](https://static.fdocuments.net/doc/165x107/5a6493ac7f8b9a76568b4b91/three-raisings-from-the-dead-vol-2.jpg)