
Patterns of diversity and adaptation in Glomeromycota from three prairie grasslands
15
Patterns of diversity and adaptation in Glomeromycota from three prairie grasslands BAOMING JI,* 1 CATHERINE A. GEHRING,* GAIL W. T. WILSON, † R. M. MILLER, ‡ LLUVIA FLORES-RENTER IA* and NANCY COLLINS JOHNSON* *Department of Biological Sciences, Northern Arizona University, Flagstaff, AZ 86011, USA, †Department of Natural Resource Ecology & Management, Oklahoma State University, Stillwater, OK 74078, USA, ‡Biosciences Division, Argonne National Laboratory, Argonne, IL 60439, USA Abstract Arbuscular mycorrhizal (AM) fungi are widespread root symbionts that often improve the fitness of their plant hosts. We tested whether local adaptation in mycorrhizal sym- bioses would shape the community structure of these root symbionts in a way that maximizes their symbiotic functioning. We grew a native prairie grass (Andropogon gerardii) with all possible combinations of soils and AM fungal inocula from three dif- ferent prairies that varied in soil characteristics and disturbance history (two native prairie remnants and one recently restored). We identified the AM fungi colonizing A. gerardii roots using PCR amplification and cloning of the small subunit rRNA gene. We observed 13 operational taxonomic units (OTUs) belonging to six genera in three families. Taxonomic richness was higher in the restored than the native prairies with one member of the Gigaspora dominating the roots of plants grown with inocula from native prairies. Inoculum source and the soil environment influenced the composition of AM fungi that colonized plant roots. Correspondingly, host plants and AM fungi responded significantly to the soil–inoculum combinations such that home fungi often had the highest fitness and provided the greatest benefit to A. gerardii. Similar patterns were observed within the soil–inoculum combinations originating from two native prairies, where five sequence types of a single Gigaspora OTU were virtually the only root colonizers. Our results indicate that indigenous assemblages of AM fungi were adapted to the local soil environment and that this process occurred both at a commu- nity scale and at the scale of fungal sequence types within a dominant OTU. Keywords: arbuscular mycorrhizas, Gigaspora, local adaptation, prairies, reciprocal inoculation Received 29 March 2012; revision received 16 January 2013; accepted 20 January 2013 Introduction Arbuscular mycorrhizas are ancient symbioses between plants and Glomeromycotan fungi that arose simulta- neously with the evolution of land plants (Pirozynski & Malloch 1975; Redecker et al. 2000; Brundrett 2002). An estimated 80% of all plant species form these symbioses (Smith & Read 2008), and they are particularly common in grasslands (Miller 1987; Hartnett & Wilson 2002). The Glomeromycota often appear to have little host spec- ificity because the root systems of individual plants are generally colonized by multiple fungal species, and like- wise, individual fungal clones may colonize multiple plant species across space and time (Fitter 2005; Rosendahl 2008; Helgason & Fitter 2009). Nevertheless, biogeographical studies suggest that the distribution of Glomeromycota is related to the distribution of plant communities and soil properties (Chaudhary et al. 2008; Murray et al. 2010; € Opik et al. 2010). Within grasslands, the species composition of arbuscular mycorrhizal (AM) fungal communities has been related to precipitation, soil properties, plant community composition and time since disturbance (Johnson et al. 1992; Egerton-Warburton et al. Correspondence: Baoming Ji, Fax number: (812) 855-6705; E-mail: [email protected] 1 Present address: Department of Biology, Indiana University, Bloomington, IN 47405, USA © 2013 Blackwell Publishing Ltd Molecular Ecology (2013) 22, 2573–2587 doi: 10.1111/mec.12268
-
Upload
nancy-collins -
Category
Documents
-
view
212 -
download
0
Transcript of Patterns of diversity and adaptation in Glomeromycota from three prairie grasslands

Patterns of diversity and adaptation in Glomeromycotafrom three prairie grasslands
BAOMING JI , * 1 CATHERINE A. GEHRING,* GAIL W. T. WILSON,† R. M. MILLER,‡
LLUVIA FLORES-RENTER�IA* and NANCY COLLINS JOHNSON*
*Department of Biological Sciences, Northern Arizona University, Flagstaff, AZ 86011, USA, †Department of Natural Resource
Ecology & Management, Oklahoma State University, Stillwater, OK 74078, USA, ‡Biosciences Division, Argonne National
Laboratory, Argonne, IL 60439, USA
Abstract
Arbuscular mycorrhizal (AM) fungi are widespread root symbionts that often improve
the fitness of their plant hosts. We tested whether local adaptation in mycorrhizal sym-
bioses would shape the community structure of these root symbionts in a way that
maximizes their symbiotic functioning. We grew a native prairie grass (Andropogongerardii) with all possible combinations of soils and AM fungal inocula from three dif-
ferent prairies that varied in soil characteristics and disturbance history (two native
prairie remnants and one recently restored). We identified the AM fungi colonizing
A. gerardii roots using PCR amplification and cloning of the small subunit rRNA gene.
We observed 13 operational taxonomic units (OTUs) belonging to six genera in three
families. Taxonomic richness was higher in the restored than the native prairies with
one member of the Gigaspora dominating the roots of plants grown with inocula from
native prairies. Inoculum source and the soil environment influenced the composition
of AM fungi that colonized plant roots. Correspondingly, host plants and AM fungi
responded significantly to the soil–inoculum combinations such that home fungi often
had the highest fitness and provided the greatest benefit to A. gerardii. Similar patterns
were observed within the soil–inoculum combinations originating from two native
prairies, where five sequence types of a single Gigaspora OTU were virtually the only
root colonizers. Our results indicate that indigenous assemblages of AM fungi were
adapted to the local soil environment and that this process occurred both at a commu-
nity scale and at the scale of fungal sequence types within a dominant OTU.
Keywords: arbuscular mycorrhizas, Gigaspora, local adaptation, prairies, reciprocal inoculation
Received 29 March 2012; revision received 16 January 2013; accepted 20 January 2013
Introduction
Arbuscular mycorrhizas are ancient symbioses between
plants and Glomeromycotan fungi that arose simulta-
neously with the evolution of land plants (Pirozynski &
Malloch 1975; Redecker et al. 2000; Brundrett 2002). An
estimated 80% of all plant species form these symbioses
(Smith & Read 2008), and they are particularly common
in grasslands (Miller 1987; Hartnett & Wilson 2002).
The Glomeromycota often appear to have little host spec-
ificity because the root systems of individual plants are
generally colonized by multiple fungal species, and like-
wise, individual fungal clones may colonize multiple
plant species across space and time (Fitter 2005;
Rosendahl 2008; Helgason & Fitter 2009). Nevertheless,
biogeographical studies suggest that the distribution of
Glomeromycota is related to the distribution of plant
communities and soil properties (Chaudhary et al. 2008;
Murray et al. 2010; €Opik et al. 2010). Within grasslands,
the species composition of arbuscular mycorrhizal (AM)
fungal communities has been related to precipitation, soil
properties, plant community composition and time since
disturbance (Johnson et al. 1992; Egerton-Warburton et al.
Correspondence: Baoming Ji, Fax number: (812) 855-6705;
E-mail: [email protected] address: Department of Biology, Indiana University,
Bloomington, IN 47405, USA
© 2013 Blackwell Publishing Ltd
Molecular Ecology (2013) 22, 2573–2587 doi: 10.1111/mec.12268

2007; Fitzsimons et al. 2008). Although the structure of
Glomeromycotan communities is often related to plant
community properties, there is not always a strong rela-
tionship between plant and fungal diversity – highly
diverse plant communities may have seemingly depau-
perate AM fungal communities and vice versa (Johnson &
Wedin 1997; Rosendahl & Stukenbrock 2004; Johnson
et al. 2010a). This emphasizes the scale dependency of
ecological patterns involving AM symbioses (Fitzsimons
et al. 2008) and suggests that mycorrhizal diversity needs
to be considered at appropriate taxonomic scales. Studies
demonstrate that functionally important genetic diversity
occurs among isolates of a single species of Glomeromy-
cotan fungi (Munkvold et al. 2004; Koch et al. 2006) and
even among nucleotypes within an individual fungal
clone (Angelard et al. 2010; Angelard & Sanders 2011).
Hence, just as McMillan (1959) demonstrated over
50 years ago that considerable ecotypic diversity exists
within species of North American prairie grasses, such
variation may also exist for Glomeromycotan fungi. More
research is needed to link the functional variation in
Glomeromycotan taxa with selection pressures in the
environment.
Soil fertility is likely to be a strong selection pressure
because mycorrhizas are nutritional symbioses in which
photosynthate is traded for soil minerals. The relative
availability of essential soil nutrients, particularly phos-
phorus (P), often determines the degree to which plants
may benefit from mycorrhizas; when P and other soil
nutrients are in luxury supply, plants have little to gain
from AM symbioses (Mosse 1973; Bethlenfalvay et al.
1982). In contrast, AM fungi are obligate biotrophs
whose existence requires association with living plants
regardless of soil fertility levels. This asymmetry gener-
ates a continuum of mycorrhizal functioning from
mutualism to parasitism (Johnson et al. 1997). Geo-
graphic isolates of Glomeromycota have been shown to
contribute more positively to host performance in the
environment in which they evolved when they are sub-
jected to water stress (Stahl & Smith 1984; Bethlenfalvay
et al. 1989) or nutrient limitation (Johnson et al. 2010b);
however, there is a great deal of variation in plant
responses to native and exotic fungi (Lambert et al.
1980; Klironomos 2003; Ji et al. 2010). Functional differ-
ences among geographic isolates of AM fungi probably
occur because of fine-scale local adaptation to both the
soil environment and to the plant genotypes in the
landscape. Klironomos (2003) showed that extreme
responses of mutualism and parasitism were more com-
mon in local plant–fungal pairs compared with foreign
pairs. This suggests that both positive and negative
feedbacks between plants and Glomeromycota may be
important forces in structuring communities (Bever
2002; Bever et al. 2002). More studies are needed to
determine the mechanisms that generate the range in
symbiotic performance among ecotypes of AM fungi
and also determine whether there are dominant AM
fungi within the community that are responsible for the
functional differences among communities.
The tallgrass prairie is one of the most critically
endangered ecosystems in North America; more than
99% of the tallgrass prairie once existing east and north
of the Missouri River has been destroyed (Samson &
Knopf 1994). Of the original Illinois prairie (over
85 000 km2), <1 km2 of high-quality remnant prairie
remains (Robertson et al. 1997). The undesired conse-
quences of converting diverse prairies into crop mono-
cultures have inspired efforts to restore tallgrass prairie
communities on decommissioned agricultural lands.
Native tallgrass prairie plants are generally highly
dependent upon AM symbioses (Wilson & Hartnett
1998), and there is evidence that conversion of grass-
lands to cropland reduces the diversity of Glomeromy-
cota and alters their species composition (Helgason
et al. 1998; Fitzsimons et al. 2008; Gao & Guo 2010;
Verbruggen et al. 2010). Furthermore, re-introduction of
AM fungal communities from native prairie may
increase the establishment of native plant species dur-
ing restoration efforts (Bever et al. 2003). Little is known
about whether the geographic origin of introduced
fungi is important to the success of prairie restorations,
but there is concern that introduction of exotic AM fun-
gal inoculum may have unexpected detrimental effects
(Schwartz et al. 2006).
Andropogon gerardii, a long-lived dominant grass of
native prairie, may be expected to select for rhizosphere
communities of AM fungi, which form symbioses that
maximize mutualistic benefits in nutrient-limited soils
and minimize parasitism in nutrient-rich soils. This
hypothesis was supported in a reciprocal inoculation
study that compared the mycorrhizal functioning of
native and exotic combinations of plant ecotypes, fungal
communities and soils across three prairies, two that
were never tilled and one that had been restored from
agriculture nearly 30 years ago (Johnson et al. 2010b).
Soils of the three sites varied in texture, pH and nutri-
ent availability (Table 1). The 2010 study manipulated
whole communities of AM fungi but it did not identify
the individual species of fungi involved in the symbio-
ses. This study identifies AM fungi inside the plant
roots from that experiment and links the species com-
position of these intraradical fungal communities with
their symbiotic functioning both at a community scale
and at the scale of fungal sequence types within a dom-
inant species. Our current study tested the following
hypotheses:
H1. The community composition of AM fungi in the
roots of our experimental A. gerardii plants is influenced
© 2013 Blackwell Publishing Ltd
2574 B. J I ET AL.

by both inoculum source and the background soil
environment in which the plant is grown;
H2. Glomeromycotan diversity is lower in the roots of
A. gerardii plants grown in restored prairie compared to
undisturbed prairie;
H3. Glomeromycotan fungi have the highest fitness
and provide the greatest benefit to A. gerardii when they
are grown in the soils where they evolved. We expect
this pattern to exist at both a community scale and at
the scale of geographic sequence types within an indi-
vidual fungal species.
Materials and methods
Study sites
Soils and AM fungal inocula were collected from three
sites: two native prairie remnants, Cedar Creek Ecosys-
tem Science Reserve in Minnesota and Konza Prairie
Biological Station in Kansas, and a restored prairie at
Fermi National Laboratory in Illinois (Table 1). All
available evidence suggests that the prairies at Cedar
Creek and Konza have remained untilled since the last
glaciation. The Fermi prairie was cultivated and man-
aged using conventional agricultural methods from the
late 1840s through 1975; and in 1975, a reconstructed
prairie was established using locally collected seeds of
prairie plants growing on similar soil types. Soil fertility
at the three sites is very different; Cedar Creek soil has
the highest available P and lowest available soil nitro-
gen (N), Konza has the highest available N, and both
plant-available N and P are very low in the Fermi soil
used in this study (Table 1).
Experimental design
Unlike the full factorial design used in our previous
study (Johnson et al. 2010b) which reciprocally crossed
soil source, AM fungal inoculum source and Andropogon
gerardii ecotype across the three prairies, this study held
plant ecotype constant and only investigated soil source
and inoculum source effects on the AM fungal commu-
nities inside the roots of the Fermi ecotype of A. gerardii.
Our previous study showed that although interactions
between soil and plant ecotype, and inoculum and plant
ecotype influenced the formation of arbuscules and
mycorrhizal growth response (MGR), plant ecotype did
not have a strong influence on overall plant–fungal
interactions. Therefore, only one of the plant ecotypes
was examined in this study. We chose the Fermi eco-
type because it was more successful in biomass produc-
tion than the other two ecotypes and thus would
provide the most abundant roots for our extensive
molecular analysis. In this study, the two-way factorial
design resulted in a total of nine treatment combinations
(three soil sources by three inoculum sources), each
being replicated three times.
Greenhouse methods
Seeds of A. gerardii ecotypes from Fermi were pregermi-
nated, and 14-day-old seedlings were transplanted into
square plastic pots (14 cm tall by 11 cm wide), one
seedling per pot. Each pot was filled with 1 kg of steril-
ized soils from the three prairies. Soils were steam
pasteurized at 80 °C for 2 h to eliminate biotic
communities but retain abiotic soil traits. Communities
of AM fungi and other soil organisms were added back
in a controlled manner by inoculating pots with 20 g of
living soil (including small root fragments) from each of
the sites in a reciprocal design. These soils contained
diverse communities of AM fungal spores (Table S1,
Supporting information) as well as fragments of hyphae
and mycorrhizal roots, all of which function as fungal
propagules. Inoculum soils were collected fresh from
each of the three sites and added directly below the
Table 1 Location, climate and soil characteristics of the three prairie sites used for the reciprocal inoculation experiment (Johnson
et al.2010b) that generated the plant roots used in this study. The sites were either native prairie that had never been tilled (Cedar
Creek and Konza) or prairie that had been restored from an agricultural field (Fermi)
Site Coordinates Soil texture pH OM (%) PO4-P (lg/g) NH4-N (lg/g) NO3-N (lg/g) Soil a(N:P)*
Cedar Creek 45°24′N Sandy loam 5.3 1.4 46.5 5.1 4.9 0.2
93°12′WKonza 39°05′N Silty clay loam 6.2 5.7 18.5 13.4 8.2 1.2
96°18′WFermi 41°50′N Silt loam 7.6 3.3 11.5 7.2 5.8 1.1
88°15′W
*Soil a(N:P) ratio is the ratio of mineral N (NH4-N+NO3-N) divided by available soil P.
Soil pH was measured from a 1:1 soil/water paste; soil organic matter was determined by direct combustion; available P was
measured using the Bray-1 method; inorganic N was extracted using 2 M KCl and analysed using cadmium reduction/colorimetry.
Kansas State University Soil Testing Laboratory (Manhattan, KS, USA) conducted all of the soil analyses.
© 2013 Blackwell Publishing Ltd
DIVERSITY AND ADAPTATION IN SYMBIOTIC FUNGI 2575

seedling roots during transplantation. Differences in the
fertility of the three types of soil inocula were elimi-
nated by adding 20 g of additional sterilized soil from
the two sites that were not used in the inoculum treat-
ment. Additional pots were established using only ster-
ile soil to create nonmycorrhizal (NM) controls for each
plant and soil combination. Each of the nine treatment
combinations was replicated three times for a total of 27
pots. All pots were amended with 60-ml nonsterile soil
sievate, 20 mL from each of the three sites. The sievates
were prepared by blending soil/water in a 1:2 ratio and
passing the slurry through a 38-lm sieve. The relatively
large AM fungal spores and hyphae were trapped on
the sieve, while smaller organisms pass through, allow-
ing for the addition of the majority of soil microbes
while excluding AM fungi.
Plants were grown for 14 weeks with full sunlight
during the summer in a glasshouse (20–25 °C) at Kan-
sas State University, Manhattan, Kansas, USA. Plants
were watered daily to field capacity and received no
fertilizer throughout the study. At harvest, roots were
removed from the soil and gently washed. A subset of
the roots were stained with trypan blue and scored for
AM colonization using the magnified gridline intersect
method (McGonigle et al. 1990). This method uses a
compound microscope (200–400X) to quantify cortical
root length colonized by fungal structures (hyphae, ves-
icles, arbuscules and coils). An additional subset of
roots were placed in plastic bags and stored at �20 °Cfor subsequent molecular analyses. The remaining roots
were used to measure total plant dry weight and cor-
rect for the fresh root subsamples that were analysed
for mycorrhizas. External AM hyphal lengths were
determined by extracting the hyphae from 5 g of soil,
followed by collecting the hyphae on a membrane filter,
staining with trypan blue and quantifying hyphal
length by the gridline intercept method (Miller et al.
1995). Total oven-dried plant weight was measured and
the MGR of plants was calculated as ln (AM/NM)
where AM is the total dry weight of mycorrhizal plants
and NM is the mean total dry weight of the plants
receiving no live inoculum and grown in the same
background soil as the AM plants. Positive MGR values
indicate mutualistic relationships, and negative values
indicate parasitic relationships. Shoot tissue N and P
concentrations were determined after wet digestion
with sulphuric acid and hydrogen peroxide of dried
plant material was ground through a 20-lm mesh. P
concentrations were determined on the digest using the
molybdate-blue method (Murphy & Riley 1962), and
nitrogen concentrations were determined by a Kjeldahl
method with a rapid-flow autoanalyser. All chemical
analyses were conducted at the Kansas State University
Soil Testing Laboratory (Manhattan, KS, USA).
Molecular methods
The AM fungal communities colonizing the roots of
A. gerardii were determined through PCR amplification
and sequencing of a portion of the small subunit ribo-
somal gene (SSU rDNA). A 25 mg (fresh weight) sam-
ple of the fine roots of each plant was obtained by
pooling small pieces of roots (2–3 cm) from throughout
the root system. Roots were cleaned using distilled
water, and DNA was extracted from them using the
UltraClean Soil DNA Isolation Kit (MO BIO Laborato-
ries, Carlsbad, California, USA) following the manufac-
turer’s instructions. Roots of the NM plants inoculated
with sterile soil were not colonized by AM fungi (data
not shown) and were thus not included in our DNA
analyses.
Partial SSU rDNA was amplified using the nested
PCR protocol and primers developed by Lee et al.
(2008). These primers (AML1 and AML2) were chosen
because they have better specificity and coverage of
AM fungi than the more widely used NS31-AM1 pri-
mer pair (Helgason et al. 1998), but they amplify a
region that overlaps with that amplified by NS31-AM1,
thereby allowing us to utilize the large number of
sequences currently found in the GenBank database for
identification. Despite the improved selectivity of these
primers, our initial testing routinely revealed non-AM
fungal amplicons in PCR products, and these contami-
nant sequences were not specific to any particular soil–
inoculum treatment group. To reduce the amplification
of non-AM fungal DNA, we searched for a restriction
enzyme that cuts the AML1-AML2 region of common
contaminants found in our samples but not of AM
fungi. Of hundreds of commercially available enzymes
tested, BsmI was selected because it was able to effec-
tively eliminate most of the fungal contaminants. Our
intensive testing found that no AM fungal sequence
available in GenBank was cut by this enzyme.
A 10-fold dilution of extracted DNA was first ampli-
fied using the general eukaryotic primers NS1 and NS4
(White et al. 1990). The PCR product was then digested
with the restriction enzyme BsmI. The second-step PCR
was performed using a 10-fold dilution of the digest
and the primers AML1 and AML2. Second-step PCR
products were visualized on an agarose gel, and bands
of ~800 bp, indicating amplification by AML1 and
AML2, were cut out and purified using a QIAquick gel
extraction kit (QIAGEN, Valencia, CA, USA) following
the manufacturer’s protocol. Purified DNA was
sequenced using an ABI 3130 DNA analyzer to verify
the presence of AM fungi prior to further cloning and
sequencing. This step was included because of prob-
lems with amplification of non-AM fungi from some
root samples. Purified DNA was cloned into the pDrive
© 2013 Blackwell Publishing Ltd
2576 B. J I ET AL.

cloning vector and transformed into QIAGEN EZ com-
petent cells using QIAGEN PCR cloning kits (QIAGEN,
Valencia, CA, USA). The DNA of a minimum of ten
positive transformants per sample was sequenced using
sequencing primers SP6 and T7 on an ABI 3730 DNA
analyzer. The resulting forward and reverse DNA
sequences were assembled in BioEdit version 7.0.5.3 to
create a consensus sequence for data analysis (Hall
2011).
Sequence analysis
To identify the clone DNA sequences, we compared
them with the GenBank database using a BLASTN search
on the NCBI website (http://www.ncbi.nlm.nih.gov/).
Per cent query coverage, per cent maximum identity
and bit score data were used to identify the closest
match of our sequences to those in GenBank. Only
sequences that were unambiguously identified as AM
fungi were included in the subsequent analysis.
To determine operational taxonomic units (OTUs), we
pooled all individual AM fungal sequences together
and performed a standard OTU analysis using the soft-
ware Mothur (Schloss et al. 2009) and a 97% similarity
to group sequences into OTUs (Helgason et al. 1998).
We then selected one sequence to represent each OTU
and aligned these representative sequences together
with reference sequences of all major Glomeromycota
clades using the ClustalX algorithm in BioEdit. All ref-
erence sequences were chosen from Kr€uger et al. (2012)
with one exception. The sequences representing Gigas-
pora margarita were much shorter than other sequences
and therefore were replaced by more appropriate
sequences from GenBank (accession numbers AJ852603.
1 and AJ852604.1). Maximum-likelihood (ML) phyloge-
netic analysis was computed in MEGA version 5 (Tam-
ura et al. 2011) with 1000 bootstrap replicates to
evaluate support of the tree and with Rhodotorula hordea
and Henningsomyces candidus as outgroups to root the
tree. We chose R. hordea and H. candidus as outgroups
because they were used by Kr€uger et al. (2012) for the
same purpose. Parameters for the ML analysis were
estimated using the jModelTest program (Posada 2008).
The best model inferred for our data was GTR+I+G.
Branches corresponding to partitions reproduced in
<50% bootstrap replicates were collapsed. Representa-
tive sequences for each OTU used in the phylogenetic
analysis were deposited in GenBank under accession
numbers JQ837420, JQ837422, JQ837424, JQ837428,
JQ837429, JQ837454 and JX970622-JX970628.
For sequences identified as the OTU Gigaspora 1, our
initial phylogenetic analysis discovered greater genetic
diversity than grouping at 97% similarity could reveal,
so we conducted an additional analysis on these
sequences focusing on a 94-bp hypervariable region of
the SSU rDNA, located between 274 and 368 bp from
the 5′ end of the primer AML1. Hypervariable regions
of the SSU have been used to distinguish among mem-
bers of the Glomeromycota in the past although these
studies emphasized regions outside of the area ampli-
fied by the AML1 and AML2 primers that we used
(Bago et al. 1998; de Souza et al. 2004). We constructed a
maximum-likelihood phylogeny with the model
GTR+I+G calculated as described above. The phyloge-
netic tree was created using 103 sequences of Gigaspora
1 and five additional members of the genus Gigaspora.
The out-group was composed of Scutellospora spinosiss-
ima, Scutellospora gilmorei and Racocetra fulgida.
Statistical analysis
Two-way analysis of variance (ANOVA) was performed
to test for differences in plant and fungal responses and
OTU richness for each soil–inoculum combination, fol-
lowed by Tukey’s HSD tests (P < 0.05) when significant
differences were observed. These analyses were per-
formed using JMP 9.0.2 (SAS Institute Inc. Cary, NC,
USA). To determine whether sampling intensity was
sufficient, species richness was estimated using a first-
order jackknife procedure in PC-ORD 5.10 (McCune &
Mefford 2006), a measure that accounts for species that
occur in only one sampling unit. In addition, an experi-
ment-wide species accumulation curve was generated
using the same program. Data on the community com-
position of AM fungi in the roots of A. gerardii were
visualized using a nonmetric multidimensional scaling
ordination with a Bray–Curtis distance measure in
PC-ORD 5.10 (McCune & Mefford 2006). The influence
of soil source and inoculum source on AM fungal com-
munity composition was tested with a permutation-
based nonparametric multivariate analysis of variance
(PerMANOVA) using relative abundance data, also in
PC-ORD. The main effects of soil source and inoculum
source were analysed together as a two-way factorial
design, followed by pairwise tests of soil or inoculum
combinations when the main effects were significant
(P < 0.05). If significant differences were detected, an
indicator species analysis was conducted in PC-ORD to
determine whether particular species made a greater
contribution to the community differences. Qualita-
tively, similar patterns were observed with presence/
absence data, but only the relative abundance data are
presented. To determine whether sequence types of
Gigaspora 1 differed significantly in A. gerardii roots
inoculated with Cedar Creek versus Konza soil, a mul-
tiresponse permutation procedure (MRPP) was con-
ducted using relative abundance data in PC-ORD,
followed by an indicator species analysis. The ‘A’
© 2013 Blackwell Publishing Ltd
DIVERSITY AND ADAPTATION IN SYMBIOTIC FUNGI 2577

statistic generated by the MRPP is a descriptor of
within-group similarity compared to random expecta-
tion. An A value >0.1 is a strong indicator of a differ-
ence among groups (McCune & Grace 2002).
Results
All 27 Andropogon gerardii root samples yielded positive
PCR product of the expected size (c. 800 bp) after the
second-step PCR. A total of 282 clones were sequenced,
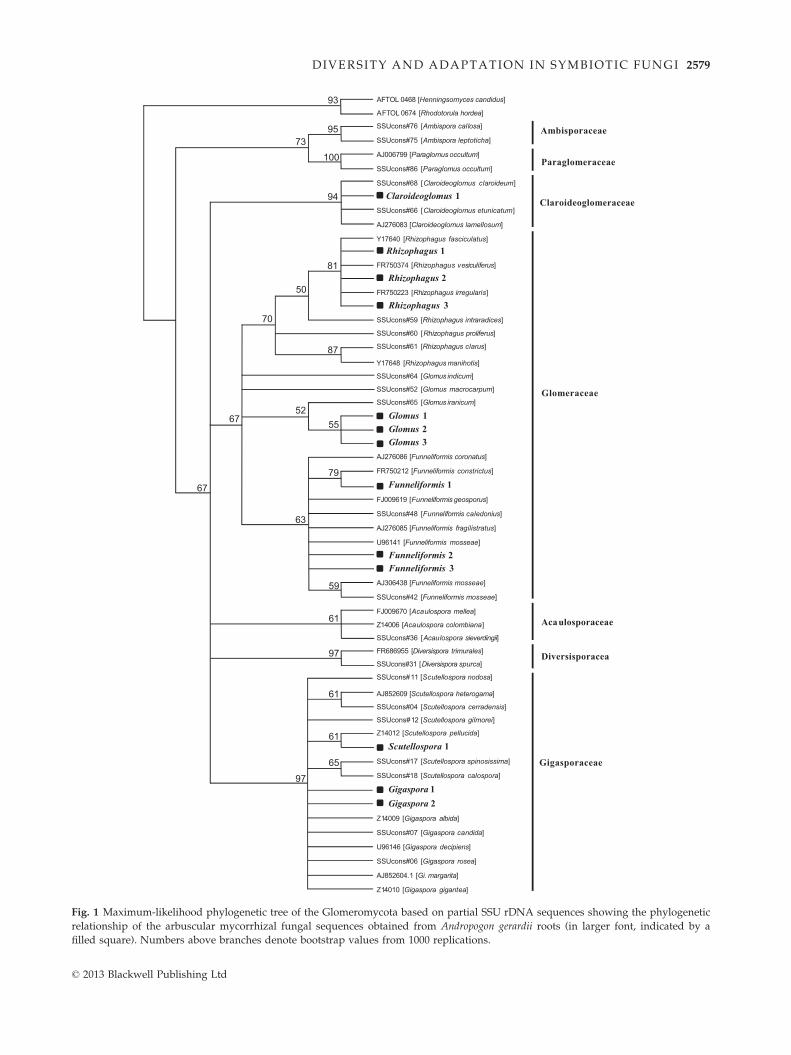
and 231 of them were identified as AM fungi. Our phy-
logenetic analysis of these AM fungal sequences
revealed a total of 13 OTUs (Fig. 1) from three families
of AM fungi, the Gigasporaceae, the Glomeraceae and
the Claroideoglomeraceae. Approximately 63% of the
root samples contained a single OTU, 26% contained
two OTUs, while the remaining samples (11%) con-
tained three OTUs. An experiment-wide species accu-
mulation curve (Fig. S1, Supporting information) and
the first-order jackknife estimates of OTU richness (15.6)
suggested that our sampling captured most of the com-
munity. Ten of the identified OTUs were affiliated with
genera within the families Claroideoglomeraceae: Claro-
ideoglomus (one OTU) or Glomeraceae: Funneliformis
(three OTUs), Glomus (three OTUs) and Rhizophagus
(three OTUs). The other three OTUs belonged to the
family Gigasporaceae: Gigaspora (two OTUs) and Scutel-
lospora (one OTU) (Fig. 1). Overall, Gigaspora was the
most abundant AM fungal genus in this study, with
57% of clones identified as Gigaspora. The AM fungal
spore community in the soil from each site was more
species rich than the AM fungal community observed
in A. gerardi roots inoculated with that soil. All of the
genera observed in roots were also observed as spores,
but eight genera were observed as spores but not in
roots (Acaulospora, Ambispora, Archaeospora, Diversispora,
Entrophospora, Paraglomus, Racocetra and Sclerocystis)
(Table S1, Supporting information).
The richness of OTUs per A. gerardii plant was signif-
icantly influenced by both soil origin (F = 3.85,
P = 0.040) and inoculum source (F = 4.65, P = 0.023),
but there was no significant interaction (F = 2.00,
P = 0.138). The AM fungal communities of A. gerardii
were more species rich when grown in Fermi soil
[mean (SE) = 1.89 (0.18)] or with Fermi inoculum [mean
(SE) = 1.89 (0.18)] than when grown with Cedar Creek
soil [mean (SE) = 1.22 (0.18)] or inoculum [mean
(SE) = 1.11 (0.18)]. Values for Konza soil [mean
(SE) = 1.33 (0.17)] or inoculum [mean (SE) = 1.44 (0.18)]
were intermediate and not significantly different from
either of the other prairies.
The community composition of AM fungi inside
A. gerardii roots was significantly influenced by both
inoculum source (F = 17.821, P = 0.0002) and the soil
type in which plants were grown (F = 4.631, P = 0.003)
(Fig. 2). There was also a significant interaction between
soil type and inoculum source (F = 4.513, P = 0.0002).
Fermi soil was driving the differences in community
composition (Fermi vs. Cedar Creek, t = 2.769
P = 0.0004; Fermi vs. Konza, t = 1.901, P = 0.022; Cedar
Creek vs. Konza, t = 1.249, P = 0.203). This can be seen
in Fig. 2 with the communities generated from Fermi
soil forming a line in the centre of the figure away from
the other communities. There was no significant indica-
tor OTU for soil source.
The three inoculum sources resulted in statistically
distinct AM fungal communities on A. gerardii (Fermi
vs. Cedar Creek, t = 4.819, P = 0.0002; Fermi vs. Konza,
t = 5.105, P = 0.0002; Cedar Creek vs. Konza, t = 1.526,
P = 0.1230; Fig. 2). Glomeromycotan communities in
plants inoculated with AM fungi from Fermi were dom-
inated by members of the Glomeraceae, except for small
amounts of Scutellospora and Claroideoglomus. Glomus 3
[indicator value (IV) = 55.6, P = 0.0042] and Rhizophagus
1 (IV = 43.1, P = .0228) were significant indicators of
Fermi inoculum. In contrast, soils inoculated with AM
fungi from Konza or Cedar Creek were dominated by
members of the genus Gigaspora, particularly Gigaspora
1, except for the Fermi soil–Konza inoculum combina-
tion where Gigaspora 1 was present, but members of the
genus Funneliformis dominated (Fig. 3).
Plants inoculated with Cedar Creek and Konza
inocula and grown in Cedar Creek and Konza soil were
colonized almost entirely by Gigaspora 1, but the phylo-
genetic composition of this OTU differed with inoculum
source (Fig. 4). Although the genus Gigaspora had
strong phylogenetic support (bootstrap value of 70), the
internal resolution at the species level was conflictive as
some described species could not be distinguished
(Fig. 4). This analysis grouped most (>80%) Gigaspora 1
sequences into five sequence types, with bootstrap val-
ues between 53 and 94, although some sequences were
not well resolved (see Fig. S2, Supporting information
for a phylogeny including all sequences and Fig. 4 for a
phylogeny with sequences of each of the five sequence
types compressed into a single node). The relative
abundance of the five sequence types of Gigaspora 1
varied significantly among A. gerardii inoculated with
Cedar Creek versus Konza AM fungi [(A) = 0.1198,
P = 0.029], with Gigaspora 1B a significant indicator of
Konza inoculum (IV = 55.3, P = 0.0480) and Gigaspora
1D an indicator of Cedar Creek inoculum (IV = 87.9,
P = 0.002) (Fig. 4).
Both plants and AM fungi responded significantly to
the soil–inoculum combinations (plant total dry weight,
F = 20.578, P < 0.0001; external hyphae, F = 32.404,
P < 0.0001; AM colonization, F = 13.582, P < 0.0001).
With the exception of the Konza soil and Fermi
© 2013 Blackwell Publishing Ltd
2578 B. J I ET AL.
59
61
63
67
70
67
97
52
50
73
93
95
100
94
81
87
55
79
61
97
61
65
AFTOL 0468 [Henningsomyces candidus]
AFTOL 0674 [Rhodotorula hordea]
SSUcons#76 [Ambispora callosa]
SSUcons#75 [Ambispora leptoticha]
AJ006799 [Paraglomus occultum]
SSUcons#86 [Paraglomus occultum]
SSUcons#68 [Claroideoglomus claroideum]
Claroideoglomus 1SSUcons#66 [Claroideoglomus etunicatum]
AJ276083 [Claroideoglomus lamellosum]
Y17640 [Rhizophagus fasciculatus]
Rhizophagus 1FR750374 [Rhizophagus vesiculiferus]
Rhizophagus 2FR750223 [Rhizophagus irregularis]
Rhizophagus 3SSUcons#59 [Rhizophagus intraradices]
SSUcons#60 [Rhizophagus proliferus]
SSUcons#61 [Rhizophagus clarus]
Y17648 [Rhizophagus manihotis]
SSUcons#64 [Glomus indicum]
SSUcons#52 [Glomus macrocarpum]
SSUcons#65 [Glomus iranicum]
Glomus 1Glomus 2Glomus 3
AJ276086 [Funneliformis coronatus]
FR750212 [Funneliformis constrictus]
Funneliformis 1FJ009619 [Funneliformis geosporus]
SSUcons#48 [Funneliformis caledonius]
AJ276085 [Funneliformis fragilistratus]
U96141 [Funneliformis mosseae]
Funneliformis 2Funneliformis 3
AJ306438 [Funneliformis mosseae]
SSUcons#42 [Funneliformis mosseae]
FJ009670 [Acaulospora mellea]
Z14006 [Acaulospora colombiana]
SSUcons#36 [Acaulospora sieverdingii]
FR686955 [Diversispora trimurales]
SSUcons#31 [Diversispora spurca]
SSUcons#11 [Scutellospora nodosa]
AJ852609 [Scutellospora heterogama]
SSUcons#04 [Scutellospora cerradensis]
SSUcons#12 [Scutellospora gilmorei]
Z14012 [Scutellospora pellucida]
Scutellospora 1SSUcons#17 [Scutellospora spinosissima]
SSUcons#18 [Scutellospora calospora]
Gigaspora 1Gigaspora 2
Z14009 [Gigaspora albida]
SSUcons#07 [Gigaspora candida]
U96146 [Gigaspora decipiens]
SSUcons#06 [Gigaspora rosea]
AJ852604.1 [Gi. margarita]
Z14010 [Gigaspora gigantea]
Ambisporaceae
Paraglomeraceae
Claroideoglomeraceae
Glomeraceae
Acaulosporaceae
Diversisporacea
Gigasporaceae
Fig. 1 Maximum-likelihood phylogenetic tree of the Glomeromycota based on partial SSU rDNA sequences showing the phylogenetic
relationship of the arbuscular mycorrhizal fungal sequences obtained from Andropogon gerardii roots (in larger font, indicated by a
filled square). Numbers above branches denote bootstrap values from 1000 replications.
© 2013 Blackwell Publishing Ltd
DIVERSITY AND ADAPTATION IN SYMBIOTIC FUNGI 2579

inoculum combination, plants tended to grow largest
and AM fungi produced the most external hyphae in
the ‘home’ soil–inoculum combinations (indicated by ‘h’
in Fig. 5a, b). The Glomeraceae-dominated Fermi inocu-
lum produced as much fungal colonization and external
hyphae and was equally beneficial to plants grown in
Konza soil as the Gigaspora-dominated ‘home’ inoculum
from Konza. Even though root colonization was
uniformly high with Fermi inoculum, it was not signifi-
cantly higher than the home soil–inoculum combina-
tions in the other soil types (Fig. 5c).
We were able to compare the symbiotic functioning
of sequence types of Gigaspora 1 because this OTU was
the only taxon identified from roots grown with inocu-
lum from Cedar Creek and Konza, the two native prai-
rie sites. As with the full-scale analysis involving
multiple genera of Glomeromycota, this analysis of
Gigaspora 1 isolates indicates that the home soil–inocu-
lum combination generates the most efficient symbioses.
Home soil–inoculum combinations produced the most
arbuscules, the site of symbiotic exchange between
plants and fungi (Fig. 6a). Furthermore, the MGR of
plants was significantly higher in the home combination
(Fig. 6b). Shoot tissue N:P ratios tended to be greater in
plants colonized by Cedar Creek Gigaspora (Fig. 6c).
Discussion
In support of our first hypothesis, we discovered that
the composition of Glomeromycotan communities
inside our experimental Andropogon gerardii roots is
determined by both the source of the fungal inoculum
NM
DS
axis
2
NMDS axis 1
CC
CK
CF
KC
KK
KF
FC
FK
FF
Fig. 2 An NMS ordination shows that both soil source, repre-
sented by the shape of the symbol, and inoculum source, rep-
resented by the colour of the symbol, influenced arbuscular
mycorrhizal (AM) fungal community composition within Andr-
opogon gerardii roots (F refers to Fermi soil or inoculum,
C refers to Cedar Creek soil or inoculum, and K refers to Kon-
za soil or inoculum). The first letter in the two-letter combina-
tion of the legend refers to soil source and the second letter to
inoculum source. Each point represents the centroid of the AM
fungal community of three replicates per treatment with verti-
cal and horizontal bars depicting 95% confidence limits. The
community of four soil–inoculum combinations (CC, CK, KC
and KK) consisted of the same single operational taxonomic
unit, Gigaspora 1, so no confidence limits are shown. The point
locations on the graph for these four combinations are identi-
cal, but they have been shifted slightly so that all of them are
visible. Axis 1 explains 69.3% of the variation in community
composition, while axis 2 explains 16.2% of the variation.
0
10
20
30
40
50
60
70
80
90
100
CC CK CF KC KK KF FC FK FF
Rela
tive
abu
ndan
ce (%
)
Soil-inoculum site combination
Claroideoglomus 1
Funneliformis 1
Funneliformis 2
Funneliformis 3
Gigaspora 1
Gigaspora 2
Glomus 1
Glomus 2
Glomus 3
Rhizophagus 1
Rhizophagus 2
Rhizophagus 3
Scutellospora 1
Fig. 3 Mean% relative abundance of AM fungal taxa inside roots of Andropogon gerardii in nine reciprocal soil source by inoculum
source treatments. The first letter in the two-letter combination refers to soil source and the second letter to inoculum source. Arbus-
cular mycorrhizal fungal communities of treatments including Konza (K) and Cedar Creek (C) soil or inoculum were dominated by
members of the Gigaspora. In contrast, the presence of Fermi (F) soil or inoculum resulted in communities dominated by members of
the Glomeraceae or mixed Glomeraceae–Gigasporaceae communities.
© 2013 Blackwell Publishing Ltd
2580 B. J I ET AL.

and the soil environment in which the plant was
grown (Fig. 2). It is not surprising that the community
composition of AM fungi differs among three geograph-
ically separated prairies with different soil properties
and climatic conditions. The important insight from this
reciprocal inoculation experiment is that the same fun-
gal inoculum generated three different communities
inside A. gerardii roots grown in three soils with very
different properties (Table 1, Fig. 2). Uibopuu et al.
(2009) found that the same fungal inoculum developed
different intraradical AM fungal communities when
grown with different plant species. These findings
support the hypothesis that plants are not passive
participants in the colonization process, but rather, they
select AM fungal partners in response to different soil
conditions and plant requirements (Reinhardt 2007).
Alternatively, fungal taxa with the highest growth rates
in the environment may come to dominate roots. It is
likely that both plant and fungal factors control the
community composition of AM fungi that we observed
in the roots of A. gerardii grown for 3 months in our
greenhouse experiment.
Our finding of 13 OTUs from just over 230 clones iso-
lated from a single plant species compares well with
the six studies reviewed by Dumbrell et al. (2010a) that
examined 150–400 clones from one to two species of
Gi. rosea SSUcons06 DAOM194757Gi. rosae SSUcons08 DAOM194757Gi. margarita AJ852604.1Gi. margarita AJ852603.1
Gi. gigantea Z14010Gi. gigantea EF014362.1Gi. gigantea AJ852602.1D27A6D27A7D8A7D885D8A4D7A8D17A22D17B18D16B7D13B1D16B5D13B2D2B4
D16B4
D16A1
D27A3D17B17D37A14
D27B1
D17A20
D27A5
S. gilmorei AJ276094S. gilmorei SSUcons#12 FCPC1145R. fulgida SSUcons16, W2993
S. spinosissima SSUcons17, W3485/Att209-44 typeGi. decsipiens U96146.1
Gi. candida SSUcons07 BEG17
Gigaspora 1D
Gigaspora 1E
Gigaspora 1C
Gigaspora 1BGigaspora 1A
Unresolved group
Gigaspora
1
Konza inoculumCedar inoculum
0.005
76
64
9451
53
63
76
49
40
64
Fig. 4 A maximum-likelihood phyloge-
netic tree showing the relationships of
the Gigaspora 1 sequence types relative to
other members of the Gigasporaceae. The
tree is based on sequences of a hyper-
variable region of the SSU rDNA. Most
of the Gigaspora 1 sequences form five
sequence types (Gigaspora 1A–E), with
individual sequences of each sequence
type collapsed into a black triangle with
numbers about branches denoting boot-
strap values higher than 50% based on
1000 replications. A full phylogenetic tree
showing more than 100 sequences of
Gigaspora 1 is shown in Fig. S2. The pie
charts indicate the proportional composi-
tion of clone sequences obtained from
roots inoculated with Konza inoculum
(in grey) and Cedar Creek inoculum (in
black) for the five Gigaspora 1 sequence
types and the rest of Gigaspora 1
sequences (~20%) that could not be
resolved.
© 2013 Blackwell Publishing Ltd
DIVERSITY AND ADAPTATION IN SYMBIOTIC FUNGI 2581

plants and observed an average OTU richness of 14.
Likewise, at the Konza site, six to nine Glomeromycota
OTUs were observed per sampling period in field col-
lected roots of A. gerardii sampled four times during the
year (Jumpponen 2011). Our species accumulation curve
was levelling (Fig. S1, Supporting information), and our
jackknife estimates of species richness were close to our
observed values. Nevertheless, it is possible that we
missed some OTUs in our analysis due to problems
intrinsic to all PCR-based molecular techniques and lim-
itations specific to our PCR primers. PCR is known to
bias towards certain template DNA (Polz & Cavanaugh
Tota
l dry
wei
ght (
g)
0
2
4
6
8
10
12Cedar CreekKonzaFermi
cde
bc ab
bcd
de de
a
bc
de
h
InoculumEx
tern
al h
ypha
e (m
g–1
soil)
0
20
40
60
80
100
120
de
bc bc
b
ede
a
bc
cd
h hh
AM
col
oniz
atio
n (%
)
0
20
40
60
80
100
cd
ab
cd
a
bcdcd
a
bc
d
h hh
h h
Cedar Creek Konza Fermisoil soil soil
(a)
(b)
(c)
Fig. 5 Total dry weight of Andropogon gerardii plants (a), exter-
nal hyphal length of arbuscular mycorrhizal (AM) fungi
(b) and per cent root length colonized by AM fungi (c) in all
possible combinations of soil and fungal inoculum origins.
Values are means � SE (n = 3). Different letters indicate that
the mean values are significantly different (P < 0.05) from each
other according to a Tukey’s HSD test.
Tiss
ue N
: P
0
5
10
15
20
MG
R (l
n A
M/N
M)
–1
0
1
2
3
Arb
uscu
lar c
olon
izat
ion
(%)
0
2
4
6
8 Cedar Creek Konza
Cedar Creeksoil
Konzasoil
ab
c
a
bc
ab
c
d
a
ab abb
Inoculum(a)
(b)
(c)
Fig. 6 Per cent root length colonized by arbuscules (a), mycor-
rhizal growth response of plants (b) and plant tissue N:P ratios
(c) in all combinations of soil and fungal inoculum sources
from Cedar Creek and Konza where only Gigaspora species
were detected in roots. Values are means � SE (n = 3). Differ-
ent letters indicate that the mean values are significantly differ-
ent (P < 0.05) from each other according to the Tukey’s HSD
test.
© 2013 Blackwell Publishing Ltd
2582 B. J I ET AL.

1998), and as a result, taxa with low DNA abundance
in roots may be completely missing from PCR products.
Roots grown with Cedar Creek and Konza inocula con-
tained some intraradical vesicles (data not shown), a
mycorrhizal structure not produced by Gigasporaceae
but commonly formed by other Glomeromycota (Gerde-
mann & Trappe 1974). This indicates that AM fungi
other than Gigaspora were present in these samples even
though our molecular analysis only detected a single
Gigaspora OTU. Although the primers we used amplify
most genera of AM fungi, they do not amplify the
genus Archaeospora (Lee et al. 2008), which was present
in the spore communities of all three inoculum soils
(Table S1, Supporting information). Studies that analyse
the composition of both AM fungal spores in soil and
the fungi inside roots grown in that soil regularly show
that the two communities are different (e.g. Clapp et al.
1995; Liu et al. 2012). There are many possible reasons
for a lower diversity of fungi inside plant roots com-
pared to the diversity of spores in field soil, particularly
in greenhouse studies. S�ykorov�a et al. (2007) compared
the AM fungal community composition between field
and greenhouse conditions and found short-term green-
house cultivation (3 months) favoured a subset of
mycorrhizal taxa that were rapid colonizers that could
competitively exclude other fungi. Greenhouse condi-
tions may have introduced a similar bias in our study.
Also, it is well known that there is selective association
between certain plant and AM fungal species (e.g. John-
son et al. 1992; Eom et al. 2000; Uibopuu et al. 2009;
Murray et al. 2010), and this would generate root
communities that are a subset of the spore community
presents at a site.
Our second hypothesis that Glomeromycotan diver-
sity should be lowest in the restored prairie was not
supported by our results. In fact, we observed the
opposite pattern (Fig. 3). Fermi inoculum resulted in
significantly higher species richness including three
genera within the Glomeraceae and one genus within
the Claroideoglomeracae. In contrast, Konza and Cedar
Creek inocula were dominated by a single OTU of
Gigaspora. Overdominance by one taxon is not uncom-
mon in Glomeromycotan communities (Dumbrell et al.
2010a). Data synthesized from over 30 studies showed
that, on average, a single taxon represented 40% of the
abundance of AM fungal communities (Dumbrell et al.
2010a).
Two factors may explain the pattern of Gigaspora dom-
inance in A. gerardii grown in association with Cedar
Creek and Konza inocula. First, it is possible that Gigas-
pora has come to dominate the native prairies at Konza
and Cedar Creek over time, but that this genus is not
yet well established in the earlier successional restored
prairie at Fermi. Members of the Gigasporaceae have
extremely large spores that may be slower to recolonize
following disturbance compared to members of the
Glomeraceae with smaller spores. Relative to members
of the Glomeraceae, AM fungi in the Gigasporaceae lack
the ability to form extensive hyphal networks (de la
Providencia et al. 2005; Voets et al. 2006), rely more on
soilborne spores to regenerate and require more plant
resources to establish and grow (Klironomos & Hart
2002; Thonar et al. 2011). The reduced abundance of
Gigasporaceae at Fermi could therefore suggest that
members of this family are more vulnerable to soil dis-
turbance than other families of AM fungi and may need
a longer time to recover.
An alternative explanation for the dominance of
Gigaspora in A. gerardii grown in soil from Konza and
Cedar Creek is that the neutral soil pH at Fermi is more
favourable for the Glomeraceae, while the more acidic
soil at Konza and Cedar Creek is better for Gigaspora-
ceae. It is well known that soil pH is an important
determinant of microbial community structure (Lauber
et al. 2009), including AM fungal community composi-
tion (Dumbrell et al. 2010b; Lekberg et al. 2011). For
example, across a pH range similar to that of our study
sites, differences in pH accounted for more than 40% of
the variation in AM fungal community composition in
a combined habitat of grassland, woodland and heath-
land (Dumbrell et al. 2010b). An early field survey by
Porter et al. (1987) suggests that Gigaspora species might
be more adapted to low soil pH than high pH, which
may help explain why members of the Gigasporaceae
were dominant at Konza and Cedar Creek. However,
our findings do not suggest that the higher pH of Fermi
soil prevents colonization by Gigaspora because A. gerar-
dii formed associations with Gigaspora when grown in
sterilized Fermi soil and inoculated with soil organisms
from Konza or Cedar Creek suggesting that Gigaspora is
less able to competitively exclude Glomeraceae in Fermi
soil over the short term.
Our phylogenetic analyses employing a hypervariable
region of the widely used SSU region of the rRNA gene
revealed distinct sequence types within a single
Gigaspora OTU, Gigaspora 1. Based on the trees we
constructed (Fig. 4), the majority of the Gigaspora
1 sequences we obtained were grouped into one of five
sequence types that were distinct from one another and
from the OTUs used by Kr€uger et al. (2012) in their
recent phylogenetic analysis of the Glomeromycota.
While Kr€uger et al. (2012) found strong support for a
monophyletic origin of the Gigaspora using a 2700-bp
data set including multiple regions of rDNA, individual
species of Gigaspora were poorly resolved with just the
SSU (Kr€uger et al. 2012). Likewise, de Souza et al. (2004)
found that a hypervariable region of the SSU could
distinguish among species of Gigaspora, but the most
© 2013 Blackwell Publishing Ltd
DIVERSITY AND ADAPTATION IN SYMBIOTIC FUNGI 2583

informative hypervariable region (V9) was found out-
side the primers we used. Therefore, it is unclear
whether the five sequence types we identified are
different species of Gigaspora or different genotypes of a
single Gigaspora species. Sequencing another hypervari-
able region such as V9 (Bago et al. 1998) or using
alternative molecular methods such as the PCR-DGGE
approach (de Souza et al. 2004) might help resolve our
Gigaspora 1 sequence types. Members of the Gigaspora
produce large, multinucleate spores that can be geneti-
cally distinct (Z�ez�e et al. 1997), adding to the challenges
of understanding the relationships between Gigaspora
OTUs and sequence types.
Our third hypothesis that Glomeromycotan fungi
have the highest fitness and provide the greatest benefit
to A. gerardii when they are grown in the soils where
they evolved was partially supported. The differences
in the composition of fungal communities from the dif-
ferent sites corresponded with significant differences in
AM colonization, external hyphae and plant biomass,
and for the most part, matched pairs of soil and inocu-
lum performed the best (Fig. 5). This exciting result
supports the hypothesis that local adaptation is an
important force structuring Glomeromycotan communi-
ties (Dumbrell et al. 2010b; Ji et al. 2010; Johnson et al.
2010b, 2012). However, there was one exception that is
noteworthy; plants grown in P-limited Konza soil and
inoculated with soil organisms from the restored prairie
at Fermi had a similar total biomass to plants grown in
the home soil–inoculum combination (Fig. 5). Hyphal
lengths also did not differ between the two groups.
These results suggest that the Gigasporaceae-dominated
Konza community and the Glomeraceae-dominated
Fermi community had similar mycorrhizal benefits and
costs in Konza soil. This result is surprising given pre-
vious work suggesting that compared to Glomeraceae,
members of the Gigasporaceae tend to produce more
mycelium in soil, a presumed advantage in low P soils
(Hart & Reader 2002; Thonar et al. 2011).
Comparisons of the performance and symbiotic func-
tion of the Gigaspora in the Konza and Cedar Creek
inocula revealed a tremendous degree of intra-OTU var-
iation and strongly support the hypothesis that AM
fungi have the highest fitness and provide the greatest
benefit to plants in the soils where they evolved. In
Cedar Creek soil, the local sequence types of Gigaspora
1 formed significantly more external hyphae (Fig. 5b)
and arbuscules (Fig. 6a) than Konza sequence types of
Gigaspora 1; the reverse was equally true – Konza Gigas-
pora 1 sequence types performed best in Konza soil.
Perhaps most importantly, in the P-rich Cedar Creek
soil, local Gigaspora 1 sequence types generated a com-
mensal symbiosis, while Konza Gigaspora 1 sequence
types generated a parasitic symbiosis (Fig. 6b). Both
sequence types generated mutualistic symbioses in Kon-
za soil, but the benefits were significantly greater when
roots were colonized with fungi that evolved at Konza.
The properties of Cedar Creek and Konza soils are
extremely different (Table 1), and it is likely that N lim-
itation at Cedar Creek and P limitation at Konza are
important selection pressures on plants and Glomer-
omycota. Fungal OTUs that best facilitate plant acquisi-
tion of these limited resources should be favoured
because Glomeromycota are obligate biotrophs so that
fungal fitness is tightly linked to plant carbon alloca-
tion, and it is known that plants preferentially allocate
carbon to fungi that provide them the greatest benefit
(Bever et al. 2009; Hammer et al. 2011; Kiers et al. 2011).
If preferential allocation occurs in our system, the selec-
tion of different geographic sequence types in Cedar
Creek and Konza soils can be directly linked to the dif-
ference in plant nutritional demands. In both soil types,
tissue N:P ratio tends to be higher in plants inoculated
with Cedar Creek soil organisms (Fig. 6c), indicating
that Cedar Creek inoculum enhances N uptake, while
Konza inoculum enhances P uptake. The statistical sig-
nificance of these comparisons would likely increase if
the sample size was larger (N = 3).
A uniform microbial wash composed of non-AM
microorganisms from all three sites was added to each
pot in an attempt to create a common community of
bacteria and non-AM fungi across all treatments. Nev-
ertheless, it is possible that differences in the microbial
communities remained, and consequently, some of the
plant responses to the different inocula may have been
generated by soil organisms other than AM fungi.
Although we cannot rule out this possibility, it is unli-
kely that the observed patterns in plant growth are
independent of the AM symbioses in their roots
because of the close correspondence between plant dry
weight and the formation of internal and external struc-
tures of AM fungi (Fig. 5).
In conclusion, our study supports the idea that Glom-
eromycota are ‘more diverse than meets the eye’ (Bever
et al. 2001) and suggests that ecological studies should
focus on variation within geographic isolates of fungi.
Although Glomeromycota are asexual, their unusual
genetic structure maintains a high degree of genetic
diversity within individual fungal clones because of
diverse populations of nuclei within heterokaryotic,
coenocytic mycelium (Sanders 2002; Reinhardt 2007;
Rosendahl 2008). These fungi exhibit high rates of
segregation and recombination, which generate func-
tionally distinct nucleotypes that have the potential for
rapid adaptation to the environment (Angelard et al.
2010; Angelard & Sanders 2011). Consequently, intra-
specific diversity of Glomeromycota may be very
important (Johnson et al. 2012), and thus, application of
© 2013 Blackwell Publishing Ltd
2584 B. J I ET AL.

non-native AM fungi in commercial inoculants may not
always have the expected outcomes because of a
mismatch between the ambient soil conditions and the
edaphic adaptations within the inoculant fungi
(Schwartz et al. 2006).
Acknowledgements
This work was funded by the National Science Foundation
(DEB-03116136, DEB 0842327 and DEB 0816675) and the Ful-
bright Commission of the Czech Republic. RMM’s participation
was in part funded by the U.S. Department of Energy, Office
of Biological and Environmental Research under contract
DE-AC02-06CH11357. We thank Jacqueline Wilson for her help
with the greenhouse study, Carlyn van Camp and Carolyn
Myren for their assistance with the molecular analysis and Anita
Antoninka for analysing the spore communities. Five anony-
mous reviewers and the laboratories of C. Gehring, N. Johnson
and J. Bever provided valuable comments on the manuscript.
References
Angelard C, Sanders IR (2011) Effect of segregation and genetic
exchange on arbuscular mycorrhizal fungi in colonization of
roots. New Phytologist, 189, 652–657.
Angelard C, Colard A, Niculita-Hirzel H, Croll D, Sanders IR
(2010) Segregation in a mycorrhizal fungus alters rice growth
and symbiosis-specific gene transcription. Current Biology, 20,
1216–1221.
Bago B, Bentivenga SP, Brenac V, Dodd JC, Piche Y, Simon L
(1998) Molecular analysis of Gigaspora (Glomales, gigaspora-
ceae). New Phytologist, 139, 581–588.
Bethlenfalvay GJ, Brown MS, Pacovsky RS (1982) Parasitic and
mutualistic associations between a mycorrhizal fungus and
soybean – development of the host plant. Phytopathology, 72,
889–893.
Bethlenfalvay GJ, Franson RL, Brown MS, Mihara KL (1989)
The Glycine-Glomus-Bradyrhizobium symbiosis. IX. Nutritional,
morphological and physiological responses of nodulated
soybean to geographic isolates of the mycorrhizal fungus
Glomus mosseae. Physiologia Plantarum, 76, 226–232.Bever JD (2002) Negative feedback within a mutualism: host-
specific growth of mycorrhizal fungi reduces plant benefit.
Proceedings of the Royal Society of London Series B-Biological
Sciences, 269, 2595–2601.Bever JD, Schultz PA, Pringle A, Morton JB (2001) Arbuscular
mycorrhizal fungi: more diverse than meets the eye, and the
ecological tale of why. BioScience, 51, 923–931.
Bever JD, Pringle A, Schultz P (2002) Dynamics within the
plant-arbuscular mycorrhizal fungal mutualism: testing the
nature of community feedback. In: Mycorrhizal Ecology (eds
van der Heijden MGA, Sanders IR), pp. 267–292. Springer-
Verlag, Berlin, Germany.
Bever JD, Schultz PA, Miller RM, Gades L, Jastrow JD (2003)
Inoculation with prairie mycorrhizal fungi may improve
restoration of native prairie plant diversity. Ecological
Restoration, 21, 311–312.Bever JD, Richardson SC, Lawrence BM, Holmes J, Watson M
(2009) Preferential allocation to beneficial symbiont with
spatial structure maintains mycorrhizal mutualism. Ecology
Letters, 12, 13–21.Brundrett MC (2002) Coevolution of roots and mycorrhizas of
land plants. New Phytologist, 154, 275–304.Chaudhary VB, Lau MK, Johnson NC (2008) Macroecology of
microbes — biogeography of the Glomeromycota. In: Mycor-
rhiza: Genetics and Molecular Biology, Eco-function, Biotechnol-
ogy, Eco-physiology, Structure and Systematics (ed. Varma A),
pp. 529–564. Springer, Berlin.
Clapp JP, Young JPW, Merryweather JW, Fitter AH (1995)
Diversity of fungal symbionts in arbuscular mycorrhizas
from a natural community. New Phytologist, 130, 259–265.Dumbrell AJ, Nelson M, Helgason T, Dytham C, Fitter AH
(2010a) Idiosyncrasy and overdominance in the structure of
natural communities of arbuscular mycorrhizal fungi: is there
a role for stochastic processes? Journal of Ecology, 98, 419–428.Dumbrell AJ, Nelson M, Helgason T, Dytham C, Fitter AH
(2010b) Relative roles of niche and neutral processes in struc-
turing a soil microbial community. ISME Journal, 4, 337–345.
Egerton-Warburton LM, Johnson NC, Allen EB (2007) Mycor-
rhizal community dynamics following nitrogen fertilization:
a cross-site test in five grasslands. Ecological Monographs, 77,
527–544.
Eom AH, Hartnett DC, Wilson GWT (2000) Host plant species
effects on arbuscular mycorrhizal fungal communities in
tallgrass prairie. Oecologia, 122, 435–444.Fitter AH (2005) Darkness visible: reflections on underground
ecology. Journal of Ecology, 93, 231–243.
Fitzsimons M, Miller R, Jastrow J (2008) Scale-dependent
niche axes of arbuscular mycorrhizal fungi. Oecologia, 158,
117–127.Gao Q-M, Guo L-D (2010) A comparative study of arbuscular
mycorrhizal fungi in forest, grassland and cropland in the
Tibetan Plateau, China. Mycology, 1, 163–170.
Gerdemann JW, Trappe JM (1974) The Endogonaceae in the
Pacific Northwest. Mycologia Memoir, 5, 1–76.
Hall T (2011) BioEdit. Biological Sequence Alignment Editor for
Windows. Ibis Biosciences, Carlsbad, California.
Hammer EC, Pallon J, Wallander H, Olsson PA (2011) Tit for
tat? A mycorrhizal fungus accumulates phosphorus under
low plant carbon availability. FEMS Microbiology Ecology, 76,
236–244.
Hart MM, Reader RJ (2002) Taxonomic basis for variation in
the colonization strategy of arbuscular mycorrhizal fungi.
New Phytologist, 153, 335–344.Hartnett DC, Wilson GWT (2002) The role of mycorrhizas in
plant community structure and dynamics: lessons from
grasslands. Plant and Soil, 244, 319–331.
Helgason T, Fitter AH (2009) Natural selection and the evolu-
tionary ecology of the arbuscular mycorrhizal fungi (Phylum
Glomeromycota). Journal of Experimental Botany, 60, 2465–2480.
Helgason T, Daniell TJ, Husband R, Fitter AH, Young JPW
(1998) Ploughing up the wood-wide web? Nature, 394,
431–431.Ji B, Bentivenga SP, Casper BB (2010) Evidence for ecological
matching of whole AM fungal communities to the local
plant-soil environment. Ecology, 91, 3037–3046.
Johnson NC, Wedin DA (1997) Soil carbon, nutrients, and
mycorrhizae during conversion of dry tropical forest to
grassland. Ecological Applications, 7, 171–182.
© 2013 Blackwell Publishing Ltd
DIVERSITY AND ADAPTATION IN SYMBIOTIC FUNGI 2585

Johnson NC, Tilman D, Wedin D (1992) Plant and soil
controls on mycorrhizal fungal communities. Ecology, 73,
2034–2042.
Johnson NC, Graham JH, Smith FA (1997) Functioning of
mycorrhizal associations along the mutualism-parasitism
continuum. New Phytologist, 135, 575–586.Johnson D, Anderson IC, Williams A, Whitlock R, Grime JP
(2010a) Plant genotypic diversity does not beget root-fungal
species diversity. Plant and Soil, 336, 107–111.
Johnson NC, Wilson GWT, Bowker MA, Wilson JA, Miller RM
(2010b) Resource limitation is a driver of local adaptation in
mycorrhizal symbioses. Proceedings of the National Academy of
Sciences of the United States of America, 107, 2093–2098.
Johnson D, Martin F, Cairney JWG, Anderson IC (2012) The
importance of individuals: intraspecific diversity of mycor-
rhizal plants and fungi in ecosystems. New Phytologist, 194,
614–628.
Jumpponen A (2011) Analysis of ribosomal RNA indicates sea-
sonal fungal community dynamics in Andropogon gerardii
roots. Mycorrhiza, 21, 453–464.Kiers ET, Duhamel M, Beesetty Y et al. (2011) Reciprocal
rewards stabilize cooperation in the mycorrhizal symbiosis.
Science, 333, 880–882.
Klironomos JN (2003) Variation in plant response to native and
exotic arbuscular mycorrhizal fungi. Ecology, 84, 2292–2301.
Klironomos JN, Hart MM (2002) Colonization of roots by
arbuscular mycorrhizal fungi using different sources of inoc-
ulum. Mycorrhiza, 12, 181–184.
Koch AM, Croll D, Sanders IR (2006) Genetic variability in a
population of arbuscular mycorrhizal fungi causes variation
in plant growth. Ecology Letters, 9, 103–110.Kr€uger M, Kr€uger C, Walker C, Stockinger H, Sch€ußler A
(2012) Phylogenetic reference data for systematics and phylo-
taxonomy of arbuscular mycorrhizal fungi from phylum to
species level. New Phytologist, 193, 970–984.Lambert DH, Cole H, Baker DE (1980) Adaptation of vesicular-
arbuscular mycorrhizae to edaphic factors. New Phytologist,
85, 513–520.
Lauber CL, Hamady M, Knight R, Fierer N (2009) Pyrose-
quencing-based assessment of soil pH as a predictor of soil
bacterial community structure at the continental scale.
Applied and Environmental Microbiology, 75, 5111–5120.
Lee J, Lee S, Young JPW (2008) Improved PCR primers for the
detection and identification of arbuscular mycorrhizal fungi.
FEMS Microbiology Ecology, 65, 339–349.Lekberg Y, Meadow J, Rohr JR, Redecker D, Zabinski CA
(2011) Importance of dispersal and thermal environment for
mycorrhizal communities: lessons from Yellowstone National
Park. Ecology, 92, 1292–1302.Liu Y, Shi G, Mao L et al. (2012) Direct and indirect influences
of 8 yr of nitrogen and phosphorus fertilization on Glomer-
omycota in an alpine meadow ecosystem. New Phytologist,
194, 523–535.McCune B, Grace JB (2002) Analysis of Ecological Communities.
MjM Software Design, Glenedon Beach, Oregon.
McCune B, Mefford MJ (2006) PC-ORD. Multivariate Analysis of
Ecological Data. MjM Software, Gleneden Beach, Oregon, USA.
McGonigle TP, Miller MH, Evans DG, Fairchild GL, Swan JA
(1990) A new method which gives an objective measure of
colonization of roots by vesicular–arbuscular mycorrhizal
fungi. New Phytologist, 115, 495–501.
McMillan C (1959) The role of ecotypic variation in the distri-
bution of the central grassland of North America. Ecological
Monographs, 29, 285–308.
Miller RM (1987) The ecology of vesicular-arbuscular mycorrhi-
zae in grass- and shrublands. In: Ecophysiology of VA Mycor-
rhizal Plants (ed. Safir GR), pp. 135–170. CRC Press, Boca
Raton, Florida.
Miller RM, Reinhardt DR, Jastrow JD (1995) External hyphal
production of vesicular-arbuscular mycorrhizal fungi in pas-
ture and tallgrass prairie communities. Oecologia, 103, 17–23.Mosse B (1973) Plant growth responses to vesicular-arbuscular
mycorrhiza. IV. In soil given additional phosphate. New
Phytologist, 72, 127–136.
Munkvold L, Kjøller R, Vestberg M, Rosendahl S, Jakobsen I
(2004) High functional diversity within species of arbuscular
mycorrhizal fungi. New Phytologist, 164, 357–364.Murphy J, Riley JP (1962) A modified single solution method
of the determination of phosphate in natural waters. Analyti-
ca Chimica Acta, 27, 31–36.
Murray TR, Frank DA, Gehring CA (2010) Ungulate and topo-
graphic control of arbuscular mycorrhizal fungal spore com-
munity composition in a temperate grassland. Ecology, 91,
815–827.€Opik M, Vanatoa A, Vanatoa E et al. (2010) The online data-
base MaarjAM reveals global and ecosystemic distribution
patterns in arbuscular mycorrhizal fungi (Glomeromycota).
New Phytologist, 188, 223–241.
Pirozynski KA, Malloch DW (1975) The origin of land plants: a
matter of mycotrophism. Biosystems, 6, 153–164.Polz MF, Cavanaugh CM (1998) Bias in template-to-product
ratios in multitemplate PCR. Applied and Environmental
Microbiology, 64, 3724–3730.
Porter WM, Robson AD, Abbott LK (1987) Field survey of
the distribution of vesicular arbuscular mycorrhizal fungi
in relation to soil pH. Journal of Applied Ecology, 24,
659–662.
Posada D (2008) jModelTest: phylogenetic model averaging.
Molecular Biology and Evolution, 25, 1253–1256.
de la Providencia IE, de Souza FA, Fernandez F, Delmas NS,
Declerck S (2005) Arbuscular mycorrhizal fungi reveal dis-
tinct patterns of anastomosis formation and hyphal healing
mechanisms between different phylogenic groups. New Phy-
tologist, 165, 261–271.Redecker D, Kodner R, Graham LE (2000) Glomalean fungi
from the Ordovician. Science, 289, 1920–1921.Reinhardt D (2007) Programming good relations – develop-
ment of the arbuscular mycorrhizal symbiosis. Current
Opinion in Plant Biology, 10, 98–105.
Robertson KR, Anderson RC, Schwartz M (1997) The tallgrass
prairie mosaic. In: Conservation in Highly Fragmented Land-
scapes (ed Schwartz M), pp. 55–87. Chapman and Hall,
New York, New York.
Rosendahl S (2008) Communities, populations and individuals
of arbuscular mycorrhizal fungi. New Phytologist, 178,
253–266.Rosendahl S, Stukenbrock EH (2004) Community structure of
arbuscular mycorrhizal fungi in undisturbed vegetation
revealed by analyses of LSU rDNA sequences. Molecular
Ecology, 13, 3179–3186.Samson F, Knopf F (1994) Prairie conservation in North Amer-
ica. BioScience, 44, 418–421.
© 2013 Blackwell Publishing Ltd
2586 B. J I ET AL.

Sanders IR (2002) Ecology and evolution of multigenomic
arbuscular mycorrhizal fungi. American Naturalist, 160,
S128–S141.
Schloss PD, Westcott SL, Ryabin T et al. (2009) Introducing
mothur: open-source, platform-independent, community-
supported software for describing and comparing microbial
communities. Applied and Environmental Microbiology, 75,
7537–7541.Schwartz MW, Hoeksema JD, Gehring CA et al. (2006) The
promise and the potential consequences of the global
transport of mycorrhizal fungal inoculum. Ecology Letters, 9,
501–515.Smith SE, Read DJ (2008) Mycorrhizal Symbiosis, 3rd edn.
Academic Press, San Diego, California.
de Souza FA, Kowalchuk GA, Leeflang P, van Veen JA, Smit
E (2004) PCR-denaturing gradient gel electrophoresis profil-
ing of inter- and intraspecies 18S rRNA gene sequence het-
erogeneity is an accurate and sensitive method to assess
species diversity of arbuscular mycorrhizal fungi of the
genus Gigaspora. Applied and Environmental Microbiology, 70,
1413–1424.
Stahl PD, Smith WK (1984) Effects of different geographic iso-
lates of Glomus on the water relations of Agropyron smithii.
Mycologia, 76, 261–267.S�ykorov�a Z, Ineichen K, Wiemken A, Redecker D (2007) The
cultivation bias: different communities of arbuscular mycor-
rhizal fungi detected in roots from the field, from bait plants
transplanted to the field, and from a greenhouse trap experi-
ment. Mycorrhiza, 18, 1–14.Tamura K, Peterson D, Peterson N, Stecher G, Nei M, Kumar S
(2011) MEGA5: molecular evolutionary genetics analysis
using maximum likelihood, evolutionary distance, and maxi-
mum parsimony methods. Molecular Biology and Evolution,
28, 2731–2739.
Thonar C, Schnepf A, Frossard E, Roose T, Jansa J (2011) Traits
related to differences in function among three arbuscular
mycorrhizal fungi. Plant and Soil, 339, 231–245.Uibopuu A, Moora M, Saks U, Daniell T, Zobel M, Opik M
(2009) Differential effect of arbuscular mycorrhizal fungal
communities from ecosystems along management gradient on
the growth of forest understorey plant species. Soil Biology &
Biochemistry, 41, 2141–2146.
Verbruggen E, Roling WFM, Gamper HA, Kowalchuk GA,
Verhoef HA, van der Heijden MGA (2010) Positive effects
of organic farming on below-ground mutualists: large-scale
comparison of mycorrhizal fungal communities in agricul-
tural soils. New Phytologist, 186, 968–979.Voets L, de la Providencia IE, Declerck S (2006) Glomeraceae
and Gigasporaceae differ in their ability to form hyphal
networks. New Phytologist, 172, 185–188.
White TJ, Bruns T, Lee S, Taylor J (1990) Amplification and
direct sequencing of fungal ribosomal RNA genes for
phylogenetics. In: PCR Protocols: a Guide to Methods and
Applications(eds Innis MA, Gelfand DH, Sninsky JJ & White
TJ), pp. 315–322. Academic Press, San Diego.
Wilson GWT, Hartnett DC (1998) Interspecific variation in
plant responses to mycorrhizal colonization in tallgrass
prairie. American Journal of Botany, 85, 1732–1738.
Z�ez�e A, Sulistyowati E, Ophel-Keller K, Barker S, Smith S
(1997) Intersporal genetic variation of Gigaspora margarita, a
vesicular arbuscular mycorrhizal fungus, revealed by M13
minisatellite-primed PCR. Applied and Environmental
Microbiology, 63, 676–678.
N.C.J., C.A.G. and B.J. initiated this research project.
N.C.J., G.W.T.W. and R.M.M. designed and conducted
the greenhouse experiment, BJ designed and conducted
the molecular analysis with assistance from L.R.-F. and
C.A.G., L.R.-F. and B.J. conducted the phylogenetic
analyses, and C.A.G, N.C.J and B.J. conducted the sta-
tistical analyses. N.C.J., C.A.G., L.R.-F. and B.J. drafted
the manuscript with editorial input from G.W.T.W. and
R.M.M.
Data accessibility
DNA sequences: GenBank accession numbers JQ837420,
JQ837422, JQ837424, JQ837428, JQ837429, JQ837454 and
JX970622-JX970628.
Phylogenetic data: TreeBASE study accession number:
#13814.
Full sequence data, sequence description file, plant
and fungal trait measurements: Dryad entry doi:10.
5061/dryad.k4m41.
© 2013 Blackwell Publishing Ltd
DIVERSITY AND ADAPTATION IN SYMBIOTIC FUNGI 2587


