PATTERNS AND DETERMINANTS OF GENDER BIAS IN...
49
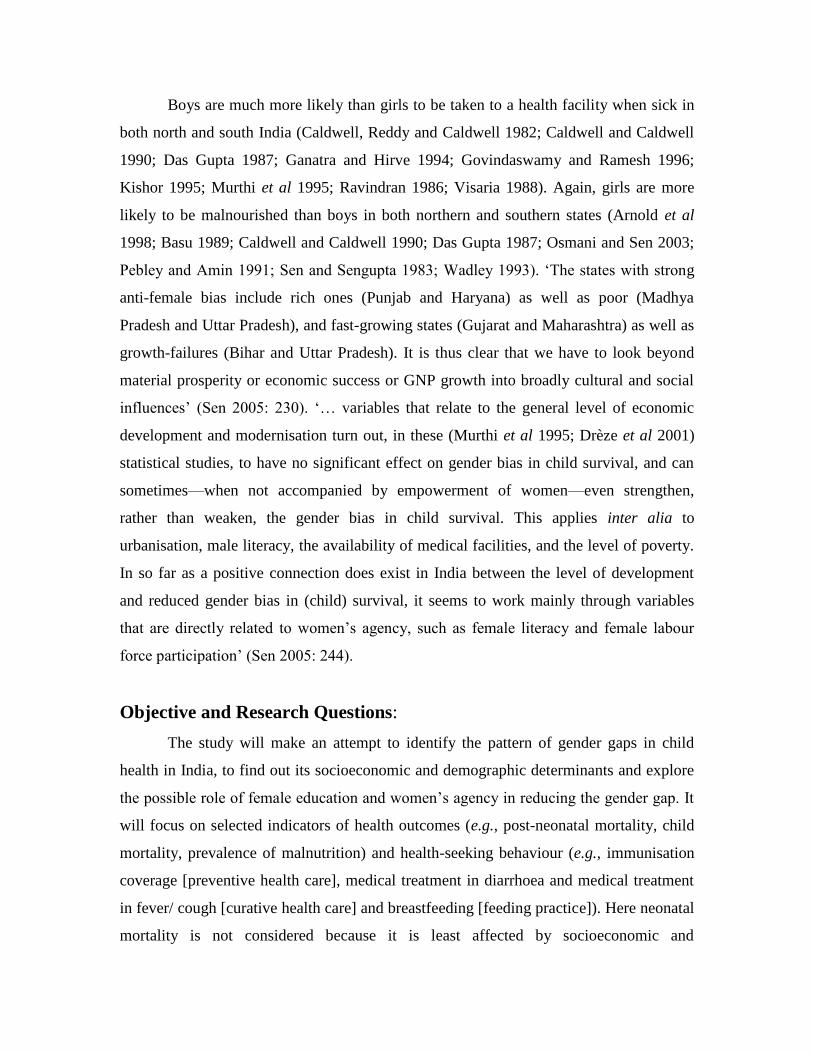
PATTERNS AND DETERMINANTS OF GENDER BIAS IN CHILD HEALTH IN INDIA NILANJAN PATRA Abstract: The study will make an attempt to identify patterns of gender gap in child health in India and their determinants, and examine the possible role of female education and women’s agency in reducing the gap. It will apply Borda rule, Principal Component Analysis, Logistic regression techniques on three rounds of NFHS data. Children under three years of age are the units of analysis. With the help of 21 selected indicators of health-seeking behaviour and health outcome, it is shown that there are ample evidence of varying level of gender gap exists in all the states of India. It is found that the gender gap in various health outcomes are not much related to the gender gap in various indicators of health-seeking behaviour. However for the girl children’s health achievement, the indicators of health-seeking behaviour are significantly related to the indicators of health outcome. It is also shown that any consistently robust pattern of gender bias against girl children in child health is not present in India. But there is a consistent pattern of girl children’s absolute health achievement. Hence we focus on the girl children exclusively and tried to identify the determinants of health achievements for girl children. Given the Rawlsian theory of justice, the same determinants will, in turn, be able to reduce gender bias. We analyse the effects of some selected demographic and socioeconomic variables on the chance of full immunisation, chance of medical treatment in diarrhoea and medical treatment in fever/ cough, chance of breastfeeding, chance of malnutrition and chance of mortality for girl children. Except for a few cases, the results are consistently robust. It has been found that, among others, female education and women’s empowerment do have a positive role in reducing gender bias in child health in India. Keywords: Gender Bias, Child Health, NFHS, Logit, Female Literacy, Women’s Empowerment, India. JEL Classification: C19, C43, D63, I18, J13, J16, O15, O18, R11 : The author is at Institute of Health Management Research (IIHMR), Kolkata. E-mail: [email protected]
Transcript of PATTERNS AND DETERMINANTS OF GENDER BIAS IN...
PATTERNS AND DETERMINANTS OF GENDER BIAS IN CHILD HEALTH IN INDIA
NILANJAN PATRA
Abstract:
The study will make an attempt to identify patterns of gender gap in child health
in India and their determinants, and examine the possible role of female education and
women’s agency in reducing the gap. It will apply Borda rule, Principal Component
Analysis, Logistic regression techniques on three rounds of NFHS data. Children under
three years of age are the units of analysis.
With the help of 21 selected indicators of health-seeking behaviour and health
outcome, it is shown that there are ample evidence of varying level of gender gap exists
in all the states of India. It is found that the gender gap in various health outcomes are not
much related to the gender gap in various indicators of health-seeking behaviour.
However for the girl children’s health achievement, the indicators of health-seeking
behaviour are significantly related to the indicators of health outcome. It is also shown
that any consistently robust pattern of gender bias against girl children in child health is
not present in India. But there is a consistent pattern of girl children’s absolute health
achievement.
Hence we focus on the girl children exclusively and tried to identify the
determinants of health achievements for girl children. Given the Rawlsian theory of
justice, the same determinants will, in turn, be able to reduce gender bias. We analyse the
effects of some selected demographic and socioeconomic variables on the chance of full
immunisation, chance of medical treatment in diarrhoea and medical treatment in fever/
cough, chance of breastfeeding, chance of malnutrition and chance of mortality for girl
children. Except for a few cases, the results are consistently robust. It has been found
that, among others, female education and women’s empowerment do have a positive role
in reducing gender bias in child health in India.
Keywords: Gender Bias, Child Health, NFHS, Logit, Female Literacy, Women’s
Empowerment, India.
JEL Classification: C19, C43, D63, I18, J13, J16, O15, O18, R11
: The author is at Institute of Health Management Research (IIHMR), Kolkata.
E-mail: [email protected]

Introduction:
Provision of public health is a basic human right and a crucial merit good, defined
as an activity with very high positive externalities. Universal access to health together
with safe drinking water, sanitation, nutrition, basic education, information and
employment are essential to a balanced development. If India is to glean the gains of a
demographic dividend and become a major economic power by 2030, it will have to
guarantee that her people are healthy, live long and generate wealth.
Ever since the Bhore Committee Report (GoI 1946) and the Constitution of India,
the Government of India (GoI) has reiterated many times its aim of advancing the
average health of its citizens, reducing inequalities in health, and fostering financial
access to health care, particularly for the most destitute. In the Directive Principles of
State Policy (Bakshi 2006: 84-91) of the Constitution of India, Articles 38 (2) and 41
stress the need for equitable access and assistance to the sick and the underserved, along
with the rights to employment and education, while Article 47 stresses improving
nutrition, the standard of living and public health. Article 39 and Article 45 point to
gender equality and the protection of children rights including education and Article 42
asks for just and humane work environment and maternity relief. Article 14 suggests that
men and women have equal rights and opportunities in the political, economic and social
spheres and Article 15 (1) prohibits discrimination against any citizen on the grounds of
religion, race, caste, sex, etc. Nevertheless, roughly by any benchmark, India’s triumph in
achieving these goals can at best be reckoned as varied (GoI 2005).
Inequality between women and men can come out in many diverse forms—it has
many faces, e.g., survival inequality, natality inequality, unequal facilities, ownership
inequality, unequal sharing of household benefits and chores and domestic violence and
physical victimisation (Sen 2005: 224). Gender disparity is, in fact, not one hardship but
a multitude of problems. Gender inequality of one type tends to encourage and sustain
gender inequality of other kinds (ibid: 220). In most nations women have failed to ‘hold
up half the sky’. There are extensive inequalities even in morbidity and mortality in
substantial parts of Asia and North Africa (Sen 1995). In family behaviour, inequalities
between men and women (and between boys and girls) are often accepted as ‘natural’ or
‘appropriate’ (ibid). Gender inequality takes the brutal form of remarkably high mortality

rates of women and a subsequent predominance of men in the total population (Sen 2005:
224). Gender inequality is evident not just in the old form of mortality asymmetry, but
also in the new form of sex-selective abortions aimed at eliminating female foetuses as
many parents want the newborn to be a boy rather than a girl (ibid: 226). Given equal
nutrition and health care, women live on average slightly longer than men, even allowing
for a modest level of maternal mortality. However, discrimination against females in
many parts of the world meant that there were more than 100 million ‘missing women’ in
the world in 1986 (Nussbaum 1995, Sen 1990). Daughters are likely to be put to work for
the household at a very young age, are much less likely to be educated and to attain
literacy than sons of the same households and, worst of all — being less valued than their
brothers — they have less chance of staying alive, because they are more deprived of
food or of healthcare (Dasgupta 1993; Drèze and Sen 1990: Ch-4; Papanek 1990).
Women in both rich and poor countries also suffer from severe ‘time poverty’, since they
are carrying the ‘double burden’ of domestic and breadwinning responsibilities (Okin
1995). Along with these doubly burdened productive works women are also burdened
with unpaid reproductive work.
Almost all over the world, cultural traditions pose obstacles to women’s health
and empowerment. Many traditions have portrayed women as less important than men,
less deserving of basic life support, or of fundamental rights that are strongly correlated
with quality of life, such as health, education, self-respect, right to work, social and
political liberty and participation (Nussbaum 1995; Sen 2005: 232). According to the
1995 UN Human Development Report, there is no country in the world in which
women’s quality of life is equal to that of men, according to a complex measure that
includes longevity, health status, educational opportunities, employment and political
rights.
The Constitution of India promises women equal employment opportunities (as
men) and equal pay for equal work. But still today there is a significant degree of gender
inequality in work opportunities and remuneration, and an astonishing range of variation
in female labour force participation (Chen 1995). The social barriers on the lifestyles of
women tend to become more rigid as one moves up in the caste hierarchy (Drèze 1990:

52). Generally, there is more seclusion of females in North India than in the South, and
among upper castes and classes than among lower castes and classes (Miller 1981: 780).
There is a need to study gender as it deals with ‘emancipation of women from
their subordination, and their achievement of equality, equity and empowerment’ (Moser
1993). The United Nations Decade for Women (1976-85) played an essential role in
highlighting the ‘important but often previously invisible role of women in the social and
economic development of Third World countries and communities, and the particular
‘plight’ of low-income women’ (ibid). During this decade ‘policy-makers began to shift
their focus from a universal concern with welfare-oriented, family-centred programmes
which assumed motherhood as the most important role for women in the development
process, to a diversity of approaches emphasising the productive role of women’ (ibid).
Women are increasingly seen as active ‘agents’ of development from the earlier view of
passive ‘patients’.
Health policies are aimed at the betterment of all children—boys and girls. But, as
we will see later, the persistent seemingly gender-blind health policies have resulted in a
situation where boys’ achievements outperform that of girls’ in almost all indicators of
health. Thus it is important to look at the extent by which girls are lagging behind boys in
the indicators of health. It is not only the absolute level of achievement of girls but the
relative achievement of girls to boys which is important to study. As reduction and
removal of gender bias in health can go a long way in achieving gender parity in many
other dimensions of human development, not only for the present generation but also
over the generations, studying gender bias is of utmost importance.
Preference for sons is prominent in Asia and North Africa (Sinha et al 2005) and
it is particularly strong in the Indian subcontinent (Arnold 1997). In India, son preference
endured for centuries. Population sex ratios from censuses almost steadily stepped up,
from 1030 males per 1000 females in 1901 to 1064 males per 1000 females in 2011
(Census 2001; Desai 1994; Visaria 1967, 1969; Visaria and Visaria 1983, 1995). Sex
ratios for children under age 10 years became more masculine in India over 1961-1991
(Bhat 1989; Das Gupta and Bhat 1997; Desai 1994; El-Badry 1969; Miller 1989;
Parasuraman and Roy 1991). ‘A strong preference for sons has been found to be
pervasive in Indian society, affecting both attitudes and behaviour with respect to

children and the choice regarding number and sex composition of children (Arnold et al
1998, 2002; Arokiasamy 2002; Bhat et al 2003; Clark 2000; Das Gupta et al 2003;
Mishra et al 2004; Pande et al 2007)’ (IIPS 2007: 103). Son preference is an obstructing
factor for maternal and child health care utilisation (Choi et al 2006; Li 2004).
Mortality rates of females often exceed than those of males (Bairagi 1986;
Caldwell and Caldwell 1990; D’Souza and Chen 1980; Faisel, Ahmed and Kundi 1993;
Koenig and D’Souza 1986; IIPS 1995; Pande 2003; Sen 1998). Gender discrimination
prevails regardless of the realisation that prejudice in morbidity, nutritional status, or use
of health care will probably contribute to greater gender bias in mortality (Arnold, Choe,
and Roy 1998; Bardhan 1974, 1982; Doyal 2005: 10; Kishor 1993, 1995; Kurz and
Johnson-Welch 1997; Makinson 1994; Miller 1981; Obermeyer and Cardenas 1997;
Waldron 1987).
Gender bias in India was traced as early as the 1901 Census, which notes ‘there is
no doubt that, as a rule, she (a girl) receives less attention than would be bestowed upon a
son. She is less warmly clad, … she is probably not so well fed as a boy would be, and
when ill, her parents are not likely to make the same strenuous efforts to ensure her
recovery’ (1901 Census, quoted in Miller 1981: 67). Due to unequal treatment of women,
India now has the largest share of ‘missing women’ in the world (Klasen et al 2001).
Female infanticide has been widely recorded in India, especially in North and North-
western India (Clark 1983; Jeffery et al 1984). Such a practice has also been noted
recently in South India, in Tamil Nadu (Chunkath and Athreya 1997; George et al 1992).
Also the advanced technology to determine sex of the foetus helps in female foeticide
(Sinha et al 2005).
Gender bias, even when it is not disastrous, may still create greater debility
among surviving girls and its effect may be perpetuated over generations (Merchant and
Kurz 1992; Mosley and Becker 1991; Mosley and Chen 1984; Pande 2003; Sen 1998). If
the ‘Barker thesis’ (i.e., foetal origin of adult diseases hypothesis) (Barker 1995, 1993) is
true, there is a possibility of a causal connection ‘that goes from nutritional neglect of
women to maternal under-nourishment, and from there to foetal growth retardation and
underweight babies, thence to greater child under-nourishment’ and to a higher incidence
of permanent disadvantages in health much later in adult life (Osmani and Sen 2003; Sen

2005: 248). ‘What begins as a neglect of the interests of women ends up causing
adversities in the health and survival of all—even at advanced ages’ (Sen 2005: 248).
Thus, gender bias not only hurts women, but inflicts a heavy economic cost on the
society by harming the health of all, including that of men (Osmani and Sen 2003).
Gender bias can be a blend of ‘active’ bias (e.g., ‘intentional choice to provide health care
to a sick boy but not to a sick girl’), ‘passive’ neglect (e.g., ‘discovering that a girl is sick
later than that would be the case for a boy, simply because girls may be more neglected in
day-to-day interactions than are boys’), and ‘selective favouritism’ (‘choices made by
resource-constrained families that favour those children that the family can ill afford to
lose’) (Pande 2003).
Women in India face discrimination in terms of social, economic and political
opportunities because of their ‘inferior’ status. Gender bias prevails in terms of allocation
of food, preventive and curative health care, education, work and wages and, fertility
choice (Arokiasamy 2004: 835; Miller 1997; Pande et al 2003; Pandey et al 2002). A
large body of literature suggests that son preference and the low status of women are the
two important factors contributing to the gender bias against women. The patriarchal
intra-familial economic structure coupled with the perceived cultural, religious and
economic utility of boys over girls based on cultural norms have been suggested as the
original determining factors behind the degree of son preference and the inferior status of
women across the regions of India (Arokiasamy 2004: 836; Pande 2003; Sinha et al
2005). Daughters are considered as a net drain on parental resources in patrilineal and
patrilocal communities (Dasgupta 2000). Intra-household gender discrimination has
primary origins not in parental preference for boys but in higher returns to parents from
investment in sons (Hazarika 2000).
Gender bias in child health prevails even today when India is shining in terms of
aggregate economic growth indicators or Bharat Nirman is going on. There are several
conflicting findings in the literature on the issue of gender bias. For example, gender bias
tends to diminish with higher female literacy (Bourne and Walker 1991) and lower
female literacy (Basu 1992); with higher levels of poverty (Krishnaji 1987; Dasgupta
1993; Miller 1993) and lower levels of poverty (Agarwal 1986); with higher levels of
fertility (Das Gupta 1993, 1994) and lower levels of fertility (Basu 1992; Das Gupta

1987). Other household opportunities (e.g., urbanisation, higher household standard of
living, better parental education, mother’s empowerment, etc.) can also affect gender
bias. Female household headship can also affect female disadvantage. The reasons behind
women household headship may be economic, sociological, geographical or ecological
(Bose 2006).
Rosenzweig and Schultz (1982) found that enhanced employment opportunities
for adult women tend to raise the relative survival chances of girls. Kishor (1993, 1995)
also shows that the relative survival chance of girls is positively related to female labour
force participation. ‘Higher levels of female literacy and (female) labour force
participation are strongly associated with lower levels of relative female disadvantage in
child survival’ (Sen 2005: 244). Gender bias in child survival could also be affected by
some other variables, e.g., mortality, fertility, development indicators, geographical
location, etc. It is evident that gender bias in child survival tends to be relatively low
among poor households, among backward castes, and among households with high levels
of female labour force participation (Murthi et al 1995).
Given that there is a strong preference for sons in India, there are significant
variations in the extent of this preference within the country (Sinha et al 2005).
Prevalence of ‘female disadvantage’ is evident in large parts of India, particularly in the
large northern states rather than the southern states (Caldwell, Reddy and Caldwell 1982;
Caldwell and Caldwell 1990; Das Gupta 1987; Ganatra and Hirve 1994; Govindaswamy
and Ramesh 1996; Kishor 1995; Murthi et al 1995; Ravindran 1986; Sinha et al 2005;
Visaria 1988). There exists a ‘Bermuda Triangle’ for the female child in India in a zone
of 24 districts consisting parts of Rajasthan, Haryana, western Uttar Pradesh and Madhya
Pradesh (Agnihotri 1996). The country can be roughly divided into two by a line that
resembles the contours of the Satpura hill range, extending eastward to join the Chota
Nagpur hills of southern Bihar. To the north of this line sex ratios are high and to the
south sex ratios are comparatively low (Dyson and Moore 1983; Sinha et al 2005). Dyson
and Moore (1983) have explained the North-South demographic divide in terms of
female autonomy, i.e., decision-making ability regarding personal matters, with low
female autonomy in the North compared to higher female autonomy in the South.
Boys are much more likely than girls to be taken to a health facility when sick in
both north and south India (Caldwell, Reddy and Caldwell 1982; Caldwell and Caldwell
1990; Das Gupta 1987; Ganatra and Hirve 1994; Govindaswamy and Ramesh 1996;
Kishor 1995; Murthi et al 1995; Ravindran 1986; Visaria 1988). Again, girls are more
likely to be malnourished than boys in both northern and southern states (Arnold et al
1998; Basu 1989; Caldwell and Caldwell 1990; Das Gupta 1987; Osmani and Sen 2003;
Pebley and Amin 1991; Sen and Sengupta 1983; Wadley 1993). ‘The states with strong
anti-female bias include rich ones (Punjab and Haryana) as well as poor (Madhya
Pradesh and Uttar Pradesh), and fast-growing states (Gujarat and Maharashtra) as well as
growth-failures (Bihar and Uttar Pradesh). It is thus clear that we have to look beyond
material prosperity or economic success or GNP growth into broadly cultural and social
influences’ (Sen 2005: 230). ‘… variables that relate to the general level of economic
development and modernisation turn out, in these (Murthi et al 1995; Drèze et al 2001)
statistical studies, to have no significant effect on gender bias in child survival, and can
sometimes—when not accompanied by empowerment of women—even strengthen,
rather than weaken, the gender bias in child survival. This applies inter alia to
urbanisation, male literacy, the availability of medical facilities, and the level of poverty.
In so far as a positive connection does exist in India between the level of development
and reduced gender bias in (child) survival, it seems to work mainly through variables
that are directly related to women’s agency, such as female literacy and female labour
force participation’ (Sen 2005: 244).
Objective and Research Questions:
The study will make an attempt to identify the pattern of gender gaps in child
health in India, to find out its socioeconomic and demographic determinants and explore
the possible role of female education and women’s agency in reducing the gender gap. It
will focus on selected indicators of health outcomes (e.g., post-neonatal mortality, child
mortality, prevalence of malnutrition) and health-seeking behaviour (e.g., immunisation
coverage [preventive health care], medical treatment in diarrhoea and medical treatment
in fever/ cough [curative health care] and breastfeeding [feeding practice]). Here neonatal
mortality is not considered because it is least affected by socioeconomic and

demographic indicators and is mostly due to biological reasons. On the basis of
exploratory data analysis, the study intends to address the following questions:
Is there evidence of gender gap in various indicators of health-seeking behaviour
(e.g., immunisation coverage, medical treatment in diarrhoea, medical treatment in
fever/cough and breastfeeding), and if so, how does the gender gap vary between
different regions?
Is there evidence of gender gap in various health outcomes (e.g., post-neonatal
mortality, child mortality, malnutrition), and if so, how does the gender bias vary
between different regions?
Can the gender gap (if any) in various health outcomes be related to a corresponding
gender gap in various indicators of health-seeking behaviour?
If gender gap exists, what is the regional pattern of gender gap in child health in
India? How has this regional pattern of gender gap changed over the study period of
almost one-and-a-half decades?
What are the socio-economic and demographic determinants of gender gap in health
outcomes and health-seeking behaviour?
How does female education and women’s agency affect the gender gap in health
outcomes and health-seeking behaviour?
Are the results of previous analyses robust?
Data and Methodology:
The present study uses secondary data from National Family Health Survey
(NFHS)-III (2005-06), NFHS-II (1998-99), and NFHS-I (1992-93). These surveys
provides state-level estimates of demographic and health parameters as well as data on
various socioeconomic and demographic factors that are critical for bringing about
desired changes in India’s demographic and health situation. NFHS-I was a ‘landmark in
the history of collection of demographic data through surveys’ (Visaria et al 1999). ‘It is
widely recognised that the NFHSs play a pivotal role in providing valuable conventional
and non-conventional demographic and health information on India’ (Rajan et al 2004).
It is worth noting that the NFHS series is regarded as ‘storehouse of demographic and
health data in India’ (ibid). The NFHS is ‘unique’ (or ‘unprecedented’) because of—

uniformity of its questionnaires, sampling method, data collection, analysis of data; a
representative sample in the north-eastern states for the first time; in-depth uniform
training of interviewers and strict supervision (Kanitkar 1999, Bhat and Zavier 1999).
The NFHS sampling design followed a systematic, multi-stage stratified random sample
of households, all over the country (Kanitkar 1999). A post-survey check (with five
percent of samples) of NFHS-I also confirmed its ‘high quality data’ (Singh 1999).
Children under age three years are the unit of the present analysis. A child data
file is created by merging selected household and mother’s characteristics from
household and women’s data files respectively. The predictor variables could be birth
order of the child (1, 2, 3, 4 and above), residence (rural, urban), mother’s education
(illiterate, primary, secondary, higher), mother’s age (19 or less, 20-24, 25-29, 30-49),
antenatal care (no, yes), religion (Hindu, Muslim, Christian and other religious
minorities), caste/ tribe (general, other backward class, scheduled caste, scheduled tribe),
standard of living index (low, medium, high) or wealth index (poorest, poorer, middle,
richer, richest), media exposure1 (no, yes), sex of household head (female, male),
mother’s empowerment index2 (low, medium, high), zone of states (Central, North, East,
Northeast, West, South), electricity (no, yes).
The study identifies patterns of gender gap in post-neonatal mortality, child
mortality, prevalence of malnutrition, immunisation coverage, diarrhoea treatment, fever/
cough treatment, and breast-feeding. The gender gap is calculated as a relative gap
between the achievement of boys and girls (first two questions). For the third question,
state-level OLS regression is undertaken. The study uses the Borda rule and Principal
Component Analysis to see the regional pattern in gender gap in child health for the
fourth question. For the fifth question, binary bivariate and multivariate logit regression
1 It includes whether a child’s mother reads newspaper/ magazine at least once a week or almost every day
or listens to radio at least once a week or almost every day or watches TV at least once a week or almost
every day or go to cinema hall/ theatre at least once a month. 2 It shows decision making power of mothers’ within a family. The following recoded variables are chosen
for its construction: permission to get medical help for self, who decides how to spend money, mother’s
type of earnings for work, final say on health care, final say on making large household purchases, final say
on making household purchases for daily needs, final say on visits to family or relatives, final say on
deciding what to do with money husband earns, allowed to go to market, allowed to go to health facility,
allowed to go to places outside this village/ community, have bank or saving account, has money for her
own use. The method of unweighted aggregation is followed by which the scores of the above-mentioned
thirteen recoded variables are simply added to get the scores of MEI.

analyses are performed. Structural estimation of the full model is beyond the scope of the
present study, which estimates a few reduced form models examining the magnitude of
gender bias in child health after controlling for socioeconomic and demographic factors
that could influence gender bias. Logistic regression results are presented in multiple
classification analysis (MCA) form. This involves calculating unadjusted and adjusted
values of the response variable for each category of every predictor variable. Unadjusted
values are calculated from logit regressions incorporating only one predictor variable.
Adjusted values are calculated from logit regressions incorporating all predictor variables
simultaneously. When calculating the adjusted values for a particular predictor variable,
all other predictor variables are controlled by setting them to their mean values in the
underlying regression (Retherford and Choe 1993). The effectiveness of female education
and women’s empowerment (sixth question), can be seen from the adjusted effects of the
logistic regression results. The robustness of the results is tested using the first and
second round of the NFHS dataset.
Analysis and Results:
1. Gender Gap in Health-seeking Behaviour for Children in India
Here we will explore if there is any evidence of gender gap in the selected
indicators of health-seeking behaviour for children in the states of India. The selected
indicators of health-seeking behaviour are: childhood immunisation, childhood diarrhoea,
childhood fever/ cough and childhood breastfeeding. We will see the extent of gender gap
in these indicators in the Indian states and how this gender gap changes over the study
period of almost one-and-a-half decades.
The state-wise gender gap for all the indicators is calculated using the following
relative gap formula: 100X
X X GapGender
Girl
GirlBoy
. This measure of gender gap is
the relative gap between boy and girl minus one and then taken in per cent (used in
Arokiasamy 2004: 844; Jatrana: 8; Macintyre 2001; Murthi et al 1995: 757; Nussbaum
1995: 22-31; Pande 2003: 403; Rajan et al 2000; Yount 2003: 272). Some studies
measure gender gap as the absolute gap (Kimhi 2006; Nangia et al (forthcoming)—
difference and absolute difference) or as the relative gap (Arokiasamy et al

(forthcoming)—simple arithmetic average of relative gaps) or both (Klasen 1996; Paci
and Murthi 2006). These studies use a particular gap (or more than one gap) without
giving much rationale for the choice.
A relative gap measure captures both the levels of coverage and gender equality.
The value of gender gap decreases as coverage rates increase for both boys and girls with
same absolute gap between them and it decreases as coverage rates increases for both
boys and girls with lower absolute gap between them. A gender-equity-sensitive indicator
(GESI) would have been a better measure, though the choice of degree of inequality
aversion equal to two is questionable.
This relative gap formula satisfies all the four principles of an inequality index,
namely, principle of population symmetry, principle of transfer, principle of scale
invariance and principle of constant addition. An absolute gap formula, however, does
not satisfy principle of scale invariance and principle of constant addition. Moreover, the
absolute gap formula is not unit-free but a relative gap formula is free of any units.
State-wise gender gap in full immunisation is shown in figure-1. There exists a
positive gender gap in immunisation in India in all three rounds of NFHS (more than five
percent). The states witnessing a reduction in gender gap over time are: Delhi, Haryana,
Himachal Pradesh, Rajasthan, Uttarakhand, Uttar Pradesh, Orissa, Nagaland, Sikkim and
Tamil Nadu. Bihar is the only state where gender gap remains almost stagnant at above
40 percent over the thirteen year period. Meghalaya is the only state that has a gender gap
favourable to girl children in all three rounds of NFHS though its extent is decreasing
over time. Maharashtra is the only state where gender gap consistently increased over
time.
For all three indicators of childhood diarrhoea, state-wise gender gap in three
rounds of NFHS is presented in figures-2, -3 and -4. There exists a positive gender gap in
all three indicators of childhood diarrhoea in India in favour of boys in all three rounds of
NFHS. In case of diarrhoea, girls received no treatment at least eight percent more than
boys and boys received medical treatment at least five percent more than girls in India.
Boys are also more likely receive ORS than girls.
Gender gaps in these two indicators of childhood fever/ cough across the states
are presented in figures-5 and -6. There exists a positive gender gap in both the indicators

of childhood fever/ cough in India in favour of boys in all three rounds of NFHS. In case
of fever/ cough, girls received no treatment at least ten percent more than boys and boys
received medical treatment at least six percent more than girls in India.
It clearly shows that in most of the states there is a decrease in medical treatment
in public health facility over the years (figure-7)3. Gender gap in childhood fever/ cough
treatment in public and private health facility across the states are presented in figures-8
and -9 respectively.
State-wise gender gaps in childhood breastfeeding for five indicators (never
breastfed, less than six months breastfed, at least six months breastfed, currently
breastfeeding and exclusively breastfed for first six months) are shown in figures-10-14.
So it is evident that there is strong evidence of gender gap in the selected thirteen
indicators of health-seeking behaviour in immunisation, diarrhoea, fever/ cough and
breastfeeding for children in all the states of India. For a particular state, it might so
happen that for a particular variable, gender gap (and/or its sign) changes over time and
the gender gap (and/or its sign) changes for different variables in a particular time period.
2. Gender Gap in Health Outcome for Children in India
Here we will explore if there is any evidence of gender gap in the selected
indicators of health outcomes for children in the states of India. The selected indicators of
health outcomes are childhood malnutrition and childhood mortality. Gender gap in
childhood malnutrition is shown in figures-15-20.
Post-neonatal death rate is calculated as the percentage of children age 1-11
months who died among the children ever born for boy and girl children separately for
each state. Gender gap in post-neonatal death is shown in figure-21. Child death rate is
calculated as the percentage of children age 12-35 months who died among the children
ever born for boy and girl children separately for each state. Gender gap in child death is
shown in figure-22. From figures-21 and -22 one can argue that as children grow older,
girl children receive more harshly biased treatment.
3 Percentage of the children (also for boy and girl children separately) who were sick and taken to any
public health facility steadily declined over time from 27 percent in 1992-93 to 18 percent in 2005-06. But
percentage of the children who were sick and taken to any private health facility steadily increased over the
same time from 80 percent to 90 percent. This raises serious concern about the quality and acceptability of
the public health facilities in India.

So it is evident that there is strong evidence of gender gap in the selected eight
indicators of health outcome in malnutrition and mortality for children in the states of
India. For a particular state it might so happen that for a particular variable gender gap
(and/or its sign) changes over time and gender gap (and/or its sign) changes for different
variables in a particular time period.
3. Impact of Gender Gap in Health-seeking Behaviour on Gender Gap in Health
Outcome4
Here we will examine whether the gender gap in various health outcomes is
related to a corresponding gender gap in various indicators of health-seeking behaviour.
Ordinary least square (OLS) method will be used for state-level reduced-form
regressions. The selected dependent variables are gender gap in post-neonatal survival,
gender gap in childhood survival and gender gap in childhood nutrition. Independent
variables are gender gap in full immunisation, gender gap in medical treatment in
diarrhoea, gender gap in medical treatment in fever/ cough and gender gap in
breastfeeding with at least six months breastfed. In addition we incorporate two dummy
variables for major states and southern states. We run OLS regression for three separate
statistical models for each round of NFHS as well as for the pooled data of all three
rounds.
The study found that the gender gaps in various health outcomes are not much
related to the gender gaps in various indicators of health-seeking behaviour. So the
gender gap in health-seeking behaviour does not really transform into the gender gap in
health outcome for the children in the states of India.
However for girl children’s health achievement, the indicators of health-seeking
behaviour are significantly related to the indicators of health outcome. Full immunisation
rate for the girl children has a consistently significant impact on all the indicators of
health outcome. An increase in full vaccination coverage rate for girl children reduces
post-neonatal mortality, childhood mortality and childhood malnutrition rates for the girl
children. Girl children’s health outcome is worse in the major states compared to other
non-major states.
4 Tables will be provided on request.

4. Pattern of Gender Gap in Child Health in India
Here we will try to see if there is any pattern of gender gap in child health exists
in India. Also we will try to explore whether this pattern of gender gap in child health
remained consistent over the study period of almost one-and-a-half decades. If we can
identify the consistent pattern of gender gap, it is possible to focus on those particular
areas to reduce and remove gender gap.
4A. State-wise Pattern of Gender Gap in Child Health in India5
The selected 21 indicators of health-seeking behaviour and health outcome are:
for childhood immunisation—A: childhood full vaccination; for diarrhoea—B: childhood
diarrhoea with 'no treatment', C: childhood diarrhoea with 'medical treatment', D:
childhood diarrhoea with 'given ORS'; for breastfeeding—E: childhood breastfeeding
with 'never breastfed', F: childhood breastfeeding with 'less than six months breastfed', G:
childhood breastfeeding with 'at least six months breastfed', H: childhood breastfeeding
with 'currently breastfeeding', I: childhood breastfeeding with 'exclusively breastfed for
first six months'; for malnutrition—J: severely stunted (height-for-age, -3 SD), K: stunted
(height-for-age, -2 SD), L: severely underweight (weight-for-age, -3 SD), M:
underweight (weight-for-age, -2 SD), N: severely wasted (weight-for-height, -3 SD), O:
wasted (weight-for-height, -2 SD); for fever/ cough—P: childhood fever/ cough with
‘received no treatment’, Q: childhood fever/ cough with ‘received medical treatment’, R:
childhood fever/ cough with ‘received medical treatment in public health facility’, S:
childhood fever/ cough with ‘received medical treatment in private health facility’; and
for mortality—T: post-neonatal death, U: child death.
The 21 dimensions will be reduced by some ordinal measure. As an ordinal
aggregator, the study used the well-known Borda rule (named after Jean-Charles de
Borda who devised it in 1770). The rule gives a method of rank-order scoring, the
method being to award each state a point equal to its rank in each indicator (A-U) of
ranking, adding each state’s scores to obtain its aggregate score, and then ranking states
on the basis of their aggregate scores (Dasgupta 1995: 109-16), separately for each round
of NFHS.
5 For details, see Patra (2012a).

Each state is ranked for each of the chosen indicators to capture the relative
position of the Indian states in gender bias against girl children. A higher rank (number)
indicates higher gender bias against girl children. Ranking is done in ascending order (a
higher value indicates higher gender bias against girls) for the following indicators—A,
C, D, G, H, I, Q, R, and S. For the rest of the indicators, ranking is done in descending
order (a lower value indicates higher gender bias against girls). Borda rank is calculated
for each state on the basis of their aggregate scores for each round of NFHS. State-wise
Borda rank in gender bias against girl children in child health is presented in table-1.
Again, a higher rank (number) signifies higher gender bias against girls. For any NFHS
round, a Borda rank of one signifies lowest gender bias against girls in that state for that
period.
From table-1, one can see that there are lot of ups and down in the state-wise
rankings as we move from NFHS-I to NFHS-III. Over almost the one and a half decades
of the study period, Gujarat, Himachal Pradesh, Uttarakhand, Jharkhand, Chhattisgarh
and Meghalaya consistently improved their ranks, i.e., gender bias against girl children
has consistently reduced relative to the other states. But the picture is just the reverse for
Punjab and Mizoram where gender bias against girl children in child health has
consistently increased over time relative to the other states. Table-2 provides the rank
(Spearman) correlation coefficient for each pair of Borda rankings from the three rounds
of NFHSs (given in table-1). The rank correlation coefficients are not significant even at
10 percent level, suggesting that the state-wise pattern of gender bias against girl children
in child health is not consistent.
To check the robustness of the absence of a consistent state-wise pattern in gender
bias in child health, the analysis needs further calibration. First, instead of all the 21
indicators we took only six indicators (A, C, G, L, Q and U) for all the 29 states. Doing
the same exercise as above, the (Spearman) correlation coefficients for each pair of Borda
rankings from the three rounds of NFHSs are not significant even at 10 percent level as
before (table-3). Second, we do the same exercise for the major 19 states with the same
six indicators (A, C, G, L, Q and U). Again the correlation coefficients are also not
significant (see tables-4 and -5).
To check robustness of the results the study also uses Principal Component
Analysis (PCA) technique as a second tool to reduce dimensions. PCA reduces a large set
of variables to a much smaller set that still contains most of the information about the
large set. It reduces the variation in a correlated multi-dimension to a set of uncorrelated
components. Principal components (defined as a normalised linear combination of the
original variables) are constructed from the 21 indicators. The principal components with
Eigen value greater than one are considered. Then a composite index is constructed as a
weighted average of the principal components or factors, where the weights are (Eigen
value of the corresponding principal component)/ (sum of all Eigen values) (Kumar et al
2007: 107-9). On the basis of the values of the composite index all the states are ranked
in ascending order separately for each round of NFHS.
For calculation of PCA, all the 21 indicators were made unidirectional. Say, for b,
we used the B: childhood diarrhoea with ‘no treatment’. We deducted the percentages of
boys and girls who received ‘no treatment’ from 100 to get percentages of boys and girls
who received ‘any treatment’. Then the gender gap is calculated using the previously
mentioned formula. The same method is applied for b, e, f, j, k, l, m, n, o, p, t, and u also.
With the values of composite index, states are ranked in ascending order, separately for
each round of NFHS. A higher rank (number) indicates higher gender bias against girls.
With the values of composite index, states are ranked in ascending order, separately for
each round of NFHS. A higher rank (number) indicates higher gender bias against girls.
Here we consider six principal factors with Eigen values greater than one in both
NFHS-I and –II; and in NFHS-III, seven principal factors with Eigen values greater than
one are considered. The cumulative variance explained by these principal factors is 83
percent for NFHS-I, 78 percent for NFHS-II and 82 percent for NFHS-III. With these
principal factors, we construct a composite index and rank the states accordingly. Table-6
presents the state-wise composite index and the ranks of the states. From table-6 one can
see that there are lot of ups and down in the state-wise rankings as we move from NFHS-
I to NFHS-III. Over the study period of thirteen years, Gujarat, Himachal Pradesh,
Rajasthan, Karnataka and to some extent Orissa, consistently improved their ranks, i.e.,
gender bias against girl children has consistently reduced relative to the other states. But
the picture is just reverse for Punjab, Bihar and Mizoram where gender bias against girl

children in child health has consistently increased over time. For the entire picture of
state-wise pattern of gender bias over the three rounds of NFHSs, we need table-7. Table-
7 provides the (Spearman) correlation coefficient for each pair of rankings from the three
rounds of NFHSs (given in table-6). The correlation coefficients are not significant even
at 10 percent level suggesting that there is no consistent state-wise pattern of gender bias
against girl children in child health.
To check the robustness of the absence
of a consistent state-wise pattern in gender bias in child health, the analysis is calibrated
further. First, we consider only one principal component that explains the largest
proportion of total variation in all the 21 indicators. The total variance explained by the
first principal component is only 24 percent for NFHS-I, 23 percent for NFHS-II, and 20
percent for NFHS-III. But the (Spearman) correlation coefficients are not significant
except for the correlation coefficient between the ranks in NFHS-I and NFHS-II
(significant at five percent level). As the total explained variance is quite low, we should
not place much weight on this solitary exception.
Secondly, we considered only the 19
major states. Now, we are considering only two principal factors with Eigen values
greater than one in NFHS-I and three principal factors with Eigen values greater than one
for both NFHS-II and -III. The cumulative variance explained by these principal factors
is 57 percent for NFHS-I, 79 percent for NFHS-II and 76 percent for NFHS-III. With
these principal factors, we construct a composite index and rank the states accordingly.
Again, the correlation coefficients of the ranks are not significant as before.
The study found that any consistently robust state-wise pattern of gender bias
against girl children in child health is not present among all the 29 Indian states over the
three rounds of NFHSs. However, the absence of any consistent state-wise pattern in
gender bias does not mean that there is no gender bias in child health in the Indian states.
Among the 19 major states, overall, there is high gender bias in three Empowered Action
Group of states (namely, Uttar Pradesh, Madhya Pradesh, and Bihar) and in Andhra
Pradesh, Punjab, and Gujarat as well. The states which succeeded in reducing gender bias
against girl children in child health over the years as compared to the other states are
Gujarat, Himachal Pradesh, Rajasthan, West Bengal, Uttarakhand, Chhattisgarh, and

Jharkhand. But for the states of Jammu and Kashmir, Punjab, Uttar Pradesh, Madhya
Pradesh, Bihar, Maharashtra, Andhra Pradesh and Tamil Nadu gender bias against girl
children has consistently increased over time relatively.
Along with the gender gap one should also look at the absolute level of health
achievement for both boys and girls. There may be untoward cases of low gender gap
with low absolute achievement level for both sexes. By the Rawlsian (Rawls 1971)
theory of justice6 which gives complete priority to the worst-off group’s gain (Sen 2000:
70), one should focus on the health achievement by the girl children only with reduction
in gender bias in child health being the ultimate motto.
An attempt has been made to see if there is any state-wise pattern in health status
for girl children only over the three rounds of NFHSs. For this we selected only six
indicators (A, C, G, L, Q and U) of health-seeking behaviour and health outcome for girl
children only. Based on these six indicators, the Borda ranks of the states are presented in
table-8 for three rounds of NFHSs. Table-9 shows that the (Spearman) rank correlations
of the ranks of states for various NFHS rounds are strongly significant now. Thus there is
a consistent state-wise pattern of girl children’s health status. This finding may be
interpreted as, overall, girl children’s health achievement in different states moved more
or less in the same direction, but girl children’s relative achievement compared to boys in
health has not moved in the same direction for all the states over the study period.
6 Compared to the Utilitarian approach, the Rawlsian theory of ‘justice as fairness’ has many decisive
advantages. The Rawlsian theory also has merits in terms of scope and reach over more relativist and less
universalist approaches that have sometimes been proposed. The concern with equity in addition to
efficiency as reflected in Rawl’s principles of justice puts equity at the centre of disputes about justice in a
way that utilitarianism (peripherally concerned with equity) fails to do (Sen 1995).
Concentrating on the consistent state-wise pattern of girl children’s health
achievement is fairly justified on the Rawlsian premise as in the social valuation function
it assumes the degree of inequality aversion tending to infinity. As a policy measure, to
reduce gender bias in child health, we need to focus on the states with low health
achievement by girls (i.e., lower Borda ranks in table-8), viz., Rajasthan, Uttar Pradesh,
Uttarakhand, Madhya Pradesh, Chhattisgarh, Bihar, Jharkhand, Orissa, Assam and
Andhra Pradesh.
4B. Regional Pattern of Gender Gap in Child Health in India7
Here six indicators, one from each dimension, are chosen: health-seeking
behaviour— childhood full vaccination, childhood diarrhoea with ‘medical treatment’,
childhood breastfeeding with ‘at least six months breastfed’, childhood fever/ cough with
‘received medical treatment’; health outcome— childhood nutrition (weight-for-age,
above -2 SD), childhood survival. For the variable region of states, North includes Delhi,
Haryana, Himachal Pradesh, Jammu and Kashmir, Punjab and Rajasthan; Central
includes Madhya Pradesh, Chhattisgarh, Uttar Pradesh, and Uttarakhand; East includes
Bihar, Jharkhand, Orissa and West Bengal; Northeast includes Arunachal Pradesh,
Assam, Manipur, Meghalaya, Mizoram, Nagaland, Sikkim and Tripura; West includes
Goa, Gujarat and Maharashtra; South includes Andhra Pradesh, Karnataka, Kerala and
Tamil Nadu.
A gender-equity-sensitive indicator (GESI) is used to measure gender inequality
which is simply the Atkinson index. Lesser the value of the index, lesser will be the
gender inequality, i.e., a lower value implies better status (technical note-1, UNDP 1995).
For robustness of the results, in addition to this, gender gap is also calculated using the
previous relative gap formula. The six dimensions are reduced by the Borda rule and
PCA technique.
The study found that any consistently robust region-wise pattern of gender bias
against girl children in child health is not present among the six Indian regions of states
over the three rounds of NFHSs. However, there is a consistent region-wise pattern of girl
children’s health status.
7 For details, see Patra (2011a).

4C. Pattern of Gender Gap in Infant Mortality in India: Evidence from NFHS and SRS Data8
Here infant mortality rate (IMR) is taken as a proxy for child health conditions.
According to Reidpath et al (2003), the causes of infant mortality are ‘strongly correlated
to those structural factors like economic development, general living conditions, social
wellbeing, and the quality of the environment, that affect the health of entire population’.
State-wise IMR is computed from the unit-level records for the major sixteen states of
India for five-year period preceding the survey for both boys and girls separately as well
as for all children for three NFHSs. For robustness, IMR data is also taken from the
published Sample Registration System (SRS) data. Gender gap is calculated as a relative
gap as before. From figures-23-28, it is evident that there is gender bias in IMR though its
extent differs across surveys.
The study found that any consistently robust state-wise pattern of gender bias
against girl children in IMR is not present among the sixteen major states. But, there is a
consistent inter-temporal state-wise pattern in girl infants’ mortality status. This result
remains valid irrespective of the data we use.
Thus it is evident that any consistently robust pattern of gender bias against girl
children in child health is not present in India. But there is a consistent pattern of girl
children’s health achievement. This is true irrespective of the number of indicators we
use or the number of states we select or the measurement of gender bias or the method to
reduce dimensions. As a policy measure, to reduce gender bias in child health, we need to
focus on the states with low health achievement by girls viz., Rajasthan, Punjab, Haryana,
Uttar Pradesh, Uttarakhand, Madhya Pradesh, Chhattisgarh, Bihar, Jharkhand, Orissa,
Assam, Andhra Pradesh, Tamil Nadu and Gujarat.
5. Determinants of Gender Gap in Child Health in India
A consistently robust inter-temporal pattern of girl children’s health achievement
emphasises the need to focus exclusively on the girl children. If we can identify the
factors which can improve girl children’s health achievements, the same factors will, in
turn, be able to reduce gender gap in child health on the Rawlsian premise. To find out
the determinants of girl children’s health achievement, the study will use logistic
8 For details, see Patra (2011b, 2012b).

regression technique to examine only girl children’s health achievements. Logistic
regressions are performed (a) for all India level, (b) for rural areas in India, (c) for
demographic factors only in India and (d) for socioeconomic factors only in India. The
dependent variables9 are—full immunisation, and malnutrition.
5A. Determinants of Full Immunisation for Girl Children
The analysis of immunisation coverage focuses on living girl children age 12-23
months during the Survey. This age group is selected because full immunisation (BCG,
three doses each of DPT and Polio and measles) is recommended for all children by the
age of one year. Multicollinearity problem is not there as the correlation coefficients are
much less than the threshold magnitude.
Table-10 shows the unadjusted and adjusted effects on full immunisation
coverage in India for three rounds of NFHS. There is a consistently inverse relationship
between immunisation coverage and birth order of a girl child in India. The majority of
first-order births occur to younger women who are more likely to utilise maternal and
child health care services than older women. One can think of two countervailing effects
of increasing birth-order on likelihood of vaccination. The positive one could be some
kind of learning effect about immunisation which almost does not vary with higher birth-
order. The negative one could be some kind of negligence effect to the higher order births
and this effect perhaps increasingly increases with higher birth order. Thus for higher
order births, it seems that the negligence effect more than offset the learning effect.
The unadjusted likelihoods of residence suggest that it has a positive effect on the
girl children from urban areas. After controlling for other variables the rural- urban
disparity almost vanishes (except for NFHS-II). When we control for the demographic
factors only, urban girl children are significantly more likely to be fully immunised in all
three rounds of the data. This implies that the unadjusted likelihoods for residence in
baseline regressions capture mainly the effects of the selected socioeconomic variables.
Hence it can be argued that the rural-urban disparity is not due to demographic factors
but to socioeconomic factors. High immunisation coverage in urban areas is however
supported by many researchers (Pebley et al 1996; Padhi 2001).
9 Logistic regression results for medical treatment in diarrhoea, medical treatment in fever/cough, at least
six months breastfeeding and child death are almost similar and hence not shown in this paper.

There is a strong positive relationship between mother’s education and girl
children’s immunisation coverage. The adjusted effects are lower than unadjusted ones
but still strongly significant. Such positive effects of maternal education is also
hypothesised by Padhi (2001), Dasai et al (1998), Islam et al (1996), Gage et al (1997),
Pebley et al (1996) and Mosley et al (1984) though Gauri et al (2002) find a spurious
effect.
The chance of immunisation of girl children increases with the mother’s age only
up to the age group of 25-29 year and then decreases. A positive relationship is also noted
by Steele et al (1996). In the context of rural Bangladesh, Islam et al (1996) show that the
likelihood of vaccination decreases for the mothers older than 28 years.
Antenatal care during pregnancy has a strong positive direct effect on vaccination.
Antenatal care increases the possibility of meeting health-care personnel who help
mothers to raise their awareness by disseminating information regarding immunisation.
Such a positive relationship is also noted by Islam et al (1996).
The likelihood of immunisation also varies with religion. Girl children from
Muslim households are less likely to be fully vaccinated and girl children from Christian
and other religious minority households are more likely to be fully vaccinated, compared
to girl children from Hindu households. Caste/ tribe also affect full immunisation. The
chance of being fully vaccinated is consistent with the relative traditional social hierarchy
of castes/ tribes. So girl children from the backward caste/ tribe households are less likely
to be fully immunised even if vaccines are available to all for free.
The chance of immunisation increases with the standard of living index or wealth
index of girl children’s households (except for the adjusted ones in NFHS-II). Mosley et
al (1984) also argue for household income as a proximate determinant of immunisation
coverage. Islam et al (1996) also noted such a positive relationship with household
income. Though vaccines are freely available under UIP, household income (as measured
by SLI or wealth index) does have a positive effect on childhood immunisation.
Girl children of mothers with some exposure to mass media are more likely to be
fully vaccinated than their counterparts whose mothers do not have any exposure to mass
media. This indicates that media exposure has a significantly positive effect on
immunisation. However, Gauri et al (2002) do not find any significant effect of media.

After controlling for the other included variables, the sex of household head does
not have any significant effect on full vaccination (except in NFHS-II). However, in the
context of rural Orissa, Panda (1997) shows that children from male headed households
are more likely to be immunised than those from female headed households. Moreover,
he shows that the gender inequality (boys are more likely than girls) in preventive health
care persists regardless of the gender of the household head.
Mother’s empowerment index has a positive effect on full immunisation in
NFHS-III but it does not have any significant effect in NFHS-II. The immunisation rate
varies widely across different zones too. Girl children from northeast zone are the least
likely to be fully vaccinated. Household electrification has also a significantly strong
positive role on full immunisation in India. Such a positive effect possibly works through
availability of electronic mass media, establishment of an institutional health facility in
the vicinity, higher wealth index, etc. Islam et al (1996) also noted such a positive
relationship.
The effects of the variables remain same in case of rural India or for demographic
factors only or for socioeconomic factors only as in the all-India regression model.
5B. Determinants of Malnutrition for Girl Children
The analysis of childhood malnutrition focuses on the living girl children age
below 36 months. Here malnutrition refers to underweight. Children whose weight-for-
age is below minus two standard deviations from the median of the international
reference population are considered to be underweight. Multicollinearity problem is not
there as the correlation coefficients are much less than the threshold magnitude.
Table-11 shows the unadjusted and adjusted effects on malnutrition in India for
three rounds of NFHS. The unadjusted likelihoods suggest that as a girl child’s birth
order increases she will be more and more likely to be malnourished. After controlling
for other variables, the effect of birth order almost vanishes. When we control for
demographic factors only, birth order does have a positive effect on malnutrition. This
implies that the unadjusted likelihoods for birth order in all-India regressions capture
mainly the effects of the selected socioeconomic variables. Thus the effect of birth order
is not due to the demographic factors but due to selected socioeconomic factors.

Adjusting for other variables girl children from urban areas are not less likely to
be malnourished than their rural counterparts. When we control for demographic factors
only, girl children from urban areas are strongly less likely to be malnourished than their
rural counterparts in each round of NFHS. Hence the rural-urban gap is not due to the
demographic factors but due to the socioeconomic factors.
Girl children of educated mothers are less likely to be malnourished than their
counterparts of illiterate mothers. Girl children of more aged mothers are more likely to
be malnourished than girl children of mothers’ aged 19 or less. Antenatal care during
pregnancy reduces the likelihood of malnutrition for a girl child. Girl children from
backward caste households are strictly more likely to be malnourished than girl children
from general caste households. The chance of being malnourished strongly decreases
with the standard of living index or the wealth index of the girl children’s household.
Mothers’ exposure to mass media also reduces the likelihood of malnutrition. The chance
of being malnourished varies significantly across different zones too. Household
electrification reduces the likelihood of malnutrition for girl children after controls.
The effects of the variables remain same in case of rural India or for demographic
factors only or for socioeconomic factors only as in the all-India regression model.
Conclusion and Policy Discussion:
Gender inequality is a far-reaching societal impairment, not merely a special
deprivation of women (Sen 2005: 250). Gender inequality of one type tends to encourage
and sustain gender inequality of other kinds (ibid: 220). Health being one of the most
basic capabilities, the reduction and removal of gender bias in child health can go a long
way in achieving gender parity in many other dimensions of human development, not
only for the present generation but also over the generations.
The study selected thirteen indicators of health-seeking behaviour in
immunisation, diarrhoea, fever/ cough and breastfeeding and eight indicators of health
outcome in malnutrition and mortality for children age less than three years. It was shown
that there is ample evidence of varying levels of gender gap in all the states of India over
almost one-and-a-half decades. For a particular state it might so happen that for a

particular indicator, gender gap (and/ or its sign) changes over time and gender gap (and/
or its sign) changes for different indicators in a particular time period.
The gender gap in health-seeking behaviour does not transform much into the
gender gap in health outcome for the children in the states of India. However for girl
children’s health achievement, the indicators of health-seeking behaviour are
significantly related to the indicators of health outcome. Full immunisation rate for the
girl children has a consistently significant impact on all the indicators of health outcome.
Increases in vaccination coverage rates for girl children will reduce post-neonatal
mortality, childhood mortality and childhood malnutrition rates for girl children. Girl
children’s health outcome tends to be worse in the major states compared to other (non-
major) states.
It was shown that any consistently robust pattern across states of gender bias
against girl children in child health is not present. But there is a consistent pattern of girl
children’s absolute health achievement. This is true irrespective of the number of
indicators we use or the number of states we select or the measurement of gender bias or
the method to reduce dimensions. The result remains valid even when it is performed at
the regional level instead of state level. Assuming the Rawlsian theory of justice, which
gives complete priority to the worst off group’s gain, one should focus on the absolute
health achievement by the girl children only, even when reduction in gender bias in child
health is the ultimate motto. As a policy measure, to reduce gender bias in child health,
we need to focus on the states with low health achievement by girls, viz., Rajasthan,
Punjab, Haryana, Uttar Pradesh, Uttarakhand, Madhya Pradesh, Chhattisgarh, Bihar,
Jharkhand, Orissa, Assam, Andhra Pradesh, Tamil Nadu and Gujarat.
On the determinants of child health achievement, except for a few cases, the
results were consistently robust across the different models as well as across different
dependent variables.
Robust Results
o Increase in birth order of a girl child reduces the likelihood of health achievement. It
seems that the negligence effect more than offsets the learning effect. The result
perhaps shows greater apathy on the part of parents to take care of subsequent

children. Also higher order birth children are more and more constrained by
household resources.
o The likelihood of health achievement is higher for girl children from urban areas. The
rural-urban disparity in child health is not due to demographic factors but due to
socioeconomic factors.
o The likelihood of health achievement for girl children increases with mother’s
education level, mother’s empowerment index, mother’s age and mother’s exposure
to mass media. These variables tend to enhance the mother’s autonomy or agency
within the household and raise the value ascribed to girl children, which in turn helps
mothers to take greater care of girl children.
o Some antenatal care during pregnancy raises the chance of health achievement for
girls significantly. Having antenatal care increases the possibility of meeting health
personnel who help mothers to raise their awareness by disseminating information
regarding child health. This information spill-over or learning-by-doing raises health
care for girl children.
o Among the religious groups, Muslim girl children are the least likely to be fully
immunised and the most likely to be malnourished, in comparison with girl children
from Hindu households.
o The likelihood of health achievement is less for girl children from backward caste/
tribe households compared to girl children from general caste households.
o Household income measured either by the standard of living index or wealth index
raises the likelihood of health achievement for girl children. With higher household
income, parents are more likely to spend more money and time for girl children.
o The gender of the household head has no effect on the likelihood of health
achievement for girl children.
o The likelihood of health achievement for girl children increases in households with
electricity. Household electrification indirectly raises awareness about the value of
girl children and helps parents to take greater care of them.
These findings support Sen’s (2005) claim that ‘we have to look beyond material
prosperity or economic success or GNP growth…’. The non-existence of any consistent
pattern of gender bias in child health implies that there are many pathways of gender

injustice. However, the consistent pattern in girl children’s health achievement calls for
some policy interventions to reduce and hopefully to remove gender bias in child health
on the Rawlsian premise.
The above results suggest that a synergistic effort incorporating a number of other
sectors is needed to reduce the gender gap in child health. The need of the hour is an
equitable, participatory and intersectoral approach to health and health care (Bose, 2001).
Policies and programmes in other sectors such as education, welfare, industry, labour,
information, environment, etc. have also to be informed and influenced by public health
considerations (Gopalan, 1994). To bring gender justice, we need coordination and
convergence in the programmes of various Ministries of the Government. The policy
managers should also try the following means to reduce gender gap in child health in
India:
o Focus on female education and raising the female literacy rate.
o Step up information, education and communication (IEC) to enhance media exposure
of mothers.
o Generate enough gainful employment opportunities to raise household’s standard of
living. Also there is a need to create jobs for women to raise empowerment of mothers.
o Ensure quality antenatal care focusing on supply-side issues.
o Promote small family norm and discourage early marriage.
o Focus on girl children from Muslim households and backward castes.
o Provide electricity to every household particularly in rural areas.
o Provide basic facilities that are commonly available in urban areas universally in rural
areas.
In the new millennium, nations are judged by the well-being of their people; by
levels of health, nutrition and education; by the civil and political liberties enjoyed by
their citizens; by the protection guaranteed to children and by provisions made for the
vulnerable and the disadvantaged. Here we will discuss the extent of concern of
Government policies about gender bias in child health and how they can remove it. In the
various schemes and policies of Ministry of Health and Family Welfare and the Planning
Commission of Government of India there is hardly any mention of gender bias in child
health, leave alone the elaboration of policies to reduce and remove it. The focus appears
to be on mothers and children generally rather than specifically on girl children. In the
‘shining’ India, a Judge of Supreme Court of India has noted that ‘the fact is that
women’s exploitation is a reality and gender justice a fragile myth’ (ToI 2011).
The persistent gender bias in an array of indicators of child health in almost all the
states of India over one-and-a-half decades calls for devising a gender-aware child health
policy. To reap the benefits of the demographic dividend, first we have to ensure that our
children are healthy and capable of being healthy human capital. We need to ensure that
girl children are effectively benefited by the government health schemes that would
penetrate the problem that has roots in social behaviour and prejudices in large parts of
the country. We need to raise awareness of the people to make them understand that
women are no longer ‘patients’, but the ‘agents’ of growth and development of a country.
Such an awareness campaign will help parents to demand healthcare facilities for their
children; not only for their sons but for their daughters too. We have to ensure gender-
justice in child health by ensuring that there is no discrimination on the basis of gender.
Government as well as the civil society has to oversee the enforcement of gender justice
in health schemes and also ensure that they effectively reach all children irrespective of
their class, caste and religion. Removal of gender bias in child health is one of the early
hurdles that the country needs to overcome. Universal access to the health schemes will
hopefully put India on a double-digit growth path in a foreseeable future.
The study shows that it is high time that policy makers acknowledge gender bias
in child health and act to curb this menace. It pleads the policy makers to design health
policies by taking note of some of the way outs mentioned here to reduce gender bias in
child health in India. The policy makers must keep in mind that improvement in the lives
of girl children will actually be able to improve lives of all—men, women and children.
They should ensure that the girl children are not left unattended by the health policies so
that in future they are able to ‘hold up half the sky’.
Reference
Agarwal, Bina (1986): ‘Women, Poverty and Agricultural Growth in India’, Journal of Peasant Studies,
Vol.-13, No.-4, pp-165-220.
Agnihotri, S. (1996): ‘Juvenile Sex Ratios in India’, Economic and Political Weekly, Dec 28, pp-S3369-82.
Arnold, Fred (1997): Gender Preference for Children. Demographic and Health Surveys Report No.-23.
Arnold, Fred, Kishor, Sunita and Roy, T. K. (2002): ‘Sex-Selective Abortions in India’, Population and
Development Review, 28(4): 759-785.
Arnold, F., Choe, M. K., and Roy, T. K. (1998): ‘Son Preference, the Family-Building Process and Child
Mortality in India’, Population studies, Vol.-52, pp-301-15.
Arokiasamy, P. (2004): ‘Regional Patterns of Sex Bias and Excess Female Child Mortality in India’,
Population, 59(6): 833-63.
Arokiasamy, P. (2002): ‘Gender Preference, Contraceptive Use and Fertility in India: Regional and
Development Influences’, International Journal of Population Geography, 8(1): 49-67.
Arokiasamy, P. and Pradhan, J. (forthcoming): ‘Gender Bias against Female Children in India’ in Gender
Issues and Empowerment of Women, eds. Manoranjan Pal et al, Ch-9. New York: Nova Science
Publishers.
Bairagi, R. (1986): ‘Food Crisis, Nutrition, and Female Children in Rural Bangladesh’, Population and
Development Review, Vol.-12, pp-307-15.
Bakshi, P. M. (2006): The Constitution of India. 7th
Edition. Delhi: Universal Law Publishing Co. Pvt. Ltd.
Bardhan, P. K. (1982): ‘Little Girls and Death in India’, Economic and Political Weekly, Sep 4, pp-1448-
50.
Bardhan, P. K. (1974): ‘On Life and Death Questions’, Economic and Political Weekly, Aug. Special
Number, pp-1293-304.
Barker, D.J.P. (1995): ‘Fetal Origins of Coronary Heart Disease’, British Medical Journal, Vol.-311, pp-
171-4.
Barker, D.J.P. (1993): ‘Intrauterine Growth Retardation and Adult Disease’, Current Obstetrics
Gynaecology, Vol.-3, pp- 200-6.
Basu, Alaka M. (1992): Culture, The Status of Women and Demographic Behaviour, Oxford: Clarendon
Press.
Basu, Alaka M. (1989): ‘Is Discrimination in Food Really Necessary for Explaining Sex Differential in
Childhood Mortality?’, Population Studies, Vol.-43, pp-193-210.
Bhat, P. N. Mari (1989): ‘Mortality and Fertility in India, 1881-1961: A Reassessment’, pp-73-118 in
India’s Historical Demography: Studies in Famine, Disease and Society ed. Tim Dyson. London: Curzon.
Bhat, P.N. Mari and Zavier, A.J. Francis (2003): ‘Fertility Decline and Gender Bias in Northern India’,
Demography 40(4): 637-657.
Bhat, P.N. Mari and Zavier, A.J. Francis (1999): ‘Findings of NFHS: Regional Analysis’, Economic and
Political Weekly, Oct 16-23, pp-3008-32.
Bose, Ashish (2006): ‘Where Women Prevail: 2001 Census and Female Heads of Households’, Economic
and Political Weekly, Vol.-XLI, No.-22, pp-2192-4.
Bose, Ashish (2001): ‘Health for All by 2000: Broken Promises’, Economic and Political Weekly, Mar 17,
pp-905-7.
Bourne, K. and Walker, G. M. (1991): ‘The Differential Effect of Mothers’ Education on Mortality of Boys
and Girls in India’, Population Studies, Vol.-45, No.-2, pp-203-219.
Caldwell, Pat and Caldwell, John C. (1990): Gender Implications for Survival in South Asia, Health
Transition Working Paper No.-7. Canberra: National Centre for Epidemiology and Population Health,
Australian National University.
Caldwell, John C., Reddy, P. H. and Caldwell, Pat (1982): ‘The Causes of Demographic Change in Rural
South India: A Micro Approach’, Population and Development Review, Vol.-8, pp-689-727.
Census of India (2001): General Population Tables. Office of the Registrar General, Govt. of India.
Chen, Martha (1995): ‘A Matter of Survival: Women’s Right to Employment in India and Bangladesh’ in
Women, Culture and Development: A Study of Human Capabilities, eds. Martha Nussbaum and Jonathan
Glover. New Delhi: Oxford University Press.
Choi, J.Y. and Lee, S-H (2006): ‘Does Parental Care Increase Access to Child Immunisation? Gender Bias
among Children in India’, Social Science and Medicine, Vol.-63, pp- 107-17.
Chunkath, Sheela Rani and Athreya, V.B. (1997): ‘Female Infanticide in Tamil Nadu: Some Evidence’,
Economic and Political Weekly, Vol.-32, No.-17, pp-WS22-29.
Clark, Alice W. (1983): ‘Limitations on Female Life Chance in Rural Central Gujarat’, The Indian
Economic and Social History Review, Vol.-20, pp-1-25.
Clark, Shelley (2000): ‘Son Preference and Sex Composition of Children: Evidence from India’,
Demography, 37(1): 95-108.
Dasgupta, Partha (2000): ‘Population and Resources: An Exploration of Reproductive and Environmental
Externalities’, Population and Development Review, Vol.-26, No.-4, pp-643-89.
Dasgupta, Partha (1995): An Inquiry into Well-being and Destitution. Oxford: Clarendon Press.
Das Gupta, Monica (1994): ‘What Motivates Fertility Decline? Lessons from a Case Study of Punjab,
India’, mimeograph, Center for Population and Development Studies, Harvard University.
Das Gupta, Monica (1993): ‘Fertility Decline in Punjab, India: Parallels with Historical Europe’,
mimeograph, Center for Population and Development Studies, Harvard University.
Das Gupta, Monica (1987): ‘Selective Discrimination against Female Children in Rural Punjab, India’,
Population and Development Review, Vol.-13, No.-1, pp-77-100.
Das Gupta, M., J. Zhenghua, L. Bohua, X. Zhenming, W. Chung, and B. Hwa-Ok (2003): ‘Why is Son
Preference so Persistent in East and South Asia? A Cross-Country Study of China, India and the Republic
of Korea’, Journal of Development Studies, 40(2): 153-187.
Das Gupta, Monica and Mari Bhat, P. N. (1997): ‘Fertility Decline and Increased Manifestation of Sex Bias
in India’, Population Studies, Vol.-51, pp-307-15.
Desai, S. (1994): Gender Inequalities and Demographic Behaviour: India. New York: Population Council.
Desai, S. and Alva, S. (1998): ‘Maternal Education and Child Health: Is There a Strong Causal
Relationship?’, Demography, Vol-35, No.-1, pp-71-81.
Doyal, Lesley (2005): Gender, Health and the Millennium Development Goals (a briefing document and
resource guide). Geneva, Switzerland: Global Forum for Health Research.
Drèze, Jean (1990): Widows in Rural India. DEP Paper No. 26, Development Economics Research
Programme. London: London School of Economics.
Drèze, Jean and Murthi, Mamta (2001): ‘Fertility, Education, and Development: Evidence from India’,
Population and Development Review, Vol.-27, No.-1, pp-33-63.
Drèze, Jean and Sen, A. (eds) (1990): The Political Economy of Hunger, Vol.-I: Entitlement and Well-
Being. Oxford: Clarendon Press.
D’Souza, S. and Chen, L. C. (1980): ‘Sex Differentials in Mortality in Bangladesh’, Population and
Development Review, Vol.-6, pp-257-70.
Dyson, Tim and Moore, Mick (1983): ‘On Kinship Structure, Female Autonomy, and Demographic
Behaviour in India’, Population and Development Review, Vol-9, No.-1, pp-35-60.
El-Badry, M. A. (1969): ‘Higher Female than Male Mortality in Some Countries of South Asia: A Digest’
American Statistical Association Journal, Vol.-64, pp-1234-44.

Faisel, A., Ahmed, T., and Kundi, Z. (1993): ‘Differentials in Health-Related Variables among Children at
a Diarrhoea Training Unit in Pakistan’, Journal of Diarrhoeal Disease Research, Vol.-11, pp-19-24.
Gage, A.J., Sommerfelt, E. and Piani, A. (1997): ‘Household Structure and Childhood Immunization in
Niger and Nigeria’, Demography, Vol-34, No.-2, pp-295-309.
Ganatra, B. and Hirve, S. (1994): ‘Male Bias in Health Care Utilization for Under-Fives in a Rural
Community in Western India’, Bulletin of World Health Organization, Vol.-72, pp-101-4.
Gauri, V. and Khaleghian, P. (2002): ‘Immunization in Developing Countries: Its Political and
Organizational Determinants’, Policy Research Working Paper No.-2769, The World Bank.
George, Sabu, Abel R. and Miller, B.D. (1992): ‘Female Infanticide in Rural South India’, Economic and
Political Weekly, Vol-27, No.-22, pp-1153-6.
Gopalan, C. (1994): ‘Challenges to Public Health Systems’, Economic and Political Weekly, May 14, pp-
1204-9.
Govt. of India (2005): Investing in Health for Economic Development, Background Papers of Report of
National Commission on Macroeconomics and Health, Ministry of Health and Family Welfare, New Delhi.
Govt. of India (1946): Report of the Health Survey and Development (Bhore) Committee. Delhi: GoI Press.
Govindaswamy, P. and Ramesh, B. M. (1996): ‘Maternal Education and Gender Bias in Child Care
Practice in India’, Paper presented at the Annual Meeting of the Population Association of America, New
Orleans, May 9-11.
Hazarika, Gautam (2000): ‘Gender Differences in Children’s Nutrition and Access to Health Care in
Pakistan’, Journal of Development Studies, Vol.-37, No.-1, pp-73-92.
IIPS, Measure DHS+ and ORC Macro (2007): National Family Health Survey (NFHS-3), 2005-06: India:
Vol-1. International Institute of Population Sciences, Mumbai.
___ (2000): National Family Health Survey (NFHS-2), 1998-99: India. IIPS, Mumbai.
___ (1995): National Family Health Survey (NFHS-1), 1992-93: India. IIPS, Mumbai.
Islam, S.M.S. and Islam, M.M. (1996): ‘Influences of Selected Socio-economic and Demographic Factors
on Child Immunization in a Rural Area of Bangladesh’, Demography India, Vol-25, No.-2, pp-275-83.
Jatrana, Santosh (?): ‘Explaining Gender Disparity in Child Health in Haryana State of India’, Asian Meta
Centre Research Paper Series No.16.
Jeffery, Roger, Jeffery, P. and Lyon, A. (1984): ‘Female Infanticide and Amniocentesis’, Social Science
and Medicine, Vol.-19, No.-11, pp-1207-12.
Kanitkar, Tara (1999): ‘National Family Health Survey: Some Thoughts’, Economic and Political Weekly,
Oct 16-23, pp-3081-83.
Kimhi, Ayal (2006): ‘Gender Differences in Health and Nutrition in Southern Ethiopia’ in Gender
Disparity: Manifestation, Causes and Implication, eds Premananda Bharati and Manoranjan Pal. New
Delhi: Anmol Publications.
Kishor, Sunita (1995): ‘Gender Differentials in Child Mortality in India: A Review of Evidence’, in
Women’s Health in India: Risk and Vulnerability, ed. M. Das Gupta, T. N. Krishnan, and Lincoln Chen.
Mumbai: Oxford University Press.
___ (1993): ‘‘May God Give Sons to All’: Gender and Child Mortality in India’, American Sociological
Review, Vol.-58, No.-2, pp-247-265.
Klasen, Stephan (1996): ‘Nutrition, Health and Mortality in Sub-Saharan Africa: Is There a Gender Bias’,
The Journal of Development Studies, 32 (6), pp-913-32.
Klasen, Stephan and Wink, Claudia (2001): ‘A Turning Point in Gender Bias in Mortality?: An Update on
the Number of ‘Missing Women’’, Discussion Paper 2001-13, Dept. of Economics, Univ. of Munich.
(http://epub.ub.uni-muenchen.de)
Koenig, M. A. and D’Souza S. (1986): ‘Sex Differences in Childhood Mortality in Rural Bangladesh’,
Social Science and Medicine, Vol.-22, pp-15-22.

Kumar, S., Nagar, A.L., Samanta, S. (2007): ‘Indexing the Effectiveness of Tax Administration’, Economic
and Political Weekly, Dec 15, pp-104-10.
Kurz, K. M. and Johnson-Welch, C. (1997): Gender Differences among Children 0-5 Years: An
Opportunity for Child Survival Interventions. A Review Paper prepared for the BASICS Project. Arlington,
VA: BASICS.
Li, Jianghong (2004): ‘Gender Inequality, Family Planning, and Maternal and Child Care in a Rural
Chinese County’, Social Science and Medicine, Vol.-59, pp-695-708.
Macintyre, Sally (2001): ‘Inequalities in Health: Is Research Gender Blind’, in Poverty, Inequality and
Health: An International Perspective, eds. David Leon and Gill Walt. Oxford: Oxford University Press.
Makinson, C. (1994): ‘Discrimination against the Female Child’, International Journal of Gynecology and
Obstetrics, Vol.-46, pp-119-25.
Merchant, K. M. and Kurz, K. M. (1992): ‘Women’s Nutrition through the Life Cycle: Social and
Biological Vulnerabilities’, pp-63-90 in The Health of Women: A Global Perspectives, eds. Koblinsky, M.,
Timyan, J., and Gay, J. Boulder: Westview Press.
Miller, Barbara D. (1997): ‘Social Class, Gender and Intra-Household Food Allocations to Children in
South Asia’, Social Science and Medicine, Vol.-44, No.-11, pp-1685-95.
Miller, Barbara D. (1993): ‘On Poverty, Child Survival and Gender: Models and Misperceptions’, Third
World Planning Review, Vol.-15, No.-3, pp-iii-viii.
Miller, Barbara D. (1989): ‘Changing Patterns of Juvenile Sex Ratios in Rural India, 1961 to 1971’,
Economic and Political Weekly, June 3, pp-1229-36.
Miller, Barbara D. (1981): The Endangered Sex: Neglect of Female Children in Rural North India. Ithaca,
New York: Cornell University Press.
Mishra, Vinod, T.K. Roy, and Robert D. Retherford (2004): ‘Sex Differentials in Childhood Feeding,
Health Care and Nutritional Status in India’, Population and Development Review, 30(2): 269-295.
Moser, Caroline O.N. (1993): Gender Planning and Development: Theory, Practice and Training. New
York: Routledge.
Mosley, W. H. and Becker, S. (1991): ‘Demographic Models for Child Survival and Implications for
Health Intervention Programmes’, Health Policy and Planning, Vol.-6, pp-218-33.
Mosley, W. H. and Chen, L. C. (1984): ‘An Analytical Framework for the Study of Child Survival in
Developing Countries’, Population and Development Review (Suppl.), Vol.-10, pp-25-45.
Murthi, Mamta, Guio, A-C., Drèze, Jean (1995): ‘Mortality, Fertility, and Gender Bias in India: A District-
Level Analysis’, Population and Development Review, Vol-21, No.-4, pp-745-82.
Nangia, Parveen and Roy, T. K. (forthcoming): ‘Gender Disparity in Child Care in India: Findings from
Two NFHS’ in Gender Issues and Empowerment of Women, eds Manoranjan Pal et al, Ch-8. New York:
Nova Science Publishers.
Nussbaum, Martha C. (1995): Introduction to Women, Culture and Development: A Study of Human
Capabilities, eds. Martha Nussbaum and Jonathan Glover. New Delhi: Oxford University Press.
Obermeyer, C. M. and Cardenas, R. (1997): ‘Son Preference and Differential Treatment in Morocco and
Tunisia’, Studies in Family Planning, Vol.-28, pp-235-44.
Okin, Susan Moller (1995): ‘Inequalities between the Sexes in Different Cultural Contexts’ in Women,
Culture and Development: A Study of Human Capabilities, eds. Martha Nussbaum and Jonathan Glover.
New Delhi: Oxford University Press.
Osmani, Siddiq and Sen, A. K. (2003): ‘The Hidden Penalties of Gender Inequality: Fetal Origins of Ill-
Health’, Economics and Human Biology, Vol.-1, pp-105-21.
Paci, Pierella and Murthi, Mamta (2006): ‘Economic Transition and the Position of Women: A Survey of
the Evidence’ in Gender Disparity: Manifestation, Causes and Implication, eds Premananda Bharati and
Manoranjan Pal. New Delhi: Anmol Publications.
Padhi, Sakti (2001): ‘Infant and Child Survival in Orissa: An Analysis with NFHS Data’, Economic and
Political Weekly, Aug 25, pp-3316-26.
Panda, Pradeep K. (1997): ‘Female Headship, Poverty and Child Welfare: A Study of Rural Orissa’,
Economic and Political Weekly, Oct 25, pp-WS-73-WS-82.
Pande, Rohini P. (2003): ‘Selective Gender Differences in Childhood Nutrition and Immunization in Rural
India: The Role of Siblings’, Demography, Vol.-40, No.-3, pp-395-418.
Pande, R. and N. Astone (2007): ‘Explaining Son Preference in Rural India: The Independent Role of
Structural versus Individual Factors’, Population Research and Policy Review, 26(1): 1-29.
Pande, Rohini P. and Yazbeck, A.S. (2003): ‘What’s in a Country Average? Wealth, Gender, and Regional
Inequalities in Immunisation in India’, Social Science and Medicine, Vol.-57, pp-2075-88.
Pandey, A. et al (2002): ‘Gender Differences in Healthcare-Seeking during Common Illnesses in a Rural
Community of West Bengal, India’, Journal of Health, Population, Nutrition, Vol.-20, No.-4, pp-306-11.
Papanek, Hanna (1990): ‘To Each Less Than She Needs, From Each More Than She Can Do: Allocations,
Entitlements, and Value’ in Tinker I. (ed) Persistent Inequalities: Women and World Development. New
York and Oxford: Oxford University Press.
Parasuraman, S. and Roy, T. K. (1991): ‘Some Observations of the 1991 Census Population of India’,
Journal of Family Welfare, Vol.-37, pp-62-68.
Patra, N. (2012a): ‘State-wise Pattern of Gender Bias in Child Health in India’, International Journal of
Child Health and Human Development, Vol.-5, No.-3. Available at MPRA: http://mpra.ub.uni-
muenchen.de/21435.
Patra, N. (2012b): ‘A Comment on Infant Mortality Rate in India’, International Public Health Journal,
Vol-4, No-2.
Patra, N. (2011a): ‘Credible Neglect in Incredible India: Regional Pattern of Gender Bias in Child Health
in India’, International Public Health Journal, Vol-3, No-3.
Patra, N. (2011b): ‘Inter-temporal Pattern of Gender Bias in Infant Mortality in India: Evidence from
NFHS and SRS Data’, International Journal of Child and Adolescent Health, Vol-4, No-1, pp-53-65.
Retherford, Robert D. and Minja Kim Choe (1993): Statistical Methods for Causal Analysis, New York:
John Wiley and Sons.
Pebley, A. R. and Amin, S. (1991): ‘The Impact of a Public-Health Intervention on Sex Differentials in
Childhood Mortality in Rural Punjab, India’, Health Transition Review, Vol.-1, pp-143-69.
Rajan, S.I. and James, K.S. (2004): ‘Second National Family Health Survey: Emerging Issues’, Economic
and Political Weekly, Feb 14, pp-647-51.
Rajan, S.I., Sudha, S. and Mohanachandran, P. (2000): ‘Fertility Decline and Worsening Gender Bias in
India: Is Kerala No Longer an Exception?’, Development and Change, Vol-31, pp-1085-92.
Ravindran, S. (1986): Health Implications of Sex Discrimination in Childhood: A Review Paper and an
Annotated Bibliography. Geneva: WHO/ UNICEF.
Rawls, John (1971): A Theory of Justice. Cambridge: Harvard University Press.
Reidpath, Daniel and Allotey, Pascale (2003): ‘Infant Mortality Rate as an Indicator of Population
Health’, Journal of Epidemiology and Community Health, Vol-57, pp. 344–346.
Retherford, Robert D. and Minja Kim Choe (1993): Statistical Methods for Causal Analysis, New York:
John Wiley and Sons.
Rosenzweig, Mark and Schultz, T. Paul (1982): ‘Market Opportunities, Genetic Endowments, and
Intrafamily Resource Distribution: Child Survival in Rural India’, American Economic Review, Vol-72, pp-
803-15.
Sen, A. K. (2005): The Argumentative Indian. London: Penguin Books Ltd.
Sen, A. K. (2000): ‘Social Justice and Distribution of Income’, Chapter-1 in A.B. Atkinson and F.
Bourguignon ed. Handbook of Income Distribution. Elsevier.
Sen, A. K. (1998): ‘Mortality as an Indicator of Economic Success and Failure’, The Economic Journal,
Vol.-108, No.-446, pp-1-25.
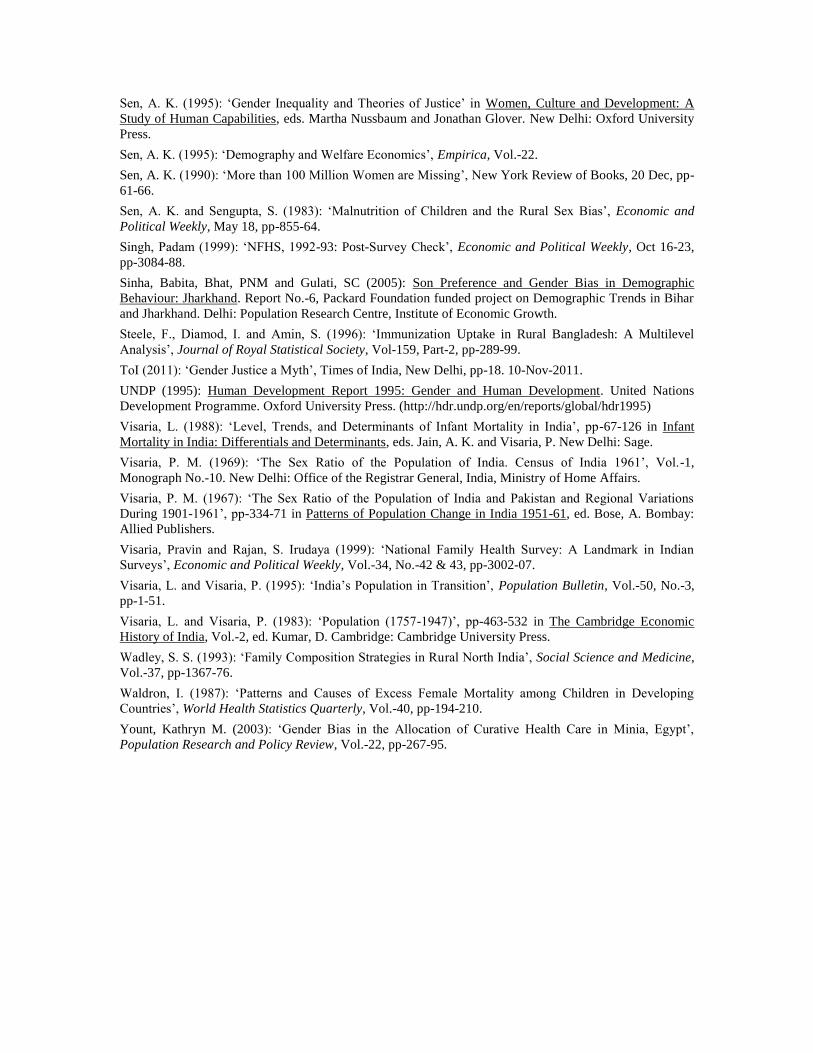
Sen, A. K. (1995): ‘Gender Inequality and Theories of Justice’ in Women, Culture and Development: A
Study of Human Capabilities, eds. Martha Nussbaum and Jonathan Glover. New Delhi: Oxford University
Press.
Sen, A. K. (1995): ‘Demography and Welfare Economics’, Empirica, Vol.-22.
Sen, A. K. (1990): ‘More than 100 Million Women are Missing’, New York Review of Books, 20 Dec, pp-
61-66.
Sen, A. K. and Sengupta, S. (1983): ‘Malnutrition of Children and the Rural Sex Bias’, Economic and
Political Weekly, May 18, pp-855-64.
Singh, Padam (1999): ‘NFHS, 1992-93: Post-Survey Check’, Economic and Political Weekly, Oct 16-23,
pp-3084-88.
Sinha, Babita, Bhat, PNM and Gulati, SC (2005): Son Preference and Gender Bias in Demographic
Behaviour: Jharkhand. Report No.-6, Packard Foundation funded project on Demographic Trends in Bihar
and Jharkhand. Delhi: Population Research Centre, Institute of Economic Growth.
Steele, F., Diamod, I. and Amin, S. (1996): ‘Immunization Uptake in Rural Bangladesh: A Multilevel
Analysis’, Journal of Royal Statistical Society, Vol-159, Part-2, pp-289-99.
ToI (2011): ‘Gender Justice a Myth’, Times of India, New Delhi, pp-18. 10-Nov-2011.
UNDP (1995): Human Development Report 1995: Gender and Human Development. United Nations
Development Programme. Oxford University Press. (http://hdr.undp.org/en/reports/global/hdr1995)
Visaria, L. (1988): ‘Level, Trends, and Determinants of Infant Mortality in India’, pp-67-126 in Infant
Mortality in India: Differentials and Determinants, eds. Jain, A. K. and Visaria, P. New Delhi: Sage.
Visaria, P. M. (1969): ‘The Sex Ratio of the Population of India. Census of India 1961’, Vol.-1,
Monograph No.-10. New Delhi: Office of the Registrar General, India, Ministry of Home Affairs.
Visaria, P. M. (1967): ‘The Sex Ratio of the Population of India and Pakistan and Regional Variations
During 1901-1961’, pp-334-71 in Patterns of Population Change in India 1951-61, ed. Bose, A. Bombay:
Allied Publishers.
Visaria, Pravin and Rajan, S. Irudaya (1999): ‘National Family Health Survey: A Landmark in Indian
Surveys’, Economic and Political Weekly, Vol.-34, No.-42 & 43, pp-3002-07.
Visaria, L. and Visaria, P. (1995): ‘India’s Population in Transition’, Population Bulletin, Vol.-50, No.-3,
pp-1-51.
Visaria, L. and Visaria, P. (1983): ‘Population (1757-1947)’, pp-463-532 in The Cambridge Economic
History of India, Vol.-2, ed. Kumar, D. Cambridge: Cambridge University Press.
Wadley, S. S. (1993): ‘Family Composition Strategies in Rural North India’, Social Science and Medicine,
Vol.-37, pp-1367-76.
Waldron, I. (1987): ‘Patterns and Causes of Excess Female Mortality among Children in Developing
Countries’, World Health Statistics Quarterly, Vol.-40, pp-194-210.
Yount, Kathryn M. (2003): ‘Gender Bias in the Allocation of Curative Health Care in Minia, Egypt’,
Population Research and Policy Review, Vol.-22, pp-267-95.
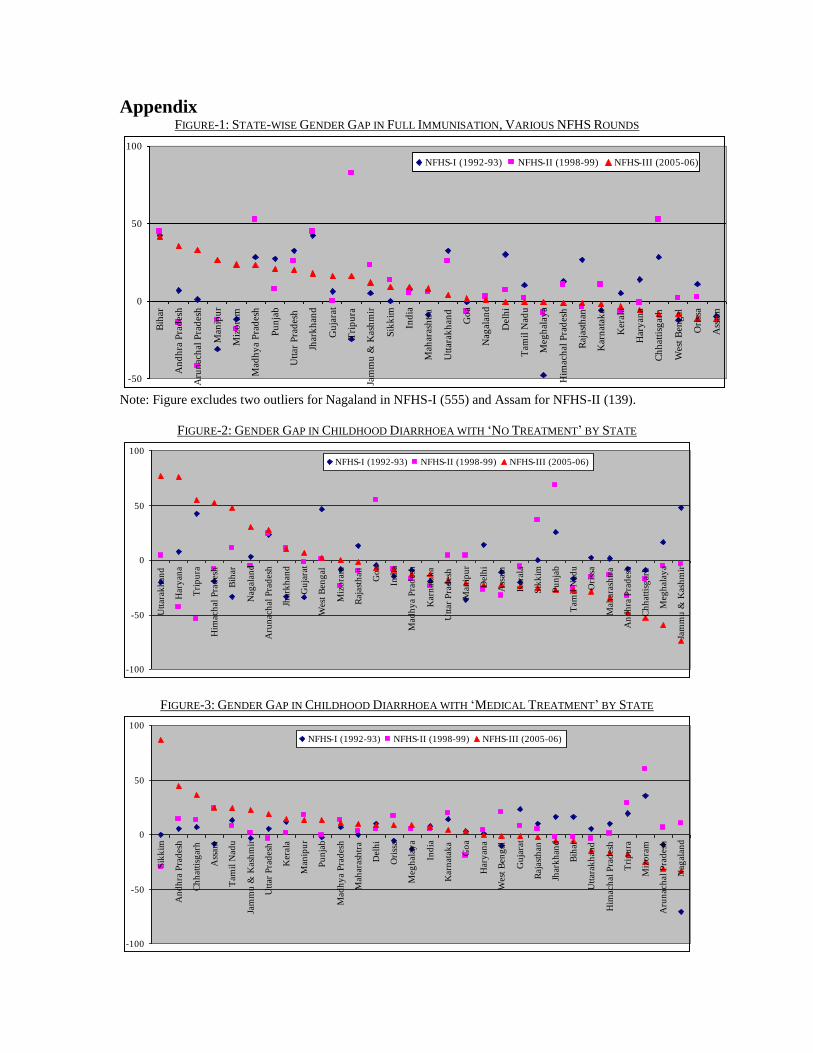
Appendix FIGURE-1: STATE-WISE GENDER GAP IN FULL IMMUNISATION, VARIOUS NFHS ROUNDS
-50
0
50
100
Bih
ar
An
dh
ra P
rad
esh
Aru
nac
hal
Pra
des
h
Man
ipu
r
Miz
ora
m
Mad
hy
a P
rad
esh
Pu
nja
b
Utt
ar P
rad
esh
Jhar
kh
and
Gu
jara
t
Tri
pu
ra
Jam
mu
& K
ash
mir
Sik
kim
Ind
ia
Mah
aras
htr
a
Utt
arak
han
d
Go
a
Nag
alan
d
Del
hi
Tam
il N
adu
Meg
hal
aya
Him
ach
al P
rad
esh
Raj
asth
an
Kar
nat
aka
Ker
ala
Har
yan
a
Ch
hat
tisg
arh
Wes
t B
eng
al
Ori
ssa
Ass
am
NFHS-I (1992-93) NFHS-II (1998-99) NFHS-III (2005-06)
Note: Figure excludes two outliers for Nagaland in NFHS-I (555) and Assam for NFHS-II (139).
FIGURE-2: GENDER GAP IN CHILDHOOD DIARRHOEA WITH ‘NO TREATMENT’ BY STATE
-100
-50
0
50
100
Utt
arak
han
d
Har
yan
a
Tri
pu
ra
Him
ach
al P
rad
esh
Bih
ar
Nag
alan
d
Aru
nac
hal
Pra
des
h
Jhar
kh
and
Gu
jara
t
Wes
t B
eng
al
Miz
ora
m
Raj
asth
an
Go
a
Ind
ia
Mad
hy
a P
rad
esh
Kar
nat
aka
Utt
ar P
rad
esh
Man
ipu
r
Del
hi
Ass
am
Ker
ala
Sik
kim
Pu
nja
b
Tam
il N
adu
Ori
ssa
Mah
aras
htr
a
An
dh
ra P
rad
esh
Ch
hat
tisg
arh
Meg
hal
aya
Jam
mu
& K
ash
mir
NFHS-I (1992-93) NFHS-II (1998-99) NFHS-III (2005-06)
FIGURE-3: GENDER GAP IN CHILDHOOD DIARRHOEA WITH ‘MEDICAL TREATMENT’ BY STATE
-100
-50
0
50
100
Sik
kim
An
dh
ra P
rad
esh
Ch
hat
tisg
arh
Ass
am
Tam
il N
adu
Jam
mu
& K
ash
mir
Utt
ar P
rad
esh
Ker
ala
Man
ipu
r
Pu
nja
b
Mad
hy
a P
rad
esh
Mah
aras
htr
a
Del
hi
Ori
ssa
Meg
hal
aya
Ind
ia
Kar
nat
aka
Go
a
Har
yan
a
Wes
t B
eng
al
Gu
jara
t
Raj
asth
an
Jhar
kh
and
Bih
ar
Utt
arak
han
d
Him
ach
al P
rad
esh
Tri
pu
ra
Miz
ora
m
Aru
nac
hal
Pra
des
h
Nag
alan
d
NFHS-I (1992-93) NFHS-II (1998-99) NFHS-III (2005-06)

FIGURE-4: GENDER GAP IN CHILDHOOD DIARRHOEA WITH ‘GIVEN ORS’ BY STATE
-55
0
55
110
Ass
am
Jam
mu
& K
ash
mir
Ker
ala
Ori
ssa
Ch
hat
tisg
arh
Kar
nat
aka
Meg
hal
aya
Har
yan
a
Utt
ar P
rad
esh
Mad
hy
a P
rad
esh
Del
hi
Wes
t B
eng
al
Sik
kim
Go
a
Ind
ia
Miz
ora
m
Mah
aras
htr
a
Utt
arak
han
d
Jhar
kh
and
Tri
pu
ra
Nag
alan
d
Raj
asth
an
Man
ipu
r
Him
ach
al P
rad
esh
Aru
nac
hal
Pra
des
h
Gu
jara
t
Bih
ar
Tam
il N
adu
An
dh
ra P
rad
esh
Pu
nja
b
NFHS-I (1992-93) NFHS-II (1998-99) NFHS-III (2005-06)
Note: Figure excludes two outliers for Mizoram (139) in NFHS-I and Assam (382) for NFHS-III.
FIGURE-5: GENDER GAP IN CHILDHOOD FEVER/ COUGH WITH ‘RECEIVED NO TREATMENT’
-70
-35
0
35
70
Ker
ala
Meg
hal
aya
Gu
jara
t
Kar
nat
aka
Him
ach
al P
rad
esh
Man
ipu
r
Mad
hy
a P
rad
esh
Tam
il N
adu
Ch
hat
tisg
arh
Miz
ora
m
Bih
ar
Jhar
kh
and
Aru
nac
hal
Pra
des
h
Pu
nja
b
Nag
alan
d
Har
yan
a
Ass
am
Jam
mu
& K
ash
mir
Mah
aras
htr
a
Ori
ssa
Ind
ia
An
dh
ra P
rad
esh
Raj
asth
an
Sik
kim
Utt
ar P
rad
esh
Del
hi
Wes
t B
eng
al
Tri
pu
ra
Utt
arak
han
d
Go
a
NFHS-I (1992-93) NFHS-II (1998-99) NFHS-III (2005-06)
FIGURE-6: GENDER GAP IN CHILDHOOD FEVER/ COUGH WITH ‘RECEIVED MEDICAL TREATMENT’
-35
0
35
70
Utt
arak
han
d
Tri
pu
ra
Sik
kim
Go
a
Nag
alan
d
Raj
asth
an
Wes
t B
eng
al
Ori
ssa
Bih
ar
Utt
ar P
rad
esh
Aru
nac
hal
Pra
des
h
Ind
ia
Jam
mu
& K
ash
mir
Del
hi
Ass
am
An
dh
ra P
rad
esh
Har
yan
a
Him
ach
al P
rad
esh
Tam
il N
adu
Kar
nat
aka
Man
ipu
r
Mah
aras
htr
a
Miz
ora
m
Pu
nja
b
Jhar
kh
and
Ch
hat
tisg
arh
Mad
hy
a P
rad
esh
Ker
ala
Gu
jara
t
Meg
hal
aya
NFHS-I (1992-93) NFHS-II (1998-99) NFHS-III (2005-06)

FIGURE-7: FEVER/ COUGH WITH ‘RECEIVED MEDICAL TREATMENT IN PUBLIC HEALTH FACILITY’
0
50
100
Bih
ar
Har
yan
a
Utt
ar P
rad
esh
Jhar
kh
and
Pu
nja
b
Wes
t B
eng
al
Gu
jara
t
An
dh
ra P
rad
esh
Mah
aras
htr
a
Ind
ia
Ch
hat
tisg
arh
Del
hi
Go
a
Kar
nat
aka
Utt
arak
han
d
Mad
hy
a P
rad
esh
Ker
ala
Nag
alan
d
Tam
il N
adu
Ass
am
Tri
pu
ra
Raj
asth
an
Jam
mu
& K
ash
mir
Ori
ssa
Man
ipu
r
Him
ach
al P
rad
esh
Meg
hal
aya
Aru
nac
hal
Pra
des
h
Miz
ora
m
Sik
kim
NFHS-I (1992-93) NFHS-II (1998-99) NFHS-III (2005-06)
FIGURE-8: GENDER GAP IN CHILDHOOD FEVER/ COUGH WITH
‘RECEIVED MEDICAL TREATMENT IN PUBLIC HEALTH FACILITY’
-50
0
50
100
Pu
nja
b
An
dh
ra P
rad
esh
Him
ach
al P
rad
esh
Nag
alan
d
Wes
t B
eng
al
Meg
hal
aya
Mad
hy
a P
rad
esh
Go
a
Aru
nac
hal
Pra
des
h
Ker
ala
Jam
mu
& K
ash
mir
Utt
arak
han
d
Miz
ora
m
Ori
ssa
Ind
ia
Raj
asth
an
Man
ipu
r
Ch
hat
tisg
arh
Sik
kim
Gu
jara
t
Ass
am
Del
hi
Kar
nat
aka
Mah
aras
htr
a
Utt
ar P
rad
esh
Tri
pu
ra
Jhar
kh
and
Tam
il N
adu
Bih
ar
Har
yan
a
NFHS-I (1992-93) NFHS-II (1998-99) NFHS-III (2005-06)
Note: Figure excludes the outlier Punjab (189) in NFHS-III.
FIGURE-9: GENDER GAP IN CHILDHOOD FEVER/ COUGH
WITH ‘RECEIVED MEDICAL TREATMENT IN PRIVATE HEALTH FACILITY’
-70
-35
0
35
Miz
ora
m
Sik
kim
Tri
pu
ra
Ch
hat
tisg
arh
Gu
jara
t
Utt
arak
han
d
Del
hi
Ori
ssa
Mah
aras
htr
a
Jhar
kh
and
Wes
t B
eng
al
Ass
am
Tam
il N
adu
Har
yan
a
Kar
nat
aka
Utt
ar P
rad
esh
Bih
ar
Nag
alan
d
Ind
ia
Go
a
Man
ipu
r
Pu
nja
b
Raj
asth
an
Mad
hy
a P
rad
esh
An
dh
ra P
rad
esh
Ker
ala
Aru
nac
hal
Pra
des
h
Jam
mu
& K
ash
mir
Him
ach
al P
rad
esh
Meg
hal
aya
NFHS-I (1992-93) NFHS-II (1998-99) NFHS-III (2005-06)

FIGURE-10: GENDER GAP IN CHILDHOOD BREASTFEEDING WITH ‘NEVER BREASTFED’ BY STATE
-100
-50
0
50
100
Ch
hat
tisg
arh
Ker
ala
Meg
hal
aya
Tam
il N
adu
Nag
alan
d
Wes
t B
eng
al
Del
hi
Mad
hy
a P
rad
esh
Pu
nja
b
Utt
ar P
rad
esh
Go
a
Ori
ssa
Ind
ia
Man
ipu
r
Bih
ar
Kar
nat
aka
Utt
arak
han
d
Him
ach
al P
rad
esh
Mah
aras
htr
a
An
dh
ra P
rad
esh
Aru
nac
hal
Pra
des
h
Raj
asth
an
Ass
am
Jam
mu
& K
ash
mir
Har
yan
a
Miz
ora
m
Jhar
kh
and
Sik
kim
Gu
jara
t
Tri
pu
ra
NFHS-I (1992-93) NFHS-II (1998-99) NFHS-III (2005-06)
Note: Figure excludes the outliers for Kerala (233), West Bengal (129) and Arunachal Pradesh (178) in
NFHS-I and Meghalaya (173), Tamil Nadu (160) for NFHS-III.
FIGURE-11: GENDER GAP IN BREASTFEEDING WITH ‘LESS THAN SIX MONTHS BREASTFED’ BY STATE
-60
0
60
Meg
hal
aya
Him
ach
al P
rad
esh
Miz
ora
m
Del
hi
Raj
asth
an
Wes
t B
eng
al
Ch
hat
tisg
arh
Jam
mu
& K
ash
mir
Utt
arak
han
d
Bih
ar
Ker
ala
Pu
nja
b
Mah
aras
htr
a
Nag
alan
d
Man
ipu
r
Tri
pu
ra
Aru
nac
hal
Pra
des
h
Ind
ia
Jhar
kh
and
Gu
jara
t
Utt
ar P
rad
esh
Ass
am
Sik
kim
Go
a
Kar
nat
aka
Mad
hy
a P
rad
esh
Ori
ssa
An
dh
ra P
rad
esh
Har
yan
a
Tam
il N
adu
NFHS-I (1992-93) NFHS-II (1998-99) NFHS-III (2005-06)
FIGURE-12: GENDER GAP IN CHILDHOOD BREASTFEEDING WITH ‘AT LEAST SIX MONTHS BREASTFED’
-15
0
15
Har
yan
a
An
dh
ra P
rad
esh
Go
a
Ori
ssa
Ass
am
Kar
nat
aka
Gu
jara
t
Mad
hy
a P
rad
esh
Sik
kim
Tri
pu
ra
Tam
il N
adu
Utt
ar P
rad
esh
Jhar
kh
and
Aru
nac
hal
Pra
des
h
Ind
ia
Utt
arak
han
d
Mah
aras
htr
a
Man
ipu
r
Jam
mu
& K
ash
mir
Pu
nja
b
Ch
hat
tisg
arh
Bih
ar
Raj
asth
an
Ker
ala
Wes
t B
eng
al
Nag
alan
d
Miz
ora
m
Him
ach
al P
rad
esh
Del
hi
Meg
hal
aya
NFHS-I (1992-93) NFHS-II (1998-99) NFHS-III (2005-06)

FIGURE-13: GENDER GAP IN CHILDHOOD BREASTFEEDING WITH ‘CURRENTLY BREASTFEEDING’ BY STATE
-10
0
10
Pu
nja
b
Ass
am
Miz
ora
m
Ch
hat
tisg
arh
An
dh
ra P
rad
esh
Jam
mu
& K
ash
mir
Har
yan
a
Mah
aras
htr
a
Bih
ar
Jhar
kh
and
Del
hi
Mad
hy
a P
rad
esh
Utt
arak
han
d
Raj
asth
an
Man
ipu
r
Ind
ia
Meg
hal
aya
Sik
kim
Tri
pu
ra
Ori
ssa
Tam
il N
adu
Utt
ar P
rad
esh
Kar
nat
aka
Wes
t B
eng
al
Aru
nac
hal
Pra
des
h
Go
a
Ker
ala
Him
ach
al P
rad
esh
Gu
jara
t
Nag
alan
d
NFHS-I (1992-93) NFHS-II (1998-99) NFHS-III (2005-06)
FIGURE-14: GENDER GAP IN BREASTFEEDING WITH ‘EXCLUSIVELY BREASTFED FOR FIRST SIX MONTHS’
-100
-50
0
50
100
Del
hi
Bih
ar
Him
ach
al P
rad
esh
Har
yan
a
Jhar
kh
and
Ker
ala
Meg
hal
aya
Ch
hat
tisg
arh
Miz
ora
m
Sik
kim
Gu
jara
t
Raj
asth
an
Wes
t B
eng
al
Ind
ia
Mad
hy
a P
rad
esh
Utt
ar P
rad
esh
Aru
nac
hal
Pra
des
h
Mah
aras
htr
a
Man
ipu
r
Utt
arak
han
d
Kar
nat
aka
Ass
am
Ori
ssa
Tri
pu
ra
An
dh
ra P
rad
esh
Pu
nja
b
Tam
il N
adu
Jam
mu
& K
ash
mir
Go
a
Nag
alan
d
NFHS-I (1992-93) NFHS-II (1998-99) NFHS-III (2005-06)
FIGURE-15: GENDER GAP IN CHILDHOOD MALNUTRITION (SEVERE STUNTING)
-50
0
50
Tri
pu
ra
Utt
arak
han
d
Wes
t B
eng
al
Gu
jara
t
Ori
ssa
Ass
am
Nag
alan
d
Aru
nac
hal
Pra
des
h
Ker
ala
Miz
ora
m
Mah
aras
htr
a
Meg
hal
aya
Him
ach
al P
rad
esh
Jam
mu
& K
ash
mir
Har
yan
a
Raj
asth
an
Jhar
kh
and
Ch
hat
tisg
arh
Mad
hy
a P
rad
esh
Kar
nat
aka
Ind
ia
Sik
kim
An
dh
ra P
rad
esh
Pu
nja
b
Utt
ar P
rad
esh
Tam
il N
adu
Bih
ar
Go
a
Del
hi
Man
ipu
rNFHS-I (1992-93) NFHS-II (1998-99) NFHS-III (2005-06)
Note: Figure excludes the outliers for Mizoram (116) and Goa (344) in NFHS-II.
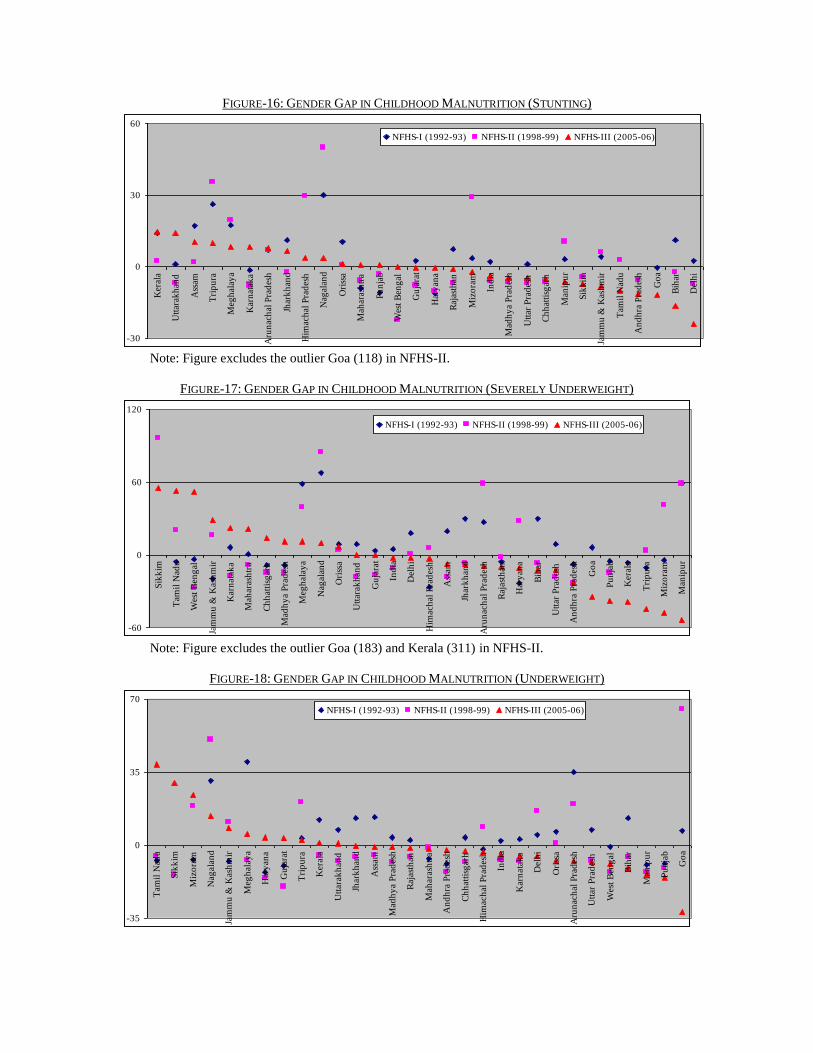
FIGURE-16: GENDER GAP IN CHILDHOOD MALNUTRITION (STUNTING)
-30
0
30
60
Ker
ala
Utt
arak
han
d
Ass
am
Tri
pu
ra
Meg
hal
aya
Kar
nat
aka
Aru
nac
hal
Pra
des
h
Jhar
kh
and
Him
ach
al P
rad
esh
Nag
alan
d
Ori
ssa
Mah
aras
htr
a
Pu
nja
b
Wes
t B
eng
al
Gu
jara
t
Har
yan
a
Raj
asth
an
Miz
ora
m
Ind
ia
Mad
hy
a P
rad
esh
Utt
ar P
rad
esh
Ch
hat
tisg
arh
Man
ipu
r
Sik
kim
Jam
mu
& K
ash
mir
Tam
il N
adu
An
dh
ra P
rad
esh
Go
a
Bih
ar
Del
hi
NFHS-I (1992-93) NFHS-II (1998-99) NFHS-III (2005-06)
Note: Figure excludes the outlier Goa (118) in NFHS-II.
FIGURE-17: GENDER GAP IN CHILDHOOD MALNUTRITION (SEVERELY UNDERWEIGHT)
-60
0
60
120
Sik
kim
Tam
il N
adu
Wes
t B
eng
al
Jam
mu
& K
ash
mir
Kar
nat
aka
Mah
aras
htr
a
Ch
hat
tisg
arh
Mad
hy
a P
rad
esh
Meg
hal
aya
Nag
alan
d
Ori
ssa
Utt
arak
han
d
Gu
jara
t
Ind
ia
Del
hi
Him
ach
al P
rad
esh
Ass
am
Jhar
kh
and
Aru
nac
hal
Pra
des
h
Raj
asth
an
Har
yan
a
Bih
ar
Utt
ar P
rad
esh
An
dh
ra P
rad
esh
Go
a
Pu
nja
b
Ker
ala
Tri
pu
ra
Miz
ora
m
Man
ipu
r
NFHS-I (1992-93) NFHS-II (1998-99) NFHS-III (2005-06)
Note: Figure excludes the outlier Goa (183) and Kerala (311) in NFHS-II.
FIGURE-18: GENDER GAP IN CHILDHOOD MALNUTRITION (UNDERWEIGHT)
-35
0
35
70
Tam
il N
adu
Sik
kim
Miz
ora
m
Nag
alan
d
Jam
mu
& K
ash
mir
Meg
hal
aya
Har
yan
a
Gu
jara
t
Tri
pu
ra
Ker
ala
Utt
arak
han
d
Jhar
kh
and
Ass
am
Mad
hy
a P
rad
esh
Raj
asth
an
Mah
aras
htr
a
An
dh
ra P
rad
esh
Ch
hat
tisg
arh
Him
ach
al P
rad
esh
Ind
ia
Kar
nat
aka
Del
hi
Ori
ssa
Aru
nac
hal
Pra
des
h
Utt
ar P
rad
esh
Wes
t B
eng
al
Bih
ar
Man
ipu
r
Pu
nja
b
Go
a
NFHS-I (1992-93) NFHS-II (1998-99) NFHS-III (2005-06)

FIGURE-19: GENDER GAP IN CHILDHOOD MALNUTRITION (SEVERE WASTING)
-70
-35
0
35
70
105
Sik
kim
Del
hi
Ori
ssa
Jam
mu
& K
ash
mir
Wes
t B
eng
al
Gu
jara
t
Miz
ora
m
Ch
hat
tisg
arh
Ass
am
Mah
aras
htr
a
Meg
hal
aya
Nag
alan
d
Jhar
kh
and
Raj
asth
an
Utt
arak
han
d
Ind
ia
Mad
hy
a P
rad
esh
Bih
ar
Go
a
An
dh
ra P
rad
esh
Utt
ar P
rad
esh
Tam
il N
adu
Aru
nac
hal
Pra
des
h
Kar
nat
aka
Har
yan
a
Him
ach
al P
rad
esh
Ker
ala
Tri
pu
ra
Pu
nja
b
Man
ipu
r
NFHS-I (1992-93) NFHS-II (1998-99) NFHS-III (2005-06)
Note: Figure excludes the outliers Assam (136), Meghalaya (179), Goa (119), Karnataka (269) and
Manipur (217) in NFHS-I, Andhra Pradesh (156), Arunachal Pradesh (433) and Kerala (150) in NFHS-II
and Sikkim (125), Delhi (119) in NFHS-III.
FIGURE-20: GENDER GAP IN CHILDHOOD MALNUTRITION (WASTING)
-50
0
50
100
Sik
kim
Del
hi
Ori
ssa
Jam
mu
& K
ash
mir
Raj
asth
an
Tam
il N
adu
Meg
hal
aya
Gu
jara
t
Him
ach
al P
rad
esh
Nag
alan
d
Mad
hy
a P
rad
esh
Bih
ar
Har
yan
a
Ind
ia
Mah
aras
htr
a
Utt
arak
han
d
Ch
hat
tisg
arh
Wes
t B
eng
al
Utt
ar P
rad
esh
Kar
nat
aka
Jhar
kh
and
Ker
ala
An
dh
ra P
rad
esh
Ass
am
Man
ipu
r
Go
a
Miz
ora
m
Pu
nja
b
Tri
pu
ra
Aru
nac
hal
Pra
des
h
NFHS-I (1992-93) NFHS-II (1998-99) NFHS-III (2005-06)
Note: Figure excludes the outliers Meghalaya (137) in NFHS-I and Arunachal Pradesh (126) in NFHS-II.
FIGURE-21: GENDER GAP IN POST-NEONATAL DEATH
-100
0
100
Meg
hal
aya
Aru
nac
hal
Pra
des
h
Tam
il N
adu
Ori
ssa
Man
ipu
r
Jhar
kh
and
Har
yan
a
Ch
hat
tisg
arh
Jam
mu
& K
ash
mir
Wes
t B
eng
al
Ker
ala
An
dh
ra P
rad
esh
Utt
ar P
rad
esh
Raj
asth
an
Ind
ia
Utt
arak
han
d
Bih
ar
Kar
nat
aka
Mah
aras
htr
a
Mad
hy
a P
rad
esh
Gu
jara
t
Ass
am
Tri
pu
ra
Nag
alan
d
Pu
nja
b
Him
ach
al P
rad
esh
Sik
kim
Del
hi
NFHS-I (1992-93) NFHS-II (1998-99) NFHS-III (2005-06)

Note: Figure excludes the outliers J & K (115), Maharashtra (129) and HP (227) in NFHS-I, Arunachal
Pradesh (181) in NFHS-II and Meghalaya (644), Arunachal Pradesh (238), TN (182), Orissa (155),
Manipur (125), Jharkhand (122), HR (122), Chhattisgarh (113) and J & K (111) in NFHS-III.
FIGURE-22: GENDER GAP IN CHILD DEATH
-65
0
65
130
Tri
pu
ra
Utt
arak
han
d
Wes
t B
eng
al
Meg
hal
aya
Har
yan
a
Jhar
kh
and
Ori
ssa
Nag
alan
d
Him
ach
al P
rad
esh
Aru
nac
hal
Pra
des
h
An
dh
ra P
rad
esh
Kar
nat
aka
Pu
nja
b
Del
hi
Raj
asth
an
Ch
hat
tisg
arh
Ker
ala
Ass
am
Ind
ia
Man
ipu
r
Gu
jara
t
Jam
mu
& K
ash
mir
Utt
ar P
rad
esh
Mah
aras
htr
a
Sik
kim
Bih
ar
Mad
hy
a P
rad
esh
Tam
il N
adu
Go
a
Miz
ora
m
NFHS-I (1992-93) NFHS-II (1998-99) NFHS-III (2005-06)
Note: Figure excludes the outliers Goa (457) and Mizoram (112) in NFHS-I, WB (139) and Kerala (122) in
NFHS-II and Tripura (347) and Uttarakhand (217) in NFHS-III.
FIGURE-23: GENDER BIAS IN IMR, NFHS-I (1988-92)
FIGURE10
-24: GENDER BIAS IN IMR, SRS-1992
10
Legend key: x<=85: High Female Advantage, 85<x<=99: Female Advantage, x=100: No Female
Advantage (neutral), 100<x<115: Female Disadvantage, 115=<x: High Female Disadvantage.
100*)( (x) GapGender bg XX .

FIGURE-25: GENDER BIAS IN IMR, NFHS-II (1994-98)
FIGURE-26: GENDER BIAS IN IMR, SRS-1998
FIGURE-27: GENDER BIAS IN IMR, NFHS-III (01-05)
FIGURE-28: GENDER BIAS IN IMR, SRS-2005

TABLE-1: STATE-WISE BORDA RANK IN GENDER
BIAS AGAINST GIRL CHILDREN
NF
HS
-I
(19
92
-93)
NF
HS
-II
(19
98
-99)
NF
HS
-III
(20
05
-06)
Nagaland 2 10 1
Meghalaya 5 4 2
H.P. 17 8 3
Gujarat 28 26 4
W.B. 8 17 5
Uttarakhand 24 18 6
Rajasthan 21 25 7
Kerala 14 5 8
Jharkhand 19 13 9
Karnataka 18 27 10
Arunach.P. 4 1 11
Tamil Nadu 10 23 12
Tripura 8 29 13
J.& K. 7 16 14
Orissa 10 15 14
Maharashtra 12 11 16
Haryana 13 9 17
Mizoram 6 7 18
Delhi 15 11 19
Chhattisgarh 22 20 20
Assam 1 28 21
M.P. 22 20 22
Bihar 19 13 23
Sikkim NA 6 24
Punjab 16 22 25
Manipur 27 3 26
U.P. 24 18 27
Andhra P. 26 24 28
Goa 3 2 29
Note: Total excludes the ranks obtained in the
indicators—for NFHS-I: J, K, N, O, and T due to
non-availability of data for some of the states
other than Sikkim; for NFHS-II and III: E, and T
due to non-availability of data for some of the
states. States are ordered according to NFHS-III
rankings.
TABLE-2: RANK-CORRELATION (SPEARMAN)
MATRIX OF BORDA RANKINGS
NF
HS
-I
NF
HS
-II
NFHS-II 0.3 — NFHS-III 0.2 -0.01
Note: none significant at 10% level (two tail).
TABLE-3: RANK-CORRELATION (SPEARMAN)
MATRIX OF BORDA RANKINGS
NF
HS
-I
NF
HS
-II
NF
HS
-III
NFHS-I —
NFHS-II 0.26 —
NFHS-III 0.10 0.04 —
Note: None significant at 10% level (two tail).
TABLE-4: BORDA RANK IN GENDER BIAS
AGAINST GIRL CHILDREN, MAJOR 19 STATES
NF
HS
-I
(19
92
-93)
NF
HS
-II
(19
98
-99)
NF
HS
-III
(20
05
-06)
W.B. 8 7 1
H.P. 15 4 2
Chhattisgarh 16 11 3
Kerala 5 3 4
Karnataka 5 19 4
Uttarakhand 9 16 6
Jharkhand 11 9 7
Rajasthan 19 14 8
Maharashtra 1 6 9
Orissa 1 18 10
Gujarat 18 8 11
Haryana 5 1 12
M.P. 16 11 13
Tamil Nadu 4 4 14
Punjab 13 2 15
J.& K. 1 11 16
Bihar 11 9 17
U.P. 9 16 18
Andhra P. 14 15 18
Note: States are ordered by NFHS-III rankings.
TABLE-5: RANK-CORRELATION (SPEARMAN)
MATRIX OF BORDA RANKINGS
NF
HS
-I
NF
HS
-II
NF
HS
-III
NFHS-I —
NFHS-II 0.045 —
NFHS-III -0.059 0.084 —
Note: none significant at 10% level (two tail).
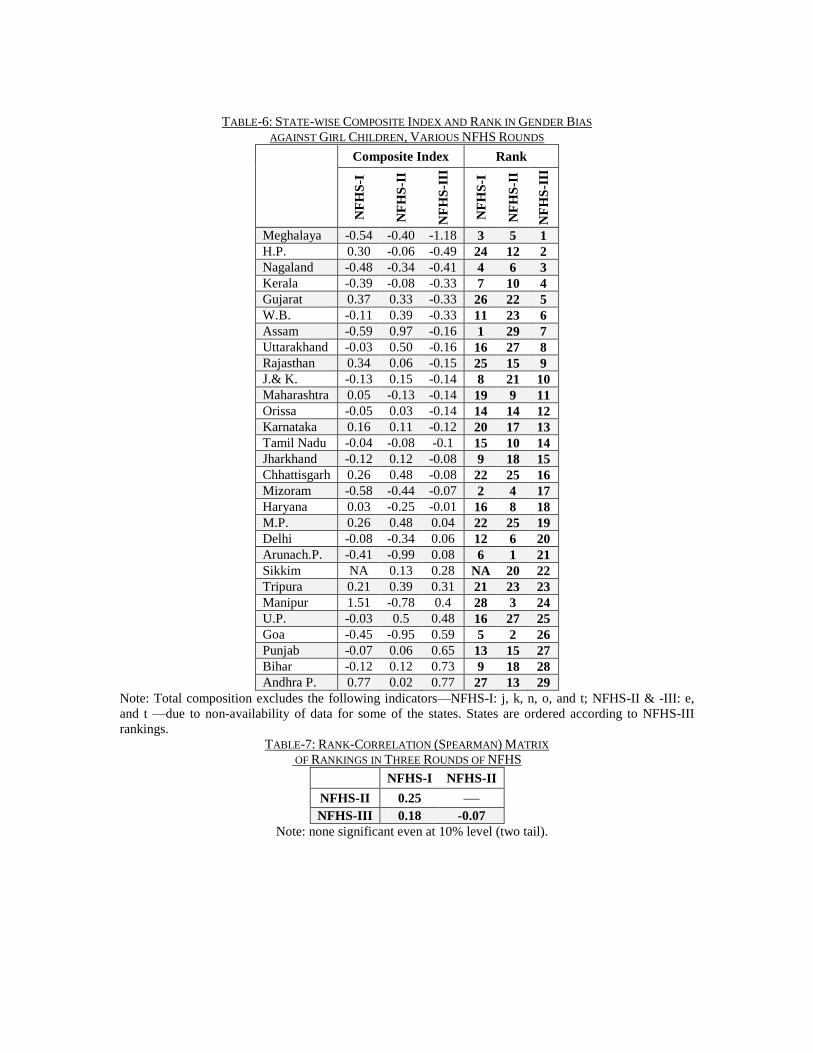
TABLE-6: STATE-WISE COMPOSITE INDEX AND RANK IN GENDER BIAS
AGAINST GIRL CHILDREN, VARIOUS NFHS ROUNDS
Composite Index Rank
NF
HS
-I
NF
HS
-II
NF
HS
-III
NF
HS
-I
NF
HS
-II
NF
HS
-III
Meghalaya -0.54 -0.40 -1.18 3 5 1
H.P. 0.30 -0.06 -0.49 24 12 2
Nagaland -0.48 -0.34 -0.41 4 6 3
Kerala -0.39 -0.08 -0.33 7 10 4
Gujarat 0.37 0.33 -0.33 26 22 5
W.B. -0.11 0.39 -0.33 11 23 6
Assam -0.59 0.97 -0.16 1 29 7
Uttarakhand -0.03 0.50 -0.16 16 27 8
Rajasthan 0.34 0.06 -0.15 25 15 9
J.& K. -0.13 0.15 -0.14 8 21 10
Maharashtra 0.05 -0.13 -0.14 19 9 11
Orissa -0.05 0.03 -0.14 14 14 12
Karnataka 0.16 0.11 -0.12 20 17 13
Tamil Nadu -0.04 -0.08 -0.1 15 10 14
Jharkhand -0.12 0.12 -0.08 9 18 15
Chhattisgarh 0.26 0.48 -0.08 22 25 16
Mizoram -0.58 -0.44 -0.07 2 4 17
Haryana 0.03 -0.25 -0.01 16 8 18
M.P. 0.26 0.48 0.04 22 25 19
Delhi -0.08 -0.34 0.06 12 6 20
Arunach.P. -0.41 -0.99 0.08 6 1 21
Sikkim NA 0.13 0.28 NA 20 22
Tripura 0.21 0.39 0.31 21 23 23
Manipur 1.51 -0.78 0.4 28 3 24
U.P. -0.03 0.5 0.48 16 27 25
Goa -0.45 -0.95 0.59 5 2 26
Punjab -0.07 0.06 0.65 13 15 27
Bihar -0.12 0.12 0.73 9 18 28
Andhra P. 0.77 0.02 0.77 27 13 29
Note: Total composition excludes the following indicators—NFHS-I: j, k, n, o, and t; NFHS-II & -III: e,
and t —due to non-availability of data for some of the states. States are ordered according to NFHS-III
rankings.
TABLE-7: RANK-CORRELATION (SPEARMAN) MATRIX
OF RANKINGS IN THREE ROUNDS OF NFHS
NFHS-I NFHS-II
NFHS-II 0.25 —
NFHS-III 0.18 -0.07
Note: none significant even at 10% level (two tail).
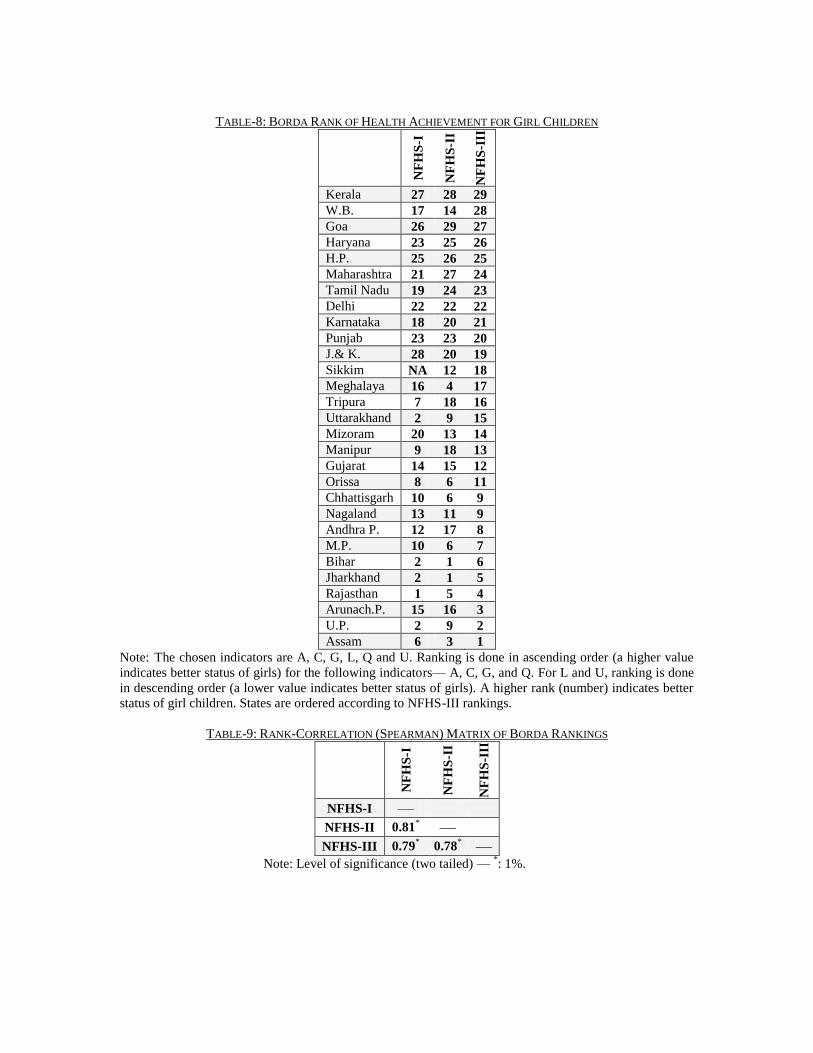
TABLE-8: BORDA RANK OF HEALTH ACHIEVEMENT FOR GIRL CHILDREN
NF
HS
-I
NF
HS
-II
NF
HS
-III
Kerala 27 28 29
W.B. 17 14 28
Goa 26 29 27
Haryana 23 25 26
H.P. 25 26 25
Maharashtra 21 27 24
Tamil Nadu 19 24 23
Delhi 22 22 22
Karnataka 18 20 21
Punjab 23 23 20
J.& K. 28 20 19
Sikkim NA 12 18
Meghalaya 16 4 17
Tripura 7 18 16
Uttarakhand 2 9 15
Mizoram 20 13 14
Manipur 9 18 13
Gujarat 14 15 12
Orissa 8 6 11
Chhattisgarh 10 6 9
Nagaland 13 11 9
Andhra P. 12 17 8
M.P. 10 6 7
Bihar 2 1 6
Jharkhand 2 1 5
Rajasthan 1 5 4
Arunach.P. 15 16 3
U.P. 2 9 2
Assam 6 3 1
Note: The chosen indicators are A, C, G, L, Q and U. Ranking is done in ascending order (a higher value
indicates better status of girls) for the following indicators— A, C, G, and Q. For L and U, ranking is done
in descending order (a lower value indicates better status of girls). A higher rank (number) indicates better
status of girl children. States are ordered according to NFHS-III rankings.
TABLE-9: RANK-CORRELATION (SPEARMAN) MATRIX OF BORDA RANKINGS
NF
HS
-I
NF
HS
-II
NF
HS
-III
NFHS-I —
NFHS-II 0.81* —
NFHS-III 0.79* 0.78
* —
Note: Level of significance (two tailed) — *: 1%.
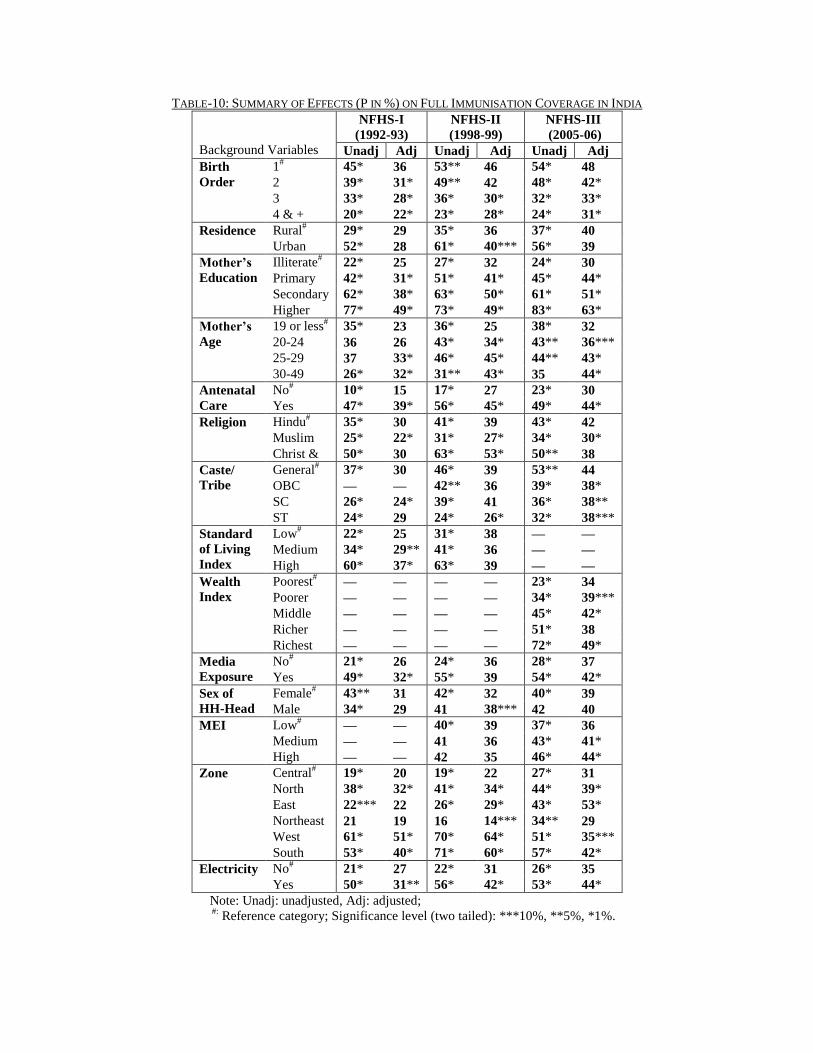
TABLE-10: SUMMARY OF EFFECTS (P IN %) ON FULL IMMUNISATION COVERAGE IN INDIA
Background Variables
NFHS-I
(1992-93)
NFHS-II
(1998-99)
NFHS-III
(2005-06)
Unadj Adj Unadj Adj Unadj Adj
Birth
Order
1# 45* 36 53** 46 54* 48
2 39* 31* 49** 42 48* 42*
3 33* 28* 36* 30* 32* 33*
4 & + 20* 22* 23* 28* 24* 31*
Residence Rural# 29* 29 35* 36 37* 40
Urban 52* 28 61* 40*** 56* 39
Mother’s
Education
Illiterate# 22* 25 27* 32 24* 30
Primary 42* 31* 51* 41* 45* 44*
Secondary 62* 38* 63* 50* 61* 51*
Higher 77* 49* 73* 49* 83* 63*
Mother’s
Age
19 or less# 35* 23 36* 25 38* 32
20-24 36 26 43* 34* 43** 36***
25-29 37 33* 46* 45* 44** 43*
30-49 26* 32* 31** 43* 35 44*
Antenatal
Care
No# 10* 15 17* 27 23* 30
Yes 47* 39* 56* 45* 49* 44*
Religion Hindu# 35* 30 41* 39 43* 42
Muslim 25* 22* 31* 27* 34* 30*
Christ & 50* 30 63* 53* 50** 38
Caste/
Tribe
General# 37* 30 46* 39 53** 44
OBC — — 42** 36 39* 38*
SC 26* 24* 39* 41 36* 38**
ST 24* 29 24* 26* 32* 38***
Standard
of Living
Index
Low# 22* 25 31* 38 — —
Medium 34* 29** 41* 36 — —
High 60* 37* 63* 39 — —
Wealth
Index
Poorest# — — — — 23* 34
Poorer — — — — 34* 39***
Middle — — — — 45* 42*
Richer — — — — 51* 38
Richest — — — — 72* 49*
Media
Exposure
No# 21* 26 24* 36 28* 37
Yes 49* 32* 55* 39 54* 42*
Sex of
HH-Head
Female# 43** 31 42* 32 40* 39
Male 34* 29 41 38*** 42 40
MEI Low# — — 40* 39 37* 36
Medium — — 41 36 43* 41*
High — — 42 35 46* 44*
Zone Central# 19* 20 19* 22 27* 31
North 38* 32* 41* 34* 44* 39*
East 22*** 22 26* 29* 43* 53*
Northeast 21 19 16 14*** 34** 29
West 61* 51* 70* 64* 51* 35***
South 53* 40* 71* 60* 57* 42*
Electricity No# 21* 27 22* 31 26* 35
Yes 50* 31** 56* 42* 53* 44*
Note: Unadj: unadjusted, Adj: adjusted;
#:
Reference category; Significance level (two tailed): ***10%, **5%, *1%.
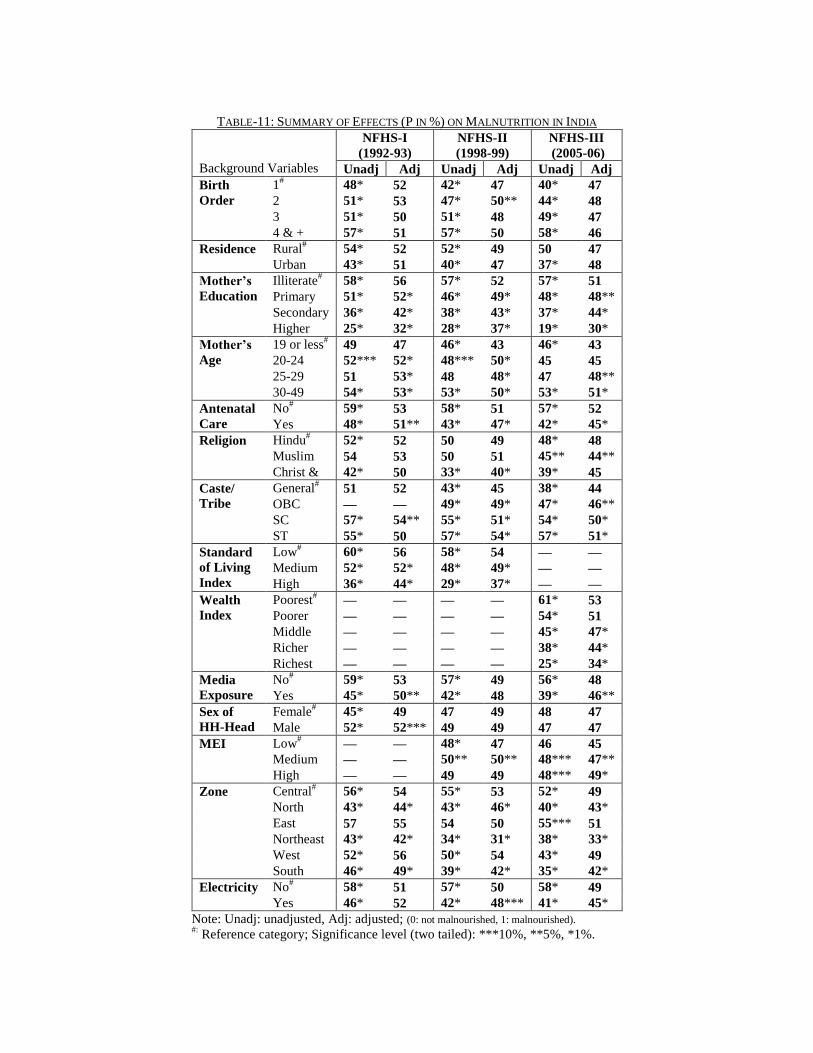
TABLE-11: SUMMARY OF EFFECTS (P IN %) ON MALNUTRITION IN INDIA
Background Variables
NFHS-I
(1992-93)
NFHS-II
(1998-99)
NFHS-III
(2005-06)
Unadj Adj Unadj Adj Unadj Adj
Birth
Order
1# 48* 52 42* 47 40* 47
2 51* 53 47* 50** 44* 48
3 51* 50 51* 48 49* 47
4 & + 57* 51 57* 50 58* 46
Residence Rural# 54* 52 52* 49 50 47
Urban 43* 51 40* 47 37* 48
Mother’s
Education
Illiterate# 58* 56 57* 52 57* 51
Primary 51* 52* 46* 49* 48* 48**
Secondary 36* 42* 38* 43* 37* 44*
Higher 25* 32* 28* 37* 19* 30*
Mother’s
Age
19 or less# 49 47 46* 43 46* 43
20-24 52*** 52* 48*** 50* 45 45
25-29 51 53* 48 48* 47 48**
30-49 54* 53* 53* 50* 53* 51*
Antenatal
Care
No# 59* 53 58* 51 57* 52
Yes 48* 51** 43* 47* 42* 45*
Religion Hindu# 52* 52 50 49 48* 48
Muslim 54 53 50 51 45** 44**
Christ & 42* 50 33* 40* 39* 45
Caste/
Tribe
General# 51 52 43* 45 38* 44
OBC — — 49* 49* 47* 46**
SC 57* 54** 55* 51* 54* 50*
ST 55* 50 57* 54* 57* 51*
Standard
of Living
Index
Low# 60* 56 58* 54 — —
Medium 52* 52* 48* 49* — —
High 36* 44* 29* 37* — —
Wealth
Index
Poorest# — — — — 61* 53
Poorer — — — — 54* 51
Middle — — — — 45* 47*
Richer — — — — 38* 44*
Richest — — — — 25* 34*
Media
Exposure
No# 59* 53 57* 49 56* 48
Yes 45* 50** 42* 48 39* 46**
Sex of
HH-Head
Female# 45* 49 47 49 48 47
Male 52* 52*** 49 49 47 47
MEI Low# — — 48* 47 46 45
Medium — — 50** 50** 48*** 47**
High — — 49 49 48*** 49*
Zone Central# 56* 54 55* 53 52* 49
North 43* 44* 43* 46* 40* 43*
East 57 55 54 50 55*** 51
Northeast 43* 42* 34* 31* 38* 33*
West 52* 56 50* 54 43* 49
South 46* 49* 39* 42* 35* 42*
Electricity No# 58* 51 57* 50 58* 49
Yes 46* 52 42* 48*** 41* 45*
Note: Unadj: unadjusted, Adj: adjusted; (0: not malnourished, 1: malnourished). #:
Reference category; Significance level (two tailed): ***10%, **5%, *1%.