Pathogenic Variation of South American Phakopsora pachyrhizi ... · Rpp genes confer specific...
12
221 JARQ 51 (3), 221 – 232 (2017) http://www.jircas.affrc.go.jp Pathogenic Variation of South American Phakopsora pachyrhizi Populations Isolated from Soybeans from 2010 to 2015 Hajime AKAMATSU 1, 7 , Naoki YAMANAKA 1 , Rafael Moreira SOARES 2 , Antonio Juan Gerardo IVANCOVICH 3 , Miguel Angel LAVILLA 4 , Alicia Noelia BOGADO 5 , Gabriela MOREL 5 , Ruth SCHOLZ 5 , Yuichi YAMAOKA 6 and Masayasu KATO 1 * 1 Biological Resources and Post-harvest Division, Japan International Research Center for Agri- cultural Sciences (JIRCAS) (Tsukuba, Ibaraki 305-8686, Japan) 2 Empresa Brasileira de Pesquisa Agropecuária, Centro Nacional de Pesquisa de Soja (Embrapa Soja) (Londrina, Paraná 86001-970, Brazil) 3 Estación Experimental Agropecuaria Pergamino, Instituto Nacional de Tecnología Agropecuaria (INTA-EEA Pergamino) (Pergamino, Buenos Aires, Argentina) 4 National University of the Northwest Province of Buenos Aires (Pergamino, Buenos Aires, Argentina) 5 Centro de Investigación Capitán Miranda, Instituto Paraguayo de Tecnología Agraria (IPTA- CICM) (Capitán Miranda, Itapúa, Paraguay) 6 Faculty of Life and Environmental Sciences, University of Tsukuba (Tsukuba, Ibaraki 305-8572, Japan) 7 Division of Lowland Farming, Central Region Agricultural Research Center, National Agriculture and Food Research Organization (CARC/NARO) (Joetsu, Niigata 943-0193, Japan) Abstract Soybean rust caused by Phakopsora pachyrhizi is one of the most serious economic threats to soybean production in South America. A previous study using South American P. pachyrhizi popula- tions collected between 2007/2008 and 2009/2010 revealed the pathogenic diversity in Argentinean, Brazilian, and Paraguayan rust populations. Because such pathogenic diversity has been a major constraint to the breeding program for soybean rust resistance, pathogen populations were continu- ously monitored throughout the 2010/2011 to 2014/2015 seasons using the same method of evaluating pathogenicity as used in the previous study. None of the 83 P. pachyrhizi samples collected from the three countries from 2010/2011 to 2014/2015 yielded identical pathogenicity patterns in the 16 differ- entials, thus demonstrating the pathogenic diversity of more recent South American rust populations. Cluster analysis using a total of 145 rust populations from 2007 to 2015 demonstrated that the Ar- gentinean, Brazilian, and Paraguayan populations were not assigned to three distinct country-based groups. The analysis indicated that a majority of South American populations differed in pathogenic- ity compared with Japanese rust races. The rates of resistance to the rust populations varied among the 13 differentials carrying Rpp genes; the most effective resistance gene was Rpp1-b followed by Rpp5, and the least effective was Rpp1 . Discipline: Plant Disease Additional key words: Asian soybean rust, Glycine max, infection type, urediniospore, virulence This paper reports the results obtained in the joint project on “Identification of Stable Resistance to Soybean Rust for South Ameri- ca” and “Development of Breeding Technologies toward Improved Production and Stable Supply of Upland Crops” supported by JIRCAS. *Corresponding author: e-mail [email protected] Received 18 May 2016; accepted 23 August 2016.
Transcript of Pathogenic Variation of South American Phakopsora pachyrhizi ... · Rpp genes confer specific...
221
Pathogenic Variation of South American Soybean Rust in 2010-2015JARQ 51 (3), 221 – 232 (2017) http://www.jircas.affrc.go.jp
Pathogenic Variation of South American Phakopsora pachyrhizi Populations Isolated from Soybeans from 2010 to 2015
Hajime AKAMATSU1, 7, Naoki YAMANAKA1, Rafael Moreira SOARES2, Antonio Juan Gerardo IVANCOVICH3, Miguel Angel LAVILLA4, Alicia Noelia BOGADO5, Gabriela MOREL5, Ruth SCHOLZ5, Yuichi YAMAOKA6 and Masayasu KATO1*1 Biological Resources and Post-harvest Division, Japan International Research Center for Agri-
cultural Sciences (JIRCAS) (Tsukuba, Ibaraki 305-8686, Japan) 2 Empresa Brasileira de Pesquisa Agropecuária, Centro Nacional de Pesquisa de Soja (Embrapa
Soja) (Londrina, Paraná 86001-970, Brazil) 3 Estación Experimental Agropecuaria Pergamino, Instituto Nacional de Tecnología Agropecuaria
(INTA-EEA Pergamino) (Pergamino, Buenos Aires, Argentina) 4 National University of the Northwest Province of Buenos Aires (Pergamino, Buenos Aires,
Argentina) 5 Centro de Investigación Capitán Miranda, Instituto Paraguayo de Tecnología Agraria (IPTA-
CICM) (Capitán Miranda, Itapúa, Paraguay) 6 Faculty of Life and Environmental Sciences, University of Tsukuba (Tsukuba, Ibaraki 305-8572,
Japan) 7 Division of Lowland Farming, Central Region Agricultural Research Center, National Agriculture
and Food Research Organization (CARC/NARO) (Joetsu, Niigata 943-0193, Japan)
AbstractSoybean rust caused by Phakopsora pachyrhizi is one of the most serious economic threats to soybean production in South America. A previous study using South American P. pachyrhizi popula-tions collected between 2007/2008 and 2009/2010 revealed the pathogenic diversity in Argentinean, Brazilian, and Paraguayan rust populations. Because such pathogenic diversity has been a major constraint to the breeding program for soybean rust resistance, pathogen populations were continu-ously monitored throughout the 2010/2011 to 2014/2015 seasons using the same method of evaluating pathogenicity as used in the previous study. None of the 83 P. pachyrhizi samples collected from the three countries from 2010/2011 to 2014/2015 yielded identical pathogenicity patterns in the 16 differ-entials, thus demonstrating the pathogenic diversity of more recent South American rust populations. Cluster analysis using a total of 145 rust populations from 2007 to 2015 demonstrated that the Ar-gentinean, Brazilian, and Paraguayan populations were not assigned to three distinct country-based groups. The analysis indicated that a majority of South American populations differed in pathogenic-ity compared with Japanese rust races. The rates of resistance to the rust populations varied among the 13 differentials carrying Rpp genes; the most effective resistance gene was Rpp1-b followed by Rpp5, and the least effective was Rpp1.
Discipline: Plant DiseaseAdditional key words: Asian soybean rust, Glycine max, infection type, urediniospore, virulence
This paper reports the results obtained in the joint project on “Identification of Stable Resistance to Soybean Rust for South Ameri-ca” and “Development of Breeding Technologies toward Improved Production and Stable Supply of Upland Crops” supported by JIRCAS.*Corresponding author: e-mail [email protected] 18 May 2016; accepted 23 August 2016.

222 JARQ 51 (3) 2017
H. Akamatsu et. al
Introduction
Soybean [Glycine max (L.) Merrill] production in South America has been growing markedly since the late 1990s, and South American countries are the largest soybean producers in the world (FAOSTAT 2013). Soybeans are economically important as a valuable source of oil and protein worldwide, and for traditional food products of the Orient. Therefore, various countries, particularly those in which the soybean industry and consumption are highly dependent on imports from other countries, are particularly interested in soybean production. With an increase in soybean cultivation areas in South America, biotic stressors such as plant pathogens and pests that negatively affect crop production are a major concern. One of the most damaging diseases of soybeans is soybean rust caused by Phakopsora pachyrhizi H. Sydow & P. Sydow (Hartman et al. 2011, Miles et al. 2003, Pennisi 2010). Soybean rust can result in a 10%-80% reduction in yield or losses of over 80%, particularly when the disease develops under preferable environmental conditions for P. pachyrhizi (Hartman et al. 2005, Levy 2005, Li et al. 2010, Pennisi 2010, Rosa et al. 2015, Yorinori et al. 2005). Since the first outbreak of soybean rust caused by P. pachyrhizi in Paraguay and Brazil in 2001 and in Argentina in 2003 (Ivancovich 2005, Rossi 2003, Yorinori et al. 2005), it has rapidly spread to most of the soybean fields throughout South America, and has continuously impacted soybean production in the region, resulting in tremendous economic losses.
Although the use of fungicides is a major measure to control the disease, production costs increase considerably with such use due to the cost of the chemicals and application management (Godoy et al. 2016). Furthermore, reduced sensitivity of rust isolates to the fungicides has been observed in Brazil (Godoy et al. 2015), most likely due to the extensive and repeated use of fungicides. Using rust-resistant soybean varieties is more economical and environment friendly than chemical control methods. Past researches on host resistance to soybean rust have identified six major resistance loci (Rpp: resistance to P. pachyrhizi), named Rpp1 to Rpp6 and an allele (Chakraborty et al. 2009, Garcia et al. 2008, Hartwig 1986, Hartwig & Bromfield 1983, Li et al. 2012, McLean & Byth 1980, Ray et al. 2009). These Rpp genes confer specific resistance to a limited set of P. pachyrhizi isolates, some of which have been used to develop Rpp gene-carrying cultivars (Garcia et al. 2011, Hartman et al. 2011) and Rpp-pyramided lines (Lemos et al. 2011, Maphosa et al. 2012, Yamanaka et al. 2015b) using conventional strategies.
By using such differences in the host-plant responses,
a method of evaluating soybean resistance to P. pachyrhizi and assessing the pathogenicity of P. pachyrhizi has been established (Akamatsu et al. 2013, Yamanaka et al. 2010). In addition, P. pachyrhizi samples from Argentina, Brazil, and Paraguay from the 2007/2008-2009/2010 cropping seasons were tested for pathogenicity on 16 soybean differentials (Akamatsu et al. 2013). The report showed a substantial pathogenic variation in the rust populations from South America and useful resistance genes. Knowledge about the pathogenic variation of the fungus is necessary for identifying genetic sources useful for reducing disease and developing rust-resistant soybean cultivars for specific growing regions.
The objectives of this study were (1) to investigate the pathogenicity of P. pachyrhizi populations infecting soybeans in Argentina, Brazil, and Paraguay from 2010 to 2015 and (2) to compare rust pathogenicity data from total eight cropping seasons from 2007 to 2015. This paper provides valuable knowledge regarding characteristics of soybean rust pathogenicity in South America that can be used to identify resistant soybean genotypes and target effective cultivars against certain pathogen populations.
Materials and methods
1. Soybean rust sampling in three South American countries
Soybean rust samples were collected in Argentina, Brazil, and Paraguay during five cropping seasons from 2010/2011 to 2014/2015 (Table 1). The table includes the soybean rust samples collected in a previous study conducted during the three cropping seasons of 2007/2008, 2008/2009, and 2009/2010 (Akamatsu et al. 2013). P. pachyrhizi population samples without single-spore (or single-lesion) isolation were used in the present study to investigate the pathogenic differences among the dominant races, rather than specific races in the samples, and to compare the pathogenicity data with the previous study (Akamatsu et al. 2013). Seven Japanese rust isolates collected in 2007, 2008, and 2009 were also used to compare pathogenicity with the South American rust samples. Each of these Japanese isolates belongs to individual races, representing seven out of eight races that were found in Ibaraki Prefecture, Japan (Table 1; Yamaoka et al. 2014). The harvesting of urediniospores from diseased soybean leaves and their storage until use were performed according to Akamatsu et al. (2013) and Yamanaka et al. (2013).
2. South American soybean rust collection from 2010/2011 to 2014/2015
In Argentina, 28 soybean rust populations were

223
Pathogenic Variation of South American Soybean Rust in 2010-2015
collected from 17 locations in 10 provinces during the five cropping seasons from 2010/2011 to 2014/2015 (Table 1). The P. pachyrhizi sample codes consisted of the sampling location codes and cropping season numbers. The 2007/2008 season was defined as the first season of the sampling period in the present study, and the numbers
for the 2010/2011, 2011/2012, 2012/2013, 2013/2014, and 2014/2015 cropping seasons correspond to 4, 5, 6, 7, and 8, respectively. The location codes APM, ANE, and ANW denote the Argentina-Pampa, Argentina-Northeast, and Argentina-Northwest regions, respectively. According to this coding system, APM1-5 is a sample collected
Sample code Country N o .
a Location Soybean croppingseason
2007/2008 2008/2009 2009/2010 2010/2011 2011/2012 2012/2013 2013/2014 2014/2015 Argentina 1 Pergamino,
Buenos AiresAPM1-1 b − APM1-3 − APM1-5 b APM1-6 b APM1-7 APM1-8 b
2 Acebal, Santa Fé
− APM2-2 b APM2-3 b − − − − −
3 Coronel Bogado, Santa Fé
− − APM3-3 b − − − − −
4 Rosario, Santa Fé
− − APM4-3 b − APM4-5 b − − −
5 Villa Mantero, Entre Ríos
− − APM5-3 b − − − − −
6 Cerro Azul, Misiones
− ANE6-2 b ANE6-3 b − ANE6-5 b ANE6-6 ANE6-7 −
7 El Colorado, Formosa
ANE7-1 b − ANE7-3 b ANE7-4 b − ANE7-6 b ANE7-7 −
8 Saenz Peña, Chaco
ANE8-1 b − − − − ANE8-6 b − −
9 Pozo Hondo, Santiago del Estero
− − ANW9-3 b − − − − −
10 Alderete, Tucumán
− − ANW10-3 b − − − − −
11 Metán, Salta − − ANW11-3 b − − − − −12 Ledesma,
Jujuy− ANW12-2 b − − ANW12-5 b − ANW12-7 −
13 Sunchales, Santa Fé
− − − APM13-4 b − − − −
14 Humboldt, Santa Fé
− − − APM14-4 b − − − −
15 Esperanza, Santa Fé
− − − − − − APM15-7 −
16 Gálvez, Santa Fé
− − − − − − − APM16-8 b
17 Reconquista, Santa Fé
− − − APM17-4 b − − APM17-7 −
18 Paraná, Entre Ríos
− − − − − − APM18-7 APM18-8 b
19 La Paz, Entre Ríos
− − − − − APM19-6 b − APM19-8 b
20 Marcos Juárez, Córdoba
− − − − − − APM20-7 −
Table 1. Soybean rust samples used in this study

224 JARQ 51 (3) 2017
H. Akamatsu et. al
21 Esquina, Corrientes
− − − − − ANE21-6 − −
22 El Sombrero, Corrientes
− − − − − − ANE22-7 −
23 Pichanal, Salta − − − − − − ANW23-7 −Brazil 1 Passo Fundo,
Rio Grande do Sul (RS)
BSO1-1 BSO1-2 BSO1-3 − − BSO1-6 b BSO1-7 b BSO1-8
2 Londrina, Paraná (PR) c
BSO2-1 b BSO2-2 BSO2-3 BSO2-4(1) BSO2-5 BSO2-6 BSO2-7 b BSO2-8 BSO2-4(2)
3 Londrina, Paraná (PR) d
BSO3-1 − − BSO3-4(1) BSO3-5(1) BSO3-6 BSO3-7 BSO3-8 b BRP-1 b, e BSO3-4(2) BSO3-5(2) BRP-2 b, e BSO3-5(3)
BSO3-5(4) 4 Uberaba,
Minas Gerais (MG)
− BSO4-2 − − − − − −
5 Dourados, Mato Grosso do Sul (MS)
BCW5-1(1) f − BCW5-3 b BCW5-4 − − − −BCW5-1(2) f
6 Chapadão do Sul, MS
BCW6-1 − − BCW6-4 b − − BCW6-7 b BCW6-8
7 Campo Verde, Mato Grosso (MT)
BCW7-1 − − − − BCW7-6 b − −
8 Rondonópolis, MT
− − BCW8-3 b − − − − BCW8-8
9 Goiânia, Goiás (GO)
BCW9-1 − − BCW9-4 b − − − −
10 Senador Canedo, GO
BCW10-1 − BCW10-3 g − BCW10-5 − − −
11 Planaltina, Distrito Federal (DF)
BCW11-1 BCW11-2 BCW11-3 − BCW11-5 − − −
12 Vilhena, Rondônia (RO)
BNO12-1 BNO12-2 BNO12-3 − BNO12-5 − − −
13 São Raimundo das Mangabei-ras, Maranhão (MA)
− BNO13-2 g − − − − − −
14 São Desidério, Bahia (BA)
− BNO14-2 g − − − − − −
15 Rio Verde, GO − − − − BCW15-5 − BCW15-7 −16 Primavera do
Leste, MT− − − − − − BCW16-7 −
Paraguay 1 Corpus Chris-ti, Canindeyú
PNC1-1 − − − − − − −
2 Pindoty Porã, Canindeyú
PNC2-1 − − − − − − −
3 Katueté, Canindeyú
− − PNC3-3 PNC3-4 PNC3-5 b − − PNC3-8
4 Troncal, Alto Paraná
− − PMA4-3 − − − − −
5 Minga Porã, Alto Paraná
− − PMA5-3 − − − − −
225
Pathogenic Variation of South American Soybean Rust in 2010-2015
6 San Alberto, Alto Paraná
PMA6-1 PMA6-2 − − PMA6-5 b PMA6-6 PMA6-7 PMA6-8
7 Itakyry, Alto Paraná
− − PMA7-3 PMA7-4 b − − − −
8 Santa Rita, Alto Paraná
− PMA8-2 − − − − − −
9 Naranjal, Alto Paraná
PMA9-1 − − − − − − −
10 Naranjito, Itapúa
PSI10-1 − − − − − − −
11 Maria Auxili-adora, Itapúa
− − PSI11-3 − − − − −
12 Capitán Meza, Itapúa
− PSI12-2 − PSI12-4 b − − − −
13 Pirapó, Itapúa PSI13-1 PSI13-2 − PSI13-4 b PSI13-5 b PSI13-6 PSI13-7 PSI13-8 14 Bella Vista,
Itapúa− − PSI14-3 − − − − −
15 Capitán Miranda, Itapúa
PSI15-1 PSI15-2 PSI15-3 PSI15-4 PSI15-5 PSI15-6 PSI15-7 PSI15-8
16 Choré, San Pedro
− − − − − PNS16-6 − PNS16-8
17 Yhovy, Canindeyú
− − − − − − − PNC17-8
18 Yguazú, Alto Paraná
− − − − − − − PMA18-8
19 Dr. Juan Eulogio Estigarribia, Caaguazú
− − − − − − − PMG19-8
Japan − NICS, Kan-nondai, Tsuku-ba, Ibaraki
T1-4 h N1-1 h E1-4 h
− Kannondai, Tsukuba, Ibaraki
K1-2 h, i
− Kurihara, Tsukuba, Ibaraki
N2-3 b, j
T3-1 j
− Azuma, Tsukuba, Ibaraki
K3-1 i, k
a The location numbers correspond to those in Tables 2, 3, and 4. b The rust samples were not evaluated using a complete set of 16 differentials due to preparation failure involving certain differential
plants. c The rust samples except for BSO2-4(2) were isolated from a field of EMBRAPA Soja, Londrina, PR, Brazil. BSO2-4(2) was iso-
lated from a field near EMBRAPA Soja. d The rust samples were isolated from the greenhouses of EMBRAPA Soja, Londrina, PR, Brazil. e Yamanaka et al. (2010) and Akamatsu et al. (2013). f Two samples were isolated on two different dates in the 2007/2008 season (Akamatsu et al. 2013). g Three samples were collected in the 2007/2008-2009/2010 seasons, but the evaluation data was not included in Akamatsu et al.
(2013). h The rust samples were isolated in 2007 (Yamaoka et al. 2014). i Soybean rust isolates K1-2 and K3-1 were collected from kudzu (Yamaoka et al. 2014). j The rust sample was isolated in 2008 (Yamaoka et al. 2014). k The rust sample was isolated in 2009.
226 JARQ 51 (3) 2017
H. Akamatsu et. al
from Pergamino, Buenos Aires, Argentina-Pampa region during the 2011/2012 season (the fifth season).
In Brazil, 31 rust populations were collected from six states and the Federal District (Distrito Federal, DF; Table 1). The location codes BSO, BSE, BCW, BNO, and BNE denote the Brazil-South, Brazil-Southeast, Brazil-Central-West, Brazil-North, and Brazil-Northeast regions, respectively. BSE and BNE coded for the populations from the 2007/2008–2009/2010 seasons were treated as BSO and BNO in this study.
In Paraguay, 24 rust populations were sampled from five departments (Table 1). The location codes PNC, PNS, PMA, PMG, and PSI denote the Paraguay-Eastern region North-Canindeyú, Paraguay-Eastern region North-San Pedro, Paraguay-Eastern region Middle-Alto Paraná, Paraguay-Eastern region Middle-Caaguazú, and Paraguay-Eastern region South-Itapúa prefectures, respectively.
3. Differential plants, inoculation, and data collection The same soybean differential set was used as in
our previous study (Akamatsu et al. 2013, Yamanaka et al. 2013). The procedures for rust urediniospore multiplication, soybean inoculation, and pathogenicity evaluation were adopted from those that we used previously (Akamatsu et al. 2013, Yamanaka et al. 2013). The reaction was classified into three categories: 1) R, immune or resistant; 2) IM, intermediate; and 3) S, susceptible.
4. Data analysis The R, IM, and S infection types were coded as 0, 1,
and 2, respectively. The distance matrices were prepared by calculating Euclidean and the squared Euclidean distances between samples using R software version 3.2.0 (R Core Team 2015). Dendrograms based on the unweighted paired group method with an arithmetic mean (UPGMA) were also constructed with R. An R package (pvclust) was run to assess the uncertainty in hierarchical cluster analysis, which calculates approximately unbiased probability values (AU p-values) for each cluster using multiscale bootstrap resampling techniques (Suzuki & Shimodaira 2006).
Results
1. Pathogenicity of the Phakopsora pachyrhizi population from Argentina during the 2010/2011 to 2014/2015 seasons
In the 28 rust samples, no identical pathogenicity patterns within the 16 differentials were observed (Table 2). Two populations, ANE7-4 and ANE7-6, exhibited
identical pathogenicity patterns in 12 differentials. In addition, 14 reaction matches out of 15 comparable differentials were identified in APM18-7 and APM18-8. These samples were derived from the same location in the Northeast and Pampa regions, respectively, but during different seasons. The pathogenicity profiles differed among the multiple rust samples collected at each of the seven locations during the five different cropping seasons (APM1, ANE6, ANE7, ANW12, APM17, APM18, and APM19). Thus, no strong association was observed in the pathogenicity profiles of Argentinean rust populations during the 2010/2011-2014/2015 seasons with the geographical origins of the isolation. ANE6-6 displayed the highest virulence in the 16 differentials in Argentina, none of which induced resistant reactions against the samples.
2. Pathogenicity of the Phakopsora pachyrhizi population from Brazil during the 2010/2011 to 2014/2015 seasons
No identical pathogenicity patterns among the 16 differentials were found in the 31 P. pachyrhizi samples collected from Brazil (Table 3). The highest level of similarity in the pathogenicity profiles of the 16 differentials was found between BSO3-5(2) and BSO3-5(4) with 15 reaction matches, followed by BCW8-8 and BCW15-7 with 14 reaction matches. Pathogenic variations were detected among rust samples collected from the same location (BSO1, BSO2, BSO3, BCW6, and BCW15), but were from different seasons although certain sample pairs (e.g., BSO2-6 and BSO2-8, BCW6-7 and BCW6-8) induced identical reactions to 13 out of 15 or 16 differentials. Pathogenicity also varied among rust samples with the same regional (South and Central-West regions) and seasonal origins, indicating no apparent region-specific pathogenicity in Brazil. BSO3-7 was the most virulent of the Brazilian rust populations. It did not cause any resistant reactions in the 16 differentials. BSO2-6 and BSO3-6 also displayed high virulence in 13 out of 16 differentials.
3. Pathogenicity of the Phakopsora pachyrhizi population from Paraguay during the 2010/2011 to 2014/2015 seasons
All rust samples from Paraguay differed in the level of pathogenicity towards the 16 differentials (Table 4). The highest similarity of the pathogenicity profiles out of 24 Paraguayan samples was detected between PSI13-8 and PMG19-8, which only caused different reactions with PI 587886 (differential 11). PSI15-6 was the most virulent of the differentials in the rust populations from Paraguay, inducing resistant reactions in only two

227
Pathogenic Variation of South American Soybean Rust in 2010-2015
pathogenic characteristics of the sampling locations was not observed in Paraguay, as the pathogenicity profiles differed among rust samples collected from the same location (PNC3, PMA6, PSI13, PSI15, and PNS16), but during different seasons.
Rpp-carrying differentials (differentials 7 and 8). In contrast, a few rust samples such as PSI13-7 exhibited lower pathogenicity towards the differentials. However, PMA6-7 never produced a susceptible reaction in any of the 13 Rpp-carrying differentials. Variation in the
Table 3. Infection types of 31 Phakopsora pachyrhizi samples from Brazil on 16 differentials a Location no. c 1 2 3 5 6 7 8 9 10 11 12 15 16
Season2012/2013
2013/2014
2014/2015
2010/2011
2010/2011
2011/2012
2012/2013
2013/2014
2014/2015
2010/2011
2010/2011
2011/2012
2011/2012
2011/2012
2011/2012
2012/2013
2013/2014
2014/2015
2010/2011
2010/2011
2013/2014
2014/2015
2012/2013
2014/2015
2010/2011
2011/2012
2011/2012
2011/2012
2011/2012
2013/2014
2013/2014
Sample code
BSO
1-6
BSO
1-7
BSO1-8
BSO2-4(1)
BSO2-4(2)
BSO2-5
BSO2-6
BSO2-7
BSO2-8
BSO3-4(1)
BSO3-4(2)
BSO3-5(1)
BSO3-5(2)
BSO3-5(3)
BSO3-5(4)
BSO3-6
BSO3-7
BSO3-8
BCW5-4
BCW6-4
BCW6-7
BCW6-8
BCW7-6
BCW8-8
BCW9-4
BCW10-5
BCW11-5
BNO12-5
BCW15-5
BCW15-7
BCW16-7
1 PI 200492 R nd S S S S S S S S S S S S S S S S S S S S S IM S S S S S S S2 PI 368039 S S S S S S S S S S S S S R R S S nd S S S S S S S S S S S S S3 PI 230970 R IM S S S S S IM IM R R S R R R S S IM S R IM IM S S nd IM IM IM IM S S4 PI 417125 R R S S S S S S S IM IM S R R R S IM R R IM S IM nd S IM IM S S IM S IM5 PI 462312 nd S R S S R S R S IM S S R R R S S IM S R R R R R S S S R R R R6 PI 459025 R R S S S R S R S R R R R R R R S R S nd R R S R nd S R S IM R R7 Shiranui R R R R IM R IM R IM R R R R R R IM IM R R R R R R R nd R R R R R R8 PI 416764 R nd S R S S S S S S S S R S R S IM R R IM IM S R IM R S S R R IM S9 PI 587855 R R R IM R IM S R R S R R R R R S S R R R R R R R R R R R S IM R10 PI 587880A R R R S R IM S R R S R R R R R S S S R R R R R R R R S R R R R11 PI 587886 S S S S IM S S S S S S S S R S S S S R S S S S S S S S S S S S12 PI 587905 R R S R R R S R S S R R R R R IM IM R R R S S R R R R R R R R R13 PI 594767A R R R R R S R IM R R R IM R IM R R IM R R R R R IM R R R R R R R R14 BRS 154 S S S S S S S S S S S S S S S S S S S S S S S S S S S S S S S15 TK5 S S S S S S S S S S S S S IM S S S S S IM nd S S S S S S S S S S16 Wayne S nd S S S S S nd S S S S S S S S S nd S nd S S S S S S S S S S S
a Infection types were classified into three categories described in Akamatsu et al. (2013): R, white letters and black background; IM, white letters and gray background; and S, black letters and white background; nd (black letters and light gray background), infec-tion type was not determined due to preparation failure involving certain differential plants.
b The numbers correspond to those in Table 1
Table 2. Infection types of 28 Phakopsora pachyrhizi samples from Argentina on 16 differentials a
Location no. b 1 4 6 7 8 12 13 14 15 16 17 18 19 20 21 22 23
Season2011/2012
2012/2013
2013/2014
2014/2015
2011/2012
2011/2012
2012/2013
2013/2014
2010/2011
2012/2013
2013/2014
2012/2013
2011/2012
2013/2014
2010/2011
2010/2011
2013/2014
2014/2015
2010/2011
2013/2014
2013/2014
2014/2015
2012/2013
2014/2015
2013/2014
2012/2013
2013/2014
2013/2014
Sample code
APM
1-5
APM1-6
APM1-7
APM1-8
APM4-5
ANE6-5
ANE6-6
ANE6-7
ANE7-4
ANE7-6
ANE7-7
ANE8-6
ANW12-5
ANW12-7
APM13-4
APM14-4
APM15-7
APM16-8
APM17-4
APM17-7
APM18-7
APM18-8
APM19-6
APM19-8
APM20-7
ANE21-6
ANE22-7
ANW23-7
1 PI 200492 S S S S S S S S S nd R nd S S S S S nd S S S S S S S S S S2 PI 368039 S S S S S S S S S S IM S S S S S S nd S S R nd S nd S IM S IM3 PI 230970 nd S IM S S nd IM S S S IM S nd IM IM S S S R IM R R S R IM R S S4 PI 417125 S S R S S R IM S nd R S S R R R R S R nd IM R R nd S S S R R5 PI 462312 S S R R R S S R R R R R R R R R R S R R R R S R R R R R6 PI 459025 nd R R S nd nd S R S S R R nd R nd nd R S S R R R R R R R R R7 Shiranui S IM R nd R R IM IM S S IM S R R S nd R R IM S R R R R R S IM R8 PI 416764 S nd S S nd IM S S nd nd S S IM S nd nd S S nd S S S S R S IM S S9 PI 587855 S R R R R S IM R R nd R R R IM R R R R R R R R R nd R R R R10 PI 587880A R R R R R S S IM R R R R R R R R R R R R R R R R R R R R11 PI 587886 nd S S S S S S S S S IM S S S S R S S S S S S S S S S S S12 PI 587905 S S R R R nd S R R R R R R S R R R R R R R R R R R R R IM13 PI 594767A R S R R R S S R R R IM R R R R R R R nd R R R R R R S R R14 BRS 154 S S S S S S S S S S S S S S S S S S nd S S IM S S IM S IM S15 TK5 S S IM R S S S IM S S S S S S S nd S nd S R S S S S IM S S S16 Wayne S S S S S S S S S S S S S S S S S S S S S S S S S S IM Sa Infection types were classified into three categories described in Akamatsu et al. (2013): R, white letters and black background; IM,
white letters and gray background; and S, black letters and white background; nd (black letters and light gray background), infec-tion type was not determined due to preparation failure involving certain differential plants.
b The numbers correspond to those in Table 1.

228 JARQ 51 (3) 2017
H. Akamatsu et. al
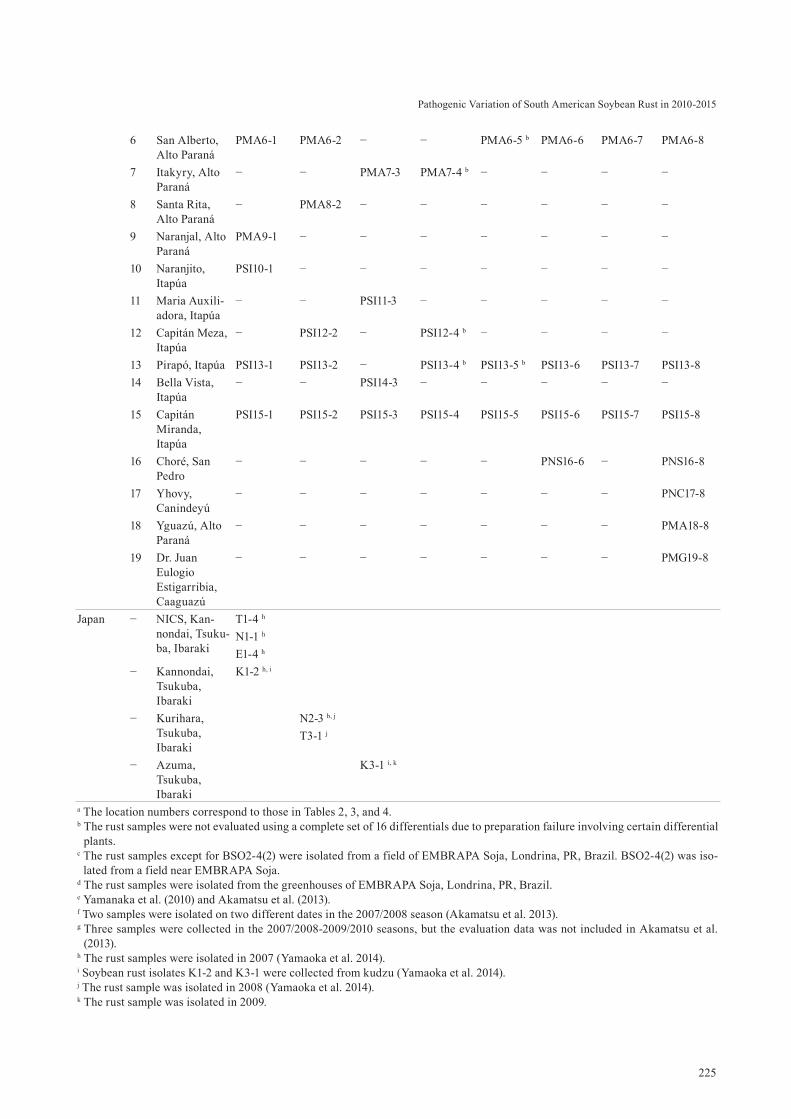
Argentinean, 58 Brazilian, 43 Paraguayan samples) and seven Japanese rust races from 2010/2011 to 2014/2015 (this study) and from 2007/2008 to 2009/2010 (Akamatsu et al. 2013) (Fig. 1). None of the P. pachyrhizi samples
4. Pathogenic variation in rust populations from the three South American countries
A dendrogram constructed by cluster analysis was drawn based on the pathogenicity of 145 samples (i.e., 44
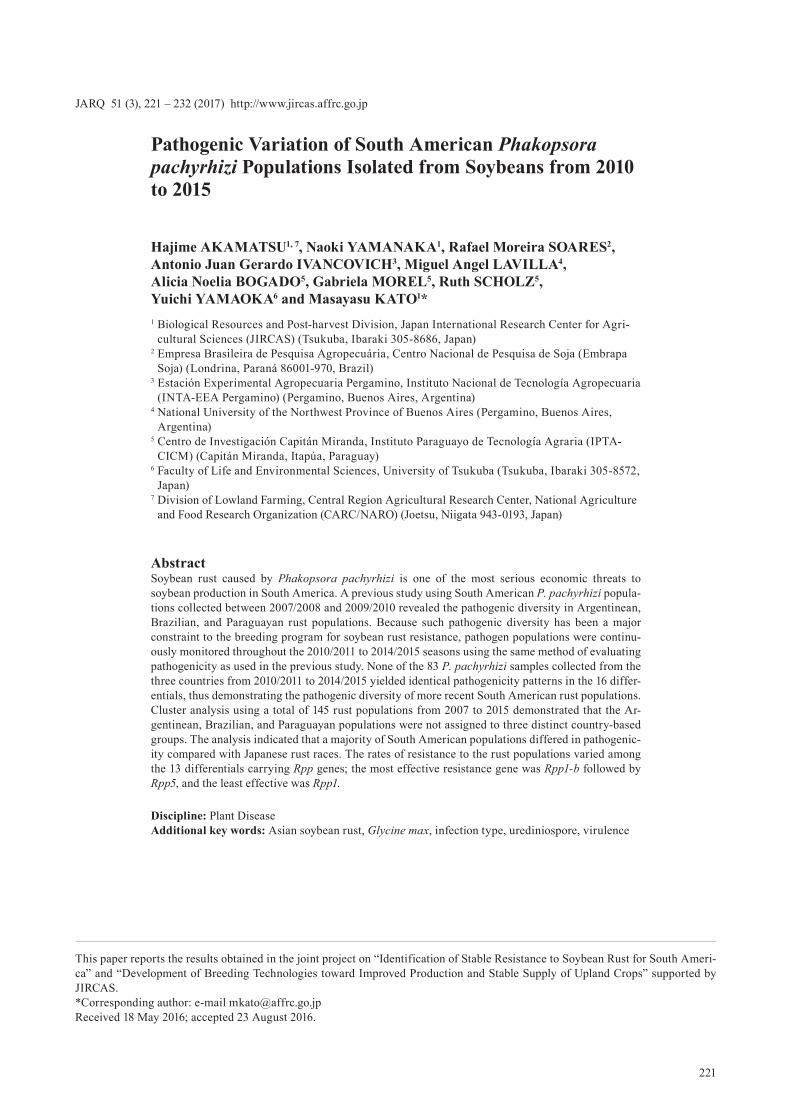
Fig. 1. Sampling locations of soybean rust in Argentina (a), Brazil (b), and Paraguay (c). Provinces of Argentina, states of Brazil, and departments of Paraguay are shown on each map. Provinces, states, and departments
from which pathogen samples were obtained are indicated in dark gray; others are indicated in light gray. Indicated sampling location numbers correspond to Table 2. The black bars in Figs. 1a, 1b, and 1c, show 1,000 km, 2,000 km, and 200 km, respectively. Blank maps of the three countries were downloaded from http://www.freemap.jp/.
a
CHILE
Buenos Aires
Entre Ríos
Misiones
Corrientes
SaltaTucumán
Chubut
Río Negro
LaPampa
Men-doza
San Juan
Santa Cruz
Tierra del Fuego
Jujuy
Santa Fé
BRAZIL
Buenos Aires
Entre Ríos
Pampa region
c
Alto Paraguay
PresidenteHayes
Boquerón
Con-cepción
Cordi-llera
San Pedro
Central
Para-guarí
Alto Paraná
BRAZIL
BOLIVIA
ARGENTINA
Canindeyú
Distrito Capital
b
Pará
AmapáRora-ima
Amazonas
BA
Piauí
MA Cea-rá
ParaíbaPernambuco
SergipeMT
MS
RS
PR
RO
GODF
Espírito Santo
Rio de JaneiroSão
Paulo
Santa Catarina
MG
Toca-ntins
Rio Grande do Norte
Alagoas
VENEZUELA
COLOM-BIA
BOLIVIA
PERU
URUGUAY
CHILE
GUYANA
FRENCH GUIANASURINAME
ARGENTINA
Table 4. Infection types of 24 Phakopsora pachyrhizi samples from Paraguay and seven isolates from Japan on 16 differentials a Location no. b 3 6 7 12 13 15 16 17 18 19 Ibaraki, Japan c
Season2010/2011
2011/2012
2014/2015
2011/2012
2012/2013
2013/2014
2014/2015
2010/2011
2010/2011
2010/2011
2011/2012
2012/2013
2013/2014
2014/2015
2010/2011
2011/2012
2012/2013
2013/2014
2014/2015
2012/2013
2014/2015
2014/2015
2014/2015
2014/2015
2007 2007 2008 2008 2007 2007 2009
Sample code
PNC
3-4
PNC
3-5
PNC
3-8
PMA
6-5
PMA
6-6
PMA
6-7
PMA
6-8
PMA
7-4
PSI1
2-4
PSI1
3-4
PSI1
3-5
PSI1
3-6
PSI1
3-7
PSI1
3-8
PSI1
5-4
PSI1
5-5
PSI1
5-6
PSI1
5-7
PSI1
5-8
PNS1
6-6
PNS1
6-8
PNC
17-8
PMA
18-8
PMG
19-8
T1-4
Rac
e 1
N1-
1R
ace
2N
2-3
Rac
e 3
T3-1
Rac
e 4
E1-4
Rac
e 5
K1-
2R
ace
6K
3-1
Rac
e 7
1 PI 200492 S S S S S R S S S S S R R S S S S S S S S S S S R R R R R R R2 PI 368039 S S S S S R S S R S S S R S S S S S S S S S S S R R R R R R R3 PI 230970 IM IM S R R R IM R IM IM IM S R S R S S S S S S IM S S S S IM R R R R4 PI 417125 S nd S S S IM S IM R R IM S R S IM IM IM S S IM R R S S S S S R R R R5 PI 462312 IM nd S S R R R nd S IM R R R S S S S R S IM S S R S R R R R R R R6 PI 459025 IM R R nd S IM R IM IM R R R R R IM R S R R IM S R S R S R R R R R R7 Shiranui R R R R R IM R R R R R R R R R R R R IM R R R IM R R R R R R R R8 PI 416764 S R R S R IM R R R IM S S R R R S R IM R IM R R IM R R R R R R R R9 PI 587855 R S R nd R R R R R nd R R R R IM R S R S R R R R R R R nd R R R R10 PI 587880A R nd R R R R R R nd R R R R R IM S S R S S R R R R R R R R R R R11 PI 587886 S S S S R R S S nd R S S R R S S S S S S R S S S S S S S R R R12 PI 587905 R R S S R R R R R nd R R R R R R S R S R S S R R R R R R R R R13 PI 594767A R R S R S R R R IM R R R S R R R S R R R IM R R R R R nd R R R R14 BRS 154 S S S S S S S S S S S S IM S S S S S S S S S IM S S S S S S S S15 TK5 S nd S S S R S R IM R nd S R S R S S IM S S S S S S S S S S S S R16 Wayne S S IM S S R S S IM IM S S S S S S S IM S S S S S S S S S S S R S
a Infection types were classified into three categories described in Akamatsu et al. (2013): R, white letters and black background; IM, white letters and gray background; and S, black letters and white background; nd (black letters and light gray background), infec-tion type was not determined due to preparation failure involving certain differential plants.
b The numbers correspond to those in Table 1
229
Pathogenic Variation of South American Soybean Rust in 2010-2015
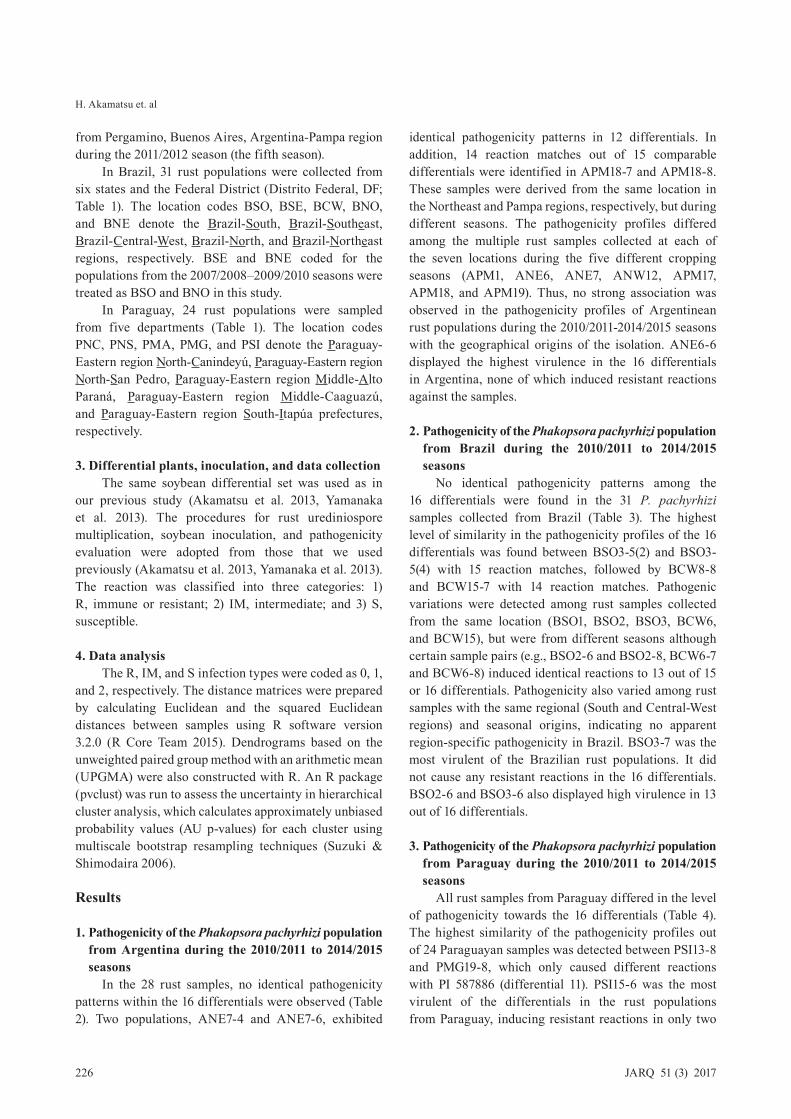
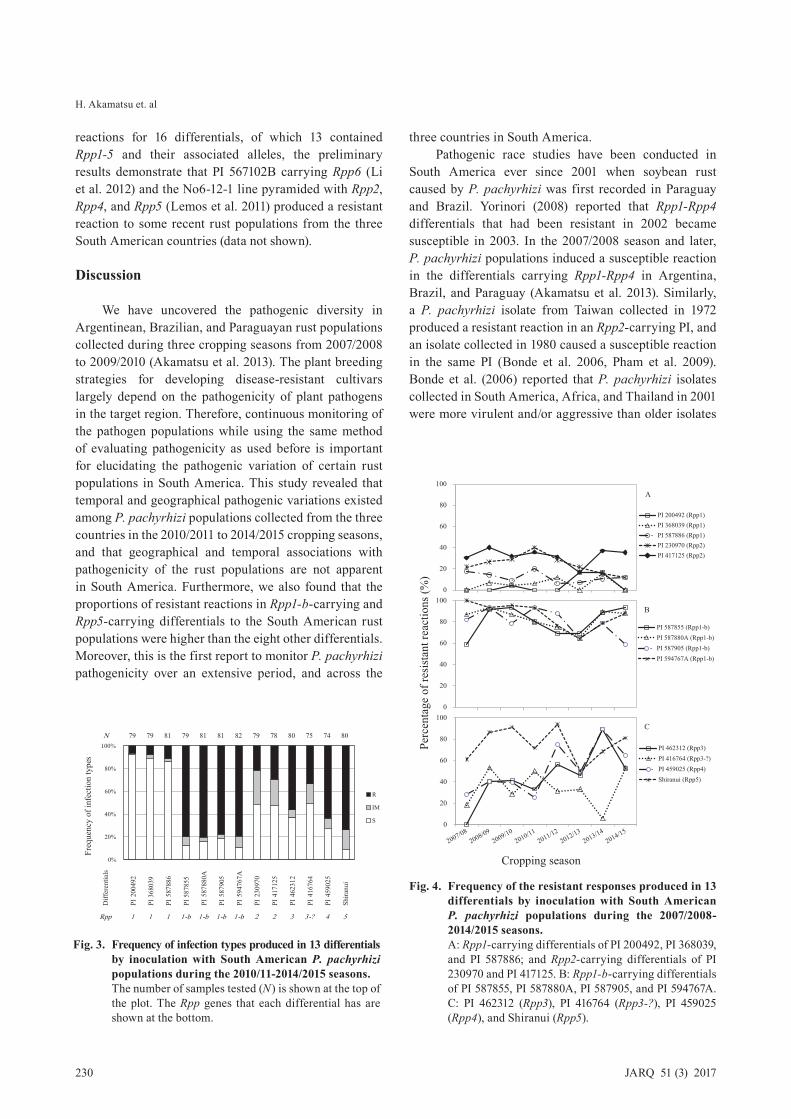
four seasons from 2011/2012 to 2014/2015 (50%-89%) compared with those from 2007/2008 to 2010/2011 (25%-40%). The frequency of resistant reactions in the Rpp5-carrying differential ranged from 50%-94%.
Although this study primarily focused on the
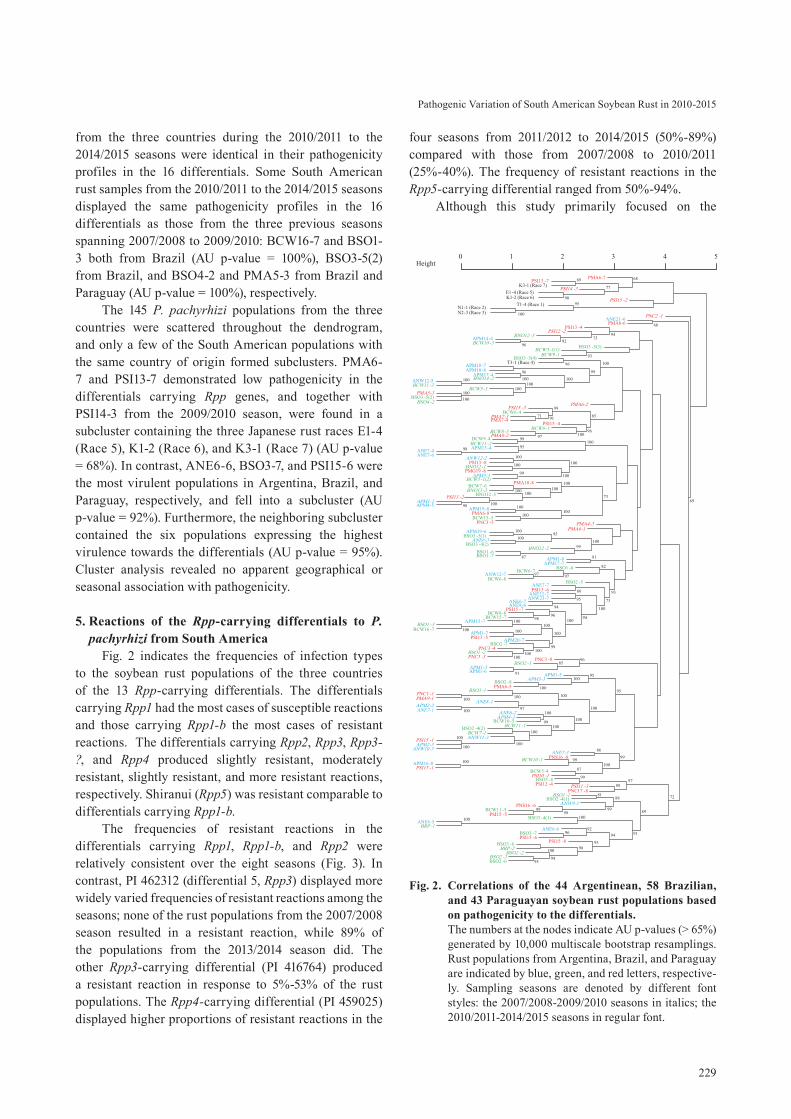
from the three countries during the 2010/2011 to the 2014/2015 seasons were identical in their pathogenicity profiles in the 16 differentials. Some South American rust samples from the 2010/2011 to the 2014/2015 seasons displayed the same pathogenicity profiles in the 16 differentials as those from the three previous seasons spanning 2007/2008 to 2009/2010: BCW16-7 and BSO1-3 both from Brazil (AU p-value = 100%), BSO3-5(2) from Brazil, and BSO4-2 and PMA5-3 from Brazil and Paraguay (AU p-value = 100%), respectively.
The 145 P. pachyrhizi populations from the three countries were scattered throughout the dendrogram, and only a few of the South American populations with the same country of origin formed subclusters. PMA6-7 and PSI13-7 demonstrated low pathogenicity in the differentials carrying Rpp genes, and together with PSI14-3 from the 2009/2010 season, were found in a subcluster containing the three Japanese rust races E1-4 (Race 5), K1-2 (Race 6), and K3-1 (Race 7) (AU p-value = 68%). In contrast, ANE6-6, BSO3-7, and PSI15-6 were the most virulent populations in Argentina, Brazil, and Paraguay, respectively, and fell into a subcluster (AU p-value = 92%). Furthermore, the neighboring subcluster contained the six populations expressing the highest virulence towards the differentials (AU p-value = 95%). Cluster analysis revealed no apparent geographical or seasonal association with pathogenicity.
5. Reactions of the Rpp-carrying differentials to P. pachyrhizi from South America
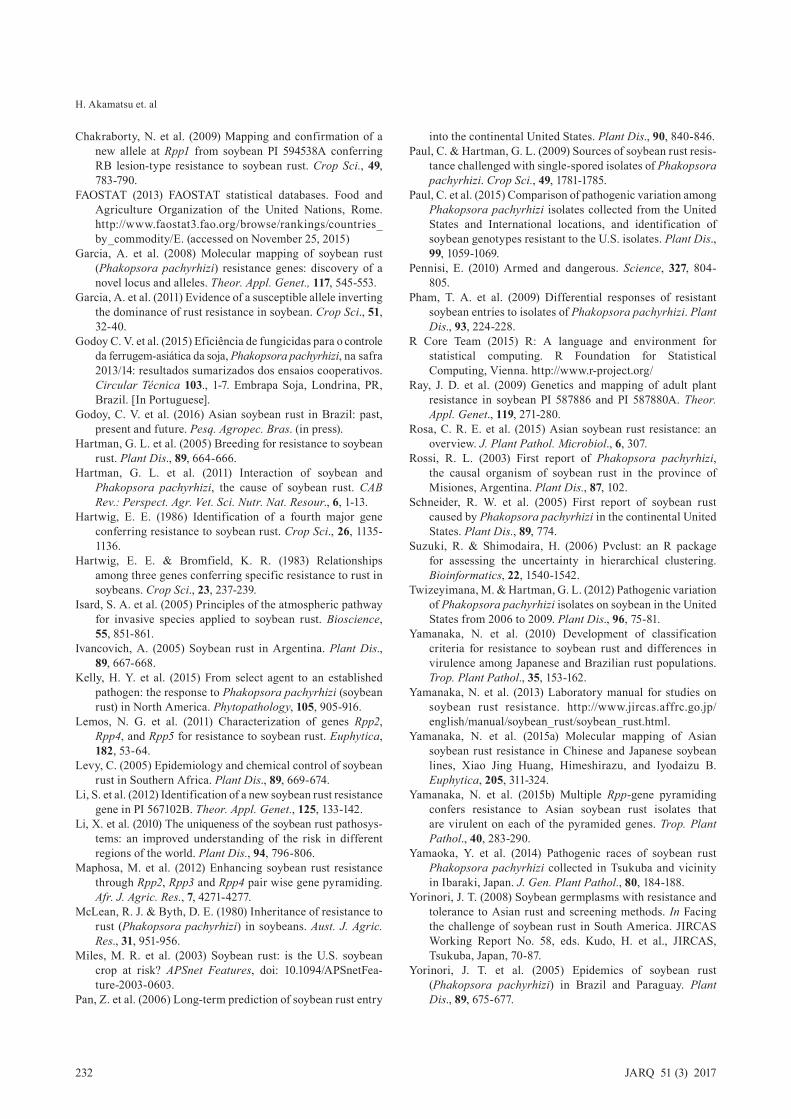
Fig. 2 indicates the frequencies of infection types to the soybean rust populations of the three countries of the 13 Rpp-carrying differentials. The differentials carrying Rpp1 had the most cases of susceptible reactions and those carrying Rpp1-b the most cases of resistant reactions. The differentials carrying Rpp2, Rpp3, Rpp3-?, and Rpp4 produced slightly resistant, moderately resistant, slightly resistant, and more resistant reactions, respectively. Shiranui (Rpp5) was resistant comparable to differentials carrying Rpp1-b.
The frequencies of resistant reactions in the differentials carrying Rpp1, Rpp1-b, and Rpp2 were relatively consistent over the eight seasons (Fig. 3). In contrast, PI 462312 (differential 5, Rpp3) displayed more widely varied frequencies of resistant reactions among the seasons; none of the rust populations from the 2007/2008 season resulted in a resistant reaction, while 89% of the populations from the 2013/2014 season did. The other Rpp3-carrying differential (PI 416764) produced a resistant reaction in response to 5%-53% of the rust populations. The Rpp4-carrying differential (PI 459025) displayed higher proportions of resistant reactions in the
Fig. 2. Correlations of the 44 Argentinean, 58 Brazilian, and 43 Paraguayan soybean rust populations based on pathogenicity to the differentials.
The numbers at the nodes indicate AU p-values (> 65%) generated by 10,000 multiscale bootstrap resamplings. Rust populations from Argentina, Brazil, and Paraguay are indicated by blue, green, and red letters, respective-ly. Sampling seasons are denoted by different font styles: the 2007/2008-2009/2010 seasons in italics; the 2010/2011-2014/2015 seasons in regular font.
PMA6-7PSI13 -7K3-1 (Race 7)
PSI14 -3E1-4 (Race 5)K1-2 (Race 6) PSI15 -2
T1-4 (Race 1)N1-1 (Race 2)N2-3 (Race 3) PNC2 -1ANE21-6
PMA6-6PSI13 -4
PSI12 -2BNO12 -3APM14-4
BCW10 -3BSO3 -5(3)BCW5-1(1)
BCW9-1BSO3 -5(4)
T3-1 (Race 4)APM18-7APM18-8
APM17-4BNO14 -2ANW12-5
BCW11 -3BCW5-3
PMA5-3BSO3 -5(2)
BSO4 -2 PMA6-2PSI15 -3BCW6-4
PMA7-3PMA7-4
PSI15 -4BCW6-1BCW8-3
PMA8-2BCW9-4BCW11 -2APM13-4ANE7-4
ANE7-6 ANW12-2PSI13 -8
BNO12 -1PMG19 -8
APM5-3BCW5-1(2)
PMA18-8BCW7-6BNO13 -2
BNO12 -5PSI13 -2APM1-1APM4-5
APM19-8PMA6-8BCW15 -5
PNC3 -5 PMA4-3PMA6-1APM19-6
BSO3 -5(1)ANE6-3
BSO3 -4(2)BNO12 -2
BSO1 -6BSO1 -7
APM1-8APM17-7
BSO1 -8BCW6-7ANW12-7BCW6-8 BSO2 -5ANE7-7
PSI13 -6ANE22-7ANW23-7
ANE6-7ANE8-6PSI15 -7
BCW8-8BCW15 -7
APM15-7BSO1 -3BCW16 -7
APM1-7PSI13 -5 APM20-7
BSO2 -7PNC3 -4
BSO1 -2PNC3 -3 PNC3 -8
BSO2 -1APM1-3APM1-6
APM1-5APM3-3BSO2 -8
PMA6-5BSO3 -1PNC1 -1
PMA9-1 ANE8-1APM2-2ANE7-1 ANE6-2
APM4-3BCW10 -5
BCW11 -1BSO2 -4(2)BCW7-1ANW11-3PSI15 -1
APM2-3ANW10-3
ANE7-3PNS16 -8BCW10 -1
APM16-8PSI13 -1
BCW5-4PSI10 -1BSO3 -8PSI12 -4 PSI11 -3
PNC17 -8BSO1 -1
BSO2 -4(1)ANW9-3PNS16 -6
BCW11 -5PSI15 -5
BSO3 -4(1)ANE6-5BRP -1 ANE6-6
BSO3 -7PSI15 -6
PSI15 -8BSO3 -6BRP -2BSO2 -2
BSO2 -3BSO2 -6
0 1 2 3 4 5Height
89
90
92
77
71
96
94
95
100
99
93
97
100
99100
100
96
100
100
100
100
100
99
95
91
100
100
100
96
100
85
100
100
100
95
7596
91
99
96
8596100
100
73
81
98
98
100
94
10098
97
95
99
95
100
100
100
100
95
73
100
100
100 100
94
100
100
100
97
100
87
100
99
100
100
99
82
93
100
100
100
97
100
100100
100
100
99
100
100
100
100
100
100
100
99
9692
100
86
100100
9999
99
87
100100
99
81 7288
89
8897
9594 91
9594
98
68
68
69
66
230 JARQ 51 (3) 2017
H. Akamatsu et. al
three countries in South America.Pathogenic race studies have been conducted in
South America ever since 2001 when soybean rust caused by P. pachyrhizi was first recorded in Paraguay and Brazil. Yorinori (2008) reported that Rpp1-Rpp4 differentials that had been resistant in 2002 became susceptible in 2003. In the 2007/2008 season and later, P. pachyrhizi populations induced a susceptible reaction in the differentials carrying Rpp1-Rpp4 in Argentina, Brazil, and Paraguay (Akamatsu et al. 2013). Similarly, a P. pachyrhizi isolate from Taiwan collected in 1972 produced a resistant reaction in an Rpp2-carrying PI, and an isolate collected in 1980 caused a susceptible reaction in the same PI (Bonde et al. 2006, Pham et al. 2009). Bonde et al. (2006) reported that P. pachyrhizi isolates collected in South America, Africa, and Thailand in 2001 were more virulent and/or aggressive than older isolates
reactions for 16 differentials, of which 13 contained Rpp1-5 and their associated alleles, the preliminary results demonstrate that PI 567102B carrying Rpp6 (Li et al. 2012) and the No6-12-1 line pyramided with Rpp2, Rpp4, and Rpp5 (Lemos et al. 2011) produced a resistant reaction to some recent rust populations from the three South American countries (data not shown).
Discussion
We have uncovered the pathogenic diversity in Argentinean, Brazilian, and Paraguayan rust populations collected during three cropping seasons from 2007/2008 to 2009/2010 (Akamatsu et al. 2013). The plant breeding strategies for developing disease-resistant cultivars largely depend on the pathogenicity of plant pathogens in the target region. Therefore, continuous monitoring of the pathogen populations while using the same method of evaluating pathogenicity as used before is important for elucidating the pathogenic variation of certain rust populations in South America. This study revealed that temporal and geographical pathogenic variations existed among P. pachyrhizi populations collected from the three countries in the 2010/2011 to 2014/2015 cropping seasons, and that geographical and temporal associations with pathogenicity of the rust populations are not apparent in South America. Furthermore, we also found that the proportions of resistant reactions in Rpp1-b-carrying and Rpp5-carrying differentials to the South American rust populations were higher than the eight other differentials. Moreover, this is the first report to monitor P. pachyrhizi pathogenicity over an extensive period, and across the
Fig. 4. Frequency of the resistant responses produced in 13 differentials by inoculation with South American P. pachyrhizi populations during the 2007/2008-2014/2015 seasons.
A: Rpp1-carrying differentials of PI 200492, PI 368039, and PI 587886; and Rpp2-carrying differentials of PI 230970 and PI 417125. B: Rpp1-b-carrying differentials of PI 587855, PI 587880A, PI 587905, and PI 594767A. C: PI 462312 (Rpp3), PI 416764 (Rpp3-?), PI 459025 (Rpp4), and Shiranui (Rpp5).
0
20
40
60
80
100
PI 462312 (Rpp3)PI 416764 (Rpp3-?)PI 459025 (Rpp4)Shiranui (Rpp5)
C
0
20
40
60
80
100
PI 200492 (Rpp1)PI 368039 (Rpp1)PI 587886 (Rpp1)PI 230970 (Rpp2)PI 417125 (Rpp2)
A
0
20
40
60
80
100
PI 587855 (Rpp1-b)PI 587880A (Rpp1-b)PI 587905 (Rpp1-b)PI 594767A (Rpp1-b)
B
Cropping season
Perc
enta
ge o
f res
ista
nt re
actio
ns (%
)
2007/082008/09
2009/102010/11
2011/122012/13
2013/142014/15
Fig. 3. Frequency of infection types produced in 13 differentials by inoculation with South American P. pachyrhizi populations during the 2010/11-2014/2015 seasons.
The number of samples tested (N) is shown at the top of the plot. The Rpp genes that each differential has are shown at the bottom.
0%
20%
40%
60%
80%
100%
1 2 3 4 5 6 7 8 9 10 11 12 13
R
IM
S
N 79 79 81 79 81 81 82 79 78 80 75 74 80
Freq
uenc
y of
infe
ctio
n ty
pes
Diff
eren
tials
PI20
0492
PI 3
6803
9
PI58
7886
PI 5
8785
5
PI58
7880
A
PI58
7905
PI59
4767
A
PI23
0970
PI41
7125
PI46
2312
PI41
6764
PI45
9025
Shira
nui
Rpp 1 1 1 1-b 1-b 1-b 1-b 2 2 3 3-? 4 5

231
Pathogenic Variation of South American Soybean Rust in 2010-2015
from Central or South America (Isard et al. 2005, Pan et al. 2006). In addition, the pathogen genotype that could defeat Rpp1 in PI 200492 was restricted by the subsequent winter season, lost, and then never re-established in the US, despite urediniospores of such populations that could be reintroduced from Central or South America. A comparative study following the evaluation of P. pachyrhizi populations from both the US and Central America (e.g., Mexico) would establish more comprehensive data to determine the variability and correlation of the pathogen populations between North and South America.
This work elucidates the pathogenicity of P. pachyrhizi populations from Argentina, Brazil, and Paraguay from the 2010/2011-2014/2015 seasons, and provides a dataset useful for comparing pathogenicity data obtained in the past and for the future monitoring of pathogen populations. In an on-going study, the pathogenicity of the P. pachyrhizi populations from the three countries has been evaluated using the differentials with Rpp1-5 and their additional alleles, PI 567102B carrying Rpp6 (Li et al. 2012) and the No6-12-1 line pyramided with Rpp2, Rpp4, and Rpp5 (Lemos et al. 2011). In the future, a more informative dataset containing infection types of the two new differentials would be useful in breeding programs to develop rust resistant cultivars for P. pachyrhizi populations outside of Argentina, Brazil, and Paraguay (e.g., Central America). To our knowledge, this paper, coupled with Akamatsu et al. (2013), describes the pathogenicity of the largest P. pachyrhizi collection, consisting of populations from eight cropping seasons from 2007 to 2015 in three South American countries.
Acknowledgements
We gratefully acknowledge the greenhouse facility staff of EMBRAPA Soja and Hernán Russian of EEA-Pergamino, INTA, for their technical assistance. This research was supported by the JIRCAS Research Project entitled “Identification of Stable Resistance to Soybean Rust for South America” and “Development of Breeding Technologies toward Improved Production and Stable Supply of Upland Crops.”
References
Akamatsu, H. et al. (2013) Pathogenic diversity of soybean rust in Argentina, Brazil, and Paraguay. J. Gen. Plant Pathol., 79, 28-40.
Bonde, M. R. et al. (2006) Evaluation of virulence of Phakopsora pachyrhizi and P. meibomiae isolates. Plant Dis., 90, 708-716.
collected from 1972 to 1994. The temporal change of pathogenic profiles was also
reported in the US. The US isolates expressing the same pathogenicity profile as US isolates collected in 2004 when soybean rust was first found in the US (Schneider et al. 2005), have not been detected in subsequent US samples (Paul et al. 2015, Paul & Hartman 2009, Pham et al. 2009). Therefore, it has been suggested that P. pachyrhizi isolates existing in 2004 disappeared or were suppressed due to the subsequent winter, likely resulting in unfavorable conditions for pathogen survival (Paul et al. 2015, Paul & Hartman 2009). In this study, a highly virulent Argentinean population (i.e., ANE6-6) was discovered, and it could pose a serious threat since none of the Rpp-carrying differentials demonstrated a resistant reaction to the population. Fortunately, such rust populations were never found after the 2012/2013 season, and thus were unlikely to survive the subsequent winter and further expand.
During the 2007/2008 to 2009/2010 seasons, South American rust populations never resulted in a susceptible reaction in PI 594767A carrying Rpp1-b (Akamatsu et al. 2013). However, rust populations overcoming the resistance to the same PI were later identified in Argentina, Brazil, and Paraguay. This study has thus resulted in the accumulation of valuable data regarding pathogenic variation, likely reflecting the diversity of the pathogen races or pathotypes in these countries. Furthermore, this study represents a contribution to the detection of sudden changes in pathogenicity and whether novel pathogen populations are likely to expand or contract.
The data obtained will enable a comparison of pathogenicity between the US and South American populations, but cannot be compared directly as the data were obtained using different evaluation methods. The data revealed a large difference in the rust reactions of Rpp1-carrying PI 200492 and PI 587880A; PI 587880A possesses a different Rpp1 allele compared with PI 200492, Rpp1-b (Ray et al. 2009, Yamanaka et al. 2015a). The reactions of PI 200492 and PI 587880A to most South American rust populations were evaluated as being susceptible and resistant, respectively, whereas those to the US isolates were evaluated as being resistant and susceptible, respectively (Paul et al. 2015, Twizeyimana & Hartman 2012). In contrast, the P. pachyrhizi isolates collected in Alabama in 2004 induced a susceptible reaction in Rpp1-carrying PI 200492. Pham et al. (2009) confirmed that the rust isolates resulting in a susceptible reaction in PI 200492 already existed in Brazil by 2001. These findings suggest that initial entry of the pathogen was achieved by its long distance movement
232 JARQ 51 (3) 2017
H. Akamatsu et. al
into the continental United States. Plant Dis., 90, 840-846. Paul, C. & Hartman, G. L. (2009) Sources of soybean rust resis-
tance challenged with single-spored isolates of Phakopsora pachyrhizi. Crop Sci., 49, 1781-1785.
Paul, C. et al. (2015) Comparison of pathogenic variation among Phakopsora pachyrhizi isolates collected from the United States and International locations, and identification of soybean genotypes resistant to the U.S. isolates. Plant Dis., 99, 1059-1069.
Pennisi, E. (2010) Armed and dangerous. Science, 327, 804-805.
Pham, T. A. et al. (2009) Differential responses of resistant soybean entries to isolates of Phakopsora pachyrhizi. Plant Dis., 93, 224-228.
R Core Team (2015) R: A language and environment for statistical computing. R Foundation for Statistical Computing, Vienna. http://www.r-project.org/
Ray, J. D. et al. (2009) Genetics and mapping of adult plant resistance in soybean PI 587886 and PI 587880A. Theor. Appl. Genet., 119, 271-280.
Rosa, C. R. E. et al. (2015) Asian soybean rust resistance: an overview. J. Plant Pathol. Microbiol., 6, 307.
Rossi, R. L. (2003) First report of Phakopsora pachyrhizi, the causal organism of soybean rust in the province of Misiones, Argentina. Plant Dis., 87, 102.
Schneider, R. W. et al. (2005) First report of soybean rust caused by Phakopsora pachyrhizi in the continental United States. Plant Dis., 89, 774.
Suzuki, R. & Shimodaira, H. (2006) Pvclust: an R package for assessing the uncertainty in hierarchical clustering. Bioinformatics, 22, 1540-1542.
Twizeyimana, M. & Hartman, G. L. (2012) Pathogenic variation of Phakopsora pachyrhizi isolates on soybean in the United States from 2006 to 2009. Plant Dis., 96, 75-81.
Yamanaka, N. et al. (2010) Development of classification criteria for resistance to soybean rust and differences in virulence among Japanese and Brazilian rust populations. Trop. Plant Pathol., 35, 153-162.
Yamanaka, N. et al. (2013) Laboratory manual for studies on soybean rust resistance. http://www.jircas.affrc.go.jp/english/manual/soybean_rust/soybean_rust.html.
Yamanaka, N. et al. (2015a) Molecular mapping of Asian soybean rust resistance in Chinese and Japanese soybean lines, Xiao Jing Huang, Himeshirazu, and Iyodaizu B. Euphytica, 205, 311-324.
Yamanaka, N. et al. (2015b) Multiple Rpp-gene pyramiding confers resistance to Asian soybean rust isolates that are virulent on each of the pyramided genes. Trop. Plant Pathol., 40, 283-290.
Yamaoka, Y. et al. (2014) Pathogenic races of soybean rust Phakopsora pachyrhizi collected in Tsukuba and vicinity in Ibaraki, Japan. J. Gen. Plant Pathol., 80, 184-188.
Yorinori, J. T. (2008) Soybean germplasms with resistance and tolerance to Asian rust and screening methods. In Facing the challenge of soybean rust in South America. JIRCAS Working Report No. 58, eds. Kudo, H. et al., JIRCAS, Tsukuba, Japan, 70-87.
Yorinori, J. T. et al. (2005) Epidemics of soybean rust (Phakopsora pachyrhizi) in Brazil and Paraguay. Plant Dis., 89, 675-677.
Chakraborty, N. et al. (2009) Mapping and confirmation of a new allele at Rpp1 from soybean PI 594538A conferring RB lesion-type resistance to soybean rust. Crop Sci., 49, 783-790.
FAOSTAT (2013) FAOSTAT statistical databases. Food and Agriculture Organization of the United Nations, Rome. http://www.faostat3.fao.org/browse/rankings/countries_by_commodity/E. (accessed on November 25, 2015)
Garcia, A. et al. (2008) Molecular mapping of soybean rust (Phakopsora pachyrhizi) resistance genes: discovery of a novel locus and alleles. Theor. Appl. Genet., 117, 545-553.
Garcia, A. et al. (2011) Evidence of a susceptible allele inverting the dominance of rust resistance in soybean. Crop Sci., 51, 32-40.
Godoy C. V. et al. (2015) Eficiência de fungicidas para o controle da ferrugem-asiática da soja, Phakopsora pachyrhizi, na safra 2013/14: resultados sumarizados dos ensaios cooperativos. Circular Técnica 103., 1-7. Embrapa Soja, Londrina, PR, Brazil. [In Portuguese].
Godoy, C. V. et al. (2016) Asian soybean rust in Brazil: past, present and future. Pesq. Agropec. Bras. (in press).
Hartman, G. L. et al. (2005) Breeding for resistance to soybean rust. Plant Dis., 89, 664-666.
Hartman, G. L. et al. (2011) Interaction of soybean and Phakopsora pachyrhizi, the cause of soybean rust. CAB Rev.: Perspect. Agr. Vet. Sci. Nutr. Nat. Resour., 6, 1-13.
Hartwig, E. E. (1986) Identification of a fourth major gene conferring resistance to soybean rust. Crop Sci., 26, 1135-1136.
Hartwig, E. E. & Bromfield, K. R. (1983) Relationships among three genes conferring specific resistance to rust in soybeans. Crop Sci., 23, 237-239.
Isard, S. A. et al. (2005) Principles of the atmospheric pathway for invasive species applied to soybean rust. Bioscience, 55, 851-861.
Ivancovich, A. (2005) Soybean rust in Argentina. Plant Dis., 89, 667-668.
Kelly, H. Y. et al. (2015) From select agent to an established pathogen: the response to Phakopsora pachyrhizi (soybean rust) in North America. Phytopathology, 105, 905-916.
Lemos, N. G. et al. (2011) Characterization of genes Rpp2, Rpp4, and Rpp5 for resistance to soybean rust. Euphytica, 182, 53-64.
Levy, C. (2005) Epidemiology and chemical control of soybean rust in Southern Africa. Plant Dis., 89, 669-674.
Li, S. et al. (2012) Identification of a new soybean rust resistance gene in PI 567102B. Theor. Appl. Genet., 125, 133-142.
Li, X. et al. (2010) The uniqueness of the soybean rust pathosys-tems: an improved understanding of the risk in different regions of the world. Plant Dis., 94, 796-806.
Maphosa, M. et al. (2012) Enhancing soybean rust resistance through Rpp2, Rpp3 and Rpp4 pair wise gene pyramiding. Afr. J. Agric. Res., 7, 4271-4277.
McLean, R. J. & Byth, D. E. (1980) Inheritance of resistance to rust (Phakopsora pachyrhizi) in soybeans. Aust. J. Agric. Res., 31, 951-956.
Miles, M. R. et al. (2003) Soybean rust: is the U.S. soybean crop at risk? APSnet Features, doi: 10.1094/APSnetFea-ture-2003-0603.
Pan, Z. et al. (2006) Long-term prediction of soybean rust entry