Patent Quality and Settlement Among Repeat Patent Litigants
36
ARTICLES Patent Quality and Settlement Among Repeat Patent Litigants JOHN R. ALLISON,* MARK A. LEMLEY** & JOSHUA W ALKER*** Repeat patent plaintiffs—those who sue eight or more times on the same patents—have a disproportionate effect on the patent system. They are respon- sible for a sizeable fraction of all patent lawsuits. Their patents should be among the strongest, according to all economic measures of patent quality. And logic suggests that repeat patent plaintiffs should be risk averse, settling more of their cases and taking only the very best to trial to avoid having their patents invalidated. In this Article, we test those hypotheses. We find that repeat patent plaintiffs are somewhat more likely to settle their cases. But to our surprise, we find that when they do go to trial or judgment, overwhelmingly they lose. This result seems to be driven by two parallel findings: both software patents and patents owned by nonpracticing entities (so-called “patent trolls”) fare ex- tremely poorly in court. We offer some possible explanations for why a group of apparently weak patents nonetheless has so much influence over the patent system and some preliminary thoughts about how these findings should shape the patent reform debate. TABLE OF CONTENTS INTRODUCTION .......................................... 678 I. THE MOST-LITIGATED PATENTS .......................... 681 II. RESULTS .......................................... 686 A. OUTCOMES AND SETTLEMENTS ........................ 686 * Spence Centennial Professor, McCombs Graduate School of Business, University of Texas at Austin. © 2011, John R. Allison, Mark A. Lemley & Joshua Walker. ** William H. Neukom Professor, Stanford Law School; partner, DurieTangri LLP. *** CEO, Lex Machina, Inc. Thanks to participants at the Harvard Law and Economics Workshop, the Columbia Law and Economics Workshop, the Conference on Empirical Legal Studies, the Northwest- ern University Patent Litigation Roundtable, and the National Bureau of Economic Research Summer Intellectual Property Institute, and to Ian Ayres, Jonathan Barnett, Jim Bessen, Colleen Chien, Wesley Cohen, Terry Fisher, Michael Frakes, Alberto Galasso, Rose Hagan, Dietmar Harhoff, Scott Hemphill, Brian Jones, Louis Kaplow, Rob Kunstadt, Clarisa Long, Paul Morgan, Craig Nard, Michael Risch, Ben Roin, Dave Schwartz, Steve Shavell, Ted Sichelman, and Scott Stern for helpful comments, and to David Rizk for research assistance. Ying He, Ph.D. candidate, McCombs School of Business, provided invaluable statistical assistance. 677
Transcript of Patent Quality and Settlement Among Repeat Patent Litigants

ARTICLES
Patent Quality and Settlement Among RepeatPatent Litigants
JOHN R. ALLISON,* MARK A. LEMLEY** & JOSHUA WALKER***
Repeat patent plaintiffs—those who sue eight or more times on the samepatents—have a disproportionate effect on the patent system. They are respon-sible for a sizeable fraction of all patent lawsuits. Their patents should beamong the strongest, according to all economic measures of patent quality. Andlogic suggests that repeat patent plaintiffs should be risk averse, settling moreof their cases and taking only the very best to trial to avoid having their patentsinvalidated. In this Article, we test those hypotheses. We find that repeat patentplaintiffs are somewhat more likely to settle their cases. But to our surprise, wefind that when they do go to trial or judgment, overwhelmingly they lose. Thisresult seems to be driven by two parallel findings: both software patents andpatents owned by nonpracticing entities (so-called “patent trolls”) fare ex-tremely poorly in court. We offer some possible explanations for why a group ofapparently weak patents nonetheless has so much influence over the patentsystem and some preliminary thoughts about how these findings should shapethe patent reform debate.
TABLE OF CONTENTS
INTRODUCTION . . . . . . . . . . . . . . . . . . . . . . . . . . . . . . . . . . . . . . . . . . 678
I. THE MOST-LITIGATED PATENTS . . . . . . . . . . . . . . . . . . . . . . . . . . 681
II. RESULTS . . . . . . . . . . . . . . . . . . . . . . . . . . . . . . . . . . . . . . . . . . 686
A. OUTCOMES AND SETTLEMENTS . . . . . . . . . . . . . . . . . . . . . . . . 686
* Spence Centennial Professor, McCombs Graduate School of Business, University of Texas atAustin. © 2011, John R. Allison, Mark A. Lemley & Joshua Walker.
** William H. Neukom Professor, Stanford Law School; partner, Durie Tangri LLP.*** CEO, Lex Machina, Inc. Thanks to participants at the Harvard Law and Economics Workshop,
the Columbia Law and Economics Workshop, the Conference on Empirical Legal Studies, the Northwest-ern University Patent Litigation Roundtable, and the National Bureau of Economic Research SummerIntellectual Property Institute, and to Ian Ayres, Jonathan Barnett, Jim Bessen, Colleen Chien, WesleyCohen, Terry Fisher, Michael Frakes, Alberto Galasso, Rose Hagan, Dietmar Harhoff, Scott Hemphill,Brian Jones, Louis Kaplow, Rob Kunstadt, Clarisa Long, Paul Morgan, Craig Nard, Michael Risch, BenRoin, Dave Schwartz, Steve Shavell, Ted Sichelman, and Scott Stern for helpful comments, and toDavid Rizk for research assistance. Ying He, Ph.D. candidate, McCombs School of Business, providedinvaluable statistical assistance.
677
B. ENTITY SIZE AND STATUS . . . . . . . . . . . . . . . . . . . . . . . . . . . . 689
1. Entity Size . . . . . . . . . . . . . . . . . . . . . . . . . . . . . . . . . . 689
2. NPE Status . . . . . . . . . . . . . . . . . . . . . . . . . . . . . . . . . 691
C. INDUSTRY AND TECHNOLOGY DIFFERENCES . . . . . . . . . . . . . . . . 695
D. LOGISTIC REGRESSION . . . . . . . . . . . . . . . . . . . . . . . . . . . . . . 697
III. EXPLANATIONS AND IMPLICATIONS . . . . . . . . . . . . . . . . . . . . . . . . . 700
A. OTHER EXPLANATIONS FOR SETTLEMENT DATA . . . . . . . . . . . . . . 700
1. Number of Defendants . . . . . . . . . . . . . . . . . . . . . . . . . 700
2. License Agreements and Plaintiff Stakes . . . . . . . . . . . . 704
B. WEAK LITIGATED PATENTS . . . . . . . . . . . . . . . . . . . . . . . . . . . 705
1. Multiple Lawsuits As Evidence of Obviousness? . . . . . . 706
2. Overclaiming? . . . . . . . . . . . . . . . . . . . . . . . . . . . . . . . 707
3. Are Software Patents or Trolls the Problem? . . . . . . . . . 707
C. OUTLIERS: CRAZY LIKE A FOX? . . . . . . . . . . . . . . . . . . . . . . . . 709
D. DO WE UNDERSTAND PATENT VALUE? . . . . . . . . . . . . . . . . . . . . 710
E. DO WE UNDERSTAND LITIGATION BEHAVIOR? . . . . . . . . . . . . . . . 711
CONCLUSION . . . . . . . . . . . . . . . . . . . . . . . . . . . . . . . . . . . . . . . . . . . . 712
INTRODUCTION
Patent owners who file lawsuits put their underlying patents at risk. Asignificant percentage of litigated patents are held invalid,1 and a finding ofinvalidity is the death knell for a patent. Because of the arcane civil proceduredoctrine of offensive nonmutual collateral estoppel, the consequences of valid-ity and invalidity holdings are highly asymmetric.2 A patentee who wins a suitagainst defendant A, having proven the patent infringed and fought off a validitychallenge, gets no credit for the win in a subsequent suit against defendant B.3
Because B was not a party to the first suit, it is entitled to once again challenge
1. See, e.g., John R. Allison & Mark A. Lemley, Empirical Evidence on the Validity of LitigatedPatents, 26 AIPLA Q.J. 185, 205 (1998) (finding that 46% of patents litigated to judgment are heldinvalid); Paul M. Janicke & LiLan Ren, Who Wins Patent Infringement Cases?, 34 AIPLA Q.J. 1, 5–6(2006) (finding that patentees win only 25% of cases litigated to judgment, in part because of invalidityand in part because of noninfringement).
2. E.g., Blonder-Tongue Labs, Inc. v. Univ. of Ill. Found., 402 U.S. 313, 325 (1971) (discussingconsequences and fairness of nonmutuality of estoppel in patent litigation).
3. Indeed, the Federal Circuit has even refused to allow the prior judgment to be considered by thejury in a subsequent lawsuit. See Mendenhall v. Cedarapids, Inc., 5 F.3d 1557, 1575 (Fed. Cir. 1993).
678 [Vol. 99:677THE GEORGETOWN LAW JOURNAL
the validity of the patent, even on the very same grounds rejected in the firstlawsuit.4 The same is true in subsequent suits against defendants C, D, E, and soon.5 Indeed, for this reason Federal Circuit Judge Rich used to insist that patentswere not held valid, but merely held “not invalid.”6 By contrast, should Asucceed in proving the patent invalid, the game is up. The doctrine of collateralestoppel will prevent the patentee from enforcing the patent against B, C, D, orE; each of those defendants is entitled to rely on the patentee’s prior loss todefeat the lawsuit.7 And even existing licensees will be permitted to stop payingroyalties and file their own challenge to the patent.8
If you are a patent owner who faces multiple infringers, the deck is stackedagainst you. How might patentees respond to this asymmetry? One possibleoption is to sue all the defendants at once. Doing so makes the resulting casemore complex, but it insulates the patentee from the risk of having to litigatevalidity again and again. And even the complexity of the multi-defendant suitcan redound to the patentee’s advantage if defendants cannot agree to present aunified front on issues like claim construction.9 Alternatively, patentees that areinvolved (or expect to be involved) in multiple lawsuits might reasonably bemore likely to settle cases rather than risk taking them to judgment because anadverse judgment wipes out all the other lawsuits as well.10
Corollaries of these anticipated patentee responses are that we should expectrational patentees to prefer filing single lawsuits against multiple entities ratherthan filing multiple suits in parallel,11 that patentees who file multiple lawsuitsshould settle more often than other patentees, and that those patentees who dofile multiple lawsuits and litigate those suits to judgment might do so because
4. Id.5. Id.6. See, e.g., Thomson, S.A. v. Quixote Corp., 166 F.3d 1172 (Fed. Cir. 1999).7. In patent law, this is true even if the patentee has already litigated and won one or more cases
before its first loss. See, e.g., Mendenhall v. Barber-Greene Co., 26 F.3d 1573, 1577 (Fed. Cir. 1994);Miss. Chem. Corp. v. Swift Agric. Chems. Corp., 717 F.2d 1374, 1379 (Fed. Cir. 1983); Stevenson v.Sears, Roebuck & Co., 713 F.2d 705, 709 (Fed. Cir. 1983).
8. MedImmune, Inc. v. Genentech, Inc., 549 U.S. 118, 137 (2007); Lear, Inc. v. Adkins, 395 U.S.653, 673–74 (1969).
9. The patentee’s costs go up with more defendants because they must prove more infringements.But the increase is not linear because many of the issues—claim construction, validity, unenforceability—will take just as much time to litigate against one defendant as against ten. On the defense side, theremay be some cost savings from sharing research, but it has been our experience that trying tocoordinate strategy among many different lawyers is often more rather than less costly.
10. For a discussion of the game-theoretics of claim preclusion, see Bruce L. Hay, Some SettlementEffects of Preclusion, 1993 U. ILL. L. REV. 21 (1993). Hay suggests that claim preclusion might notdrive more settlements because the parties could bargain for their own preclusion rules. But he isfocused only on mutual collateral estoppel, which governs subsequent suits between the same parties.His argument does not apply to nonmutual collateral estoppel—the kind we are concerned with here.Cf. Michael Risch, Patent Challenges and Royalty Inflation, 85 IND. L.J. 1003 (2010) (modelingrepeat-play behavior in patent litigation).
11. Some patentees will file “test suits” against small companies early on, in hopes of building a warchest and a record of enforcement before suing a larger array of companies. But that strategy supportsserial patent lawsuits, not the suits in parallel that we observe.
2011] 679REPEAT PATENT LITIGANTS

they have a stronger than average patent and therefore face less risk of invalid-ity. In this Article, we test each of these hypotheses using a unique database, theStanford IP Litigation Clearinghouse. In Part I, we explain the source of ourdata and our methodology.
Part II provides our results. There has been an increase in the number ofdefendants named in a particular suit. Nonetheless, many patents are enforced inmultiple lawsuits. We focus on the most-litigated patents—all 106 patents thathave been the subject of eight or more lawsuits since the year 2000. Weemphasize that being involved in eight or more lawsuits does not mean thatthese patents went to judgment eight or more times. Most cases settle, and manycases in our data set were still pending as of our closing date. In fact, very fewcases in our data set had more than one judgment.
Those most-litigated patents exhibit characteristics that economists haveassociated with value. Indeed, economists looking at these patents would saythey are far more valuable than the average patent or even than the average-litigated patent.12 We also find that serial patent litigants do react to the greaterconsequences of losing; cases involving the most-litigated patents are indeedmore likely to settle than ordinary-litigated patents with a high degree ofsignificance. But to our great surprise, we find that the willingness of thesepatentees to litigate their cases to judgment is a mistake. Far from beingstronger than other litigated patents, the most-litigated patents that go to judg-ment are far more likely to be held invalid or not infringed. The differences aredramatic. Once-litigated patents win in court almost 50% of the time, while themost-litigated—and putatively most valuable—patents win in court only 10.7%of the time.13
The results are equally striking for patents owned by nonpracticing entities(NPEs) and for software patentees. NPEs and software patentees overwhelm-ingly lose their cases, even with patents that they litigate again and again.
12. See Gwendolyn G. Ball & Jay P. Kesan, Transaction Costs and Trolls: Strategic Behavior byIndividual Inventors, Small Firms and Entrepreneurs in Patent Litigation 2 (Ill. Law & Econ. PapersSeries, Research Papers Series No. LE09-005, 2009), available at http://papers.ssrn.com/abstract�1337166 (finding “evidence that when suing a large alleged infringer, small parties are only enforcingtheir most ‘valuable’ patents.”); Timo Fischer & Joachim Henkel, Patent Trolls or Markets forTechnology—An Empirical Analysis of Trolls’ Patent Acquisitions 2 (Dec. 14, 2009) (working paper),available at http://papers.ssrn.com/sol3/papers.cfm?abstract_id�1523102 (finding that nonpracticingentities (NPEs) purchased patents that had characteristics associated with patent value).
13. Comparing them shows that patent owner win rates are greater with an exceptional degree ofstatistical significance—the p-value (the statistical measure of the likelihood that the result arose bychance) is 0. This calculation includes plaintiff wins by default judgment in the once-litigated set ofpatents; there were no default wins in the most-litigated set. These percentages are obtained whensettlements are excluded from the denominator, with only win rates being compared. The percentagewin rates are naturally much smaller for both plaintiffs and accused infringers than when the hugenumbers of settlements are in the denominator, but the comparison is just as striking—with settlementsin the denominator, patent owners in the most-litigated group prevailed only 1% of the time, while those in theonce-litigated group prevailed 7.6% of the time. A statistical comparison still yields a p-value of 0.
680 [Vol. 99:677THE GEORGETOWN LAW JOURNAL
Software patentees win only 12.9% of their cases, while NPEs win only 9.2%.14
In Part III, we offer some preliminary thoughts about what might explainthese results. We first investigate whether the outcome data are the result ofclustering—a few cases in multidistrict litigation that invalidate or hold notinfringed multiple patents at once. We find some evidence of clustering but notenough to explain the full differences in the outcomes. One possible explanationis that defendants rather than plaintiffs are driving the decision to take a weakpatent to judgment by simply refusing to settle. Another possibility is that theenforcement of a patent against multiple infringers is an indication of wide-spread simultaneous invention and, hence, of obviousness. A third possibility isthat these plaintiffs are by definition outliers, a status that may affect both theirrationality and their skill at litigation. For instance, the decision to sue inmultiple different suits rather than consolidating the suits may itself provideevidence about the sophistication of the plaintiff and, hence, the likely outcome.Finally, it is possible that the economics of patent litigation make it profitable toenforce even patents that are overwhelmingly likely to lose in court.
None of these explanations is entirely satisfactory. The result is a bit of apuzzle. The most-litigated patents—the patents that by all measures should bethe most important—seem mostly to fail in court. So too do the patents thathave occupied the most public attention—software patents and patents filed byNPEs. That fact has implications for patent policy and, in particular, for patentreform directed at litigation abuse. It appears that, as a society, we are spendinga disproportionate amount of time and money dealing with a class of weakpatents. Our results may also have implications for our models of patent valueand of rational behavior in litigation because it appears we know quite a bit lessthan we thought about what makes patents valuable.
I. THE MOST-LITIGATED PATENTS
In prior work, two of this Article’s authors demonstrated that litigated patentshave significantly different characteristics than other patents.15 They includemore claims, cite more prior art, are cited more often by later patents, file morecontinuation applications, and come from larger “families” of patents.16 They
14. These percentages also are calculated with settlements excluded from the denominator, andcomparisons in the case of both software patentees and NPEs show that they lose when compared withnon-software patentees and product-producing companies, respectively, with an extremely high degreeof statistical significance—again, with p-values of 0. Likewise, when the calculations are made withsettlements left in the denominators, the statistical differences are just as striking, with p-values onceagain of 0.
15. John R. Allison et al., Valuable Patents, 92 GEO. L.J. 435 (2004) [hereinafter ALMT]; see alsoJohn R. Allison & Thomas W. Sager, Valuable Patents Redux: On the Enduring Merit of Using PatentCharacteristics to Identify Valuable Patents, 85 TEX. L. REV. 1769 (2007) (defending the statisticalpower of the results in the earlier study); James Bessen, The Value of U.S. Patents By Owner and PatentCharacteristics, 37 RES. POL’Y 932, 932 (2008) (finding that “[l]itigated patents are more valuable, asare highly cited patents”).
16. ALMT, supra note 15, at 451–58.
2011] 681REPEAT PATENT LITIGANTS
are also concentrated in some industries but not others; semiconductor patentsare particularly unlikely to be litigated.17 Many of these characteristics arewithin the control of the patent applicant, and most are known by the time thepatent issues.18 Allison, Lemley, Moore, and Trunkey (ALMT) suggest thatthese characteristics are evidence of the private value of patents,19 following asignificant economic literature correlating each of these attributes with value tothe patent owner.20
That prior work depended significantly on a randomly selected sample ofcases actually litigated, collected by hand from district courts around thecountry. The development of the Stanford IP Litigation Clearinghouse in Decem-ber 2008 opened up a second alternative.21 The Clearinghouse collects everypatent lawsuit filed since January 1, 2000, in searchable format and links thosesuits to the patents involved.22 Using that database, in a prior paper weidentified every patent that has been litigated eight or more times betweenJanuary 2000 and February 2009 (including cases still pending). There were106 such patents, which have been litigated in a total of 2,987 differentpatent-suit pairs in 478 different suits, often against multiple defendants.23 For
17. Id. at 438.18. Id. at 460.19. Id. at 460–65.20. See, e.g., Bessen, supra note 15, at 932 (finding that citation and litigation both correlate with
patent value); Jean O. Lanjouw & Mark Schankerman, Characteristics of Patent Litigation: A Windowon Competition, 32 RAND J. ECON. 129, 140 (2001) (finding that litigation correlates with patent valueand that “[t]he number of claims is another . . . indicator of the ‘bits of information’ contained in apatent, and therefore its value”); Stuart J.H. Graham et al., Post-issue Patent “Quality Control”: AComparative Study of US Patent Re-examinations and European Patent Oppositions (Nat’l Bureau ofEcon. Research, Working Paper No. 8807, 2002) (comparing USPTO and EPO opposition mechanismsand finding that the most valuable patents were challenged in both systems); Dietmar Harhoff &Markus Reitzig, Determinants of Opposition Against EPO Patent Grants—The Case of Biotechnologyand Pharmaceuticals 1 (Ctr. for Econ. Pol’y Res., Discussion Paper No. 3645, 2002) (confirming that“valuable patents are more likely to be attacked”); Jean O. Lanjouw & Mark Schankerman, EnforcingIntellectual Property Rights 5 (Nat’l Bureau of Econ. Res., Working Paper No. 8656, 2001) (“[M]orevaluable patents . . . are much more likely to be involved in suits.”); cf. Dietmar Harhoff et al.,Citations, Family Size, Opposition and the Value of Patent Rights, 32 RES. POL’Y 1343, 1345 (2003)(finding that “[p]atents which are upheld against opposition . . . are particularly valuable”); Jean O.Lanjouw & Josh Lerner, The Enforcement of Intellectual Property Rights: A Survey of the EmpiricalLiterature, 49/50 ANNALES D’ECONOMIE ET DE STATISTIQUE 223 (1998) (surveying the literature on theissue).
21. That site is presently operated by a private company, Lex Machina, Inc., and hosted athttp://www.lexmachina.org.
22. Due to increased availability over time of electronic filings in federal court, the ability to identifypatents in suits improves markedly later in time, particularly from 2003 forward. Moreover, electronicaccess also varies by district, potentially making this patent data set under-inclusive for certain districtsdespite hand-collection of cases from those districts. Nevertheless, the patents identified represent thebest, most representative data set available.
23. John R. Allison, Mark A. Lemley & Joshua Walker, Extreme Value or Trolls on Top? EvidenceFrom the Most-Litigated Patents, 158 U. PA. L. REV. 1 (2009). For purposes of this analysis we includedeclaratory judgment actions as well as actions filed by the patent owner; until 2007 the rules fordeclaratory judgment required a clear threat of suit by the patent owner. Teva Pharm. USA, Inc. v.Pfizer, Inc., 395 F.3d 1324, 1333 (2005), abrogated by MedImmune, Inc. v. Genentech, Inc., 549 U.S.
682 [Vol. 99:677THE GEORGETOWN LAW JOURNAL
purposes of that study, we identified a randomly selected control set of 106patents that have been litigated only once during this time period. This allowedus to extend the work ALMT did in 2003, comparing ordinary litigated patents(already outliers, as we have seen) to the most-litigated patents. To assess theALMT value hypothesis, we collected data on the number of continuationapplications filed leading to issuance of the patent; the raw and adjusted numberof “forward citations” (citations to the patent by later patents); the number of“backward citations” to U.S. patents, foreign patents, and non-patent prior art(“prior art references”—the citations the patent makes to prior art); and thenumber of claims in each patent. Each of these factors has been identified in theeconomic literature as evidence of the value of a patent.24 As ALMT predicted,those most-litigated patents exhibited even more evidence of private value andeven more of an industry skew than did the average litigated patent.25
In this Article, we use the same most-litigated cases, but collect informationabout the outcome of each case. In addition, we expand our sample of once-litigated cases to 343 (after exclusion of cases that were still pending or thatwere the subject of purely procedural dispositions) in order to generate a morevalid statistical sample of cases that went to judgment or settlement.26
For each litigated patent, we also determine small entity status (in otherwords, whether the patent owner at issue was an individual, university, or smallbusiness, collectively referred to as “small entities”), whether the patent beinglitigated covers a software invention, whether the patent is assigned beforelitigation, and—following Lemley and Myhrvold27—the nature of the patentplaintiff, divided into one of twelve different “entity status” categories listed inTable 1.
Of the twelve classes of entity, only one (Class 8) involves enforcement by apatent owner that actually makes products. The rest are different types of NPEs,sometimes called “patent trolls” for the practice of hiding under a bridge theydid not build and demanding a toll from surprised passers-by. Rather than take a
118 (2007). We count only separate lawsuits; many patent lawsuits are filed against multiple defendantsin a single proceeding. If we count the number of patent assertion-defendant combinations, the numberof observations is more than 10,000. There are 478 separate lawsuits involving these patents, butbecause many of those lawsuits involve several different patents in the data set, the total number ofpatent-suit pairs of the 106 patents is 2,987.
The choice of the lower bound of eight suits for repeat litigants is arbitrary. It could have been seven,or nine, or ten. We chose a number that gave us enough different patents to run meaningful statisticaltests, while avoiding blurring the line between the most- and once-litigated patents.
24. See ALMT, supra note 15.25. Id. at 462–63.26. Every most-litigated patent was at one time a once-litigated patent. To avoid biasing our sample
by including patents that simply were not yet multiply litigated, but were headed that way, we checkedthe status of the once-litigated patents a year after the cut-off date and excluded those that hadadditional suits filed. This check is not perfect, but makes it less likely that the sample of once-litigatedpatents includes cases that would eventually qualify as most-litigated patents.
27. Mark A. Lemley and Nathan Myhrvold have developed a twelve-class taxonomy of patentplaintiffs, which we follow here.
2011] 683REPEAT PATENT LITIGANTS
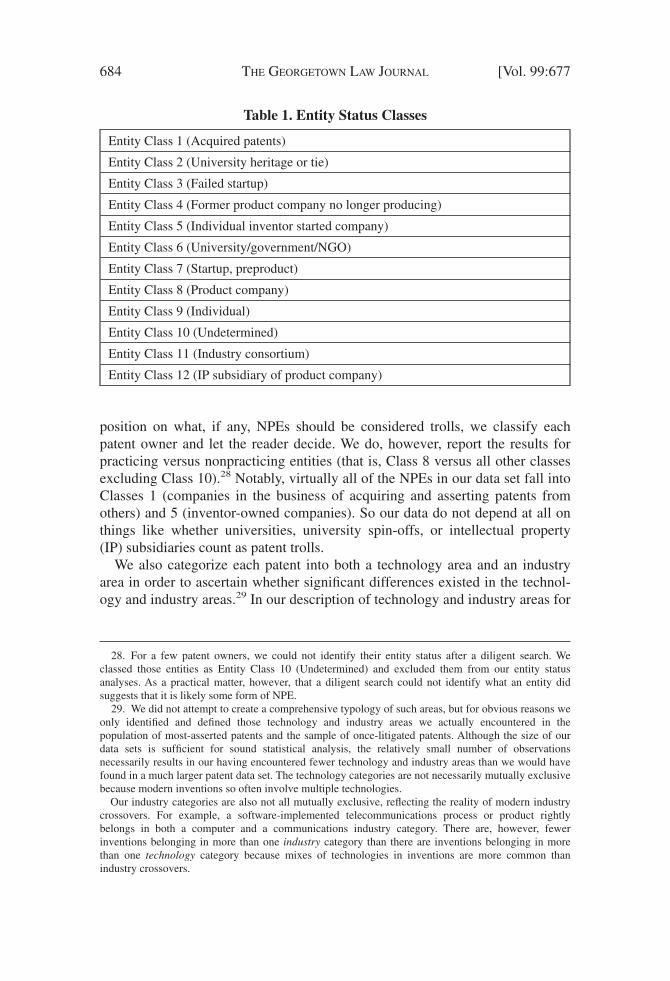
position on what, if any, NPEs should be considered trolls, we classify eachpatent owner and let the reader decide. We do, however, report the results forpracticing versus nonpracticing entities (that is, Class 8 versus all other classesexcluding Class 10).28 Notably, virtually all of the NPEs in our data set fall intoClasses 1 (companies in the business of acquiring and asserting patents fromothers) and 5 (inventor-owned companies). So our data do not depend at all onthings like whether universities, university spin-offs, or intellectual property(IP) subsidiaries count as patent trolls.
We also categorize each patent into both a technology area and an industryarea in order to ascertain whether significant differences existed in the technol-ogy and industry areas.29 In our description of technology and industry areas for
28. For a few patent owners, we could not identify their entity status after a diligent search. Weclassed those entities as Entity Class 10 (Undetermined) and excluded them from our entity statusanalyses. As a practical matter, however, that a diligent search could not identify what an entity didsuggests that it is likely some form of NPE.
29. We did not attempt to create a comprehensive typology of such areas, but for obvious reasons weonly identified and defined those technology and industry areas we actually encountered in thepopulation of most-asserted patents and the sample of once-litigated patents. Although the size of ourdata sets is sufficient for sound statistical analysis, the relatively small number of observationsnecessarily results in our having encountered fewer technology and industry areas than we would havefound in a much larger patent data set. The technology categories are not necessarily mutually exclusivebecause modern inventions so often involve multiple technologies.
Our industry categories are also not all mutually exclusive, reflecting the reality of modern industrycrossovers. For example, a software-implemented telecommunications process or product rightlybelongs in both a computer and a communications industry category. There are, however, fewerinventions belonging in more than one industry category than there are inventions belonging in morethan one technology category because mixes of technologies in inventions are more common thanindustry crossovers.
Table 1. Entity Status Classes
Entity Class 1 (Acquired patents)
Entity Class 2 (University heritage or tie)
Entity Class 3 (Failed startup)
Entity Class 4 (Former product company no longer producing)
Entity Class 5 (Individual inventor started company)
Entity Class 6 (University/government/NGO)
Entity Class 7 (Startup, preproduct)
Entity Class 8 (Product company)
Entity Class 9 (Individual)
Entity Class 10 (Undetermined)
Entity Class 11 (Industry consortium)
Entity Class 12 (IP subsidiary of product company)
684 [Vol. 99:677THE GEORGETOWN LAW JOURNAL
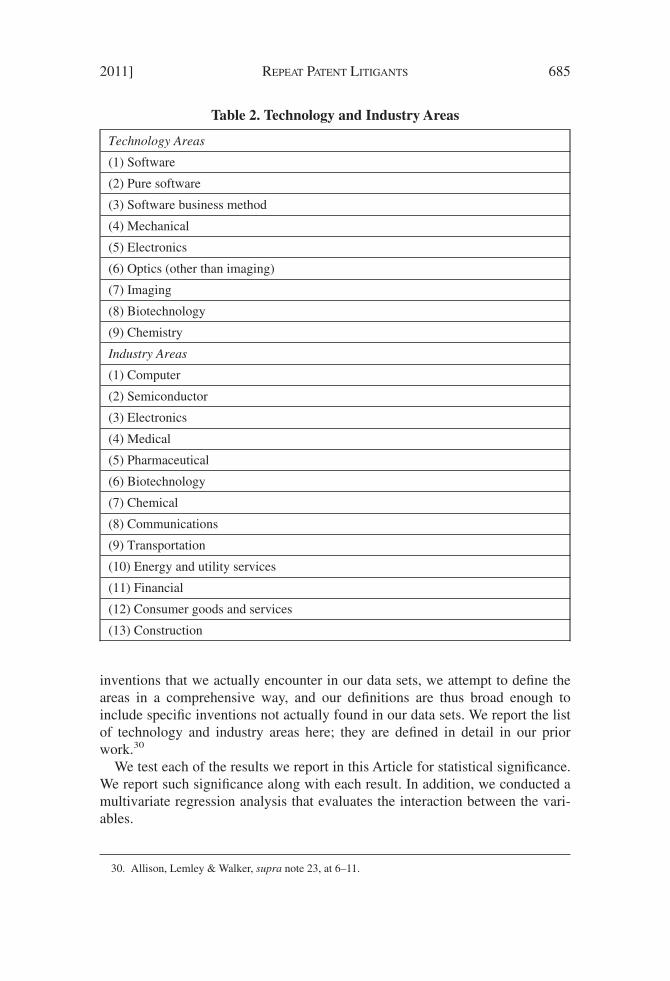
inventions that we actually encounter in our data sets, we attempt to define theareas in a comprehensive way, and our definitions are thus broad enough toinclude specific inventions not actually found in our data sets. We report the listof technology and industry areas here; they are defined in detail in our priorwork.30
We test each of the results we report in this Article for statistical significance.We report such significance along with each result. In addition, we conducted amultivariate regression analysis that evaluates the interaction between the vari-ables.
30. Allison, Lemley & Walker, supra note 23, at 6–11.
Table 2. Technology and Industry Areas
Technology Areas
(1) Software
(2) Pure software
(3) Software business method
(4) Mechanical
(5) Electronics
(6) Optics (other than imaging)
(7) Imaging
(8) Biotechnology
(9) Chemistry
Industry Areas
(1) Computer
(2) Semiconductor
(3) Electronics
(4) Medical
(5) Pharmaceutical
(6) Biotechnology
(7) Chemical
(8) Communications
(9) Transportation
(10) Energy and utility services
(11) Financial
(12) Consumer goods and services
(13) Construction
2011] 685REPEAT PATENT LITIGANTS
Finally, we evaluate the status of each of the cases as of August 2009. Wecategorize the outcomes of patent cases in the following ways: (1) settlements,including consent judgments; (2) procedural dispositions; (3) pending (includ-ing stays and transfers); (4) patentee wins, with and without default judgments;and (5) accused infringer wins. We count a case as a win by one party if thatparty has prevailed on a case-dispositive issue in the highest court to rule on themerits. Most of our outcomes are district court outcomes, though some havegone to the Federal Circuit. Notably, we count a case as a win for a party if thecase against at least one defendant went to judgment, even though otherdefendants might have settled before judgment.31
II. RESULTS
A. OUTCOMES AND SETTLEMENTS
As noted above, our previous work suggests that the most-litigated patentsare also the most valuable patents by all the available measures economists haveused. Assuming that those value measures are accurate, it is reasonable toexpect that the most-litigated patents are more likely to succeed in litigationthan the once-litigated patents. At the same time, the doctrine of offensivenonmutual collateral estoppel means that the most-litigated patents are also themost vulnerable. A patentee who files one suit puts the patent at risk, but unlessthe patent is widely licensed to others, the scope of that risk is not much greaterthan the risk of losing the one suit. By contrast, a patentee who has multiplelawsuits pending at the same time should be very worried about the possibilityof losing even one of those suits because doing so will bring down the wholeedifice. These two assumptions can reinforce each other; it is reasonable toassume that where a serial patent plaintiff does not settle, but actually takes thecase to judgment, the patents selected for litigation should be even stronger thanthe average most-litigated patent and more likely still to succeed in court.
As a result, we test two hypotheses: first, that the most-litigated patentowners will be risk averse, and therefore more likely than other litigants tosettle their lawsuits before judgment; and second, that where the most-litigatedpatents do get litigated to judgment, the patentee is more likely to prevail thanother litigants.
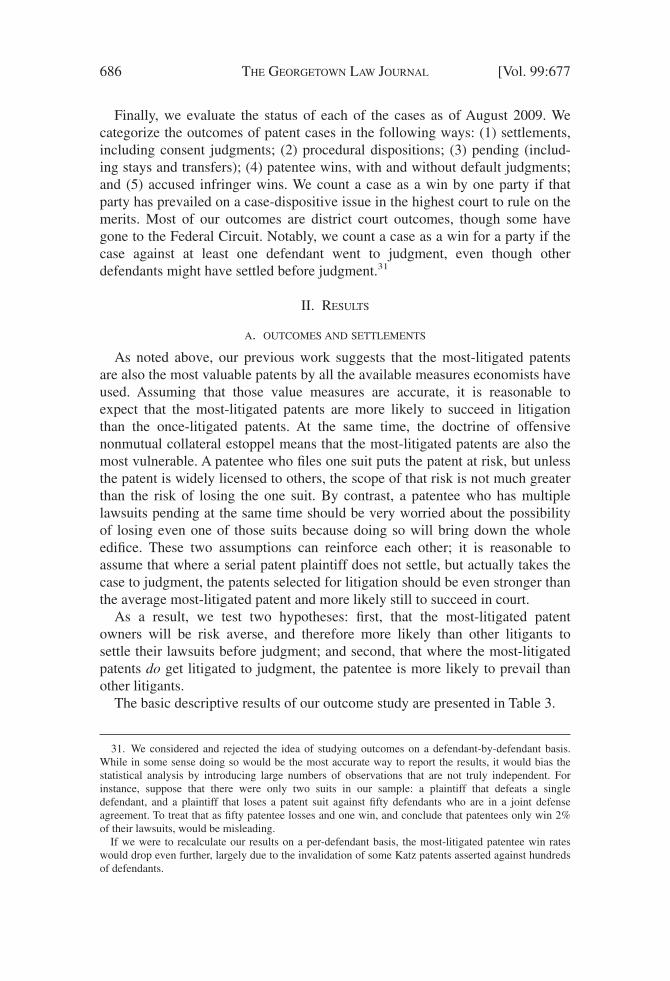
The basic descriptive results of our outcome study are presented in Table 3.
31. We considered and rejected the idea of studying outcomes on a defendant-by-defendant basis.While in some sense doing so would be the most accurate way to report the results, it would bias thestatistical analysis by introducing large numbers of observations that are not truly independent. Forinstance, suppose that there were only two suits in our sample: a plaintiff that defeats a singledefendant, and a plaintiff that loses a patent suit against fifty defendants who are in a joint defenseagreement. To treat that as fifty patentee losses and one win, and conclude that patentees only win 2%of their lawsuits, would be misleading.
If we were to recalculate our results on a per-defendant basis, the most-litigated patentee win rateswould drop even further, largely due to the invalidation of some Katz patents asserted against hundredsof defendants.
686 [Vol. 99:677THE GEORGETOWN LAW JOURNAL
It is worth noting the substantial number of most-litigated patent suits that areresolved on procedural grounds, whether involving personal jurisdiction, stand-ing, transfers to another venue, or multidistrict litigation (MDL) consolidation.It should not be surprising that these non-merits resolutions are more commonin the more complex environment of multiple litigation. But the widespread useof the MDL process, which is quite new to patent litigation, is notable, as is thesizeable number of transfers outside the MDL context.33 For purposes of ourstatistical analyses in the remainder of this Article, we exclude all pending cases(including stays), transfers, and procedural dispositions other than default judg-ments because none represent a resolution of the case either on the merits orthrough settlement. The result is a data set of 1,134 results, either on the merits,default judgment, or settlement, 343 of which are once-litigated patent out-comes and the rest are most-litigated patent outcomes.
Several facts stand out in these results. Most notably, our hypothesis that themost-litigated patents will fare well in litigation does not hold up. The most-litigated patent plaintiffs won only 10.7% of their cases, compared with 26%across all lawsuits34 and 47.3% in the once-litigated set.35
Statistical tests bear this out. We compare the proportion of win rates, testingthe null hypothesis that there is no difference between the most-litigated andonce-litigated patent outcomes.36 We test the proportions in several ways, both
32. The rows that are struck through are those we do not include in subsequent tests.33. Jamie H. McDole & Aaron D. Charfoos, Multidistrict Litigation in Patent Infringement Cases 2
(Mar. 2005) (unpublished manuscript), http://www.ipo.org/AM/Template.cfm?Section�Home&Template�/CM/ContentDisplay.cfm&ContentID�22938.
34. Janicke & Ren, supra note 1, at 5–6.35. The once-litigated win rate is only 35.6% if we exclude default judgments; this is discussed in
more detail below.36. Because the number of wins on the merits was arguably too small to use the Chi-square test, we
used Fisher’s exact test as well. Fisher’s exact test is commonly used to test differences in proportions,particularly when the number of observations is relatively small and when a Chi-square test may not
Table 3. Outcome Data32
OutcomesMost-Litigated
PatentsOnce-Litigated
Patents
settlement/consent judgment 716 288
procedural disposition 15 19
pending (including stays and transfers) 40 83
transfers (including multidistrict litigation) 139 11
default judgment 0 10
plaintiff win 8 16
defendant win 67 29
plaintiff win rate (including defaults) 10.7% 47.3%
2011] 687REPEAT PATENT LITIGANTS

including and excluding settlements in the denominator of decided cases, andboth including and excluding default judgments as plaintiff wins. No matterwhich test we use, the differences are highly statistically significant—themost-litigated patentees were more likely to lose.37
Our hypothesis of asymmetric stakes and a consequently greater tendency tosettle among repeat patent litigants was confirmed with statistical significance,but the degree of confirmation is not as striking as the disconfirming results forwin–loss rates. Settlement rates, with pending cases, procedural dispositions,
produce reliable results. Fisher’s exact test is widely used because it requires fewer assumptions thanalternative tests and worked well in the comparisons we made in this study. See generally RickRoutledge, Fisher’s Exact Test, in 3 ENCYCLOPEDIA OF BIOSTATISTICS 1961–64 (Peter Armitage & TheodoreColton eds., 2d ed. 2005).
Actually, the absolute differences in our comparisons were usually so great that the Chi-square testalso found statistical significance with high degrees of confidence (low p-values).
37. There is a potential problem of censoring of results because a ruling that a patent is invalid will,if final, prevent the patentee from enforcing the patent in its other suits. If, for instance, a largepercentage of the most-litigated patents were invalidated in the first lawsuit, they would not beenforceable in subsequent lawsuits. There is also a potential selection effect in the most-litigated setbecause cases that involve eight or more different lawsuits might do so only because they survived thefirst seven lawsuits (that is the patent was not held invalid in those earlier suits). Finally, findings mightnot be independent: whether one court holds a patent invalid or not infringed may strongly influencesubsequent courts deciding on the same patent.
Censoring and selection do not seem to be a significant problem in our data set, for the simple reasonthat most of the most-litigated patents involve cases that were filed roughly in parallel, not in series.Most cases in our study settle, and others are still pending, meaning that we have only a small share ofthe most-litigated patents that are the subject of even one ruling on the merits, and very few that getmore than one ruling on the merits. Some of those merits rulings are on infringement, not invalidity,and so will not create estoppel against subsequent lawsuits. Further, a ruling by the district court willnot create an estoppel effect as long as that ruling is on appeal. The vast majority of our outcomes aredistrict court rulings, which means the other lawsuits are not automatically precluded by even a findingof invalidity.
The independence concern is potentially more significant. If, for instance, we were to find that a fewmost-litigated patents were invalidated by a single court, and then multiple courts adopted thatreasoning and invalidated the patent, that finding would not necessarily indicate that the most-litigatedpatents overall were likely invalid. But that is not what we find. There are virtually no instances ofmultiple rulings on the merits of the same patent in our data set. And when we exclude the fewinstances that do exist, the results do not change.
Table 4. Most-Litigated vs. Once-Litigated Win Rates
Most-Litigated(WithoutDefault
Judgments)
Once-Litigated(WithoutDefault
Judgments)
p-Value(Both
Chi-sq. &Fisher’sExact)
Most-Litigated
(IncludingDefault
Judgments)
Once-Litigated
(IncludingDefault
Judgments)
p-Value(Both
Chi-sq. &Fisher’sExact)
SettlementsIncluded inDenominator 1.00% 4.80% 0 1.00% 7.60% 0
SettlementsExcluded fromDenominator 10.70% 35.60% �0.01 10.70% 47.30% 0
688 [Vol. 99:677THE GEORGETOWN LAW JOURNAL
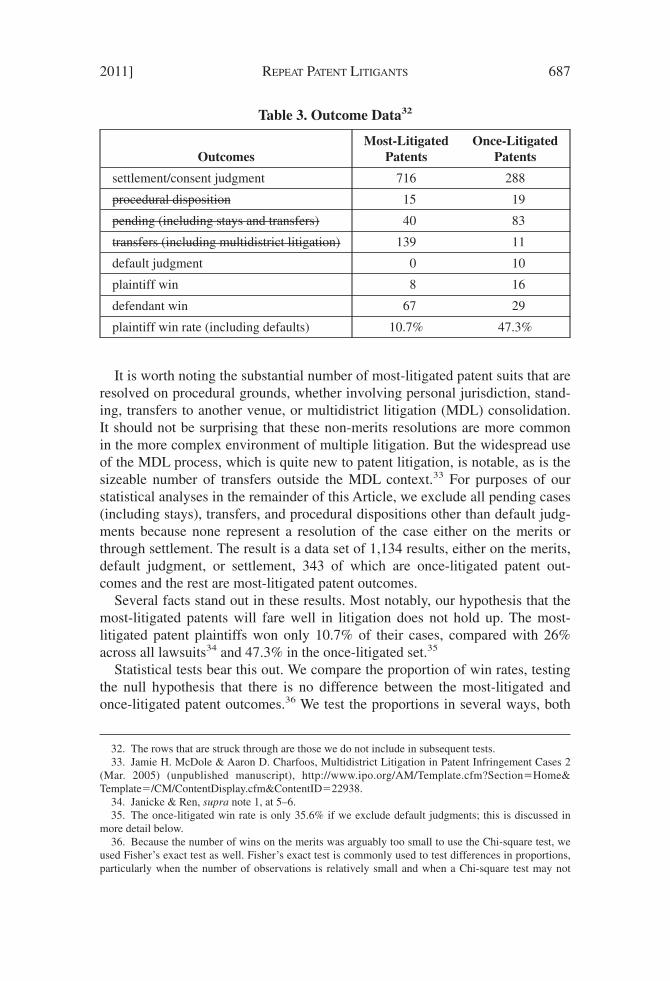
and transfers removed from the denominators, are reported in Table 5.38
Settlements account for 90.5% of the outcomes in the most-litigated patentset and 84.0% of the outcomes among the once-litigated patents. This differenceis highly statistically significant, confirming our hypothesis of a greater ten-dency to settle among repeat patent litigants.
Thus, when settlement fails and cases go to judgment, our hypothesis regard-ing the strength of the most-litigated patents does not hold up. Patent plaintiffsare repeatedly litigating patents that are less successful than the once-litigatedpatents. And although they are more likely to settle than the once-litigatedpatents, the disparity is less than theory would predict because the most-litigated patentees regularly lose the cases that do go to judgment. In Part III,we consider possible explanations for this surprising result.
B. ENTITY SIZE AND STATUS
1. Entity Size
We also test the relationship between entity size and entity status and theoutcome of cases. The United States Patent and Trademark Office (PTO)distinguishes between “large” and “small” entities. A small entity is an indi-vidual, a university, a nonprofit organization, or a company with fewer than 500employees.39 Small-entity status is determined based on the entity that ownedthe patent when it issued from the PTO; one complication is that many patentsare sold before litigation.40 Nonetheless, PTO small-entity status is a usefulproxy for the size of the patent plaintiff. We test the effect of the plaintiff’s sizeon the outcome of patent litigation.41
Considering only the patents themselves, the proportions of initial ownershipby large and small entities are almost equal in the most- and once-litigated data
38. Of necessity, there were no MDL transfers in these cases as there were among the most-litigatedpatents.
39. 35 U.S.C. § 41(h)(1) (2006) (incorporating by reference the Small Business Act § 3, 15 U.S.C.§ 631 (2006)).
40. Kimberly A. Moore, Populism and Patents, 82 N.Y.U. L. REV. 69, 96–97 (2007) (documenting ahigh rate of prelitigation transfer of patents).
41. As we did in our prior article, we removed Ronald S. Katz Technology Licensing LLP from theentity-size analysis because Katz owns some patents classed as small-entity patents and others classedas large-entity patents. In our most-litigated set, Katz did not claim small-entity status (with theresulting lower filing fees) that he was entitled to claim, and thus, these patents were recorded as havingbeen issued to large entities when they should not have been.
Table 5. Most-Litigated vs. Once-Litigated Settlement Rates
SettlementRate
p-Value (Both Chi-sq.& Fisher’s Exact)
Most-Litigated Patents 90.50%�0.01
Once-Litigated Patents 84.00%
2011] 689REPEAT PATENT LITIGANTS
sets: 53.5% of most-litigated patents and 47.8% of once-litigated patents wereissued to large entities. The picture is different, however, when one looks at theproportion of actual patent-suit pairs in litigation, where large entities accountfor a surprisingly small percentage of the most-litigated patents.42 Becausesmall entities are disproportionately represented in the actual litigation ofmost-litigated patents (those patents that were asserted against accused infring-ers at least eight times), patents that were initially issued to large entitiesrepresent only 22.4% of the patent-suit pairs in the most-litigated group,compared to 47.8% of the once-litigated group.
We find no significant difference in the propensity of large and small entitiesto settle their cases. Indeed, the settlement rates are virtually identical at 87.1%and 87.5%, respectively.
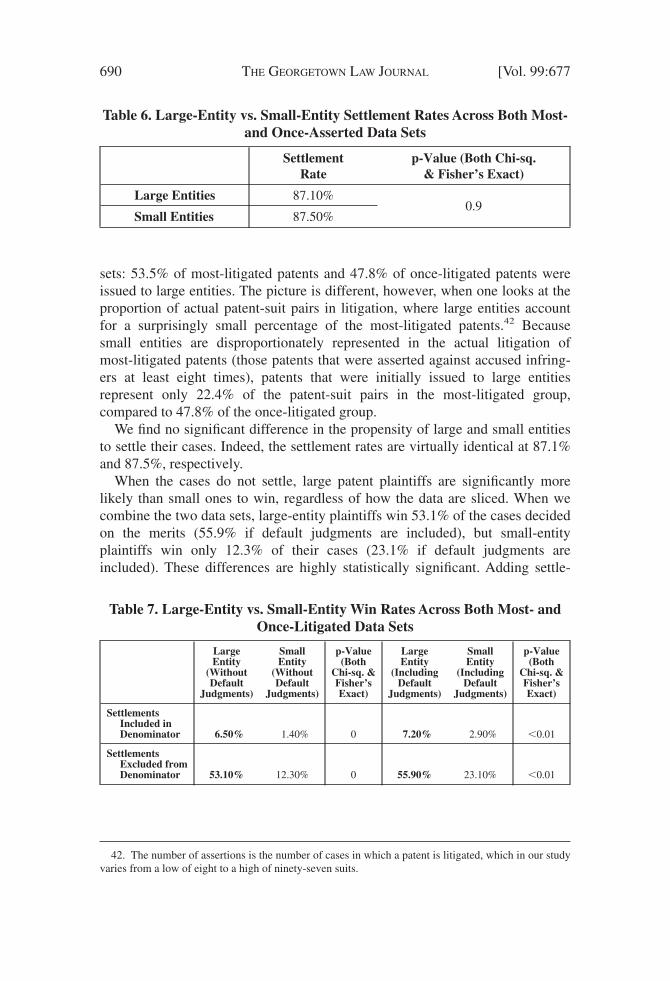
When the cases do not settle, large patent plaintiffs are significantly morelikely than small ones to win, regardless of how the data are sliced. When wecombine the two data sets, large-entity plaintiffs win 53.1% of the cases decidedon the merits (55.9% if default judgments are included), but small-entityplaintiffs win only 12.3% of their cases (23.1% if default judgments areincluded). These differences are highly statistically significant. Adding settle-
42. The number of assertions is the number of cases in which a patent is litigated, which in our studyvaries from a low of eight to a high of ninety-seven suits.
Table 6. Large-Entity vs. Small-Entity Settlement Rates Across Both Most-and Once-Asserted Data Sets
SettlementRate
p-Value (Both Chi-sq.& Fisher’s Exact)
Large Entities 87.10%0.9
Small Entities 87.50%
Table 7. Large-Entity vs. Small-Entity Win Rates Across Both Most- andOnce-Litigated Data Sets
LargeEntity
(WithoutDefault
Judgments)
SmallEntity
(WithoutDefault
Judgments)
p-Value(Both
Chi-sq. &Fisher’sExact)
LargeEntity
(IncludingDefault
Judgments)
SmallEntity
(IncludingDefault
Judgments)
p-Value(Both
Chi-sq. &Fisher’sExact)
SettlementsIncluded inDenominator 6.50% 1.40% 0 7.20% 2.90% �0.01
SettlementsExcluded fromDenominator 53.10% 12.30% 0 55.90% 23.10% �0.01
690 [Vol. 99:677THE GEORGETOWN LAW JOURNAL
ments into the denominator naturally reduces the number of patentee wins butdoes not change the relationship: large entities win judgments in 6.5% of allcases in the combined data sets (7.2% if default judgments are included),compared to 1.4% of small entities (2.9% if default judgments are included).These differences are also highly significant.
In short, patents originally issued to large entities do substantially better inlitigation than those originally issued to small entities.
2. NPE Status
Because many patents are sold before being litigated,43 however, entity sizeis at best an indirect proxy for the nature of the current plaintiff.44 To get more
43. See, e.g., Moore, supra note 40 (finding that roughly half of patents enforced by corporationswere purchased before suit, generally from an individual).
44. It may, however, reflect differences in the prosecution of patents between large and smallentities.
Figure 1. Large & Small Entities’ Merits-Based Win Rates OnceSettlement Fails (Most- and Once-Litigated Patent Cases Combined)
2011] 691REPEAT PATENT LITIGANTS
directly at the question of whether different types of plaintiffs fare differently incourt, we characterized each of the patent owners into one of the twelveentity-status categories described above. For statistical analysis purposes, weaggregate the patents into practicing entities (Class 8) and NPEs (all otherclasses except Class 10).
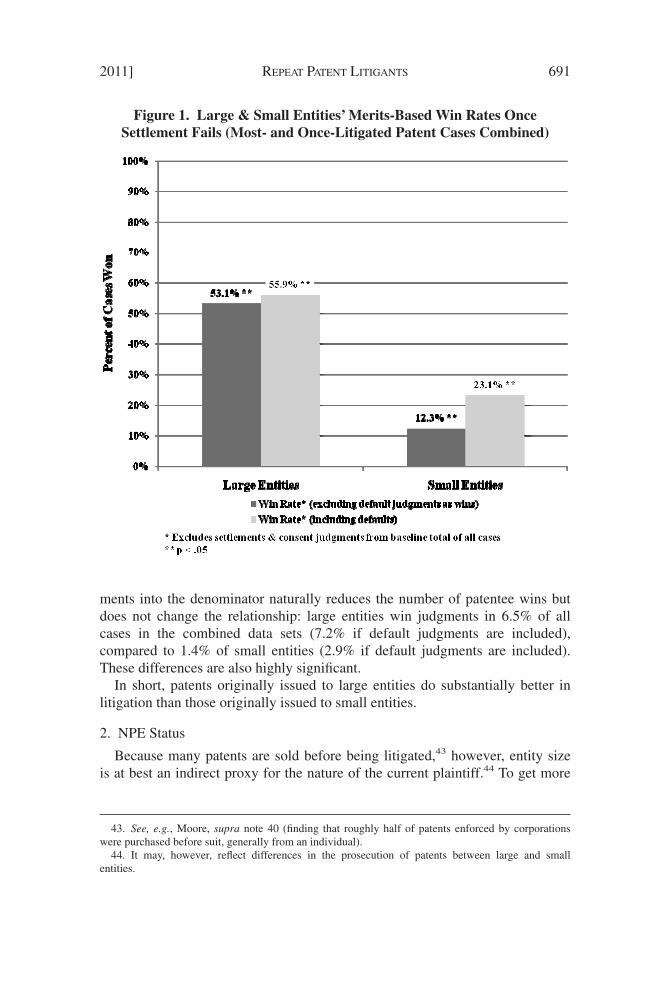
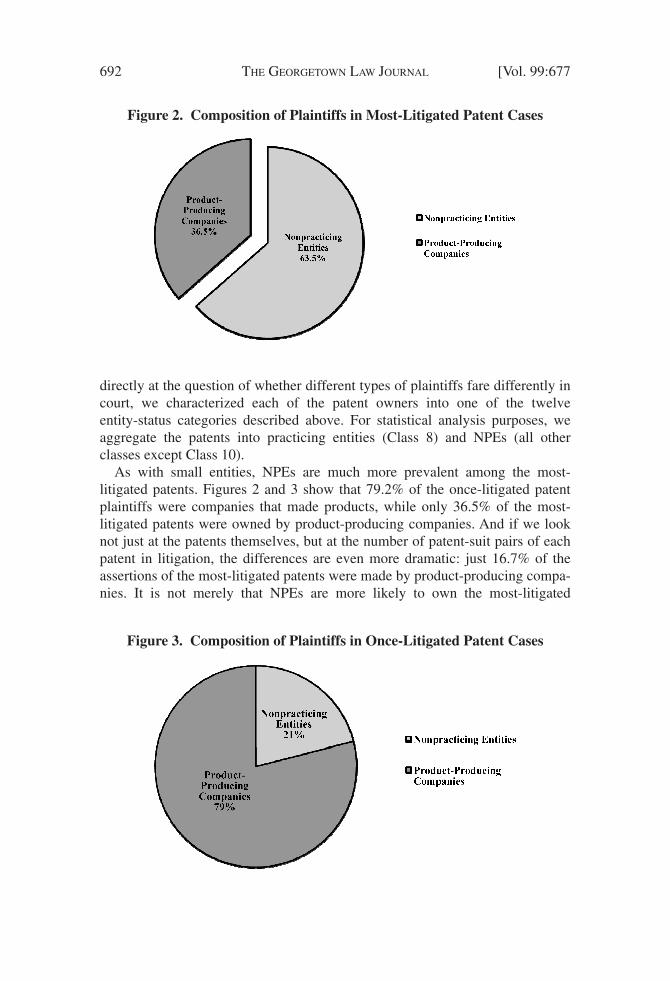
As with small entities, NPEs are much more prevalent among the most-litigated patents. Figures 2 and 3 show that 79.2% of the once-litigated patentplaintiffs were companies that made products, while only 36.5% of the most-litigated patents were owned by product-producing companies. And if we looknot just at the patents themselves, but at the number of patent-suit pairs of eachpatent in litigation, the differences are even more dramatic: just 16.7% of theassertions of the most-litigated patents were made by product-producing compa-nies. It is not merely that NPEs are more likely to own the most-litigated
Figure 2. Composition of Plaintiffs in Most-Litigated Patent Cases
Figure 3. Composition of Plaintiffs in Once-Litigated Patent Cases
692 [Vol. 99:677THE GEORGETOWN LAW JOURNAL

patents; they also file more lawsuits on those patents than their product-producing counterparts in the most-litigated set.
As for outcomes, the results, as seen in Table 8 and Figure 4, are dra-matic—no matter how the data are sliced, product-producing entities are far
Table 8. Product Company vs. NPE Win Rates Across Both Most- andOnce-Litigated Data Sets
ProductCompany(WithoutDefault
Judgments)
NPE(WithoutDefault
Judgments)
p-Value(Both
Chi-sq. &Fisher’sExact)
ProductCompany(Including
DefaultJudgments)
NPE(Including
DefaultJudgments)
p-Value(Both
Chi-sq. &Fisher’sExact)
SettlementsIncluded inDenominator 4.50% 0.80% 0 6.70% 1.00% 0
SettlementsExcluded fromDenominator 40.00% 8.00% 0 50.00% 9.20% 0
Figure 4. Plaintiffs’ Merits-Based Win Rates Once Settlement Fails(Most- and Once-Litigated Patent Cases Combined)
2011] 693REPEAT PATENT LITIGANTS
more likely to win their cases than NPEs.45
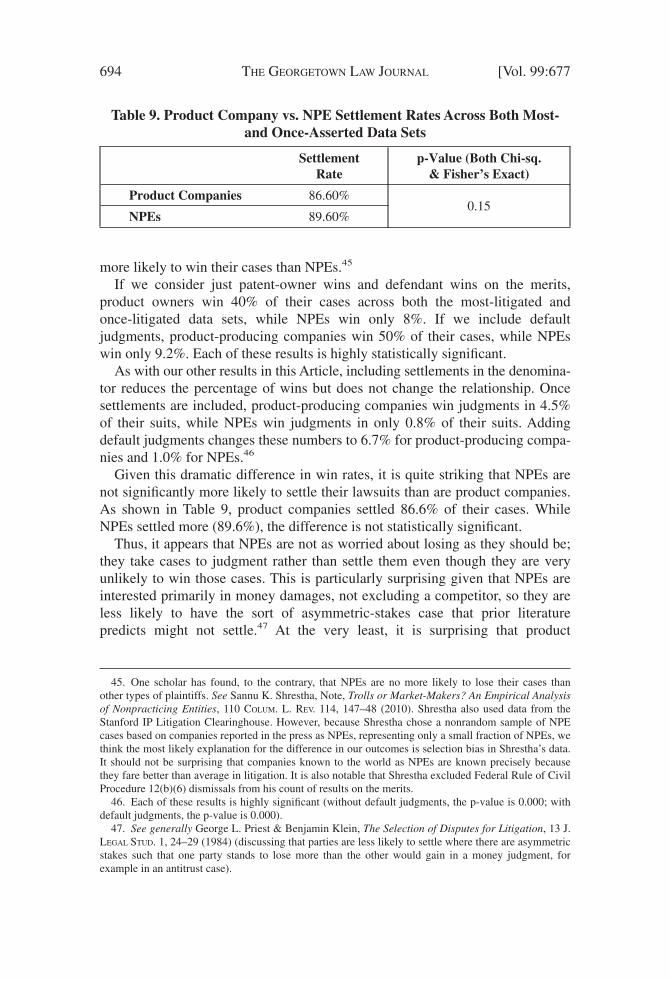
If we consider just patent-owner wins and defendant wins on the merits,product owners win 40% of their cases across both the most-litigated andonce-litigated data sets, while NPEs win only 8%. If we include defaultjudgments, product-producing companies win 50% of their cases, while NPEswin only 9.2%. Each of these results is highly statistically significant.
As with our other results in this Article, including settlements in the denomina-tor reduces the percentage of wins but does not change the relationship. Oncesettlements are included, product-producing companies win judgments in 4.5%of their suits, while NPEs win judgments in only 0.8% of their suits. Addingdefault judgments changes these numbers to 6.7% for product-producing compa-nies and 1.0% for NPEs.46
Given this dramatic difference in win rates, it is quite striking that NPEs arenot significantly more likely to settle their lawsuits than are product companies.As shown in Table 9, product companies settled 86.6% of their cases. WhileNPEs settled more (89.6%), the difference is not statistically significant.
Thus, it appears that NPEs are not as worried about losing as they should be;they take cases to judgment rather than settle them even though they are veryunlikely to win those cases. This is particularly surprising given that NPEs areinterested primarily in money damages, not excluding a competitor, so they areless likely to have the sort of asymmetric-stakes case that prior literaturepredicts might not settle.47 At the very least, it is surprising that product
45. One scholar has found, to the contrary, that NPEs are no more likely to lose their cases thanother types of plaintiffs. See Sannu K. Shrestha, Note, Trolls or Market-Makers? An Empirical Analysisof Nonpracticing Entities, 110 COLUM. L. REV. 114, 147–48 (2010). Shrestha also used data from theStanford IP Litigation Clearinghouse. However, because Shrestha chose a nonrandom sample of NPEcases based on companies reported in the press as NPEs, representing only a small fraction of NPEs, wethink the most likely explanation for the difference in our outcomes is selection bias in Shrestha’s data.It should not be surprising that companies known to the world as NPEs are known precisely becausethey fare better than average in litigation. It is also notable that Shrestha excluded Federal Rule of CivilProcedure 12(b)(6) dismissals from his count of results on the merits.
46. Each of these results is highly significant (without default judgments, the p-value is 0.000; withdefault judgments, the p-value is 0.000).
47. See generally George L. Priest & Benjamin Klein, The Selection of Disputes for Litigation, 13 J.LEGAL STUD. 1, 24–29 (1984) (discussing that parties are less likely to settle where there are asymmetricstakes such that one party stands to lose more than the other would gain in a money judgment, forexample in an antitrust case).
Table 9. Product Company vs. NPE Settlement Rates Across Both Most-and Once-Asserted Data Sets
SettlementRate
p-Value (Both Chi-sq.& Fisher’s Exact)
Product Companies 86.60%0.15
NPEs 89.60%
694 [Vol. 99:677THE GEORGETOWN LAW JOURNAL
companies and NPEs settle at the same rate given their very different win ratesin the cases that do not settle. We discuss some possible explanations for thatdivergence in section III.A.
C. INDUSTRY AND TECHNOLOGY DIFFERENCES
We also divided the data set by industry and technology. Small numbers oflitigated cases in many of the industry and technology categories in our data setsrequired us to make broader comparisons. Moreover, it is the patents coveringone type of invention—software—that are one of the most striking features ofour study. In our taxonomy, software is a technology that is part of the computerindustry. However, because far more observers are interested in the world ofsoftware patenting than of computer-industry patenting more generally, wereport here on differences between litigation involving software patents andlitigation involving all other types of patents.
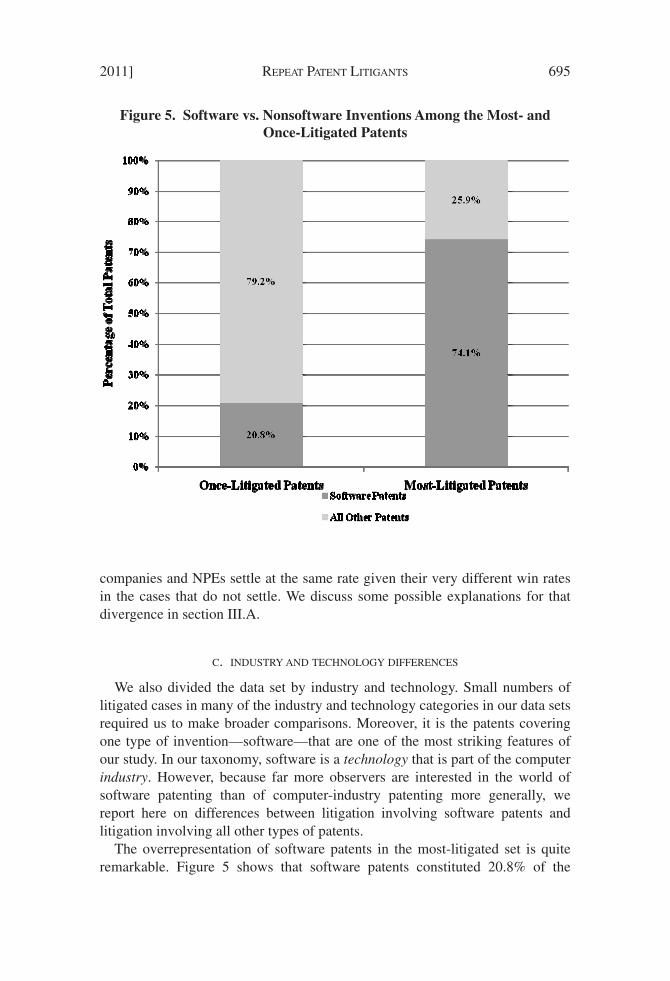
The overrepresentation of software patents in the most-litigated set is quiteremarkable. Figure 5 shows that software patents constituted 20.8% of the
Figure 5. Software vs. Nonsoftware Inventions Among the Most- andOnce-Litigated Patents
2011] 695REPEAT PATENT LITIGANTS
once-litigated patents but 74.1% of the most-litigated patents.48 And again,these differences are even more dramatic if we measure not patents, butpatent-suit pairs. Software patents accounted for 93.7% of the assertions of themost-litigated patents.
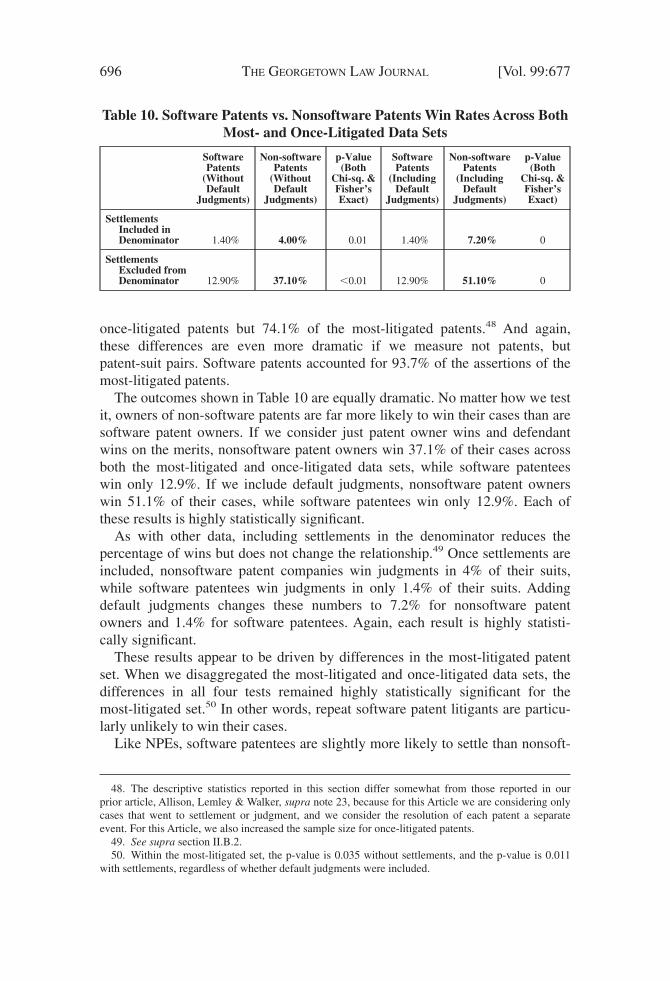
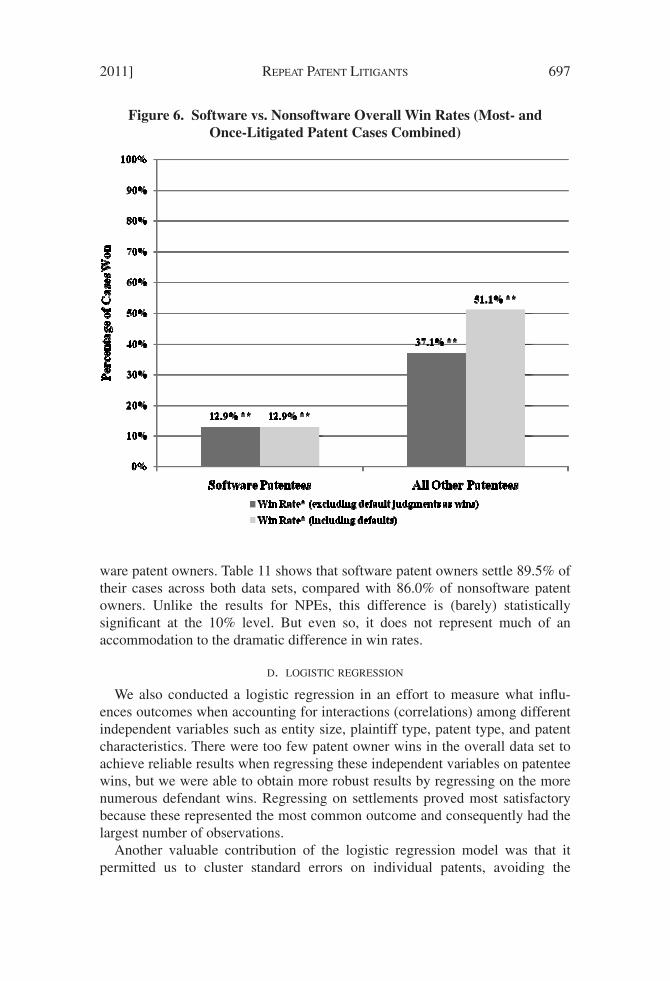
The outcomes shown in Table 10 are equally dramatic. No matter how we testit, owners of non-software patents are far more likely to win their cases than aresoftware patent owners. If we consider just patent owner wins and defendantwins on the merits, nonsoftware patent owners win 37.1% of their cases acrossboth the most-litigated and once-litigated data sets, while software patenteeswin only 12.9%. If we include default judgments, nonsoftware patent ownerswin 51.1% of their cases, while software patentees win only 12.9%. Each ofthese results is highly statistically significant.
As with other data, including settlements in the denominator reduces thepercentage of wins but does not change the relationship.49 Once settlements areincluded, nonsoftware patent companies win judgments in 4% of their suits,while software patentees win judgments in only 1.4% of their suits. Addingdefault judgments changes these numbers to 7.2% for nonsoftware patentowners and 1.4% for software patentees. Again, each result is highly statisti-cally significant.
These results appear to be driven by differences in the most-litigated patentset. When we disaggregated the most-litigated and once-litigated data sets, thedifferences in all four tests remained highly statistically significant for themost-litigated set.50 In other words, repeat software patent litigants are particu-larly unlikely to win their cases.
Like NPEs, software patentees are slightly more likely to settle than nonsoft-
48. The descriptive statistics reported in this section differ somewhat from those reported in ourprior article, Allison, Lemley & Walker, supra note 23, because for this Article we are considering onlycases that went to settlement or judgment, and we consider the resolution of each patent a separateevent. For this Article, we also increased the sample size for once-litigated patents.
49. See supra section II.B.2.50. Within the most-litigated set, the p-value is 0.035 without settlements, and the p-value is 0.011
with settlements, regardless of whether default judgments were included.
Table 10. Software Patents vs. Nonsoftware Patents Win Rates Across BothMost- and Once-Litigated Data Sets
SoftwarePatents
(WithoutDefault
Judgments)
Non-softwarePatents
(WithoutDefault
Judgments)
p-Value(Both
Chi-sq. &Fisher’sExact)
SoftwarePatents
(IncludingDefault
Judgments)
Non-softwarePatents
(IncludingDefault
Judgments)
p-Value(Both
Chi-sq. &Fisher’sExact)
SettlementsIncluded inDenominator 1.40% 4.00% 0.01 1.40% 7.20% 0
SettlementsExcluded fromDenominator 12.90% 37.10% �0.01 12.90% 51.10% 0
696 [Vol. 99:677THE GEORGETOWN LAW JOURNAL
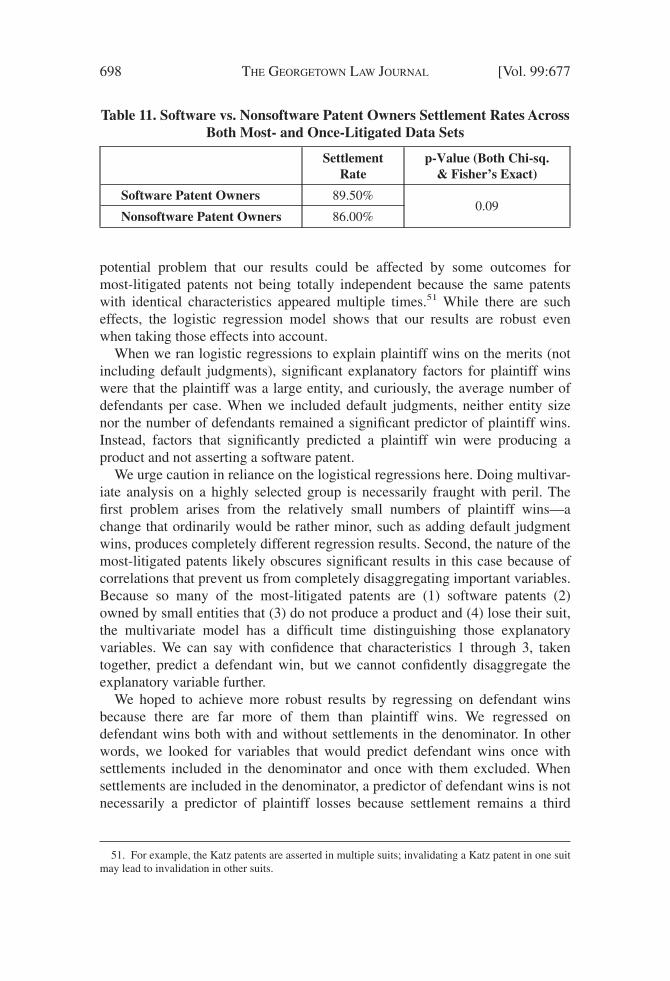
ware patent owners. Table 11 shows that software patent owners settle 89.5% oftheir cases across both data sets, compared with 86.0% of nonsoftware patentowners. Unlike the results for NPEs, this difference is (barely) statisticallysignificant at the 10% level. But even so, it does not represent much of anaccommodation to the dramatic difference in win rates.
D. LOGISTIC REGRESSION
We also conducted a logistic regression in an effort to measure what influ-ences outcomes when accounting for interactions (correlations) among differentindependent variables such as entity size, plaintiff type, patent type, and patentcharacteristics. There were too few patent owner wins in the overall data set toachieve reliable results when regressing these independent variables on patenteewins, but we were able to obtain more robust results by regressing on the morenumerous defendant wins. Regressing on settlements proved most satisfactorybecause these represented the most common outcome and consequently had thelargest number of observations.
Another valuable contribution of the logistic regression model was that itpermitted us to cluster standard errors on individual patents, avoiding the
Figure 6. Software vs. Nonsoftware Overall Win Rates (Most- andOnce-Litigated Patent Cases Combined)
2011] 697REPEAT PATENT LITIGANTS
potential problem that our results could be affected by some outcomes formost-litigated patents not being totally independent because the same patentswith identical characteristics appeared multiple times.51 While there are sucheffects, the logistic regression model shows that our results are robust evenwhen taking those effects into account.
When we ran logistic regressions to explain plaintiff wins on the merits (notincluding default judgments), significant explanatory factors for plaintiff winswere that the plaintiff was a large entity, and curiously, the average number ofdefendants per case. When we included default judgments, neither entity sizenor the number of defendants remained a significant predictor of plaintiff wins.Instead, factors that significantly predicted a plaintiff win were producing aproduct and not asserting a software patent.
We urge caution in reliance on the logistical regressions here. Doing multivar-iate analysis on a highly selected group is necessarily fraught with peril. Thefirst problem arises from the relatively small numbers of plaintiff wins—achange that ordinarily would be rather minor, such as adding default judgmentwins, produces completely different regression results. Second, the nature of themost-litigated patents likely obscures significant results in this case because ofcorrelations that prevent us from completely disaggregating important variables.Because so many of the most-litigated patents are (1) software patents (2)owned by small entities that (3) do not produce a product and (4) lose their suit,the multivariate model has a difficult time distinguishing those explanatoryvariables. We can say with confidence that characteristics 1 through 3, takentogether, predict a defendant win, but we cannot confidently disaggregate theexplanatory variable further.
We hoped to achieve more robust results by regressing on defendant winsbecause there are far more of them than plaintiff wins. We regressed ondefendant wins both with and without settlements in the denominator. In otherwords, we looked for variables that would predict defendant wins once withsettlements included in the denominator and once with them excluded. Whensettlements are included in the denominator, a predictor of defendant wins is notnecessarily a predictor of plaintiff losses because settlement remains a third
51. For example, the Katz patents are asserted in multiple suits; invalidating a Katz patent in one suitmay lead to invalidation in other suits.
Table 11. Software vs. Nonsoftware Patent Owners Settlement Rates AcrossBoth Most- and Once-Litigated Data Sets
SettlementRate
p-Value (Both Chi-sq.& Fisher’s Exact)
Software Patent Owners 89.50%0.09
Nonsoftware Patent Owners 86.00%
698 [Vol. 99:677THE GEORGETOWN LAW JOURNAL
alternative outcome. When settlements are excluded, however, there are onlytwo possible outcomes and a predictor of defendant wins is a predictor ofplaintiff losses. The results of doing this both ways are unfortunately notconsistent because the number of settlements overwhelms the numbers of bothplaintiff and defendant wins.52
With settlements included in the denominator, we found that the averagenumber of defendants per case was a significant predictor of defendant wins.That is, the more defendants there are, the more likely they are to win. Thisfinding is seemingly inconsistent with what we found when regressing onplaintiff wins without default judgments, where the number of defendants was asignificant predictor of plaintiff wins. In fact, however, the two results can bereconciled: an increase in the number of defendants per case reduces the chanceof settlement, making both plaintiff and (especially) defendant wins more likely.We say more about this in section III.A.1.
When we then regress on defendant wins with settlements excluded from thedenominator, we get cleaner results because there are only two possible out-comes. Here, we find that the assertion of a software patent is a very significantpredictor of defendant wins, and thus, of plaintiff losses—yet further confirma-tion of how poorly software patents fared when going to judgment across bothdata sets. We also find that when the plaintiff asserts a patent originally issued toa large entity, defendants are more likely to lose—large-entity status is asignificant predictor of plaintiff wins.
Our final set of regressions seeks predictors of settlement. The number ofdefendants per case is a negative predictor of settlement. That is, the moredefendants there are per case, the less likely the case is to settle. Recall, as well,that we have some evidence from the win-rate regressions that, if the case doesnot settle but instead goes to judgment, the more defendants there are per casethe more likely those defendants are to win. And, because of the much largernumber of observations, the result from this regression is almost certainly moretrustworthy than the inconsistent finding when plaintiff wins (without defaultjudgments) was the dependent variable. Such evidence may speak against thestrategy of suing many defendants in the same case because it is more difficultto settle with those defendants, and if the patent owner does not settle, thosedefendants are more likely to win.53
52. We did consider employing multinomial regression with three dependent variables—plaintiffwin, defendant win, and settlement—instead of a logistic regression. Because of the nature of our dataand the small numbers of plaintiff wins, however, we would not have achieved results that were anymore satisfactory.
53. Remember, though, that because settlements are in the denominator, the fact that defendants aremore likely to win when there are more of them per case does not necessarily mean that plaintiffs aremore likely to lose. When we regressed directly on plaintiff wins, the number of defendants in a casewas also a significant predictor of plaintiff wins.
2011] 699REPEAT PATENT LITIGANTS

III. EXPLANATIONS AND IMPLICATIONS
What explains these surprising results? In this Part, we explore some possiblereasons why the most-litigated patents turn out to be weaker than other-litigatedpatents, as well as some reasons why the owners of those patents nonethelessseem willing to let the cases go to judgment more often than they should—theydo settle more, just not nearly often enough.
A. OTHER EXPLANATIONS FOR SETTLEMENT DATA
As we found in the previous Part, our hypothesis that the patentees who filethe most suits will be more likely to settle is borne out, but to a surprisinglymodest extent. In this section, we explore some other factors that mightcomplicate the hypothesized relationship between repeat play and settlement.
1. Number of Defendants
One possible explanation is that the settlement results are being driven bydefendants rather than plaintiffs in the most-litigated cases. The most-litigatedpatents are generally asserted against multiple defendants in each suit; perhapsthe presence of multiple defendants gives the patentee less control over settle-ment because even one obstinate defendant who refuses to settle (possibly in thehopes of building a reputation that will deter future plaintiffs) can force the caseto judgment. On this theory, the more defendants in a case, the more likely itshould be to go to judgment with respect to at least one of those defendants.
In the abstract, there are reasons to be skeptical of this “defendant control”theory. To begin, the economic literature suggests the opposite—that invalida-tion of a patent is a public good because the defendant that takes a case all theway to judgment shoulders all the risk of losing the case, but must share thebenefit of invalidating the patent with all of its competitors.54 Thus, if anything,we should expect that defendants in multiparty patent cases should be morelikely to settle out and leave their competitors holding the bag, particularlybecause while defendants can share information, they cannot act jointly indeciding to settle.55 Similarly, because the patentee faces the risk of losing thepatent itself if the case does not settle, it is reasonable to expect that the patenteewill often be willing to accept a lower payment in settlement from eachindividual defendant. This is particularly true if the defendant has discovered astrong argument against the patent, such as a killer piece of prior art. When that
54. Joseph Farrell & Robert P. Merges, Incentives to Challenge and Defend Patents: Why LitigationWon’t Reliably Fix Patent Office Errors and Why Administrative Patent Review Might Help, 19BERKELEY TECH. L.J. 943, 952 (2004); Joseph Scott Miller, Building a Better Bounty: Litigation-StageRewards for Defeating Patents, 19 BERKELEY TECH. L.J. 667, 679–80 (2004); Joseph Scott Miller, JointDefense or Research Joint Venture: Reassessing the Patent-Challenge Bloc’s Antitrust Status, 2011STAN. TECH. L. REV. (forthcoming), available at http://papers.ssrn.com/sol3/papers.cfm?abstract_id�1652188.
55. Jones Knitting Corp. v. Morgan, 361 F.2d 451, 459 (3d Cir. 1966) (sharing settlement authorityviolates the antitrust laws).
700 [Vol. 99:677THE GEORGETOWN LAW JOURNAL
happens, it is in the interest of both the plaintiff and the defendant to give thatparticular defendant a confidential “sweetheart” deal that keeps the argumentout of court and keeps the patent alive.56 Indeed, there is no reason the patenteein such a case could not simply drop one determined defendant from the suit,before or after settling with others.
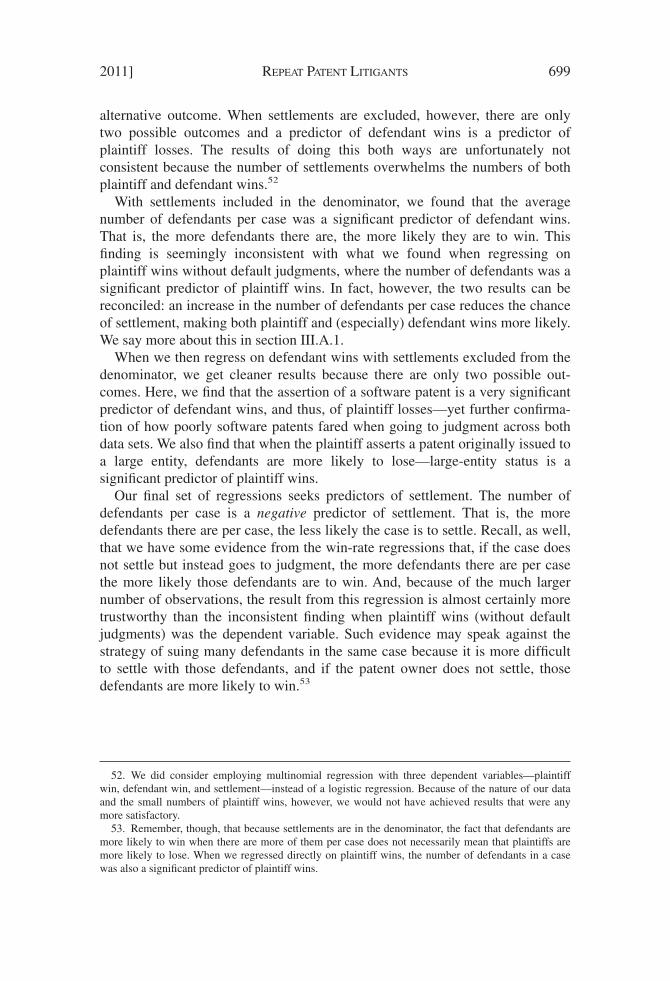
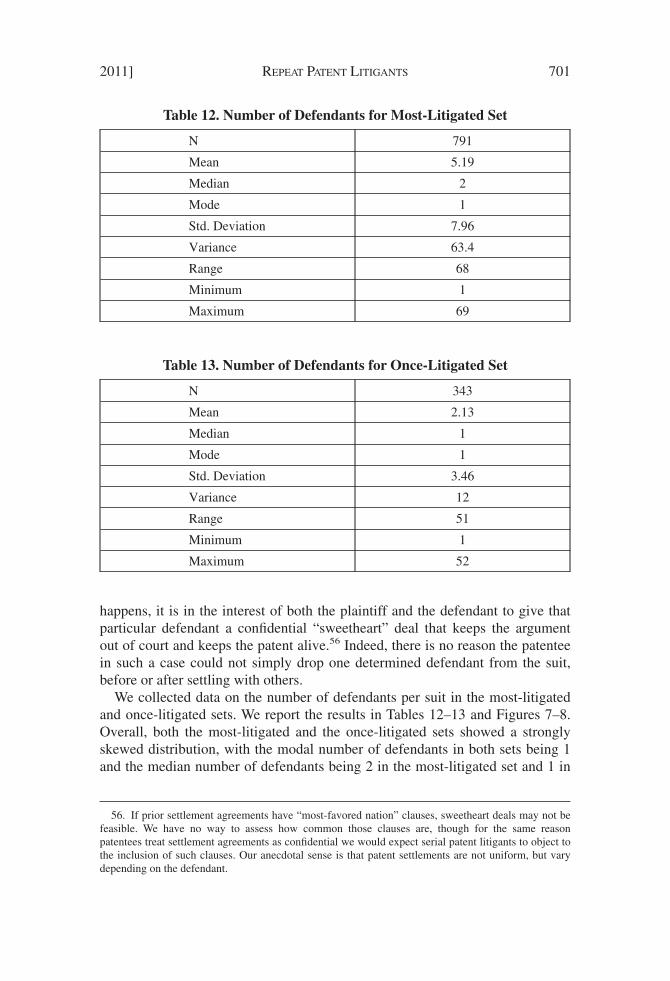
We collected data on the number of defendants per suit in the most-litigatedand once-litigated sets. We report the results in Tables 12–13 and Figures 7–8.Overall, both the most-litigated and the once-litigated sets showed a stronglyskewed distribution, with the modal number of defendants in both sets being 1and the median number of defendants being 2 in the most-litigated set and 1 in
56. If prior settlement agreements have “most-favored nation” clauses, sweetheart deals may not befeasible. We have no way to assess how common those clauses are, though for the same reasonpatentees treat settlement agreements as confidential we would expect serial patent litigants to object tothe inclusion of such clauses. Our anecdotal sense is that patent settlements are not uniform, but varydepending on the defendant.
Table 12. Number of Defendants for Most-Litigated Set
N 791
Mean 5.19
Median 2
Mode 1
Std. Deviation 7.96
Variance 63.4
Range 68
Minimum 1
Maximum 69
Table 13. Number of Defendants for Once-Litigated Set
N 343
Mean 2.13
Median 1
Mode 1
Std. Deviation 3.46
Variance 12
Range 51
Minimum 1
Maximum 52
2011] 701REPEAT PATENT LITIGANTS
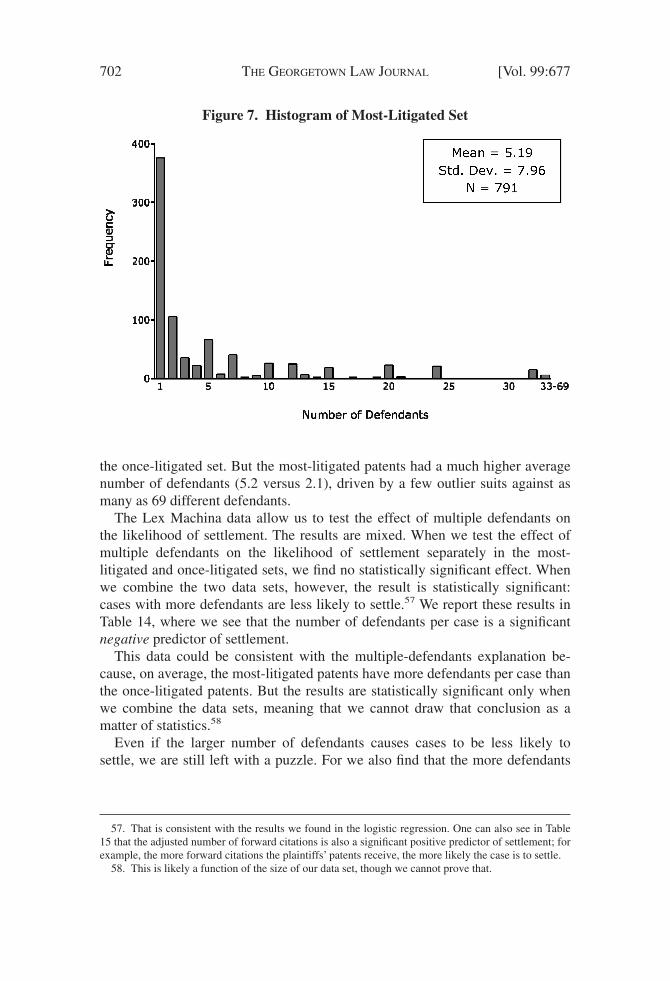
the once-litigated set. But the most-litigated patents had a much higher averagenumber of defendants (5.2 versus 2.1), driven by a few outlier suits against asmany as 69 different defendants.
The Lex Machina data allow us to test the effect of multiple defendants onthe likelihood of settlement. The results are mixed. When we test the effect ofmultiple defendants on the likelihood of settlement separately in the most-litigated and once-litigated sets, we find no statistically significant effect. Whenwe combine the two data sets, however, the result is statistically significant:cases with more defendants are less likely to settle.57 We report these results inTable 14, where we see that the number of defendants per case is a significantnegative predictor of settlement.
This data could be consistent with the multiple-defendants explanation be-cause, on average, the most-litigated patents have more defendants per case thanthe once-litigated patents. But the results are statistically significant only whenwe combine the data sets, meaning that we cannot draw that conclusion as amatter of statistics.58
Even if the larger number of defendants causes cases to be less likely tosettle, we are still left with a puzzle. For we also find that the more defendants
57. That is consistent with the results we found in the logistic regression. One can also see in Table15 that the adjusted number of forward citations is also a significant positive predictor of settlement; forexample, the more forward citations the plaintiffs’ patents receive, the more likely the case is to settle.
58. This is likely a function of the size of our data set, though we cannot prove that.
Figure 7. Histogram of Most-Litigated Set
702 [Vol. 99:677THE GEORGETOWN LAW JOURNAL
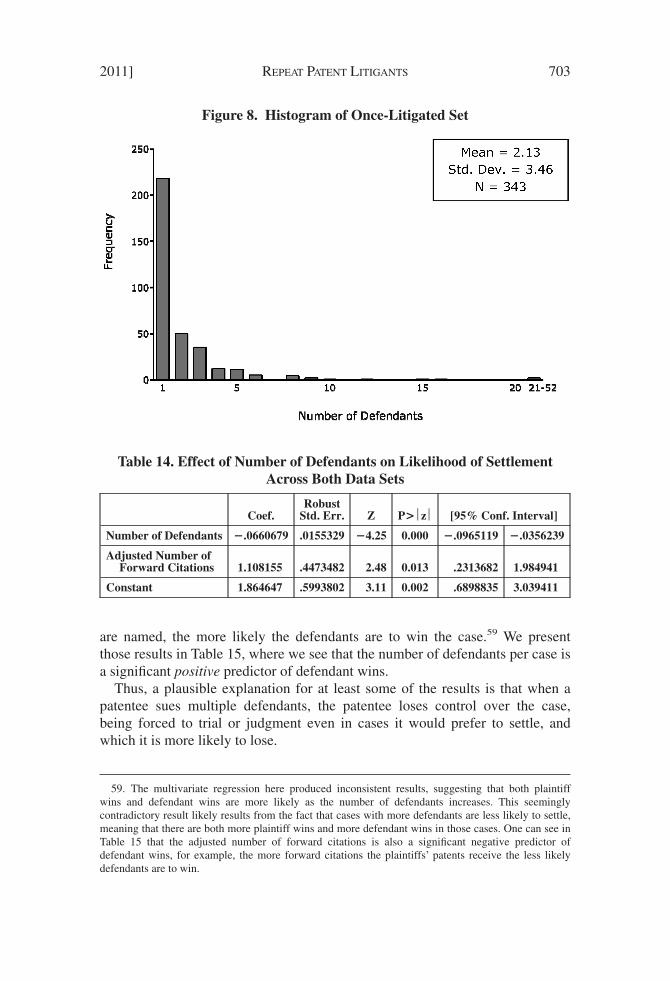
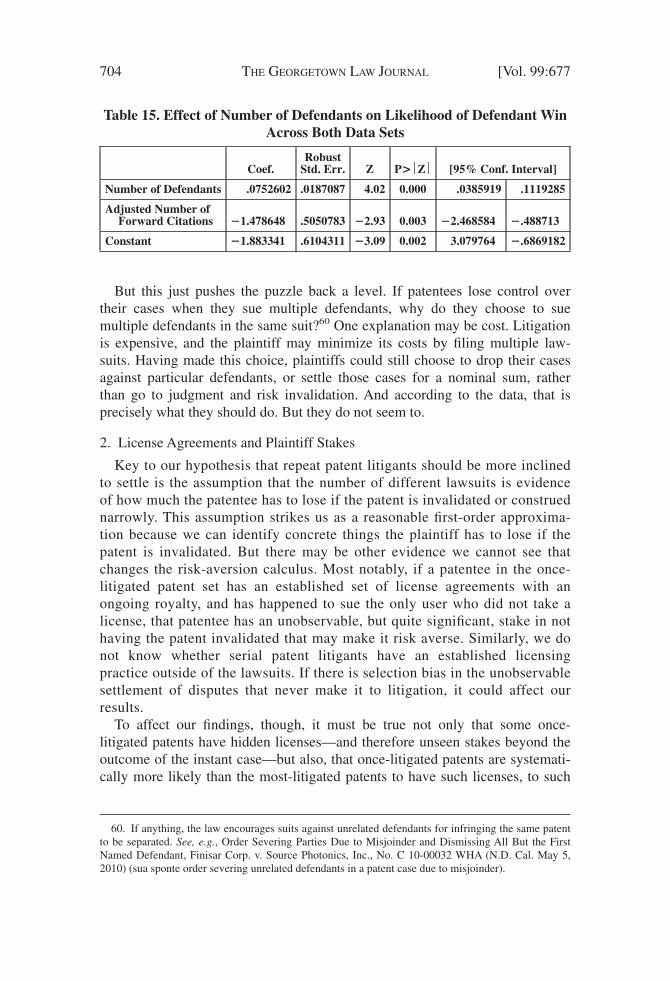
are named, the more likely the defendants are to win the case.59 We presentthose results in Table 15, where we see that the number of defendants per case isa significant positive predictor of defendant wins.
Thus, a plausible explanation for at least some of the results is that when apatentee sues multiple defendants, the patentee loses control over the case,being forced to trial or judgment even in cases it would prefer to settle, andwhich it is more likely to lose.
59. The multivariate regression here produced inconsistent results, suggesting that both plaintiffwins and defendant wins are more likely as the number of defendants increases. This seeminglycontradictory result likely results from the fact that cases with more defendants are less likely to settle,meaning that there are both more plaintiff wins and more defendant wins in those cases. One can see inTable 15 that the adjusted number of forward citations is also a significant negative predictor ofdefendant wins, for example, the more forward citations the plaintiffs’ patents receive the less likelydefendants are to win.
Table 14. Effect of Number of Defendants on Likelihood of SettlementAcross Both Data Sets
Coef.Robust
Std. Err. Z P>z [95% Conf. Interval]
Number of Defendants �.0660679 .0155329 �4.25 0.000 �.0965119 �.0356239
Adjusted Number ofForward Citations 1.108155 .4473482 2.48 0.013 .2313682 1.984941
Constant 1.864647 .5993802 3.11 0.002 .6898835 3.039411
Figure 8. Histogram of Once-Litigated Set
2011] 703REPEAT PATENT LITIGANTS
But this just pushes the puzzle back a level. If patentees lose control overtheir cases when they sue multiple defendants, why do they choose to suemultiple defendants in the same suit?60 One explanation may be cost. Litigationis expensive, and the plaintiff may minimize its costs by filing multiple law-suits. Having made this choice, plaintiffs could still choose to drop their casesagainst particular defendants, or settle those cases for a nominal sum, ratherthan go to judgment and risk invalidation. And according to the data, that isprecisely what they should do. But they do not seem to.
2. License Agreements and Plaintiff Stakes
Key to our hypothesis that repeat patent litigants should be more inclinedto settle is the assumption that the number of different lawsuits is evidenceof how much the patentee has to lose if the patent is invalidated or construednarrowly. This assumption strikes us as a reasonable first-order approxima-tion because we can identify concrete things the plaintiff has to lose if thepatent is invalidated. But there may be other evidence we cannot see thatchanges the risk-aversion calculus. Most notably, if a patentee in the once-litigated patent set has an established set of license agreements with anongoing royalty, and has happened to sue the only user who did not take alicense, that patentee has an unobservable, but quite significant, stake in nothaving the patent invalidated that may make it risk averse. Similarly, we donot know whether serial patent litigants have an established licensingpractice outside of the lawsuits. If there is selection bias in the unobservablesettlement of disputes that never make it to litigation, it could affect ourresults.
To affect our findings, though, it must be true not only that some once-litigated patents have hidden licenses—and therefore unseen stakes beyond theoutcome of the instant case—but also, that once-litigated patents are systemati-cally more likely than the most-litigated patents to have such licenses, to such
60. If anything, the law encourages suits against unrelated defendants for infringing the same patentto be separated. See, e.g., Order Severing Parties Due to Misjoinder and Dismissing All But the FirstNamed Defendant, Finisar Corp. v. Source Photonics, Inc., No. C 10-00032 WHA (N.D. Cal. May 5,2010) (sua sponte order severing unrelated defendants in a patent case due to misjoinder).
Table 15. Effect of Number of Defendants on Likelihood of Defendant WinAcross Both Data Sets
Coef.Robust
Std. Err. Z P>Z [95% Conf. Interval]
Number of Defendants .0752602 .0187087 4.02 0.000 .0385919 .1119285
Adjusted Number ofForward Citations �1.478648 .5050783 �2.93 0.003 �2.468584 �.488713
Constant �1.883341 .6104311 �3.09 0.002 3.079764 �.6869182
704 [Vol. 99:677THE GEORGETOWN LAW JOURNAL
an extent that those hidden licenses swamp the effect a loss would have on thepending suits of the most-litigious patentees. We can think of no way to test thiswith available information; licensing agreements outside of litigation are almostalways confidential.61 But one plausible reason that it might be true lies in thereality that the patentee filed so many suits. Although the difference betweenfiling one suit and multiple suits may reflect the value of the patent, thenecessity of using the patent, or the number of competitors, it might also reflectthe willingness of companies to license the patent from the plaintiff. If twocompanies, each with twenty infringers, send license demands to all twentycompanies, the company that gets paid without litigation will file relatively fewlawsuits, whereas the company whose license efforts are rebuffed will have tofile more lawsuits if it hopes to collect revenue.62
A second possible explanation has to do with the dependence of plaintiffstakes on the structure of the licenses entered into. If the parties enter into aroyalty-bearing license, the obligation of the licensee to pay royalties ends whenthe patent is held invalid.63 By contrast, if a company pays a lump sum tolicense a patent, it is far from clear that it can get that money back merelybecause the patent is later held invalid.64 And while the confidentiality of thedata prevents a rigorous analysis, our experience has been that settlements ofpatent lawsuits more commonly involve lump-sum payments rather than ongo-ing royalties. As a result, a serial patent plaintiff that has settled a number of itscases may feel more comfortable litigating the rest because it probably will notbe forced to give the money back even if it loses.
We emphasize that we cannot test any of this empirically. It is all speculation.But it does serve to point out that the relationship between patterns of litigationand party stakes is more complex than we might at first assume.
B. WEAK LITIGATED PATENTS
More surprising to us is the finding that the most-litigated patents that domake it to judgment fare so poorly. Are there structural reasons to think themost-litigated patents are likely to be weaker and, therefore, most likely to berejected? And if so, what does this say about the evidence economists use toassess the value of patents?
61. But see Mark A. Lemley & Nathan Myhrvold, How To Make a Patent Market, 36 HOFSTRA L.REV. 257 (2008) (arguing that licensing agreements outside of litigation should not be confidential).
62. Strictly speaking, that company will merely have to sue more defendants; it could sue them all inthe same case. But our data suggest that those who sue multiple defendants also tend to file multiplelawsuits. The plaintiffs who filed the most lawsuits also sued more defendants per case on average—5.2defendants compared with 2.1 in the once-litigated set.
63. See Lear, Inc. v. Adkins, 395 U.S. 653, 673–74 (1969).64. See, e.g., Studiengesellschaft Kohle v. Shell Oil Co., 112 F.3d 1561, 1568 (Fed. Cir. 1997) (pre-
MedImmune, concluding that a licensee could not recover royalties paid before a patent challenge); MedIm-mune Inc. v. Genentech Inc., 535 F. Supp. 2d 1000, 1016 (C.D. Cal. 2008) (noting, but not resolving, the issue).As a result, lawyers and scholars have argued that patent owners should license for lump sums rather thanongoing royalties whenever possible. See Michael Risch, supra note 10, at 1017–18.
2011] 705REPEAT PATENT LITIGANTS
1. Multiple Lawsuits As Evidence of Obviousness?
The most-litigated patents are enforced against a wide array of compa-nies—an average of 5.2 defendants per suit per patent, with some patentsinvolved in as many as ninety-seven different suits. Although in theory thatcould result from a pattern of widespread copying of a particular technology,other work suggests that patent plaintiffs are overwhelmingly suing independentdevelopers, not those they accuse of copying their ideas.65 Thus, one reasonableinference from the filing of multiple lawsuits against multiple defendants is thatthe technology in question is one that was widely adopted by an industry as aresult of widespread, near-simultaneous invention.
Near-simultaneous invention is sometimes used as evidence that an inventionis obvious.66 After all, if most of the companies interested in a particular fieldindependently develop the same technology at about the same time, that ispretty good evidence that the technology was within the capability of one ofordinary skill in the art. So one hypothesis is that the enforcement of a patentagainst an entire industry is evidence of simultaneous invention, and therefore,of obviousness.
We do not believe this can explain our results, however. First, we discoveredin our prior article that the most-litigated patents result from long chains ofcontinuation applications—more than four applications on average67—and, there-fore, were based on applications filed well before the lawsuits.68 As a result, thepatents in our study were more likely than average to have been invented longbefore the rest of the industry adopted the technology. Second, and moreimportant, the patentee losses in the most-litigated patents data set were over-whelmingly not based on findings of obviousness. They are split betweenfindings of invalidity, noninfringement, and unenforceability; those based oninvalidity are more likely to be findings of on-sale bar or inadequate writtendescription than findings of obviousness. Although there are more findings ofinvalidity than noninfringement (sixty of the eighty-six cases in the most-litigated set involved findings of invalidity, forty-four involved findings ofnoninfringement, and three involved findings of unenforceability), the mostcommon grounds for invalidation of the most-litigated patents were written
65. Christopher A. Cotropia & Mark A. Lemley, Copying in Patent Law, 87 N.C. L. REV. 1421, 1459(2009). This is particularly true in the information technology industries in which the vast majority ofthe most-litigated patents exist.
66. Hybritech, Inc. v. Monoclonal Antibodies, Inc., 802 F.2d 1367, 1380 n.4 (Fed. Cir. 1986) (notingthe use of this factor, but not applying it in the case at hand). For discussion of secondary consider-ations of non-obviousness, see Rochelle Cooper Dreyfuss, The Federal Circuit: A Case Study inSpecialized Courts, 64 N.Y.U. L. REV. 1, 9–10 (1989), and Robert P. Merges, Commercial Success andPatent Standards: Economic Perspectives on Innovation, 76 CALIF. L. REV. 803, 816 (1988). For anargument that simultaneous invention should be used more often, see Mark A. Lemley, Should PatentInfringement Require Proof of Copying?, 105 MICH. L. REV. 1525, 1534–35 (2007).
67. Allison, Lemley & Walker, supra note 23, at 28.68. Cf. Allison & Lemley, supra note 1, at 237 (finding that even the average-litigated patent spent
12.3 years from filing of the application to resolution of the case).
706 [Vol. 99:677THE GEORGETOWN LAW JOURNAL
description, anticipation, and on-sale bar.69
2. Overclaiming?
Because serial patent litigants have sued so many defendants, it mightsuggest that they are overclaiming. Perhaps what distinguishes these cases fromthe once-litigated cases is that the patentees have either obtained a patent that istoo broad or that they are overreading the claims they received. If so, the patentin question would be more likely to be found either invalid (in the first case) ornot infringed (in the second). The fact that the patentees in this data set filed somany continuation applications may also support the overclaiming hypothesisbecause one use of continuation applications is to change patent claims overtime to cover technologies developed after the original application was filed.70
Doing so does not necessarily violate the patent laws, but it is far more likely toinvolve overclaiming because the patentee is attempting to extend the claims tosomething it did not have in mind when it filed its original patent application.
It is hard to know whether the patentees in these cases are more likely thanothers to involve overclaiming, though the explanation is plausible.71 To mea-sure overclaiming, we would need to know what the “right” scope of the patentwas in a Platonic sense, as well as whether the court was right to find the patentinvalid or not infringed.72
3. Are Software Patents or Trolls the Problem?
One of the most striking findings is the weakness of software and NPE-owned patents in the overall data set. Given the enormous percentage of thecases we review that involve software patents, especially in the most-litigatedset, it seems likely that software patents are dragging down the averages. Afterall, 134 of the 421 patents we evaluate in both data sets, or 31.8%, involvesoftware. There have been numerous complaints about the quality of software
69. These numbers add up to more than eighty-six cases because in many cases the court ruled onmore than one ground.
70. See, e.g., Mark A. Lemley & Kimberly A. Moore, Ending Abuse of Patent Continuations, 84B.U. L. REV. 63, 107 (2004) (“One of the most egregious abuses of continuation applications describedabove is the use of the process to change patent claims to track inventions first made by one of theapplicant’s competitors.”).
71. See Ronald J. Mann & Marian Underweiser, A New Look at Patent Quality: Relating PatentProsecution to Validity 8 (Columbia Law & Econ. Working Paper No. 381, 2010), available athttp://ssrn.com/abstract�1671784 (finding that patents with more claims are more likely to be invali-dated, and suggesting that the owners of those patents may be more likely to overclaim them). Mannand Underweiser also find that filing continuation applications is negatively correlated with validity. Id.at 18.
72. We cannot distinguish overclaiming from other explanations based on the reason the patent wasrejected because an overbroad claim may be invalid either under 35 U.S.C. § 112 for lack of descriptionor enablement or under 35 U.S.C. §§ 102 and 103 because it is written so broadly as to encompass theprior art.
2011] 707REPEAT PATENT LITIGANTS
patents; our data may give some empirical support to those assertions.73 If weconsider just patent-owner wins and defendant wins on the merits, nonsoftwarepatent owners win 37.1% of their cases across both the most-litigated andonce-litigated data sets, whereas software patentees win only 12.9%. If weinclude default judgments, nonsoftware patent owners win 51.1% of their cases,whereas software patentees win only 12.9%.74
Something similar can be said about suits brought by NPEs. NPE suits, likesoftware suits, constitute a large percentage of the most-litigated cases; theyrepresent 730 of the 1134 cases in our combined data set, or 64.3%. If weconsider just patent-owner wins and defendant wins on the merits, productowners win 40% of their cases across both the most-litigated and once-litigateddata sets, while NPEs win only 8%. If we include default judgments, product-producing companies win 50% of their cases, whereas NPEs win only 9.2%.75
The authors have elsewhere expressed skepticism over efforts to eliminateparticular types of patents,76 and one has argued that we should not single outpatent trolls for special treatment.77 But it is important to recognize thatsoftware patents and patents asserted by NPEs are both taking disproportionateresources in patent litigation and that the social benefit from those cases appearsto be slight.
It is less clear what conclusions we should draw from this fact. Perhapsjudges (and juries, though most of the outcomes were the result of judicialdecisions) simply do not like either NPEs or software patents. After all, bothhave been subject to substantial criticism by both legal scholars and the popularpress.78 Our results could accordingly be evidence of antisoftware or anti-NPE
73. See, e.g., Julie E. Cohen, Reverse Engineering and the Rise of Electronic Vigilantism: Intellec-tual Property Implications of “Lock-Out” Programs, 68 S. CAL. L. REV. 1091, 1177–80 (1995); Peter S.Menell, A Method for Reforming the Patent System, 13 MICH. TELECOMM. & TECH. L. REV. 487, 506(2007); Pamela Samuelson et al., A Manifesto Concerning the Legal Protection of Computer Programs,94 COLUM. L. REV. 2308, 2425 (1994).
74. Each of these results is highly significant.75. Each of these results is highly significant.76. See, e.g., John R. Allison & Starling D. Hunter, On the Feasibility of Improving Patent Quality
One Technology at a Time: The Case of Business Methods, 21 BERKELEY TECH. L.J. 729, 789 (2006);John R. Allison & Ronald J. Mann, The Disputed Quality of Software Patents, 85 WASH. U. L. REV.297, 334 (2007).
77. Mark A. Lemley, Are Universities Patent Trolls?, 18 FORDHAM INTELL. PROP. MEDIA & ENT. L.J.611, 630 (2008).
78. On patent trolls, see, for example, Robin M. Davis, Note, Failed Attempts To Dwarf the PatentTrolls: Permanent Injunctions in Patent Infringement Cases Under the Proposed Patent Reform Act of2005 and eBay v. MercExchange, 17 CORNELL J.L. & PUB. POL’Y 431, 438 (2008) (“Most patent trollingbehavior thrives on the inequities of enforcing patent rights without contributing anything to either theinvention or production of new technologies.”), Jason Kirby, Patent Troll or Producer?, NAT’L POST
(Toronto), Jan. 14, 2006, available at http:// www.financialpost.com/story.html?id�1509d361-0144-4432-b6dc-2c14026c98d6 (“Companies who do the costly grunt work of actually developing and marketingnew technologies are being held ransom by tiny outfits whose only assets are ‘kooky and vague’patents . . . .”), and Joe Beyers, Rise of the Patent Trolls, CNET NEWS, (Oct. 12, 2005, 4:00 AM), http://news.cnet.com/Rise-of-the-patent-trolls/2010-1071_3-5892996.html.
On software patents, see, for example, JAMES BESSEN & MICHAEL MEURER, PATENT FAILURE: HOW
708 [Vol. 99:677THE GEORGETOWN LAW JOURNAL
“bias.” There is no way to tell whether the rejection of particular NPE andsoftware patents is right or wrong without having some Platonic insight into the“true” validity and scope of each patent. But even if we think that courts arewrong to invalidate these patents or limit their scope, they are neverthelessdoing so. Society is spending a large chunk of its patent law resources dealingwith what are—for whatever reason—the weakest cases. And patent plaintiffsare pursuing those cases despite the overwhelming odds against them.79
What might this mean for patent reform? On the one hand, it should givesubstantial ammunition to those who argue against software patents and whowant to restrain patent trolls. If software and NPE patents are overwhelminglybad—either invalid or overclaimed—the social benefit of allowing them maywell be outweighed by the harm they cause. At the same time, however, onecould read this evidence as proof that the system is working—the bad patentsare being weeded out of the system and are not stifling innovation.
The truth probably lies somewhere in between. The latter claim—that thewidespread invalidation of software and NPE-owned patents shows that thesystem is working—seems altogether too facile. After all, roughly 90% of thosecases settled without judgment. Although those settlements are confidential, weexpect that the vast majority involved some sort of payment to the patentplaintiff—a payment that the outcomes data suggests might represent not theacquisition of real legal rights but a nuisance settlement over a likely invalidpatent. At the same time, that these patents are so weak should—at least onceexposed—limit the value of those settlements and quiet concerns that softwareor troll patentees will actually shut down many innovative products.
C. OUTLIERS: CRAZY LIKE A FOX?
Finally, it is worth noting that, by definition, our study is a study of outliers.Ronald Katz is obviously an outlier, having filed a sizeable percentage of thepatent lawsuits in the last decade against hundreds of defendants.80 But in somesense, anyone in the most-litigated patent set is an outlier simply by virtue ofbeing willing to sue multiple times in different courts over the same patent. Itmay be that outliers are either irrational or simply have motivations that are notshared by the majority of patent owners. That is a possible explanation both fortheir unwillingness to settle and perhaps for their willingness to pursue losing
JUDGES, BUREAUCRATS, AND LAWYERS PUT INNOVATORS AT RISK 194–98 (2008), and Jacqueline Lipton, IP’sProblem Child: Shifting the Paradigms for Software Protection, 58 HASTINGS L.J. 205, 208 (2006). Butcf. Stuart J.H. Graham & David C. Mowery, Software Patents: Good News or Bad News?, inINTELLECTUAL PROPERTY RIGHTS IN FRONTIER INDUSTRIES: SOFTWARE AND BIOTECHNOLOGY 45, 73 (Robert W.Hahn ed., 2005) (evaluating claims that software patents are bad for innovation).
79. The same may be true of other types of lawsuits. Antitrust suits, for instance, continue to bebrought despite their low win rate. A more general explanation for that phenomenon is outside thescope of this Article.
80. Although Katz has an outsized effect on the most-litigated patents, it is worth noting that evenwhen we exclude Katz patents from the results, as we do with entity size, we still find dramatic differencesbetween the most-litigated and the once-litigated patents. See supra note 41 and accompanying text.
2011] 709REPEAT PATENT LITIGANTS
cases to judgment. And it may be particularly true of the NPEs that dominatethe most-litigated data set, because their motivations are likely to differ system-atically from those of product-producing companies.
Alternatively, the patents (rather than the patentees) may be outliers inanother sense—they might have so much potential value if enforceable that it isworth suing to enforce them even if the suit is unlikely to succeed. If the payofffor victory at the end of the day is $1 billion, a 10% chance of success does notsound so bad. On this theory, the most-litigated patents are lottery tickets thatrational plaintiffs use to take a chance at a big win. This theory is consistentwith most-litigated patents also being litigated against far more defendants; if anentire industry potentially infringes a patent, there may simply be more moneyat stake. And higher stakes may also explain why the settlement finding is not asstrong as we expected—the greater the stakes in a case, the less importantattorney’s fees are as an inducement to settle the case.81
We think there is something to both explanations, though, without data onhow much was paid to settle these cases, we cannot test them.82 But even if themost-litigated patents are outliers, that does not mean that they are irrelevant.They represent a substantial percentage of patent litigation, and—preciselybecause they appear willing to take to trial weak cases others might settle—theymay have an even larger influence on the law. Put another way, the Katzes ofthe world exist because we have structured our patent system in a way thatpermits them to exist. Katz may be an outlier, but he is not unique. Patentowners like this are a feature of the system. We should not ignore that reality inevaluating that system.83
D. DO WE UNDERSTAND PATENT VALUE?
Whatever the explanation for the poor performance of the most-litigatedpatents, such poor performance calls into question the evidence economistshave long relied upon to demonstrate patent value. The connection betweenpatent claims, forward citations, backward citations, and application family sizeon the one hand, and the value of patents on the other, is well-established in theeconomic literature and forms the basis for a great deal of economic analysisnot only of patents, but of innovation and growth more generally.84 Allison andMann have found software patents to be of above-average quality by traditional
81. Future research could investigate how the nature of the fee arrangement with the lawyer affectssettlement behavior.
82. We hope in the future to test whether parties enforcing their own patents fared better or worsethan parties enforcing patents they bought. The findings may shed some light on the irrational-behaviorstory.
83. We contemplated excluding Katz from our results. But we think doing so would paint anartificially rosy picture of the patent system.
84. See supra notes 15–20 (citing this literature). But cf. Bessen, supra note 15, at 932 (finding thatpatent citations are correlated with value, but explain little variance in value); Alfonso Gambardella etal., The Value of European Patents, 5 EUR. MGMT. REV. 69, 82 (2008) (finding a value linkage, butnoting that the data is noisy).
710 [Vol. 99:677THE GEORGETOWN LAW JOURNAL
economic measures.85 ALMT found in 2004 a very strong connection betweenthese measures of patent value and whether patents were litigated.86 And in ourprevious work, we found that that connection was even stronger for the most-litigated patents.87 Shrestha found that NPE patents had characteristics thatindicated that they were more valuable than other patents.88 And although wehave always emphasized that it is private, not social, value that is measured bythese statistics, we would have expected even that private value to be reflectedat the end of the day in litigation outcomes. That it is not—that the very patentsthat by every economic measure are the most valuable ones turn out to be muchweaker than other litigated patents—should give economists and other socialscientists significant pause in using those measures of value for other purposesas well. Perhaps there is a definition of value that is independent of whether ornot the patent is in fact valid and what it covers, but once we understand that theexisting measures of value do not correspond to “good” patents, we suspect thatdefinition will have to be very specialized. And in any event, the voluminousliterature that measures the value of patents based on these characteristics, andthe value of innovation based on the number of patents that have thosecharacteristics, stands on shakier ground than previously thought.
E. DO WE UNDERSTAND LITIGATION BEHAVIOR?
Finally, our results are a bit of a puzzle for the most common law andeconomics models of litigation. The Priest–Klein model suggests that litigationis about divergent expectations between the parties, and in the absence of asystemic asymmetry, plaintiff win rates in the cases that are selected for trialshould approach 50%.89 An asymmetric stakes theory would suggest thatplaintiffs have more to lose from going to trial than defendants, and so theplaintiff win rate should exceed 50% in the most-litigated cases.90 Our data donot support either theory; perhaps they represent yet another nail in the Priest–Klein coffin.91 But they do beg the question of what is motivating the parties inthese cases. Further work could investigate how the repeat-player status of bothpatentees and defendants affects settlements and outcomes.
85. Allison & Mann, supra note 76, at 333–34.86. ALMT, supra note 15, at 437.87. Allison, Lemley & Walker, supra note 23, at 3.88. Shrestha, supra note 45, at 145–46.89. Priest & Klein, supra note 47, at 17–24.90. See, e.g., Robert Cooter, Stephen Marks & Robert Mnookin, Bargaining in the Shadow of the
Law: A Testable Model of Strategic Behavior, 11 J. LEGAL STUD. 225 (1982) (discussing how asymmet-ric stakes might affect win rates). It is possible to read asymmetry the other way in certain respects. Forexample, before 2006 defendants faced an injunction if they lost, and the risk of that injunction mighthave been so catastrophic as to raise their stakes. But that should be equally true for the once- andmost-litigated patents; any defendant cares only about the threat a patent poses to him, and he will onlybe sued once on any given patent.
91. For other criticism of Priest–Klein, see, for example, Steven Shavell, Any Frequency of PlaintiffVictory at Trial Is Possible, 25 J. LEGAL STUD. 493, 493–94 (1996).
2011] 711REPEAT PATENT LITIGANTS
CONCLUSION
We designed this study to explore the effects of repeat play on litigationbehavior, contributing to a literature on the economics of civil procedure as wellas the substance of patent law. But what we found was dramatic and unex-pected: the patents and patentees that occupy the most time and attention incourt and in public policy debates—the very patents that economists considerthe most valuable—are astonishingly weak. Nonpracticing entities and softwarepatentees almost never win their cases. That may be a good thing, if you believethat most software patents are bad or that NPEs are bad for society. But itcertainly means that the patent system is wasting more of its time than expecteddealing with weak patents. And it also suggests that both our measures of patentvalue and our theories of litigation behavior need some serious reconsideration.
712 [Vol. 99:677THE GEORGETOWN LAW JOURNAL