
Patent Citation Networks Bernard Gress gressb01 Fannie Mae Inc., Washington DC....
37
Patent Citation Networks Patent Citation Networks • Bernard Gress • http://student.ucr.edu/~gressb01 • Fannie Mae Inc., Washington DC. • [email protected] • Forthcoming in The Mathematica Journal • http://www.mathematica-journal.com/
-
Upload
lesley-russell -
Category
Documents
-
view
216 -
download
0
Transcript of Patent Citation Networks Bernard Gress gressb01 Fannie Mae Inc., Washington DC....

Patent Citation NetworksPatent Citation Networks
• Bernard Gress• http://student.ucr.edu/~gressb01
• Fannie Mae Inc., Washington DC.
• Forthcoming in The Mathematica Journal• http://www.mathematica-journal.com/

The Patent Citation Dataset
• Patent citations are part of the legal patent process where the patent applicant has the duty to disclose any knowledge of 'prior art' amongst previous patents.
• Some objectivity in the process is provided by the government patent examiner who is supposed to be an expert in the area and who approves the final citation.
• The network established by patent citations allows one to trace the flow of technology through time, from patent to patent, and across fields.
• Studies of technological spillover effects, the impact or influence of individual patents, the rates of technological development, and other such issues, can be assisted by the consideration of patent citations.

The Patent Citation Dataset - continued
• Hall, Jaffe, and Trajtenberg, and the National Bureau of Economic Research (NBER) (http://www.nber.org/patents/).
• The primary database (cite75_99.zip) contains 22,309,440 pairs of pair-wise patent citation dataset on more than 3 million U.S. patents granted between January 1963 and December 2002.
• The secondary database (pat63_02f.txt) contains records for 3,414,910 patents with 25 fields each.

Structure of Primary Database (cite75_99.zip)
Citing Cited4647229 13964859 16194502 16409007 34833984 134119158 134130067 243972663 295252107 31

Structure of Secondary Database (pat63_02f.txt)

Patent Numbers Issued Serially
3.5106 4106 4.5106 5106 5.5106 6106 6.5106
4000
6000
8000
10000
12000
14000
16000Grant Date by Patent Number

Two Types of Citation Networks
• A Citation Lineage – all of the progenitors and descendants by
citation reference, so long as no siblings are brought into the picture
• A Citation Neighborhood– all those patents that are within a specified
network distance of the patent of interest, regardless of relationship, including all 'siblings' and 'cousins'.
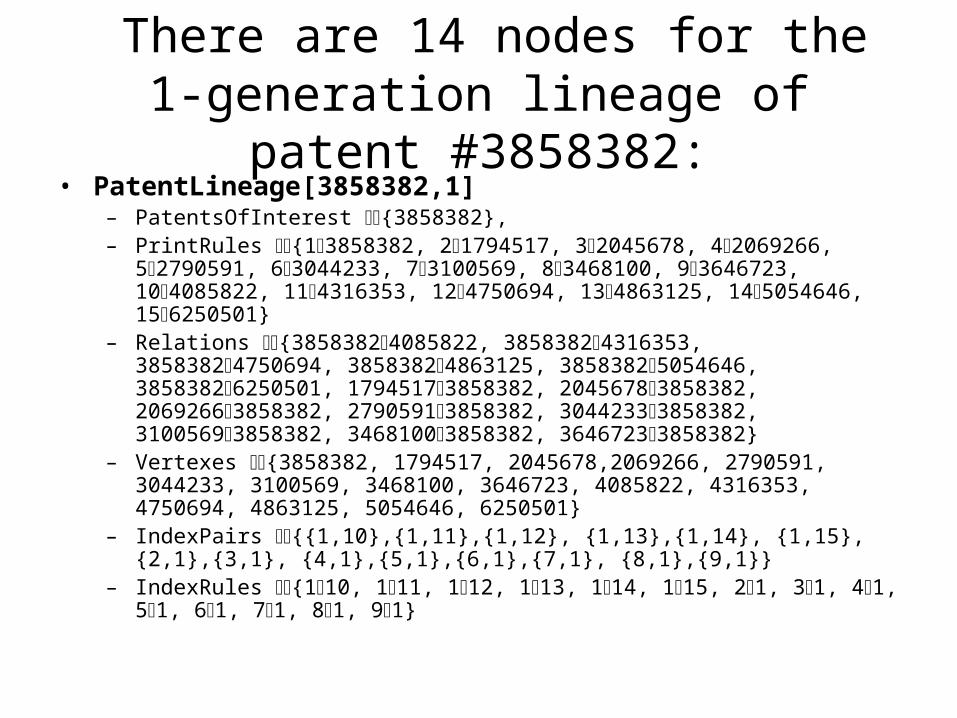
There are 14 nodes for the 1-generation lineage of patent #3858382:• PatentLineage[3858382,1]
– PatentsOfInterest {3858382},– PrintRules {13858382, 21794517, 32045678, 42069266,
52790591, 63044233, 73100569, 83468100, 93646723, 104085822, 114316353, 124750694, 134863125, 145054646, 156250501}
– Relations {38583824085822, 38583824316353, 38583824750694, 38583824863125, 38583825054646, 38583826250501, 17945173858382, 20456783858382, 20692663858382, 27905913858382, 30442333858382, 31005693858382, 34681003858382, 36467233858382}
– Vertexes {3858382, 1794517, 2045678,2069266, 2790591, 3044233, 3100569, 3468100, 3646723, 4085822, 4316353, 4750694, 4863125, 5054646, 6250501}
– IndexPairs {{1,10},{1,11},{1,12}, {1,13},{1,14}, {1,15}, {2,1},{3,1}, {4,1},{5,1},{6,1},{7,1}, {8,1},{9,1}}
– IndexRules {110, 111, 112, 113, 114, 115, 21, 31, 41, 51, 61, 71, 81, 91}

There are 15 nodes for the1-generation Neighborhood
of patent #3858382:• PatentNeighborhood[3858382,1]
– PatentsOfInterest {3858382}– PrintRules {13858382, 21794517, 32045678, 42069266,
52790591, 63044233, 73100569, 83468100, 93646723, 104085822, 114316353, 124750694, 134863125, 145054646, 156250501}
– Relations {17945173858382, 20456783858382, 20692663858382, 27905913858382, 30442333858382, 31005693858382, 34681003858382, 36467233858382, 38583824085822, 38583824316353, 38583824750694, 38583824863125, 38583825054646, 38583826250501}
– Vertexes {3858382, 1794517, 2045678, 2069266,2790591, 3044233, 3100569, 3468100, 3646723, 4085822, 4316353, 4750694, 4863125, 5054646, 6250501}
– IndexPairs {{1,10}, {1,11}, {1,12}, {1,13}, {1,14}, {1,15}, {2,1}, {3,1},{4,1},{5,1},{6,1}, {7,1}, {8,1}, {9,1}}
– IndexRules {110, 111, 112,113, 114, 115, 21, 31, 41, 51, 61, 71, 81, 91}

• Mathematica has Nice Built-in Graph Visualization Functions for Unstructured Graphs:
• GraphPlot• GraphPlot3D• ShowGraph
• But to Plot Graphs Over Time then Have to Use My Function:
• PatentPlot

Citation Networks Over Time - continuedThe 2-Generation Lineage of 3858382

Citation Networks Over Time - continuedThe 2-Generation Neighborhood of 3858382

GraphPlot[PatentNeighborHood[ {3858382, 4597749}, 2]]

1963
1964
1965
1967
1968
1969
1970
1971
1972
1973
1974
1975
1976
1977
1978
1979
1980
1981
1982
1983
1984
1985
1986
1987
1988
1989
1990
1991
1992
1993
1994
1995
1996
1997
1998
1999
2000
2001
2002
385838238690653897678 38900113893382
3973376
3889449
153287717945171863556 20456782069266 232591727210152790591 28058982842921 298599230442333050918 30566323075324 30897323100569
3156273
3210124
3304619 33231553329260 3337064 3351388
3382010 3384287
3431828 3439891 3455529 3468100
3495378 3497086
35814593587410 35980433605383
3640450 3646723
3707826 371728137314723747298
378957037912673810420
4062170
4084397 40858224092817 4094125
41379584139029 41481734156521
41810694216050 4226072 4236694
4244159427793642803154285681 42959044308021
4316353 43163554322932 4325470 43387614341054 43425644345412 43514244356955 4357139 43609994364534
4370845 4372433 43781824386924 43927604395252 43986894403465 4407474 441346844166244418835
4432186 443376444376344451249 4454706 446623344706274473431 4478029 4480750 4484662 44861874487313 448738844875994490131
45110234516380 45163844518378 4529090 45412284545844 4549877 45519664558800 4561806
4571227 4576310 45763164579307 4581007 4581874 458248445833494597749 460353546131044620681 4623111
46352954642084 465567746575284662864 46643474676205 46883704692134 46937014695020 46961504697771 46996074699608 4704845 4710068
47214194723742 473095547309564731981 473251347353404747815 4749158 47506944758214 47606844762297 4769125 4769126 4769977 477056547715874785938
4798042 48058574805969 481208548152554819898 4821985 482843448303174838504 48403354858862 48609024860982 4863125 48673394869045 48694474869458 4887411
48995224904092 49211934921197 4923080 49254384925439 4926624 49325604946041 49464884953664 49557624957252
4986872 49893954989398 499003449986945005457 5012994 50186375018691 50190585020750 50372455050825 50546465062259 50661465074674
5083702 5100087 5101938 51038825105605 510596951176175120553 512201651255695125887 51297655131499 514284051428415167301 51708255174094 51744135174449
51763085177939 51781965184728 51902535195613 5201350521314552149055215275 5222702 522284052268585230688 5233281524252952427015244450 5249410 5255494 526155352677115268969 52694165269423
5279696 52804655293731 5299890530557953101025312317 5321930 53297525332094 5335485 5349996 5356397 536157053639655368165
5377570 53925895393293 54009895405021 54074005408805 540881454131575417039 5419452542151254354585440863 54511255452559 54542075458851 54658455467572 5478173 5478174
54840915501394 55029465503355 550350555075865511360 5513479 55178005518578 552476355257865526631 55357925546732 55494235551219 556196755622135564255 5567091 55709775577615 5584402
560684456181475636925 564260656553525657619 565762056671735685432 569268956947465702339
5713181 57256705741208 576534857716675775055 57758695782073 5788425 57946735794866579946558028135806815 5809743 58097455810706 5819509582640558330615845467 5848625
58573105860529 5860905586313058683645868901 5871115 58757005890347 59015385947882 5960617 5976315 5987854599336859939425997177 5997643 6003288
602686960331546042063605970760860236089514 6094822609489561423646145709 6148587 6152407 61526566155521
617102461763666185915 6196717620575562279946230781 623787862505016250543 625452162603336264059 6266945 6282871628317862862936291037 6295790 63134446315705 6324818
6334290 6347499 6363694637457963751316379291 638595163897866402098 64314076453646 6460814 64878356491218
A nice illustration of the spread of technology over time.

Coloring nodes by criteria
I also add functions to color nodes and edges by different patent characteristics, e.g. – Patent Technology Category (2- and 4-digit
HJT)– Patent Originality/ Generality Index– Total Number of Citations

GraphPlot3D[PatentNeighborhood[ 3858382, 7]]

GraphPlot[PatentNeighborhood[3858382,12]]
Colored by technology category

Time ConstrainedThe 7-Generation Neighborhood of #3858382,
Colored by Technology Class

Network Statistics and Structure Analysis
• Citation Lags
• Network Curvature
• Citation Count Distributions
• HJT Technology Categories
• Originality and Generality

Distributions of Backward Lags

Distributions of Backward Lags

Network Curvaturethe average number of patents reached at subsequent network distances
-some simple graphs and their respective curvature plots-
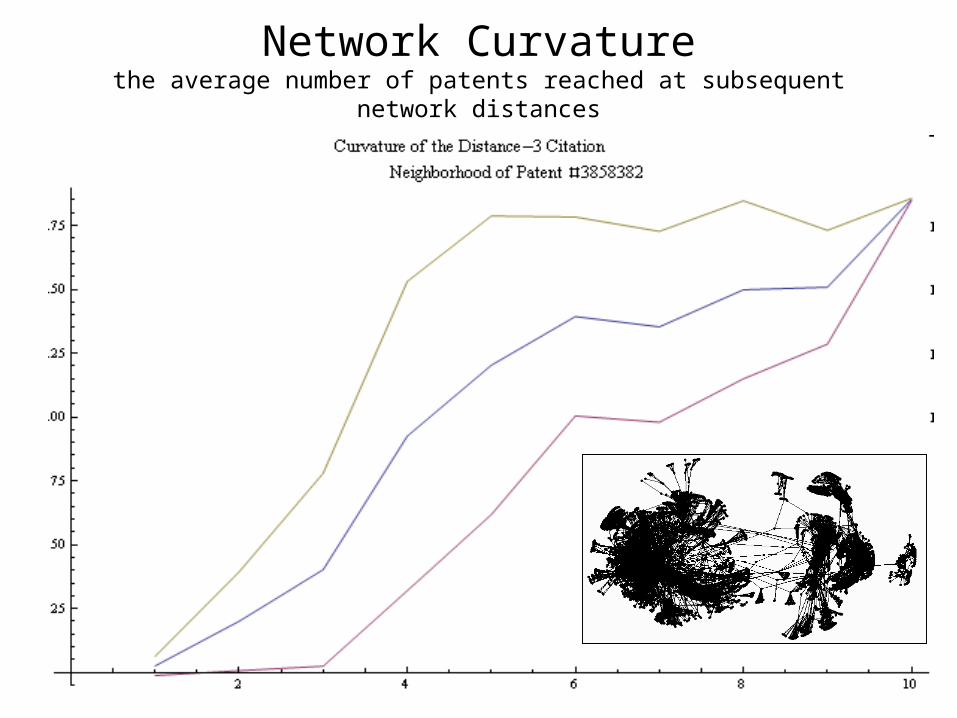
Network Curvaturethe average number of patents reached at subsequent network distances

A much larger network of 91,000 patents over 40 years
Curvature graphs for each year
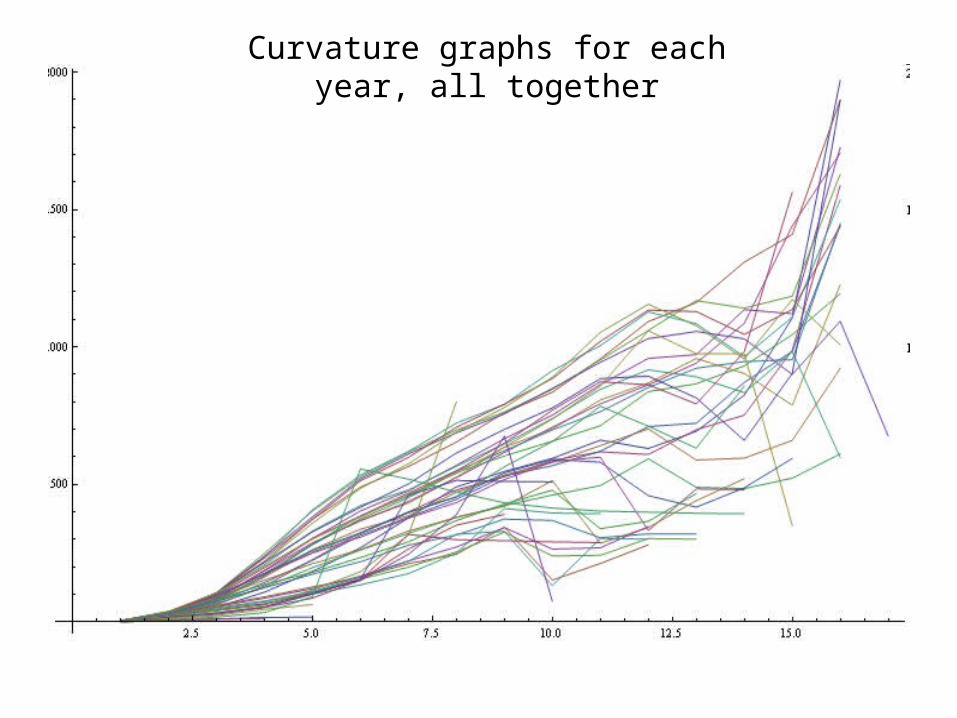
Curvature graphs for each year, all together

Curvature graphs for each year, all together, different view

Patent Technological CompositionHJT Category HJT SubCategory SubCategory Name Category Name Total Patents Frequency 1 11 Agriculture, Food, Textiles Chemical 31 781 0.7351 12 Coating Chemical 64 563 1.4931 13 Gas Chemical 23 269 0.5381 14 Organic Compounds Chemical 132 904 3.0741 15 Resins Chemical 118 687 2.7451 19 Miscellaneous chemical Chemical 411 881 9.5272 21 Communications Computers & Communications 167 787 3.8812 22 Computer Hardware & Software Computers & Communications 119 478 2.7632 23 Computer Peripherials Computers & Communications 41 154 0.9522 24 Information Storage Computers & Communications 70 164 1.6232 25 Unknown Unknown 2548 0.0593 31 Drugs Drugs & Medical 114 011 2.6373 32 Surgery & Med Inst. Drugs & Medical 106 104 2.4543 33 Biotechnology Drugs & Medical 31 551 0.733 39 Miscellaneous Drgs &Med Drugs & Medical 26 336 0.6094 41 Electrical Devices Electrical & Electronic 133 152 3.084 42 Electrical Lighting Electrical & Electronic 65 907 1.5244 43 Measuring & Testing Electrical & Electronic 110 696 2.564 44 Nuclear & X rays Electrical & Electronic 51 408 1.1894 45 Power Systems Electrical & Electronic 139 427 3.2254 46 Semiconductor Devices Electrical & Electronic 80 028 1.8514 49 Miscellaneous Elec Electrical & Electronic 93 005 2.1515 51 Mat. Proc & Handling Mechanical 259 561 6.0035 52 Metal Working Mechanical 135 812 3.1415 53 Motors & Engines Parts Mechanical 179 208 4.1455 54 Optics Mechanical 82 085 1.8995 55 Transportation Mechanical 152 761 3.5335 59 Miscellaneous Mechanical Mechanical 259 434 6.0016 61 Agriculture, Husbandry, Food Others 110 294 2.5516 62 Amusement Devices Others 53 528 1.2386 63 Apparel & Textile Others 98 543 2.2796 64 Earth Working & Wells Others 71 491 1.6546 65 Furniture, House Fixtures Others 125 006 2.8916 66 Heating Others 65 573 1.5176 67 Pipes & Joints Others 47 698 1.1036 68 Receptacles Others 108 177 2.5026 69 Miscellaneous Others Others 438 506 10.142
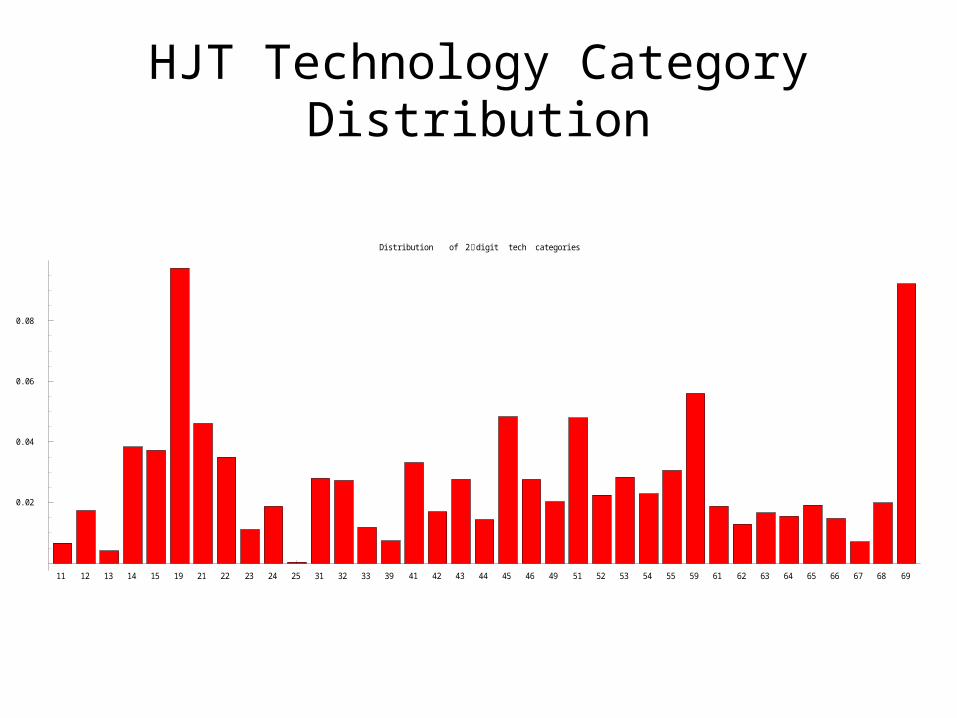
HJT Technology Category Distribution
11 12 13 14 15 19 21 22 23 24 25 31 32 33 39 41 42 43 44 45 46 49 51 52 53 54 55 59 61 62 63 64 65 66 67 68 69
0.02
0.04
0.06
0.08
Distribution of 2digit tech categories
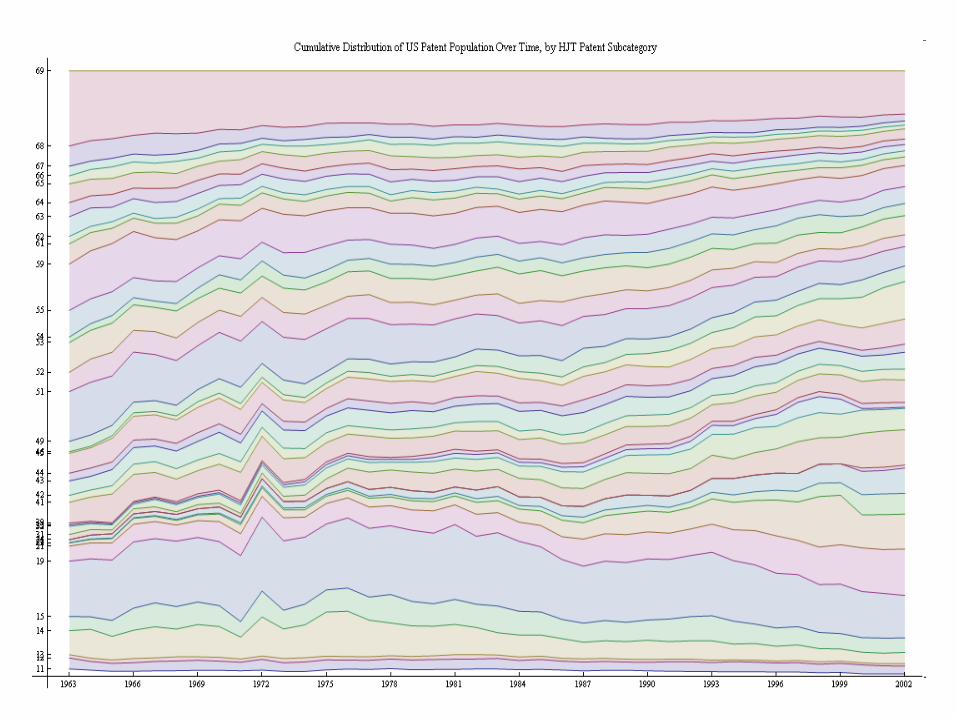
Cumulative distribution of patents by tech category

Citation Count Distributions
Citation Count Distributions

Citation Count Distributions - continued

Citation Count Distributions - continued

Citation Count Distributions - continued

Generality and Originality
• where J is the number of patent classes, Ni is the total number of forward citations for patent i, and Ni,j is the number of forward citations in each patent class for patent i. The second term is a Herfindal-type of index.
• The 'Originality' of Patent 'i' is the same, except with backwards citations (i.e. citations made).
• "Thus if a patent cites previous patents that belong to a narrow set of technologies, the originality score will be low, whereas Citing patents in a wide range of fields would render a higher score."

Generality and Originality - Continued
Not very interesting - at least no trends over time –
and seemingly no necessary relationship to the concepts
they intend to measure.

Conclusions
• Mathematica is a nice platform for networks analysis
• There is a lot of opportunity for research in this area
• Don’t know what the value of this research is to the IPI-ConfEx clientele

References
• [1] B. Hall, Jaffe, Trajtenberg, "The NBER Patent Citations Data File: Lessons, Insights and Methodological Tools," 2002, http://emlab.berkeley.edu/users/bhhall/pat/NBERpatdata.pdf
• [2] S. Wolfram, A New Kind of Science, : 2002


