
Patent Boxes Design, Patents Location and Local R&D · patent income and conclude that they are...
37
Annette Alstadsæter, Salvador Barrios, Gaetan Nicodeme, Agnieszka Maria Skonieczna and Antonio Vezzani 2015 IPTS Working Papers on Corporate R&D and Innovation – No 6/2015 Patent Boxes Design, Patents Location and Local R&D
Transcript of Patent Boxes Design, Patents Location and Local R&D · patent income and conclude that they are...

Annette Alstadsæter, Salvador Barrios, Gaetan Nicodeme, Agnieszka Maria Skonieczna and Antonio Vezzani
2015
IPTS Working Papers on Corporate R&D and Innovation – No 6/2015
Patent Boxes Design, Patents Location
and Local R&D

European Commission
Joint Research Centre
Institute for Prospective Technological Studies
The main authors of this paper are: Annette Alstadsæter (University of Oslo), Salvador Barrios (European Commission,
Joint Research Centre, IPTS), Gaetan Nicodeme (European Commission, ULB, CESifo and CEPR), Agnieszka Maria
Skonieczna (European Commission) and Antonio Vezzani (European Commission, Joint Research Centre, IPTS)
Contact information
Salvador Barrios
Address: Edificio Expo. c/ Inca Garcilaso, 3. E-41092 Seville (Spain)
E-mail: [email protected], [email protected]
Tel.: +34 954488236
Fax: +34 954488316
JRC Science Hub
https://ec.europa.eu/jrc
Legal Notice
This publication is a Technical Report by the Joint Research Centre, the European Commission’s in-house science service.
It aims to provide evidence-based scientific support to the European policy-making process. The scientific output
expressed does not imply a policy position of the European Commission. Neither the European Commission nor any person
acting on behalf of the Commission is responsible for the use which might be made of this publication.
All images © European Union 2015
JRC96080
ISSN 1831-9408 (online)
Spain: European Commission, Joint Research Centre, 2015
© European Union, 2015
Reproduction is authorised provided the source is acknowledged.
Abstract
Patent boxes have been heavily debated for their role in corporate tax competition. This paper uses firm-level data for
the period 2000-2011 for the top 2,000 corporate research and development (R&D) investors worldwide to consider the
determinants of patent registration across a large sample of countries. Importantly, we disentangle the effects of
corporate income taxation from the tax advantage of patent boxes. We also exploit a new and original dataset on patent
box features such as the conditionality on performing research in the country, and their scope. We find that patent boxes
have a considerable effect on attracting patents, mostly because of their favourable tax treatment, especially for high-
quality patents. Patent boxes with a large scope in terms of tax base definition also have stronger effects on the
location of patents. The size of the tax advantage offered through patent box regimes is found to deter local innovative
activities, whereas R&D development conditions tend to attenuate this adverse effect. Our simulations show that, on
average, countries imposing such development conditions tend to grant a tax advantage that is slightly greater than
optimal from a local R&D impact perspective.

IPTS WORKING PAPER ON CORPORATE R&D AND INNOVATION – NO.6/2015 PATENT BOXES DESIGN, PATENTS LOCATION AND LOCAL R&D
1
Abstract§
Patent boxes have been heavily debated for their role in corporate tax competition. This
paper uses firm-level data for the period 2000-2011 for the top 2,000 corporate research and
development (R&D) investors worldwide to consider the determinants of patent registration
across a large sample of countries. Importantly, we disentangle the effects of corporate
income taxation from the tax advantage of patent boxes. We also exploit a new and original
dataset on patent box features such as the conditionality on performing research in the
country, and their scope. We find that patent boxes have a considerable effect on attracting
patents, mostly because of their favourable tax treatment, especially for high-quality patents.
Patent boxes with a large scope in terms of tax base definition also have stronger effects on
the location of patents. The size of the tax advantage offered through patent box regimes is
found to deter local innovative activities, whereas R&D development conditions tend to
attenuate this adverse effect. Our simulations show that, on average, countries imposing such
development conditions tend to grant a tax advantage that is slightly greater than optimal
from a local R&D impact perspective.
Keywords: Corporate taxation, patent boxes, location, patents, R&D, nexus approach
JEL Classification: F21, F23, H25, H73, O31, O34
§ We are thankful to Maarten Buis, David Hannigan, Shafik Hebous, Henrik Paulander, Eric Strobl, Sara
Riscado and the participants in the 2015 PSE CESifo conference for valuable comments and suggestions. The
findings, interpretations and conclusions expressed in this paper are entirely those of the authors and should not
be attributed to the European Commission. Possible errors and omissions are those of the authors and theirs
only.

IPTS WORKING PAPER ON CORPORATE R&D AND INNOVATION – NO.6/2015 PATENT BOXES DESIGN, PATENTS LOCATION AND LOCAL R&D
2
1. Introduction
A growing number of developed economies have recently implemented patent box
regimes. Those grant preferential tax treatment to corporate revenues from intellectual
property (IP). The use of such schemes has raised suspicion about yet another tax competition
device. In July 2013, the German finance minister, Wolfgang Schäuble, publicly criticised
patent box regimes as ‘going against the European spirit’, suggesting that they should simply
be banned.1 Such concerns appear justified by anecdotal evidence. For instance, Pfizer’s
widely discussed and failed attempt to takeover Astra Zeneca appeared to be essentially tax
motivated.2 The company resulting from this merger would have been incorporated in the UK
taking advantage of a reduced corporate tax rate of 10% (instead of a standard rate of 21%)
over future profits generated from patents. Similarly, the UK company GlaxoSmithKline has
recently centralised all its vaccine-related IP in Belgium mainly for fiscal reasons while
carrying its physical capital investment at home.3
In another notable case, the hotel
reservation company Booking.com was expected to reduce its tax rate by around 4 percentage
points thanks to the Dutch patent box regime.4 These examples seem to suggest that the
decisions on patent registration by firms may have little to do with developing research and
innovation but a lot to do with tax planning, echoing Minister Schäuble’s worries that patent
boxes are simply there ‘to attract companies’. Such concerns were also voiced in the context
of the Organisation for Economic Cooperation and Development (OECD) Base Erosion and
Profit Shifting (BEPS) discussion and in the EU code of conduct on business taxation.5 The
need to align taxation with ‘substantial’ research activity being developed by companies is
now indeed seen as a key factor to ensure that such preferential regimes reach their goal of
fostering innovation and economic growth.6
In this paper, we provide novel empirical evidence on the determinants of the
geographical distribution of patent applications made by the 2,000 top corporate R&D
investors. We focus on both tax and non-tax features of patent box regimes that might affect
patent registration and local R&D activity. Our sample covers 33 countries (the EU28, the
USA, Canada, Switzerland, the Republic of Korea and China) and three sectors of activity
(the pharmaceutical industry, the car industry and the Information and Communications
Technology, ICT), which have been particularly active in global patenting in the past decades.
We disentangle the general effects of the corporate income tax (CIT) rate from tax and non-
tax characteristics of patent boxes such as their scope and eligibility conditions, and
investigate whether or not these characteristics influence local research activity. Importantly,
our firm-level data includes 12 countries with patent boxes, of which 10 have introduced a
patent box within the period 2000-2011. To the best of our knowledge, this is the first attempt
1
Breidthardt, A., ‘Germany calls on EU to ban “patent box” tax breaks’, Reuters, 9 July 2013,
http://uk.reuters.com/article/2013/07/09/uk-europe-taxes-idUKBRE9680KY20130709 2 Financial Times, 29 April, 2014
3 See Financial Times, 12 March 2014 and "GSK renforce le rôle de la Belgique comme QG mondial", L'Echo,
7 April 2015. 4
Breidthardt, A., ‘Germany calls on EU to ban “patent box” tax breaks’, Reuters, 9 July 2013,
http://uk.reuters.com/article/2013/07/09/uk-europe-taxes-idUKBRE9680KY20130709 5 OCDE (2014), pages 27-53.
6 Van der Made (2014, 2015).

IPTS WORKING PAPER ON CORPORATE R&D AND INNOVATION – NO.6/2015 PATENT BOXES DESIGN, PATENTS LOCATION AND LOCAL R&D
3
to analyse the various specific designs of patent boxes and to test their impacts on patent
location and local inventorship. Our results suggest that patent boxes have a strong effect on
attracting high-value patents, mainly owing to the favourable tax treatment they offer. Patents
are also found to be more sensitive to the tax advantages offered by patent boxes when these
have a large scope in terms of IP covered, and when they grant their benefit to pre-existing
patents, acquired patents and/or embedded royalties. Interestingly, our results indicate that the
tax advantages of patent boxes tend to deter local innovative activities, given the lack of
incentives for companies to develop local research. Nevertheless, our results suggest that the
imposition of local R&D development conditions in the patent box regime has the potential to
attenuate this adverse fiscal effect. Our simulations show that on average countries imposing
such development conditions actually tend to grant a tax advantage that is larger than optimal
from a local R&D impact perspective, although only slightly so.
There is to date little empirical evidence on the impacts of patent boxes on R&D and
patent location. A negative relationship between the level of the corporate income tax rate
and the amounts of both a firm’s intangible assets and its patents has been documented by
Dischinger and Riedel (2011), Ernst and Spengel (2011), Karkinsky and Riedel (2012),
Böhm et al. (2014), Ernst et al. (2014), and Griffith et al. (2014). For example, Karkinsky
and Riedel (2012) estimate that a percentage point increase in the corporate tax rate reduces
patent applications filed at the location by around 3.5%. Böhm et al. (2014) and Griffith et al
(2014) show in addition that the quality of an intangible asset and the anti-avoidance
framework (controlled foreign company, CFC, rules) play a role in the location decisions.
Böhm et al. (2014) and Ernst et al. (2014) suggest that low income tax rates attract
particularly patents with high earning potential. However, these papers use older data that do
not cover the introduction of the many recent patent boxes, often mainly analysing the effect
of the (effective) CIT rate on the patent location choices. For instance, Griffith et al. (2014)
estimate ex ante, with data running until 2005, the impact of preferential tax regimes for
patent income and conclude that they are likely to result in substantial revenue losses for all
countries.
The rising concerns surrounding patent boxes are part of a long-standing discussion on
tax competition. This literature usually advocates for an increased global coordination of
corporate tax policies. Countries around the world have always been eager to be attractive to
foreign portfolio and physical investment, thus triggering a race to the bottom in corporate
taxation, realising the theoretical predictions of Zodrow and Mieszkowski (1986) and Wilson
(1986).7 In the OECD, the average CIT rates fell from 48.5% in 1985 to 28.7% in 2007, while
in the EU (EU-15) the fall was from 48.7% in 1985 to 28.8% in 2007. Recently, however,
this race to the bottom seems to have levelled off. The EU-15 average moved from 27.5% in
2008 to 26.3% in 2015 and the OECD average changed from 27.6% to 26.4% over the same
period8. At the same time, many EU Member States narrowed their tax base in corporate
taxation with a view to stimulating investment.9 Tax competition thus seems to have changed
7 See Devereux et al. (2008) for an empirical analysis. Data on corporate tax rates can be found in, inter alia,
European Commission (2014b) and OECD (2015a). 8 The Eu-28 average moved from 22.7% in 2008 to 22.1% in 2015. The OECD data are for those countries that
were members in 1985. 9 See Garnier et al (2014) for a recent review on policy measures at EU level.

IPTS WORKING PAPER ON CORPORATE R&D AND INNOVATION – NO.6/2015 PATENT BOXES DESIGN, PATENTS LOCATION AND LOCAL R&D
4
its nature, moving from a focus on statutory rates to one on tax bases. Patent boxes are an
important driver of these recent developments, with EU countries being especially active.
Figure 1 shows that the number of patent boxes in the EU has grown from 2 in 1995 to 11 in
2015 with a clear acceleration in recent years. The tax reduction that patent boxes offer varies
across countries but the average tax advantage over the period has been about a 75%
reduction in the CIT rate (17.9 percentage points).
Theoretically, there are a number of reasons for suggesting that patent boxes do not
necessarily serve the goal of boosting local R&D activity. First, unlike expense-based tax
incentives for R&D, such schemes do not reward firms for the social benefits that they cannot
appropriate. Instead, they award additional tax benefits to a successful innovation that already
enjoys IP protection. Un-patentable research efforts with potentially higher social spillovers
are less attractive and thus become indirectly discriminated against. Second, patent boxes also
rank very low in terms of good tax incentive practices such as their scope (determining the
size of the tax base), their targeting and their organisational practices (CPB, 2015).10
Finally,
the patent box schemes came under the scrutiny of the EU and OECD because of the apparent
lack of linkage between the tax advantage offered and the presence of research or innovation
activity. Discussions at both the OECD and the EU have led to an agreement on the
requirement to establish a nexus between the income derived from IP and the expenditure
incurred to develop this asset, for the income to qualify for the patent box preferential regime
(OECD, 2014).11
The existence of development conditions in some patent boxes may shed
light on the potential effect of the nexus condition developed by the OECD and the EU,
notably with regard to its effect on patent location, tax revenues and local R&D. Our finding
that the tax-sensitivity of patent location is reduced when such specific conditionality is
imposed would suggest that the nexus approach could (at least partly) inhibit the still
dominant tax competition dimension of patent boxes.
The remainder of the paper is organised as follows. Section 2 describes patent box
regimes and their characteristics and details the nexus approach chosen by developed
economies. Section 3 explains our empirical strategy and section 4 describes our dataset.
Next, section 5 discusses our results before section 6 concludes.
2. Patents, patent box design and local R&D
2.1 Who patents and why?
Before moving into the analysis on the location of patents, it is useful to understand why
companies patent their inventions in the first place and why it is strategically important to
locate patent for fiscal reason, in particular for large multinationals. A patent is a ‘legal title
10
CPB (2015) reviews the economic literature on the determinants of R&D activity to benchmark the tax
schemes. Patent boxes are found to have several non-recommended practices such as being related to output or
having weak targeting. 11
In the EU, an agreement on a modified nexus approach requires that Member States with patent boxes that do
not meet this condition close them to new entrants by 30 June 2016 and abolish them by the 30 June 2021 (van
der Made, 2015).

IPTS WORKING PAPER ON CORPORATE R&D AND INNOVATION – NO.6/2015 PATENT BOXES DESIGN, PATENTS LOCATION AND LOCAL R&D
5
that gives inventors the right, for a limited period (usually 20 years), to prevent others from
making, using or selling their invention without their permission in the countries for which
the patent has been granted’.12
The patent system is territorial, and a patent is valid for the
geographical area for which it is granted. This has the effect of dividing world markets into
protected trade areas (Greenhalgh and Rogers, 2010).13
Holders of a patent issued by a patent
office have a given period of time (12 months) to file a patent application abroad and still
claim priority for the existing application.
Large R&D-intensive firms tend to patent more, whereas process-oriented innovators
patent less than product-oriented innovators (Peeters and van Pottelsberghe, 2006). Many
sectors are not patent-active, and patenting firms represent a small part of the population of
firms, e.g. only between 1.6% in Ireland and 8.8% in Germany (OECD, 2013). Hall et al.
(2013) find that even among firms that conduct R&D in the UK, only 4% patent. The share of
patenting firms is much lower than one might expect given that around 20% of firms that
invest in R&D report product innovations. Findings are similar for the USA as only 5.5% of
US manufacturing firms own a patent (Balasubramanian and Sivadasan, 2011). The use of
patents by industry reflects this heterogeneity. Computers, electronics, machinery, chemicals
and pharmaceuticals are the sectors with the highest patenting activities (OECD, 2013). The
most important objective behind patenting is to prevent third parties from exploiting the
protected invention. However, strategic patenting seems increasingly important and may also
provide signals to rivals, potential negotiation leverage and boost to reputation, but also
incentives for R&D employees and the measurement of performance (Blind et al., 2006).
Empirical evidence suggests that, for many sectors patents, are an ineffective way to
appropriate returns and secrecy, and lead times are used extensively (Arundel, 2001; Hanel
2008; Hall et al., 2013). This does not necessarily mean that different means of appropriation
are substitutes, as for non-patentable inventions such as software in Europe. Firms can
combine formal (patents, copyrights, trademarks) and informal (secrecy, lead times) means of
appropriation and treat them as complements to protect different elements of their innovation
(Hall et al., 2013, 2014). This is important for our work, as the evidence presented in this
paper suggests that many patent boxes apply to IP, which is much broader than patents.
Furthermore, even for large, R&D-intensive firms coming from sectors where patents are
used intensively, differences in strategy remain (Dernis et al., 2015). We are interested in
these differences, as we expect that responses to patent boxes will vary across sector. Indeed,
the motives for patenting can differ across sectors, for example depending on whether an
industry mainly produces ‘discrete’ or ‘complex’ products (Cohen et al, 2000).
2.2 Patent Boxes: a European story
The European patent system, which is more specifically considered in this paper, is rather
complex. The patent applicant have a choice between following the national procedure in
each state for which (s)he seeks protection and taking the European route with the European
12
Definition according to the European Patent Office: http://www.epo.org/service-support/glossary.html. 13
This means, for instance, that a US company holding a US patent (granted by the United States Patent and
Trademark Office, USTPO) would need to file for patent/register with the European Patent Office (EPO) or a
national patent office to obtain a patent that also covers European countries

IPTS WORKING PAPER ON CORPORATE R&D AND INNOVATION – NO.6/2015 PATENT BOXES DESIGN, PATENTS LOCATION AND LOCAL R&D
6
Patent Office (EPO), which in a single procedure confers protection in all the designated
contracting states. However, the EPO applicant will still need to validate the European patent
in the designated states within a short time limit after the EPO grants the patent (usually 3
months). This could entail a substantial cost due to a number of requirements, such as
payment of the fees and translations.14
Patent boxes first appeared in France and Ireland as early as the 1970s. Interestingly,
Ireland is, to date, the only country that has abolished its patent box for budgetary reasons
(2010), but its re-introduction is under consideration at the time of writing of this paper.15
Patent boxes are very heterogeneous in their design. These differences are shown in more
detail in Table 2. We focus on five design characteristics that are expected to make the tax
advantage more or less pronounced: (a) which IP rights qualify for the patent box (the scope);
(b) the treatment of existing patents; (c) the treatment of acquired patents; (d) the treatment of
embedded royalties; and (e) the existence of development conditions.
First, the name ‘patent boxes’ can be deceptive, as many patent boxes have a much larger
scope than just patentable rights, as summarised in Table 1. All patent boxes cover patents
and often rights equivalent to patents such as supplementary protection certificates. Besides
patents, patent boxes can also cover designs and, to a lesser extent, trademarks. In addition,
they often consider copyrights, sometimes with a restriction to software, probably to
compensate for the fact that software is not patentable in Europe unlike in the USA. Firms
often combine different forms of IP, even for the same invention (Hall, 2014). This implies
that the advantage conferred by patent boxes with a wide IP scope could be more generous
than intended by policymakers and would over-subsidise the same invention.
Second, the effects of a patent box on tax revenues depend on its provisions. Existing (i.e.
prior) patents may in some cases also benefit from the lower tax rates of patent boxes, as in
the systems put in place in Cyprus, France, Hungary, Malta, Spain, the UK, Ireland (up to
2010), Liechtenstein and the Nidwalden canton in Switzerland. This represents a windfall
gain to firms with existing patents, as after-tax income from their existing patents in that
jurisdiction increases with no further action required.
Third, the treatment of acquired patents differs across patent boxes. A majority of patent
boxes allow patents acquired from related or third parties, whereas only a small number of
countries allow the use of acquired patents on condition that the acquirer further develops
these patents.
Fourth, patent boxes also vary in the treatment of embedded royalties. The three
‘narrowest’ patent boxes in terms of coverage (in the UK, Belgium and The Netherlands)
include only income from patents under their IP tax rules (see Table 1). However, at the same
14
Patenting in the EU is expected to become less complex and costly thanks to the introduction of the European
patent with unitary effect, the so-called "unitary patent" (European Commission, 2011). Such patent will be yet
another option for users besides already-existing national and "classical" European patents. It will enable a
unitary effect in 25 EU states without the need for subsequent validation. However, the system is not yet in
force. The unitary patent may be requested from the date of the entry into force of the Agreement on a Unified
Patent Court. The Agreement was signed by 25 EU Member States on 19 February 2013. It will need to be
ratified by at least 13 states, including France, Germany and the United Kingdom to enter into force. 15
Department of Finance, ‘Department of Finance Launches Consultation Process on Knowledge Development
Box’, 14 January 2015, http://www.finance.gov.ie/news-centre/press-releases/department-finance-launches-
consultation-process-knowledge-development.
IPTS WORKING PAPER ON CORPORATE R&D AND INNOVATION – NO.6/2015 PATENT BOXES DESIGN, PATENTS LOCATION AND LOCAL R&D
7
time, these patent boxes also include the embedded royalties in the calculation of eligible
income.16
This means that the income from the sale of products that include patented items
and the notional royalty from using patented industrial processes, fall under the patent box,
implicitly increasing the coverage (and cost in terms of tax expenditures) of the IP boxes. For
instance, Evers et al. (2014) find that the treatment of expenses relating to IP income is
generally more decisive for the effective tax burden than the nominal IP Box tax rate. The
treatment of expenses can be so generous that IP Boxes provide negative effective tax rates.
In these cases unprofitable investment projects are subsidised by the patent box regime. It is
also important to note that other elements of the tax system need to be in place to make such
schemes beneficial for tax-planning purposes, namely an extensive network of bilateral
treaties, weak CFC legislation, flexible transfer pricing rules and flexibility of the tax
administration (e.g. advance rulings). In addition, some countries offer standard corporate tax
rates below the tax advantage offered by a patent box and could be more attractive for
companies that prefer to book their full profits in such jurisdictions.
In the next section, we examine the fifth important characteristic of patents, the possible
imposition of development conditions.
2.3 Patent Boxes and the link with local R&D
Current patent boxes approach the question of the link with underlying research activity -
thanks to which an IP right originated - in different ways. In half of the cases considered in
this paper, the patent boxes do not require any development work by the taxpaying company
in question. Patent boxes in The Netherlands, Belgium, the United Kingdom, Ireland (up to
2010), Spain, Portugal and China contain(ed) provisions specifying the link with the
underlying research activity.17
In the EU, this is usually done in the form of a development
condition that requires at least part of the patent to be developed by the beneficiary corporate
group within the Single Market. However, these conditions differ in their definition and
strength. For instance, the Belgian patent box requires that the qualifying patent shall have
been developed fully or partially by the taxpaying company in an R&D centre that qualifies
as a branch of activity. In the Netherlands, the patent box applies to intangible assets that the
company has developed itself. It also covers intangible assets that are in large part the result
of R&D work, conditional on the taxpaying company receiving a declaration from the Dutch
Research Agency (Schellekens, 2013). This declaration in turn links the R&D activity with
the use of the Dutch payroll deduction scheme for researchers. Under the UK patent box a
company or group must have performed qualifying development in relation to the IP right,
and the rules include provisions against full outsourcing (HMRC, 2010). Nevertheless, an
additional 'active ownership condition' potentially limits the constraining aspect of the
development condition. In such case, another company within a group could have fully
developed the IP right, while the company that pays tax in the UK actively manages the IP
portfolio.
16
Embedded royalties also exist in broader patent boxes such as in Luxembourg, Liechtenstein and Nidwalden
canton in Switzerland. 17
China has a preferential rate for new high-technology enterprises, which need to meet a number of
requirements to qualify to profit from the rate (e.g. level of R&D expenses).

IPTS WORKING PAPER ON CORPORATE R&D AND INNOVATION – NO.6/2015 PATENT BOXES DESIGN, PATENTS LOCATION AND LOCAL R&D
8
Generally, development conditions often contain qualitative terms such as ‘substantial’ or
‘significant’ work that are open to interpretation and have to be assessed on a case-by-case
basis.18
It is also worth mentioning that in the specific case of the EU, its Member States
cannot restrict the benefits of R&D tax incentives to activities performed in their territory as
this would infringe upon the freedom of establishment and prevent companies from
conducting their R&D elsewhere in the EU.19
3. Empirical strategy
We base our econometric analysis on a patent count model that links the number of
patents registered in a country by company and technology with company-level and patent-
level characteristics. We follow the empirical model proposed by Griffith et al. (2014) and
consider the firm’s payoff from registering a patent in a specific location as being determined
by the following profit function:
tjptjstjstjiitjtjtjp xapatentboxETR ,,,,,,,,,,, (1)
where p stands for the specific patent being considered, i indicates ideas to which this specific
patent belongs to, s indicates the industry category to which the firm registering this patent
belongs, j is the country in which the patent is registered and t is a time indicator. The
variable ETR stands for the effective tax rate, that is the statutory CIT rate minus, when
applicable, the tax rebate granted to income-related patents. We want, however, to account
separately for the effect of patent boxes, separating the tax reduction linked to the existence
of a patent box regime (T) from the non-tax aspects of patent boxes (NT), which define the
conditions under which these tax rebates apply. By accounting separately for the tax and non-
tax aspects of patent boxes we thus also consider that patent box regimes can represent an
administrative constraint that firms must comply with in order to benefit from the specific tax
rebate granted under the patent box regime. The ETR variable in equation (1) can thus be
decomposed into the statutory tax rate CIT and the tax effect of the patent box T:
tjtjtj TCITETR ,,, (2)
T will take non-zero values when a patent box regime exists, which we can in turn formally
specify as:
);( ,,, tjtjtj NTTfpatentbox (3)
where the tax component is given by 1
00,,,
,,
tjtj
tjtj
difX
diftjT (4)
with Xi,t > 0 being the tax rebate, in percentage points, granted under a patent box regime
applying in country j, and dj,t being a dummy variable indicating the existence or absence of a
patent box regime in a given country j and year t.
18
In our sample, only China applies the territorial restrictions so that most of the related R&D must be done in
China. 19
See Baxter and Fournier European Court of Justice cases, C-254/97 and C-39/04.
IPTS WORKING PAPER ON CORPORATE R&D AND INNOVATION – NO.6/2015 PATENT BOXES DESIGN, PATENTS LOCATION AND LOCAL R&D
9
The non-tax effect of patent boxes is given by (5)
Hence this non-tax component controls for other-than-tax characteristics of the patent box
that may affect the number of patents registered in a country where a patent box regime
applies. Replacing the ETR and patentbox variables of equation (1) by its components defined
in equations (2)-(5) we obtain the following alternative specification:
p p, j,t = l1CITj,t +a1Tj,t +a12NTj,t +biai, j,t +gsx j,t +es, j,t (1´)
The specification (1') decomposes the full effect of a specific patent box regime,
including the tax advantage (T) and the non-tax patent box component (NT), for a given level
of CIT. Equation (1') can be used to analyse the extent to which the tax advantage is large
enough to compensate firms for the compliance and administrative costs they must sustain to
benefit from this advantage. We can also further decompose the non-tax component (NT) into
the effects of the individual characteristics of patent boxes described earlier.
The other control variables included in our estimating equation are the research activity
related to idea i being conducted in country j where the patent is being registered (aij), as well
as a set of control variables measuring the research level of technological activity in country j
(represented by the total business R&D in percentage of gross domestic product, GDP), the
size of the local market (represented by the log of GDP) and the strength of the IP protection
in country j.
In our basic specification, we use a negative binomial logit. The reason for using such an
approach is the nature of our data and the large number of potential locations observed. This
large number of potential locations in particular implies a large number of zeros in our data,
which leads to the well-known problem of over-dispersion (see Rabe-Hesketh and Skrondal,
2012). Hence, in order to account for this over-dispersion, we take advantage of the fact that
the firm’s size, proxied by the total number of employees, is often directly correlated with the
probability of a given firm to register a patent. We use this employment variable as exposure
variable, assuming that, the larger the size of the company, the higher the probability for this
firm to register a patent. We next also consider a mixed negative binomial model in order to
account for unobserved heterogeneity and to estimate fixed and random effects on the
effective tax variable, which reflects the fact that firms do not behave similarly to fiscal
conditions.20
4. Data description
This paper uses the patent applications of world corporate R&D investors in 33 different
countries over the period 2000-2011.21
The analysis is based on the top 2,000 worldwide
corporate R&D investors as reported by the EU Industrial R&D Scoreboard (European
20
In doing so we also check whether our main results hold when using a specification including random effects,
as in Griffith et al. (2014). 21
Data for 2012 were also available at the time of writing of this paper although they did not yet cover the full
year. The use of these data would have resulted in unbalanced exposure across the year and could have
potentially biased our results.
11
00,,
,
tj
tj
dif
diftjNT

IPTS WORKING PAPER ON CORPORATE R&D AND INNOVATION – NO.6/2015 PATENT BOXES DESIGN, PATENTS LOCATION AND LOCAL R&D
10
Commission, 2013), which ranks the companies that invested the largest amounts of R&D in
2012. Alltogether, these companies accounted for about 90% of global business R&D
spending. 22
The Scoreboard data are drawn from the latest available company accounts reported in
the ORBIS database as provided by Bureau Van Dijk Electronic Publishing. ORBIS contains
ownership and balance-sheet accounting and financial information about firms located
worldwide. The patents filed by these companies at the European Patent Office (EPO) are
from the Patstat23
database in the framework of a JRC-OECD joint project (see Dernis et al.,
2015). This project has carried out a matching on a by-country basis using a series of string-
matching algorithms contained in the Imalinker system (Idener Multi Algorithm Linker)
developed for the OECD by IDENER, Seville, 2013.24
The characteristics of innovations vary across sectors and so does the influence of
taxation on the patent location choices, as discussed in section 2.1. Therefore, we adopt a
sectoral approach to our regressions. In particular, we identify three sectors of interest: the car
industry (ICB code 3350), the ICT industry (ICB code 9500) and the pharmaceutical industry
(ICB code 4570), together with their subsectors. Patent applications pertain to different
technological fields.25
Globally, in our full sample, chemistry counts for close to a quarter of
all applications, very closely followed by electrical engineering; about a fifth of all
applications are related to mechanical engineering and instruments. The remainder, ‘other
fields’ counts for the remaining 9% of patent applications. Their repartition, however, differs
widely across sectors. As shown in table 3, each sector focusses mainly on one specific
technology field, but not exclusively. In the car industry, 63.98% of the 88,826 patent
applications are related to mechanical engineering technology. In the ICT sector, electrical
engineering accounts for 81% of all applications and in the pharmaceutical sector, chemistry
has the lion’s share with 79.5%. These differences justify a sectoral approach.26
In our regressions, the Statutory corporate income tax is, unsurprisingly, the statutory
CIT rate applicable in the country, including surcharges. We logically expect this variable to
have a negative and significant effect on the number of patents. Next, Tax advantage in
patent box (T) defined by equation 3 is a variable capturing the tax reduction offered under
the patent box regime compared with the normal CIT rate. Hence, we expect this later
variable to exert a positive and significant effect on the number of patent applications.
Finally, the Non-tax effect of patent boxes (NT) is a dummy taking the value 1 when a patent
22
The EU Industrial R&D Investment Scoreboard sample is assembled by the Joint Research Centre of the
European Commission. For more information on the sample of firms included in the R&D Scoreboard, see
http://iri.jrc.ec.europa.eu/scoreboard.html. 23
PATSTAT is the European Patent Office’s Worldwide Patent Statistical Database, which contains data about
70 million applications from more than 80 countries. See more details at http://www.epo.org. 24
Overall, in 2012 the top R&D investors controlled more than 500,000 subsidiaries (defined as firms more than
50% owned by the parent), including ‘branches’, which account for about 34% of all subsidiaries. Patent
applications have been aggregated at the group level. A more extensive description of the approach used to
perform the matching between Orbis and PATSTAT can be found in Dernis et al. (2015). For a description of
Imalinker, see http://www.idener.es/?portfolio=imalinker. 25
The Industry Classification Benchmark (ICB) is a classification widely used by stock exchanges such as the
NASDAQ and the NYSE. 26
Moreover, to ensure consistency, our econometric estimations are run considering only the patents registered
under the most frequent technology by sector.

IPTS WORKING PAPER ON CORPORATE R&D AND INNOVATION – NO.6/2015 PATENT BOXES DESIGN, PATENTS LOCATION AND LOCAL R&D
11
box regime is in force in the potential country of patent application. Combined in the same
regression with the Tax advantage in patent box (T), the dummy variable (NT) captures all
the non-tax (positive or negative) influence of patent boxes on patent applications. Starting
with only two regimes in 2000 (France and Ireland), the number of patent boxes has
increased and reached 10 by 2011 (Belgium, China, France, Hungary, Liechtenstein,
Luxembourg, Malta, Switzerland, Spain and The Netherlands).
Other variables have influence on patent applications. We control for the size of the
market measured by the log of GDP (in Euros) of the country of potential application by the
variable GDP level. The innovation potential of the country is captured by private business
R&D expenditures in percentage of GDP, Business R&D/GDP. A high level of IP protection
in the legislation is captured by the index variable IP protection. For this variable, we take a
widely used index developed by Ginarte and Park (1997) and subsequently updated by Park
(2008). Finally, Real Research Activity measures whether or not any of the inventors of a
given patent reside in the country where the patent is registered according to the Patstat
database. Since we use a count model, the Real Research Activity is measured by the number
of patents where at least one of the inventors resides in the country where the patent was
registered, as a percentage of the total number of patents registered in that country by a given
firm. All four controls variables also used by Griffith et al (2014), are expected to exert a
positive effect on patent applications.
Table 4 provides summary statistics on the dependent and exogenous variables for the
estimation samples used to run our base regressions. The average value of the patent count is
nearly 20 times lower than its standard deviation in all three sectors, illustrating the skewness
of the dependent variable. The explanatory variables display similar means and standard
deviations across sectors as these are country-specific. The level of IP protection, GDP and
business R&D also display low variability compared with the tax advantage and non-tax
patent box effects, reflecting the fact that, over the period considered, countries have
increasingly used patent boxes, thereby reducing their effective CIT rate to attract patenting
activities.
5. Results
We first run our basic regression separately for the three sectors of interest. The results
are reported in Table 5. In the sequel we discuss our basic results of estimating the effect of
the patent box regimes and the related fiscal advantage on the number of patents for a set of
33 countries. We then extend our analysis to the influence of patent quality and patent box
characteristics. Finally, we provide results on the influence of patent boxes on local research
activity, highlighting in particular the effects of patent box characteristics, which define the
conditions under which patent box regimes apply.

IPTS WORKING PAPER ON CORPORATE R&D AND INNOVATION – NO.6/2015 PATENT BOXES DESIGN, PATENTS LOCATION AND LOCAL R&D
12
5.1. Patent boxes and the fiscal advantage of patent box regimes
Table 5 reports separate results for each of the sectors. All regressions contain country
and time fixed effects, on top of our four control variables (GDP level, Business R&D/GDP,
IP protection and Real Research Activity). Given that our dependent variable is defined on a
country-level basis and that the patent count variable is defined at firm level, we also cluster
our observation at the country level, following Moulton (1990). IP protection and Real
Research Activity both have, as expected, a large positive and significant effect on patent
location. The level of business R&D in relation to GDP seems to have no significant effect,
appearing at best small and only significant at the 10% level in only a few regressions.
Finally, the log of GDP has contrasted effects. It appears to exert a strong and significant
positive effect for the pharmaceutical sector and to some extent for ICT. The effect is,
however, mainly negative for the car industry, which may be due to the absence of US
leadership and a high geographical concentration of patents,27
despite the presence of country
dummies.
In all three sectors, the effective CIT rate exerts the expected negative effect on the
location of patents as shown in column 1. This effect is always significant at the 1% level. In
the first three columns, we estimate the model with the effective CIT rate, i.e. the tax rate
incorporating the effect of patent boxes whenever these apply in a given country/year. As in
the previous literature, we find that this effective CIT rate has a negative and significant
effect on the probability of choosing a specific country for registering a patent. The
(unreported) marginal effects on the estimated coefficients are equal to -13.1%, -1.5% and -
5.4% for the pharmaceutical, ICT and car industries respectively.
Our approach allows us to go one step further and decompose the tax effects into the
effects of the standard CIT rate and the effect of the patent box tax benefit. The tax advantage
offered by the patent box regime comes with a significant positive effect in all three
regressions 4-6. This is the expected effect. However, to determine the full effect of patent
boxes one should also account for the non-tax characteristics of patent boxes implemented in
each country that grants a tax rebate on IP-related revenues. These come out as negative and
highly significant, potentially reflecting the compliance and administrative costs linked to
patent boxes. When calculating the marginal effects in these regressions, we find that, for
each percentage point reduction in the CIT rate thanks to the patent box, the likelihood of
registering a patent in the country concerned will rise by 10.4%, 7.6% and 17.5% for the
pharmaceutical, ICT and car industries respectively. The effect of patent boxes is therefore
economically significant.
To determine the global effect of patent boxes on patents location, it is important to recall
that in non-linear models - such as the negative binomial used here - the marginal effects are
sensitive to the baseline values given to all variables. This is particularly relevant in our case
given that the effect of a patent box regime mainly depends on the tax rebate offered, which
is itself often a percentage of the CIT rate and on the conditions under which this tax rebate
applies, i.e. the non-tax patent box characteristics. To account for the full effect of patent box
27
In our sample, the top three patent locations for the car industry (DE, JP, US) represent 83.0% of cases,
compared to 69.7% in the pharmaceutical sector and 66.7% in the ICT sector.
IPTS WORKING PAPER ON CORPORATE R&D AND INNOVATION – NO.6/2015 PATENT BOXES DESIGN, PATENTS LOCATION AND LOCAL R&D
13
regimes we need to consider both components together. As just mentioned, marginal effects
are estimated by default at the average value of all control variables, including the tax
variables. However, the baseline value of a control for a specific category of observations
frequently differs from the baseline value for the entire sample. For example, the average tax
advantage of patent boxes is in reality about 17 percentage points but it drops to 2.7
percentage points when we consider the whole sample, including observations without a
patent box, for which this advantage is therefore zero. The average value of 2.7 percentage
points is even well below the observed lowest tax advantage in our sample (bar the zeros),
that is 8.8 percentage points. In addition, a company may choose to set up a subsidiary in a
given country primarily to reduce its overall tax bill by shifting patent registration there, but it
might also consider the level of the CIT rate applying to revenues other than patents. It is
therefore important to consider alternative cases where the tax reduction and the starting level
of the CIT rate depart from their average value.
As can be seen in columns 4-6 of Table 5 the coefficient of the non-tax patent box
characteristics variable is negative and significant. This variable measures the effect of
treating firms differently through a patent box regime without changing the average tax rate.
Estimating this effect at the average value of the explanatory variable for the whole sample
gives little information, since the very existence of a patent box regime implies that a fiscal
advantage is offered. Hence, the marginal effect of the tax advantage of the patent should be
calculated at the average value for observations for which a patent box is in place and not at
the average value for the whole sample.
A more general concern about the estimation of marginal effects of interaction effects in
non-linear model lies in the fact that the marginal effect cannot be directly determined by the
first derivative of the expected value of the dependent variable with respect to the interaction
term. The marginal effect should be instead calculated as the cross partial derivative of the
dependent variable with respect to each interacted variable separately in order to interpret it
correctly. A very practical solution is to calculate the incidence ratio. The marginal effect of
the interaction term between the tax rebate and the dummy variable dj,t can be interpreted
directly as a measure of the differential impact of the tax rebate due to the presence of a
patent box regime. Calculating the incidence ratio, one can infer the marginal effects of
multiplicative terms directly.28
Using this approach, we also look into the effect of predicted change in the number of
patent at various levels of corporate tax rebate in the patent box regimes at average (i.e. 32%)
and high (i.e. 51.6%) levels of the CIT rate. The results of these simulations are reported in
28
In particular the marginal effects of an interaction term provided by the statistical software will be the
marginal effect of the interaction term calculated at the average sample value for both elements of the
interaction on the expected value of the number of patents ∂E(#patents)
∂(dj,t∗T) where dj,t stands for the patent box
dummy variable and T is the tax advantage in the patent box regime. In reality, the average tax advantage
conditional on having a patent box is higher than for the total sample (which includes the cases for which there
is no patent box). Hence, the marginal effect is not calculated at the right reference point. We are instead
interested in the marginal effect of the patent box on the marginal effect of the tax advantage on the expected
number of patents, that is ∂ (
∂E(#patents)
∂T)
∂dj, t⁄ . We are particularly thankful to Marteen Buis for very helpful
discussion on this point.

IPTS WORKING PAPER ON CORPORATE R&D AND INNOVATION – NO.6/2015 PATENT BOXES DESIGN, PATENTS LOCATION AND LOCAL R&D
14
Figure 2. We consider tax rebates up to 30 percentage points. As can be seen in this case, the
predicted change in the number of patents registered increases substantially once the tax
advantage reaches high levels, i.e. beyond 20% and it does so at growing rates. Considering
average values of the tax rebate (17%) and the observed values of the patent count by
sector/year, we find that the predicted change in the number of patent for the average CIT
rate varies between the 4.4% for the pharmaceutical industry and the 31.8% for the ICT one.
Interestingly, the larger marginal impact is found for average rather than high starting CIT
values, reflecting the fact that, for the former, the relative change in CIT brought by the
patent box is often greater in relative terms. In addition, the ICT sector appears to benefit the
most from patent boxes in the case of large corporate tax rebates, followed by the car
industry. The difference between the high and average tax scenarios is also most marked for
the car industry. By contrast, the percentage change in the number of patents registered,
although also positive and larger in the average CIT scenario, is also sensibly lower in the
case of the pharmaceutical industry.
As a robustness check, we also estimate our model by analysing whether or not firms
could respond heterogeneously to the tax advantage offered by patent boxes. We therefore
run the mixed-effects version of the negative binomial model by estimating the random
effects. The last three columns of Table 5 report the results of the mixed negative binomial
estimation with a random effect estimated for the tax advantage variable. These results are
qualitatively similar to the ones obtained with the negative binomial model. We now find a
slightly lower coefficient for the tax advantage in the pharmaceutical industry and a
significantly higher coefficient in the ICT and car industries. More interestingly, the random
term on the tax advantage displays a significant coefficient in the ICT and car industry. This
coefficient is not significantly different from zero in the pharmaceutical industry, however.
The random components are, nonetheless small, indicating that, although firms may indeed
be heterogeneous in terms of their reaction to tax rebates on patent boxes, this heterogeneity
is small compared with the average effect of patent boxes (i.e. the so-called fixed effect in the
mixed-model terminology). The fact that our regressions are estimated for each sector
separately can explain this result because, within each sector, firms are more homogeneous in
terms of technologies used and importance of the fiscal dimension for research activities. In
the extensions of our empirical analysis presented in the following sections, we will use the
negative binomial model without the random term, which is also computationally less
demanding, since the model with the random effect does not appear to modify our results
significantly.
5.2. Patent quality
Innovation outcome distributions are highly skewed with major innovations capturing the
lion's share of value creation (Scherer and Harhoff, 2000). Patent quality can serve as a proxy
for innovations with high earning potential, the holy grail of innovation policy. The role
played by ideas and patent quality is therefore quite fundamental in the analysis of patent
boxes. The motives for different patent registration choices are likely to be correlated within
ideas, and so is the potential influence of tax determinants, since firms are likely to decide on
the geographical registration of their patent portfolio strategically, depending on the market
IPTS WORKING PAPER ON CORPORATE R&D AND INNOVATION – NO.6/2015 PATENT BOXES DESIGN, PATENTS LOCATION AND LOCAL R&D
15
potential of new ideas embedded in patents. Griffith et al. (2014) use a group variable based
on the simultaneity between industry and the network of inventors of patents registered by a
single firm to identify idea membership. Such a measure could, nevertheless, be regarded as
somewhat restrictive, since it excludes patents registered by different firms but relating to the
same idea or invention, as well as patents relating to the same idea or invention but registered
at different times. There are also two reasons for using an alternative measure of patent
quality. First, competing firms are also likely to compete for similar ideas. Second, firms may
attempt to protect ideas or to generate revenues from a given idea by registering patents at
successive times. To account for these possibilities, we use instead an indicator variable
based on the information provided by the International Patent Documentation, i.e. the so-
called INPADOC family group, produced by the European Patent Office. The INPADOC
family groups indicate if a given patent registration corresponds to the same priority and
invention. Using information based on INPADOC membership is likely to provide an
accurate measure of the quality of the patent given that it is not exclusive in terms of the time
of registration and firm ownership of the patent. We defined high-quality patents as those
belonging to the top quartile by sector in terms of INPADOC family size. In line with our
approach, patent’s family size is also a preferred quality measure of Böhm et al (2014). In
Figure 2, we report the weighted average of the statutory and effective tax rates (i.e. including
the patent box rebate whenever in place), using as weight the total number of patents
registered. As one can see, high-quality patents tend to be located in countries with lower
corporate taxation and with a larger gap between the standard CIT rate and the effective tax
rate. This descriptive evidence thus suggests that firms have exploited the tax advantage
offered by patent boxes especially for high-quality patents.
To confirm these results, we have run regressions separately for high-quality patents,
defined as patents belonging to the top quartile in terms of patent family size as defined
above, and compared the results with the regressions covering the remaining patents. The
results of these additional regressions are reported in Table 6. The effects of both the
statutory CIT rate and the tax advantage in the patent box regime are different between the
two groups of regression. The coefficients obtained for the statutory CIT rate are lower for
high-quality patents, and the tax advantage coefficients are always larger, although not
always clearly so. Since these additional regressions are run over different sample sizes, we
have tested the significance of the difference in the coefficients estimated using a Wald test.
The results of these tests are reported in the last row of Table 5 showing that the null
hypothesis of equal coefficients can be rejected at 99% confidence levels. These results
therefore suggest that high-quality patents tend to be significantly more sensitive to taxes.
5.3. Patent box characteristics
Next, we are interested in whether or not the specific characteristics of patent boxes have
an effect on patent location and whether these effects vary across sectors. Given the high
multicollinearity in some of the patent box characteristics reported in Table 2 not all these
characteristics were included in the regression. To test the effects of characteristics, we have
identified five dimensions of patent boxes and we add dummy variables reflecting these
specific features of the patents as described in Tables 1 and 2. These regressions are run

IPTS WORKING PAPER ON CORPORATE R&D AND INNOVATION – NO.6/2015 PATENT BOXES DESIGN, PATENTS LOCATION AND LOCAL R&D
16
conditionally to the existence of the patent box regime, i.e. they are run for countries/years in
which a patent box regime was in place. In doing, so we can interpret our estimates in terms
of marginal effect of a given patent box characteristic for a baseline average effect of the
patent box as presented in Table 5.
The first set of characteristics considered are dummy variables respectively for whether or
not acquired patents, embedded royalties and existing patents (i.e. patents prior to the
creation of the patent box) qualify for the tax advantages of patent boxes. The results of these
regressions are reported in the first three columns of Tables 7-9 for each sector separately.
We focus on the coefficient obtained on the tax advantage interacted with the specific patent
box characteristic without making any inference on the separate dummy variables, since, as
discussed earlier, such discussion is best made for other than average values of the control
variables. We find the tax advantage in the acquired patents characteristics to be positive and
significant in all three sectors. The tax advantage in the embedded royalties is positive and
significant for the ICT and car industries, while the existing patents condition is positive and
significant for the pharmaceutical and car industries. Taken at the average value of the tax
advantage, we find that these characteristics still exert a positive effect on patent location. We
also find that for the car industry the tax advantage in the existing patents condition is
negative and significant, which might reflect the dominant role played by large car producers
with high patenting activity, such as Germany and Japan, where strategic market
considerations might prevail over tax advantage when deciding about the location of a patent
registration.
Next, in regressions 4 of Tables 7-9, we look at the effect of having patent boxes offering
a tax advantage to a larger range of rights than just patents (see Table 1 for details). The tax
advantage of these patents is positive and significant for all three sectors with large
coefficients. Finally, in regressions 5 of the tables, we consider the role played by
development conditions whereby countries grant tax rebate conditional on R&D activities
being developed within the country. Controlling for the development conditions dummy
variable makes the tax advantage to be insignificant in the ICT and Car sectors, while it
makes it negative and significant for the Pharmaceutical sector. The effect of development
condition thus appears to be rather heterogeneous across sectors. Compared with the general
tax effect of patent boxes, such development conditions does not seem to affect the number of
patents registered in the ICT and Car industries and decreases it in the Pharmaceutical
industry.
5.4. Effects of patent boxes on real activity
We now consider the interaction between patent box regimes and local innovative
activity. In particular, we are interested in testing two arguments put forward in the patent
box debate: (i) to what extent the tax rebate granted by a patent box is effectively promoting
local inventorship, as this is an often advocated justification for granting preferential tax
treatment; and (ii) the effectiveness and strength of development conditions in ensuring that
the link between the tax rebate and the underlying research activities is effectively delivering.
We test the influence of patent box regimes and development conditions on local

IPTS WORKING PAPER ON CORPORATE R&D AND INNOVATION – NO.6/2015 PATENT BOXES DESIGN, PATENTS LOCATION AND LOCAL R&D
17
inventorship by considering whether the patent registration leads to an increase in the number
of inventors in the country of registration while the number of inventors in the parent country
decreases or remains constant. This indicator is used as dependent variable whereby a value
equal to 1 would indicate that the real activity has been actually moved to the patent box
country. Indeed, although we do not observe whether the inventors actually move from one
country to another, we can reasonably assume that such simultaneous rise and fall in the
number of inventors in two different parts of the (company) group indicates an inventor shift.
These regressions are performed at the company-level. Given that in this case we have a
binary variable taking values of 1 or 0, we estimate our model through logistic regressions.
As control variables, we use the same as the previous specifications with two exceptions. On
the one hand, we first remove the real activity variable as this variable could be endogenous
in this specification. We then check if including this dummy back in the regression alters our
results. On the other hand, we include a binary variable indicating the presence of
development conditions in the patent box regime.
The results of these estimations are reported in Table 10. Columns 1-3 provide the results
from the logistic regressions on the probability of actually performing an inventor shift
without controlling for the real activity variable. Columns 4-6 provide the results of the
specification controlling for the real activity variables. Results are similar in both
specifications: the CIT and tax advantage in the patent box regime display negative and
significant coefficients with similar values in each specification. These results suggest that
the tax advantage linked to the patent box does decrease the probability of moving inventors
to the patent box country. The fiscal advantage of patent boxes thus tends to deter local
inventorship rather than favor it. These results suggest that firms could be principally
interested in the tax rebate when registering a patent in a country with a patent box regime,
rather than in setting (extending) R&D facilities there. However, the presence of a
development condition has a strong effect in reversing this tendency. Countries including a
specific local development condition have a higher probability of experiencing an inventor
shift in their favor, as reflected by the positive and significant coefficient attached to the
development condition variable. This result also holds independently of controlling for the
local research activity variable.
The tax advantage and the development conditions thus tend to have opposite effects.
Their combined impact on inventor shifting is likely to depend on the corporate tax rebate
offered and the specific firm/sector patenting activities. To quantify the importance of each of
these elements we proceed to simulate the predicted probability of inventor shifting in the
presence and absence of R&D development conditions for each sector of activity and
considering different levels of tax advantage. Figure 4 illustrates the results of these
simulations whereby the marginal effect of development condition is calculated as the
difference between the predicted probability of having an inventor shift for countries with a
development condition and the same probability for countries that do not include such a
condition in their patent box regimes. We base our simulation on the specification including
the Real research activity variable (unreported results without this variable display very
similar results). At the sample average tax rebate (17.8%) indicated by the discontinuous
vertical line in Figure 5, the probability to observe inventor shift between the home and the

IPTS WORKING PAPER ON CORPORATE R&D AND INNOVATION – NO.6/2015 PATENT BOXES DESIGN, PATENTS LOCATION AND LOCAL R&D
18
host country increase by order of 60%, 45% and 30%, for the car, pharmaceutical and ICT
industries respectively. The overall impact of development conditions is always positive in all
scenarios of tax rebates: it varies between 37.6% and 48.4% for the car industry, between
34.1% and 43.9% for the pharmaceutical industry and between 19.2% and 32.2% for the ICT
sector. It interesting to note that the maximum impact of the local development conditions is
reached at lower values of the tax rebates, i.e. at 12% for the car industry, 9% for
pharmaceutical and at 1% for the ICT sector. These results would suggest that the optimum
tax rebate is likely to be lower than the actual average tax rebate in presence of R&D
development conditions. Under the assumption that a government objective is to minimise
the fiscal loss and to maximise the local R&D impact, our results would indicate that, when
development conditions are included under a patent box regime, the tax breaks offered tend
on average to be slightly larger than the optimal level.
6. Conclusions
This paper analyses how the implementation of patent boxes affects the patent-filing
strategies of top corporate R&D investors across countries. For this, we use a recent and rich
firm-level dataset for the 2000-2011 period on the top 2,000 corporate R&D investors
worldwide, considering their ownership structure, and analyse the determinants of patent
registration across a large sample of countries. For the first time, we disentangle the effect of
three key characteristics of patent boxes: the corporate income taxation; the tax advantage of
registering patents in a patent box country; and other characteristics of the patent boxes that
define both their scope (i.e. the tax base) and non-fiscal characteristics such as local R&D
development conditionality. Patent boxes exert a strong effect on attracting patents, mostly
due to the specific favourable tax treatment that they bring about. However, this effect varies
across sectors and with the specific characteristics of the patents. High-quality patents are
shown to be more influenced in their location choices by the tax advantage offered by patent
boxes than patents of lower quality. The possibility to grant the patent box tax regime to
patents that have been acquired, existed previously or contain embedded royalties seems to
make patent location even more sensitive to the tax advantages offered by patent boxes. The
same can be said of patent boxes broadening their scope to other rights such as trademarks,
design and models, copyrights or domain names. Our results also suggest that in the majority
of cases, the existence of a patent box regime incentivises multinationals to shift the location
of their patents without a corresponding growth in the number of inventors or a relocation of
R&D activities. We find that the size of the tax advantage is negatively correlated with the
local R&D. This suggests that the effects of patent boxes are mainly of a tax nature.
An interesting development of patent boxes concerns the possibility of imposing
development conditions for the patent to qualify for the advantageous tax regime. This is the
case in several countries. These conditions provide a proxy for the possible effect of
conditionality clause discussed at the EU and OECD, i.e. the so-called nexus approach. Our
results show that such specific condition appears to dampen the dominant effects of the tax
advantage of the patent box regime on patent locations while encouraging local inventorship.

IPTS WORKING PAPER ON CORPORATE R&D AND INNOVATION – NO.6/2015 PATENT BOXES DESIGN, PATENTS LOCATION AND LOCAL R&D
19
In addition, our simulation suggests that the optimal preferential tax treatment offered to
patent registration could be lower than its current average value (17.8%). This would
optimise the impact of patent box regimes on local R&D activity, provided that such
development conditions are in place. Future challenges, such as the need to reach a common
agreement on the definition and measurement of R&D activities as well as their link to
patenting activities, will of course emerge in case such clauses are implemented.
Patent boxes are a relatively recent development among the tools offered to companies to
boost R&D activities. They have been criticised for offering additional tax advantages to
income already profiting from an IP protection and having potentially little effect on the level
of R&D. Their development has raised concerns over the fact that they could exert a
significant effect on patent location without any change in the real research activity, targeting
only the tax benefits. Our results confirm these fears, with the tax attractiveness of patent
boxes being greater the broader their scope. Recent debates on the potentially harmful
consequences of patent boxes have addressed the possibility of linking the advantages of
patent boxes to the requirement of a real research activity by the taxpaying company
receiving the tax benefits. Our results suggest that it has the potential to decrease the still
dominant tax effects of patent boxes on patent location and to raise the level of local
inventorship. The nexus approach therefore offers some potential to mitigate the role of
patent boxes as new tax competition tools.

IPTS WORKING PAPER ON CORPORATE R&D AND INNOVATION – NO.6/2015 PATENT BOXES DESIGN, PATENTS LOCATION AND LOCAL R&D
20
References
Arundel, A. (2001), The relative effectiveness of patents and secrecy for appropriation, Research Policy,
30(4): 611-624.
Balasubramanian, N. and J. Sivadasan (2011), What Happens When Firms Patent? New Evidence from U.S.
Economic Census Data, The Review of Economics and Statistics, 93(1): 126-146.
Becker, B. and N. Pain (2008), What Determines Industrial R&D Expenditure in the UK?. Manchester
School, 76(1): 66-87.
Becker, J. and C. Fuest, 2007. Quality versus quantity — the composition effect of corporate taxation on
foreign direct investment. CESifo Working Paper Series 2126.
Becker, J., Fuest, C. and N. Riedel (2012), Corporate Tax Effects on the Quality and Quantity of FDI,
European Economic Review, 56(8): 1495–1511.
Blind, K., Edler J., Frietsch, R., Schmoch, U. (2006). Motives to patent: Empirical evidence from Germany,
Research Policy 35: 655–672.
Bloom, N., R. Griffith and J. van Reenen (2002), Do R&D Tax Credits Work? Evidence from a Panel of
Countries 1979-1997, Journal of Public Economics 85: 1-31.
Bloom, N. and R. Griffith (2001), The Internationalisation of UK R&D, Fiscal Studies 22 (3): 337-355.
Böhm, T., Karkinsky, T. and N. Riedel (2014), The Impact of Corporate Taxes on R&D and Patent
Holdings, mimeo.
Buettner, T. and M. Ruf (2007), Tax Incentives and the Location of FDI: Evidence from a Panel of German
Multinationals, International Tax and Public Finance 14: 151-164.
Council of the European Union, Code of Conduct (Business Taxation)- Draft Report to the Council, doc
16100/14, FISC 216, ECOFIN 1105,2014.
CPB (2015), "Study on R&D Tax Incentives", Taxation Papers, 52.
Dernis H., Dosso M., Hervás F., Millot V., Squicciarini M. and Vezzani A. (2015). World Corporate Top
R&D Investors: Innovation and IP bundles. A JRC and OECD common report. Luxembourg: Publications
Office of the European Union.
Desai, M. A. and J. R. Hines (2002), Expectations and Expatriations: Tracing the Causes and Consequences
of Corporate Inversions, National Tax Journal, 55(3): 409-40.
Devereux, M.P., Lockwood, B. and M. Redoano (2008), Do Countries Compete over Corporate Tax Rates?,
European Economic Review, 92(5-6): 1210-1235.
Dischinger, M., and Riedel, N. (2011), Corporate taxes and the location of intangible assets within
multinational firms. Journal of Public Economics 95: 691–707.
Ernst, C. and C. Spengel (2011), Taxation, R&D Tax Incentives and Patent Application in Europe, Centre
for European Economic Research, ZEW Discussion Paper, No.11-024.
Ernst, C., K. Richter and N. Riedel (2014): Corporate taxation and the quality of research and development,
International Tax and Public Finance 1-26.
European Commission (2013). The 2013 EU Industrial R&D Investment Scoreboard, Luxembourg:
Publications Office of the European Union.
European Commission (2014a), EU R&D Scoreboard, The 2014 EU Industrial R&D investment scoreboard,
Institute for Prospective Technological Studies, Joint Research Centre, European Commission.
European Commission (2014b), Taxation Trends in the EU, Brussels.
Evers, L., Miller, H. and C. Spengel (2014), Intellectual Property Box Regimes: Effective Tax Rates and Tax
Policy Considerations, International Tax and Public Finance,1-29.
Financial Times, 12 March 2014, Tanya Powley: “Aerospace and automotive are UK manufacturing’s star
performers”.
Financial Times, 29 April, 2014, Vanessa Houlder, “Patent box holds key of Pfizer-AZ deal’s attraction”.
Fuest, C., Spengel, C., Finke, K., Heckemeyer, J.H. and H. Nusser (2013), Profit Shifting and “Aggressive”
Tax Planning by Multinational Firms: Issues and Options for Reform, World Tax Journal (3).
Garnier, G. , Gyorgy, E., Heineken, K, Mathe, M., Puglisi, L., Rua, S., Skonieczna, A. and A. Van Mierlo,
(2014) A Wind of Change? Reforms of Tax Systems since the Launch of Europe2020, Reflets et Perspectives de
la Vie Economique, 53(2): 75-111.
Ginarte, J.C., Park,W.G., (1997). "Determinants of patent rights: a cross- national study", Research Policy
26: 283–301.

IPTS WORKING PAPER ON CORPORATE R&D AND INNOVATION – NO.6/2015 PATENT BOXES DESIGN, PATENTS LOCATION AND LOCAL R&D
21
Greenhalgh and Rogers. (2010). Innovation, Intellectual Property, and Economic Growth. Princeton
University Press.
Griffith, G., H. Miller and M. O'Connell (2014), "Ownership of intellectual property and corporate taxation",
Journal of Public Economics 112: 12-23.
Hall, B. H. and D. Harhoff (2012), Recent Research on the Economics of Patents, Annual Review of
Economics, 4(1): 541-565.
Hall, B. H., Lotti, F. and J. Mairesse (2013), Evidence on the impact of R&D and ICT investments on
innovation and productivity in Italian firms, Economics of Innovation and New Technology, 22(3): 300–328.
Hall, B. H., Lotti, F. and J. Mairesse (2014), The Choice between Formal and Informal Intellectual Property:
A Review, Journal of Economic Literature 2014, 52(2): 375–423.
Hanel, P. (2008), “The use of intellectual property rights an innovation by manufacturing firms in Canada”,
Economics of Innovation and New Technologies, 17: 285-309.
Scherer, F. M, Harhoff, D. (2000). Technology policy for a world of skew-distributed outcomes, Research
Policy, 29: 559-566.
Kamran, L (2014). Patent Laws, Product Life-Cycle Lengths, and Multinational Activity. American
Economic Review 2014, 104(7): 1979–2013.
Karkinsky, T. and N. Riedel (2012), Corporate Taxation and the Location of Patents within Multinational
Firms, Journal of International Economics, 88(1): 176-185.
Moulton, B. R. (1990). An illustration of a pitfall in estimating the effects of aggregate variables on micro
units. The Review of Economics and Statistics, pp. 334-338.
Obuoforibo, B. (2013), The technical aspects of the UK patent box rules, European Taxation, 53(10): 1-11.
OECD (2014), Countering Harmful Tax Practices more Effectively, taking into account Transparency and
Substance, OECD/G20 Base Erosion and Profit Shifting Project, Action 5
OECD (2015a), OECD Tax Database.
OECD (2015b) Action 5: Agreement on Modified Nexus Approach for IP Regimes. OECD/G20 Base Erosion
and Profit Shifting Project.
Park, W.G. (2008), "International patent protection: 1960–2005", Research Policy: 37(4): 761-766.
Peeters, C. and B. van Pottelsberghe (2006), Innovation strategy and the patenting behavior of firms, Journal
of Evolutionary Economics, 16(1): 109-135.
Rabe-Hesketh, S., and A. Skrondal. (2012), Multilevel and Longitudinal Modeling Using Stata. 3rd ed.
College Station, TX: Stata Press.
Sanz-Gómez, R., (2015), " The OECD’s Nexus Approach to IP Boxes: A European Union Law Perspective",
WU International Taxation Research Paper 2015 - 12, Wien University.
Schellekens, M. (2013), The Netherlands as an Innovation Hub: An Appraisal of the Innovation Box Regime.
European Taxation, 2013 (Volume 53), No. 10
Siedschlag, I., Smith, D., Turcu, C. and X. Zhang (2013), What determines the location choice of R&D
activities by multinational firms? Research Policy 42: 1420– 143.
Squicciarini, M. and H. Dernis (2013), "A Cross-Country Characterisation of the Patenting Behaviour of
Firms based on Matched Firm and Patent Data", OECD Science, Technology and Industry Working Papers
2013/05, Organisation for Economic Cooperation and Development, OECD, Paris.
Van der Made, B. (2014), Update on the EU Code of Conduct Group, International Tax Review, 26 February
2014, http://www.internationaltaxreview.com/Article/3313023/EU-Update-on-the-EU-Code-of-Conduct-Group-
Business-Taxation.html
Van der Made, B. (2015), Update on the EU Code of Conduct Group, International Tax Review, 24 February
2015, http://www.internationaltaxreview.com/Article/3430573/EU-Update-on-patent-boxes-and-the-EU-Code-
of-Conduct-Group-Business-Taxation.html
Wilson, J.D. (1986), A theory of interregional tax competition, Journal of Urban Economics, 19(3): 296-
315.
Wilson, J.D. (2009), Beggar Thy Neighbor? The In-State, Out-of-State, and Aggregate Effects of R&D Tax
Credits, The Review of Economics and Statistics 91(2): 431-436.
Zodrow, G.R. and P. Mieszkowski (1986), Pigou, Tiebout, property taxation, and the underprovision of local
public goods, Journal of Urban Economics, 19(3): 356-370.

IPTS WORKING PAPER ON CORPORATE R&D AND INNOVATION – NO.6/2015 PATENT BOXES DESIGN, PATENTS LOCATION AND LOCAL R&D
22
Table 1: Coverage of patent boxes by country in 2014
Sources: European Commission
Table 2: Patent box characteristics
Sources: European Commission
Table 3: Technology field of patent applications by sector 2000-2012
Chemistry Electrical
engineering Instruments
Mechanical
engineering Other fields Total
Cars 8.82% 17.25% 8.48% 63.98% 1.46% 88,826
ICT 4.14% 81.01% 9.82% 4.77% 0.26% 165,187
Pharma 79.50% 1.63% 17.11% 1.60% 0.16% 75,859
Total
applications 74,982 150,380 36,737 65,920 1,853 329,872
Sources: European Commission, Patstat and OECD
NL BE LU FR PT China UK ES HU MT CH (NW) CY LI
Patents and associated patent rights
Trademarks
Designs and models a)
Copyrights a) c) c) c) d)
Domain names
Trade secrets /know-how a) b) b)a) Only if R&D declaration
b) Know-how (BE) /in dustrial processes (FR) closely associated with patents
c) Only software
d) Only artistic
Yes , with restrictions :No:
Yes :Colour codes :
FR HU NL BE LU ES MT CY UK PT LI CH IE China
Top corporate income tax rate (TTR
2014)38 20.6 25 34.00 29.2 30 35 12.5 21 31.5 12.50
8.5% (+
6% 12.5 25
Effective tax rate on patent income
within the patent box (calculated on
top CIT rate with surcharges)
15.5 (16.245 %
2011-2015)10.300 5.000 6.798 5.840 12.000 0.000 2.500 10.00a) 15.750 2.500 8.800 0.000 15.000
Year introduced 1971 2003 2007 2007 2008 2008 2010 2012 2013 a) 2014 2011 2011 1973 2007
(changed) (2012) (2010) (2013) (2008)
Only patents and rights associated with
patents
Applicable to existing IP
Applicable to acquired IP b) c)* c)
Authority granting the IP right d) d) d*) d) d)
Development condition
Capital gains included? f) e)
Income from the sale of innovative
products (embedded royalties)na
Can R&D be performed abroad (or
within a group)?g) h) j) i) k) o) l)
Cap
Other major tax reforms that could
affect the location decision
CIR 2008 CICE
2013 & 2014ACE 2006
Interest
barrier
rules
2012;
Gradual
decrease in
CIT rate
from 28% in
2010 to 20%
in 2015
Interest
barrier rules
2013; major
CIT reform
2013/14
Abolished
2010Major CIT
reform in
2007
a) Phased in ti l l 2017, see deta i l s below
b) Must be held for at least two years . Anti -avoidance rules for intragroup exploi tation of IP rights .
c)* i f ful ly or partia l ly improved c) If further developed and actively managed Colour codes:d) Has to be regis tered at the national IP office/d* granted by UKIO or EPO
e) If between unrelated parties .
f) Exempted i f held for at least one year or used to buy other IP.
g) Covers patents developed within a group when managed and coordinated in the NL. Sources: h) If in a qual i fying R&D centre. IBFD; ZEW (2013); TRR (2014); PWC (2013); ACCA (2013); Cao (2011); National legislation and reports by PWC, Deloitte and KPMG .i ) If active ownership, and sel f-developed.
j) If sel f-developed.
k) double tax rel ief l imited to 50%
l ) at elast 60% done in China
m) l imited to EEA s ince 2008
Yes:Yes, with restrictions:No:

IPTS WORKING PAPER ON CORPORATE R&D AND INNOVATION – NO. 6/2015 PATENT BOXES DESIGN, PATENTS LOCATION AND LOCAL R&D
23
Table 4: Summary statistics – base model
car ICT pharmaceuticals
Min Max Mean std. Dev. Min Max Mean std. Dev. Min Max Mean std. Dev.
Patent count 0.000 869.000 1.882 20.104 0.000 1249.000 1.651 25.553 0.000 598.000 1.064 12.534
Effective corporate income tax 0.000 51.612 25.101 10.229 0.000 51.612 25.040 10.211 0.000 51.612 25.031 10.201
Statutory corporate income tax 12.500 51.612 27.821 7.421 12.500 51.612 27.763 7.411 12.500 51.612 27.749 7.407
Tax advantage in patent box (T) 0.000 32.850 2.720 6.868 0.000 32.850 2.722 6.864 0.000 32.850 2.718 6.857
Non-tax patent box effect (NT) 0.000 1.000 0.151 0.358 0.000 1.000 0.151 0.358 0.000 1.000 0.151 0.358
Business R&D / GDP 0.010 4.088 1.235 0.704 0.010 4.088 1.232 0.703 0.010 4.088 1.228 0.701
IP protection 0.000 1.000 0.500 0.500 0.000 1.000 0.500 0.500 0.000 1.000 0.500 0.500
Real research activity 0.000 1.000 0.096 0.294 0.000 1.000 0.081 0.273 0.000 1.000 0.091 0.288
GDP level (log) 7.898 16.289 12.392 1.796 7.898 16.289 12.396 1.794 7.898 16.289 12.397 1.793
Sources: Patstat for patent count; Patstat and OECD for Real research activity; OECD for Business R&D; OECD for GDP; The Taxes in Europe Database, the OECD
tax database and the IBFD database, as well as national ministries of finance websites, for the statutory rates and the patent characteristics; Ginarte and Park (1997),
and Park (2008) for IP protection.

IPTS WORKING PAPER ON CORPORATE R&D AND INNOVATION – NO.6/2015 PATENT BOXES DESIGN, PATENTS LOCATION AND LOCAL R&D
24
Table 5: Basic Regressions
(1) (2) (3) (4) (5) (6) (7) (8) (9)
Model estimated negative binomial negative binomial negative binomial - mixed model
Pharma ICT Car Pharma ICT Car Pharma ICT Car
Effective corporate income tax -0.032** 0.014 -0.058*** - - - - - -
(0.013) (0.014) (0.018) - - - - - -
Statutory corporate income tax - - - -0.141*** -0.015 -0.056** -0.090*** -0.043 -0.037
- - - (0.029) (0.035) (0.028) (0.023) (0.034) (0.025)
Tax advantage in patent box (T) - - - 0.099*** 0.073*** 0.162*** 0.073*** 0.128*** 0.234***
(0.016) (0.017) (0.025) (0.015) (0.024) (0.037)
Tax advantage in patent box
(random effects) - - - - - - 0.000 0.012*** 0.016**
- - - - - - 0.000 0.004 0.007
Non-tax patent box effect (NT) - - - -1.869*** -2.460*** -2.639*** -1.606*** -3.028*** -3.697***
- - - (0.174) (0.210) (0.194) (0.169) (0.255) (0.318)
0.584* 0.036 -0.526 0.603** 0.640* -0.506 0.218 0.518 -0.265
(0.310) (0.407) (0.363) (0.289) (0.375) (0.366) (0.264) (0.323) (0.414)
IP protection 4.995*** 4.793*** 6.074*** 4.886*** 4.957*** 6.103*** 5.057*** 4.970*** 6.166***
(0.181) (0.179) (0.344) (0.162) (0.170) (0.341) (0.199) (0.211) (0.378)
Real research activity 9.341*** 12.856*** 10.378*** 8.738*** 11.475*** 10.171*** 7.291*** 9.537*** 10.261***
(0.176) (0.323) (0.221) (0.168) (0.301) (0.215) (0.153) (0.228) (0.266)
GDP level 2.679*** 0.556 -3.411*** 2.417*** 1.264** -2.611*** 1.064** 1.507** -0.653
(0.540) (0.625) (0.783) (0.563) (0.641) (0.812) (0.538) (0.627) (0.962)
Observations 55,200 75,392 29,792 55,200 75,392 29,792 55,200 75,392 29,792
Chi-square 66,019 51,407 29,584 69,170 54,842 29,183 2,702 2,155 1,540
LR-test 240,200 704,492 247,406 229,065 694,026 244,974 1,387 1,896 680.4
Prob>=chibar2 [0.000] [0.000] [0.000] [0.000] [0.000] [0.000] [0.000] [0.000] [0.000]
Alpha (overdispersion) 23.580 4.100 21.007 22.063 56.787 19.788
(0.028) (0.030) (0.762) (0.631) (1.715) (0.719)
Standard errors in parentheses. *** p<0.01, ** p<0.05, * p<0.1. We use as exposure variable the total number of employees of a company (including its subsidiaries).
Observations are clustered at the host country level.

IPTS WORKING PAPER ON CORPORATE R&D AND INNOVATION – NO.6/2015 PATENT BOXES DESIGN, PATENTS LOCATION AND LOCAL R&D
25
Table 6: High-quality patents
(1) (2) (3) (4) (5) (6)
Model estimated Negative binomial – high quality patents Negative binomial – other patents
Pharma ICT Car Pharma ICT car
high quality patents other patents
Statutory corporate income tax -0.269*** -0.165* -0.221*** -0.069** 0.058* -0.007
(0.044) (0.085) (0.067) (0.035) (0.035) (0.034)
Tax advantage in patent box (T) 0.163*** 0.086* 0.202*** 0.082*** 0.056*** 0.188***
(0.033) (0.045) (0.043) (0.018) (0.016) (0.036)
Non-tax patent box effect (NT) -2.470*** -2.510*** -3.128*** -1.572*** -1.999*** -2.782***
(0.346) (0.548) (0.371) (0.205) (0.213) (0.245)
Business R&D / GDP -1.428** -2.129** -3.026*** 1.089*** 1.766*** 0.178
(0.658) (0.901) (0.763) (0.304) (0.338) (0.514)
IP protection 5.912*** 4.287*** 6.578*** 4.276*** 4.621*** 6.510***
(0.389) (0.366) (0.550) (0.170) (0.171) (0.516)
Real research activity 8.339*** 16.820*** 7.632*** 8.542*** 9.801*** 11.940***
(0.330) (0.924) (0.343) (0.182) (0.230) (0.309)
GDP level 2.609** 0.311 -1.945 1.388** 2.076*** -0.545
(1.153) (1.390) (1.597) (0.633) (0.582) (1.224)
Observations 14,732 20,033 8,192 40,468 55,359 21,600
Chi-square 17,009 10,583 11,862 54,725 50,256 15,580
LR-test 68,496 175,564 39,173 152,565 487,186 198,317
country-fixed effects yes yes yes yes yes yes
time fixed-effects yes yes yes yes yes yes
Chi-square equality of coefficients
between high quality patents and other
patents (tax advantage in patent box) 77.19 127.21 19.91 - - -
Prob > chi2 0.00 0.00 0.00 - - -
Standard errors in parentheses. *** p<0.01, ** p<0.05, * p<0.1. We use as exposure variable the total number of employees of a company (including its subsidiaries). Observations
are clustered at the host country level.
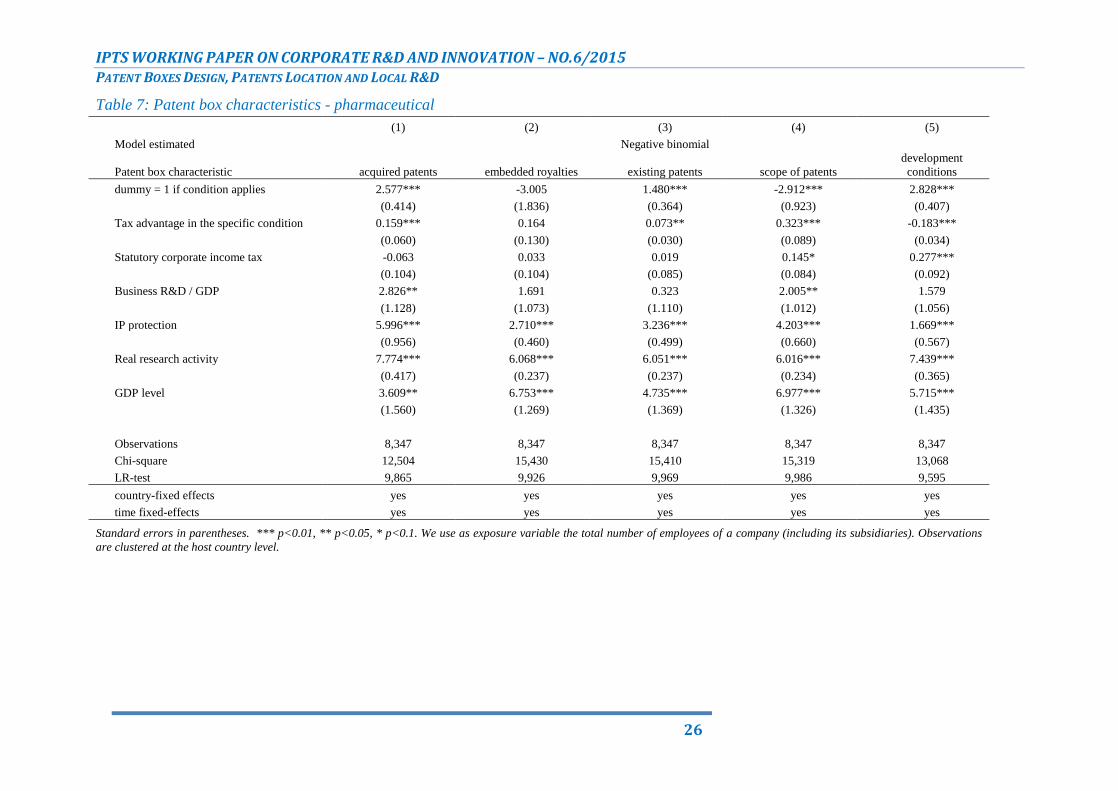
IPTS WORKING PAPER ON CORPORATE R&D AND INNOVATION – NO.6/2015 PATENT BOXES DESIGN, PATENTS LOCATION AND LOCAL R&D
26
Table 7: Patent box characteristics - pharmaceutical
(1) (2) (3) (4) (5)
Model estimated Negative binomial
Patent box characteristic acquired patents embedded royalties existing patents scope of patents
development
conditions
dummy = 1 if condition applies 2.577*** -3.005 1.480*** -2.912*** 2.828***
(0.414) (1.836) (0.364) (0.923) (0.407)
Tax advantage in the specific condition 0.159*** 0.164 0.073** 0.323*** -0.183***
(0.060) (0.130) (0.030) (0.089) (0.034)
Statutory corporate income tax -0.063 0.033 0.019 0.145* 0.277***
(0.104) (0.104) (0.085) (0.084) (0.092)
Business R&D / GDP 2.826** 1.691 0.323 2.005** 1.579
(1.128) (1.073) (1.110) (1.012) (1.056)
IP protection 5.996*** 2.710*** 3.236*** 4.203*** 1.669***
(0.956) (0.460) (0.499) (0.660) (0.567)
Real research activity 7.774*** 6.068*** 6.051*** 6.016*** 7.439***
(0.417) (0.237) (0.237) (0.234) (0.365)
GDP level 3.609** 6.753*** 4.735*** 6.977*** 5.715***
(1.560) (1.269) (1.369) (1.326) (1.435)
Observations 8,347 8,347 8,347 8,347 8,347
Chi-square 12,504 15,430 15,410 15,319 13,068
LR-test 9,865 9,926 9,969 9,986 9,595
country-fixed effects yes yes yes yes yes
time fixed-effects yes yes yes yes yes
Standard errors in parentheses. *** p<0.01, ** p<0.05, * p<0.1. We use as exposure variable the total number of employees of a company (including its subsidiaries). Observations
are clustered at the host country level.

IPTS WORKING PAPER ON CORPORATE R&D AND INNOVATION – NO.6/2015 PATENT BOXES DESIGN, PATENTS LOCATION AND LOCAL R&D
27
Table 8: Patent box characteristics - ICT
(1) (2) (3) (4) (5)
Model estimated: Negative binomial
Patent box characteristic acquired patents embedded royalties existing patents scope of patents
development
conditions
dummy = 1 if condition applies 1.004** -5.493** -1.121** -9.986*** 1.401***
(0.431) (2.754) (0.536) (1.693) (0.539)
Tax advantage in the specific condition 0.352*** 0.486*** 0.067 0.858*** -0.032
(0.075) (0.186) (0.041) (0.164) (0.035)
Statutory corporate income tax -0.218* -0.218 0.092 -0.214* 0.083
(0.116) (0.209) (0.124) (0.121) (0.116)
Business R&D / GDP 5.478*** 6.455*** 7.147*** 5.609*** 4.543***
(1.162) (1.396) (1.560) (1.168) (1.179)
IP protection 5.922*** 2.713*** 2.404*** 4.276*** 1.011*
(1.167) (0.674) (0.613) (1.257) (0.598)
Real research activity 9.258*** 8.735*** 8.609*** 8.581*** 9.064***
(0.419) (0.366) (0.348) (0.342) (0.409)
GDP level -1.410 0.718 1.815 2.950 0.378
(1.827) (1.837) (1.904) (1.836) (1.700)
Observations 11,409 11,409 11,409 11,409 11,409
Chi-square 8,400 9,158 9,477 8,828 9,171
LR-test 98,010 103,807 103,644 100,310 97,464
country-fixed effects yes yes yes yes yes
time fixed-effects yes yes yes yes yes
Standard errors in parentheses. *** p<0.01, ** p<0.05, * p<0.1. We use as exposure variable the total number of employees of a company (including its subsidiaries).
Observations are clustered at the host country level.

IPTS WORKING PAPER ON CORPORATE R&D AND INNOVATION – NO.6/2015 PATENT BOXES DESIGN, PATENTS LOCATION AND LOCAL R&D
28
Table 9: Patent box characteristics - car
(1) (2) (3) (4) (5)
Model estimated Negative binomial
Patent box characteristic acquired patents
embedded
royalties existing patents scope of patents
development
conditions
dummy = 1 if specific condition applies in the patent box
regime -7.126*** -15.399*** 3.938*** -8.001*** -4.521***
(1.364) (5.947) (0.953) (1.833) (1.751)
Tax advantage in the specific condition 0.458*** 0.874** -0.321*** 0.648*** 0.038
(0.157) (0.413) (0.088) (0.158) (0.145)
Statutory corporate income tax 0.432* 0.025 0.225 0.144 0.059
(0.254) (0.240) (0.232) (0.237) (0.280)
Business R&D / GDP -5.321** -5.462** -4.297* -3.878* -0.560
(2.247) (2.516) (2.555) (2.258) (2.415)
IP protection 1.821 0.190 0.355 2.217 2.776***
(1.565) (0.957) (0.909) (1.462) (0.908)
Real research activity 10.260*** 11.720*** 10.949*** 11.742*** 9.312***
(0.781) (0.889) (0.797) (0.836) (0.786)
GDP level 8.910** 4.900 6.258 4.118 6.364
(4.520) (4.772) (4.534) (5.168) (4.262)
Observations 4,492 4,492 4,492 4,492 4,492
Chi-square 2,570 2,744 2,824 2,646 2,717
LR-test 25,802 24,894 23,896 26,702 23,702
country-fixed effects yes yes yes yes yes
time fixed-effects yes yes yes yes yes
Standard errors in parentheses. *** p<0.01, ** p<0.05, * p<0.1. We use as exposure variable the total number of employees of a company (including its subsidiaries). Observations are
clustered at the host country level.

IPTS WORKING PAPER ON CORPORATE R&D AND INNOVATION – NO.6/2015 PATENT BOXES DESIGN, PATENTS LOCATION AND LOCAL R&D
29
Table 10: Impact of patent boxes on real activity
Pharmaceutical ICT car Pharmaceutical ICT car
Statutory corporate income tax -0.037** -0.013 -0.054*** -0.043** -0.028 -0.058***
(0.018) (0.029) (0.018) (0.018) (0.024) (0.018)
Tax advantage in patent box -0.092*** -0.088*** -0.201*** -0.091*** -0.073** -0.165***
(0.032) (0.026) (0.051) (0.031) (0.031) (0.045)
Development conditions are required in the patent
box 2.098*** 1.944*** 3.841*** 2.059*** 1.520** 3.109***
(0.712) (0.561) (1.025) (0.676) (0.629) (0.982)
Business R&D / GDP 0.439 0.275 -0.009 0.394 0.220 0.019
(0.291) (0.323) (0.304) (0.284) (0.289) (0.308)
Intellectual property protection 0.982** -0.252 0.022 1.126** 0.195 0.482
(0.472) (0.405) (0.582) (0.495) (0.422) (0.574)
Real research activity
0.462 1.678*** 1.729**
(0.331) (0.321) (0.723)
GDP level 0.653 0.555 0.536 0.557 0.521 0.502
(0.680) (0.592) (0.755) (0.661) (0.569) (0.731)
Constant -1.899*** -1.546*** -1.024** -2.263*** -2.718*** -2.466***
(0.428) (0.369) (0.499) (0.520) (0.455) (0.732)
Observations 3,193 3,537 1,963 3,193 3,537 1,963
Chi-square 165.2 219.2 353.3 163.6 191.6 359.5
Pseudo R2 0.0424 0.0358 0.0525 0.0460 0.0843 0.0723
Standard errors in parentheses. *** p<0.01, ** p<0.05, * p<0.1.

IPTS WORKING PAPER ON CORPORATE R&D AND INNOVATION – NO. 6/2015 PATENT BOXES DESIGN, PATENTS LOCATION AND LOCAL R&D
30
Figure 1: Average Corporate Tax Rate and Patent Boxes in the EU-28
Sources: Taxes in Europe Database and own computations. The columns indicate the number of patent box
regimes in the EU-28 and the crosses indicate the arithmetic average of the percentage reduction in
corporate income taxes offered by the patent boxes. The straight line represents the arithmetic average
statutory tax rate in the EU-28, including local taxes and surcharges.

IPTS WORKING PAPER ON CORPORATE R&D AND INNOVATION – NO. 6/2015 PATENT BOXES DESIGN, PATENTS LOCATION AND LOCAL R&D
31
Figure 2: Predicted percentage change in the number of patents at levels of corporate tax
rebate conditional on the existence of a patent box regime
0%
10%
20%
30%
40%
50%
60%
70%
80%
1% 3% 6% 9% 12% 15% 18% 21% 24% 27% 30%
Pre
dic
ted
%-c
han
ge in
nu
mb
er
of
pat
en
ts r
egi
ste
red
Corporate tax rebate under the patent box regime
CAR - Average CIT ICT - Average CIT PHARMA - High CIT
CAR - High CIT ICT - High CIT PHARMA - Average CIT

IPTS WORKING PAPER ON CORPORATE R&D AND INNOVATION – NO. 6/2015 PATENT BOXES DESIGN, PATENTS LOCATION AND LOCAL R&D
32
Figure 3: Average effective corporate tax paid on patent revenues: high- vs. low-quality
patents

IPTS WORKING PAPER ON CORPORATE R&D AND INNOVATION – NO. 6/2015 PATENT BOXES DESIGN, PATENTS LOCATION AND LOCAL R&D
33
Figure 4: Predicted probability of attracting R&D activities in presence of development
conditions and at levels of corporate tax rebate in the patent box regime
0%
20%
40%
60%
80%
1% 3% 6% 9% 12% 15% 18% 21% 24% 27% 30%
Pre
dic
ted
ch
ange
in t
he
pro
bab
ility
of
un
de
rtak
ing
loca
l R&
D
Corporate tax rebate in the patent box regime
Pharma ICT CAR
Sample Average Tax Rebate

Europe Direct is a service to help you find answers to your questions about the European Union
Freephone number (*): 00 800 6 7 8 9 10 11
(*) Certain mobile telephone operators do not allow access to 00 800 numbers or these calls may be billed.
A great deal of additional information on the European Union is available on the Internet.
It can be accessed through the Europa server http://europa.eu.
How to obtain EU publications
Our publications are available from EU Bookshop (http://bookshop.europa.eu),
where you can place an order with the sales agent of your choice.
The Publications Office has a worldwide network of sales agents.
You can obtain their contact details by sending a fax to (352) 29 29-42758.
European Commission
Joint Research Centre – Institute for Prospective Technological Studies
Title: Patent Boxes Design, Patents Location and Local R&D
Author(s): Annette Alstadsæter, Salvador Barrios, Gaetan Nicodeme, Agnieszka Maria Skonieczna and Antonio Vezzani
Spain: European Commission, Joint Research Centre
2015 – 33 pp. – 21.0 x 29.7 cm
EUR – Scientific and Technical Research series – ISSN 1831-9408 (online)

JRC Mission As the Commission’s in-house science service, the Joint Research Centre’s mission is to provide EU policies with independent, evidence-based scientific and technical support throughout the whole policy cycle. Working in close cooperation with policy Directorates-General, the JRC addresses key societal challenges while stimulating innovation through developing new methods, tools and standards, and sharing its know-how with the Member States, the scientific community and international partners.
Serving society Stimulating innovation Supporting legislation