Patches of the mussel Mytilus sp. are islands of high ... · Norling & Kautsky: Mytilus patches as...
13
AQUATIC BIOLOGY Aquat Biol Vol. 4: 75–87, 2008 doi: 10.3354/ab00096 Printed December 2008 Published online November 18, 2008 INTRODUCTION In marine benthic systems, community structure and ecosystem functions are often dependent on particular species that modify and create highly diverse habitats (Bruno & Bertness 2001). By creating spatial refuges from environmental stress and/or predation, primary spaceholders can generate and maintain local species diversity (Witman 1985, Hacker & Gaines 1997). Re- cent research demonstrates strong effects of facilita- tion, due to the influence of organismal traits on eco- system processes, on species composition and diversity at population and community level, as well as at land- scape scale (Bruno et al. 2003). Mussels are such habitat modifiers (Dayton 1972), or engineering species (Jones et al. 1994), which by alter- ing the environmental properties facilitate the pres- ence of species that would otherwise be absent (e.g. Crooks 1998, Ragnarsson & Raffaelli 1999) or inhibit the presence of and/or exclude others (Commito 1987, Beadman et al. 2004). The mussel shells provide sec- ondary hard substratum, which in sedimentary habi- tats may be the only hard substratum available for settlement of sessile organisms and algae (Albrecht 1998, Buschbaum 2000). In contrast to other habitat modifying organisms, such as kelp and seagrass, mussels not only provide habitat structure and shelter, but also clear the water © Inter-Research 2008 · www.int-res.com *Email: [email protected] Patches of the mussel Mytilus sp. are islands of high biodiversity in subtidal sediment habitats in the Baltic Sea Pia Norling*, Nils Kautsky Department of Systems Ecology, Stockholm University, Se-106 91 Stockholm, Sweden ABSTRACT: Mytilus sp. is a habitat-modifying species that can influence biodiversity by facilitation and inhibition of species. We investigated the relationship between size of Mytilus patches, sediment characteristics and species richness of associated macrofauna, meiofauna and macroalgae on sandy sediments at 7 m depth in the Askö area, northern Baltic proper. A total of 24 associated macrofauna species were identified, 11 of which were not present on bare sediment outside the patches. The bare sediment had on average 5 species, which increased to 6 associated species at a mussel patch size of 5 cm 2 and 17 species at 314 cm 2 , which was > 85% of the associated species in a nearby large mussel bed. The diversity of macro-infauna was higher in mussel patches compared to sediment. Macroal- gae, being dependent on mussel shell as substrate or on attachment by byssus threads, were not found outside patches. Sediment contents of total carbon and nitrogen were significantly higher within patches than outside, mainly due to the mussels’ filtration and biodeposition of small nutrient- rich particles. Diversity of meiofauna did not change with patch size, but total abundance of Nema- toda was higher within patches. As patch size increased, the effects of Mytilus on the sediment char- acteristics became stronger, but few negative effects of increased biodeposition were seen on species richness. The results show that mussel patches represent islands of high biodiversity in sediment areas and belong to the most species-rich habitats in the Baltic Sea, due to structural and functional effects. KEY WORDS: Engineering species · Patch size · Facilitation · Community structure · Biodiversity · Associated species · Ecological role · Habitat modification Resale or republication not permitted without written consent of the publisher OPEN PEN ACCESS CCESS
Transcript of Patches of the mussel Mytilus sp. are islands of high ... · Norling & Kautsky: Mytilus patches as...

AQUATIC BIOLOGYAquat Biol
Vol. 4: 75–87, 2008doi: 10.3354/ab00096
Printed December 2008 Published online November 18, 2008
INTRODUCTION
In marine benthic systems, community structure andecosystem functions are often dependent on particularspecies that modify and create highly diverse habitats(Bruno & Bertness 2001). By creating spatial refugesfrom environmental stress and/or predation, primaryspaceholders can generate and maintain local speciesdiversity (Witman 1985, Hacker & Gaines 1997). Re-cent research demonstrates strong effects of facilita-tion, due to the influence of organismal traits on eco-system processes, on species composition and diversityat population and community level, as well as at land-scape scale (Bruno et al. 2003).
Mussels are such habitat modifiers (Dayton 1972), orengineering species (Jones et al. 1994), which by alter-ing the environmental properties facilitate the pres-ence of species that would otherwise be absent (e.g.Crooks 1998, Ragnarsson & Raffaelli 1999) or inhibitthe presence of and/or exclude others (Commito 1987,Beadman et al. 2004). The mussel shells provide sec-ondary hard substratum, which in sedimentary habi-tats may be the only hard substratum available forsettlement of sessile organisms and algae (Albrecht1998, Buschbaum 2000).
In contrast to other habitat modifying organisms,such as kelp and seagrass, mussels not only providehabitat structure and shelter, but also clear the water
© Inter-Research 2008 · www.int-res.com*Email: [email protected]
Patches of the mussel Mytilus sp. are islands of highbiodiversity in subtidal sediment habitats in the
Baltic Sea
Pia Norling*, Nils Kautsky
Department of Systems Ecology, Stockholm University, Se-106 91 Stockholm, Sweden
ABSTRACT: Mytilus sp. is a habitat-modifying species that can influence biodiversity by facilitationand inhibition of species. We investigated the relationship between size of Mytilus patches, sedimentcharacteristics and species richness of associated macrofauna, meiofauna and macroalgae on sandysediments at 7 m depth in the Askö area, northern Baltic proper. A total of 24 associated macrofaunaspecies were identified, 11 of which were not present on bare sediment outside the patches. The baresediment had on average 5 species, which increased to 6 associated species at a mussel patch size of5 cm2 and 17 species at 314 cm2, which was >85% of the associated species in a nearby large musselbed. The diversity of macro-infauna was higher in mussel patches compared to sediment. Macroal-gae, being dependent on mussel shell as substrate or on attachment by byssus threads, were notfound outside patches. Sediment contents of total carbon and nitrogen were significantly higherwithin patches than outside, mainly due to the mussels’ filtration and biodeposition of small nutrient-rich particles. Diversity of meiofauna did not change with patch size, but total abundance of Nema-toda was higher within patches. As patch size increased, the effects of Mytilus on the sediment char-acteristics became stronger, but few negative effects of increased biodeposition were seen on speciesrichness. The results show that mussel patches represent islands of high biodiversity in sedimentareas and belong to the most species-rich habitats in the Baltic Sea, due to structural and functionaleffects.
KEY WORDS: Engineering species · Patch size · Facilitation · Community structure · Biodiversity ·Associated species · Ecological role · Habitat modification
Resale or republication not permitted without written consent of the publisher
OPENPEN ACCESSCCESS

Aquat Biol 4: 75–87, 2008
by filter feeding, regenerate nutrients that benefit algae(Kautsky & Wallentinus 1980) and increase rates ofsedimentation through biodeposition of organicallyenriched faeces and pseudo-faeces providing food fordeposit feeders (Kautsky & Evans 1987, Norkko et al.2001). Mussels can thus supply the associated commu-nity with 24 to 31% of its energy demand (Norling &Kautsky 2007). The changed near-bed hydrodynamicregime caused by the presence of the mussels allowsthe accumulation of finer organic particles (Widdowset al. 1998, Gutiérrez et al. 2003), leading to a modifiedhabitat, which sometimes can have negative effects oninfauna by causing low oxygen and high sulphidelevels in the sediment (Dittmann 1990, Ragnarsson &Raffaelli 1999, Commito & Dankers 2001).
Mytilid mussels form beds or patches composed oflayers of mussels with accumulated sediment, faeces,pseudo-faeces and shell debris, making up a musselmatrix, on substrata ranging from muddy soft bottomsto exposed hard bottoms. The ecology and biodiversityof Mytilus edulis beds and patches have been sub-jected to a number of studies (see reviews by Commito& Dankers 2001, Thiel & Ullrich 2002, Chintiroglou etal. 2004) and the diversity of associated macrofaunahas been found to increase with age and size of musselpatches (Tsuchiya & Nishihira 1985, 1986, Norling &Kautsky 2007), and decrease with increasing tidal ele-vation (Tsuchiya & Retière 1992, Saier 2002). However,for subtidal environments and sediment habitats, infor-mation is generally lacking, and studies of the relation-ship from sediment habitats have been rather incon-clusive regarding minimum patch size when effectsoccur (e.g. Svane & Setyobudiandi 1996), probablydue to the narrow size range studied. Furthermore,most of the studies were carried out in marine areas,while in the brackish Baltic Sea there has only been asingle study on meiofauna diversity in mussel beds(Radziejewska 1986).
In the species-poor Baltic Sea, Mytilus cf. edulis is,due to lack of predators and competitors for space, adominant species on sublittoral hard substrates downto 30 m depth (Kautsky 1982, Kautsky et al. 1990) andis also very common on sublittoral soft bottoms in theBaltic proper (Ankar & Elmgren 1976), making up atotal of 50 to 80% of the shell-free animal biomass inthe coastal zone in the Baltic proper (Kautsky & Kaut-sky 1995). The mussels found here are dwarfed bysalinity stress and were for a long time believed to be aseparate species. However, recent studies show thatM. edulis and M. trossulus hybridise in the Baltic(Kijewski et al. 2006); therefore we will hereafter callthem Mytilus.
The aim of the present study was to evaluate theimportance of Mytilus for the biodiversity (species rich-ness and composition) of Baltic Sea sublittoral sedi-
ment habitats, and investigate how this is influencedby Mytilus patch size. Patch sizes ranging from singlemussels to an entire mussel bed were compared tobare sediment bottoms without mussels, in order toassess the relationship between patch area, sedimentcharacteristics, biodiversity of associated macrofauna,meiofauna and macroalgae. We hypothesised thatMytilus would have facilitating effects on species rich-ness and abundance with increasing patch size abovethe sediment surface, and inhibiting effects in thesediment beneath the mussel patches. Therefore, theepifauna and infauna communities associated withMytilus, living within the mussel matrix and beneaththe sediment surface, were investigated separately.
MATERIALS AND METHODS
The studies were conducted at Persö, in the AsköArchipelago (58° 47.612’ N, 17°36.080’ E), Baltic proper,in September 2003. The salinity in the area was6.1 psu, and the tidal range is only 2 cm. The patchi-ness of the area was on average approximately 30 cmbetween well-separated patches, and was dominatedby smaller patches (25 to 225 cm2) and few largepatches (>1 m2), which were all randomly arranged onthe soft sediment. In the study of the mussel matrixcommunity, Mytilus patch assemblages (n = 12) withsizes ranging from 5 to 314 cm2 were sampled at 7 to8 m depth using SCUBA. The whole mussel patches,including associated fauna and flora were collected byscraping off the 1 cm top layer of sediment within 20 ×20 cm quadrats (400 cm2) and frozen before biodiver-sity determination. The patch diameters were mea-sured with a ruler and the patch areas were then calcu-lated. Macrofauna samples (n = 5) were also collectedfrom a nearby large mussel bed of 4 m2 using the same20 × 20 cm frames in the same way, as well as in anadjacent bare sediment area without mussels (approx-imately 3 m away) representing the sediment control(n = 5). In a second sampling focusing on the infaunacommunity, core samples were collected from musselpatches ranging from 4 to about 28 000 cm2 (n = 22)and from bare sediment (n = 15) by using Plexiglasscores (∅ = 10 cm). The top 1 cm was removed before10 cm sediment core sample was sliced off and sievedthrough 2, 1 and 0.5 mm meshes. All macrofauna andmacroalgae were identified to species level and driedat 60°C to constant weight.
In the first sampling, duplicate sediment samples forstudy of meiofauna and sediment characteristics werecollected inside and approximately 30 cm outside ofeach mussel patch, as well as in the bare sediment con-trol area (n = 12) and in the mussel bed (n = 5), usingsmall sediment cores (∅ = 2.6 cm). The surface sedi-
76
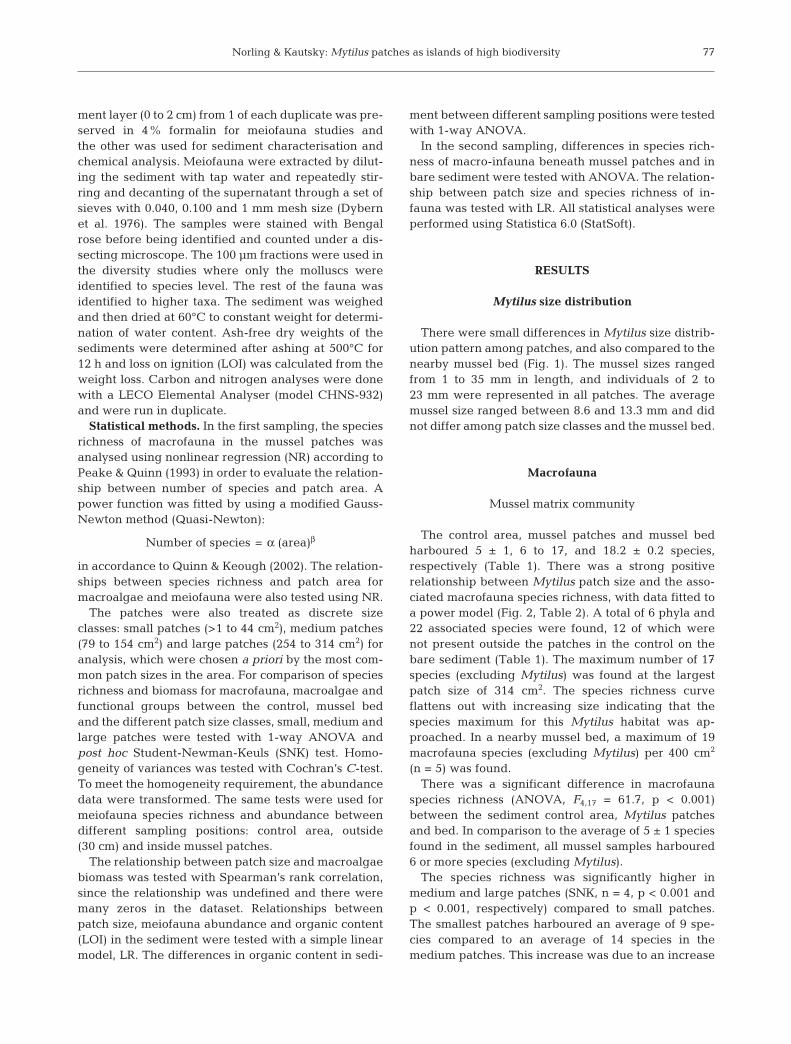
Norling & Kautsky: Mytilus patches as islands of high biodiversity
ment layer (0 to 2 cm) from 1 of each duplicate was pre-served in 4% formalin for meiofauna studies andthe other was used for sediment characterisation andchemical analysis. Meiofauna were extracted by dilut-ing the sediment with tap water and repeatedly stir-ring and decanting of the supernatant through a set ofsieves with 0.040, 0.100 and 1 mm mesh size (Dybernet al. 1976). The samples were stained with Bengalrose before being identified and counted under a dis-secting microscope. The 100 µm fractions were used inthe diversity studies where only the molluscs wereidentified to species level. The rest of the fauna wasidentified to higher taxa. The sediment was weighedand then dried at 60°C to constant weight for determi-nation of water content. Ash-free dry weights of thesediments were determined after ashing at 500°C for12 h and loss on ignition (LOI) was calculated from theweight loss. Carbon and nitrogen analyses were donewith a LECO Elemental Analyser (model CHNS-932)and were run in duplicate.
Statistical methods. In the first sampling, the speciesrichness of macrofauna in the mussel patches wasanalysed using nonlinear regression (NR) according toPeake & Quinn (1993) in order to evaluate the relation-ship between number of species and patch area. Apower function was fitted by using a modified Gauss-Newton method (Quasi-Newton):
Number of species = α (area)β
in accordance to Quinn & Keough (2002). The relation-ships between species richness and patch area formacroalgae and meiofauna were also tested using NR.
The patches were also treated as discrete sizeclasses: small patches (>1 to 44 cm2), medium patches(79 to 154 cm2) and large patches (254 to 314 cm2) foranalysis, which were chosen a priori by the most com-mon patch sizes in the area. For comparison of speciesrichness and biomass for macrofauna, macroalgae andfunctional groups between the control, mussel bedand the different patch size classes, small, medium andlarge patches were tested with 1-way ANOVA andpost hoc Student-Newman-Keuls (SNK) test. Homo-geneity of variances was tested with Cochran’s C-test.To meet the homogeneity requirement, the abundancedata were transformed. The same tests were used formeiofauna species richness and abundance betweendifferent sampling positions: control area, outside(30 cm) and inside mussel patches.
The relationship between patch size and macroalgaebiomass was tested with Spearman’s rank correlation,since the relationship was undefined and there weremany zeros in the dataset. Relationships betweenpatch size, meiofauna abundance and organic content(LOI) in the sediment were tested with a simple linearmodel, LR. The differences in organic content in sedi-
ment between different sampling positions were testedwith 1-way ANOVA.
In the second sampling, differences in species rich-ness of macro-infauna beneath mussel patches and inbare sediment were tested with ANOVA. The relation-ship between patch size and species richness of in-fauna was tested with LR. All statistical analyses wereperformed using Statistica 6.0 (StatSoft).
RESULTS
Mytilus size distribution
There were small differences in Mytilus size distrib-ution pattern among patches, and also compared to thenearby mussel bed (Fig. 1). The mussel sizes rangedfrom 1 to 35 mm in length, and individuals of 2 to23 mm were represented in all patches. The averagemussel size ranged between 8.6 and 13.3 mm and didnot differ among patch size classes and the mussel bed.
Macrofauna
Mussel matrix community
The control area, mussel patches and mussel bedharboured 5 ± 1, 6 to 17, and 18.2 ± 0.2 species,respectively (Table 1). There was a strong positiverelationship between Mytilus patch size and the asso-ciated macrofauna species richness, with data fitted toa power model (Fig. 2, Table 2). A total of 6 phyla and22 associated species were found, 12 of which werenot present outside the patches in the control on thebare sediment (Table 1). The maximum number of 17species (excluding Mytilus) was found at the largestpatch size of 314 cm2. The species richness curveflattens out with increasing size indicating that thespecies maximum for this Mytilus habitat was ap-proached. In a nearby mussel bed, a maximum of 19macrofauna species (excluding Mytilus) per 400 cm2
(n = 5) was found.There was a significant difference in macrofauna
species richness (ANOVA, F4,17 = 61.7, p < 0.001)between the sediment control area, Mytilus patchesand bed. In comparison to the average of 5 ± 1 speciesfound in the sediment, all mussel samples harboured6 or more species (excluding Mytilus).
The species richness was significantly higher inmedium and large patches (SNK, n = 4, p < 0.001 andp < 0.001, respectively) compared to small patches.The smallest patches harboured an average of 9 spe-cies compared to an average of 14 species in themedium patches. This increase was due to an increase
77

Aquat Biol 4: 75–87, 2008
in the number of species of Crustacea (Balanus impro-visus, Gammarus oceanicus and Idothea viridis), Gas-tropoda (Limapontia capitata) and Oligochaeta (Cli-tellio arenarius) (Table 1). The mussel bed harbouredthe highest number of species compared to the musselpatches and this was significant for each comparison(SNK, n = 4, p < 0.001 for small, p = 0.001 for medium,p = 0.002 for large patches).
In terms of abundance, the associated macrofaunain mussel patches was dominated by Gastropoda(67 to 92%) and Bivalvia (8 to 27% of total abundance)(Table 1), with few species from each taxonomic group.In the control area, Gastropoda (68%) and Bivalvia(32%) dominated, while Bivalvia only comprised on
average 8% in the mussel bed, which otherwise had ahigh dominance of Gastropoda (89%).
The total macrofauna abundance varied between34 × 103 and 67 × 103 ind. m–2 in the patches. Themud snail Hydrobia ulvae was the most abundantspecies in all patches, followed by the cockle Cerasto-derma glaucum. The cockle was mainly found at thesurface of the sediment. Amphipoda and Isopoda,dominated by Gammarus salinus, G. oceanicus andIdothea baltica, were most abundant in the largepatches. Black goby Gobius niger was only found inthe largest patch and the adjacent mussel bed. Speciesdominant in the sediment control area were Macomabalthica, H. ulvae and Potamopyrgus antepodarum.
78
Fig. 1. Mytilus edulis. Size distribution in individual patches of different size (samples 1 to 12, see Table 1) and mussel bed (samples B1 to B5). n = number of individuals, x = average shell size

Norling & Kautsky: Mytilus patches as islands of high biodiversity
The total biomass of associated macrofauna (excludingMytilus) in the patches ranged between 98 and 315 g dryweight (DW) m–2, on average comprising 17.4 ± 2% ofthe total assemblage including Mytilus. The biomass ofmacrofauna in the control area was smaller (45 ± 5 g DWm–2) than in the patches and mussel bed (Table 1). As forthe abundance, the Mollusca (excluding Mytilus) bio-mass was largest in the patches and bed. In contrast topatches and bed, Macoma balthica had the largest bio-mass, 27.4 g DW m–2, in the control.
Infauna community
The infauna community at 1 to 10 cm depth wassignificantly different between mussel patches and
79
Table 1. Abundances, species richness and biomass of associated macrofauna species in Mytilus patches of different sizes (N = 12) and for amussel bed and sediment control (mean ± SE, n = 5). The overall number of species found in mussel bed and sediment control was 21 and 10,respectively. Functional groups of macrofauna were defined by feeding type. F = filter feeder, Sur D = surface detritivore, Sub D = subsurfacedetritivore, Mac H = macroalgae herbivore, Mic H = microalgae herbivore, C = carnivore, O = omnivore, P = parasite. + indicates presence
Funct. group 1 2 3 4 5 6 7 8 9 10 11 12 Bed Control
Abundance (103 ind. m–2) Nemertina Cyanophthalma obscura C 0.6 0.1 0.06 0.2 0.3 0.5 0.3 0.2 0.2 0.4±0.1
Oligochaeta Clitellio arenarius Sub D 0.1 0.2 0.06 0.03 0.1 0.1±0.01 0.03 ±0.02Tubificoides benedii Sub D 0.6 0.4 0.1 0.1 0.04 0.5 0.2 0.03 0.03 0.1±0.03 0.01±0.01
Polychaeta Hediste diversicolor O 0.6 0.4 0.2 0.3 0.06 0.04 0.4 0.2 0.2 0.05 0.2±0.03 0.03±0.01Pygospio elegans Sur D 0.2 0.03 0.06±0.02 0.01±0.01
Hirudinea Piscicola geometra P 0.01±0.01
Gastropoda Hydrobia ulvae Sur D 37 157 34 43 37 24 42 47 50 41 30 48 91±12 6±1.4Potamopyrgus Sur D 2 21 6 0.9 5 2 2 1 4 6 1 0.9 5±0.9 0.9±0.6antepodarum
Lymnea peregra Mic H 0.03Theodoxus fluviatilis Mic H 3 0.4 0.2 0.5 0.1 0.2 0.3 0.5 0.5 0.2 0.3 0.5±0.1 0.1±0.06Limapontia capitata Mac H 0.1 0.06 0.06 0.03 0.04±0.02
Bivalvia Cerastoderma glaucum F 13 17 13 3 19 7 8 5 10 10 5 4 7±0.9 0.5±0.5Macoma balthica Sub D 3 2 0.4 3 0.7 0.8 0.8 0.6 1 1 0.5 0.5 1±0.3 2.7±0.9Mya arenaria F 0.6 0.1 0.06 0.03 0.03 0.01±0.01 0.01±0.01
Crustacea Gammarus oceanicus O 0.1 0.1 0.5 0.5±0.1Gammarus salinus O 0.6 0.4 0.2 0.06 0.06 0.04 0.1 0.1 0.03 0.3 2±0.2Gammarus juv. O 0.1±0.02Idothea baltica Mac H 0.4 0.2 0.09 0.1 0.3 0.3±0.1Idothea viridis Mac H 0.2 0.06 0.4 0.04 0.03 0.1 0.02±0.01Jaera albifrons sp. Mic H 1.7 0.1 0.02±0.01Balanus improvisus F 0.06 0.03 0.03 0.05 0.1±0.01Electra crustulenta F + + + + + + + + + + + +
Chordata Gobius niger C 0.03 0.01±0.01
Total abundance (103 ind. m–2) 60 199 55 51 63 34 54 55 67 60 37 55 108±13 10±2
Total biomass (g DW m–2) 158 315 106 122 159 120 121 184 166 148 98 194 207±24 47±5
Species richness 6 10 9 9 15 13 14 12 13 14 14 17 18.2±0.2 5±1
Patch size (cm2) 5 16 20 44 79 133 143 154 254 269 299 314 40 000 0
y = 5.41x0.18
R2 = 0.76
0
5
10
15
20
50 200 200150 250 300 3501000
Patch size (cm2)
Sp
ecie
s ric
hnes
s
40000
Fig. 2. Macrofauna species richness in Mytilus patches of dif-ferent size (N = 12), and mean ± SE for control area andmussel bed (n = 5); curve fitted only for patches. d = patch
samples, s = control samples, h = mussel bed samples

Aquat Biol 4: 75–87, 2008
bare sediment. The species richness was significantlyhigher (ANOVA, F1,35 = 5.83, p = 0.02) beneath themussel patches (mean ± SE 8.0 ± 0.4 species) (Fig. 3)compared to the bare sediment with 6.7 ± 0.3 species;2 infauna species only occurred >1 cm below the sedi-ment surface, Marenzelleria neglecta and Boccardiacf. ligerica. However, M. neglecta was not present inmussel patches >1418 cm2. Beneath mussels patches, aweak negative relationship was found between spe-cies richness and patch size (LR, p = 0.028, r2 = 0.22).The dominant taxa beneath the patches were Oligo-chaeta, Hydrobia ulvae, Macoma balthica and Hedistediversicolor. Significantly higher abundances of H. di-versicolor (ANOVA, F1,35 = 10.1, p = 0.003) were foundbeneath mussel patches compared to bare sediment.
Macroalgae
No macroalgae were found in the control area on thebare sediment, but when Mytilus was present, severalmacroalgae species were present (Fig. 4). Species rich-ness did not increase with increasing patch size (NR,p = 0.34).
Six macroalgae species were found, of which Furcel-laria lumbricalis dominated in terms of biomass, fol-lowed in decreasing order by Pilayella littoralis, Poly-siphonia fucoides, Ceramium tenuicorne, Phyllophorapseudoceranoides and Rhodomela confervoides (Fig. 5).F. lumbricalis and Phyllophora pseudoceranoides werefound entangled in byssus threads of the mussels. OnlyC. tenuicorne and Polysiphonia fucoides were attached
directly to the Mytilus shell, while Pilayella littoraliswas represented by loose-lying and drifting algae thathad been trapped by the patches.
The total macroalgal biomass was very low (Figs. 5& 6), on average 5.6% of the total associated fauna andflora. The biomass in patches varied between 2.7 and14.6 g DW m–2 with a mean of 6.7 g m–2. In the musselbed, the biomass was on average 8.6 g DW m–2. Thebiomass of algae did not increase with patch size(Spearman, t = –0.77, p = 0.46), but the biomass ofindividual species did. Furcellaria lumbricalis was pos-itively correlated with patch size (Spearman, t = 2.7,p = 0.02), while Polysiphonia fucoides was negativelycorrelated (Spearman, t = 3.3, p = 0.008).
Functional groups
In Table 1 and Fig. 6 the fauna have been dividedinto functional groups, depending on feeding type,with additional information on spatial position in themussel matrix. The sediment control had a total of 5
80
Table 2. Quasi-Newton model estimated fit of correlation be-tween macrofauna species richness and patch area (n = 12)
Parameter Estimate SE t p
α 5.41 0.99 5.47 <0.001β 0.178 0.04 4.88 <0.001
0
2
4
6
8
10
12
0 5000 10000 15000 300002500020000
y = –0.0001x + 8.39R2 = 0.22
Patch size (cm2)
Sp
ecie
s ric
hnes
s
Fig. 3. Macro-infauna species richness beneath Mytiluspatches of different size (n = 22), and mean ± SE for the con-trol with bare sediment (n = 15). d = patch samples, s = control
samples
0
1
2
3
4
5
6
50 200150 250 300 3501000
Patch size (cm2)
Sp
ecie
s ric
hnes
s
40000
Fig. 4. Macroalgae species richness in Mytilus patches of dif-ferent size (n = 12), and mean ± SE for control area and musselbed (n = 5). d = patch samples, s = control samples, h = mussel
bed samples
Fig. 5. Mean biomass of macroalgae species in Mytiluspatches of different patch size class (n = 4), control area (n = 5)
and mussel bed (n = 5)

Norling & Kautsky: Mytilus patches as islands of high biodiversity
functional groups, while the patches had 8 and themussel bed had 9 groups. The biomass of surface detri-tivores (Hydrobia ulvae, Potamopyrgus antepodarumand Pygospio elegans) was significantly different(ANOVA, square root, F4,17 = 21.4, p < 0.001) betweenthe control area, patches and mussel bed. It was higherin Mytilus patches (SNK, n = 4, p < 0.001 for small,medium and large patches, respectively) and musselbed (SNK, n = 5, p < 0.001) compared to the controlarea (Fig. 6), and higher biomass in the mussel bed,compared to the patches (SNK, n = 4, p = 0.01 for small,p = 0.02 for medium and p = 0.01 for large patches,respectively). In contrast, the highest biomass of sub-surface detritivores was found in the sediment controlarea, and was significantly different (ANOVA, squareroot, F4,17 = 5.67, p = 0.004) from the small (SNK, n = 4,p = 0.01) and medium (SNK, n = 4, p = 0.007) patchclasses.
The filter-feeder biomass (Balanus improvisus, Myaarenaria and Cerastoderma glaucum) was significantlydifferent between control area, patches and musselbed (ANOVA, F4,17 = 12.8, p < 0.001). The biomass wassmaller in the control area compared to the patches(SNK, n = 4, p < 0.005 for small, p < 0.001 for mediumand p < 0.001 for large patches, respectively) and themussel bed (SNK, n = 5, p = 0.005). The microalgaeherbivores (Theodoxus fluviatilis and Jaera albifrons)dominated the herbivore biomass in small patches,while macroalgae herbivores (Idothea balthica, I. viri-dis and Limapontia capitata) dominated in the largepatches. In the mussel bed the herbivore biomass waslow, but the omnivore biomass, primarily representedby Gammarus sp., was significantly higher (ANOVA,square root, F4,17 = 31.4, p < 0.001) than in all patchclasses (SNK, n = 4, p < 0.001 for all classes) and thecontrol (SNK, n= 5, p < 0.001).
Meiofauna
A total of 21 meiofauna taxa were found in theMytilus patches, representing 8 phyla (Table 3). Theaverage number of meiofauna taxa was not different(ANOVA, F2,33 = 1.0, p = 0.37) between the Mytiluspatches compared to 30 cm outside the patches and thecontrol area (Table 3). On average, 16.9 ± 0.6 taxawere found in the patches, 16.6 ± 0.6 outside patches,15.7 ± 0.6 in the sediment control and 16 ± 0.6 taxain the mussel bed. The number of meiofauna taxashowed a weak positive relationship with increasingpatch size (NR, p = 0.02, r2 = 0.48), as the smallestpatches had 13 taxa and the larger patches reached amaximum of 19 taxa.
The abundance of meiofauna was significantly dif-ferent (ANOVA, F2,33 = 5.7, p = 0.008) between thecontrol, outside and inside the patches. The abun-dance was significantly higher inside (SNK, n = 12, p =0.006) and outside (SNK, n = 12, p = 0.04) the Mytiluspatches compared to the control area (Table 3). In themussel bed (n = 5), the abundance was similar to that ofthe larger patches. The meiofauna community insidethe patches was dominated by Nematoda, Copepodaand Bivalvia.
The differences in total abundance were mainly dueto the dominant Nematoda, followed by Copepoda andOligochaeta. The Nematoda constituted from about 44to 81% (average 66%) of the total meiofauna commu-nity in Mytilus patches and 70% in the mussel bed.The nematode abundance was significantly differentbetween control, outside and inside the mussel patches(ANOVA, F2,33 = 6.2, p = 0.005). The abundance wassignificantly higher inside patches compared to out-side (SNK, n = 12, p = 0.023) and control (SNK, n = 12,p = 0.005) (Table 3). The abundance of Copepoda, tem-
81
Fig. 6. Mean biomass of functional groups (by feeding mode) in Mytilus patches of different size class (n = 4), control area (n = 5) and mussel bed (n = 5)

Aquat Biol 4: 75–87, 2008
poral Bivalvia meiofauna (excludingMytilus), nauplii and Chironomidaewere significantly higher inside andoutside Mytilus patches comparedto the control (Table 3), whereasTurbellaria and Oligochaeta wereequally abundant at all spatialscales.
For the composition of Copepoda,the relative abundances of Harpac-ticoida and Cyclopoida were signif-icantly different (ANOVA, squareroot, F2,33 = 4.8, p = 0.035 and F2,33 =9.5, p < 0.001 respectively) betweencontrol, inside and outside patches(Table 3). The Cyclopoida abun-dance was much higher inside,compared to outside and in the con-trol area (SNK, n = 12, p = 0.035)(Fig. 7). The Nauplia abundancewas also significantly differentbetween the 3 sampling positions(ANOVA, 4th root, F2,33 = 6.3, p <0.01), with lower abundance in thecontrol, compared to outside and in-side patches (SNK, n = 12, p = 0.006and p = 0.004, respectively).
The abundance of meiofauna in-creased with increasing patch sizeat smaller patch sizes, but levelledoff at larger sizes and at musselbed size. A positive relationshipbetween abundance and LOI wasfound (LR, p < 0.001, r2 = 0.52) forthe patch samples (including con-trol, inside and outside patches),
but at the bed scale no relationship was found. Therelationship between abundance (Fig. 8) and LOI(Fig. 9) with patch size showed similar patterns forpatches, but were different for the mussel bed.
Sediment
There was a sharp contrast in organic content ofthe surface sediment (0 to 2 cm) outside, comparedto inside Mytilus patches. The content in terms ofLOI was significantly different (ANOVA, 4th root,F2,33 = 31.5, p < 0.001) between the sediment controlarea, outside and inside patches. The contentwas higher inside the patches than 30 cm outside(SNK, n = 12, p < 0.001) and at the control area(SNK, n = 12, p < 0.001), but the content in thepatches was less than half of that recorded in themussel bed (Table 4, Fig. 9).
82
Table 3. Meiofauna abundances (103 ind. m–2; mean ± SE) in Mytilus patches, sedi-ment 30 cm outside patches and sediment control (3 m from patches) (n = 12). F =ANOVA statistic. p-values were significant when ≤0.05. nd = taxon not detected,
na = not analysed due to too low abundance
Control Outside patch Patch F p
Ciliata 11 ± 1.8 16 ± 2.2 15 ± 2.3 1.5 0.25Foraminifera 0.5 ± 0.2 0.8 ± 0.4 0.8 ± 0.5 0.2 0.82Rotifera 2.0 ± 0.5 1.9 ± 0.6 0.6 ± 0.4 2.3 0.12KinorhynchaEchinoderes levanderi nd 0.2 ± 0.2 0.2 ± 0.2 0.5 0.61
HydrozoaProtohydra leuckarti 6.0 ± 1.3 11 ± 1.9 5.8 ± 1.7 3.2 0.05
Platyhelmintes 19 ± 4.0 24 ± 1.8 21 ± 3.3 1.2 0.31Nematoda 230 ± 300 285 ± 270 411 ± 510 6.2 <0.010
Polychaeta (total) 4.6 ± 0.9 9.1 ± 1.7 11 ± 3.0 1.7 0.19Manayunkia aestuarina 3.0 ± 0.9 6.4 ± 1.5 7.5 ± 2.7 0.6 0.54Spionidae 1 ± 0.4 1 ± 0.6 1 ± 0.5 0.1 0.88Nereis diversicolor 0.2 ± 0.2 0.3 ± 0.2 1 ± 0.5 na naOther nd 0.9 ± 0.8 0.8 ± 0.3 1.1 0.35
Oligochaeta 55 ± 6.1 59 ± 6.5 40 ± 6.0 2.6 0.09
Copepoda (total) 37 ± 4.8 85 ± 7.5 84 ± 20 8.6 <0.001Harpacticoida 31 ± 1.6 62 ± 6.3 37 ± 5.6 9.4 <0.001Cyclopoida 1.3 ± 0.4 0.9 ± 0.4 23 ± 10 4.8 <0.050Copepodita 3.0 ± 0.6 7.1 ± 1.3 10 ± 2.6 3.1 0.06Nauplia 3.9 ± 0.9 15 ± 4.1 14 ± 3.6 6.3 <0.010
Ostracoda 7.2 ± 1.3 10 ± 1.3 6.4 ± 1.2 2.7 0.09
Acarida: Halacaridae 5.5 ± 2.3 15 ± 3.9 7.1 ± 1.5 3.6 <0.050
Gastropoda (total) 17 ± 3.1 22 ± 3.9 12 ± 2.1 2.6 0.09Hydrobia sp. 12 ± 2.7 18 ± 3.9 11 ± 2.2 1.8 0.19Limapontia capitata 4.7 ± 1.0 3.5 ± 0.9 1.1 ± 0.5 4.8 <0.050
Bivalvia (total) 0.5 ± 0.2 3.8 ± 0.7 3.3 ± 0.9 8.2 <0.010Macoma balthica 0.5 ± 0.2 3.6 ± 0.7 3.0 ± 0.9 7.8 <0.010Cerastoderma sp. nd 0.2 ± 0.2 0.3 ± 0.2 na na
Insecta: Chironomidae 0.6 ± 0.3 0.2 ± 0.2 1.9 ± 0.5 6.5 <0.010
Mean total abundance 395 ± 380 547 ± 270 619 ± 680 5.7 <0.010Mean number of taxa 15.7 ± 0.60 16.6 ± 0.60 16.9 ± 0.60 1.0 0.37
0
20
40
60
80
100
Control Outside Patch
Ab
und
ance
(103
ind
. m–2
)
CyclopoidaHarpacticoidaCopepoditaNauplia
Fig. 7. Mean abundance of Copepoda at different samplingareas (n = 12). Abundance was significantly higher inside andoutside Mytilus patches, compared to control area; abun-dance of Cyclopoida was significantly higher in patches than
outside and control

Norling & Kautsky: Mytilus patches as islands of high biodiversity
Total organic carbon and nitrogen contents in sedi-ment followed the same pattern as LOI (Table 4). Thesediment control had low contents of carbon and nitro-gen. The contents almost doubled in the Mytiluspatches, but were only 40% of that found in the musselbed. The water content of the sediment was higher
inside the patches compared to outside and variedbetween 20 and 40% (Table 4), indicating a change oftexture in the sediment. The recorded differences areprobably underestimated as the top 2 cm of the sedi-ment was homogenised and analysed, which meansthat the water, nutrient and organic content of any toplayer thinner than 2 cm may have been ‘diluted’ by theunderlying sand.
The mussel bed had on average about 3 times highercontent of carbon compared to the patches, and 50%higher water content. The bed data also showed thehighest variation between samples. The C:N ratios ofthe sediment were on average 7.8 ± 0.1 in the controlarea, 7.9 ± 0.1 in Mytilus patches and 8.0 ± 0.2 in themussel bed, but were not significantly different.
DISCUSSION
The presence of Mytilus was very important for bio-diversity, as a total of 50 taxa of associated macro- andmeiofauna and macroalgae were found on a sublittoralsediment bottom. Even very small mussel patches hada large impact on the associated fauna and the numberof macrofauna species increased to 6 to 18.5 species assoon as Mytilus was present, compared to an averageof only 5 species in the surface layer of the baresediment control. Also the macro-infauna communitydeeper in the sediment beneath the mussel patcheshad significantly higher species richness, compared tosediment without patches. In total, 24 macrofauna spe-cies were found in all samples associated to musselswhile only 10 species were associated to bare sedi-ment. Macroalgae, sessile fauna (Balanus improvisus,Electra pilosa) and grazers (Lymnea peregra, Lima-pontia capitata) were only found within the musselpatches.
The species richness of associated species in musselpatches is similar to that of other highly diverse habi-tats in the Baltic Sea. The average of 18.5 and total of24 macrofauna species and 19 meiofauna taxa found inthe Mytilus patches on sediment bottoms at 7 m depth
83
0
200
400
600
800
1000
1200
Ab
und
ance
(103
ind
. m–2
)
Patch size (cm2)50 200150 250 300 3501000 40000
Fig. 8. Abundance of meiofauna in Mytilus patches of differ-ent size (n = 12), and average meiofauna abundance (± SE) forcontrol area (n = 5) and mussel bed (n = 5). d = patch samples,
s = control samples, h = mussel bed samples
0
1
2
3
4
50 200150 250 300 3501000
Patch size (cm2)
LOI (
%)
40000
Fig. 9. Loss on ignition (LOI) in sediment of Mytilus patches ofdifferent size (n = 12), and average ± SE for control area (n =5) and mussel bed (n = 5). d = patch samples, s = control
samples, h = mussel bed samples
Table 4. Sediment characteristics (mean ± SE): water content, loss on ignition (LOI), carbon, nitrogen and C:N ratio in Mytiluspatch samples, mussel bed, control area and 30 cm outside patches
n Water (%) LOI (%) C (%) N (%) C:N
Control 12 29.2 ± 1.4 0.69 ± 0.03 0.24 ± 0.01 0.03 ± 0.001 7.8 ± 0.1
Outside 12 28.3 ± 1.0 0.68 ± 0.01 0.24 ± 0.01 0.03 ± 0.002 7.8 ± 0.1
Patch (mean) 12 33.3 ± 1.7 1.16 ± 0.1 0.45 ± 0.1 0.06 ± 0.01 7.9 ± 0.1Small (>1–44) 4 32.3 ± 4.0 1.13 ± 0.2 0.40 ± 0.1 0.05 ± 0.01 8.0 ± 0.2Medium (79–154) 4 36.6 ± 2.2 1.37 ± 0.2 0.55 ± 0.1 0.07 ± 0.10 8.0 ± 0.2Large (254–314) 4 30.9 ± 2.6 0.98 ± 0.06 0.39 ± 0.03 0.05 ± 0.003 7.7 ± 0.2
Mussel bed 5 50.2 ± 2.5 2.94 ± 0.5 1.28 ± 0.2 0.16 ± 0.02 8.0 ± 0.2

Aquat Biol 4: 75–87, 2008
was similar to that of the Mytilus–red algal belt on anearby rocky bottom at the same depth (Kautsky1974). The same total number of macrofauna specieswere also found in the Mytilus–red algae communityon hard substratum at 5 m depth at the island of Öland,northern Baltic proper (P. Norling et al. unpubl.). In theFucus vesiculosus belt, which is generally consideredto be the most species-rich habitat in the Baltic, Haage& Jansson (1970) found on average 18.5 and a total of26 associated macrofauna species at 2 m depth in theAskö Archipelago, and Råberg (2004) found a total of24 species at 0.4 m depth in the same area. In com-parison with Ankar & Elmgren (1976), who found onaverage only 8 macrofauna species on sediment bot-toms in the Askö area at 9 to 50 m depth, the frequentlyoccurring Mytilus patches on these bottoms are thus‘islands of high biodiversity’.
Both structural and functional traits of Mytilus in-fluenced species richness, composition and abundanceof macroalgae, macro-infauna, and macro- and meio-fauna in the mussel patches. The secondary substra-tum provided by mussel shells proved to be veryimportant for some macrofauna as well as for attach-ment of macroalgae (cf. Albrecht 1998, Buschbaum2000). Polychaeta and Nemertinea were more frequentin the larger patches, probably due to the presenceof large Mytilus individuals providing more complexstructure and sheltering cavities between mussels andshells (Gutiérrez et al. 2003).
Patch size affected species richness of macrofauna,but not meiofauna. The different response patternssuggest that meiofauna is more related to functionaltraits of Mytilus, such as biodeposition. Species rich-ness of macrofauna increased with Mytilus patch area,as shown in more marine areas for patches on hardsubstratum (Tsuchiya & Nishihira 1985), as well assediment bottoms (Norling & Kautsky 2007). The lowsalinity and fewer species in the Baltic Sea resulted ina macrofauna diversity that was approximately half ofthe numbers found in intertidal sediment mussel beds(Dittmann 1990), shallow patches (Norling & Kautsky2007) and large subtidal patches (Svane & Setyo-budiandi 1996) in more marine areas. However, thedominant taxonomic groups of macrofauna were dif-ferent in the present study, compared to more marineareas. Gastropoda (Hydrobia ulvae) and Bivalvia(Cerastoderma glaucum) dominated, followed by Crus-tacea (having most species), while mussel patches inmore marine intertidal habitats are generally domi-nated by Polychaeta and Crustacea, followed by Mol-lusca (see reviews: Seed 1996, Thiel & Ullrich 2002,Chintiroglou et al. 2004).
In the present study, the Polychaeta Hediste diversi-color, which has several feeding modes (predator,grazer and filter feeder using mucus net) (Fauchald
& Jumars 1979), was found in almost all samples. Thisdominance is probably a result of the low speciesdiversity in the Baltic Sea, which allows organisms tohave wider realised niches than normally found in fullymarine areas (Remane & Schlieper 1971). In addition,the facilitation by Mytilus has the potential of furtherincreasing the realised niche for associated species(Bruno et al. 2003).
Another reason for the differences in dominant spe-cies composition, compared to more marine environ-ments, is probably that most studies were carried out inthe intertidal zone, while the present study was con-ducted at 7 m depth in an area where effects of wavesare small and tidal exposure is non-existent. In a com-parative study of tidal zones, Saier (2002) found higheraverage species richness in the subtidal (1 m at meanlow tide) than in the intertidal zone, while the totalabundance was higher in the intertidal mussel bed. Incomparison, the present study, with more stable condi-tions due to larger depths, showed approximately thesame species richness as in the subtidal zone, and evenhigher abundance. This is probably due to increasingsedimentation of organic rich matter and less waveaction, making more food available. The stable habi-tat makes species composition very distinctive withdeposit- and filter-feeder domination, and this favoursbivalves like Cerastoderma glaucum in surface-feed-ing. The inhibition of macro-infauna beneath musselbeds that is seen in many intertidal studies (Dittmann1990, Commito & Dankers 2001) was not found here.Although biodeposition is high, only a weak inhibitioneffect was noted with increasing patch size, probablybecause the mussel matrix was not dense and complexenough to trap large amounts of sediment with highorganic matter.
Macroalgae were totally dependent on the presenceof Mytilus, as no algae were found outside patches andthe algae biomass increased with patch size, especiallyof the perennial red algae Furcellaria lumbricalis.Single mussels provided substrate for several macro-algae species such as Ceramium tenuicorne and Poly-siphonia fucoides, while F. lumbricalis and Phyllo-phora pseudoceranoides that are to a large extentvegetatively propagated in the Baltic Sea (Kautsky &Wallentinus 1980) were usually found entangled andattached by the byssus threads of mussels. This closeassociation between mussels and algae, which co-occur down to a depth of more than 20 m in the BalticSea, is likely further enhanced by the ability of Mytilusto clear the water and regenerate nutrients which maybe of great importance for the algae (Kautsky & Wal-lentinus 1980). The presence of macroalgae in musselpatches is in turn an important secondary factor indetermining the community structure of the fauna(Arrontes 1999, Buschbaum 2000). Thus, in large
84

Norling & Kautsky: Mytilus patches as islands of high biodiversity
patches with denser F. lumbricalis cover, Amphipodaand Isopoda became much more frequent togetherwith the algae-feeding nudibranch.
In addition to the positive species-richness effect, thenumber of functional groups increased when musselswere present. Compared to the sediment control,where 5 functional groups were found, with domi-nance of the subsurface detritivore Macoma balthicaand surface detritivore Hydrobia ulvae, additionalfilter feeders, herbivores and primary producers werefound in Mytilus patches, which had a total of 8 func-tional groups. In the patches, the biomass of herbivoresincreased with increasing patch size, with microalgaeherbivores having high abundance in the smallpatches but being replaced by macroalgae herbivoresand omnivores in the largest patches and the musselbed. Thus the largest increase with patch size was ob-served in algae grazers such as amphipods and isopodsthat feed or seek shelter in the increasing amount ofalgae.
While the number of meiofauna taxa was not differ-ent in Mytilus patches, compared to 30 cm outside thepatches or in the control area 3 m away, the abundancewas significantly higher within and outside patchesthan in the control area. The difference was mainlydue to a domination of nematodes inside the musselpatches and bed, which corresponds well with Radzie-jewska (1986), who showed that nematodes dominatedthe meiobenthos in Baltic subtidal sediments and hadhigher densities in the immediate neighbourhood ofmussel patches. The Copepoda abundance in the pre-sent study was also higher inside the patches, and ashift was observed in the copepod community, wherelarger Cyclopoida totally dominated in patches at thecost of smaller Harpacticoida, which were more abun-dant outside the patches.
The higher meiofauna abundance inside patchescould be related to the organic content of the sedimentup to a patch size of 314 cm2. However, at the musselbed scale, with organic content twice as high as in thelargest patches, no relationship was found. This maybe explained by the organic content having exceededthe optimal level for the meiofauna beyond which e.g.the oxygen level goes down, indicated by a smell ofhydrogen sulphide in sediment cores from the musselbed. The large differences in organic content betweenpatches and bed may be due to differences in hydro-dynamic conditions around patches compared to amature bed, and to the age of patches. While allpatches were probably >5 yr old, based on observedpopulation size structure (cf. Kautsky 1982), the bedwas substantially older, resting on a thicker layer ofdead shells and old biodeposits.
Even the smallestMytilus patches profoundly changedthe surface sediment characteristics and had signifi-
cantly higher organic content, compared to outside thepatches and the control area. Annual biodepositionwithin a 100 cm2 patch generated by mussels with anaverage biomass of 9.26 g DW including shells (as ob-served in the present study) would be about 3.1 g DW,1.2 g carbon, 0.16 g nitrogen and 0.02 g phosphorus,which is much higher than the natural sedimentationover the same area, but less than in a more marinemussel bed (recalculated from Kautsky & Evans 1987).As shown in the present study, only part of this is,however, accumulated within the patch, leading toenriched sediment, while the rest is consumed by theassociated fauna, degraded by micro-organisms, orre-suspended and exported to surrounding areas. Theobserved increase in abundance of fauna and biomassof macroalgae with patch size is partly due to struc-ture, but also due to the mussels supplying functionalresources that increase carrying capacity and biomass,in accordance with a study on the Swedish west coastwhere the associated community was supplied with 24to 31% of its energy demand by the mussels (Norling& Kautsky 2007).
In contrast to our results, which show predominantlypositive effects of organic enrichment, studies frommore marine areas usually show significantly lowerabundances of meiofauna and macroscopic infaunawithin mussel patches, compared to outside, due tohigh accumulation of organic matter and oxygendepletion (Dittmann 1990, Commito & Dankers 2001).This difference is probably due to the fact that lowsalinities in the Baltic Sea lead to smaller size, weakerbyssus threads and lower physiological activity ofmussels (Tedengren & Kautsky 1986), which resultsin thinner and more loosely connected mussel bedmatrices and lower biodeposition per area, comparedto the more marine mussel beds that have large highlyactive mussels which form complex matrices and arethereby likely to trap more sediment.
The present study showed that several abiotic andbiotic factors change with patch size, due to structuralas well as functional traits of Mytilus and that this hadlarge effects on the associated fauna and flora. Abovethe sediment surface, facilitating effects by the musselsincreased with increasing patch size and showed thatthis predominately small-patch habitat has a largeeffect on biodiversity. The low level is probably due tothe low species diversity of the Baltic Sea. In the sedi-ment beneath the patches, the inhibiting effects werenot as clear as we had hypothesised and at the musselbed scale it was only pronounced for the meiofaunaabundance. Opposite to what was expected, thespecies richness of macro-infauna was higher beneathpatches, compared to the bare sediment.
We conclude that the presence of Mytilus may be asimportant for species diversity in the Baltic Sea as the
85

Aquat Biol 4: 75–87, 2008
Fucus vesiculosus community, by having an almost ashigh number of associated species. Mytilus has aneven wider distribution and, most importantly, thecapacity of transforming a species-poor soft bottominto a high-diversity environment. Even very smallpatches will increase abundance and biodiversity (spe-cies richness) of associated fauna and flora, which willhave implications when studying spatial biodiversitypatterns in sediment communities. Furthermore, themussels make it possible for algae to colonise thissediment habitat, which in turn attracts and supportseven more species. Both the structural and functionaleffects of Mytilus are important for biodiversity. Withincreasing patch size, the functional effects becomemore pronounced, but in comparison to more marineareas, the inhibiting effects of biodeposition are weak.
Acknowledgements. We thank S. Qvarfordt, K. Norling andA. Wallin for field assistance, the staff at Askö Laboratory fortheir helpfulness, and are grateful for valuable commentsfrom S. Wikström, R. Elmgren, A. Norkko and C. Bradshawthat improved earlier drafts. Funding for this project wasprovided by the Swedish Environmental Protection Agencythrough the MARBIPP program, Stockholm Marine ResearchCenter (SMF), Royal Swedish Academy of Sciences (KVA),H. Ax:son Johnsons and E & B Swartz Foundation.
LITERATURE CITED
Albrecht AS (1998) Soft bottom versus hard rock: communityecology of macroalgae on intertidal mussel beds in theWadden Sea. J Exp Mar Biol Ecol 229:85–109
Ankar S, Elmgren R (1976) The benthic macro- and meio-fauna of the Askö-Landsort area. Contrib Askö Lab UnivStockholm 11:1–115
Arrontes J (1999) On the evolution of interactions betweenmarine mesoherbivores and algae. Bot Mar 42:137–155
Beadman HA, Kaiser MJ, Galanidi M, Shucksmith R, WillowsRI (2004) Changes in species richness with stocking den-sity of marine bivalves. J Appl Ecol 41:464–475
Bruno JF, Bertness MD (2001) Habitat modification and facil-itation in benthic marine communities. In: Bertness MD,Gaines SD, Hay ME (eds) Marine community ecology.Sinauer Associates, Sunderland, MA, p 201–218
Bruno JF, Stachowicz JJ, Bertness MD (2003) Inclusion offacilitation into ecological theory. Trends Ecol Evol 18:119–125
Buschbaum C (2000) Direct and indirect effects of Littorinalittorea (L.) on barnacles growing on mussel beds in theWadden Sea. Hydrobiologia 440:119–128
Chintiroglou CC, Damianidis P, Antoniadou C, Lantzouni M,Vafidis D (2004) Macrofauna biodiversity of mussel bedassemblages in Thermaikos Gulf (northern Aegean Sea).Helgol Mar Res 58:62–70
Commito JA (1987) Adult-larval interactions: predictions,mussels and cocoons. Estuar Coast Shelf Sci 25:599–606
Commito JA, Dankers N (2001) Dynamics of spatial and tem-poral complexity in European and North American softbottom mussel beds. In: Reise K (ed) Ecological compari-sons of sedimentary shores. Springer-Verlag, Heidelberg,p 39–59
Crooks JA (1998) Habitat alteration and community-leveleffects of an exotic mussel, Musculista senhousia. MarEcol Prog Ser 162:137–152
Dayton PK (1972) Towards an understanding of communityresilience and the potential effects of enrichments tothe benthos at McMurdo Sound, Antarctica. Proc ColloqConserv Probl Antarct:81–96
Dittmann S (1990) Mussel beds – amensalism or ameliorationfor intertidal fauna? Helgol Mar Res 44:335–352
Dybern BI, Ackefors H, Elmgren R (1976) Recommendationson methods for marine biological studies in the Baltic Sea.Baltic Mar Biol Publ 1:51–63
Fauchald K, Jumars P (1979) The diet of worms: a study ofpolychaete feeding guilds. Oceanogr Mar Biol Annu Rev17:193–284
Gutiérrez JL, Jones CG, Strayer DL, Iribarne OO (2003) Mol-lusks as ecosystem engineers: the role of shell productionin aquatic habitats. Oikos 101:79–90
Haage P, Jansson BO (1970) Quantitative investigations of theBaltic Fucus belt macrofauna. Ophelia 8:187–195
Hacker SD, Gaines SD (1997) Some implications of direct pos-itive interactions for community species diversity. Ecology78:1990–2003
Jones CG, Lawton JH, Shachak M (1994) Organisms as eco-system engineers. Oikos 69:373–386
Kautsky N (1974) Quantitative investigation of the red algalbelt in the Askö area, northern Baltic proper. Contrib AsköLab Univ Stockholm 3:1–29
Kautsky N (1982) Growth and size structure in a BalticMytilus edulis population. Mar Biol 68:117–133
Kautsky N, Evans S (1987) Role of biodeposition by Mytilusedulis in the circulation of matter and nutrients in a Balticcoastal ecosystem. Mar Ecol Prog Ser 38:201–212
Kautsky N, Wallentinus I (1980) Nutrient release from a BalticMytilus-red algal community and its role in benthic andpelagic productivity. Ophelia 1:17–30
Kautsky N, Johannesson K, Tedengren M (1990) Genotypicand phenotypic differences between Baltic and North Seapopulations of Mytilus edulis evaluated through recipro-cal transplantations. 1. Growth and morphology. Mar EcolProg Ser 59:203–210
Kautsky U, Kautsky H (1995) Coastal production in the BalticSea. In: Eleftheriou A, Ansell D, Smith CJ (eds) The bio-logy and ecology of shallow coastal waters. Olsen & Olsen,Fredensborg, p 31–38
Kijewski TK, Zbawicka M, Väinölä R, Wenne R (2006) Intro-gression and mitochondrial DNA heteroplasmy in theBaltic populations of mussels Mytilus trossulus and M.edulis. Mar Biol 149:1371–1385
Norkko A, Hewitt JE, Thrush SF, Funnell GA (2001) Benthic-pelagic coupling and suspension-feeding bivalves: linkingsite-specific sediment flux and biodeposition to benthiccommunity structure. Limnol Oceanogr 46:2067–2072
Norling P, Kautsky N (2007) Structural and functional ef-fects of Mytilus edulis on diversity of associated speciesand ecosystem functioning. Mar Ecol Prog Ser 351:163–175
Peake AJ, Quinn GP (1993) Temporal variation in species-area curves for invertebrates in clumps of an intertidalmussel. Ecography 16:269–277
Quinn GP, Keough MJ (2002) Experimental design and dataanalysis for biologists. Cambridge University Press, Cam-bridge
Råberg S (2004) Competition from filamentous algae on Fucusvesiculosus—negative effects and the implications on bio-diversity of associated flora and fauna. Licentiate Philthesis, Stockholm University
86

Norling & Kautsky: Mytilus patches as islands of high biodiversity
Radziejewska T (1986) On the role of Mytilus edulis aggrega-tions in enhancing meiofauna communities off the south-ern Baltic coast. Ophelia 4:211–218
Ragnarsson SA, Raffaelli D (1999) Effects of the musselMytilus edulis L. on the invertebrate fauna of sediments.J Exp Mar Biol Ecol 241:31–43
Remane A, Schlieper C (1971) Biology of brackish water. JohnWiley & Sons, New York
Saier B (2002) Subtidal and intertidal mussel beds (Mytilusedulis L.) in the Wadden Sea: diversity differences of asso-ciated epifauna. Helgol Mar Res 56:44–50
Seed R (1996) Patterns of biodiversity in the macro-inverte-brate fauna associated with mussel patches on rockyshores. J Mar Biol Assoc UK 76:203–210
Svane I, Setyobudiandi I (1996) Diversity of associated faunain beds of the blue mussel Mytilus edulis L.: effects oflocation, patch size, and position within a patch. Ophelia45:39–53
Tedengren M, Kautsky N (1986) Comparative study of thephysiology and its probable effect on size in blue mussels(Mytilus edulis L.) from the North Sea and the northernBaltic Proper. Ophelia 25:147–155
Thiel M, Ullrich N (2002) Hard rock versus soft bottom: the
fauna associated with intertidal mussel beds on hard bot-toms along the coast of Chile, and considerations on thefunctional role of mussel beds. Helgol Mar Res 56:21–30
Tsuchiya M, Nishihira M (1985) Islands of Mytilus as a habitatfor small intertidal animals: effect of island size on com-munity structure. Mar Ecol Prog Ser 25:71–81
Tsuchiya M, Nishihira M (1986) Islands of Mytilus edulis as ahabitat for small intertidal animals: effect of Mytilus agestructure on the species composition of the associatedfauna and community organization. Mar Ecol Prog Ser 31:171–178
Tsuchiya M, Retière C (1992) Zonation of intertidal organismsand community structure of small animals associated withpatches of mussel Mytilus edulis L. along the rocky coastof Dinard, Brittany, France. Bull Coll Sci Univ Ryukyus54:47–81
Widdows J, Brinsley MD, Salkeld PN, Elliott M (1998) Use ofannular flumes to determine the influence of currentvelocity and bivalves on material flux at the sediment-water interface. Estuaries 21:552–559
Witman JD (1985) Refuges, biological disturbance, and rockysubtidal community structure in New England. EcolMonogr 55:421–445
87
Editorial responsibility: Matthias Seaman, Oldendorf/Luhe, Germany
Submitted: March 28, 2008; Accepted: September 25, 2008Proofs received from author(s): November 10, 2008