Patch loading resistance of plated girders - Ultimate and...
200
DOCTORAL THESIS Luleå University of Technology Department of Civil, Mining and Environmental Engineering Division of Structural Engineering - Steel Structures 2007:30|:02-5|: - -- 07⁄30 -- 2007:30 Patch Loading Resistance of Plated Girders -Ultimate and serviceability limit state- Jonas Gozzi
Transcript of Patch loading resistance of plated girders - Ultimate and...
DOCTORA L T H E S I S
Luleå University of TechnologyDepartment of Civil, Mining and Environmental Engineering
Division of Structural Engineering - Steel Structures
2007:30|: 02-5|: - -- 07⁄30 --
2007:30
Patch Loading Resistance of Plated Girders
-Ultimate and serviceability limit state-
Jonas Gozzi


Doctoral Thesis 2007:30
Patch Loading Resistance of Plated Girders
-Ultimate and serviceability limit state-
Jonas Gozzi
Luleå University of TechnologyDepartment of Civil and Environmental EngineeringDivision of Structural Engineering - Steel Structures
SE - 971 87 Luleå, Swedenwww.ltu.se
June 2007


I
PREFACE
After almost three years of work regarding constitutive models and mechanical behaviour of steel, which ended up in my Licentiate thesis, my supervisor Professor Ove Lagerqvist asked me if I could picture myself working with patch loading the next couple of years. Since I was rather tired of material modelling, which by the way isn't that related to the other research conducted at the division, I said yes without any doubts. If that was the right answer I still don't know but it clearly was inspiring to focus on something else, and further, it brought Ove closer to my research which has been a pleasure for me. Not to mention his invaluable knowledge in the field, his ideas and his inventive jokes. Thanks for these years!
The change of research subject also involved the newly retired Professor Bernt Johansson in my project. I am sincerely grateful for your engagement, your ideas and your comments on the content in this thesis!
However, non of this would have been possible without the financial support from the Research Fund for Coal and Steel, RFCS, who sponsored the project ComBri, “Competitive Steel and Composite Bridges by Improved Steel Plated Structures”, in which most of the work in this thesis was conducted. Further, also the Development Fund of the Swedish Construction Industry, SBUF, and Luleå University of Technology have contributed financially to this work. They are all hereby thankfully acknowledged.
My professional collaboration with Dr. Anders Olsson ended with the Licentiate thesis but you stayed as a friend and sounding-board even afterwards. Thanks for careful reading of the manuscript and I look forward to late-night Dry Martinis on your terrace now that we are almost neighbours!
Friends and colleagues at the Division of Structural Engineering in general and the research group for Steel Structures in particular, headed by associate professor Milan Veljkovic who always have interesting ideas when it comes to FEM, are hereby deeply acknowledged. I will really miss you now when my journey continuous elsewhere.
The experimental work carried out in this thesis would not have been possible without the qualified personnel at Complab, especially Georg Danielsson, Lars Åström and ClaesFahlesson deserves an acknowledgement.

Preface
II
Further, also my science partner Mattias Clarin was deeply involved in the experimental part of this work as well as in the finite element studies of the tested girders. We have experienced a lot during the years, from hunted by a crazy lady in Shanghai and skiing trips to the “Country boarder” to early and heavy field trips after “Stålbyggnadsdagen” and several discussions late at nights both related to work but mostly not. I am very grateful for your support and collaboration, thanks mate!
In January 2007 me and my family left Luleå for new adventures. I got a job opportunity at SSAB Tunnplåt and I am very thankful to Joachim Larsson and Janne Kuoppa who gave me the chance to finish this thesis here in Borlänge! Also the rest of the Design group are acknowledged for treating me as a team member even though I have mostly focused on this thesis.
Last but definitely not least, the persons who really supported me and made me finish the thesis without spending too many late nights and weekends at work, my wife Lina and our daughter Elsa. I give you all my love!
Borlänge, June 2007
Jonas Gozzi
III
SUMMARY
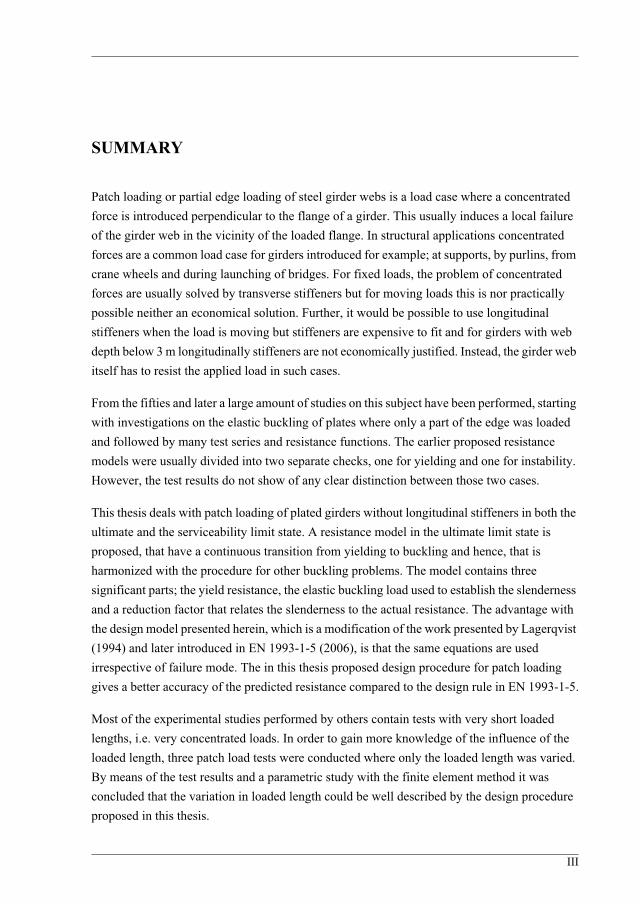
Patch loading or partial edge loading of steel girder webs is a load case where a concentrated force is introduced perpendicular to the flange of a girder. This usually induces a local failure of the girder web in the vicinity of the loaded flange. In structural applications concentrated forces are a common load case for girders introduced for example; at supports, by purlins, from crane wheels and during launching of bridges. For fixed loads, the problem of concentrated forces are usually solved by transverse stiffeners but for moving loads this is nor practically possible neither an economical solution. Further, it would be possible to use longitudinal stiffeners when the load is moving but stiffeners are expensive to fit and for girders with web depth below 3 m longitudinally stiffeners are not economically justified. Instead, the girder web itself has to resist the applied load in such cases.
From the fifties and later a large amount of studies on this subject have been performed, starting with investigations on the elastic buckling of plates where only a part of the edge was loaded and followed by many test series and resistance functions. The earlier proposed resistance models were usually divided into two separate checks, one for yielding and one for instability. However, the test results do not show of any clear distinction between those two cases.
This thesis deals with patch loading of plated girders without longitudinal stiffeners in both the ultimate and the serviceability limit state. A resistance model in the ultimate limit state is proposed, that have a continuous transition from yielding to buckling and hence, that is harmonized with the procedure for other buckling problems. The model contains three significant parts; the yield resistance, the elastic buckling load used to establish the slenderness and a reduction factor that relates the slenderness to the actual resistance. The advantage with the design model presented herein, which is a modification of the work presented by Lagerqvist (1994) and later introduced in EN 1993-1-5 (2006), is that the same equations are used irrespective of failure mode. The in this thesis proposed design procedure for patch loading gives a better accuracy of the predicted resistance compared to the design rule in EN 1993-1-5.
Most of the experimental studies performed by others contain tests with very short loaded lengths, i.e. very concentrated loads. In order to gain more knowledge of the influence of the loaded length, three patch load tests were conducted where only the loaded length was varied. By means of the test results and a parametric study with the finite element method it was concluded that the variation in loaded length could be well described by the design procedure proposed in this thesis.
Summary
IV
For a bridge girder, the problem concerning resistance to patch loading usually occurs during launching. Bridge launching is a common method to erect steel and composite bridges and means that the bridge girders are assembled on ground behind the abutment and then pushed out over launching shoes into the final position. The launching shoe on which the girder travels will introduce a concentrated force to the girder, which can be of a magnitude that governs the web thickness and even a small increase of the web thickness can add a substantial amount of steel. Therefore, it is important to find a suitable criterion for the serviceability limit state for patch loading, i.e. for bridge launching. Compared to the ultimate resistance the amount of available research considering the serviceability limit state is very limited. In fact, only one serviceability limit criterion proposed by Granath (2000), which was developed for stationary loadings, was found.
A number of FE-analyses of the launching process were carried out to investigate at what loads different girder cross sections will have a repeatable behaviour. A girder section of a bridge girder was subjected to several repeated travelling loads corresponding to a long bridge girder launched over several supports together with a co-existing bending moment. By means of these FE-analyses a serviceability criterion is established with a limit criterion not allowing any effective plastic membrane strains. The bridge designer can beneficially use the proposed serviceability criterion for bridge launching.
V
SAMMANFATTNING
I flertalet praktiska fall belastas stålbalkar av koncentrerade laster. Detta lastfall kallas lokal intryckning och det ger upphov till vertikala tryckspänningar i balklivet som är störst under den belastade flänsen och avtar sedan till den motsatta flänsen. Koncentrerade laster kan t ex uppträda vid stöd, under åsar, som hjultryck på kranbanebalkar och vid lansering av brobalkar. För laster som har ett bestämt läge, som t ex vid stöd, löses problemet oftast med tväravstyvningar. När rörliga laster är aktuella är det dock lite svårare. För det första är avstyvningar generellt sett dyra att montera och för det andra är det naturligtvis inte möjligt att ha avstyvningar överallt när lasten förflyttas. Ett annat alternativ är längsgående avstyvningar som höjer bärförmågan med avseende på lokal intryckning men dessa är förstås också dyra att montera. För höga balkar, över 3 m, behövs ofta längsgående avstyvningar av andra skäl men för balkar under 3 m är det inte ekonomiskt försvarbart. Med andra ord måste rörliga laster för balkar med en livhöjd under 3 m bäras av livet självt och för det krävs tillförlitliga dimensioneringsregler.
Föreliggande avhandling behandlar lokal intryckning av svetsade balkar utan längsgående avstyvningar i brott- och bruksgränstillstånd. När det gäller brottgränstillstånd finns det stora mängder publicerat material från provning och inom områdena kritisk bucklingslast samt bärförmågefunktioner. Tidigare var ofta bärförmågefunktionerna uppdelade på två funktioner, en för flytning och en för instabilitet. Det är dock svårt att separera dessa och inga försök visar på en klar skillnad mellan flytning och instabilitet. Lagerqvist (1994) tog ett stort steg i detta avseende och föreslog en bärförmågefunktion harmoniserad med de modeller som används vid andra bucklings- och stabilitetsproblem. Det innebär att modellen har en gradvis övergång mellan flytning och buckling. Beräkningsmodellen består av tre olika delar, ett uttryck för den plastiska bärförmågan, den kritiska bucklingslasten och en reduktionsfaktor som är empiriskt kalibrerad mot försöksdata. Lagerqvists modell har senare blivit implementerad i Eurokod 3 del 1.5, EN 1993-1-5 (2006). I denna avhandling föreslås en modifierad variant av bärförmågefunktionen i Eurokod 3 som ger mindre spridning jämfört med försöksdata och dessutom avlägsnar den diskontinuitet som finns i beräkningsmodellen idag.
Vidare har nästan all tidigare forskning fokuserats på mycket koncentrerade laster, d v s korta lastlängder. För att öka förståelsen för lastlängdens inverkan på bärförmågan och för att fylla luckorna i försöksdatabasen har tre försök utförts i detta arbete. Försöken genomfördes på tre identiska svetsade balkar med tre olika lastlängder. Utifrån försöksresultaten och en efterföljande parameterstudie med hjälp av finita elementmetoden kunde det konstateras att den
Sammanfattning
VI
föreslagna bärförmågefunktionen också kan användas för långa lastlängder. Upp till 1,2 gånger livhöjden kontrollerades med tillfredställande resultat.
När det gäller bruksgränstillstånd finns det betydligt färre publicerade artiklar. Det enda egentliga kriteriet föreslogs av Granath (2000) för balkar utsatta för en stationär koncentrerad last. En brobalk utsätts normalt endast för intryckning under själva produktionen, d v s om den lanseras. Lansering av stålbroar och samverkansbroar är vanligt, speciellt långa broar som är för tunga att lyftas på plats. Vidare är det en bra metod om bron skall sträcka sig över vatten eller vägar/järnvägar och området under bron ej kan användas. Under lanseringen sammanfogas brobalkar bakom ena landfästet och skjuts sedan ut över lanseringslager till dess slutliga position. Vid lanseringen utsätts stålbalkarna för relativt stora koncentrerade laster från stöden som balken glider på. Dessa laster är alltså inte stationära utan rörliga och kan vara så stora att de bestämmer livtjockleken. Eftersom en liten ökning i livtjocklek skulle öka mängden stål avsevärt är det därför viktigt att på ett bra sätt kunna uppskatta livets bärförmåga i ett sådant fall. Eftersom detta kan ses som ett bruksgränstillstånd och inte är det lastfall som brobalken är dimensionerad för primärt, bör kravet vara att balken ej ska få kvarstående deformationer under lanseringen. Om brobalken dessutom lanseras över många stöd och om kvarstående deformationer uppstår som växer vid varje ny passage kan det bli problem att bära de laster som balken egentligen var dimensionerad för. Vidare har det blivit vanligare att lansera brobalkar där betongfarbanan gjuts innan lanseringen. Detta ökar förstås egentyngden och därigenom också de koncentrerade lasterna från lanseringslagren.
I denna avhandling har detta studerats med hjälp av finita elementanalyser av broelement. Ett antal olika tvärsnitt har utsatts för ett konstant böjande moment och en koncentrerad last som vandrar längs flänsen. Detta har upprepats tre gånger och en last har bestämts när inga effektiva plastiska membrantöjningar har utvecklats i livet vilket i sin tur innebär att de kvarstående deformationerna ej växer för varje ny lastpassage. Utifrån dessa laster har ett bruksgränskriterium etablerats för brolansering, d v s för rörliga laster.

VII
NOTATIONS AND SYMBOLS
Notations and symbols used in this thesis are listed and explained here in alphabetical order.
a width of web panel between transverse stiffeners
distance between yield lines in the web
, F imperfection factor
b correction factor
b width
beff effective width
bf flange width
1 2 distance between plastic hinges in the flange
cu half of the length of the web resisting the applied force
D plate stiffness
error term
web imperfection
i observed error term for test specimen i obtained from a comparison of rei and
w vertical displacement of flange under load
E Young’s modulus
strain
yield total strain at yield point
f* reference yield strength taken as 300 MPa
fu ultimate tensile strength
fy yield strength
fy,nom nominal yield strength
G KD hw---------------
b rti
Notations and symbols
VIII
fyw yield strength of the web material
fyf yield strength of the flange material
F safety factor
F applied force in test
FE applied transverse force or patch load
FFE applied transverse force in finite element simulations in the serviceability limit state
FFE,sls level of applied transverse force that gave reversible behaviour according to finite element simulations
FFEM load where no effective stresses above the yield strength appear at the web surface from finite element analysis
Fcr elastic critical buckling load
FR patch loading resistance
FRc patch loading resistance, crippling or buckling
FRd design resistance
FRy patch loading resistance, yielding
FR,int patch loading resistance recalculated to fulfil the interaction equation with bending moment
FR,sls patch loading resistance in the serviceability limit state
Fslender patch loading resistance in the serviceability limit state, slender girders
Fstocky patch loading resistance in the serviceability limit state, stocky girders
Fu ultimate load from test
Fu,FE ultimate load from finite element analysis
Fy yield resistance
resistance function of the basic variables used as design model
torsional stiffness of the flange
distance from loaded flange to first yield line in the web
M partial factor for the resistance
M* corrected partial factor for resistance
grt X
G K
IX
M1 partial factor for members susceptible to instability
hw web depth
yielded length of the web not offering any resistance to bending deformations
generalized imperfection factor,
If second moment of area, flange
reduction factor
F reduction factor for patch loading
F,sls reduction factor for the serviceability limit state that reduces the ultimate resistance to a serviceability resistance
kd,n design fractile factor
kn characteristic fractile factor
k buckling coefficient for plate buckling
kF buckling coefficient for patch loading
kFs buckling coefficient for a simply supported plate
kFc buckling coefficient for a plate with clamped longitudinal edges
K numerical constant
ly effective loaded length
ly,FE effective loaded length obtained from finite element analysis
normalized effective loaded length from finite element analysis
effective loaded length, including both m1 and m2, normalized with ly,FE
effective loaded length, including only m1, normalized with ly,FE
Leff effective length for resistance to transverse forces,
correction factor taking into account the influence from a/hw on kF
a function of the girder dimensions and material properties
slenderness parameter
, plateau length
slenderness parameter for patch loading
m average
0–=
ly FE,
ly m1 m2+,
ly m1,
Leff F ly=
0 F0
F
Notations and symbols
X
M0 initially applied external bending moment in finite element analysis
ME applied bending moment
Mi plastic moment resistance, inner plastic hinge
Mo plastic moment resistance, outer plastic hinge
Mpf plastic moment resistance, flange
Mpw plastic moment resistance, web
MR bending moment resistance according to EN 1993-1-5
Mu,FE ultimate bending moment from finite element analysis
friction coefficient
Poisson’s ratio
r resistance value
rd design value of the resistance
re experimental resistance value
rei experimental resistance value for specimen i
rk characteristic value of the resistance
rm resistance value calculated using the mean values Xm of the basic variables
rn nominal value of the resistance
rt theoretical resistance determined from the resistance function
rti theoretical resistance determined using the measured parameters X for specimen i
s standard deviation
ss loaded length
sy distance between plastic hinges in the flange
stress
mean stress
c compression stress
critical stress
max maximum stress
grt X
cr

XI
min minimum stress
w stress in the web
t thickness
t* reference web thickness taken as 2,5 mm
ti idealized flange thickness
tnom nominal web thickness
tf flange thickness
tw web thickness
angle defining the deformation of the web at the yield lines
V coefficient of variation
V estimator for the coefficient of variation of the error term
VE applied shear
VR shear resistance
Vr
Vrt coefficient of variation of the basic variables, Vrt = 0,08
W section modulus
Weff effective section modulus according to EN 1993-1-5
Wel elastic section modulus
mean deviation from 1
X basic variables X1,..., Xj
Xm mean values of the basic variables
Vr V 2 Vrt2+=
xerror

Notations and symbols
XII
XIII
TABLE OF CONTENTS
PREFACE ..................................................................................................... I
SUMMARY ............................................................................................... III
SAMMANFATTNING .............................................................................. V
NOTATIONS AND SYMBOLS ..............................................................VII
TABLE OF CONTENTS ....................................................................... XIII
1 INTRODUCTION ............................................................................... 11.1 Background ....................................................................................................1
1.2 Scope and limitations .....................................................................................3
1.3 Outline and content ........................................................................................4
2 REVIEW OF EARLIER WORK ........................................................ 52.1 General ...........................................................................................................5
2.1.1 Approach for design of structural elements subjected to buckling ............. 6
2.2 Elastic critical buckling load .........................................................................9
2.3 Ultimate resistance ......................................................................................182.3.1 Empirical models and other non-mechanism models ............................... 182.3.2 Mechanism models ................................................................................... 222.3.3 Interaction with bending moment ............................................................. 392.3.4 Interaction with shear ................................................................................ 422.3.5 Review of experimental investigations ..................................................... 43
2.4 Serviceability limit state ..............................................................................43
2.5 Summary of the review ................................................................................48
Table of Contents
XIV
3 EXPERIMENTAL WORK ............................................................... 513.1 General ........................................................................................................ 51
3.2 Uniaxial coupon tests .................................................................................. 51
3.3 Patch loading tests ....................................................................................... 523.3.1 Geometry and test set-up ...........................................................................523.3.2 Measurements ........................................................................................... 55
3.4 Test results .................................................................................................. 583.4.1 P200 ........................................................................................................... 583.4.2 P700 ........................................................................................................... 643.4.3 P1440 .........................................................................................................69
3.5 Concluding remarks from the experimental work ...................................... 74
4 NUMERICAL STUDY ..................................................................... 774.1 General ........................................................................................................ 77
4.2 Finite element model ................................................................................... 77
4.3 Calibration ................................................................................................... 79
4.4 Parametric study .......................................................................................... 82
4.5 Concluding remarks from the numerical study ........................................... 83
5 PATCH LOADING RESISTANCE .................................................. 855.1 General ........................................................................................................ 85
5.2 Yield resistance ........................................................................................... 85
5.3 Proposed design procedure ......................................................................... 92
5.4 Statistical evaluation of the proposed design procedure ........................... 101
5.5 Comparison with other models ................................................................. 102
5.6 Concluding remarks .................................................................................. 104
6 BRIDGE LAUNCHING - A SERVICEABILITY LIMIT STATE 1076.1 General ...................................................................................................... 107
6.2 Bridge launching ....................................................................................... 108
6.3 Numerical study ........................................................................................ 1106.3.1 Finite element model and method ...........................................................1116.3.2 Results from the numerical study ............................................................ 115
6.4 Proposed criteria for bridge launching ...................................................... 121
6.5 Concluding remarks .................................................................................. 124

XV
7 DISCUSSION AND CONCLUSIONS ........................................... 1277.1 Discussion ..................................................................................................127
7.2 Conclusions ...............................................................................................131
7.3 Future work ................................................................................................132
REFERENCES ........................................................................................ 133
APPENDIX A UNIAXIAL COUPON TESTS ................................... 139
APPENDIX B PATCH LOADING TESTS ........................................ 143
B.1 Measured girder dimensions ......................................................................143
B.2 Strain gauge layout on girder webs ...........................................................143
B.3 Force - strain curves for the P200 test .......................................................144
B.4 Force - strain curves for the P700 test .......................................................147
B.5 Force - strain curves for the P1440 test .....................................................149
APPENDIX C DATA FROM TESTS BY OTHERS ......................... 151
APPENDIX D INFLUENCE OF VARIOUS PARAMETERS .......... 169
APPENDIX E ANNEX D OF EN 1990 (2002) .................................. 173

Table of Contents
XVI

1
1 INTRODUCTION
1.1 Background
It is common that steel girders in structures are subjected to concentrated transverse forces. Such concentrated forces acting perpendicular to the flange is denoted patch loading. In general structures such problems are usually solved by transverse stiffeners. This solution works well when the load is fixed at a position for example at supports. However, stiffeners are expensive to fit and if the load is moving, e.g. crane wheels, it is difficult to solve the problem in this way. Another example which also is difficult to solve by transverse stiffeners is launching of bridges. This is a common method to erect steel and composite bridges to heavy to lift into position. Instead, the bridge sections are assembled on ground behind the abutment and then pushed out over launching shoes or rollers into position. In this case concentrated forces are introduced to the girders from the launching shoe. Further, as the girder is launched the support reactions from the launching shoes are introduced to the girders at various positions along the girder. These concentrated forces can be of the magnitude that governs the web thickness and even a small increase of the web thickness may add a substantial amount of steel. Moreover, there is a trend in construction of composite bridges to cast the concrete bridge deck before launching, which obviously increases the self weight and consequently also the concentrated forces from the launching shoes.
For large bridges with long spans it is common that longitudinal stiffeners are attached to the web for different reasons, e.g. buckling due to bending. It was early established that such longitudinal stiffeners also increase the patch loading resistance to some extent. Generally, for girders with web depth below 3 m such longitudinally stiffeners should not be used for economical reasons but for deeper girders they might be necessary. Several studies considering the patch loading resistance of longitudinally stiffened girder webs have been carried out, e.g. by Graciano and Johansson (2003), Kuhlmann and Seitz (2004), Davaine and Aribert (2005) and recently Clarin (2007).
Between 2003 and 2006 the RFCS (Research Fund for Coal and Steel) sponsored research project ComBri (2007) “Competitive Steel and Composite Bridges by Improved Steel Plated Structures”, was carried out. The objective was to promote the wider use of steel plated structures in bridges and to improve steel plated cross sections in steel and composite bridges for the final and execution state. The project was divided into different work packages considering for example shear resistance, bending resistance and patch loading resistance. Most of the work presented in this thesis was conducted within the ComBri project.

Introduction
2
This thesis deals with patch loading resistance of plated girders without longitudinal stiffeners in both the ultimate and serviceability limit state. Considering the ultimate limit state the amount of published research is substantial and there are a great number of different proposals for how to determine the resistance. Lagerqvist (1994) took a great step forward introducing a design procedure not only valid for the three different cases, i.e. patch loading, opposite patch loading and end patch loading, but also harmonized with the design rules for other kinds of buckling problems. Before this it was common to have two criteria for the resistance, one based on yielding and one based on instability. However, the test results do not show any clear distinction between those two cases. At the end it is always a buckle in the web under the load, which size increases with increasing web slenderness. Therefore, it is concluded that there is a gradual transition between yielding and buckling as for other instability problems and this was covered in a good manner by the design procedure by Lagerqvist.
The work concerning patch loading resistance in the ultimate limit state presented herein is a continuation and modification of the procedure presented by Lagerqvist. The main focus was on two areas. First, the yield resistance which have been up for discussion several times, for example within the ComBri project, and secondly, the simplest way to increase the resistance of the web for instance when it comes to launching of bridges is to increase the length of the launching device. It is therefore of interest to investigate how this influence the resistance and a study concerning the loaded length was carried out in this thesis both by means of tests and numerical analyses.
Considering the serviceability limit state, on the other hand, the amount of published research is very limited. The only actual criterion found was presented by Granath (2000), which was a criterion based on stationary loadings. The criterion proposed herein is focused on the loadings that are introduced to a steel girder during bridge launching, i.e. including a travelling or moving patch load. The criterion itself are defined by the demand that the deformations during launching should be reversible. For simplicity, the criterion is based on the ultimate patch loading resistance multiplied with a function depending on the slenderness of the girder. It is shown by finite element analyses that the demand of a reversible behaviour gave a decreased serviceability load compared to the ultimate resistance with decreasing slenderness.
Scope and limitations
3
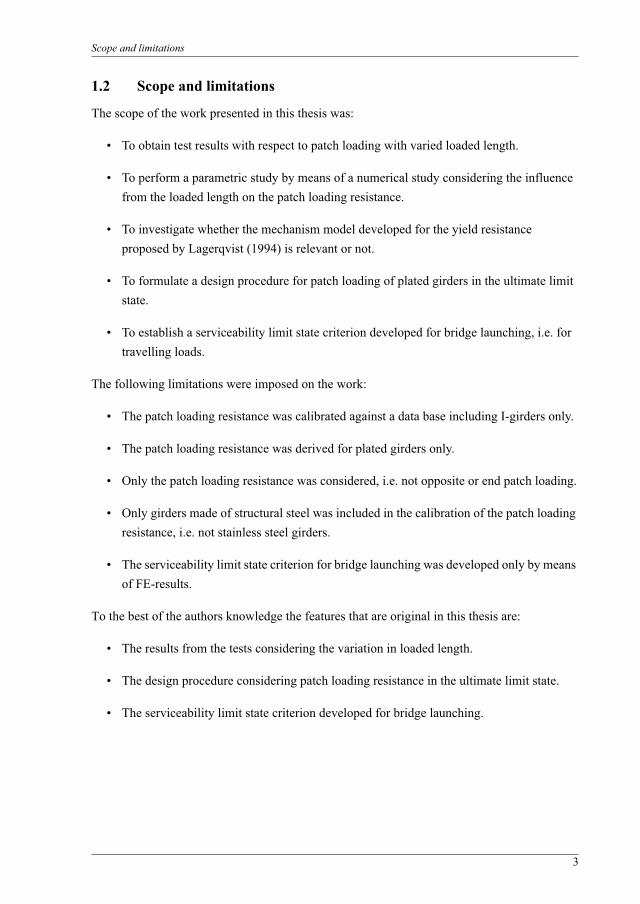
1.2 Scope and limitations
The scope of the work presented in this thesis was:
• To obtain test results with respect to patch loading with varied loaded length.
• To perform a parametric study by means of a numerical study considering the influence from the loaded length on the patch loading resistance.
• To investigate whether the mechanism model developed for the yield resistance proposed by Lagerqvist (1994) is relevant or not.
• To formulate a design procedure for patch loading of plated girders in the ultimate limit state.
• To establish a serviceability limit state criterion developed for bridge launching, i.e. for travelling loads.
The following limitations were imposed on the work:
• The patch loading resistance was calibrated against a data base including I-girders only.
• The patch loading resistance was derived for plated girders only.
• Only the patch loading resistance was considered, i.e. not opposite or end patch loading.
• Only girders made of structural steel was included in the calibration of the patch loading resistance, i.e. not stainless steel girders.
• The serviceability limit state criterion for bridge launching was developed only by means of FE-results.
To the best of the authors knowledge the features that are original in this thesis are:
• The results from the tests considering the variation in loaded length.
• The design procedure considering patch loading resistance in the ultimate limit state.
• The serviceability limit state criterion developed for bridge launching.
Introduction
4
1.3 Outline and content
Section 2 gives a review over the most important work found in the literature considering patch loading of girders without longitudinal stiffeners. It is divided into elastic critical buckling loads, resistance to patch loading in the ultimate limit state and serviceability limit state.
Sections 3 - 6 are the central parts of the thesis. In Section 3 the experimental work considering patch loading tests of girders with varying loaded length are presented. The uniaxial tensile tests performed on the plate material used in the tested girders are also described in Section 3. The calibration of the numerical model as well as a parametric study regarding the loaded length can be found in Section 4.
Section 5 contains the proposed design procedure regarding patch loading resistance in the ultimate limit state. It includes a numerical study considering the yield resistance and consequently the modified yield resistance. Further, Section 5 also includes the calibration of the new reduction factor as well as a statistical evaluation according to Annex D of EN 1990 (2002) aiming at determination of the partial safety factor, M1. Finally, Section 5 comprises a comparison with other proposed design procedures.
A serviceability limit state criterion for bridge launching is presented in Section 6, which apart from the criterion itself also includes a large numerical study on girder sections subjected to a travelling patch load and a coexisting bending moment.
Section 7 comprises a general discussion and the conclusions from the work in this thesis together with some proposals for future work.
Additional test data which was decided to take up to much space in the body of this thesis are displayed in Appendix A and B. Appendix C includes the full test data base collected by Lagerqvist (1994) and complemented with the available work performed after that. Appendix D comprises graphs showing what influence different variables have on the patch loading resistance proposed here. Finally, Appendix E contains the procedure for determination of the partial safety factor that should be applied to the resistance according to Annex D of EN 1990 (2002).
5
2 REVIEW OF EARLIER WORK
2.1 General
Patch loading or partial edge loading of steel girder webs is an area studied by many researchers over the years. From the fifties and later a large amount of studies on the subject have been performed, starting with investigations on the elastic buckling of plates where only a part of the edge was loaded and was followed by many test series and resistance functions. The resistance functions were mainly fully empirical in the beginning but from the seventies and later also semi-empirical methods were presented. Those methods were based on some kind of mechanical model, which was adjusted to fit the experimental results. However, most of the resistance models developed were divided into two separate checks, one for yielding and one for web buckling or crippling, i.e. partial buckling of the web. Though, the test results do not show of any clear distinction between direct yielding and web buckling. Further, it was early established that the web thickness and the yield strength of the web are the most important parameters when predicting the ultimate resistance of a girder subjected to patch loading.
In the mid nineties a thorough review of the work performed in the field of patch loading until then was conducted by Lagerqvist (1994). The review contained a large amount of tests, work on the elastic critical buckling load for partial edge loading and various references concerning ultimate resistance formula for patch loading. Lagerqvist came up with a method for determining the ultimate resistance for patch loading and opposite patch loading as well as end patch loading. The method of Lagerqvist was harmonized with the methods for other buckling problems, see Section 2.1.1, i.e. the method was based on three parts; the yield resistance, a slenderness parameter and a reduction factor that relates the resistance to the slenderness. A slightly modified version of this method was also implemented in Eurocode 3 for plated structural elements, EN 1993-1-5 (2006), and will be thoroughly described later in this review.
Further, as the review by Lagerqvist includes a large number of references it was decided herein to only focus on the most important contributions, in the author’s opinion, related to the work in this thesis. However, the data base of test results collected by Lagerqvist will be used for calibration of the herein proposed design model for patch loading.
In addition to the tests performed and found in the literature by Lagerqvist, other tests carried out after 1994 by others and by the author of this thesis are added to the data base. The new tests found in the literature are presented in Section 2.3.5 and the tests performed by the author are presented in Section 3.
Review of earlier work
6
Regarding serviceability limit state for girders subjected to patch loading there are a very limited amount of research available. The only proposed design model for serviceability limit state was presented by Granath (2000), which is described later in Section 2.4.
This review is divided into five parts starting with the elastic critical buckling load for a plate subjected to a partial edge load in Section 2.2. Section 2.3 describes the most important contributions regarding resistance functions for patch loading in the ultimate limit state. Section 2.3 also includes interaction between patch loading and bending moment, interaction between patch loading and shear and the last contributions to the test data base. Further, Section 2.4 deals with the somewhat limited work on serviceability limit state for girders subjected to patch loading. The review is then summarized in Section 2.5.
2.1.1 Approach for design of structural elements subjected to buckling
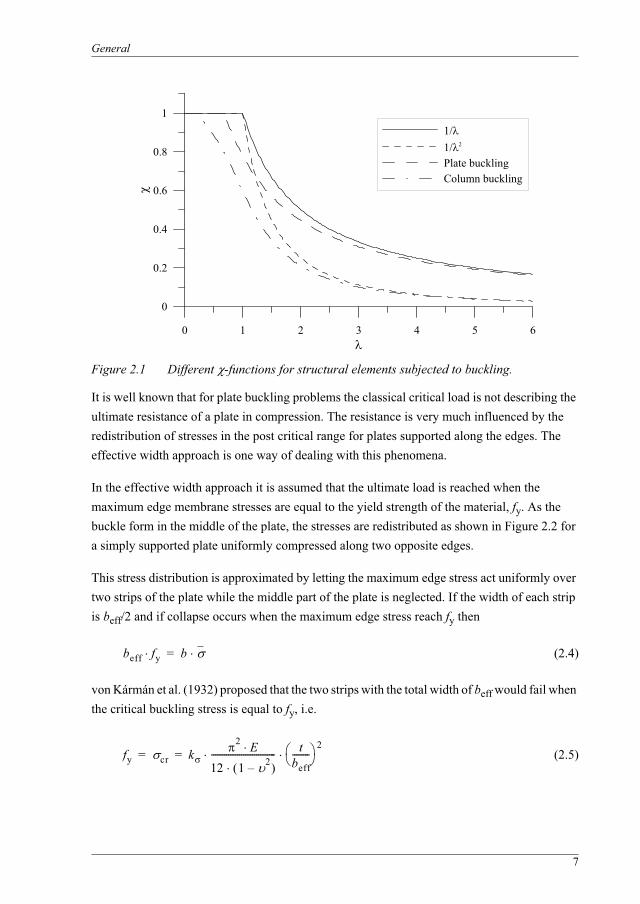
During the last 40 years a standard approach has been developed describing the resistance of structural elements subjected to various forms of buckling, see Figure 2.1. The approach includes a uniform transition between yielding and instability through three significant parts. First, a prediction of the yield resistance, Fy, that usually is taken as the maximum resistance ignoring strain hardening. Secondly, the theoretical elastic critical buckling load, Fcr, which is determined according to classical elastic buckling theory. Fcr is only used for the definition of the slenderness parameter
(2.1)
The third element in the model is a function relating the resistance to the slenderness parameter
(2.2)
In Figure 2.1 it can be seen that different buckling problems are described by quite different -functions. If FR would be equal to Fcr then together with Equation (2.1) we have
(2.3)
As can be seen in Figure 2.1 this function overestimates the resistance for column buckling except for high slenderness values.
FyFcr-------=
FRFy------ f= =
FcrFy------- 1
2-----= =
General
7
Figure 2.1 Different -functions for structural elements subjected to buckling.
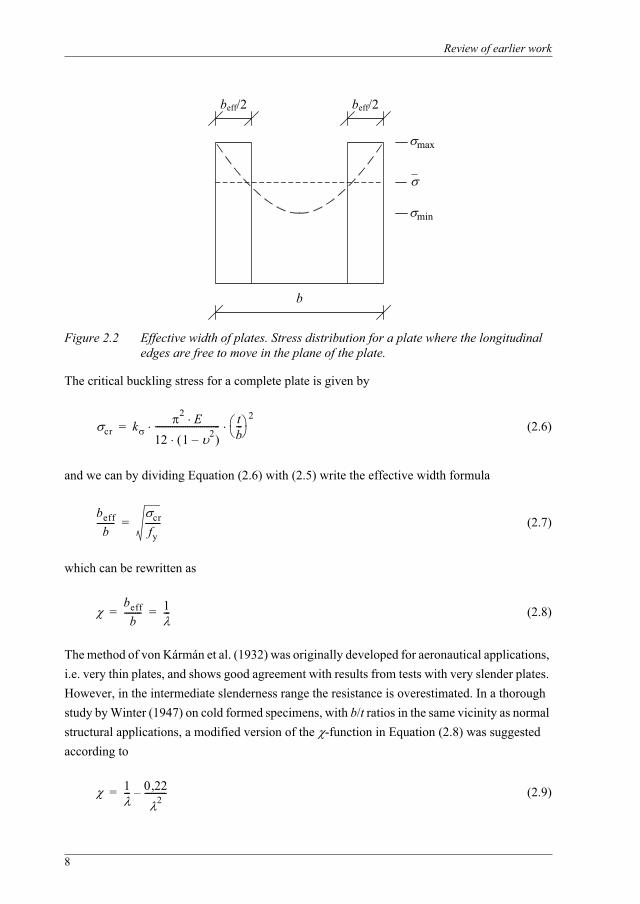
It is well known that for plate buckling problems the classical critical load is not describing the ultimate resistance of a plate in compression. The resistance is very much influenced by the redistribution of stresses in the post critical range for plates supported along the edges. The effective width approach is one way of dealing with this phenomena.
In the effective width approach it is assumed that the ultimate load is reached when the maximum edge membrane stresses are equal to the yield strength of the material, fy. As the buckle form in the middle of the plate, the stresses are redistributed as shown in Figure 2.2 for a simply supported plate uniformly compressed along two opposite edges.
This stress distribution is approximated by letting the maximum edge stress act uniformly over two strips of the plate while the middle part of the plate is neglected. If the width of each strip is beff/2 and if collapse occurs when the maximum edge stress reach fy then
(2.4)
von Kármán et al. (1932) proposed that the two strips with the total width of beff would fail when the critical buckling stress is equal to fy, i.e.
(2.5)
0 1 2 3 4 5 6
0
0.2
0.4
0.6
0.8
11/1/Plate bucklingColumn buckling
beff fy b=
fy cr k2 E
12 1 2–------------------------------ t
beff--------
2= =
Review of earlier work
8
Figure 2.2 Effective width of plates. Stress distribution for a plate where the longitudinal edges are free to move in the plane of the plate.
The critical buckling stress for a complete plate is given by
(2.6)
and we can by dividing Equation (2.6) with (2.5) write the effective width formula
(2.7)
which can be rewritten as
(2.8)
The method of von Kármán et al. (1932) was originally developed for aeronautical applications, i.e. very thin plates, and shows good agreement with results from tests with very slender plates. However, in the intermediate slenderness range the resistance is overestimated. In a thorough study by Winter (1947) on cold formed specimens, with b/t ratios in the same vicinity as normal structural applications, a modified version of the -function in Equation (2.8) was suggested according to
(2.9)
min
max
b
beff/2beff/2
cr k2 E
12 1 2–------------------------------ t
b---
2=
beffb
-------- crfy
-------=
beffb
-------- 1---= =
1--- 0 22,2
----------–=
Elastic critical buckling load
9
This equation is used today in e.g. EN 1993-1-5 (2006) for plate buckling, though in a rewritten form.
Müller (2003) made an attempt to formulate plate buckling curves in the same frame work as the curves in EN 1993-1-1 (2005) for column buckling. Müller started with the general curve for plate buckling by Maquoi and Rondal (1986)
(2.10)
in which the generalized imperfection factor and depends mainly on the boundary conditions of the plate. If = 2 the curves for beam and column buckling in EN 1993-1-1 are obtained. According to Müller it is possible to interpolate between the plastic resistance for low slenderness and the von Kármán curve, Equation (2.8), for higher slenderness if = 1. Hence, Equation (2.10) was rewritten as
(2.11)
The solution of Equation (2.11) with respect to becomes
(2.12)
with
(2.13)
Further, Müller proposed a curve that could be used for patch loading with = 0,34 and . This curve was proposed to be used with the reduced stress method according to
Section 10 in EN 1993-1-5 (2006). Moreover, Müller used 41 patch loading tests by Lagerqvist (1994) together with FE-analyses for definition of the load amplifiers, ult,k and cr, for verification of this curve.
2.2 Elastic critical buckling load
The critical load according to classical elastic theory of instability for a plate loaded with a partial in-plane edge load involves additional theoretical difficulties for obtaining rigorous solutions compared to a plate subjected to a distributed edge load. When only a part of the edge is loaded, the stress distribution throughout the plate varies considerably and this causes mathematical difficulties which have to be overcome.
1 – 1 – =
0–=
1 – 1 – =
12 –+
-----------------------------=
12--- 1 0– ++=
0 0 8,=
Review of earlier work
10
The techniques used for establishing the solutions have been analytical methods, finite-difference methods and the finite element method (FEM). As in all buckling problems, according to classical elastic theory, the solution aims at establishment of a numerical value for the buckling coefficient, kF, in Equation (2.14) which will depend on the geometrical and statical boundary conditions.
(2.14)
For the sake of consistency all values of kF presented in this study will be on the form of Equation (2.14), even if the original solution found in a reference was on a different form.
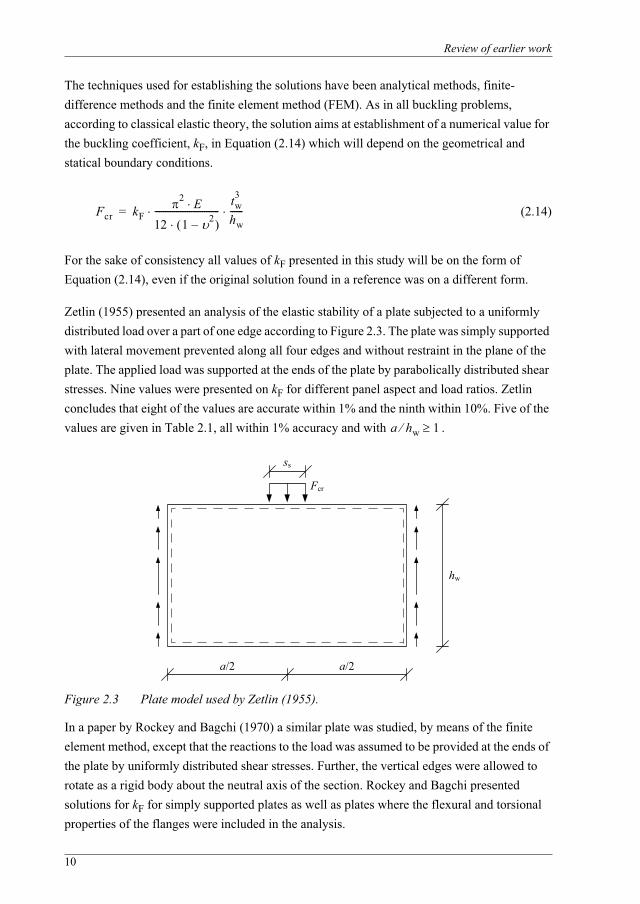
Zetlin (1955) presented an analysis of the elastic stability of a plate subjected to a uniformly distributed load over a part of one edge according to Figure 2.3. The plate was simply supported with lateral movement prevented along all four edges and without restraint in the plane of the plate. The applied load was supported at the ends of the plate by parabolically distributed shear stresses. Nine values were presented on kF for different panel aspect and load ratios. Zetlin concludes that eight of the values are accurate within 1% and the ninth within 10%. Five of the values are given in Table 2.1, all within 1% accuracy and with .
Figure 2.3 Plate model used by Zetlin (1955).
In a paper by Rockey and Bagchi (1970) a similar plate was studied, by means of the finite element method, except that the reactions to the load was assumed to be provided at the ends of the plate by uniformly distributed shear stresses. Further, the vertical edges were allowed to rotate as a rigid body about the neutral axis of the section. Rockey and Bagchi presented solutions for kF for simply supported plates as well as plates where the flexural and torsional properties of the flanges were included in the analysis.
Fcr kF
2 E12 1 2–------------------------------
tw3
hw------=
a hw 1
hw
ss
Fcr
a/2 a/2
Elastic critical buckling load
11
For the simply supported plates the solutions were presented in a diagram with kF as a function of ss/a for different values of a/hw. The diagrams show that kF increases with increasing ss/a,i.e. for a given load the shorter load length the greater tendency for buckling.
For the case when the flexural and torsional stiffness of the flanges were included the results was given as a diagram showing kF as a function of tf/tw. The girder had a web with a/hw = 1,0 and tf/tw varying between 2,0 and 8,0 and the load length over web width was ss/a = 0,2. The width of the flanges, bf, was set to hw/4. The results are shown in Table 2.2 and the influence of the flange thickness in distributing the applied load has importance, giving an increase in kF of about 130 - 160% compared with a simply supported plate.
In a series of papers, Khan and Walker (1972), Khan and Johns (1975) and Khan et al. (1977), solutions for the problem studied by Rockey and Bagchi (1970) concerning simply supported plates, were presented. The investigation was based on an energy method approach and in Khan and Walker (1972), kF was given as the solution of a rather complicated equation in terms of hw,a, ss and the wavelength of the buckle in the direction perpendicular to the applied load. By minimizing this equation with respect to the wavelength the solution which gave the smallest kF could be determined. In Khan and Johns (1975) the solution was expanded to combined loading and in Khan et al. (1977) the solution was developed in a more computer-friendly direction. The results obtained by Khan et al. (1977) are in good agreement with the results presented by Rockey and Bagchi, see Table 2.1.
In his doctoral thesis, Lagerqvist (1994), the critical load for both simply supported plates and girder webs including flanges subjected to patch loading was studied by means of FEM. In the former case the same model as used by Rockey and Bagchi (1970) was used and the results can be found in Table 2.1. As can be seen the results are in good agreement with the other presented solutions for kF. Further, Lagerqvist proposed the following equation for prediction of kF for a simply supported plate based on the results in Table 2.1.
(2.15)kF 2 2 12,hwa
------2 ss
hw------
20 5, 2
hwa
------2
+++=
Review of earlier work
12
Table 2.1 kF for partially loaded plates from Zetlin (1955), Rockey and Bagchi (1970), Khan et al. (1970), Lagerqvist (1994) and Ren et al. (2005).
a) Obtained from diagram
a/hw ss/hwkF
Zetlin (1955)kF
Rockey (1970)a)kF
Khan (1977)kF
Lagerqvist (1994)kF
Ren (2005)
1,0 0 3,25 3,20 3,221/65 3,320,05 3,36 3,270,1 3,30 3,23 3,260,2 3,45 3,32 3,36
0,25 3,42 3,38 3,430,3 3,60 3,510,4 3,70 3,710,5 3,95 3,90 3,87 3,970,6 4,15
0,75 4,50 4,650,8 4,800,9 5,101,0 6,20 5,55 5,57
2,0 0 2,40 2,360,1 2,45 2,380,2 2,50 2,41
0,25 2,41 2,430,4 2,600,5 2,59 2,600,6 2,80
0,75 2,84 2,840,8 2,901,0 3,20 3,15 3,17
3,0 0,25 2,320,5 2,43
0,75 2,661,0 2,95
4,0 0 2,074/65 2,150,2 2,12 2,12
0,25 2,21 2,140,5 2,34 2,29
0,75 2,54 2,521,0 2,80 2,79
Elastic critical buckling load
13
For the case with the more realistic section, i.e. a girder including flanges, Lagerqvist (1994) performed FE-analyses on a model according to Figure 2.4. For this particular load situation, Lagerqvist assumed that the best description of the load introduction in a real girder was to apply the load in the centre line of the web and to have the vertical deformations of flange coupled along the same distance as the load was applied, i.e. equal to ss. This prevents rotation of the flange along the longitudinal axis within the loading area. The flanges were also restrained against vertical deformation at the ends of the girders, symbolizing the support from a vertical stiffener.
The model in Figure 2.4, was used both to compare with the data from Rockey and Bagchi (1970) and to evaluate an equation for kF for the case with flanges included. In the comparison with Rockey and Bagchi the above mentioned restrain that prevents the flanges from rotation within the loading area was excluded in the model. Further, a cross section with a/hw = 1, ss/hw= 0,2, bf = hw/4, hw = 1,0 m, tw = 0,004 m and tf/tw = 2, 4 and 8 was used in the analyses. The results are shown together with those from Rockey and Bagchi in Table 2.2.
Figure 2.4 FE-model including web and flanges according to Lagerqvist (1994).
It can be noted that for the end points, i.e. tf/tw = 2 and 8, there is a good agreement but the difference at tf/tw = 4 is more significant. If kF from both references are put in a diagram it is noticed that the results of Lagerqvist seems to reach a horizontal asymptote while the curve running through kF obtained by Rockey and Bagchi continues to increase for increasing tf/tw.Lagerqvist states that the latter behaviour is doubtful since one can assume that for a certain relation for tf/tw the support of the web, given by the flanges, can be replaced by with theoretically clamped longitudinal edges of the web. If that is the case, a continuing increase of
hw = 1
ss
Fcr
atf
tf
rigid line rotation allowed
tw
bf

Review of earlier work
14
tf/tw have no effect and kF reaches a horizontal asymptote. By this reason Lagerqvist considered the FE-model used reliable and continued to use it to find an expression for kF.
Table 2.2 kF including stiffness from flanges by Rockey and Bagchi (1970) and Lagerqvist (1994). a/hw = 1,0, ss/hw = 0,2. Obtained from diagram.
Lagerqvist believed that a good estimation of the contribution to kF from the flanges could be obtained by describing kF as a function of the relation between the torsional stiffness of the flange and the flexural stiffness of the web, defined by the ratio
(2.16)
with the torsional stiffness of the flange expressed as
(2.17)
and the stiffness of the web as
(2.18)
From Equations (2.16) - (2.18) a parameter, , can be derived according to Equation (2.19) if the numerical constant 1,4 is neglected.
(2.19)
Lagerqvist wanted to give kF as a function of , ss/hw and a/hw. To investigate the influence from on kF a series of FE-analyses was performed with seven different values on for a/hw= 1, 2 and 4 and with ss/hw = 0,2. Based on the results from the FE-analyses the following relatively simple equation for kF was proposed.
tf/tw 2 3 4 5 6 7 8
kFRockey (1970)
7,75 7,85 7,95 8,10 8,30 8,55 8,80
kFLagerqvist (1994)
7,85 8,45 8,80
G KD hw---------------
G K E2 1 +-------------------------
bf tf3
3-------------=
D hwE tw
3
12 1 2–------------------------------ hw=
bf tf3
hw tw3
----------------=
Elastic critical buckling load
15
(2.20)
Finally, Lagerqvist did some additional FE-calculations to investigate the influence from ss and an expression for kF was proposed according to
(2.21)
However, Lagerqvist concluded from his experimental study that the term including ss in Equation (2.21) has very small influence on kF. Further, the final patch loading resistance still gives a good prediction of the ultimate load without the term in the first bracket for varying ss,i.e. Lagerqvist proposed that only the last bracket in Equation (2.21) should be used for kF for determination of the ultimate resistance.
Lagerqvist also proposed a simplified equation for kF which was introduced into EN 1993-1-5 (2006) and where the term for the influence from the flanges was set to a reasonable fixed value and the influence from ss was omitted.
(2.22)
Shahabian and Roberts (1999) presented a paper concerning the elastic critical buckling load of slender web plates subjected to combinations of in-plane loadings. The authors developed an approximate procedure for determining the critical load, i.e. kF. It was found that the solution by Shahabian and Roberts did not correspond very well with more accurate solutions like the one by Khan et al. (1977). Though, by using a correction factor the results fall in the same region as for example the results by Khan et al.
In a paper by Ren and Tong (2005) a study regarding elastic buckling of web plates in I-girders under patch loading was presented. A similar type of model as the one used by e.g. Rockey and Bagchi (1970) and Khan et al. (1977) was studied by means of FEM and kF was presented within the same range as others, see Table 2.1. A total of 66 FE-analyses were carried out on a simply supported rectangular plate, a/hw = 1,0 - 4,0 and ss/hw = 0 - 0,5, with the upper and the lower edges restrained in the 1-direction and the vertical edges restrained in both the 1- and 2-directions, see Figure 2.5. In addition to this and unlike the other case also the rotation degree of freedom 6 of the vertical edges was constrained.
kF 5 82 2 1,hwa
------2
0 46, 4++,=
kF 1ss
2 hw-------------+ 5 3 1 9,
hwa
------2
0 4, 4++,=
kF 6 2+hwa
------2
=
Review of earlier work
16
Figure 2.5 The model of simply supported plate by Ren and Tong (2005).
Ren and Tong proposed an equation for kFs of a simply supported rectangular plate according to
(2.23)
which was based on Equation (2.15) by Lagerqvist (1994).
Furthermore, Ren and Tong (2005) continued by analysing a similar plate as above except that degree of freedom 6, according to Figure 2.5, also was constrained for the upper and lower edges, i.e. the upper and lower edges were clamped. A total of 48 analyses with a/hw = 1,0 - 4,0 and ss/hw = 0 - 0,5 was carried out for this type of model. An equation for kFc of a clamped plate was proposed as
(2.24)
Now, Ren and Tong states that if the rotational restraint from the flanges of an I-girder is taken into account in the analyses it could be assumed that kF should end up somewhere in between Equations (2.23) and (2.24). Considering Equation (2.20) it can easily be seen that for a girder with , see Equation (2.19), approaching infinity would give a kF approaching infinity. Therefore, the authors wanted to investigate the elastic buckling behaviour of webs in I-girders with the restraining effects of the flanges included.
In order to highlight the rotational restraint provided by the flanges, a slightly different model compared to Lagerqvist was used by Ren and Tong. The flanges and the web were established
hw
ss
Fcr
a
1
2
34
56
kFs 2 05, 1 2,hwa
------2 ss
hw------
20 5, 2
hwa
------2
+++=
kFc 1 0 65sshw------
2,+ 6 3 0 05, a
hw------
20 6
hwa
------2
,+–,=
Elastic critical buckling load
17
separately in the model and only the degree of freedom 1 and 6 were coupled between the parts, i.e. the out of plane displacement and the rotation along the longitudinal direction according to Figure 2.5. Furthermore, the edges of the flange as well as the vertical edges of the web were constrained in degree of freedom 1, 2 and 5. The load was applied on the top edge of the web over the distance ss. A total of 162 different FE-analyses were carried out with a/hw = 1, 2 and 4, ss/hw = 0 - 0,5 and = 0 - 128. The authors states that according to Equation (2.19) could be well used to evaluate kF of I-girder webs. As the value of increases from zero, kF increases from kFs and when becomes large kF approaches the value of kFc. Based on this a basic expression for kF was established according to
(2.25)
However, the influence of the aspect ratio of the web plate, a/hw, must be considered as well, which was solved by introducing a factor
(2.26)
Finally, Ren and Tong proposed the following equation to determine kF for I-girder webs
(2.27)
It is understood by the author of this thesis that Ren and Tong used the model described above in order to investigate the rotational restraint given by the flange. However, when a patch load is applied to a girder it is usually preventing the flange from rotating under the load plate and hence, the approach Lagerqvist used, i.e. preventing the rotation of the flange under the load plate, would give a more realistic value on kF.
Galéa and Martin (2006) presented a newly developed software, EBPlate, for the determination of the elastic critical buckling stress of plates. The software is a very user friendly tool that can be used for rectangular plates, laterally supported along their four edges, and loaded with normal, transverse or shear stresses. It is possible to introduce the rotational and torsional stiffness of the flanges in the model and also both open and closed longitudinal stiffeners. Considering patch loading the only disadvantage with EBPlate is that it is not possible to clamp only a part of the edge that is loaded, i.e. the middle part where the transverse stress is applied.
kFkFs kFc+
1 +-----------------------------=
0 1 0 03 ahw------ 1 63
hwa
------2
,+,+,=
kFkFs kFc+
1 +-------------------------------------=
Review of earlier work
18
2.3 Ultimate resistance
There are some things regarding patch loading that can be considered as generally accepted among the researchers. The response from a girder web subjected to a patch load can be described with one of three failure modes shown in Figure 2.6, i.e. yielding, buckling or crippling of the web. However, there is no clear distinction between crippling and buckling instead it could be seen as a gradual change of buckling shape. Normally, the buckling mode is first initiated and followed by a local crippling mode at loads in the vicinity of the ultimate load and according to Edlund (1988), tests on slender webs shows that the crippling mode and the buckling mode usually is combined. The actual failure mode that occurs depends mainly on the cross section geometry. Generally, high ratio of tf/tw usually imply a buckling or crippling failure, while a low ratio of tf/tw on the other hand usually means that a yielding failure will occur. Further, a stocky web normally implies yielding while slender webs implies buckling.
Figure 2.6 Schematic failure modes for girders subjected to patch loading.
All test results indicate that the ultimate resistance of a girder subjected to patch loading is almost independent of the web depth, hw. However, the ultimate load is more or less directly proportional to the square of the web thickness and is influenced to a lesser extent by the loaded length, ss, the flange stiffness and the yield strength of the web, fyw.
The review of the ultimate resistance of girders subjected to patch loading is divided into two main sections. One section, Section 2.3.2, that deals with resistance models that is based on a mechanism solution, and one section, Section 2.3.1, that does not. Further, the interaction between patch loading and bending moment as well as patch loading and shear are treated in separate sections.
2.3.1 Empirical models and other non-mechanism models
The earliest contributions in the field considering ultimate resistance models were in general empirical models based on a small number of tests. As the years went by and the number of studies grew together with the knowledge the models became more advanced taking into account a wide variety of parameters. However, the use of a more advanced model will not automatically generate a better prediction of the failure load compared to a simpler model.
Yielding CripplingBuckling

Ultimate resistance
19
The first contribution, described herein, regarding an empirical model for the ultimate resistance were presented by Granholm (1960). A total of 11 patch loading tests with different geometries, hw/tw ranging from 126 to 264, and different loaded lengths as well as bending moments were conducted in the study. Granholm concluded that this is a local phenomenon and therefore the failure load is independent of the web depth, hw. Further, a positive bending moment, i.e. when the part of the web closest to the loaded flange is in compression, could have a negative influence on the failure load while negative bending moment or shear stresses does not affect the failure load.
Based on the test results an expression for the failure load according to Equation (2.28), where FR is in tons and tw in mm, could be used with good accuracy, though somewhat on the safe side.
(2.28)
Approximately 10 years later Bergfelt (1971) stated that Equation (2.28) gives a fairly good estimation of the failure load for girders with thin flanges. Though, Equation (2.28) was modified to
(2.29)
which is more or less the same equation as Equation (2.28) but expressed in a dimensionally correct way.
Further, Bergfelt presents a number of tests with fixed hw/tw and varying flange dimensions, tf/tw from 2 to 5, to investigate the influence of the flanges on the failure load. Based on the results a second expression for girders with thick flanges were proposed as
(2.30)
with Equation (2.29) as lower bound.
In a paper published by Skaloud and Drdacky (1975) another model was proposed for slender webs subjected to patch loading. The presented model, see Equation (2.31), includes several parameters and this was the first contribution that includes the web depth, hw, and the yield strength, fy, in the model.
(2.31)
FR 0 85, tw2=
FR 0 045 E, tw2=
FR 0 045 E, tw2 0 55, 0 22
tftw-----,+=
FR 0 55 tw, 0 9, tw 1 5 ss,twhw------+ E fyw
tftw-----=

Review of earlier work
20
Skaloud and Drdacky concludes that bending moment has a small effect on the failure load as long as the stresses, due to bending moment, do not approach the yield strength of the web. The tests used for calibration had a web slenderness, hw/tw, ranging from 200 to 400.
Two years later Drdacky and Novotny (1977) published another contribution with focus on thick girder webs, i.e. the study focused on a slenderness range below that by Skaloud and Drdacky (1975). A total of 16 test results on 8 girders are presented with hw/tw between 75 and 165. This means that all girders were loaded first on one flange and later the girder was turned upside down and loaded again on the other flange. Different loaded lengths, ss, were used and for all tests the aspect ratio, hw/a = 1. Further, bf/tf was 5 for 10 of the girders and approximately 3,1 for the other 6 girders. The test results were compared to Equation (2.31) with good agreement and the authors concluded that the resistance model could be used within the web slenderness range 75 to 400.
Bergfelt (1976) presented a semi-empirical design method for patch loading verified against more than 100 test results. The design model consists of two parts, one for yielding, Equation (2.32), and one for web crippling, Equation (2.33). The dominating failure mode depends on the ratio between stiffness of the loaded flange and the web thickness and on the loaded length. For weak flanges, i.e. tf/tw < 1-2, the influence of yielding dominates and for stiffer flanges and longer loaded lengths web buckling has greater influence. The parameter f(ss) in Equation (2.32) and Equation (2.33) depends on the loaded length and is between 1,0 and 1,3 according to Bergfelt.
(2.32)
in which depends on ti/tw according to
ti/tw = 0,5 1,0 1,0 2,0
= 0,55 0,65 0,85 1,0
; ti/tw > 1-2 (2.33)
ti is what Bergfelt call an idealized flange thickness that should be used if bf/tf differs from 25 and is determined according to
(2.34)
In a paper by Elgaaly (1983) a thorough survey over the earlier contributions in the field is presented together with a new proposal for the patch load resistance. Elgaaly states that the local
FRy 13 ti tw fyw f ss=
FRc 0 6 tw2, E fyw 1 0 4
titw-----,+ f ss=
ti12 If
25--------------4=
Ultimate resistance
21
membrane stresses in the web under the load can reach the yield strength of the web material. The localized membrane yielding may not necessarily constitute failure but will eventually induce web crippling, a local wrinkling or folding of the web. For tests of thick girder webs, higher loads than those causing membrane yielding, could be sustained and the girder failed in web crippling according to Elgaaly. Further, Elgaaly found that, during the tests the load-deflection curves indicated a change in slope around the yield load, which was due to significant membrane yielding of the web. Though, for thin girder webs, crippling can occur prior to yielding.
Elgaaly declared that all test results so far indicates that the failure load is almost independent of the web slenderness and the flange width to thickness ratio. However, the failure load is almost directly proportional to the square of the web thickness and also influenced to a lesser extent by the loaded length, the flange stiffness and the web material yield strength. It was proposed by Elgaaly that the ultimate resistance of a web under patch loading should be determined as
(2.35)
Though, for girders that will fail due to yielding, i.e. girders with very stocky webs, the girder will be able to carry higher loads compared to Equation (2.35) but for all practical girder dimensions Equation (2.35) will give satisfactory estimations, according to Elgaaly. As the resistance model is semi-empirical and hence, partially based on test results and those results were limited to tests with a loaded length less than one third of the web depth, Elgaaly restricted the model according to Equation (2.35) to ss/hw < 1/3. For more distributed loadings, Elgaaly referred to Roberts and Chong (1981), see later in this review.
Drdacky (1986) presented a new tentative model for prediction of the ultimate resistance for girders subjected to patch loading. The model, according to Equation (2.36), was derived from the mechanism of the web collapse and the condition of a smooth transition from non-buckling to buckling of the web. It was calibrated against 170 tests both with and without longitudinal stiffeners.
(2.36)
In this new resistance model Drdacky excluded the web slenderness but states that for low values of hw/tw Equation (2.36) needs to be supplemented with a correction depending on the web slenderness. This was due to an observed conservatism, when the resistance model was compared to test results, in the range of web slenderness up to 75.
FR 0 5 tw2, E fyw
tftw-----=
FR 19 54 tw2, fyw 1 0 004
sstw-----,+
If
tw4
-----0 10,
=
Review of earlier work
22
Spinassas et al. (1990) published a parametric study on girders subjected to patch loading by means of FE-analyses. The parameters varied were tw, tf, bf, a/hw, fyw, ss, the bending moment and the initial lateral imperfection. The authors found that an increase in tf had a significantly positive influence on the ultimate load, especially in combination for lower hw/tw. Further, the authors found that tw had a great influence on the resistance and also fyw and ss was found important, which is reflected by the proposed resistance formula
(2.37)
The coefficient K was set to 1,3 in Spinassas et al. (1990) but in a later publication, Raoul et al. (1991) changed the coefficient K to 1,38 based on a comparison with 118 test results. This gave an average of 1,35 compared to the 118 tests.
2.3.2 Mechanism models
The mechanism models, or resistance models including plastic hinge mechanism in the loaded flange and/or in the web, were introduced by Roberts and co-workers in the late seventieth. At the same time also the Swedish researcher Bergfelt developed a model including a plastic hinge mechanism in the loaded flange. This part of the review will start with the contribution from Roberts and co-workers in chronological order and then continue with Bergfelt and others who have contributed in the field.
Roberts and Rockey (1978) and (1979) published two papers in which a resistance model was proposed for girders subjected to patch loading. The model is based on a plastic mechanism solution which involves plastic hinges in the loaded flange as well as yield lines that forms in the web plate. Certain approximations and empirical modifications were introduced to simplify the method in order to make it suitable for hand calculations. The model is still, despite of the approximations, capable of predicting the failure load and failure mode with satisfying results according to the authors. An alternative form of the mechanism model was also presented for girders in which failure is assumed to be initiated by direct yielding of the web.
Two years later Roberts (1981) presented a reduced form of the mechanism model together with some new tests with focus on the influence of the web depth and the web and flange thicknesses. The complete mechanism model presented in Roberts and Rockey (1979) will first be summarized here and then the modified solution reduced to a simple closed form will follow.
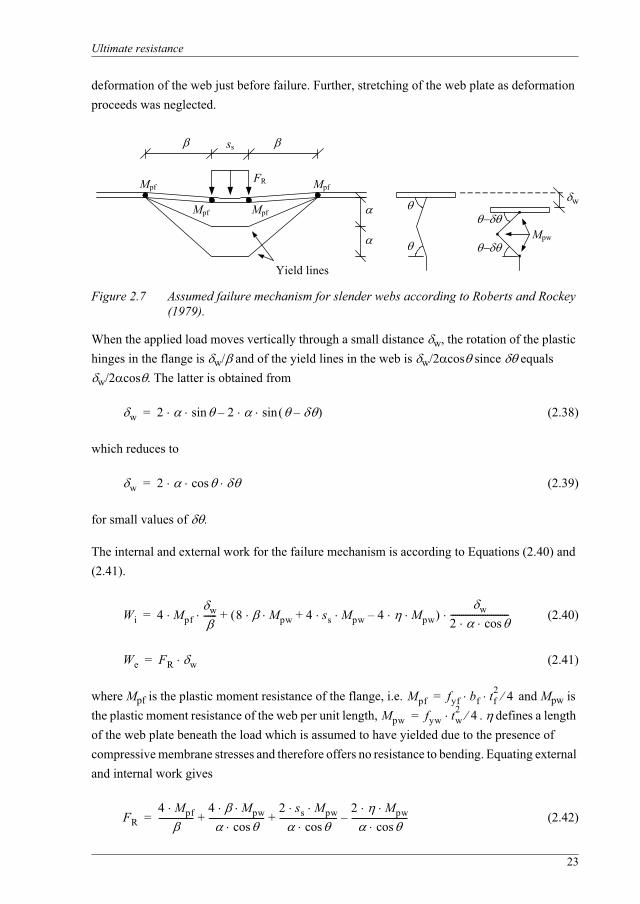
The resistance model for slender girder webs by Roberts and Rockey is based on a failure mechanism according to Figure 2.7. Dimensions and define the assumed position of the plastic hinges in the flange and the yield lines in the web respectively. The angle defines the
FR K E 0 3, fyw0 7, tw
1 53, bf tf3
12-------------
0 06,
ss0 23,=
Ultimate resistance
23
deformation of the web just before failure. Further, stretching of the web plate as deformation proceeds was neglected.
Figure 2.7 Assumed failure mechanism for slender webs according to Roberts and Rockey (1979).
When the applied load moves vertically through a small distance w, the rotation of the plastic hinges in the flange is w/ and of the yield lines in the web is w/2 cos since equals
w/2 cos . The latter is obtained from
(2.38)
which reduces to
(2.39)
for small values of .
The internal and external work for the failure mechanism is according to Equations (2.40) and (2.41).
(2.40)
(2.41)
where Mpf is the plastic moment resistance of the flange, i.e. and Mpw is the plastic moment resistance of the web per unit length, . defines a length of the web plate beneath the load which is assumed to have yielded due to the presence of compressive membrane stresses and therefore offers no resistance to bending. Equating external and internal work gives
(2.42)
ss
FR
Mpf
Mpf
Mpf
Mpf
Yield lines
Mpw
w
w 2 2 –sin–sin=
w 2 cos=
Wi 4 Mpfw------ 8 Mpw 4 ss Mpw 4 Mpw–+ w
2 cos---------------------------+=
We FR w=
Mpf fyf bf tf2 4=
Mpw fyw tw2 4=
FR4 Mpf----------------
4 Mpwcos
--------------------------2 ss Mpw
cos---------------------------
2 Mpwcos
--------------------------–+ +=
Review of earlier work
24
Minimizing FR with respect to gives
(2.43)
The deformation of the flange before failure was estimated by means of elastic theory. It was assumed that the moment in the flange varied linearly from +Mpf at one plastic hinge to -Mpf at the next. Then the deflection of the flange is given by
(2.44)
in which If is the second moment of area for the flange. The deflection of the flange must be compatible with the deformation of the web given by , i.e.
(2.45)
Equations (2.43) and (2.45) gives
(2.46)
in which everything but is known. Now, by means of Equations (2.42), (2.43) and (2.46) together with an empirical choice of , the resistance can be calculated. The experimental evidence suggests that the depth of the region of plastic deformation in the web, 2 for the assumed mechanism, is not too sensitive to the flange dimensions, according to Roberts and Rockey. A suitable choice for is
(2.47)
where t* is a reference web thickness taken as 2,5 mm, which fit to the tests TG1-TG5 by Skaloud and Novak (1972), and f* is a reference yield strength taken as 300 MPa. The term f*/fyf ensures that the solution is not to sensitive to small changes in Mpf resulting from variations in material yield strength and Equation (2.47) can be rewritten to
(2.48)
2 Mpf cosMpw
----------------------------------=
Mpf2
6 E If-------------------
2 1 sin–
Mpf2
6 E If------------------- 2 1 sin–=
cos1 sin–--------------------
4 E fyw tw2
fyf2 bf tf
--------------------------------=
hw tw f16 t fyf-------------------------
hw6
------=
hw tw40
---------------- 300fyf
---------hw6
------=
Ultimate resistance
25
According to the authors the upper limit of will prove satisfactory for most practical situations. Finally, to determine it is assumed that the web contribution to the failure load is transmitted to a length of the web in the vicinity of the patch load. Further, the authors assumed that the length of the web plate yields in compression and hence, offers no resistance to bending deformations. Equating the web contribution to the failure load, i.e. the three last terms in Equation (2.42), to a force corresponding to the yielded length of the web gives
(2.49)
from which can be solved according to
(2.50)
The following limitations were also imposed on the work:
• The positions of the outer plastic hinges in the flange are limited to not exceed the distance between possible vertical stiffeners in the vicinity of the load, i.e. the value of in Equation (2.43) is not allowed to exceed .
• If is assigned the value , should be determined according to Equation (2.48) with the term 300/fyf omitted. This means that the angle should be determined directly through Equation (2.45).
• For larger loaded lengths, ss, the predicted resistance overestimates the ultimate load from tests in some cases and therefore ss should be limited to 0,2hw or if
ss should not exceed 2 The lesser value should be used.
So far the rather complicated proposal in Roberts and Rockey (1979) have been described. However, that proposal was in Roberts (1981) modified to a simple closed form solution starting with the same mechanism, see Figure 2.7, and Equations (2.40) - (2.45). Equation (2.46) is rewritten as
(2.51)
Solving Equation (2.51) for cos in terms of H gives
(2.52)
as H2 is large compared with unity. Substituting Equations (2.43) and (2.52) into Equation (2.42) and omitting the terms containing ss and , gives a resistance according to
4 2 ss 2–+Mpw
cos-------------------- fyw tw=
4 2 ss+ Mpw2 Mpw fyw tw+ cos-------------------------------------------------------------------=
0 5 a ss–,
0 5 a ss–,
0= 5 a ss–,
cos1 sin–--------------------
4 E fyw tw2
fyf2 bf tf
-------------------------------- H= =
cos 2 H1 H2+---------------- 2
H----=

Review of earlier work
26
(2.53)
Furthermore, Equation (2.53) indicates a slight anomaly in the mechanism solution because if fyf is increased, FR will decrease. Roberts solved this by assuming that fyf is equal to fyw.Moreover, in the original proposal was taken as a function of both hw and tw, see Equation (2.48), but experimental evidence show that the failure load is independent of hw according to Roberts. Hence, was proposed to be taken as 25tw. The term containing ss in Equation (2.42) is reintroduced and the solution for the resistance reduces to
(2.54)
in which is a function of the girder dimensions and material properties. To maintain the simplicity, Roberts sets = 3/hw and to have a lower bound solution for the available test data, the constant 0,56 is reduced to 0,5, i.e.
(2.55)
Equation (2.55) is the final formula for the ultimate resistance but Roberts assign two limitations to the resistance. First, when ss/hw becomes large, it is unrealistic to assume that the flange remains straight between the two inner plastic hinges and the geometrical considerations are suspect. Therefore, Roberts recommended that the value of ss/hw should be limited to 0,2. Second, for thin webs and flanges the model tends to underestimate the failure load and to avoid this a lower limit of three was imposed on the ratio tf/tw for comparison with test data. However, this limitation was not recommended for practical situations.
In addition to the resistance models described above, Roberts and Rockey (1979) and Roberts (1981) also proposed a solution for girders with thicker webs. It is stated that for stocky girders it is expected that the failure will be initiated by direct yielding of the web as thicker webs increases the ratio of the out of plane bending stiffness to the compressive membrane stiffness. This situation can be analysed by considering an alternative failure mechanism according to Figure 2.8.
FR 2 2 tw2 E fyw
2 tffyf
-----------------------=
FR 0 56, tw2 E fyw tf
tw----------------------- 1 ss
twtf-----
3 2+=
FR 0 5, tw2 E fyw tf
tw----------------------- 1
3 sshw
-----------twtf-----
3 2+=
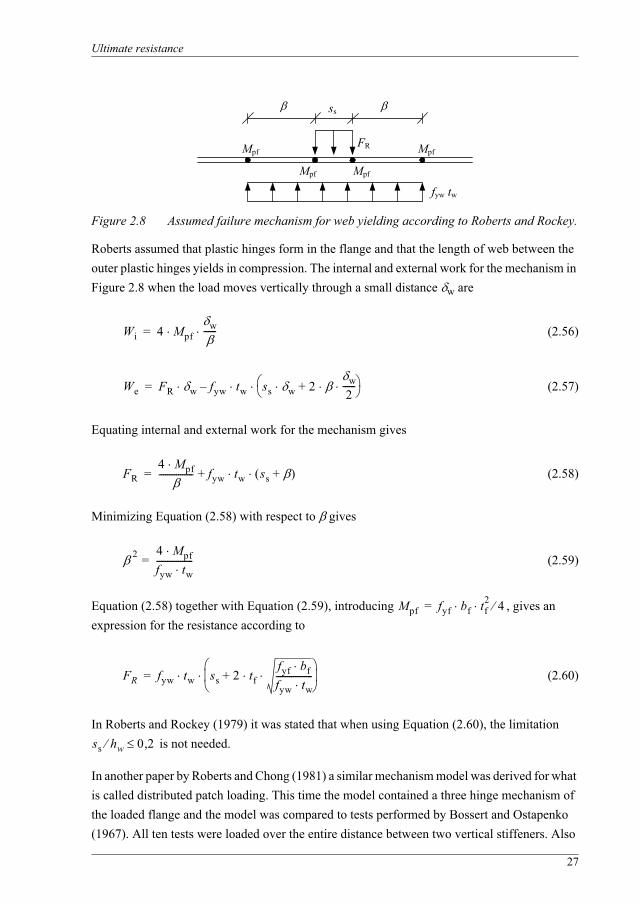
Ultimate resistance
27
Figure 2.8 Assumed failure mechanism for web yielding according to Roberts and Rockey.
Roberts assumed that plastic hinges form in the flange and that the length of web between the outer plastic hinges yields in compression. The internal and external work for the mechanism in Figure 2.8 when the load moves vertically through a small distance w are
(2.56)
(2.57)
Equating internal and external work for the mechanism gives
(2.58)
Minimizing Equation (2.58) with respect to gives
(2.59)
Equation (2.58) together with Equation (2.59), introducing , gives an expression for the resistance according to
(2.60)
In Roberts and Rockey (1979) it was stated that when using Equation (2.60), the limitation is not needed.
In another paper by Roberts and Chong (1981) a similar mechanism model was derived for what is called distributed patch loading. This time the model contained a three hinge mechanism of the loaded flange and the model was compared to tests performed by Bossert and Ostapenko (1967). All ten tests were loaded over the entire distance between two vertical stiffeners. Also
ss
FR
Mpf
Mpf
Mpf
Mpf
fyw tw
Wi 4 Mpfw------=
We FR w fyw tw ss w 2 w2
------+–=
FR4 Mpf---------------- fyw tw ss ++=
2 4 Mpffyw tw-----------------=
Mpf fyf bf tf2 4=
FR fyw tw ss 2 tffyf bffyw tw-----------------+=
ss hw 0 2,
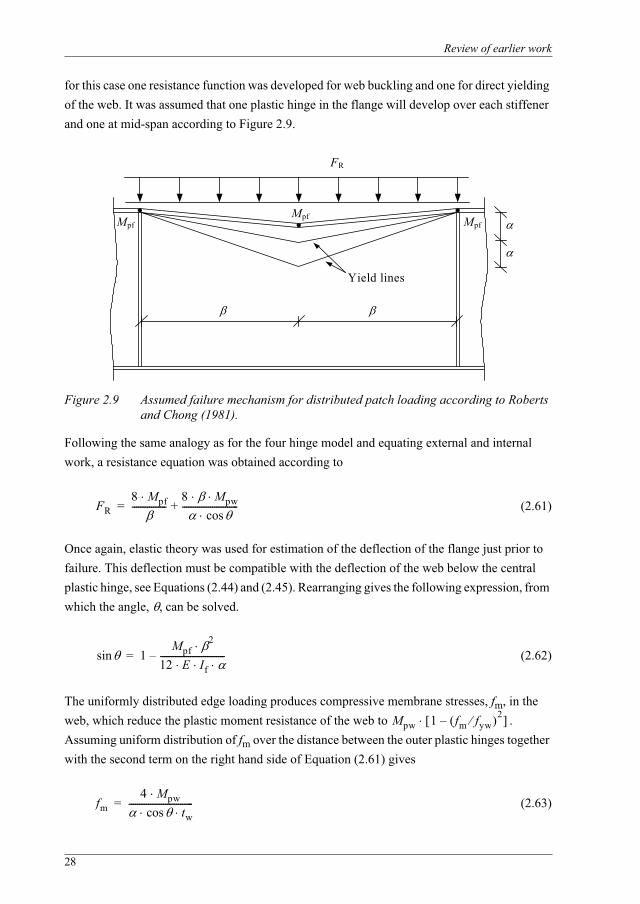
Review of earlier work
28
for this case one resistance function was developed for web buckling and one for direct yielding of the web. It was assumed that one plastic hinge in the flange will develop over each stiffener and one at mid-span according to Figure 2.9.
Figure 2.9 Assumed failure mechanism for distributed patch loading according to Roberts and Chong (1981).
Following the same analogy as for the four hinge model and equating external and internal work, a resistance equation was obtained according to
(2.61)
Once again, elastic theory was used for estimation of the deflection of the flange just prior to failure. This deflection must be compatible with the deflection of the web below the central plastic hinge, see Equations (2.44) and (2.45). Rearranging gives the following expression, from which the angle, , can be solved.
(2.62)
The uniformly distributed edge loading produces compressive membrane stresses, fm, in the web, which reduce the plastic moment resistance of the web to . Assuming uniform distribution of fm over the distance between the outer plastic hinges together with the second term on the right hand side of Equation (2.61) gives
(2.63)
FR
MpfMpfMpf
Yield lines
FR8 Mpf----------------
8 Mpwcos
--------------------------+=
sin 1Mpf
2
12 E If------------------------------–=
Mpw 1 fm fyw2–
fm4 Mpwcos tw
------------------------------=
Ultimate resistance
29
Introducing the reduced plastic moment resistance of the web into Equation (2.61) gives an approximation of the collapse load according to
(2.64)
can empirically be chosen to = 25tw according to Roberts and Chong (1981) and by Equations (2.62) and (2.64) the resistance can be calculated. Now, for stockier girders it is possible that failure will be initiated by direct yielding of the web in the same manner as Roberts have shown before for his four hinge model. In this case, using the three hinge model and equating external and internal work, the resistance becomes
(2.65)
The resistance should be taken as the lesser of Equations (2.64) and (2.65).
Two years later Roberts and Markovic (1983) presented another study on stocky girders, including tests with tw from 3 mm to 10 mm and hw/tw between 50 and 166. The objective was to fill out the gap in the test data for thicker webs and to compare the resistance functions developed earlier by Roberts and co-workers with the test results. The authors studied the load-deflection curves, deflection was defined as the deflection of the loaded flange under the load, and concluded that at approximately one third of the ultimate load the slope of the curve changes without any significant out of plane deformations. This was due to membrane yielding of the web according to the authors. Close to ultimate load the curve flattens accompanied by a rapid increase of the out of plane deformations of the web, indicating that the failure was due to bending and not yielding of the web. Further, when comparing the ultimate loads from tests with Equations (2.55) and (2.60) it was found that Equation (2.55), i.e. the resistance function originally developed for slender webs, gave the best agreement irrespective of the web thickness.
Finally, Roberts and Newark (1997) presented a slightly modified design procedure for patch loading. The main equations are the same as described above but some modifications were made. Starting with the same equation as before but adding a safety factor called F by the authors
(2.66)
where sse is the loaded length now allowing for 45o distribution through the flange, i.e.
FR8 Mpf----------------
8 Mpwcos
-------------------------- 14 Mpw
cos tw fyw------------------------------------------
2–+=
FR8 Mpf---------------- 2 tw fyw+=
FR4 Mpf----------------
4 Mpwcos
--------------------------2 sse Mpw
cos-----------------------------
2 Mpwcos
--------------------------–+ + 1F---=
Review of earlier work
30
(2.67)
A new approximation of was proposed according to Equation (2.68) where fyw/fyf was incorporated to remove the anomaly, mentioned earlier, that the resistance decrease with increasing fyf, see Equation (2.53).
(2.68)
Further, for girders with thin flanges the value of may be small compared with and the geometry of the assumed mechanism becomes unrealistic. Therefore, if > /2 the value of should be reduced to /2. The other limitations mentioned earlier in other papers are not mentioned in this paper and hence, it is assumed that they no longer are relevant.
Substituting Equations (2.43), (2.52) and (2.68) into Equation (2.66) gives
(2.69)
in which K is a numerical constant and is a complex function of the system geometry and material yield strengths. By comparison with a wide range of test data Equation (2.69) was modified empirically according to
(2.70)
where the safety factor F = 1,45. By using F = 1,45 a lower bound 95% confidence limit above unity is obtained. In the paper, also the mechanism solution for direct yielding of the web as shown in Equations (2.56) - (2.60) was described and the authors states that the lesser of Equation (2.60) and Equation (2.70) should be used for design. The only difference between the resistance equation for direct yielding in this paper and Equation (2.60) is that sse should be used instead of ss, i.e. no safety factor is needed for the case with direct yielding.
According to Roberts and Newark (1997) the predictions by Equations (2.60) and (2.70) compared with 142 test results gave a mean of 1,45 and a coefficient of variation of 0,24. The authors state that for routine design Equations (2.60) and (2.70) should be used but for girders with relatively strong flanges and closely spaced vertical stiffeners the full mechanism solution for web buckling should be used instead of Equation (2.70).
As can be noticed, Roberts and co-workers have produced an extremely large amount of both test data and knowledge in the field. Good agreement are shown between the proposed
sse ss 2 tf+=
20 twfywfyf-------
hw8
------=
FR K tw2 E fyw
tftw----- 1 + 1
F---=
FR 1 1, tw2 E fyw
tftw-----
1 41
sse twhw tf----------------+ 1
F---=
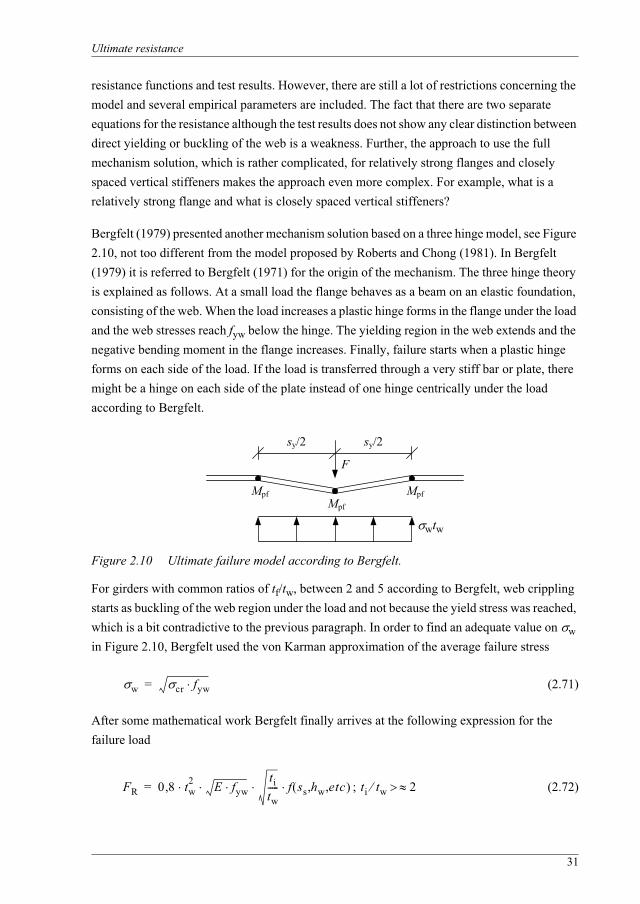
Ultimate resistance
31
resistance functions and test results. However, there are still a lot of restrictions concerning the model and several empirical parameters are included. The fact that there are two separate equations for the resistance although the test results does not show any clear distinction between direct yielding or buckling of the web is a weakness. Further, the approach to use the full mechanism solution, which is rather complicated, for relatively strong flanges and closely spaced vertical stiffeners makes the approach even more complex. For example, what is a relatively strong flange and what is closely spaced vertical stiffeners?
Bergfelt (1979) presented another mechanism solution based on a three hinge model, see Figure 2.10, not too different from the model proposed by Roberts and Chong (1981). In Bergfelt (1979) it is referred to Bergfelt (1971) for the origin of the mechanism. The three hinge theory is explained as follows. At a small load the flange behaves as a beam on an elastic foundation, consisting of the web. When the load increases a plastic hinge forms in the flange under the load and the web stresses reach fyw below the hinge. The yielding region in the web extends and the negative bending moment in the flange increases. Finally, failure starts when a plastic hinge forms on each side of the load. If the load is transferred through a very stiff bar or plate, there might be a hinge on each side of the plate instead of one hinge centrically under the load according to Bergfelt.
Figure 2.10 Ultimate failure model according to Bergfelt.
For girders with common ratios of tf/tw, between 2 and 5 according to Bergfelt, web crippling starts as buckling of the web region under the load and not because the yield stress was reached, which is a bit contradictive to the previous paragraph. In order to find an adequate value on win Figure 2.10, Bergfelt used the von Karman approximation of the average failure stress
(2.71)
After some mathematical work Bergfelt finally arrives at the following expression for the failure load
; (2.72)
Mpf
MpfMpf
sy/2 sy/2
F
wtw
w cr fyw=
FR 0 8, tw2 E fyw
titw----- f ss hw etc,,= ti tw 2
Review of earlier work
32
where ti is according to Equation (2.34) if the flange dimensions differs from bf/tf = 25, if not tiequals tf. The term f(ss,hw,etc) in Equation (2.72) contains a number of functions according to
(2.73)
in which f(sv) and f(sh) gives the influence of vertical and horizontal stiffeners respectively. The other factors are correction functions, generally close to 1,0 according to Bergfelt.
f(ss) relates the influence of the loaded length ss. Bergfelt suggested a simple formula, roughly covering many test results, according to
(2.74)
where
(2.75)
in which is a correction factor for flange bending moment.
The next factor f(hw) is a correction factor for the influence of the web depth, hw. Bergfelt did not find any significant influence for slender webs but mentioned that the web depth can have influence for stocky webs, .
f(fyw) is a correction factor for the influence from the yield strength of the web to the post-buckling strength according to Bergfelt. However, there are not many test results on girders with “extremely” high or low strengths which makes the formula uncertain. Bergfelt proposed a correction factor according to
(2.76)
f(ME) is a correction factor taking into account the compression stress in the flange from a bending moment. Finally, the correction factor for initial imperfections of the web f( ) should according to Bergfelt be calculated as
; (2.77)
which holds for tf/tw >2. If no special regard is taken to the initial imperfections of the web the constant in Equation (2.72) is 0,77 instead of 0,8f( ) according to Bergfelt.
f ss hw etc,, f ss f hw f fyw f ME f f sv f sh=
f ss 1 40sssy----
twhw------ 1 4,+=
sy 5 2,bf----
tftw-----
2 twti-----
fyf
fyw E--------------------=
hw tw 60
f fyw 700fywE
-------6=
f 1 15 0 001, tfhwtw------– tw–= 0 8, f 1
Ultimate resistance
33
In another study by Bergfelt (1983) a total of 26 tests were presented which confirms the rather small influence of the web depth, for slender webs down to hw/tw = 150, on the failure load. Further, the new test results supports the resistance function according to Equation (2.72).
In Shimizu et al. (1989) a modified version of the mechanism solution originally by Roberts and Rockey (1979) was presented. Seven test results were presented with ss/a equal to 0,3 or 0,5 and hw/tw = 167. The authors reports that two yield lines form in the web for all girders, in contradiction to the three yield lines that Roberts and Rockey, observed. Further, Shimizu et al. explained the difference in collapse behaviour by the fact that their ss/a is greater in comparison to the ratio ss/a from tests that Roberts and Rockey used for deriving their mechanism. On basis of the new findings for longer loading lengths, Shimizu et al. proposed a modified mechanism model shown in Figure 2.11.
Figure 2.11 Modified mechanism according to Shimizu et al. (1989).
Following the same analogy as Roberts and Rockey, the external and internal virtual work for the mechanism are as follows.
(2.78)
(2.79)
Equating internal and external work gives
(2.80)
and minimizing with respect to 2
(2.81)
ss
FR
MpfMpf Mpf Mpf
Yield lines Mpw
Mpw
v
Wi 4 Mpfv
2----- 2 Mpw ss 2 1 2 2+ + v
cos--------------------+=
We FR v=
FR 4Mpf
2--------- 2
Mpw ss 2 1 2 2+ +cos
----------------------------------------------------------------+=
2Mpf cos
Mpw----------------------------------=
Review of earlier work
34
1 can then be derived from the relation
(2.82)
which is obtained through Figure 2.11. Using the same assumption as Roberts and Rockey, i.e. that the flange deflection should be compatible with the web deformation and that the moment is linear between the plastic hinges in the flange, gives
(2.83)
Also Shimizu et al. defines the length, , of the web under the load that yields and can not develop plastic hinges. Adding to the resistance function gives
(2.84)
Putting the web part of the right hand side of Equation (2.84) equal to gives an expression for according to
(2.85)
Now, the authors state that by using Equations (2.81) - (2.85) the resistance can be determined. Though, the values of and needs to be determined through tests, which is not that suitable for design.
Ungermann (1990) suggests, together with other design models, a design model for patch loading. The model included the buckling load, Fcr, the yield resistance, Fy, and the slenderness parameter, . The yield resistance is evaluated from a three hinge model according to Figure 2.12 and is calculated as
(2.86)
where
(2.87)
1
2----- ---=
Mpf6 E If------------------- 1 sin–=
FR 4Mpf
2--------- 2
Mpw ss 2 1 2 2 –+ +cos
-------------------------------------------------------------------------+=
fyw tw
2 Mpwss 2 1 2 2++
2 Mpw fyw tw cos+-------------------------------------------------------------------=
Fy 2 cu tw fyw=
2 cuss2----
ss2----
2 4 bf tf2 fyf
tw fyw-------------------------------++=
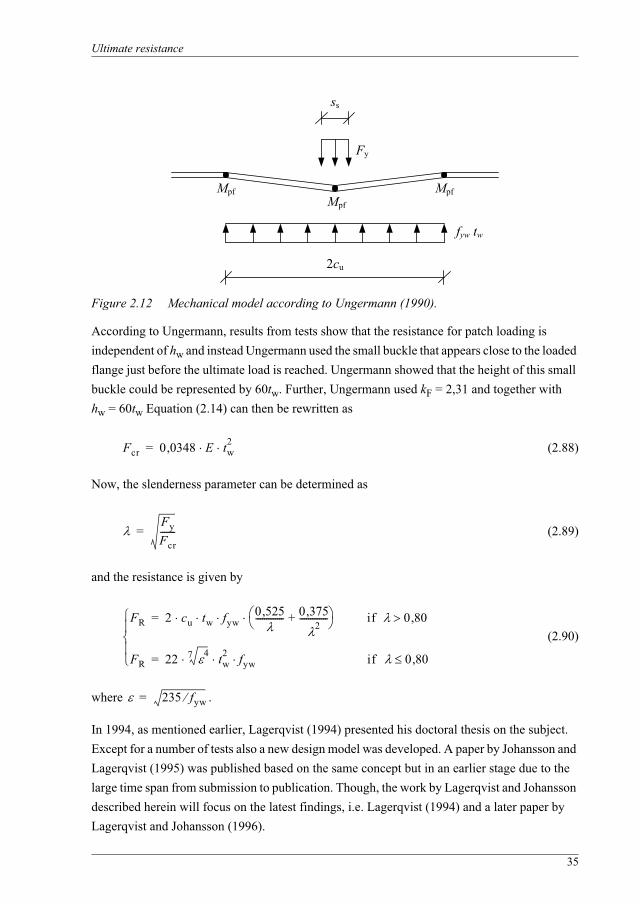
Ultimate resistance
35
Figure 2.12 Mechanical model according to Ungermann (1990).
According to Ungermann, results from tests show that the resistance for patch loading is independent of hw and instead Ungermann used the small buckle that appears close to the loaded flange just before the ultimate load is reached. Ungermann showed that the height of this small buckle could be represented by 60tw. Further, Ungermann used kF = 2,31 and together with hw = 60tw Equation (2.14) can then be rewritten as
(2.88)
Now, the slenderness parameter can be determined as
(2.89)
and the resistance is given by
(2.90)
where .
In 1994, as mentioned earlier, Lagerqvist (1994) presented his doctoral thesis on the subject. Except for a number of tests also a new design model was developed. A paper by Johansson and Lagerqvist (1995) was published based on the same concept but in an earlier stage due to the large time span from submission to publication. Though, the work by Lagerqvist and Johansson described herein will focus on the latest findings, i.e. Lagerqvist (1994) and a later paper by Lagerqvist and Johansson (1996).
Mpf
MpfMpf
2cu
Fy
fyw tw
ss
Fcr 0 0348 E tw2,=
FyFcr-------=
FR 2 cu tw fyw0 525,------------- 0 375,
2-------------+= if 0 80,
FR 22 47 tw2 fyw= if 0 80,
235 fyw=
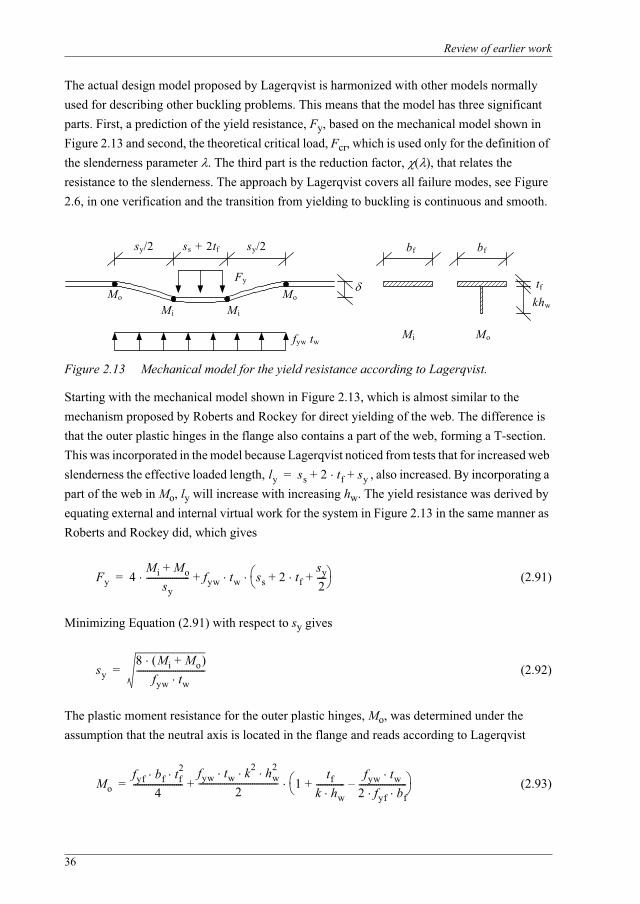
Review of earlier work
36
The actual design model proposed by Lagerqvist is harmonized with other models normally used for describing other buckling problems. This means that the model has three significant parts. First, a prediction of the yield resistance, Fy, based on the mechanical model shown in Figure 2.13 and second, the theoretical critical load, Fcr, which is used only for the definition of the slenderness parameter . The third part is the reduction factor, ( ), that relates the resistance to the slenderness. The approach by Lagerqvist covers all failure modes, see Figure 2.6, in one verification and the transition from yielding to buckling is continuous and smooth.
Figure 2.13 Mechanical model for the yield resistance according to Lagerqvist.
Starting with the mechanical model shown in Figure 2.13, which is almost similar to the mechanism proposed by Roberts and Rockey for direct yielding of the web. The difference is that the outer plastic hinges in the flange also contains a part of the web, forming a T-section. This was incorporated in the model because Lagerqvist noticed from tests that for increased web slenderness the effective loaded length, , also increased. By incorporating a part of the web in Mo, ly will increase with increasing hw. The yield resistance was derived by equating external and internal virtual work for the system in Figure 2.13 in the same manner as Roberts and Rockey did, which gives
(2.91)
Minimizing Equation (2.91) with respect to sy gives
(2.92)
The plastic moment resistance for the outer plastic hinges, Mo, was determined under the assumption that the neutral axis is located in the flange and reads according to Lagerqvist
(2.93)
ss + 2tf sy/2
fyw tw
Fy
M iM i
MoMo
sy/2 bf bf
tf
khw
MoMi
ly ss 2 tf sy++=
Fy 4Mi Mo+
sy-------------------- fyw tw ss 2 tf
sy2----+++=
sy8 Mi Mo+
fyw tw--------------------------------=
Mofyf bf tf
2
4-----------------------
fyw tw k2 hw2
2------------------------------------- 1
tfk hw-------------
fyw tw2 fyf bf----------------------–++=
Ultimate resistance
37
Further, if k is not too small, which it has to be in order to give contribution to the resistance, Lagerqvist states that the first term in the bracket is the dominating contributor and it is a safe simplification to neglect the second and third terms. Then
(2.94)
Inserting Equations (2.92) and (2.94) into Equation (2.91) and rearranging gives
(2.95)
Now, the only unknown in Equation (2.95) is the factor k. By comparison with test results it was found that k2 = 0,02 gave a reasonably good prediction of the patch loading resistance. Hence, the yield resistance can be written as
(2.96)
In Section 2.2, the buckling coefficient developed by Lagerqvist was described and therefore only the final equations are given here to make the procedure complete. The elastic critical load is determined as
(2.97)
where
(2.98)
The slenderness parameter is given by
(2.99)
Next, Lagerqvist proposed a reduction factor calibrated against 190 tests with . The reduction factor gives a lower 5-percent fractile equal to 1,0 for Fu/FR for the 190 tests and is determined as
Mofyf bf tf
2
4-----------------------
fyw tw k2 hw2
2-------------------------------------+=
Fy fyw tw ss 2 tf 2 tffyf bffyw tw----------------- k2 hw
tf------
2+++=
Fy fyw tw ss 2 tf 2 tffyf bffyw tw----------------- 0 02,
hwtf
------2
+++=
Fcr kF
2 E12 1 2–------------------------------
tw3
hw------=
kF 5 3 1 9hwa
------2
0 4bf tf
3
hw tw3
----------------4,+,+,=
FyFcr-------=
ME MR 0 4,

Review of earlier work
38
(2.100)
This gives a patch loading resistance according to
(2.101)
Lagerqvist (1994) also proposed a simplified model suited for design purposes. In this model the buckling coefficient, Equation (2.98), was simplified by omitting the term for the influence of the flanges, which gives a kF according to
(2.102)
Johansson et al. (2001) presents the new design rules that was introduced in Eurocode 3 for plated structures. The design rules for patch loading follows the procedure by Lagerqvist (1994) and Lagerqvist and Johansson (1996) with one exception. The reduction factor in Equation (2.100) was simplified to
(2.103)
The design model for patch loading was also calibrated versus test results by a statistical evaluation according to Annex Z1 of Eurocode 3 part 1-1 by Johansson et al. It was found that the partial safety factor, , should be set to 1,1 and the design resistance become
(2.104)
Finally, the equations for patch loading resistance in EN 1992-1-5 (2006) will be shown. It is basically the same equations as above but with slightly different notation and one limitation compared to the procedure by Lagerqvist (1994) and Johansson et al. (2001). The design resistance is obtained from
(2.105)
where
(2.106)
in which
1. Annex Z of Eurocode 3 part 1-1 is with minor changes today Annex D of EN 1990 (2002).
0 06, 0 47,---------- 1 0,+=
FR Fy=
kF 6 2hwa
------2
+=
0 5,------- 1 0,=
M
FRd Fy M=
FRdfyw Leff tw
M1------------------------------=
Leff F ly=
Ultimate resistance
39
(2.107)
and
(2.108)
(2.109)
The fact that m2 depends on is somewhat impractical since a value of has to be assumed first and later might have to be recalculated if wrong assumption was made, e.g. if m2 should be zero but assumed not.
The critical load is calculated according to
(2.110)
with kF according to Equation (2.102). The slenderness is determined as
(2.111)
and the reduction factor can be calculated with Equation (2.103).
2.3.3 Interaction with bending moment
In almost every case when a girder is subjected to a concentrated load it is together with a co-existing bending moment. Therefore, many researchers and design codes have proposed different models to take this into account. It should be noted though that most of the interaction equations are connected to a resistance model and will depend on that model.
Bergfelt (1971) proposed that the interaction between patch loading and bending moment should be taken care of by means of the interaction equation
(2.112)
ly ss 2 tf 1 m1 m2++ a+=
m1fyf bffyw tw-----------------=
m2 0 02,hwtf
------2
= F 0 5,
m2 0= F 0 5,
F F
Fcr 0 9 kF Etw3
hw------,=
Fly tw fyw
Fcr-------------------------=
FEFR------
8 MEMR--------
2+ 1=
Review of earlier work
40
In Bergfelt (1976), the author states that there only seems to be an influence from the bending moment on the patch load resistance if .
In Elgaaly (1983) another proposal for the interaction was presented according to
(2.113)
In 1992 yet another interaction equation was proposed by Herzog (1992). Herzog states that if the applied patch load is related to the pure web crippling load according to Equation (2.114) and the acting bending moment, ME, to the one for fully plastic flanges without web contribution an interaction formula according to Equation (2.115) will give a safe prediction. Equation (2.114) originally comes from Herzog (1986) and was developed with regression analyses and was compared to the ultimate load from 136 tests. It was defined as the 50% fractile of the web crippling load.
(2.114)
(2.115)
with
The interaction formula was compared to 42 tests with most of the tests on the safe side. However, the agreement was not that good and it is somewhat strange to put 0,9 as the maximum level. This means that even if the moment is very small the full patch load resistance cannot be utilized.
Ungermann (1990) suggests an interaction formula according to
(2.116)
In the paper Johansson and Lagerqvist (1995) an interaction formula was proposed which was coupled to an earlier proposal for the patch loading resistance, slightly different from that proposed by Lagerqvist (1994). The interaction equation was given as
(2.117)
ME MR 0 6,
FEFR------
3 MEMR--------
3+ 1=
FR 25 fyw twtftw-----3 0 4
hwa
------+,=
FEFR------
2 MEMRf---------+ 0 9,=
MRf fyf bf tf hw tf+=
FEFR------
MEMR--------+ 1 4,=
FEFR------ 1 25,
MEMR--------+ 1 75,=
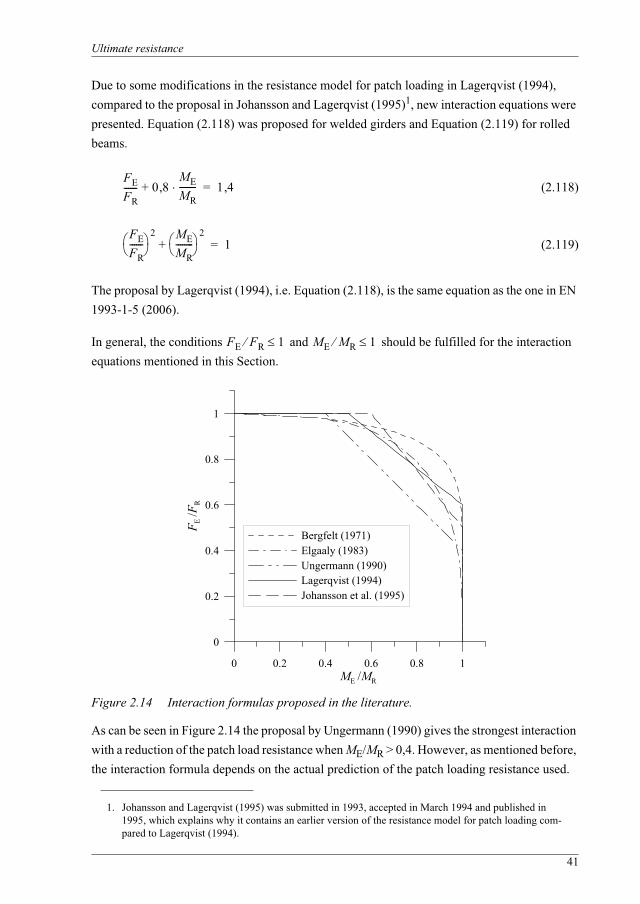
Ultimate resistance
41
Due to some modifications in the resistance model for patch loading in Lagerqvist (1994), compared to the proposal in Johansson and Lagerqvist (1995)1, new interaction equations were presented. Equation (2.118) was proposed for welded girders and Equation (2.119) for rolled beams.
(2.118)
(2.119)
The proposal by Lagerqvist (1994), i.e. Equation (2.118), is the same equation as the one in EN 1993-1-5 (2006).
In general, the conditions and should be fulfilled for the interaction equations mentioned in this Section.
Figure 2.14 Interaction formulas proposed in the literature.
As can be seen in Figure 2.14 the proposal by Ungermann (1990) gives the strongest interaction with a reduction of the patch load resistance when ME/MR > 0,4. However, as mentioned before, the interaction formula depends on the actual prediction of the patch loading resistance used.
1. Johansson and Lagerqvist (1995) was submitted in 1993, accepted in March 1994 and published in 1995, which explains why it contains an earlier version of the resistance model for patch loading com-pared to Lagerqvist (1994).
FEFR------ 0 8,
MEMR--------+ 1 4,=
FEFR------
2 MEMR--------
2+ 1=
FE FR 1 ME MR 1
0 0.2 0.4 0.6 0.8 1ME /MR
0
0.2
0.4
0.6
0.8
1
F E/F
R
Bergfelt (1971)Elgaaly (1983)Ungermann (1990)Lagerqvist (1994)Johansson et al. (1995)
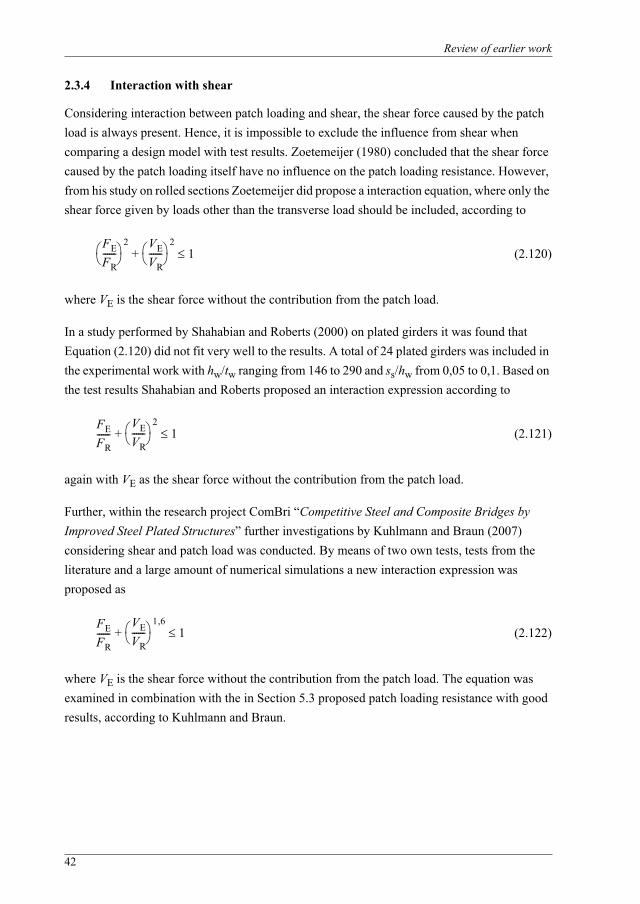
Review of earlier work
42
2.3.4 Interaction with shear
Considering interaction between patch loading and shear, the shear force caused by the patch load is always present. Hence, it is impossible to exclude the influence from shear when comparing a design model with test results. Zoetemeijer (1980) concluded that the shear force caused by the patch loading itself have no influence on the patch loading resistance. However, from his study on rolled sections Zoetemeijer did propose a interaction equation, where only the shear force given by loads other than the transverse load should be included, according to
(2.120)
where VE is the shear force without the contribution from the patch load.
In a study performed by Shahabian and Roberts (2000) on plated girders it was found that Equation (2.120) did not fit very well to the results. A total of 24 plated girders was included in the experimental work with hw/tw ranging from 146 to 290 and ss/hw from 0,05 to 0,1. Based on the test results Shahabian and Roberts proposed an interaction expression according to
(2.121)
again with VE as the shear force without the contribution from the patch load.
Further, within the research project ComBri “Competitive Steel and Composite Bridges by Improved Steel Plated Structures” further investigations by Kuhlmann and Braun (2007) considering shear and patch load was conducted. By means of two own tests, tests from the literature and a large amount of numerical simulations a new interaction expression was proposed as
(2.122)
where VE is the shear force without the contribution from the patch load. The equation was examined in combination with the in Section 5.3 proposed patch loading resistance with good results, according to Kuhlmann and Braun.
FEFR------
2 VEVR------
21+
FEFR------
VEVR------
21+
FEFR------
VEVR------
1 6,1+
Serviceability limit state
43
2.3.5 Review of experimental investigations
As mentioned earlier, a large amount of test data is available from many researchers, Lagerqvist collected the ones performed before 1994 and those have been used here and are only referred to through Lagerqvist (1994) and the test data can be found in Appendix C. However, there are a few other test series performed not added to the test data base by Lagerqvist or carried out after 1994, which also can be found in Appendix C. One is presented later in this thesis and deals with varying loaded lengths.
One small test serie found was presented by Raoul et al. (1990) including three tests on plated girders. One of the tests was a regular patch loading test while the other two was performed in order to investigate the influence considering load eccentricity and an imposed rotation on the loaded flange. Only the first test with a/hw = 1,4, hw/tw = 212 and ss/hw = 0,18, is included in the test data base.
Another test serie found in the literature was carried out by Shahabian and Roberts (2000). The study was mainly focused upon the interaction between shear and patch loading. A total of 24 tests, two on each girder, were performed. Four of the tests was pure patch loading tests with a/hw = 1, 1,5 and 2, hw/tw = 146 - 290 and ss/hw = 0,05 - 0,1.
A test serie containing stainless steel girders and was presented by Unosson (2003). A total of five tests with , hw/tw = 50-110 and ss/hw = 0,09-0,38. The ultimate loads from tests was compared to the predicted resistance according to Lagerqvist (1994) with a mean of 1,28 and a coefficient of variation of 0,073 as well as with EN 1993-1-5 (2006) with a mean of 1,34 and a coefficient of variation of 0,074.
The last test found in the literature was carried out by Kuhlmann and Seitz (2004). The main objective with the research presented by Kuhlmann and Seitz was patch loading of longitudinally stiffened girder webs but one reference test without longitudinal stiffeners was conducted with a/hw = 2, hw/tw = 200 and ss/hw = 0,58.
The tests described above are added to the data base collected by Lagerqvist, see Appendix C, and will be used for further evaluations of a new design model.
2.4 Serviceability limit state
The serviceability limit state in general and for girders subjected to patch loading in particular is a subject less studied compared to the ultimate limit state. This is probably due to the subjectivity of the problem, i.e. it is not as straight forward as the ultimate resistance.
One difficulty with serviceability is to define the limit state. This may vary depending on type of structure and how the owner weight different factors. Possible serviceability requirements for
a hw 4
Review of earlier work
44
patch loading are e.g. requirements that limit residual deformations and that limits web breathing. In this thesis it is the serviceability limit state during bridge launching that is of most interest and how to determine a reasonable criteria. For steel bridges EN 1993-2 (2003) requires no membrane yielding in the serviceability limit state. Behind this is a more basic requirement of reversible behaviour, which is less strict. Some yielding may occur as long as shake down is possible.
During launching, a girder section can be subjected to over 10 repeated support reactions from launching shoes if the girder is long, and subsequently it is important to limit the residual deformations to make sure that the attended girder can withstand the loads that it was designed for. Further, for bridge launching it is not a stationary patch load that is applied but a travelling load. Research in this area is very limited but there are some work done that will be briefly described here together with some general work on repeated patch loads.
In Skaloud and Novak (1972) a total of 22 patch loading tests were presented. 11 of the tests were performed under static conditions but the remaining 11 was loaded with a cyclic load that was stepwise increased. For each load step, 1000 loading cycles were applied. The aim with the cyclic load tests was to investigate; if the web deflection increase during a certain number of loading cycles in the plastic range, if the web deflection increase, does it cease after a limited number load applications and finally does the increase in deflection during cyclic loading affect the ultimate load. Both a static as well as a cyclic loading test was conducted on identical girders to enable a comparison in ultimate load. The girders had the dimensions a/hw = 1, hw/tw = 250 and 400 and the ratio ss/hw = 0,1 and 0,2. An increase in the web deflection was observed but the increase stopped at a constant level after a few, 3-5, load cycles according to the authors. The same behaviour was observed when the load was increased in the next load step. Further, the ultimate load from the cyclic loading tests were in all cases with hw/tw = 400 higher than the ultimate load from the static loading tests. For the cases with hw/tw = 250 the ultimate load was higher in some and lower in some cases if the ultimate load from the cyclic loading tests and static loading tests were compared.
As a complement to Skaloud and Novak (1972), Novak and Skaloud (1973) presented an extended test serie including 29 new tests. The test serie included both static and cyclic patch loading where a/hw = 1 and 2, hw/tw = 400 and ss/hw = 0,1 or 0,2 (for the girders with a/hw = 2). 12 of the cyclic loading tests were conducted with a slower loading rate, approximately 100 times slower than the other cyclic tests. The velocity of the movement of the loading jack was 6 mm/min and 50 loading cycles were applied in each successive loading step. The conclusions, drawn by the authors, from the work were that for the faster cyclic loading tests the ultimate load were not lower compared with the static tests. For the slow cyclic loading tests the ultimate load was lower in some cases and higher in some. The trend was that for higher flange stiffness the ultimate load in the cyclic loading tests were higher compared to the static
Serviceability limit state
45
loading case. However, the difference in ultimate load between the cyclic and static loading, irrespective of speed, was less than 10%.
Drdacky (1986) presented some results regarding the plastification of girder webs subjected to patch loading. The beginning of plastification was determined by means of an acoustic emission method and checked by strain gauges placed in discrete points. Drdacky found that a part of the web can be in plastic state (membrane yielding) already at 25% of the ultimate load for stocky webs. From the results presented on girders with hw/tw from 25 to 400, which is not very thoroughly reported, it can be seen that when hw/tw increase this level also increase. However, it is also shown that the loaded length, ss, plays an important role. Longer ss but otherwise equal girder dimensions gives higher level of load before membrane yielding occur. Drdacky proposed a design rule for girders subjected to dynamic patch loads, which was that the ultimate resistance from the static case should be reduced by 50%.
In Kutmanová and Skaloud (1992) another study on repeated partial edge loading was presented. Most of the tested girders were longitudinally stiffened but 16 girders had no longitudinal stiffeners. Some of girders were subjected to constant loading for the sake of comparison. However, information on how many girders that were subjected to constant or repeated loadings were not given. The girders without longitudinal stiffeners had hw = 500 mm, a/hw = 1, tw = 4 mm and ss/hw = 0,1 - 0,3. Further, the flange size was varied between what was called “thin” and “thick” flanges.
The load in the repeated loading tests by Kutmanová and Skaloud cycled between zero and a value Pmax. Pmax was varied between the constant loading ultimate load and the onset of yielding load also from the constant loading tests. Thus, the webs of the tested girders were in the elasto-plastic range and consequently their performance was expected to be governed by low-cycle fatigue according to the authors. The results from the repeated patch load tests were given as the onset of surface yielding loads and the low-cycle fatigue load, determined as the maximum load values under which no appearance of cracks or other kind of failures were detected after load cycles. These loads were given as a fraction of the ultimate load, Fu,from the constant loading tests for both “thin” and “thick” flanges. The onset of surface yielding was for both kind of flanges 0,39Fu and the low-cycle fatigue load was 0,75Fu and 0,9Fu for “thin” and “thick” flanges, respectively. The information regarding the tests and the results are limited and only one web slenderness, hw/tw, was tested.
Lagerqvist (1994) presented a rough estimation of a load level for avoiding residual deformations. Based on the load-deformation curves from his tests, Lagerqvist noticed that with a few exceptions the behaviour was linear at least up to 70% of the ultimate load. If this is assumed to be the upper limit of the elastic range, a resistance of 0,7FR in the serviceability limit state could be a criterion.
5 104
Review of earlier work
46
Granath et al. (2000) presented a numerical study similar to the one presented later in this thesis, where different girders were subjected to a travelling load together with a bending moment. Unfortunately, some information regarding how the load was applied and whether the loaded flange was constrained from rotation or not are missing. The girders were divided into a Normalgirder, hw/tw = 100 and bf/tf = 14, a Slender girder, hw/tw = 167 and bf/tf = 28, and a Stockygirder, hw/tw = 50 and bf/tf = 14. The amplitude of the initial imperfections used were hw/160,hw/96 and hw/200 respectively.
The results showed that for the Normal girder loaded with 0,5Fu,FE and 0,69MR no increase of the remaining buckle amplitude took place after three load passages. However, when the load level was increased to 0,72Fu,FE and 0,73MR the remaining buckle amplitude was increasing for each passage and after three passages the increase was approximately 5 mm and after twelve passages approximately 8 mm. The above mentioned load levels, i.e. 0,5Fu,FE and 0,72Fu,FE,have been recalculated to fulfil the interaction between patch loading and bending moment, see Equation (2.118), since there should be a significant affect from bending moments at these levels.
For the Slender girder two load levels were used, 0,46Fu,FE and 0,52MR as well as 0,68Fu,FEand 0,50MR. The former load level gave a remaining buckle amplitude growth of approximately 2 mm, though almost constant. For the latter load level the remaining buckle amplitude was first growing with approximately 3 mm and then gradually changing shape after six load passages from a sinusoidal shape to an S-shape with a smaller local buckle close to the loaded flange.
The Stocky girder was also subjected to two different load levels namely 0,49Fu,FE and 0,46MRas well as 0,68Fu,FE together with 0,61MR. As expected the former load level gave almost no increase of the remaining buckle amplitude. However, for the latter load level the growth was clear and also for this case the buckle changed shape as for the slender web.
The general conclusion that was drawn in Granath et al. (2000) was that for a travelling load, a load level of approximately 0,50Fu,FE gave reversible behaviour, i.e. 70% of the ultimate load as proposed by Lagerqvist (1994) for stationary loads are too high for travelling loads. It should be noted though that the amplitude of the initial imperfection used for the Slender girder was large, compared to the in EN 1993-1-5 recommended hw/200.
Granath (2000) presented a serviceability limit state criterion for patch loading based on a large number of non-linear FE-analyses. The limit state was defined such that the effective stress at the web surface should not exceed the yield strength of the web. Granath performed non-linear FE-analyses on 155 tests collected earlier by Lagerqvist to determine at what load level, FFEM,the effective stress at the web surface reach the yield strength of the web material. Those analyses showed that for low , according to Equation (2.111), the difference between FFEMand Fu was large but for high the difference was very small. This behaviour is expected as
F
F
Serviceability limit state
47
for a slender girder the yielding, if any, will occur late as the web will fail due to instability meanwhile a stocky girder web will yield earlier, in relation to the ultimate load, during loading. In addition to the analyses of the tested girders Granath carried out a total of 486 other analyses to cover more cases, e.g. girders made of high strength steel and girders subjected to large global bending moments.
Granath (2000) proposed a design criterion for patch loading in the serviceability limit state developed through regression analysis based on all FE-analyses performed. The resistance for a girder is calculated as
(2.123)
with
(2.124)
and
(2.125)
According to Granath 95% of both the stocky and slender girders have a FFEM that is higher than FR,sls.
Finally, an interaction formula for patch loading together with bending moment in the serviceability limit state was proposed by Granath according to
(2.126)
The work presented in Granath (2000) is very extensive but all analyses that form the basis for the serviceability limit state criterion is based on stationary loading, which is not of primary interest here.
FR sls minFstocky
Fslender=
Fstocky 0 885, fyw tw ss 5 tf+bfhw------8=
Fslender 3 93, fyw tw2 ss 5 tf+ E
hw tw fyw----------------------------
tfa---=
IfME
Weff fyw---------------------- 0 43
FEFR sls-------------- 1,
IfME
Weff fyw---------------------- 0 43
FEFR sls-------------- 1 75
MEWeff fyw---------------------- 1 75,,+,
Review of earlier work
48
2.5 Summary of the review
Considering the elastic critical buckling load for simply supported plates, Zetlin (1955), Rockey and Bagchi (1970), Khan et al. (1977), Lagerqvist (1994) and Ren and Tong (2005) have all presented values on kF with reasonable good agreement with each other. The models used were almost identical, though the boundary conditions for the vertical edges were slightly different. Rockey et al. and Lagerqvist used models that allowed for rotation of the vertical edges as rigid lines around the neutral axis of the section, which was not allowed by the others.
Rockey and Bagchi (1970) also presented results on kF for a section including the flexural and torsional properties of the flanges. This is believed more relevant for patch loading and it was shown that when the flanges were included the critical load was increased significantly. Lagerqvist (1994) did a thorough study of the critical load on cross sections including web and flanges by means of FE-analyses in order to find approximate solutions for kF were the dominating parameters were included. Recently, Ren and Tong (2005) performed a study aiming for an expression that gives a kF for a section with flanges in between the solution for a simply supported plate and a plate clamped at the horizontal edges. For weak flanges the solution of kF should end up close to the solution for a simply supported plate and for strong flanges close to the solution for clamped edges. However, the model including flanges used for the investigation of the rotational restraint did not prevent any rotation under the load, which makes the approach a bit doubtful to recommend for design purposes. From the author of this thesis point of view, the expression for kF proposed by Lagerqvist was derived with the most realistic model and therefore the proposal by Lagerqvist will be further used later in this thesis. In addition, critical loads obtained through the software EBPlate, Galéa and Martin (2006), will also be included in the further studies in this thesis.
Regarding ultimate limit state there are an abundance of studies and expressions for the resistance. From fully empirical models to models based on some kind of mechanism, with and without yield lines in the web. The general opinion that the web thickness are the parameter that contributes mostly to the resistance was confirmed by the results presented by Raoul et al. (1991), see Equation (2.37). Further, Roberts and co-workers proposed a model with four plastic hinges in the loaded flange together with three yield lines in the web for predicting the failure load regarding web crippling. In addition Roberts proposed a model for direct yielding of the web and the recommendation was to use the lesser of the resistance from the two models. Bergfelt on the other hand proposed a three-hinge mechanism using the von Kármán approach to describe the resistance of the web. The solution by Bergfelt contains a number of correction factors which makes the method rather complicated.
Following the concept by Roberts and Bergfelt using mechanism solutions, Ungermann (1990) and Lagerqvist (1994) developed their own resistance models. Those models included a plastic resistance, based on a plastic hinge mechanism in the loaded flange, the critical buckling load
Summary of the review
49
and a reduction factor to relate the slenderness to the resistance. The model by Ungermann used a three-hinge mechanism and a simplified expression for the critical buckling load, while Lagerqvist used a four-hinge mechanism and a more sophisticated expression for kF mentioned above. Furthermore, Lagerqvist’s approach has another advantage, that is that the same equations are used irrespective of the type of structural member considered. Ungermann on the other hand proposed two different equations, one for formulated for rolled beams and one for > 0,80 derived for welded girders.
The author of this thesis considers the approach by Ungermann and Lagerqvist as very interesting since it follows the same analogy as other buckling problems in the design codes. Moreover, a four-hinge mechanism is more likely to develop in reality and for instance Lagerqvist found proofs for this in his experimental investigation. The last advantage, compared to most of the other developed models, is that the resistance model by Lagerqvist considers only one verification covering all failure modes and the transition from yielding to crippling and buckling is smooth and continuous.
Considering the influence on the patch loading resistance from a co-existing bending moment there exists a number of suggestions in the literature. Some of them were considered in the review and the general conclusion found was that for small ratios for ME/MR the influence is negligible. Further, the influence from an external shear force on the patch loading resistance was investigated by some researchers where the latest contribution from Kuhlmann and Braun (2007), which is examined together with the in this thesis proposed patch loading resistance with good results, is assumed to be a good criterion for this.
When it comes to the patch loading resistance in the serviceability limit state, e.g. launching of bridge girders, the amount of papers found in the literature was very limited. The only actual design criterion was proposed by Granath (2000) where the limit state was defined such that the effective stress at the web surface should not exceed the yield strength of the web material. The final criterion was developed through regression analysis based on a large number of FE-analyses in which the serviceability load level, FFEM, was determined for different geometries and load conditions. The disadvantage with the model by Granath is that it was developed for stationary loads, which is not the load situation when launching a bridge girder.
Lagerqvist proposed a rough estimation, based on his test results, that no residual deformations would appear if 0,7FR was used as the serviceability limit state criterion. Drdacky (1986) found, not surprisingly, that membrane yielding of the web starts at a lower load level in relation with the ultimate load for low ratio of hw/tw compared to a higher ratio of hw/tw.
The primarily interest considering serviceability limit state in this thesis is to find a serviceability criterion for bridge girders that is launched into position. This means that the girder is subjected to a number of travelling concentrated forces, when travelling over several
0 80,
Review of earlier work
50
supports, during launching and also that the subsequent load situation when acting in the actual bridge is shear and bending moment. Hence, the actual resistance to patch loading after several repeated loads are not of primary interest. The only study at all considering travelling loads was presented in Granath et al. (2000) where FE-analyses of three different geometries were carried out subjected to up to 12 load passages. It was concluded by Granath et al. that even at low load levels significant residual deformations were found.
51
3 EXPERIMENTAL WORK
3.1 General
The experimental investigation carried out was focused on the influence from the loaded length on the ultimate resistance for patch loading of I-girders. When studying the literature, one can immediately see that the main tests performed was conducted with short loaded lengths. It is generally known that the resistance of a girder subjected to patch loading increase with increasing loaded length. Further, to avoid problems during launching it is common to increase the length of the launching shoe and then the question arise how well this is covered by the design rules.
Three patch load tests on identical girders were conducted with varying loaded lengths. In addition, a total of 12 uniaxial tests were conducted in order to determine the mechanical properties in terms of stress-strain curves for the plates used for manufacturing of the girder specimens used for the patch loading tests. The material used in all tests was S355 delivered from Dillinger Hütte, Germany. The complete set of test results are displayed in Appendix A and B.
3.2 Uniaxial coupon tests
The uniaxial tests were conducted to determine the mechanical material properties of the plates used for the specimens. In a later stage of this work the stress-strain curves from the tests will be used in further numerical investigations, i.e. by means of the finite element method.
The tested I-girders had 20 mm thick flanges and stiffeners and a 6 mm thick web of steel grade S355. It is common that different thicknesses have a somewhat different mechanical behaviour due to the rolling. This was investigated by means of six tensile tests on each thickness and these six tests were divided into three tests along and three tests transverse the rolling direction. In Figure 3.1, four stress-strain curves are shown, one for each thickness and direction.
As can be seen, a slight anisotropy, i.e. difference in behaviour between the rolling and transverse directions, is present for the thinner material. A summary of the tests can be found in Table 1 below, whereas individual test results from the uniaxial tests are displayed in Appendix A.
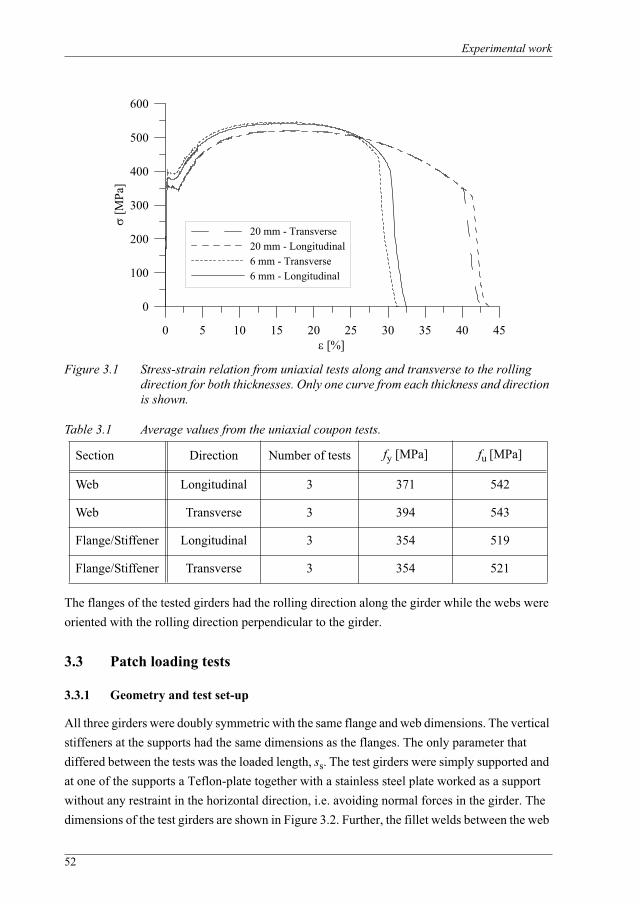
Experimental work
52
Figure 3.1 Stress-strain relation from uniaxial tests along and transverse to the rolling direction for both thicknesses. Only one curve from each thickness and direction is shown.
Table 3.1 Average values from the uniaxial coupon tests.
The flanges of the tested girders had the rolling direction along the girder while the webs were oriented with the rolling direction perpendicular to the girder.
3.3 Patch loading tests
3.3.1 Geometry and test set-up
All three girders were doubly symmetric with the same flange and web dimensions. The vertical stiffeners at the supports had the same dimensions as the flanges. The only parameter that differed between the tests was the loaded length, ss. The test girders were simply supported and at one of the supports a Teflon-plate together with a stainless steel plate worked as a support without any restraint in the horizontal direction, i.e. avoiding normal forces in the girder. The dimensions of the test girders are shown in Figure 3.2. Further, the fillet welds between the web
Section Direction Number of tests fy [MPa] fu [MPa]
Web Longitudinal 3 371 542
Web Transverse 3 394 543
Flange/Stiffener Longitudinal 3 354 519
Flange/Stiffener Transverse 3 354 521
0 5 10 15 20 25 30 35 40 45[%]
0
100
200
300
400
500
600[M
Pa]
20 mm - Transverse20 mm - Longitudinal6 mm - Transverse6 mm - Longitudinal
Patch loading tests
53
and flanges had a throat thickness of 5 mm. The exact dimensions for each girder are displayed in Appendix B.
Figure 3.2 Geometry of the test girders.
The loaded length, ss, depends on how it is defined. The aim was to investigate the influence from long loading lengths, in this case 200 mm, 700 mm and 1440 mm was chosen. For a girder loaded through one loading plate like most of the girders tested by others it is easy to define ss,i.e. ss equals the length of the loading plate. However, in this case two different set-ups were used since it is very difficult to find a stiff enough loading plate with the width of 1440 mm. For the test with 200 mm loading plate a plate of thickness 40 mm and length 200 mm was used. For the two other cases it was decided to use two or four plates with load distributing beams on top, see Figure 3.3. In the latter cases, i.e. where more than one plate were used, the plates had a thickness of 40 mm and a length of 330 mm. In here, the tests are called P200, P700 and P1440 and the figures comes from the distance between the outer edges of the outer loading plates, if more than one, or the width of the plate for the 200 mm case, see Table 3.2 and Figure 3.3. If this should be treated as ss or not can be discussed and will depend on the mechanical model used when defining the yield resistance. According to EN 1993-1-5 (2006) the recommendation, if the load is distributed through several concentrated forces, is that the resistance should be checked for each individual force as well as for the total load where ssshould be taken as the centre-to-centre distance between the outer loads and adding the load spread through the loading plate. There is also a limitation that ss should not be taken as larger than hw. In Table 3.2 the loaded length according to EN 1993-1-5 is shown as well.
2400
12006
20
20
450[mm]
30

Experimental work
54
Figure 3.3 Test set-up for the three different tests. The grey bars are locked in the longitudinal direction.
200 P200
F [mm]
F
330330 40
370
P700
F
330 330330 33040 4040
1110
P1440
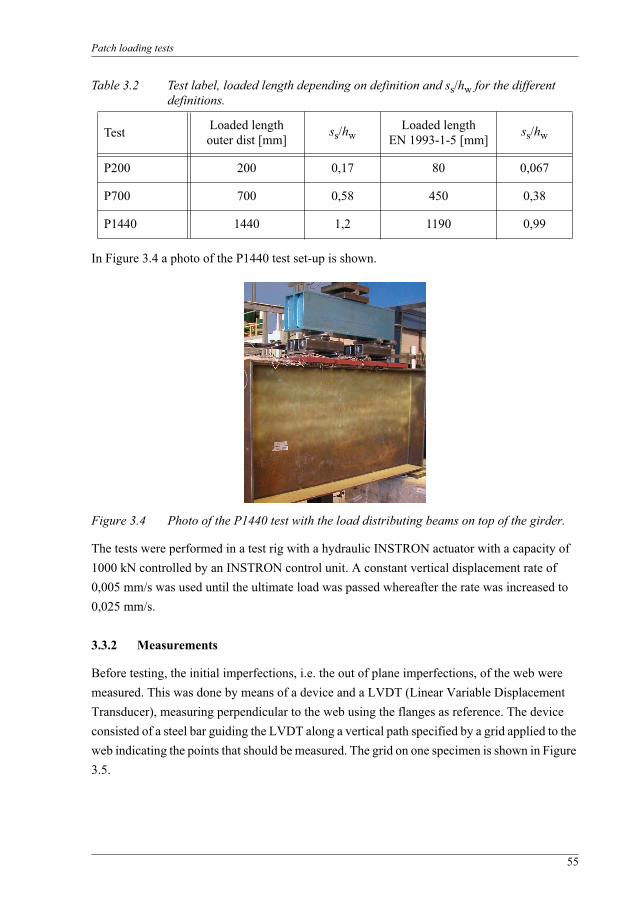
Patch loading tests
55
Table 3.2 Test label, loaded length depending on definition and ss/hw for the different definitions.
In Figure 3.4 a photo of the P1440 test set-up is shown.
Figure 3.4 Photo of the P1440 test with the load distributing beams on top of the girder.
The tests were performed in a test rig with a hydraulic INSTRON actuator with a capacity of 1000 kN controlled by an INSTRON control unit. A constant vertical displacement rate of 0,005 mm/s was used until the ultimate load was passed whereafter the rate was increased to 0,025 mm/s.
3.3.2 Measurements
Before testing, the initial imperfections, i.e. the out of plane imperfections, of the web were measured. This was done by means of a device and a LVDT (Linear Variable Displacement Transducer), measuring perpendicular to the web using the flanges as reference. The device consisted of a steel bar guiding the LVDT along a vertical path specified by a grid applied to the web indicating the points that should be measured. The grid on one specimen is shown in Figure 3.5.
Test Loaded lengthouter dist [mm]
ss/hwLoaded length
EN 1993-1-5 [mm]ss/hw
P200 200 0,17 80 0,067
P700 700 0,58 450 0,38
P1440 1440 1,2 1190 0,99

Experimental work
56
During the tests, the data from the different measurements, i.e. the load and stroke from the actuator, strains from a number of strain gauges and displacements, was recorded and stored on a computer.
Vertical displacements were measured on the loading plate/plates and in the middle of the girder on the bottom flange. This means three LVDT's (one on each side of the loading plate) for the P200 girder, three on the P700 girder, one on each loading plate and one on the bottom flange, and five on the P1440 girder, as shown in Figure 3.5.
Figure 3.5 The P1440 test where the arrows indicate the LVDT’s measuring vertical displacement. On the web a grid was applied for measurement of initial imperfections and lateral deformations during the test.
Strains were measured during the tests by a number of uniaxial and triaxial rosette strain gauges. The strain gauges were attached in the same position on both sides of the web in order to enable evaluation of membrane strains. A total of 14 monoaxial strain gauges were used for the P200 and P700 girders and 22 for the P1440 girder, i.e. 7 or 11 on each side of the web respectively. Four triaxial strain gauges were used in all tests. An example of the layout of the strain gauges is shown in Figure 3.6 for the P1440 girder. The same analogy was used for the other tests as well. The strain gauge layout for the P200 and P700 can be found in Appendix B.
Further, during the tests also the out of plane deformation of the web were measured at certain load steps. When these loads were reached the deformation of the specimen was halted and the measurement was conducted. The buckling measurements on the web were only performed along a vertical line centrically below the applied load. The same equipment was used as used for the initial imperfection measurements.

Patch loading tests
57
Figure 3.6 Strain gauge layout on one side of the web of the P1440 test girder.
Moreover, during the tests of the specimens P700 and P1440 a photogrammetric measuring method was tried. One side of the web was given a pattern that was photographed at every 100 kN. The aim was to obtain strain fields on the web, at least before severe buckling of the web had started, to investigate how the strains were distributed in the web due to the patch loading. The method has been shown to work well on concrete beams, see e.g. Carolin et al. (2004), but unfortunately the quality of the pattern was not good enough in this case. Hence, no results from this method were obtained within this study.
Furthermore, to make it possible to take pictures of one side of the web the nearby area on that side of the girder had to be clear, i.e. no equipment could stand on that side of the girder during the tests. This led to, for the P700 and P1440 tests, some problems when measuring the displacements of the loading plates. Since no equipment could be placed on one side of the girder only the vertical displacements on one side of the loading plate could be measured. A not fully flat upper flange or a loading plate not perfectly positioned, may lead to a tilting loading plate under deformation of the specimen (loading). This combined with a single side measurement of the vertical displacement on the loading plate may lead to an awkwardly graphical interpretation of the load-displacement behaviour. Regarding the load-displacement curve of P1440, this may be the cause of the somewhat unexpected correlation between the vertical deformation and the load.
Considering the P200 test, no photogrammetric measurements were conducted, hence the displacements of the loading plates were measured on both sides of the girder.
200
100
270
30
185 185
50
370A
111 121 131201
311,312,313411,
412,413
301
401
501
185
150
185 340185185
151141101 161
385
80
y
x

Experimental work
58
3.4 Test results
In this section the main results from the tests are shown graphically as load-deformation curves as well as lateral web deformation and vertical strains along the centre line of the web at certain load steps. The full strain curves from all strain gauges are shown in Appendix B.
3.4.1 P200
Figure 3.7 shows the applied force vs. the vertical web deformation, i.e. the vertical displacement of the loading plate substracted with the vertical deformation of the lower flange, for the P200 test. The ultimate load for the P200 test was Fu = 544 kN.
Figure 3.7 P200. Force vs. vertical web deformation.
The initial lateral imperfections of the web were measured before testing as described earlier. In Figure 3.8, the initial imperfections along the centre line of the web, directly below the applied load, are shown. As can be seen the maximum imperfection is approximately 0,27 times the web thickness, i.e. 1,6 mm, and the web imperfection had a bow-shape. In the following figures the points are measured values and the lines connecting the points are only a fit to the measured results.
0 2 4 6 8 10 12 14 16Vertical web deformation [mm]
0
100
200
300
400
500
600
700
800
900
Forc
e [k
N]
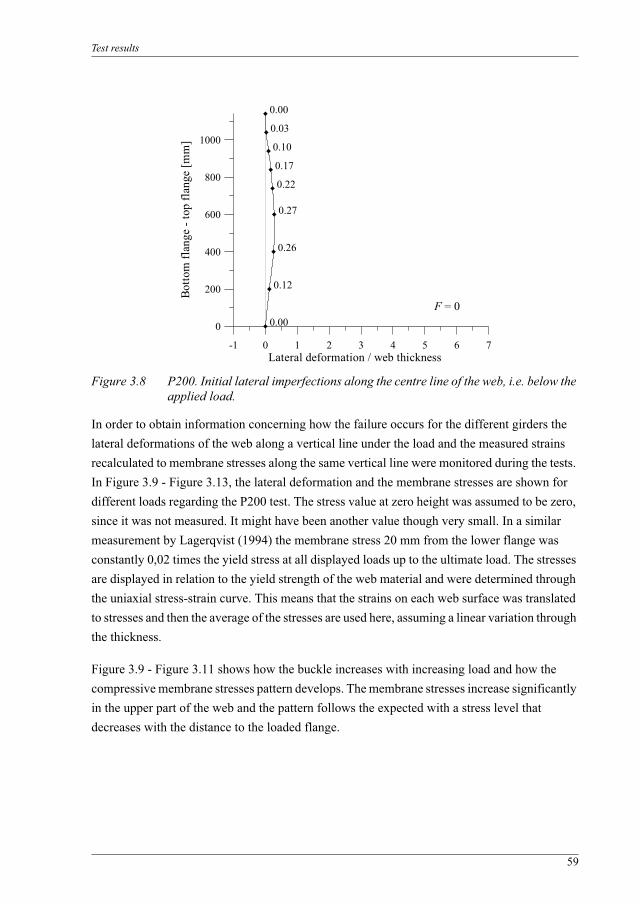
Test results
59
Figure 3.8 P200. Initial lateral imperfections along the centre line of the web, i.e. below the applied load.
In order to obtain information concerning how the failure occurs for the different girders the lateral deformations of the web along a vertical line under the load and the measured strains recalculated to membrane stresses along the same vertical line were monitored during the tests. In Figure 3.9 - Figure 3.13, the lateral deformation and the membrane stresses are shown for different loads regarding the P200 test. The stress value at zero height was assumed to be zero, since it was not measured. It might have been another value though very small. In a similar measurement by Lagerqvist (1994) the membrane stress 20 mm from the lower flange was constantly 0,02 times the yield stress at all displayed loads up to the ultimate load. The stresses are displayed in relation to the yield strength of the web material and were determined through the uniaxial stress-strain curve. This means that the strains on each web surface was translated to stresses and then the average of the stresses are used here, assuming a linear variation through the thickness.
Figure 3.9 - Figure 3.11 shows how the buckle increases with increasing load and how the compressive membrane stresses pattern develops. The membrane stresses increase significantly in the upper part of the web and the pattern follows the expected with a stress level that decreases with the distance to the loaded flange.
-1 0 1 2 3 4 5 6 7Lateral deformation / web thickness
0
200
400
600
800
1000
Botto
m fl
ange
- to
p fla
nge
[mm
]
0.00
0.03
0.10
0.17
0.22
0.27
0.26
0.12
0.00F = 0
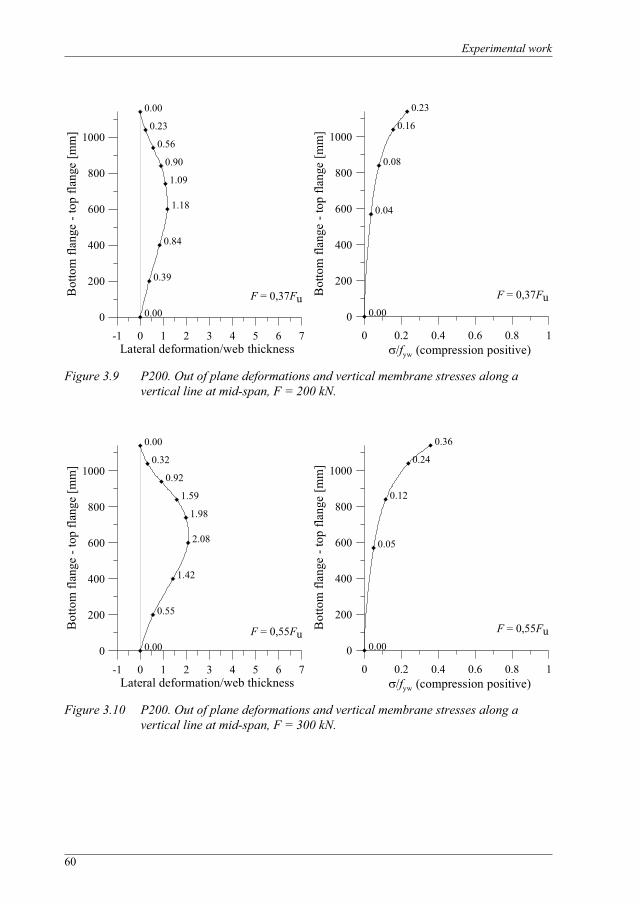
Experimental work
60
Figure 3.9 P200. Out of plane deformations and vertical membrane stresses along a vertical line at mid-span, F = 200 kN.
Figure 3.10 P200. Out of plane deformations and vertical membrane stresses along a vertical line at mid-span, F = 300 kN.
0 0.2 0.4 0.6 0.8 1/fyw (compression positive)
0
200
400
600
800
1000
Bot
tom
flan
ge -
top
flang
e [m
m]
0.23
0.16
0.08
0.04
0.00
F = 0,37Fu
-1 0 1 2 3 4 5 6 7Lateral deformation/web thickness
0
200
400
600
800
1000
Bot
tom
flan
ge -
top
flang
e [m
m]
0.00
0.23
0.56
0.90
1.09
1.18
0.84
0.39
0.00F = 0,37Fu
0 0.2 0.4 0.6 0.8 1/fyw (compression positive)
0
200
400
600
800
1000
Bot
tom
flan
ge -
top
flang
e [m
m]
0.36
0.24
0.12
0.05
0.00
F = 0,55Fu
-1 0 1 2 3 4 5 6 7Lateral deformation/web thickness
0
200
400
600
800
1000
Bot
tom
flan
ge -
top
flang
e [m
m]
0.00
0.32
0.92
1.59
1.98
2.08
1.42
0.55
0.00F = 0,55Fu
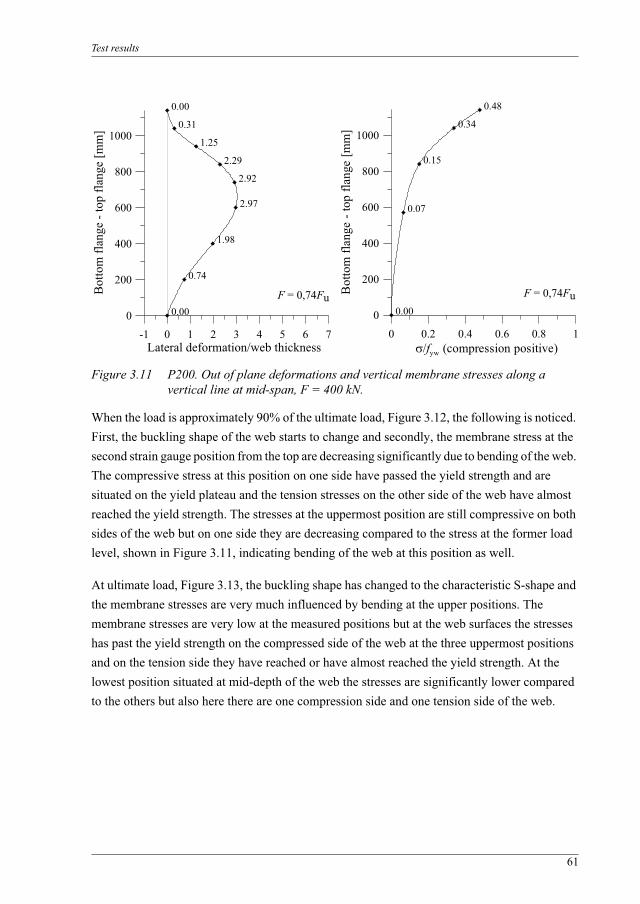
Test results
61
Figure 3.11 P200. Out of plane deformations and vertical membrane stresses along a vertical line at mid-span, F = 400 kN.
When the load is approximately 90% of the ultimate load, Figure 3.12, the following is noticed. First, the buckling shape of the web starts to change and secondly, the membrane stress at the second strain gauge position from the top are decreasing significantly due to bending of the web. The compressive stress at this position on one side have passed the yield strength and are situated on the yield plateau and the tension stresses on the other side of the web have almost reached the yield strength. The stresses at the uppermost position are still compressive on both sides of the web but on one side they are decreasing compared to the stress at the former load level, shown in Figure 3.11, indicating bending of the web at this position as well.
At ultimate load, Figure 3.13, the buckling shape has changed to the characteristic S-shape and the membrane stresses are very much influenced by bending at the upper positions. The membrane stresses are very low at the measured positions but at the web surfaces the stresses has past the yield strength on the compressed side of the web at the three uppermost positions and on the tension side they have reached or have almost reached the yield strength. At the lowest position situated at mid-depth of the web the stresses are significantly lower compared to the others but also here there are one compression side and one tension side of the web.
0 0.2 0.4 0.6 0.8 1/fyw (compression positive)
0
200
400
600
800
1000
Bot
tom
flan
ge -
top
flang
e [m
m]
0.48
0.34
0.15
0.07
0.00
F = 0,74Fu
-1 0 1 2 3 4 5 6 7Lateral deformation/web thickness
0
200
400
600
800
1000
Bot
tom
flan
ge -
top
flang
e [m
m]
0.00
0.31
1.25
2.29
2.92
2.97
1.98
0.74
0.00F = 0,74Fu
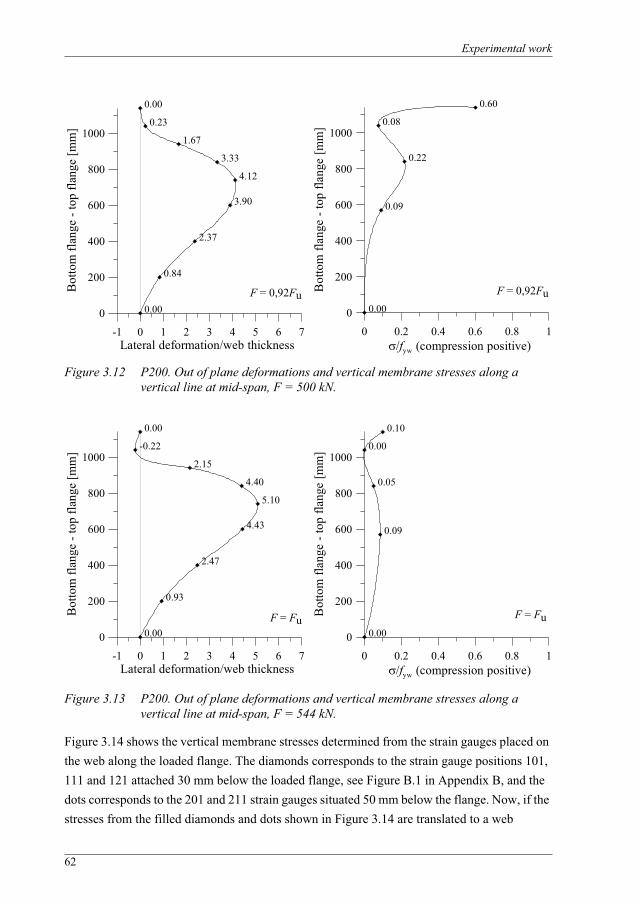
Experimental work
62
Figure 3.12 P200. Out of plane deformations and vertical membrane stresses along a vertical line at mid-span, F = 500 kN.
Figure 3.13 P200. Out of plane deformations and vertical membrane stresses along a vertical line at mid-span, F = 544 kN.
Figure 3.14 shows the vertical membrane stresses determined from the strain gauges placed on the web along the loaded flange. The diamonds corresponds to the strain gauge positions 101, 111 and 121 attached 30 mm below the loaded flange, see Figure B.1 in Appendix B, and the dots corresponds to the 201 and 211 strain gauges situated 50 mm below the flange. Now, if the stresses from the filled diamonds and dots shown in Figure 3.14 are translated to a web
0 0.2 0.4 0.6 0.8 1/fyw (compression positive)
0
200
400
600
800
1000
Bot
tom
flan
ge -
top
flang
e [m
m]
0.60
0.08
0.22
0.09
0.00
F = 0,92Fu
-1 0 1 2 3 4 5 6 7Lateral deformation/web thickness
0
200
400
600
800
1000
Bot
tom
flan
ge -
top
flang
e [m
m]
0.00
0.23
1.67
3.33
4.12
3.90
2.37
0.84
0.00F = 0,92Fu
-1 0 1 2 3 4 5 6 7Lateral deformation/web thickness
0
200
400
600
800
1000
Bot
tom
flan
ge -
top
flang
e [m
m]
0.00
-0.22
2.15
4.40
5.10
4.43
2.47
0.93
0.00F = Fu
0 0.2 0.4 0.6 0.8 1/fyw (compression positive)
0
200
400
600
800
1000
Bot
tom
flan
ge -
top
flang
e [m
m]
0.10
0.00
0.05
0.09
0.00
F = Fu
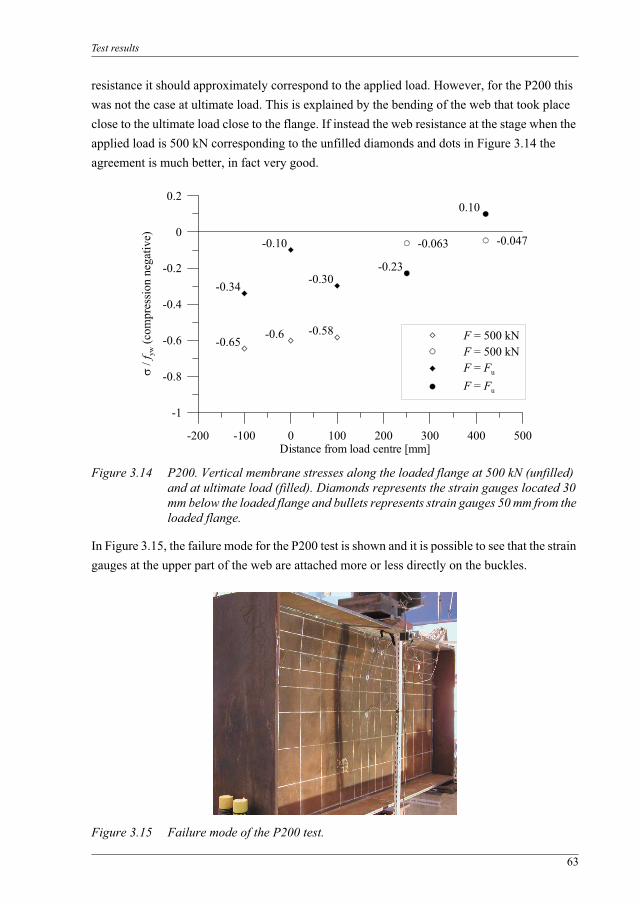
Test results
63
resistance it should approximately correspond to the applied load. However, for the P200 this was not the case at ultimate load. This is explained by the bending of the web that took place close to the ultimate load close to the flange. If instead the web resistance at the stage when the applied load is 500 kN corresponding to the unfilled diamonds and dots in Figure 3.14 the agreement is much better, in fact very good.
Figure 3.14 P200. Vertical membrane stresses along the loaded flange at 500 kN (unfilled) and at ultimate load (filled). Diamonds represents the strain gauges located 30 mm below the loaded flange and bullets represents strain gauges 50 mm from the loaded flange.
In Figure 3.15, the failure mode for the P200 test is shown and it is possible to see that the strain gauges at the upper part of the web are attached more or less directly on the buckles.
Figure 3.15 Failure mode of the P200 test.
-200 -100 0 100 200 300 400 500Distance from load centre [mm]
-1
-0.8
-0.6
-0.4
-0.2
0
0.2
/ f yw
(com
pres
sion
neg
ativ
e)
-0.34
-0.10
-0.30-0.23
0.10
-0.65-0.6 -0.58
-0.063 -0.047
F = 500 kNF = 500 kNF = Fu
F = Fu

Experimental work
64
3.4.2 P700
Figure 3.16 show the applied force vs. the vertical web deformation, i.e. the mean vertical displacement of the two loading plates subtracted with the vertical displacement of the lower flange, for the test P700. The initial less stiff part of the curve could be explained by either initial settlements of the test set-up or small rotations of the loading plates, as mentioned in Section 3.3.2, or a combination of both. The ultimate load for the P700 test was Fu = 660 kN.
Figure 3.16 P700. Force vs. vertical web deformation.
In Figure 3.17, the initial imperfections along the centre line of the web are shown As can be seen the maximum imperfection is approximately 1,07 times the web thickness, i.e. 6,4 mm, and the web imperfection has a bow-shape. This is a significantly larger initial imperfection compared to the P200 girder. However, the imperfection of the P700 is approximately hw/200which is considered to be an allowed panel imperfection.
0 2 4 6 8 10 12 14 16Vertical web deformation [mm]
0
100
200
300
400
500
600
700
800
900
Forc
e [k
N]
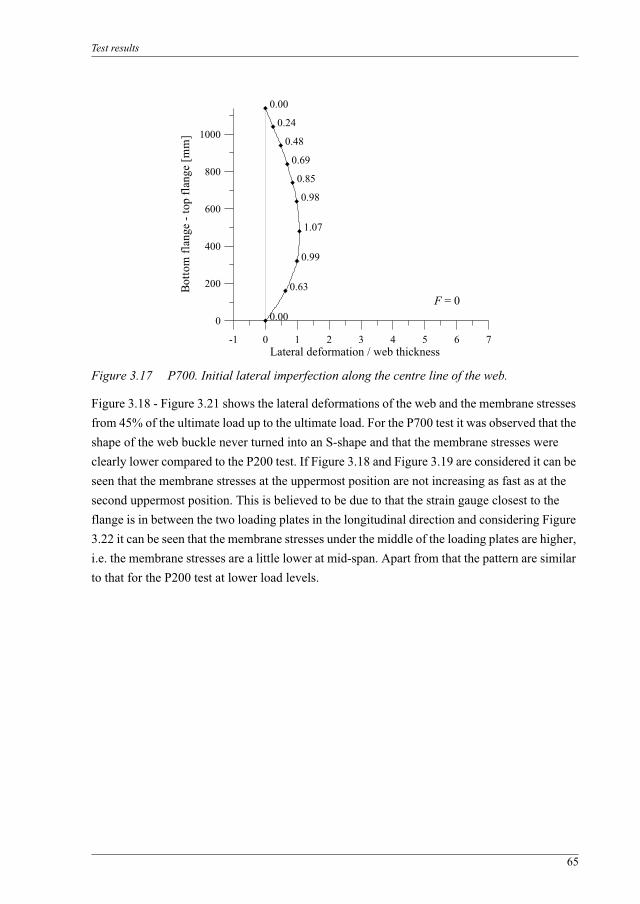
Test results
65
Figure 3.17 P700. Initial lateral imperfection along the centre line of the web.
Figure 3.18 - Figure 3.21 shows the lateral deformations of the web and the membrane stresses from 45% of the ultimate load up to the ultimate load. For the P700 test it was observed that the shape of the web buckle never turned into an S-shape and that the membrane stresses were clearly lower compared to the P200 test. If Figure 3.18 and Figure 3.19 are considered it can be seen that the membrane stresses at the uppermost position are not increasing as fast as at the second uppermost position. This is believed to be due to that the strain gauge closest to the flange is in between the two loading plates in the longitudinal direction and considering Figure 3.22 it can be seen that the membrane stresses under the middle of the loading plates are higher, i.e. the membrane stresses are a little lower at mid-span. Apart from that the pattern are similar to that for the P200 test at lower load levels.
-1 0 1 2 3 4 5 6 7Lateral deformation / web thickness
0
200
400
600
800
1000
Botto
m fl
ange
- to
p fla
nge
[mm
]
0.00
0.24
0.48
0.69
0.85
0.98
1.07
0.99
0.63
0.00F = 0
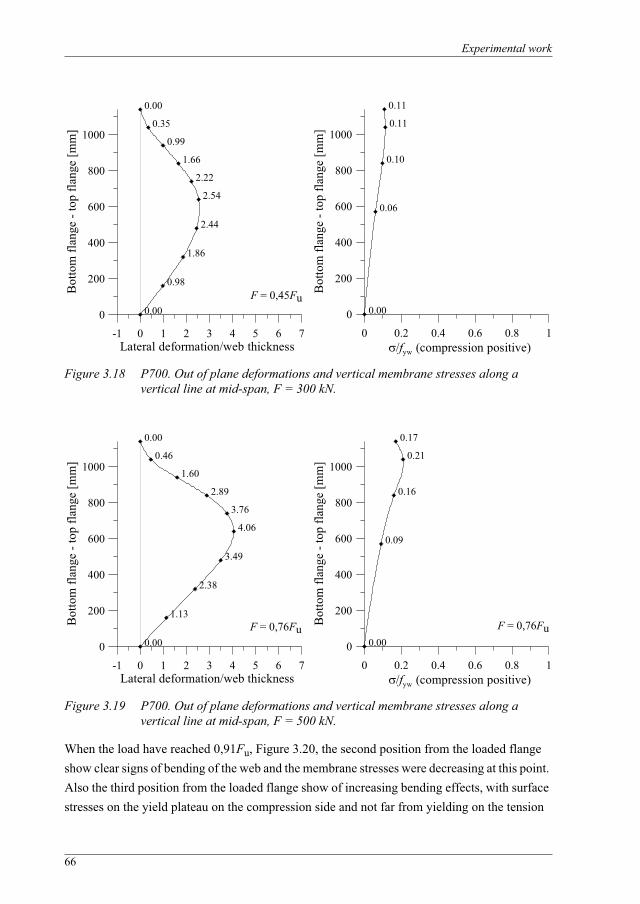
Experimental work
66
Figure 3.18 P700. Out of plane deformations and vertical membrane stresses along a vertical line at mid-span, F = 300 kN.
Figure 3.19 P700. Out of plane deformations and vertical membrane stresses along a vertical line at mid-span, F = 500 kN.
When the load have reached 0,91Fu, Figure 3.20, the second position from the loaded flange show clear signs of bending of the web and the membrane stresses were decreasing at this point. Also the third position from the loaded flange show of increasing bending effects, with surface stresses on the yield plateau on the compression side and not far from yielding on the tension
-1 0 1 2 3 4 5 6 7Lateral deformation/web thickness
0
200
400
600
800
1000
Bot
tom
flan
ge -
top
flang
e [m
m]
0.00
0.35
0.99
1.66
2.22
2.54
2.44
1.86
0.98
0.00F = 0,45Fu
0 0.2 0.4 0.6 0.8 1/fyw (compression positive)
0
200
400
600
800
1000
Bot
tom
flan
ge -
top
flang
e [m
m]
0.11
0.11
0.10
0.06
0.00
-1 0 1 2 3 4 5 6 7Lateral deformation/web thickness
0
200
400
600
800
1000
Bot
tom
flan
ge -
top
flang
e [m
m]
0.00
0.46
1.60
2.89
3.76
4.06
3.49
2.38
1.13
0.00F = 0,76Fu
0 0.2 0.4 0.6 0.8 1/fyw (compression positive)
0
200
400
600
800
1000
Bot
tom
flan
ge -
top
flang
e [m
m]
0.17
0.21
0.16
0.09
0.00F = 0,76Fu
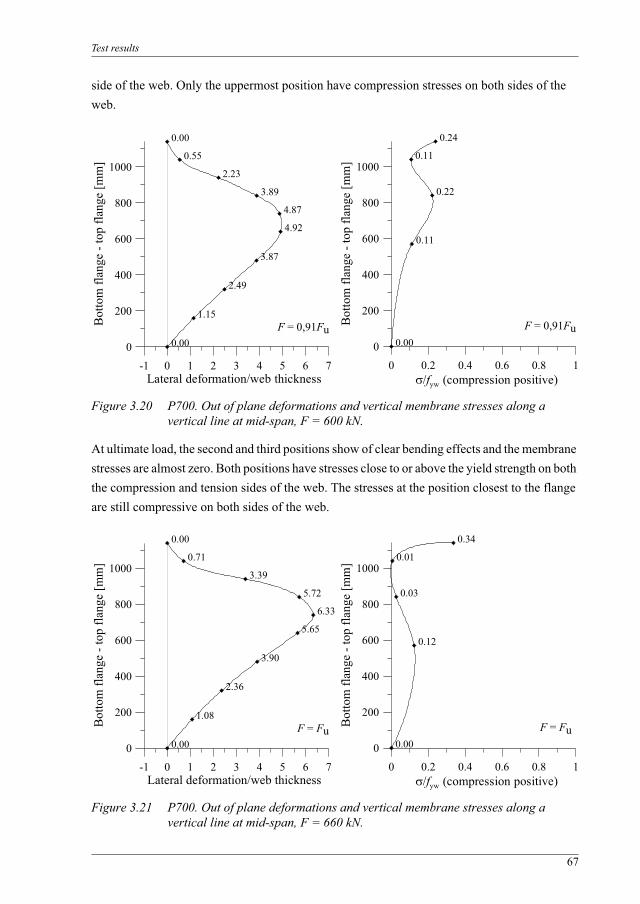
Test results
67
side of the web. Only the uppermost position have compression stresses on both sides of the web.
Figure 3.20 P700. Out of plane deformations and vertical membrane stresses along a vertical line at mid-span, F = 600 kN.
At ultimate load, the second and third positions show of clear bending effects and the membrane stresses are almost zero. Both positions have stresses close to or above the yield strength on both the compression and tension sides of the web. The stresses at the position closest to the flange are still compressive on both sides of the web.
Figure 3.21 P700. Out of plane deformations and vertical membrane stresses along a vertical line at mid-span, F = 660 kN.
-1 0 1 2 3 4 5 6 7Lateral deformation/web thickness
0
200
400
600
800
1000
Bot
tom
flan
ge -
top
flang
e [m
m]
0.00
0.55
2.23
3.89
4.87
4.92
3.87
2.49
1.15
0.00F = 0,91Fu
0 0.2 0.4 0.6 0.8 1/fyw (compression positive)
0
200
400
600
800
1000
Bot
tom
flan
ge -
top
flang
e [m
m]
0.24
0.11
0.22
0.11
0.00F = 0,91Fu
-1 0 1 2 3 4 5 6 7Lateral deformation/web thickness
0
200
400
600
800
1000
Bot
tom
flan
ge -
top
flang
e [m
m]
0.00
0.71
3.39
5.72
6.33
5.65
3.90
2.36
1.08
0.00F = Fu
0 0.2 0.4 0.6 0.8 1/fyw (compression positive)
0
200
400
600
800
1000
Bot
tom
flan
ge -
top
flang
e [m
m]
0.34
0.01
0.03
0.12
0.00F = Fu
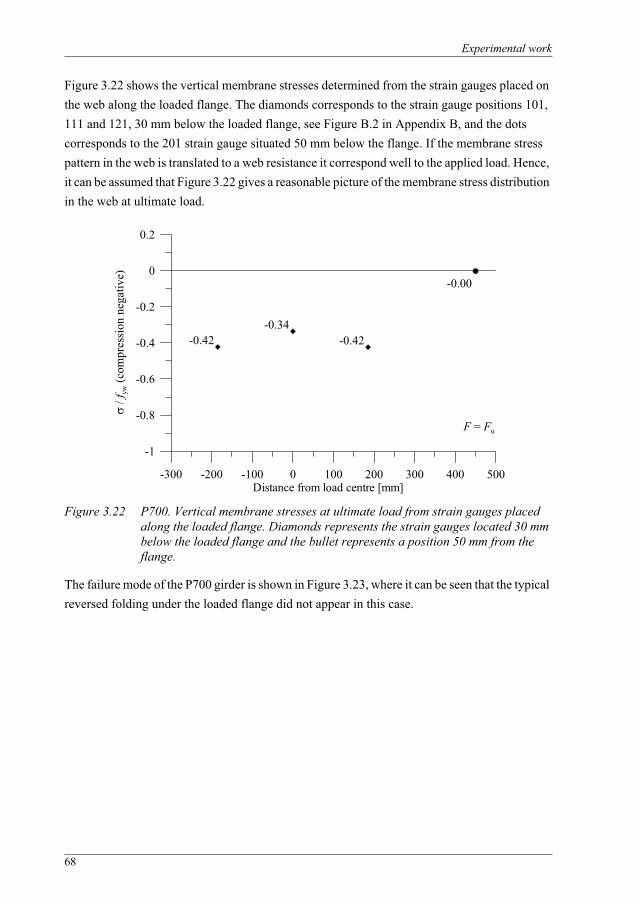
Experimental work
68
Figure 3.22 shows the vertical membrane stresses determined from the strain gauges placed on the web along the loaded flange. The diamonds corresponds to the strain gauge positions 101, 111 and 121, 30 mm below the loaded flange, see Figure B.2 in Appendix B, and the dots corresponds to the 201 strain gauge situated 50 mm below the flange. If the membrane stress pattern in the web is translated to a web resistance it correspond well to the applied load. Hence, it can be assumed that Figure 3.22 gives a reasonable picture of the membrane stress distribution in the web at ultimate load.
Figure 3.22 P700. Vertical membrane stresses at ultimate load from strain gauges placed along the loaded flange. Diamonds represents the strain gauges located 30 mm below the loaded flange and the bullet represents a position 50 mm from the flange.
The failure mode of the P700 girder is shown in Figure 3.23, where it can be seen that the typical reversed folding under the loaded flange did not appear in this case.
-300 -200 -100 0 100 200 300 400 500Distance from load centre [mm]
-1
-0.8
-0.6
-0.4
-0.2
0
0.2
/ f yw
(com
pres
sion
neg
ativ
e)
-0.42-0.34
-0.42
-0.00
F = Fu
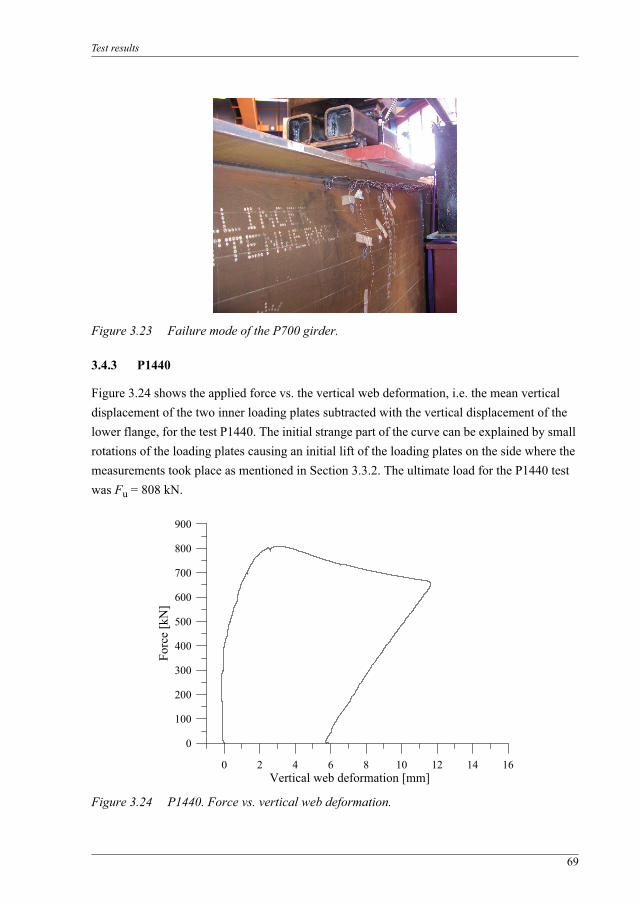
Test results
69
Figure 3.23 Failure mode of the P700 girder.
3.4.3 P1440
Figure 3.24 shows the applied force vs. the vertical web deformation, i.e. the mean vertical displacement of the two inner loading plates subtracted with the vertical displacement of the lower flange, for the test P1440. The initial strange part of the curve can be explained by small rotations of the loading plates causing an initial lift of the loading plates on the side where the measurements took place as mentioned in Section 3.3.2. The ultimate load for the P1440 test was Fu = 808 kN.
Figure 3.24 P1440. Force vs. vertical web deformation.
0 2 4 6 8 10 12 14 16Vertical web deformation [mm]
0
100
200
300
400
500
600
700
800
900
Forc
e [k
N]
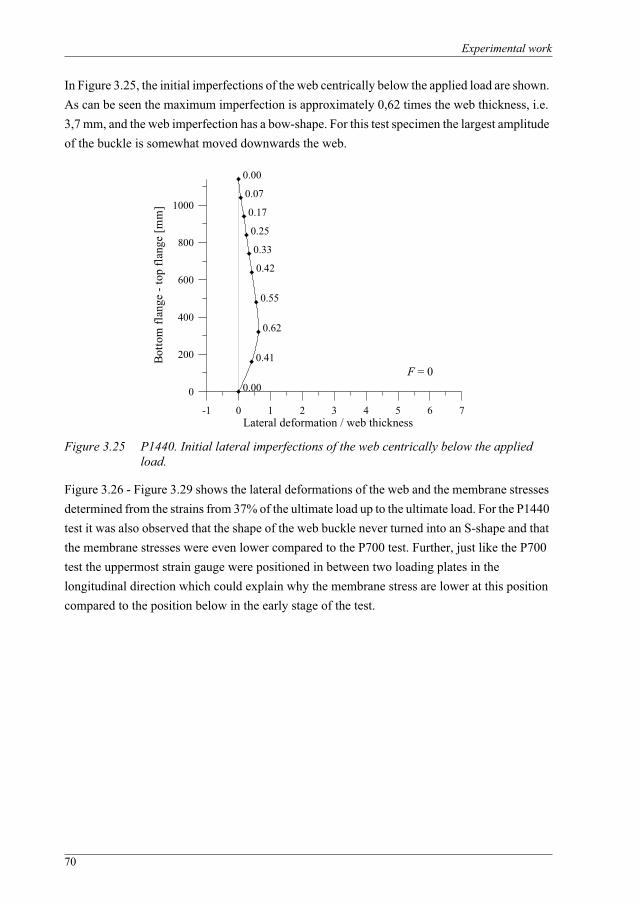
Experimental work
70
In Figure 3.25, the initial imperfections of the web centrically below the applied load are shown. As can be seen the maximum imperfection is approximately 0,62 times the web thickness, i.e. 3,7 mm, and the web imperfection has a bow-shape. For this test specimen the largest amplitude of the buckle is somewhat moved downwards the web.
Figure 3.25 P1440. Initial lateral imperfections of the web centrically below the applied load.
Figure 3.26 - Figure 3.29 shows the lateral deformations of the web and the membrane stresses determined from the strains from 37% of the ultimate load up to the ultimate load. For the P1440 test it was also observed that the shape of the web buckle never turned into an S-shape and that the membrane stresses were even lower compared to the P700 test. Further, just like the P700 test the uppermost strain gauge were positioned in between two loading plates in the longitudinal direction which could explain why the membrane stress are lower at this position compared to the position below in the early stage of the test.
-1 0 1 2 3 4 5 6 7Lateral deformation / web thickness
0
200
400
600
800
1000
Botto
m fl
ange
- to
p fla
nge
[mm
]0.00
0.07
0.17
0.25
0.33
0.42
0.55
0.62
0.41
0.00F = 0
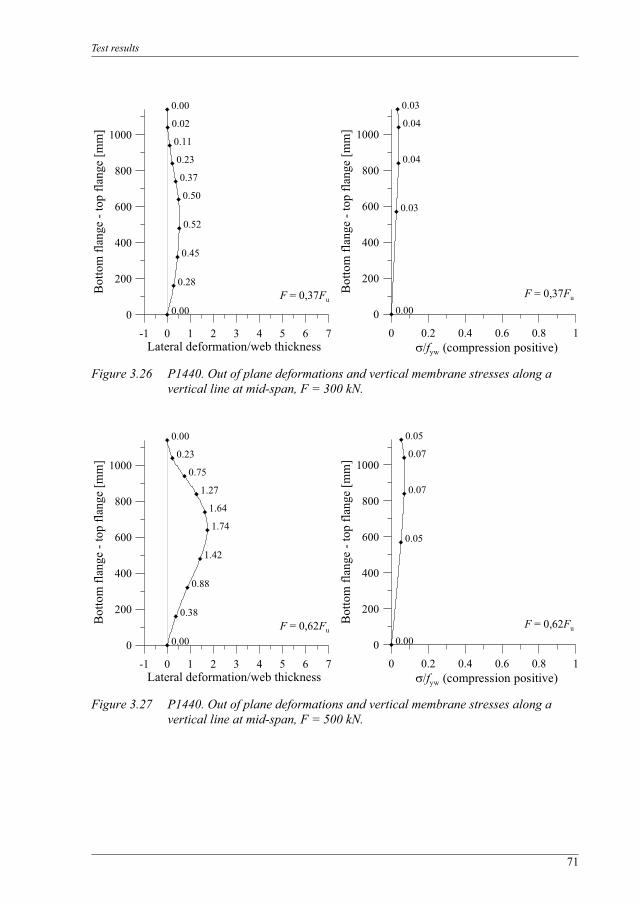
Test results
71
Figure 3.26 P1440. Out of plane deformations and vertical membrane stresses along a vertical line at mid-span, F = 300 kN.
Figure 3.27 P1440. Out of plane deformations and vertical membrane stresses along a vertical line at mid-span, F = 500 kN.
-1 0 1 2 3 4 5 6 7Lateral deformation/web thickness
0
200
400
600
800
1000
Bot
tom
flan
ge -
top
flang
e [m
m]
0.00
0.02
0.11
0.23
0.37
0.50
0.52
0.45
0.28
0.00F = 0,37Fu
0 0.2 0.4 0.6 0.8 1/fyw (compression positive)
0
200
400
600
800
1000
Bot
tom
flan
ge -
top
flang
e [m
m]
0.03
0.04
0.04
0.03
0.00F = 0,37Fu
-1 0 1 2 3 4 5 6 7Lateral deformation/web thickness
0
200
400
600
800
1000
Bot
tom
flan
ge -
top
flang
e [m
m]
0.00
0.23
0.75
1.27
1.64
1.74
1.42
0.88
0.38
0.00F = 0,62Fu
0 0.2 0.4 0.6 0.8 1/fyw (compression positive)
0
200
400
600
800
1000
Bot
tom
flan
ge -
top
flang
e [m
m]
0.05
0.07
0.07
0.05
0.00F = 0,62Fu
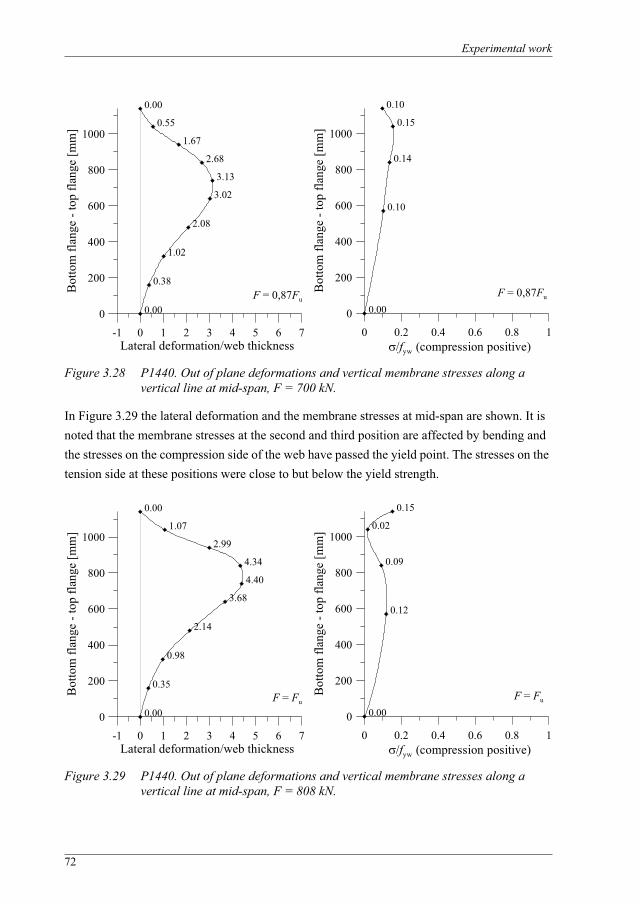
Experimental work
72
Figure 3.28 P1440. Out of plane deformations and vertical membrane stresses along a vertical line at mid-span, F = 700 kN.
In Figure 3.29 the lateral deformation and the membrane stresses at mid-span are shown. It is noted that the membrane stresses at the second and third position are affected by bending and the stresses on the compression side of the web have passed the yield point. The stresses on the tension side at these positions were close to but below the yield strength.
Figure 3.29 P1440. Out of plane deformations and vertical membrane stresses along a vertical line at mid-span, F = 808 kN.
-1 0 1 2 3 4 5 6 7Lateral deformation/web thickness
0
200
400
600
800
1000
Bot
tom
flan
ge -
top
flang
e [m
m]
0.00
0.55
1.67
2.68
3.13
3.02
2.08
1.02
0.38
0.00F = 0,87Fu
0 0.2 0.4 0.6 0.8 1/fyw (compression positive)
0
200
400
600
800
1000
Bot
tom
flan
ge -
top
flang
e [m
m]
0.10
0.15
0.14
0.10
0.00F = 0,87Fu
-1 0 1 2 3 4 5 6 7Lateral deformation/web thickness
0
200
400
600
800
1000
Bot
tom
flan
ge -
top
flang
e [m
m]
0.00
1.07
2.99
4.34
4.40
3.68
2.14
0.98
0.35
0.00F = Fu
0 0.2 0.4 0.6 0.8 1/fyw (compression positive)
0
200
400
600
800
1000
Bot
tom
flan
ge -
top
flang
e [m
m]
0.15
0.02
0.09
0.12
0.00F = Fu
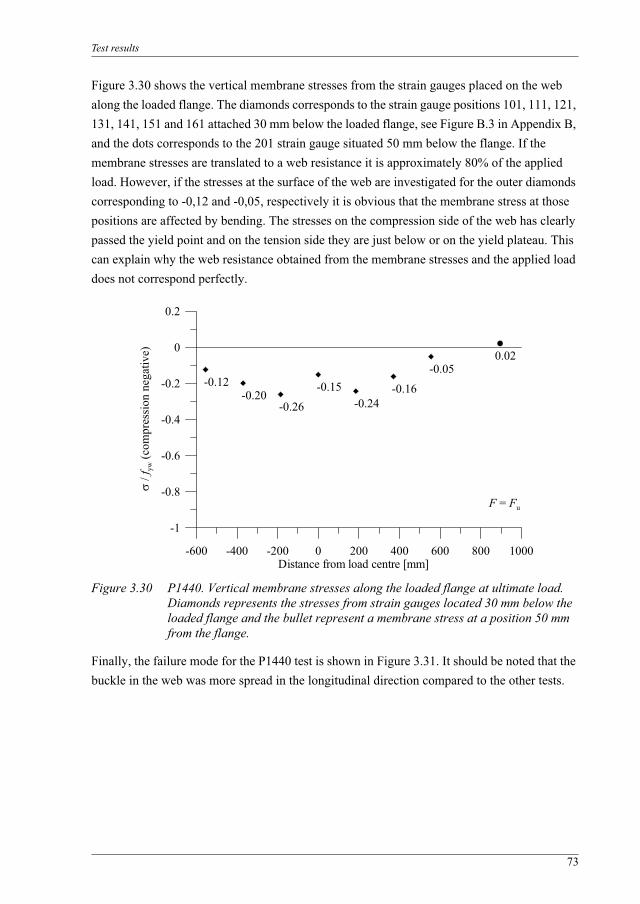
Test results
73
Figure 3.30 shows the vertical membrane stresses from the strain gauges placed on the web along the loaded flange. The diamonds corresponds to the strain gauge positions 101, 111, 121, 131, 141, 151 and 161 attached 30 mm below the loaded flange, see Figure B.3 in Appendix B, and the dots corresponds to the 201 strain gauge situated 50 mm below the flange. If the membrane stresses are translated to a web resistance it is approximately 80% of the applied load. However, if the stresses at the surface of the web are investigated for the outer diamonds corresponding to -0,12 and -0,05, respectively it is obvious that the membrane stress at those positions are affected by bending. The stresses on the compression side of the web has clearly passed the yield point and on the tension side they are just below or on the yield plateau. This can explain why the web resistance obtained from the membrane stresses and the applied load does not correspond perfectly.
Figure 3.30 P1440. Vertical membrane stresses along the loaded flange at ultimate load. Diamonds represents the stresses from strain gauges located 30 mm below the loaded flange and the bullet represent a membrane stress at a position 50 mm from the flange.
Finally, the failure mode for the P1440 test is shown in Figure 3.31. It should be noted that the buckle in the web was more spread in the longitudinal direction compared to the other tests.
-600 -400 -200 0 200 400 600 800 1000Distance from load centre [mm]
-1
-0.8
-0.6
-0.4
-0.2
0
0.2
/ f yw
(com
pres
sion
neg
ativ
e)
-0.12-0.20
-0.26
-0.15-0.24
-0.16
-0.050.02
F = Fu
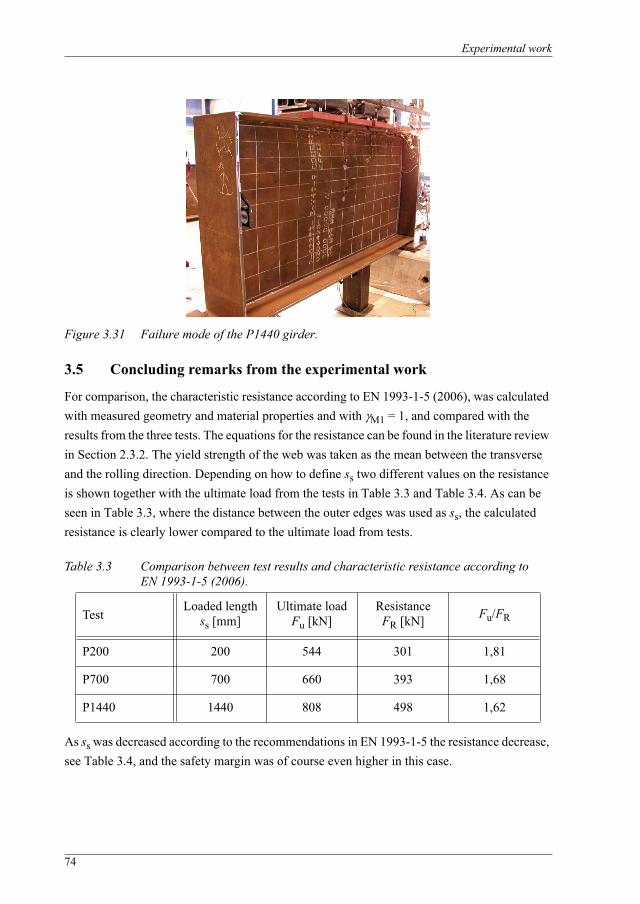
Experimental work
74
Figure 3.31 Failure mode of the P1440 girder.
3.5 Concluding remarks from the experimental work
For comparison, the characteristic resistance according to EN 1993-1-5 (2006), was calculated with measured geometry and material properties and with M1 = 1, and compared with the results from the three tests. The equations for the resistance can be found in the literature review in Section 2.3.2. The yield strength of the web was taken as the mean between the transverse and the rolling direction. Depending on how to define ss two different values on the resistance is shown together with the ultimate load from the tests in Table 3.3 and Table 3.4. As can be seen in Table 3.3, where the distance between the outer edges was used as ss, the calculated resistance is clearly lower compared to the ultimate load from tests.
Table 3.3 Comparison between test results and characteristic resistance according to EN 1993-1-5 (2006).
As ss was decreased according to the recommendations in EN 1993-1-5 the resistance decrease, see Table 3.4, and the safety margin was of course even higher in this case.
TestLoaded length
ss [mm]Ultimate load
Fu [kN]ResistanceFR [kN] Fu/FR
P200 200 544 301 1,81
P700 700 660 393 1,68
P1440 1440 808 498 1,62
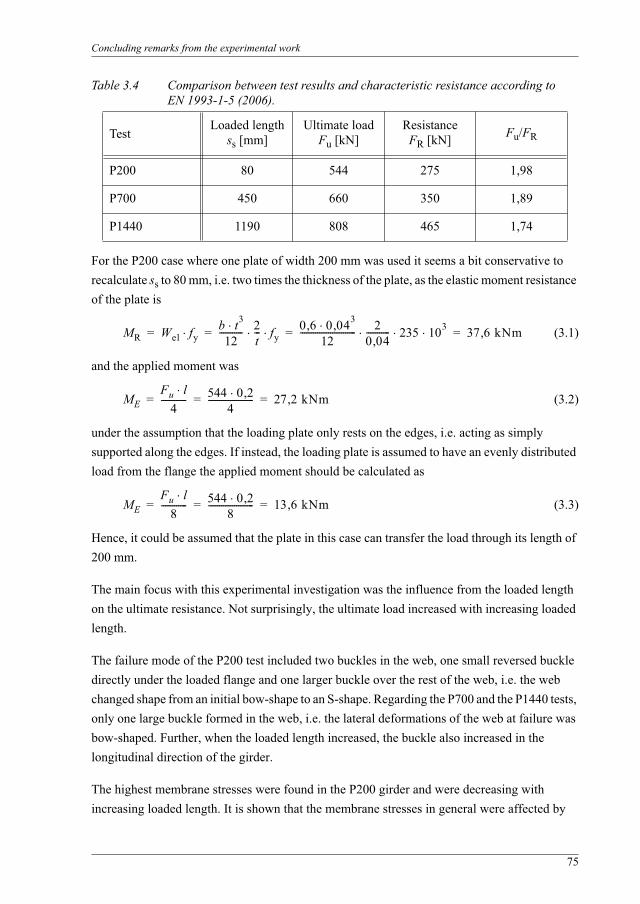
Concluding remarks from the experimental work
75
Table 3.4 Comparison between test results and characteristic resistance according to EN 1993-1-5 (2006).
For the P200 case where one plate of width 200 mm was used it seems a bit conservative to recalculate ss to 80 mm, i.e. two times the thickness of the plate, as the elastic moment resistance of the plate is
(3.1)
and the applied moment was
(3.2)
under the assumption that the loading plate only rests on the edges, i.e. acting as simply supported along the edges. If instead, the loading plate is assumed to have an evenly distributed load from the flange the applied moment should be calculated as
(3.3)
Hence, it could be assumed that the plate in this case can transfer the load through its length of 200 mm.
The main focus with this experimental investigation was the influence from the loaded length on the ultimate resistance. Not surprisingly, the ultimate load increased with increasing loaded length.
The failure mode of the P200 test included two buckles in the web, one small reversed buckle directly under the loaded flange and one larger buckle over the rest of the web, i.e. the web changed shape from an initial bow-shape to an S-shape. Regarding the P700 and the P1440 tests, only one large buckle formed in the web, i.e. the lateral deformations of the web at failure was bow-shaped. Further, when the loaded length increased, the buckle also increased in the longitudinal direction of the girder.
The highest membrane stresses were found in the P200 girder and were decreasing with increasing loaded length. It is shown that the membrane stresses in general were affected by
TestLoaded length
ss [mm]Ultimate load
Fu [kN]ResistanceFR [kN] Fu/FR
P200 80 544 275 1,98
P700 450 660 350 1,89
P1440 1190 808 465 1,74
MR Wel fyb t3
12----------- 2
t--- fy
0 6, 0 04, 3
12-------------------------- 2
0 04,----------- 235 103 37 6,= = = = kNm
MEFu l
4------------ 544 0 2,
4--------------------- 27 2,= = = kNm
MEFu l
8------------ 544 0 2,
8--------------------- 13 6,= = = kNm
Experimental work
76
bending of the web and at failure all tests had surface stresses above the yield strength a several positions.
According to the rules in EN 1993-1-5, an ss equal to hw is allowed and that is confirmed by the test results herein. However, it might be possible to allow an even higher ratio of ss/hw. This matter will be further discussed later in this thesis.
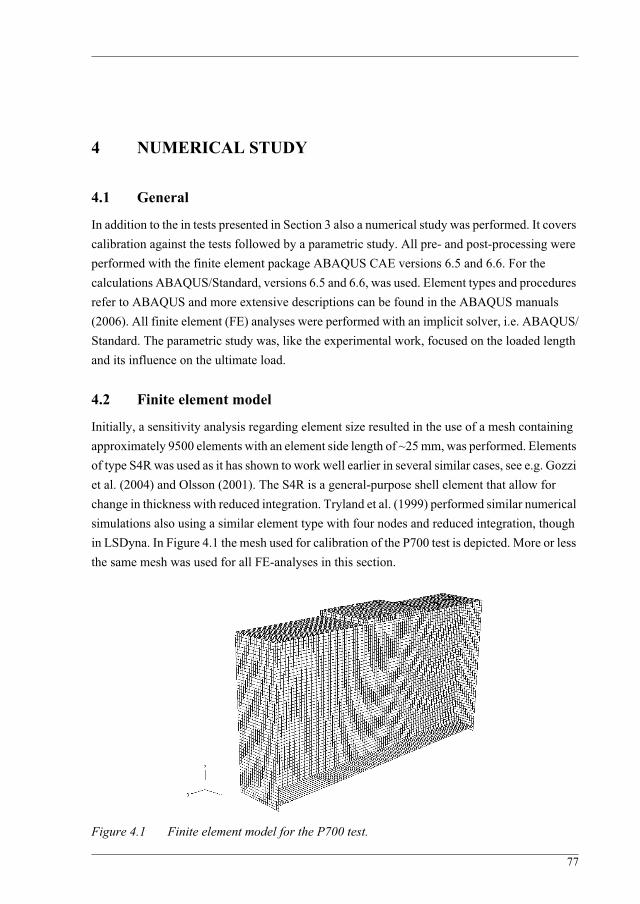
77
4 NUMERICAL STUDY
4.1 General
In addition to the in tests presented in Section 3 also a numerical study was performed. It covers calibration against the tests followed by a parametric study. All pre- and post-processing were performed with the finite element package ABAQUS CAE versions 6.5 and 6.6. For the calculations ABAQUS/Standard, versions 6.5 and 6.6, was used. Element types and procedures refer to ABAQUS and more extensive descriptions can be found in the ABAQUS manuals (2006). All finite element (FE) analyses were performed with an implicit solver, i.e. ABAQUS/Standard. The parametric study was, like the experimental work, focused on the loaded length and its influence on the ultimate load.
4.2 Finite element model
Initially, a sensitivity analysis regarding element size resulted in the use of a mesh containing approximately 9500 elements with an element side length of ~25 mm, was performed. Elements of type S4R was used as it has shown to work well earlier in several similar cases, see e.g. Gozzi et al. (2004) and Olsson (2001). The S4R is a general-purpose shell element that allow for change in thickness with reduced integration. Tryland et al. (1999) performed similar numerical simulations also using a similar element type with four nodes and reduced integration, though in LSDyna. In Figure 4.1 the mesh used for calibration of the P700 test is depicted. More or less the same mesh was used for all FE-analyses in this section.
Figure 4.1 Finite element model for the P700 test.
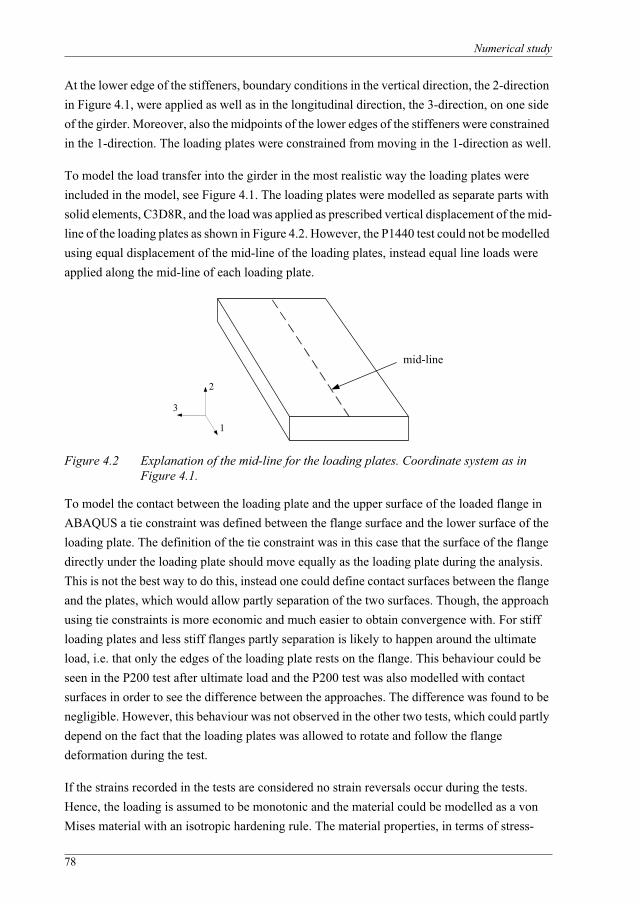
Numerical study
78
At the lower edge of the stiffeners, boundary conditions in the vertical direction, the 2-direction in Figure 4.1, were applied as well as in the longitudinal direction, the 3-direction, on one side of the girder. Moreover, also the midpoints of the lower edges of the stiffeners were constrained in the 1-direction. The loading plates were constrained from moving in the 1-direction as well.
To model the load transfer into the girder in the most realistic way the loading plates were included in the model, see Figure 4.1. The loading plates were modelled as separate parts with solid elements, C3D8R, and the load was applied as prescribed vertical displacement of the mid-line of the loading plates as shown in Figure 4.2. However, the P1440 test could not be modelled using equal displacement of the mid-line of the loading plates, instead equal line loads were applied along the mid-line of each loading plate.
Figure 4.2 Explanation of the mid-line for the loading plates. Coordinate system as in Figure 4.1.
To model the contact between the loading plate and the upper surface of the loaded flange in ABAQUS a tie constraint was defined between the flange surface and the lower surface of the loading plate. The definition of the tie constraint was in this case that the surface of the flange directly under the loading plate should move equally as the loading plate during the analysis. This is not the best way to do this, instead one could define contact surfaces between the flange and the plates, which would allow partly separation of the two surfaces. Though, the approach using tie constraints is more economic and much easier to obtain convergence with. For stiff loading plates and less stiff flanges partly separation is likely to happen around the ultimate load, i.e. that only the edges of the loading plate rests on the flange. This behaviour could be seen in the P200 test after ultimate load and the P200 test was also modelled with contact surfaces in order to see the difference between the approaches. The difference was found to be negligible. However, this behaviour was not observed in the other two tests, which could partly depend on the fact that the loading plates was allowed to rotate and follow the flange deformation during the test.
If the strains recorded in the tests are considered no strain reversals occur during the tests. Hence, the loading is assumed to be monotonic and the material could be modelled as a von Mises material with an isotropic hardening rule. The material properties, in terms of stress-
mid-line
2
3
1
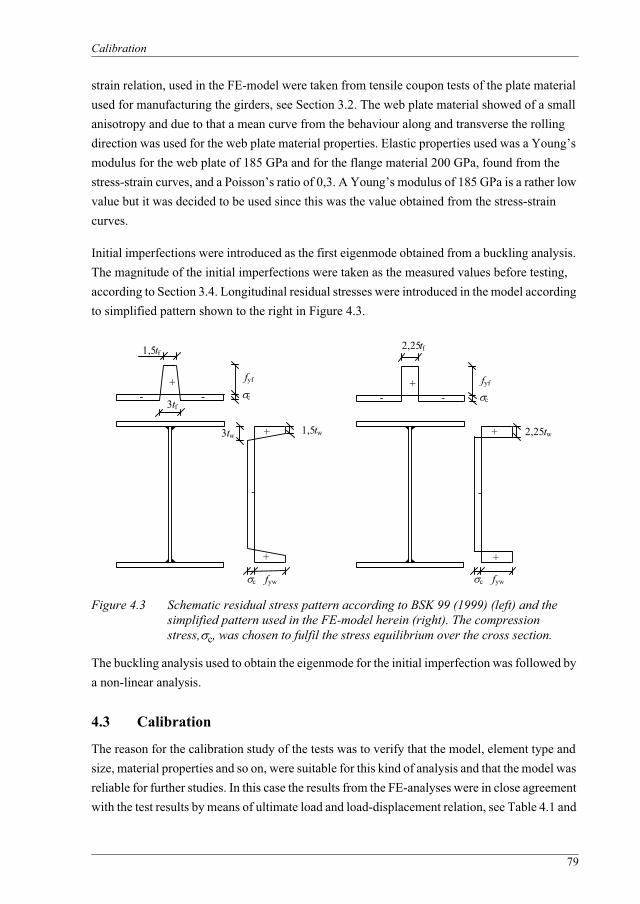
Calibration
79
strain relation, used in the FE-model were taken from tensile coupon tests of the plate material used for manufacturing the girders, see Section 3.2. The web plate material showed of a small anisotropy and due to that a mean curve from the behaviour along and transverse the rolling direction was used for the web plate material properties. Elastic properties used was a Young’s modulus for the web plate of 185 GPa and for the flange material 200 GPa, found from the stress-strain curves, and a Poisson’s ratio of 0,3. A Young’s modulus of 185 GPa is a rather low value but it was decided to be used since this was the value obtained from the stress-strain curves.
Initial imperfections were introduced as the first eigenmode obtained from a buckling analysis. The magnitude of the initial imperfections were taken as the measured values before testing, according to Section 3.4. Longitudinal residual stresses were introduced in the model according to simplified pattern shown to the right in Figure 4.3.
Figure 4.3 Schematic residual stress pattern according to BSK 99 (1999) (left) and the simplified pattern used in the FE-model herein (right). The compression stress, c, was chosen to fulfil the stress equilibrium over the cross section.
The buckling analysis used to obtain the eigenmode for the initial imperfection was followed by a non-linear analysis.
4.3 Calibration
The reason for the calibration study of the tests was to verify that the model, element type and size, material properties and so on, were suitable for this kind of analysis and that the model was reliable for further studies. In this case the results from the FE-analyses were in close agreement with the test results by means of ultimate load and load-displacement relation, see Table 4.1 and
3tf
fyf
c
+- -
1,5tf
-
+
+
1,5tw3tw
fyw c
-
+ 2,25tw
fywc
+
+- -
2,25tf
fyf
c
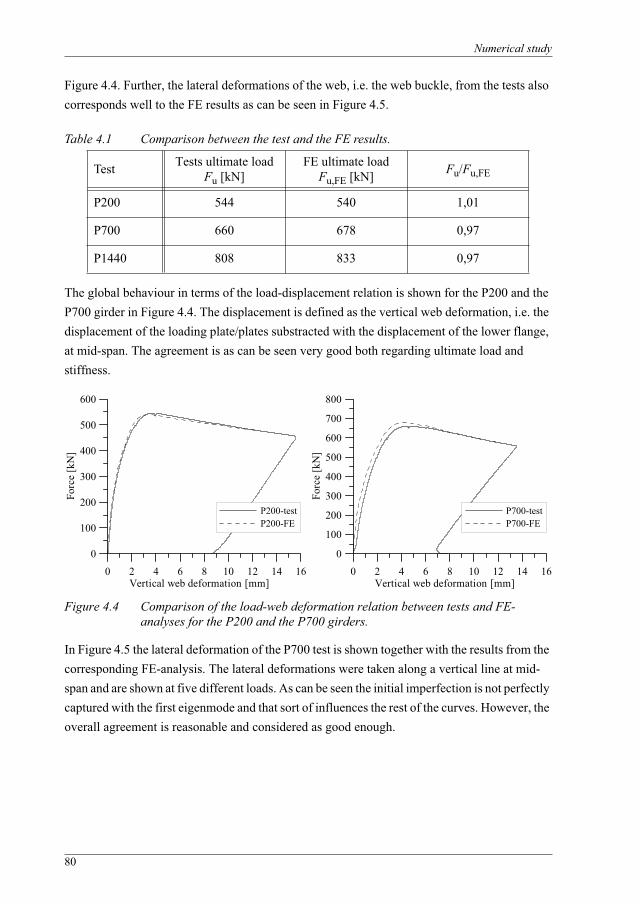
Numerical study
80
Figure 4.4. Further, the lateral deformations of the web, i.e. the web buckle, from the tests also corresponds well to the FE results as can be seen in Figure 4.5.
Table 4.1 Comparison between the test and the FE results.
The global behaviour in terms of the load-displacement relation is shown for the P200 and the P700 girder in Figure 4.4. The displacement is defined as the vertical web deformation, i.e. the displacement of the loading plate/plates substracted with the displacement of the lower flange, at mid-span. The agreement is as can be seen very good both regarding ultimate load and stiffness.
Figure 4.4 Comparison of the load-web deformation relation between tests and FE-analyses for the P200 and the P700 girders.
In Figure 4.5 the lateral deformation of the P700 test is shown together with the results from the corresponding FE-analysis. The lateral deformations were taken along a vertical line at mid-span and are shown at five different loads. As can be seen the initial imperfection is not perfectly captured with the first eigenmode and that sort of influences the rest of the curves. However, the overall agreement is reasonable and considered as good enough.
Test Tests ultimate loadFu [kN]
FE ultimate loadFu,FE [kN] Fu/Fu,FE
P200 544 540 1,01
P700 660 678 0,97
P1440 808 833 0,97
0 2 4 6 8 10 12 14 16Vertical web deformation [mm]
0
100
200
300
400
500
600
Forc
e [k
N]
P200-testP200-FE
0 2 4 6 8 10 12 14 16Vertical web deformation [mm]
0
100
200
300
400
500
600
700
800
Forc
e [k
N]
P700-testP700-FE
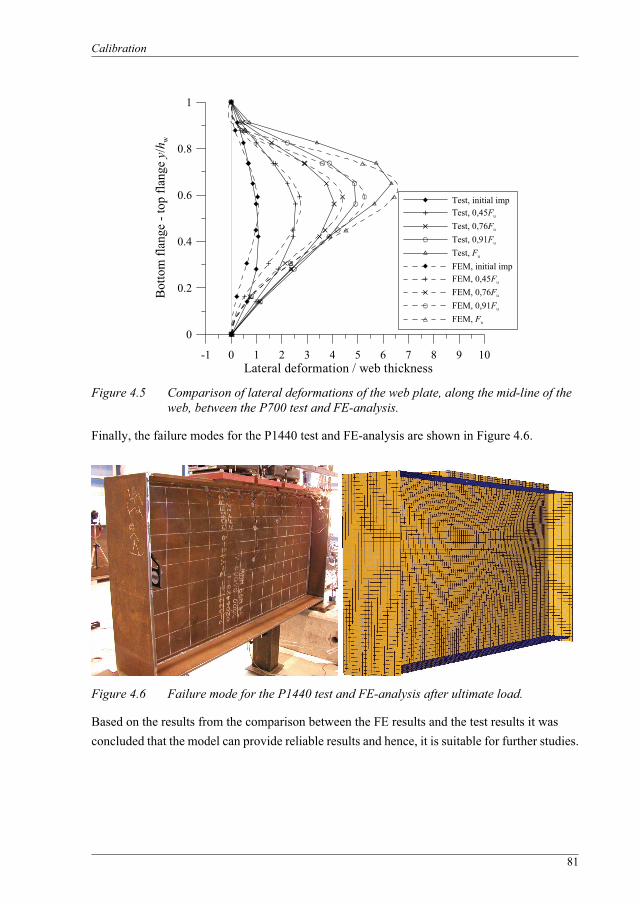
Calibration
81
Figure 4.5 Comparison of lateral deformations of the web plate, along the mid-line of the web, between the P700 test and FE-analysis.
Finally, the failure modes for the P1440 test and FE-analysis are shown in Figure 4.6.
Figure 4.6 Failure mode for the P1440 test and FE-analysis after ultimate load.
Based on the results from the comparison between the FE results and the test results it was concluded that the model can provide reliable results and hence, it is suitable for further studies.
-1 0 1 2 3 4 5 6 7 8 9 10Lateral deformation / web thickness
0
0.2
0.4
0.6
0.8
1
Bot
tom
flan
ge -
top
flang
e y/
h w
Test, initial impTest, 0,45Fu
Test, 0,76Fu
Test, 0,91Fu
Test, Fu
FEM, initial impFEM, 0,45Fu
FEM, 0,76Fu
FEM, 0,91Fu
FEM, Fu
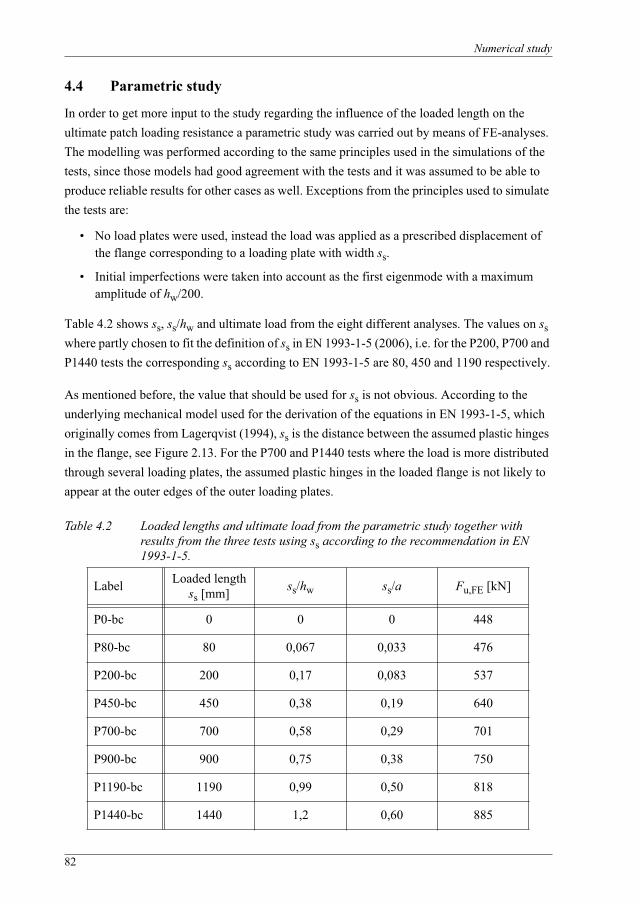
Numerical study
82
4.4 Parametric study
In order to get more input to the study regarding the influence of the loaded length on the ultimate patch loading resistance a parametric study was carried out by means of FE-analyses. The modelling was performed according to the same principles used in the simulations of the tests, since those models had good agreement with the tests and it was assumed to be able to produce reliable results for other cases as well. Exceptions from the principles used to simulate the tests are:
• No load plates were used, instead the load was applied as a prescribed displacement of the flange corresponding to a loading plate with width ss.
• Initial imperfections were taken into account as the first eigenmode with a maximum amplitude of hw/200.
Table 4.2 shows ss, ss/hw and ultimate load from the eight different analyses. The values on sswhere partly chosen to fit the definition of ss in EN 1993-1-5 (2006), i.e. for the P200, P700 and P1440 tests the corresponding ss according to EN 1993-1-5 are 80, 450 and 1190 respectively.
As mentioned before, the value that should be used for ss is not obvious. According to the underlying mechanical model used for the derivation of the equations in EN 1993-1-5, which originally comes from Lagerqvist (1994), ss is the distance between the assumed plastic hinges in the flange, see Figure 2.13. For the P700 and P1440 tests where the load is more distributed through several loading plates, the assumed plastic hinges in the loaded flange is not likely to appear at the outer edges of the outer loading plates.
Table 4.2 Loaded lengths and ultimate load from the parametric study together with results from the three tests using ss according to the recommendation in EN 1993-1-5.
Label Loaded lengthss [mm] ss/hw ss/a Fu,FE [kN]
P0-bc 0 0 0 448
P80-bc 80 0,067 0,033 476
P200-bc 200 0,17 0,083 537
P450-bc 450 0,38 0,19 640
P700-bc 700 0,58 0,29 701
P900-bc 900 0,75 0,38 750
P1190-bc 1190 0,99 0,50 818
P1440-bc 1440 1,2 0,60 885
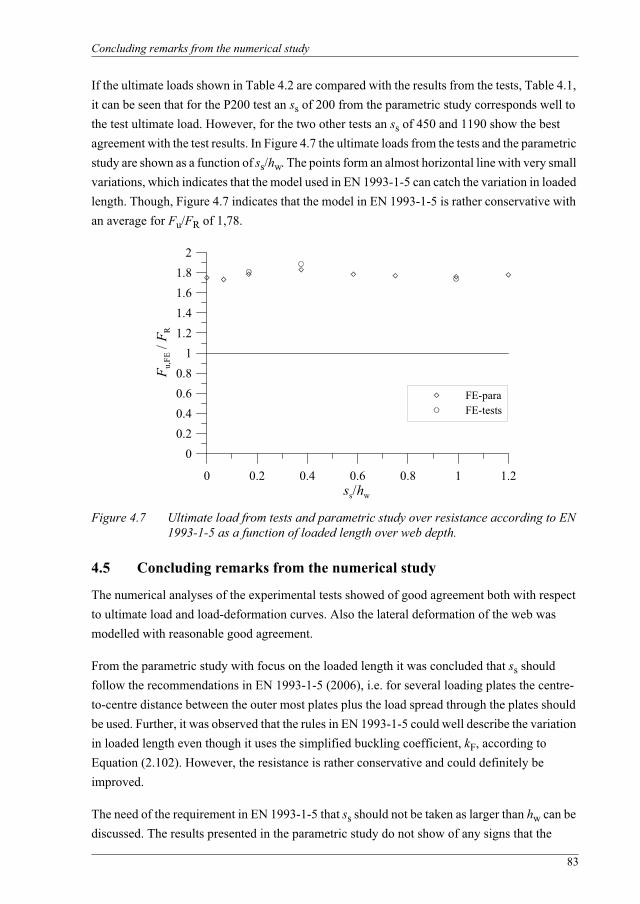
Concluding remarks from the numerical study
83
If the ultimate loads shown in Table 4.2 are compared with the results from the tests, Table 4.1, it can be seen that for the P200 test an ss of 200 from the parametric study corresponds well to the test ultimate load. However, for the two other tests an ss of 450 and 1190 show the best agreement with the test results. In Figure 4.7 the ultimate loads from the tests and the parametric study are shown as a function of ss/hw. The points form an almost horizontal line with very small variations, which indicates that the model used in EN 1993-1-5 can catch the variation in loaded length. Though, Figure 4.7 indicates that the model in EN 1993-1-5 is rather conservative with an average for Fu/FR of 1,78.
Figure 4.7 Ultimate load from tests and parametric study over resistance according to EN 1993-1-5 as a function of loaded length over web depth.
4.5 Concluding remarks from the numerical study
The numerical analyses of the experimental tests showed of good agreement both with respect to ultimate load and load-deformation curves. Also the lateral deformation of the web was modelled with reasonable good agreement.
From the parametric study with focus on the loaded length it was concluded that ss should follow the recommendations in EN 1993-1-5 (2006), i.e. for several loading plates the centre-to-centre distance between the outer most plates plus the load spread through the plates should be used. Further, it was observed that the rules in EN 1993-1-5 could well describe the variation in loaded length even though it uses the simplified buckling coefficient, kF, according to Equation (2.102). However, the resistance is rather conservative and could definitely be improved.
The need of the requirement in EN 1993-1-5 that ss should not be taken as larger than hw can be discussed. The results presented in the parametric study do not show of any signs that the
0 0.2 0.4 0.6 0.8 1 1.2ss/hw
00.20.40.60.8
11.21.41.61.8
2
F u,F
E / F
R
FE-paraFE-tests
Numerical study
84
resistance model for patch loading would not be applicable for longer ss. However, it could strongly be questioned if the design resistance for patch loading is the correct choice for ss>hw.It would be wrong to call a load with ss>hw for concentrated and further, neither the mechanism model used to derive the yield resistance nor the elastic buckling load was developed with such long loaded lengths.
85
5 PATCH LOADING RESISTANCE
5.1 General
Patch loading resistance of girders without stiffeners in the ultimate limit state is a well-studied subject as can be seen in the literature review in Section 2. There exists almost as many design models as researchers but from the author of this thesis point of view it is the model by Lagerqvist (1994), also in a slightly modified version implemented in EN 1993-1-5 (2006), that is of most interest. Hence, the model by Lagerqvist will serve as basis for the design model proposed herein. The advantages with the model by Lagerqvist are;
• that it is harmonized with the models for other buckling problems,
• that the model relies on a mechanical model,
• that all three different cases, i.e. patch loading, end patch loading and opposite patch loading, can be treated with the model and
• that the model show of good agreement with test results.
However, there is a disadvantage too, namely the by some questioned parameter m2 in the yield resistance that comes from the fictitious T-section at the outer plastic hinges, see Figure 2.13. Following the questions regarding the T-section a study of the yield resistance by means of numerical analyses was performed herein. The study on the yield resistance can be found in Section 5.2.
The yield resistance was modified due to the study mentioned above, which resulted in a new calibration of the reduction factor, see Section 5.3, against the test data base. Finally, the proposed design procedure was calibrated against test results according to the procedure in Annex D of EN 1990 (2002) and compared to other design models.
In this thesis, only patch loading will be considered, i.e. not end patch loading or opposite patch loading.
5.2 Yield resistance
The yield resistance is usually defined as an upper limit resistance that a member can carry if no instability is present. If the slenderness of the member is high it is susceptible to buckling and the yield resistance is reduced by a reduction factor to an actual resistance. Roberts and Rockey (1979) presented the first resistance function for direct yielding as shown in Figure 2.8. Furthermore, Roberts approach was to use the lower of the resistance to buckling and the
Patch loading resistance
86
resistance to direct yielding. Lagerqvist on the other hand, used a slightly modified version of the model by Roberts and Rockey but combined it with a reduction factor to handle possible buckling. The common feature of those two models is the use of a four-hinge mechanism model. Bergfelt (1979) and Ungermann (1990), Figure 2.10 and Figure 2.12, proposed models that were based on a three-hinge model, though Bergfelt mentioned that for longer loaded lengths the concentrated force at the middle hinge should be replaced by two point loads, representing the edges of the loading plate, on top of two plastic hinges instead.
In his tests, Lagerqvist observed indentations in the flange at the outer edges of the loading plate close to ultimate load. Further, during the tests Lagerqvist measured the displacement of the loaded flange at three positions; one under the middle of the load plate and one at each edge of the load plate. The difference between those displacements was very small and therefore one can assume that one hinge form at each side of the load plate. With this in mind, it was decided to use the four-hinge mechanism for the yield resistance.
The yield resistance for patch loading is not well defined because the contributing length from the web increases with deformation. In addition, strain hardening sets in at small deformations which complicates the definition further. The definition of the yield resistance will unavoidably include a subjective choice of a deformation limit. If strain hardening is neglected, the yield resistance given by the web can be approximated as a function of the web yield strength and the contributing web area according to
(5.1)
where ly is the length of the web that responds to the applied load. ly also corresponds to the distance between the two outer plastic hinges in the flange according to Figure 5.1.
Figure 5.1 Four-hinge mechanism model for the yield resistance for patch loading.
In the model by Roberts and Rockey (1979), only the flanges are assumed to contribute to the moment resistance in the plastic hinges and the yield resistance can be written as
Fy ly tw fyw=
Fy
Mi
MoMo
fyw tw
ly
Mi

Yield resistance
87
(5.2)
where the term within brackets is the length of the web, ly, responding to the applied load. This was in Roberts and Newark (1997) adjusted, to take into account the load spread through the flange, according to
(5.3)
In the proposal by Lagerqvist (1994) a part of the web was included in the moment resistance of the outer plastic hinges to increase the yield resistance with increasing web depth. This was included in the model because Lagerqvist observed that for increasing web slenderness the length of the deformed part of the flange increased. The proposal by Lagerqvist was to include 0,14hw in the T-section and this gives a yield resistance according to
(5.4)
in which comes from the web part of the T-section and this is also what is referred to as m2 in EN 1993-1-5 (2006).
Now, the parameter m2 has been questioned by e.g. Davaine et al. (2004) and therefore an investigation regarding its relevance was carried out. The investigation was conducted by means of FE-analyses with a model as shown in Figure 5.2. A total of 18 non-linear FE-analyses with material properties according to the stress-strain curves used in Section 4, i.e. S355 steel, were performed complemented by one analysis with material properties corresponding to a Weldox 700 (S690 QT) with nominal fy = 700 MPa. In order to avoid buckling of the web and make it possible to define the plastic resistance the web was constrained against lateral deformations.
The boundary conditions applied were; vertical restraints along the vertical ends of the web, a horizontal restraint in the neutral axis at the ends of the web allowing the web to rotate around this point and vertical restraints at the ends of the loaded flange, symbolizing the support from a vertical stiffener. The load was applied as a prescribed vertical displacement of the area under a fictitious loading plate, i.e. ss multiplied with bf.
The following parameters were varied in the investigation;
• flange thickness, tf,
Fy fyw tw ss 2 tffyf bffyw tw-----------------+=
Fy fyw tw ss 2 tf 1fyf bffyw tw-----------------++=
Fy fyw tw ss 2 tf 1fyf bffyw tw----------------- 0 02
hwtf
------2
,+++=
0 02 hw tf2,

Patch loading resistance
88
• flange width, bf,
• web thickness, tw,
• aspect ratio, a/hw, and
• loaded length, ss.
Figure 5.2 FE-model used in the numerical investigation of the yield resistance.
The results are shown as both a load-vertical web deformation curve and the vertical stress distribution in the web below the upper flange, along the dashed line in Figure 5.2. The latter are displayed at a stage when the girder was assumed to have reached the plastic stage, also indicated with a diamond in the load-deformation plot. The displacements used in the load-vertical web deformation curves were the displacement of the loaded flange under the load relative to the displacement of the lower flange at mid-span. For comparison the simplified stress distribution according to Lagerqvist (1994) and Roberts and Rockey (1997), i.e. according to EN 1993-1-5 (2006) with and without m2, are shown together with the numerical results. Further, the vertical stresses shown were normalized with fyw.
The effective loaded length from the numerical analyses, ly,FE, was determined as the web that was in compression according to
(5.5)
where l1 and l2 defines the area under the stress curve that was in compression, i.e. between l1and l2 there are compression stresses in the web. The ly-values with and without m2 as well as ly,FE were normalized with ly,FE to simplify comparison, i.e.
a
ss
F0,04hw
x
hw
tf
tf
tw
F
bf
ly FEw
fyw-------
l1
l2
xd=
Yield resistance
89
(5.6)
(5.7)
(5.8)
with and
In Table 5.1 all different geometries used in this numerical study are displayed together with the normalized effective loaded lengths according to Equations (5.7) and (5.8).
Table 5.1 Geometry and effective loaded length for the different models used in the study.
Label hw[mm]
tw[mm]
tf[mm]
bf[mm]
a[mm]
ss[mm]
YR1a 1000 8 8 125 1000 200 1,72 0,95YR1b 1000 8 8 250 1000 200 1,71 1,02YR1c 1000 4 8 125 1000 200 1,68 1,00YR1d 1000 4 8 250 1000 200 1,62 1,06YR1e 992 4 16 125 1000 200 1,48 1,07YR1f 992 4 16 250 1000 200 1,35 1,08YR1g 976 4 32 250 1000 200 1,26 1,09YR1h 1000 2 8 250 1000 200 1,53 1,09YR1i 976 4 32 400 1000 200 1,16 1,09YR1j 992 4 16 250 1000 100 1,47 1,11YR1k 976 4 32 250 1000 100 1,23 1,11YR1f-W7 992 4 16 250 1000 200 1,44 1,14YR2a 1000 8 8 125 2000 200 1,69 0,93YR2b 1000 8 8 250 2000 200 1,72 1,05YR2c 1000 4 8 125 2000 200 1,55 0,94YR2d 1000 4 8 250 2000 200 1,59 1,04YR2e 992 4 16 125 2000 200 1,43 1,04YR2f 992 4 16 250 2000 200 1,33 1,06YR2g 976 4 32 250 2000 200 1,21 1,05
ly FE norm, ly FE, 1= =
ly m1 m2+ norm, ly m1 m2+,ss tf 1 m1 m2+++
ly FE---------------------------------------------------------= =
ly m1 norm, ly m1,ss tf 1 m1++
ly FE-------------------------------------------= =
m1fyf bffyw tw-----------------= m2 0 02
hwtf
------2
,=
ly m1 m2+, ly m1,

Patch loading resistance
90
It is obvious that ly including m2, second column from the right in Table 5.1, overestimates the actual length meanwhile ly without m2 show of good agreement with the results from the numerical study. Figure 5.3 shows how the vertical stress distribution in the web plate appears in the FE-analysis of YR1f when the girder is assumed to have reached the plastic state at the same increment as shown in Figure 5.4.
Figure 5.3 Vertical stress distribution in the web plate for girder YR1f.
The results considering YR1f are shown in Figure 5.4 and as can be seen the effective loaded length, ly, can be better estimated without m2. In the left part of Figure 5.4 the vertical stress distribution from FE represents the solid line and the stress distribution according to Equations (5.3) and (5.4) are represented by the dashed lines.
Figure 5.4 Load-web deformation curve (left) and vertical stress distribution in the web plate (right) for the FE-analysis YR1f. The right part of the figure was taken when the load -web deformation have reached the diamond in the left figure. The dashed lines in the right figure represents the assumed stress distribution according to Equations (5.3) and (5.4).
0 2 4 6 8 10 12Displacement [mm]
0
200
400
600
800
1000
1200
Load
[kN
]
0 0.2 0.4 0.6 0.8 1Distance, x, 0,5 centre
-1.4
-1.2
-1
-0.8
-0.6
-0.4
-0.2
0
0.2
w/f
yw
ly,FE,norm=1,0ly,m1+m2,norm=1,35ly,m1,norm=1,08
Yield resistance
91
The section YR1d is shown in Figure 5.5. Also for this case a clearly better prediction of the stress state is obtained by using a ly without m2. Further, as can be seen the load-web deformation curve has a more sudden change in inclination compared to the YR1f, which is explained by the thinner flanges used in the model YR1d.
Figure 5.5 Load-web deformation curve (left) and vertical stress distribution in the web plate (right) for the FE-analysis YR1d. The right part of the figure was taken when the load -web deformation have reached the diamond in the left figure. The dashed lines in the right figure represents the assumed stress distribution according to Equations (5.3) and (5.4).
As mentioned earlier, the yield resistance depends on the deformation limit. If the deformations are allowed to increase then subsequently the length of the participating web will increase. Nevertheless, very large deformations and stresses are needed to get an ly corresponding to lyincluding m2. Depending on the geometry of the section stresses in the vicinity of the ultimate tensile strength are needed. If the results in Table 5.1 are considered, the average values for
and are 1,48 and 1,05 respectively and the deviation from 1, according to Equation (5.9), are 0,48 and 0,067 respectively.
(5.9)
The same behaviour as shown in Figure 5.4 and Figure 5.5 was also found for the other 17 cases and hence, it was concluded that m2 should be removed from the expression for ly. This means that the yield resistance should be determined according to the model Roberts and Newark (1997) proposed for direct yielding, i.e. according to Equation (5.3) where the load spread through the flange is included. This is also supported by Davaine et al. (2004) who studied longitudinally stiffened bridge girders subjected to patch loading by means of a large number of FE-analyses. Davaine et al. could not find any justification for a participating part of the web at the outer plastic hinges and also proposed that m2 should be set to zero.
0 0.2 0.4 0.6 0.8 1Distance, x, 0,5 centre
-1.4
-1.2
-1
-0.8
-0.6
-0.4
-0.2
0
0.2
w/f
yw
ly,FE,norm=1,0ly,m1+m2,norm=1,62
ly,m1,norm=1,06
0 2 4 6 8 10Displacement [mm]
0
200
400
600
800
1000
Load
[kN
]
ly m1 m2+, ly m1,
xerror
ly 1–
19-----------------------=

Patch loading resistance
92
5.3 Proposed design procedure
As a consequence of the change in yield resistance in the previous section, compared to EN 1993-1-5, some other modifications in the design procedure have to be done. The basic equations for the design procedure are given here as basis for the work presented later in this section.
As shown in the previous section, the yield resistance should be determined as
(5.10)
from which the resistance is given by
(5.11)
where F is the reduction factor relating the slenderness to the resistance. This reduction factor had to be modified to fit the modified yield resistance. To determine the reduction factor, the slenderness, , is required
(5.12)
which involves the critical load,
(5.13)
The critical load can be determined in several ways, e.g. by means of hand calculations, numerical methods or purpose developed softwares. From the designers point of view, numerical methods are not suitable and therefore that will not be considered here but they are of course possible to use. In here focus will be on methods suited for hand calculations, such as proposed by Lagerqvist (1994). As a complement, the newly developed software EBPlate, by Galéa and Martin (2006) will be included in the investigation as well.
Lagerqvist (1994) used a buckling coefficient, kF, in Equation (5.13) according to
(5.14)
Fy fyw tw ss 2 tf 1fyf bffyw tw-----------------++=
FR F Fy=
F
FFyFcr-------=
Fcr kF
2 E12 1 2–------------------------------
tw3
hw------=
kF 5 3 1 9hwa
------2
0 4bf tf
3
hw tw3
----------------4,+,+,=
Proposed design procedure
93
when evaluating his resistance model. However, Lagerqvist suggested a simplified kF for design which is the same expression as the one implemented in EN 1993-1-5 (2006), i.e.
(5.15)
As shown by the parametric study in Section 4.4, the design model implemented in EN 1993-1-5, could catch the variation in loaded length in a good manner even though the simplified kFaccording to Equation (5.15) was used. The difference between Equation (5.14) and Equation (5.15) is very small but both equations will be evaluated here.
The reduction factor, F, must be modified and it was decided herein to not use the reduction factor by Lagerqvist as basis. Instead, the proposal, originally by Müller (2003) and later included in Annex B of EN 1993-1-5, with a little bit more flexibility is used, see Equations (2.12) and (2.13).
Equations (2.12) and (2.13) are rewritten with the subscripts used for patch loading according to
(5.16)
and
(5.17)
in which F is an imperfection factor and is the plateau length. These two factors will be calibrated to fit the test results in the best possible way.
The test data that was used for this evaluation consists of 382 tests collected by Lagerqvist, nine tests performed by Lagerqvist, one test by Raoul et al. (1990), four tests by Shahabian and Roberts (2000), five tests by Unosson (2003) and one test by Kuhlmann and Seitz (2004), all displayed in Appendix C, and the three tests presented in this study. From the total of 405 tests some were excluded for different reasons, e.g. when the value of fyw was uncertain, when the definition of the ultimate load was unclear and so on. The following tests, with test label following the numbering in Appendix C, were excluded:
1 test: 2005 was excluded because hw was uncertain.
30 tests: 2012-2022 and 2116-2134 were excluded since they were performed on hot-rolled section which is not of interest here.
16 tests: 2151-2167 were excluded since fyw and fyf are uncertain.
kF 6 2hwa
------2
+=
F1
F F2
F–+-----------------------------------=
F12--- 1 F F F0– F++=
F0
Patch loading resistance
94
88 tests: 2200-2287 were expelled because it is the results from “the first or second loading cycle closely to ultimate load”, i.e. uncertainties in Fu.
6 tests: 2330-2332 and 2339-2341 were left out because it is questionable how the connection between the web and the flange was made with such a thin web.
1 test: 2366 was excluded because the load was applied through a wooden beam which makes it unclear how this influence the girder behaviour.
3 tests: 2381-2383 were left out since it was a study of interaction with shear which was not handled in this thesis.
5 tests: 2398-2402 were excluded because it was tests on girders made of stainless steel.
Now, 255 tests remains of which 186 have . The bending moment resistance, MR, was calculated according to EN 1993-1-1 (2005) or EN 1993-1-5 (2006) depending on cross section class. Those 186 tests were used to calibrate the reduction factor and Figure 5.6 shows the relation Fu/Fy as a function of . As expected Fu/Fy decrease with increasing . In Figure 5.6 the reduction factor proposed herein are shown for comparison with the test data. The best fit was obtained with
Further, it was decided herein to keep the simplified kF as this work is aiming at a procedure that should be used by designers and hence a simple format is desirable. Hence, the in Figure 5.6 was determined using kF from Equation (5.15). Though, statistics for both kF will be shown later in this section. Equation (5.16) is a continuous function that starts just below 1,5 ( = 0), as can be seen in Figure 5.6. However, after some discussions within the project ComBri (2007) it was proposed to cut the curve at 1,2 as shown by the dashed line in Figure 5.6, instead of 1,0 to still utilize more of the strength of the stocky girders. Nevertheless, the test results show that it might not be necessary to cut the curve at all. The reduction factor with F and as above becomes
(5.18)
with
(5.19)
ME MR 0 4,
F F
F 0 5,=
F0 0 6,=
F
F
F0
F1
F F2
F–+----------------------------------- 1 2,=
F12--- 1 0 5, F 0 6,– F++=
Proposed design procedure
95
The tests performed at Luleå University of Technology by Lagerqvist (1994) and by the author of this thesis are highlighted in Figure 5.6 and as can be seen those tests have a low variation compared to the total test data base. The explanation for this is not obvious but these tests are performed under similar conditions and all data concerning the tests are known, which is not always the case for tests collected from papers.
Figure 5.6 Fu/Fy as a function of for 186 tests with together with the proposed reduction factor, Equation (5.18), kF according to Equation (5.15).
Figure 5.7 shows the relation Fu/FR as a function of , where FR was calculated according to
(5.20)
with F according to Equation (5.18) and Fy according to Equation (5.10). As can be seen in Figure 5.7 the scatter is substantial, though considered as normal compared to other investigations in the field. The scatter can partly be explained by the fact that the model for prediction of the resistance is rather simple compared to the complexity of the problem. Further, it can also partly come from the fact that a large number of tests from many different laboratories are put together in one data base. This may end up in systematic differences, e.g. different methods for evaluating the yield strength. The advantage with a large amount of test data that normally is valuable can be turned to a disadvantage when the tests have been performed by many different research groups. It is reasonable to believe that some test results are more reliable than others, but since most of the information regarding the tests is hard to get and is seldom described in detail in the published papers, i.e. there might be information missing that could influence the calculated resistance, it is difficult to find ground for exclusions of individual tests. Examples of information given in papers that could be missing are; how was fy
0 1 2 3 4 5 6F
0
0.5
1
1.5
2
2.5
3
3.5
F u/F
y
Tests, LiteratureTests, Lagerqvist (1994)Tests, Author
F ME MR 0 4,
F
FR F Fy=
Patch loading resistance
96
defined, what was the stiffness of the loading plate used to introduce the concentrated force or whether the girder was used for more than one test, e.g. test on both flanges.
Figure 5.7 Fu/FR as a function of for 186 tests with .
The statistics for Fu/FR for the 186 tests with are shown in Table 5.2 for different ways of calculating Fcr. The difference between the different kF considered are very small, though a little less variation for the simplified kF. For the case when Fcr was determined through the software EBPlate the variation is slightly higher compared to the others but in this case only 119 of the tests could be used due to limitations in the software when it comes to hw and a/hw.However, the differences between the three methods are small.
Table 5.2 Comparison of statistics for Fu/FR between different methods of determining Fcrfor 186 tests and 119 tests for EBPlate.
The tests found in the literature contain a number of tests with very odd cross section dimensions. Lääne (2003) made a survey on composite bridges in Switzerland and found out
Fcr acc. to Eq. (5.13) and (5.15)
Fcr acc. to Eq. (5.13) and (5.14)
Fcr from EBPlate
Mean 1,50 1,45 1,49
Standard deviation 0,257 0,272 0,275
Coefficient of variation 0,172 0,188 0,185
Upper 5-percent fractile 1,93 1,91 1,94
Lower 5-percent fractile 1,07 1,00 1,03
0 1 2 3 4 5 6F
0
0.5
1
1.5
2
2.5
3F u
/FR
Tests, LiteratureTests, Author
F ME MR 0 4,
ME MR 0 4,
Proposed design procedure
97
that the bridge girder dimensions in general were within the limits 0,35 < Af/Atot < 0,45 and 0,30 < Aw/Atot < 0,40. If the most odd sections are removed from the test data base according to the limitations given by Lääne not many tests will be left. Instead, those limits were extended to 0,25 < Af/Atot < 0,55 and 0,20 < Aw/Atot < 0,50. Further, also the test girders with flanges outside the interval 10 < bf/tf < 30 were excluded as these are no realistic flanges for normal girders. With these limitations more realistic cross sections were obtained and now, only 60 tests remains and the statistics for these tests are shown in Table 5.3.
Table 5.3 Comparison of statistics for Fu/FR between different methods of determining Fcrfor 60 realistic cross sections and 37 tests for EBPlate.
The variation decrease significantly when only the tests with realistic cross sections are taken into account and the difference between the different methods are still small.
In Figure 5.8 Fu/FR as a function of ss/hw are shown for the 186 tests with small bending moments. In addition the FE-results from the parametric study regarding loaded length are shown as well. The results from the parametric study form an almost horizontal line in the figure, which indicates that the model can take care of the variation in loaded length in a good manner. Regarding the test results no other tendency can be found and again it is noted that the limitation in EN 1993-1-5 is not to high, in fact it seems like it could be increased. However, the three test results with have an ss equal to a, which probably influence the ultimate load.
Fcr acc. to Eq. (5.13) and (5.15)
Fcr acc. to Eq. (5.13) and (5.14)
Fcr from EBPlate
Mean 1,49 1,42 1,43
Standard deviation 0,188 0,189 0,219
Coefficient of variation 0,126 0,133 0,154
Upper 5-percent fractile 1,81 1,74 1,79
Lower 5-percent fractile 1,18 1,11 1,07
ss hwss hw
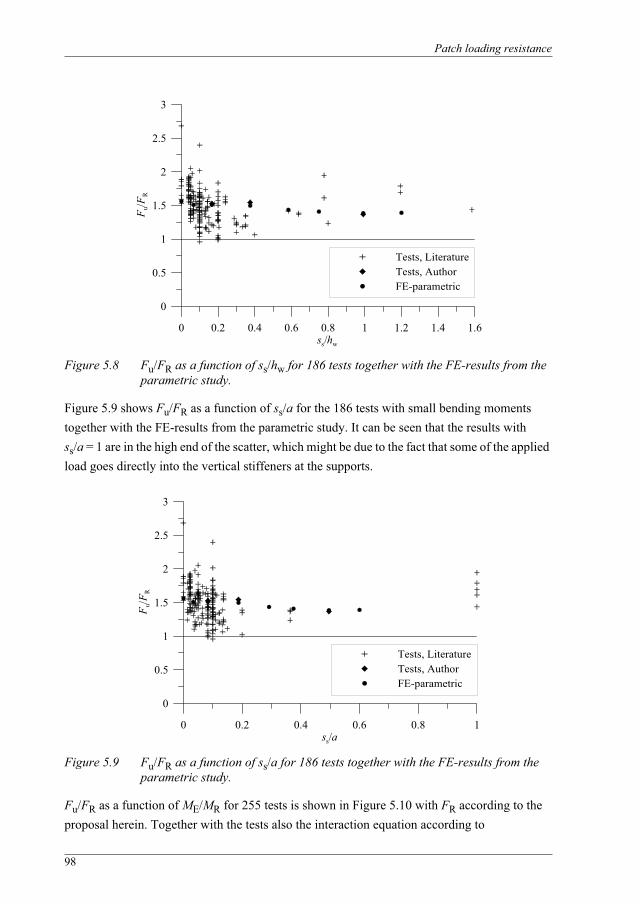
Patch loading resistance
98
Figure 5.8 Fu/FR as a function of ss/hw for 186 tests together with the FE-results from the parametric study.
Figure 5.9 shows Fu/FR as a function of ss/a for the 186 tests with small bending moments together with the FE-results from the parametric study. It can be seen that the results with ss/a = 1 are in the high end of the scatter, which might be due to the fact that some of the applied load goes directly into the vertical stiffeners at the supports.
Figure 5.9 Fu/FR as a function of ss/a for 186 tests together with the FE-results from the parametric study.
Fu/FR as a function of ME/MR for 255 tests is shown in Figure 5.10 with FR according to the proposal herein. Together with the tests also the interaction equation according to
0 0.2 0.4 0.6 0.8 1 1.2 1.4 1.6ss/hw
0
0.5
1
1.5
2
2.5
3
F u/F
R
Tests, LiteratureTests, AuthorFE-parametric
0 0.2 0.4 0.6 0.8 1ss/a
0
0.5
1
1.5
2
2.5
3
F u/F
R
Tests, LiteratureTests, AuthorFE-parametric
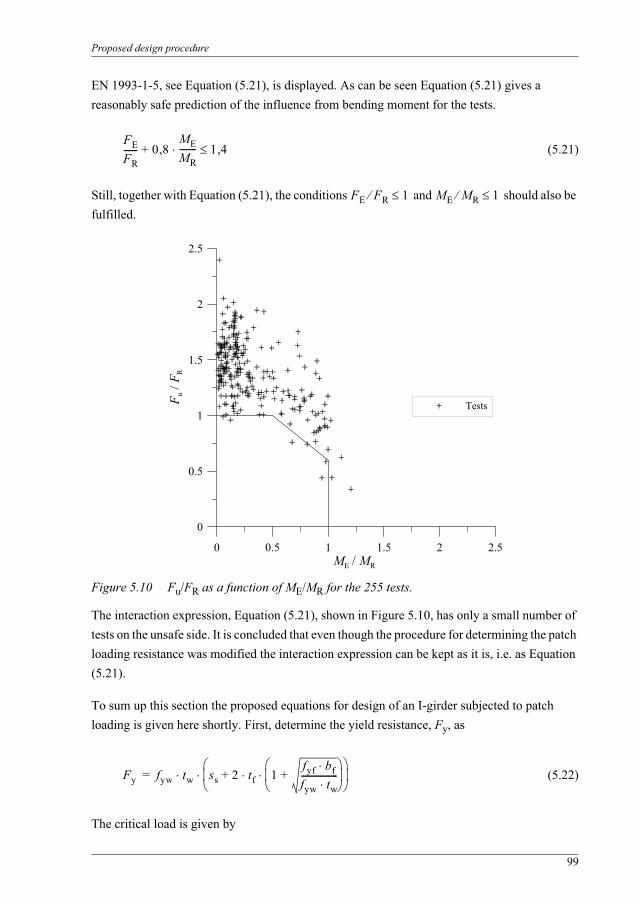
Proposed design procedure
99
EN 1993-1-5, see Equation (5.21), is displayed. As can be seen Equation (5.21) gives a reasonably safe prediction of the influence from bending moment for the tests.
(5.21)
Still, together with Equation (5.21), the conditions and should also be fulfilled.
Figure 5.10 Fu/FR as a function of ME/MR for the 255 tests.
The interaction expression, Equation (5.21), shown in Figure 5.10, has only a small number of tests on the unsafe side. It is concluded that even though the procedure for determining the patch loading resistance was modified the interaction expression can be kept as it is, i.e. as Equation (5.21).
To sum up this section the proposed equations for design of an I-girder subjected to patch loading is given here shortly. First, determine the yield resistance, Fy, as
(5.22)
The critical load is given by
FEFR------ 0 8
MEMR-------- 1 4,,+
FE FR 1 ME MR 1
0 0.5 1 1.5 2 2.5ME / MR
0
0.5
1
1.5
2
2.5
F u/F
R
Tests
Fy fyw tw ss 2 tf 1fyf bffyw tw-----------------++=
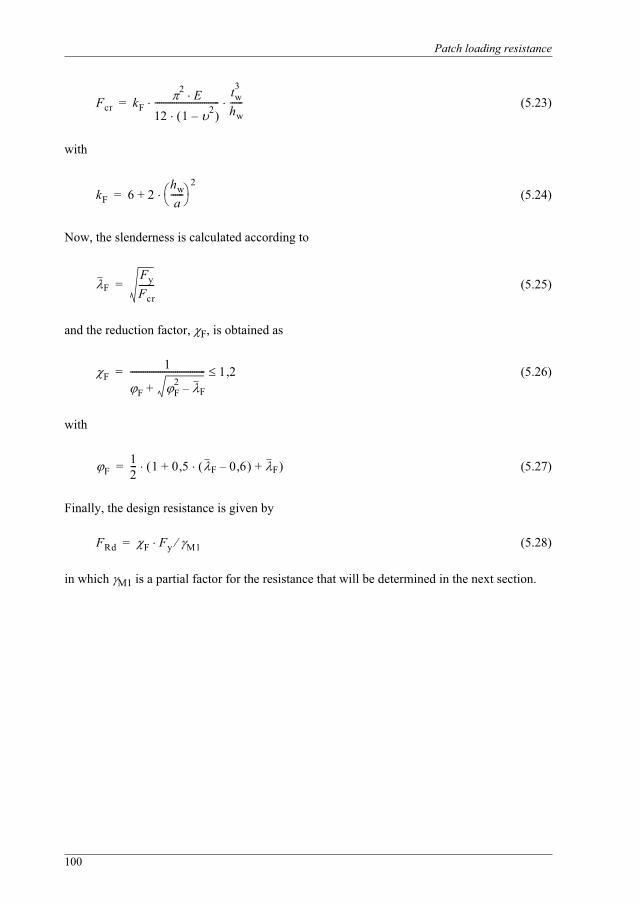
Patch loading resistance
100
(5.23)
with
(5.24)
Now, the slenderness is calculated according to
(5.25)
and the reduction factor, F, is obtained as
(5.26)
with
(5.27)
Finally, the design resistance is given by
(5.28)
in which M1 is a partial factor for the resistance that will be determined in the next section.
Fcr kF
2 E12 1 2–------------------------------
tw3
hw------=
kF 6 2hwa
------2
+=
FFyFcr-------=
F1
F F2
F–+----------------------------------- 1 2,=
F12--- 1 0 5, F 0 6,– F++=
FRd F Fy M1=
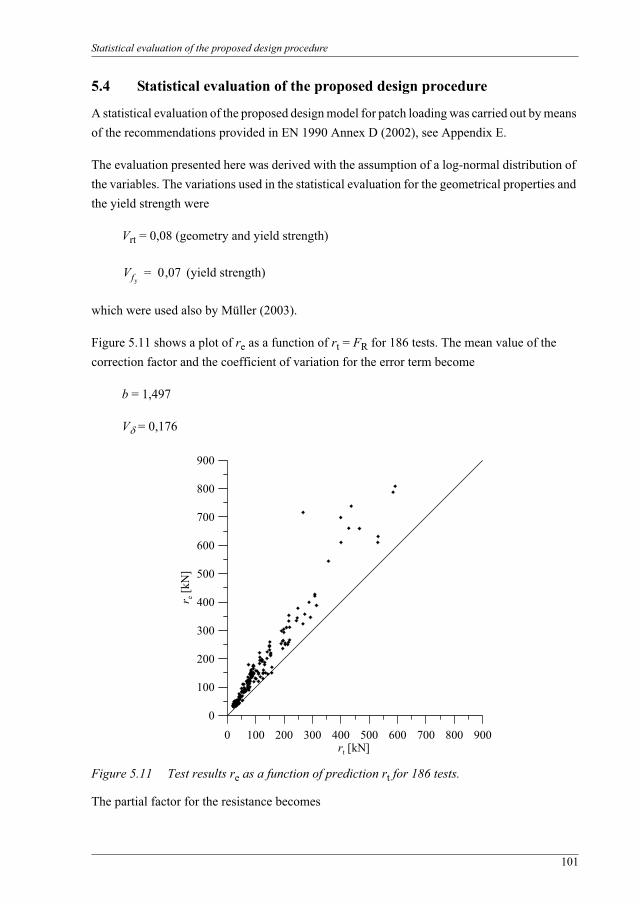
Statistical evaluation of the proposed design procedure
101
5.4 Statistical evaluation of the proposed design procedure
A statistical evaluation of the proposed design model for patch loading was carried out by means of the recommendations provided in EN 1990 Annex D (2002), see Appendix E.
The evaluation presented here was derived with the assumption of a log-normal distribution of the variables. The variations used in the statistical evaluation for the geometrical properties and the yield strength were
Vrt = 0,08 (geometry and yield strength)
(yield strength)
which were used also by Müller (2003).
Figure 5.11 shows a plot of re as a function of rt = FR for 186 tests. The mean value of the correction factor and the coefficient of variation for the error term become
b = 1,497
V = 0,176
Figure 5.11 Test results re as a function of prediction rt for 186 tests.
The partial factor for the resistance becomes
Vfy0 07,=
0 100 200 300 400 500 600 700 800 900rt [kN]
0
100
200
300
400
500
600
700
800
900
r e [kN
]
Patch loading resistance
102
and the corrected partial factor that should be applied to the resistance using nominal values of the basic variables is
However, it seems a bit unfair that this method for establishment of the partial factor for the resistance does not take into account if the variations are on the safe side or not. Instead all deviations are taken as random. If the most conservative test is taken out, with Fu/FR = 2,68,
that can be approximated to 1,0.
Further, as mentioned in Section 5.3 there are a lot of tests with very odd cross section dimensions. If only the 60 tests with realistic cross section dimensions are taken into account the results from the evaluation change dramatically according to
b = 1,493
V = 0,135
Based on the different calibrations it is proposed that M1 can be approximated to 1,0 which is the recommended value for buildings. Moreover, the recommended value of 1,1 for bridges is proposed to be lowered to 1,0 as well.
5.5 Comparison with other models
For comparison Fu/FR for the 186 tests with were determined according to EN 1993-1-5 (2006). Fu/FR as a function of are shown in Figure 5.12 and the statistics are shown in Table 5.4 together with the results from the proposed model. It is clear that the design procedure in EN 1993-1-5 is conservative but also the variation as seen in Table 5.4 is high compared to the proposed model. The reason for the increasing ratio Fu/FR with increasing slenderness, in Figure 5.12, is explained by the modified reduction factor compared to the one proposed by Lagerqvist (1994), Equation (5.29). Further, Lagerqvist did not have any restrictions regarding m2 for low values on the slenderness and no limitations regarding ly, i.e.
, as implemented in EN 1993-1-5.
The original proposal by Lagerqvist is also added in Table 5.4 for comparison. It is easily seen in Table 5.4 that the design procedure by Lagerqvist has the lowest mean and variation by far.
M 1 308,=
M 1 057,=
M 1 044,=
M 0 945,=
ME MR 0 4,
F
ly a
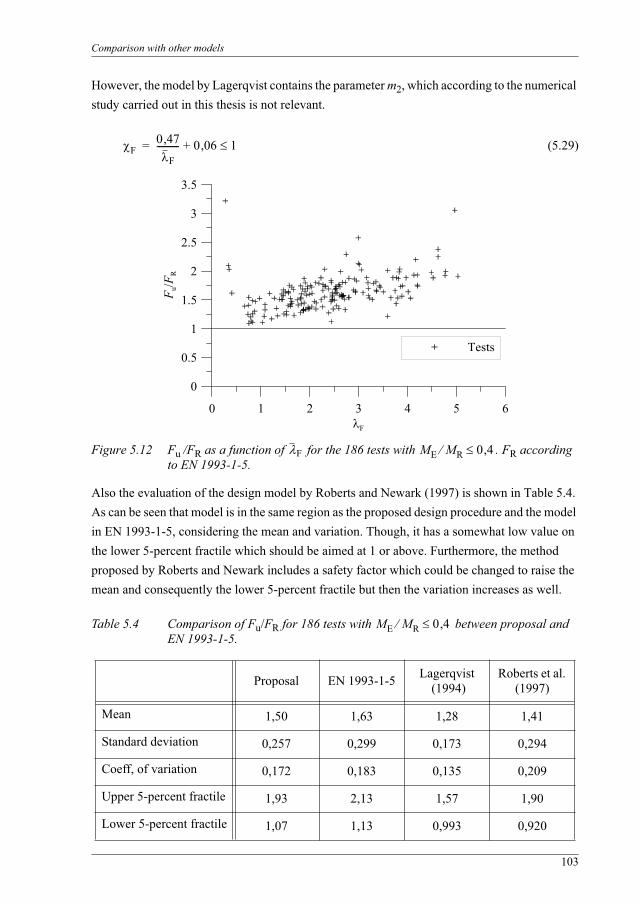
Comparison with other models
103
However, the model by Lagerqvist contains the parameter m2, which according to the numerical study carried out in this thesis is not relevant.
(5.29)
Figure 5.12 Fu /FR as a function of for the 186 tests with . FR according to EN 1993-1-5.
Also the evaluation of the design model by Roberts and Newark (1997) is shown in Table 5.4. As can be seen that model is in the same region as the proposed design procedure and the model in EN 1993-1-5, considering the mean and variation. Though, it has a somewhat low value on the lower 5-percent fractile which should be aimed at 1 or above. Furthermore, the method proposed by Roberts and Newark includes a safety factor which could be changed to raise the mean and consequently the lower 5-percent fractile but then the variation increases as well.
Table 5.4 Comparison of Fu/FR for 186 tests with between proposal and EN 1993-1-5.
Proposal EN 1993-1-5 Lagerqvist (1994)
Roberts et al. (1997)
Mean 1,50 1,63 1,28 1,41
Standard deviation 0,257 0,299 0,173 0,294
Coeff, of variation 0,172 0,183 0,135 0,209
Upper 5-percent fractile 1,93 2,13 1,57 1,90
Lower 5-percent fractile 1,07 1,13 0,993 0,920
F0 47,
F---------- 0 06 1,+=
0 1 2 3 4 5 6F
0
0.5
1
1.5
2
2.5
3
3.5F u
/FR
Tests
F ME MR 0 4,
ME MR 0 4,

Patch loading resistance
104
5.6 Concluding remarks
Considering the first part of the design procedure, the yield resistance, the numerical study performed herein shows that the assumption of a fictitious T-section at the outer plastic hinges, see Figure 2.13, proposed by Lagerqvist, is doubtful. If the web contribution, m2, is removed from the yield resistance the agreement with the numerical study is good and hence, the m2parameter is herein proposed to be removed.
The modification of the yield resistance resulted in a new calibration of the reduction factor, F.It was chosen to use the type of curve given in Annex B of EN 1993-1-5 for the new reduction factor, which comes from a proposal by Müller (2003). The idea from Müller was to introduce general reduction factors through the definition of the slenderness parameter, , from load multipliers used to define the plastic resistance and the critical load, respectively. If the different reduction factors for plate buckling are compared it turns out that patch loading clearly fall below the others. However, with the change in yield resistance proposed here, the reduction factor for patch loading will be lifted and then the reduction factors are more harmonized, although not completely. This is shown in Figure 5.13 where the proposed reduction factor are shown together with the reduction factor in EN 1993-1-5 for patch loading, plate buckling and shear buckling, respectively. The reduction factor for shear buckling shown, is the one for non-rigid end posts. The aim from Müller was to have one reduction factor for all plate buckling problems but that will not be appropriate from an economic point of view.
Figure 5.13 Comparison of different reduction factors.
The proposal is closer to the plate buckling curve, which on the other hand is a little too high. Clarin (2004) carried out a large number of stub column tests on square hollow sections made of high strength steel, with nominal fy from 420 - 1100 MPa. The results clearly showed that the plate buckling or Winter curve is too high for welded sections. Further, Clarin also put together
0 1 2 3 4 5 6F
0
0.5
1
1.5
F u/F
y
ProposalEN 1993-1-5 Patch loadingEN 1993-1-5 Plate bucklingEN 1993-1-5 Shear buckling
Concluding remarks
105
a large amount of similar tests with lower fy and found the same behaviour also for those. The only tests on welded specimens that fall above the Winter curve were stress relieved. Further, Veljkovic and Johansson (2001) performed FE-studies of plates with and without residual stresses and concluded that the Winter curve is more suitable for plates without significant residual stresses or for plates that are stress relieved.
The proposed design procedure gives less variation and lower mean compared to the existing procedure in EN 1993-1-5. However, the proposal by Lagerqvist (1994) still has the lowest mean and variation but the herein proposed procedure does describe the actual stress distribution in the web, when subjected to concentrated forces, more correctly. Further, there is still a substantial scatter in the results as can be seen in Figure 5.7.
The proposed design procedure had an average of m = 1,50, a standard deviation of s = 0,26 and a coefficient of variation of V = 0,17 when compared to 186 tests with small bending moment. This must be seen as normal when it comes to patch loading and the complexity of the problem. It was experienced here that the advantage of a large number of tests could be turned into a disadvantage when tests from several research groups are put together into one large data base as mentioned earlier. However, if only the tests performed at Luleå University of Technology are considered, i.e. the tests by Lagerqvist and the tests presented in this thesis, the variation decrease substantially. These tests are performed following the same principles and all data regarding the tests are known. For this group m = 1,39, s = 0,11 and V = 0,08 using the reduction factor calibrated against all 186 tests with small bending moments.
The expression for interaction between patch loading and bending moment according to EN 1993-1-5 (2006) was found applicable also for the herein proposed patch loading resistance. No further work considering the interaction between patch loading and shear was conducted in this work but Kuhlmann and Braun (2007) showed that their interaction equation, see Section 2.3.4, together with the proposed patch loading resistance fits well to the available test and numerical results.
Finally, the proposed design procedure was calibrated versus test results according to Annex D of EN 1990 (2002). From this statistical evaluation it is proposed that the partial safety factor,
M1, should be set to 1,0.

Patch loading resistance
106
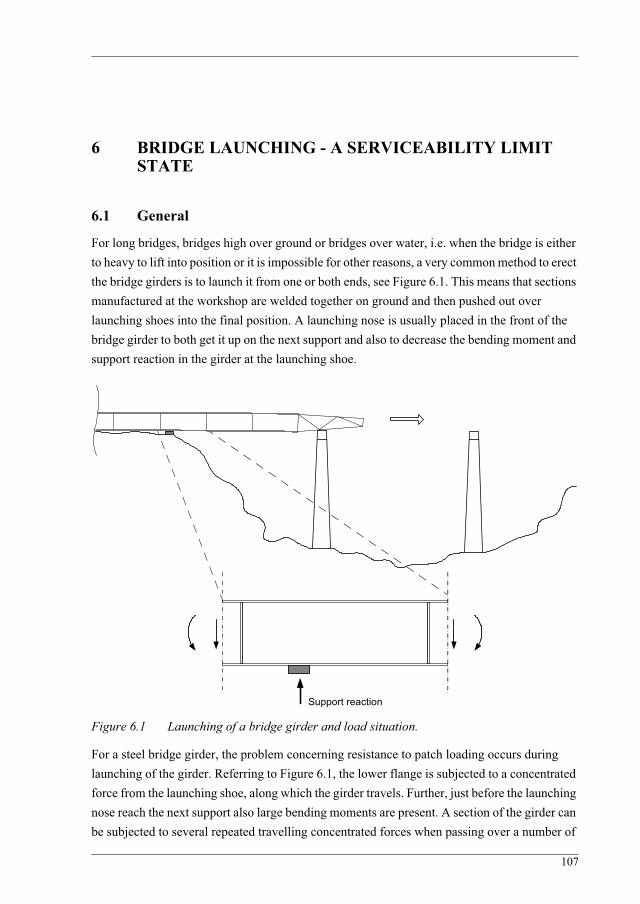
107
6 BRIDGE LAUNCHING - A SERVICEABILITY LIMIT STATE
6.1 General
For long bridges, bridges high over ground or bridges over water, i.e. when the bridge is either to heavy to lift into position or it is impossible for other reasons, a very common method to erect the bridge girders is to launch it from one or both ends, see Figure 6.1. This means that sections manufactured at the workshop are welded together on ground and then pushed out over launching shoes into the final position. A launching nose is usually placed in the front of the bridge girder to both get it up on the next support and also to decrease the bending moment and support reaction in the girder at the launching shoe.
Figure 6.1 Launching of a bridge girder and load situation.
For a steel bridge girder, the problem concerning resistance to patch loading occurs during launching of the girder. Referring to Figure 6.1, the lower flange is subjected to a concentrated force from the launching shoe, along which the girder travels. Further, just before the launching nose reach the next support also large bending moments are present. A section of the girder can be subjected to several repeated travelling concentrated forces when passing over a number of
Support reaction
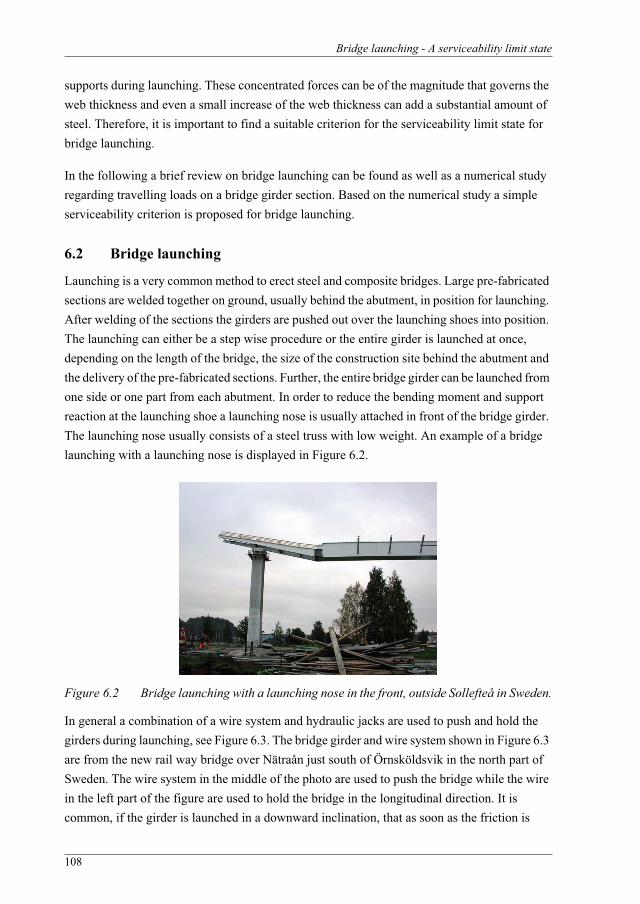
Bridge launching - A serviceability limit state
108
supports during launching. These concentrated forces can be of the magnitude that governs the web thickness and even a small increase of the web thickness can add a substantial amount of steel. Therefore, it is important to find a suitable criterion for the serviceability limit state for bridge launching.
In the following a brief review on bridge launching can be found as well as a numerical study regarding travelling loads on a bridge girder section. Based on the numerical study a simple serviceability criterion is proposed for bridge launching.
6.2 Bridge launching
Launching is a very common method to erect steel and composite bridges. Large pre-fabricated sections are welded together on ground, usually behind the abutment, in position for launching. After welding of the sections the girders are pushed out over the launching shoes into position. The launching can either be a step wise procedure or the entire girder is launched at once, depending on the length of the bridge, the size of the construction site behind the abutment and the delivery of the pre-fabricated sections. Further, the entire bridge girder can be launched from one side or one part from each abutment. In order to reduce the bending moment and support reaction at the launching shoe a launching nose is usually attached in front of the bridge girder. The launching nose usually consists of a steel truss with low weight. An example of a bridge launching with a launching nose is displayed in Figure 6.2.
Figure 6.2 Bridge launching with a launching nose in the front, outside Sollefteå in Sweden.
In general a combination of a wire system and hydraulic jacks are used to push and hold the girders during launching, see Figure 6.3. The bridge girder and wire system shown in Figure 6.3 are from the new rail way bridge over Nätraån just south of Örnsköldsvik in the north part of Sweden. The wire system in the middle of the photo are used to push the bridge while the wire in the left part of the figure are used to hold the bridge in the longitudinal direction. It is common, if the girder is launched in a downward inclination, that as soon as the friction is
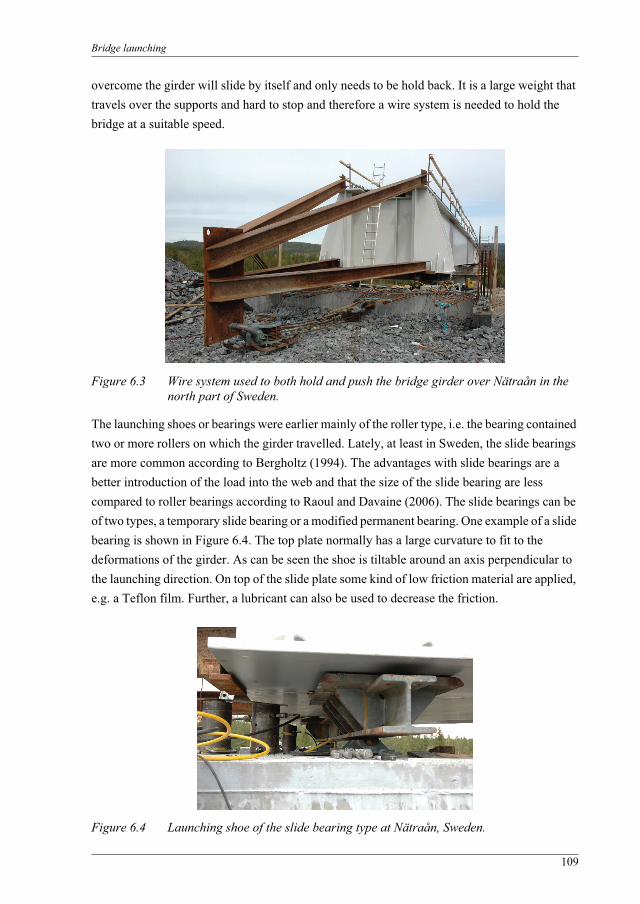
Bridge launching
109
overcome the girder will slide by itself and only needs to be hold back. It is a large weight that travels over the supports and hard to stop and therefore a wire system is needed to hold the bridge at a suitable speed.
Figure 6.3 Wire system used to both hold and push the bridge girder over Nätraån in the north part of Sweden.
The launching shoes or bearings were earlier mainly of the roller type, i.e. the bearing contained two or more rollers on which the girder travelled. Lately, at least in Sweden, the slide bearings are more common according to Bergholtz (1994). The advantages with slide bearings are a better introduction of the load into the web and that the size of the slide bearing are less compared to roller bearings according to Raoul and Davaine (2006). The slide bearings can be of two types, a temporary slide bearing or a modified permanent bearing. One example of a slide bearing is shown in Figure 6.4. The top plate normally has a large curvature to fit to the deformations of the girder. As can be seen the shoe is tiltable around an axis perpendicular to the launching direction. On top of the slide plate some kind of low friction material are applied, e.g. a Teflon film. Further, a lubricant can also be used to decrease the friction.
Figure 6.4 Launching shoe of the slide bearing type at Nätraån, Sweden.
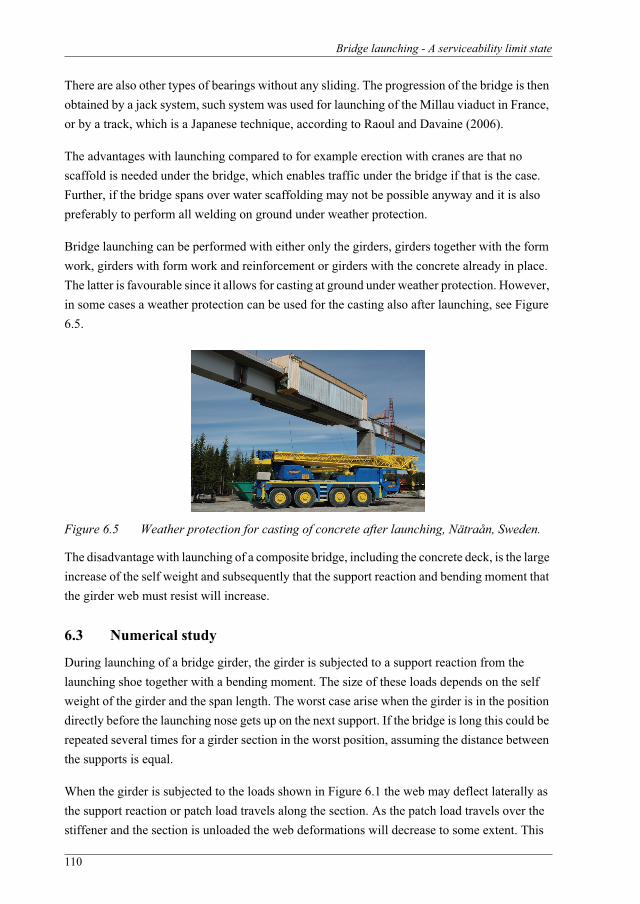
Bridge launching - A serviceability limit state
110
There are also other types of bearings without any sliding. The progression of the bridge is then obtained by a jack system, such system was used for launching of the Millau viaduct in France, or by a track, which is a Japanese technique, according to Raoul and Davaine (2006).
The advantages with launching compared to for example erection with cranes are that no scaffold is needed under the bridge, which enables traffic under the bridge if that is the case. Further, if the bridge spans over water scaffolding may not be possible anyway and it is also preferably to perform all welding on ground under weather protection.
Bridge launching can be performed with either only the girders, girders together with the form work, girders with form work and reinforcement or girders with the concrete already in place. The latter is favourable since it allows for casting at ground under weather protection. However, in some cases a weather protection can be used for the casting also after launching, see Figure 6.5.
Figure 6.5 Weather protection for casting of concrete after launching, Nätraån, Sweden.
The disadvantage with launching of a composite bridge, including the concrete deck, is the large increase of the self weight and subsequently that the support reaction and bending moment that the girder web must resist will increase.
6.3 Numerical study
During launching of a bridge girder, the girder is subjected to a support reaction from the launching shoe together with a bending moment. The size of these loads depends on the self weight of the girder and the span length. The worst case arise when the girder is in the position directly before the launching nose gets up on the next support. If the bridge is long this could be repeated several times for a girder section in the worst position, assuming the distance between the supports is equal.
When the girder is subjected to the loads shown in Figure 6.1 the web may deflect laterally as the support reaction or patch load travels along the section. As the patch load travels over the stiffener and the section is unloaded the web deformations will decrease to some extent. This
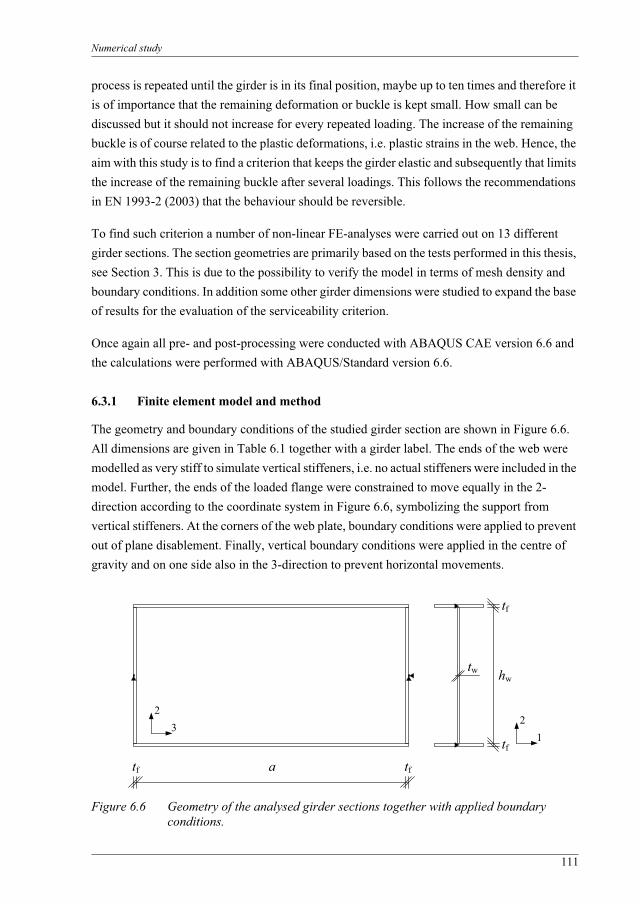
Numerical study
111
process is repeated until the girder is in its final position, maybe up to ten times and therefore it is of importance that the remaining deformation or buckle is kept small. How small can be discussed but it should not increase for every repeated loading. The increase of the remaining buckle is of course related to the plastic deformations, i.e. plastic strains in the web. Hence, the aim with this study is to find a criterion that keeps the girder elastic and subsequently that limits the increase of the remaining buckle after several loadings. This follows the recommendations in EN 1993-2 (2003) that the behaviour should be reversible.
To find such criterion a number of non-linear FE-analyses were carried out on 13 different girder sections. The section geometries are primarily based on the tests performed in this thesis, see Section 3. This is due to the possibility to verify the model in terms of mesh density and boundary conditions. In addition some other girder dimensions were studied to expand the base of results for the evaluation of the serviceability criterion.
Once again all pre- and post-processing were conducted with ABAQUS CAE version 6.6 and the calculations were performed with ABAQUS/Standard version 6.6.
6.3.1 Finite element model and method
The geometry and boundary conditions of the studied girder section are shown in Figure 6.6. All dimensions are given in Table 6.1 together with a girder label. The ends of the web were modelled as very stiff to simulate vertical stiffeners, i.e. no actual stiffeners were included in the model. Further, the ends of the loaded flange were constrained to move equally in the 2-direction according to the coordinate system in Figure 6.6, symbolizing the support from vertical stiffeners. At the corners of the web plate, boundary conditions were applied to prevent out of plane disablement. Finally, vertical boundary conditions were applied in the centre of gravity and on one side also in the 3-direction to prevent horizontal movements.
Figure 6.6 Geometry of the analysed girder sections together with applied boundary conditions.
hw
tf
tf
tw
32
tftf a
12
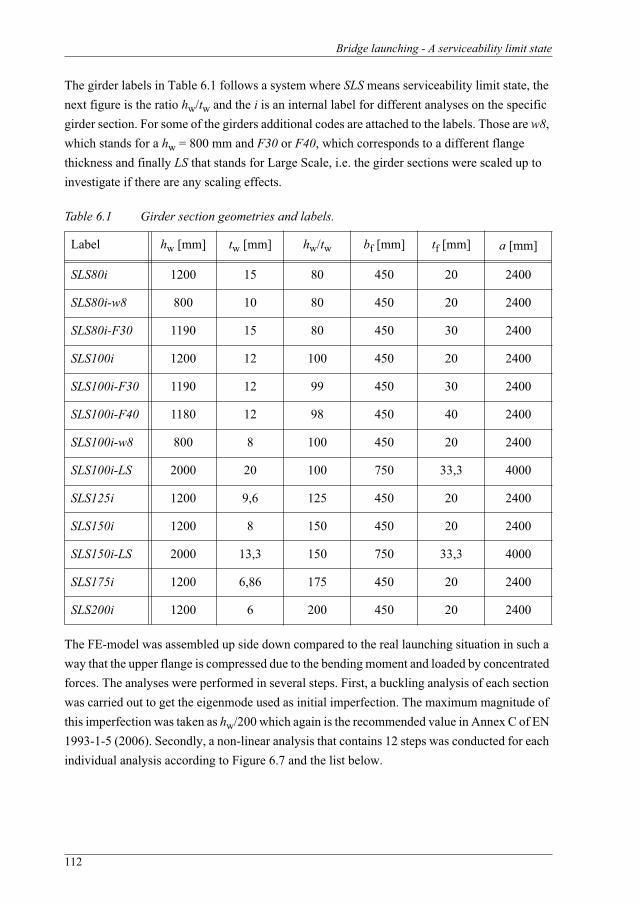
Bridge launching - A serviceability limit state
112
The girder labels in Table 6.1 follows a system where SLS means serviceability limit state, the next figure is the ratio hw/tw and the i is an internal label for different analyses on the specific girder section. For some of the girders additional codes are attached to the labels. Those are w8,which stands for a hw = 800 mm and F30 or F40, which corresponds to a different flange thickness and finally LS that stands for Large Scale, i.e. the girder sections were scaled up to investigate if there are any scaling effects.
Table 6.1 Girder section geometries and labels.
The FE-model was assembled up side down compared to the real launching situation in such a way that the upper flange is compressed due to the bending moment and loaded by concentrated forces. The analyses were performed in several steps. First, a buckling analysis of each section was carried out to get the eigenmode used as initial imperfection. The maximum magnitude of this imperfection was taken as hw/200 which again is the recommended value in Annex C of EN 1993-1-5 (2006). Secondly, a non-linear analysis that contains 12 steps was conducted for each individual analysis according to Figure 6.7 and the list below.
Label hw [mm] tw [mm] hw/tw bf [mm] tf [mm] a [mm]
SLS80i 1200 15 80 450 20 2400
SLS80i-w8 800 10 80 450 20 2400
SLS80i-F30 1190 15 80 450 30 2400
SLS100i 1200 12 100 450 20 2400
SLS100i-F30 1190 12 99 450 30 2400
SLS100i-F40 1180 12 98 450 40 2400
SLS100i-w8 800 8 100 450 20 2400
SLS100i-LS 2000 20 100 750 33,3 4000
SLS125i 1200 9,6 125 450 20 2400
SLS150i 1200 8 150 450 20 2400
SLS150i-LS 2000 13,3 150 750 33,3 4000
SLS175i 1200 6,86 175 450 20 2400
SLS200i 1200 6 200 450 20 2400
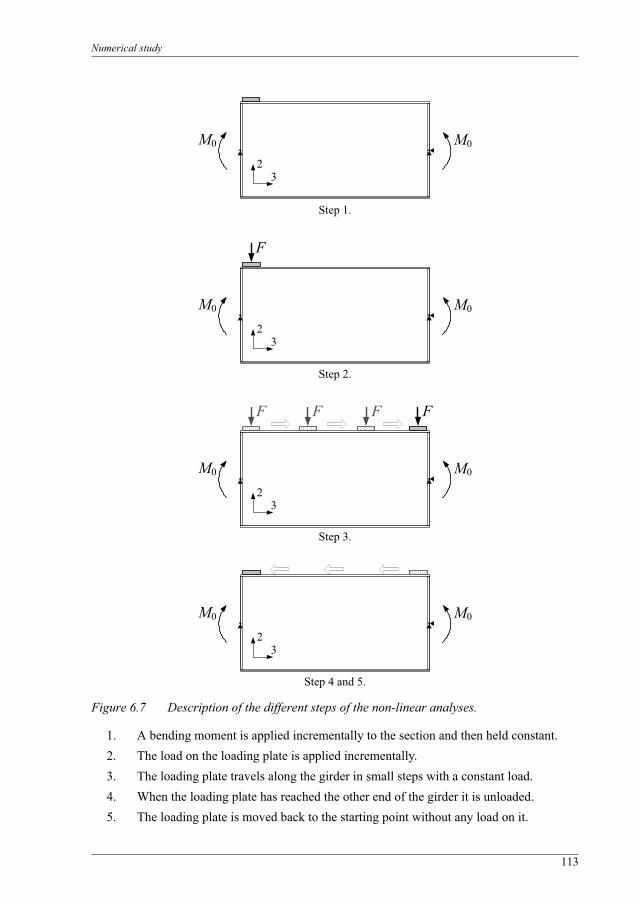
Numerical study
113
Figure 6.7 Description of the different steps of the non-linear analyses.
1. A bending moment is applied incrementally to the section and then held constant.2. The load on the loading plate is applied incrementally.3. The loading plate travels along the girder in small steps with a constant load.4. When the loading plate has reached the other end of the girder it is unloaded.5. The loading plate is moved back to the starting point without any load on it.
32
M0M0
32
M0M0
F
Step 4 and 5.
Step 3.
Step 2.
Step 1.
32
M0M0
F
32
M0M0
FF FF
32
M0M0
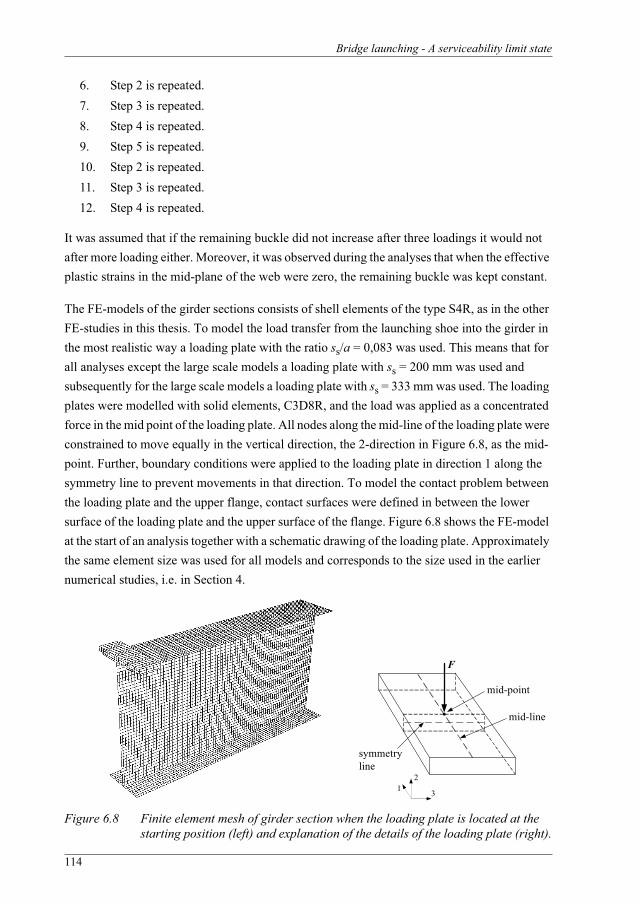
Bridge launching - A serviceability limit state
114
6. Step 2 is repeated.7. Step 3 is repeated.8. Step 4 is repeated.9. Step 5 is repeated.10. Step 2 is repeated.11. Step 3 is repeated.12. Step 4 is repeated.
It was assumed that if the remaining buckle did not increase after three loadings it would not after more loading either. Moreover, it was observed during the analyses that when the effective plastic strains in the mid-plane of the web were zero, the remaining buckle was kept constant.
The FE-models of the girder sections consists of shell elements of the type S4R, as in the other FE-studies in this thesis. To model the load transfer from the launching shoe into the girder in the most realistic way a loading plate with the ratio ss/a = 0,083 was used. This means that for all analyses except the large scale models a loading plate with ss = 200 mm was used and subsequently for the large scale models a loading plate with ss = 333 mm was used. The loading plates were modelled with solid elements, C3D8R, and the load was applied as a concentrated force in the mid point of the loading plate. All nodes along the mid-line of the loading plate were constrained to move equally in the vertical direction, the 2-direction in Figure 6.8, as the mid-point. Further, boundary conditions were applied to the loading plate in direction 1 along the symmetry line to prevent movements in that direction. To model the contact problem between the loading plate and the upper flange, contact surfaces were defined in between the lower surface of the loading plate and the upper surface of the flange. Figure 6.8 shows the FE-model at the start of an analysis together with a schematic drawing of the loading plate. Approximately the same element size was used for all models and corresponds to the size used in the earlier numerical studies, i.e. in Section 4.
Figure 6.8 Finite element mesh of girder section when the loading plate is located at the starting position (left) and explanation of the details of the loading plate (right).
mid-point
mid-line
F
2
31
symmetry line

Numerical study
115
Further, a friction coefficient, , has to be specified between the loading plate and the loaded flange. According to Granath (1998) who carried out tests with a launching shoe similar to the one shown in Figure 6.4, the friction coefficient, , varied between 0,1 and 0,2. In here, both
= 0,1 and 0,2 was tested without any significant differences. Following this observation, an = 0,15 was used in the simulations.
The material properties used in the model are the same as used in the numerical simulations of the tests, i.e. corresponding to a S355 steel grade, and the material model used was an isotropic hardening rule together with a von Mises yield surface.
6.3.2 Results from the numerical study
Before the somewhat complex analyses described above were carried out, the ultimate loads of the girders were determined both with respect to patch loading and bending moment separately, see Table 6.2. These loads, Fu,FE and Mu,FE, were then used as reference values of the resistance in the analyses with travelling load. Fu,FE and Mu,FE were determined on the girders using the same FE-model and method as described in Section 6.3.1 apart from the travelling load, instead a prescribed vertical displacement of the flange at mid-span was used to introduce the load to the girder. The ultimate load for the test presented in this thesis, P200, was 544 kN, which should be compared to the SLS200 FE-analysis, i.e. 540 kN. Hence, it was concluded that the FE-model was reasonable and that the results are trustworthy. The resistance to patch loading in the ultimate limit state, FR, in column four are according to the proposal presented in Section 5.3 and the bending resistance, MR, are determined according to EN 1993-1-1 (2005) or EN 1993-1-5 (2006) depending on cross section class.
As can be seen in Table 6.2 the ratio Fu,FE/FR falls in line with what is expected. However, Mu,FE/MR was expected to be closer to unity for some of the different girders. One explanation for this behaviour is how the moment is applied to the girder. For simplicity it was chosen to apply the moment as a force couple acting on the flanges corresponding to a moment according to Figure 6.7. Looking at the stresses in the girder it can be seen that except for the part closest to the ends of the girder there is a nice stress pattern but closest to the ends the stresses are concentrated to the flanges. This induce flange buckling close to the ends in the vicinity of Mu,FE. Further, if SLS100i and SLS100i-LS are compared it can be seen that they show of almost exactly the same Fu,FE/FR and Mu,FE/MR, which indicates that there are no scale effects involved.
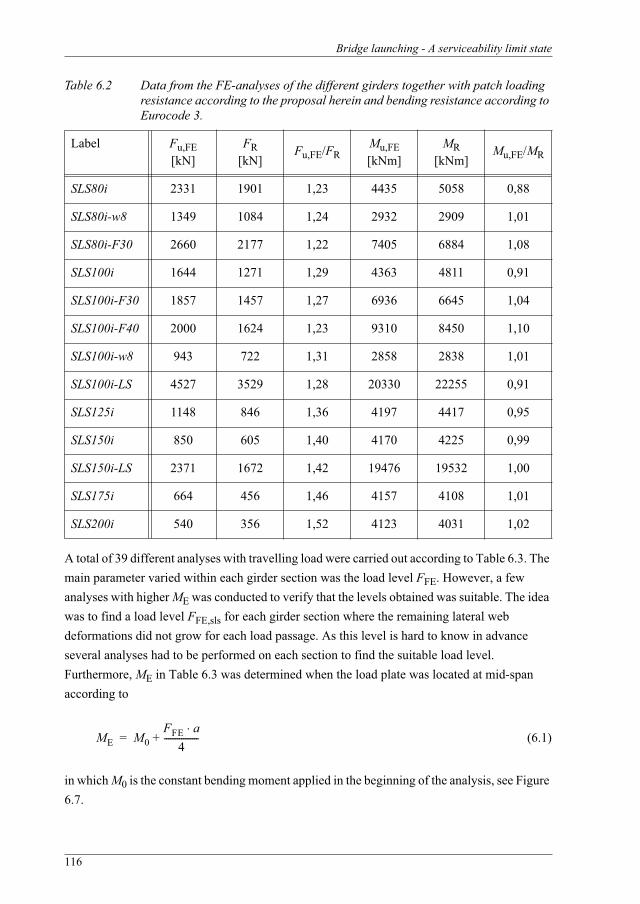
Bridge launching - A serviceability limit state
116
Table 6.2 Data from the FE-analyses of the different girders together with patch loading resistance according to the proposal herein and bending resistance according to Eurocode 3.
A total of 39 different analyses with travelling load were carried out according to Table 6.3. The main parameter varied within each girder section was the load level FFE. However, a few analyses with higher ME was conducted to verify that the levels obtained was suitable. The idea was to find a load level FFE,sls for each girder section where the remaining lateral web deformations did not grow for each load passage. As this level is hard to know in advance several analyses had to be performed on each section to find the suitable load level. Furthermore, ME in Table 6.3 was determined when the load plate was located at mid-span according to
(6.1)
in which M0 is the constant bending moment applied in the beginning of the analysis, see Figure 6.7.
Label Fu,FE[kN]
FR[kN]
Fu,FE/FRMu,FE[kNm]
MR[kNm]
Mu,FE/MR
SLS80i 2331 1901 1,23 4435 5058 0,88
SLS80i-w8 1349 1084 1,24 2932 2909 1,01
SLS80i-F30 2660 2177 1,22 7405 6884 1,08
SLS100i 1644 1271 1,29 4363 4811 0,91
SLS100i-F30 1857 1457 1,27 6936 6645 1,04
SLS100i-F40 2000 1624 1,23 9310 8450 1,10
SLS100i-w8 943 722 1,31 2858 2838 1,01
SLS100i-LS 4527 3529 1,28 20330 22255 0,91
SLS125i 1148 846 1,36 4197 4417 0,95
SLS150i 850 605 1,40 4170 4225 0,99
SLS150i-LS 2371 1672 1,42 19476 19532 1,00
SLS175i 664 456 1,46 4157 4108 1,01
SLS200i 540 356 1,52 4123 4031 1,02
ME M0FFE a
4----------------+=
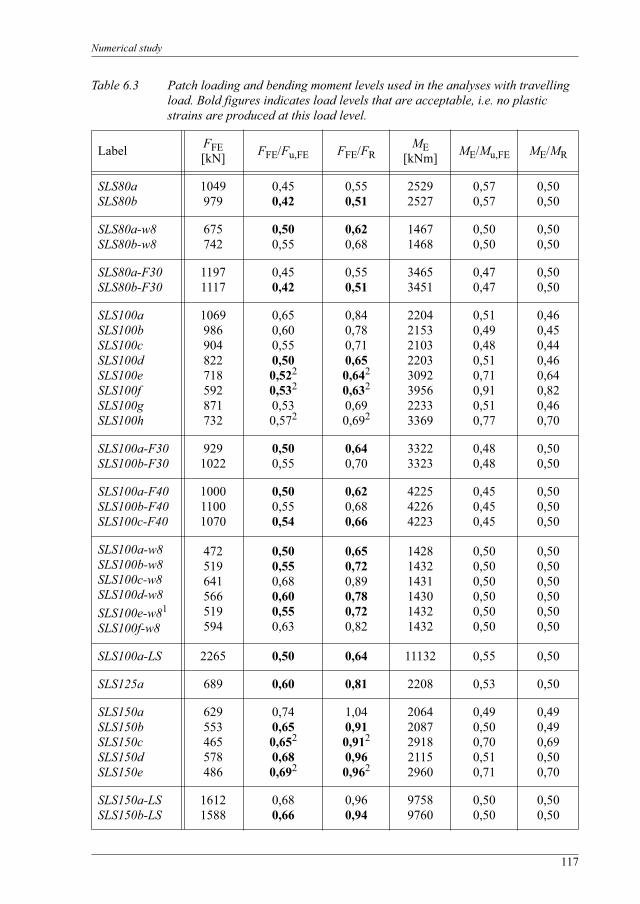
Numerical study
117
Table 6.3 Patch loading and bending moment levels used in the analyses with travelling load. Bold figures indicates load levels that are acceptable, i.e. no plastic strains are produced at this load level.
Label FFE[kN] FFE/Fu,FE FFE/FR
ME[kNm] ME/Mu,FE ME/MR
SLS80aSLS80b
1049979
0,450,42
0,550,51
25292527
0,570,57
0,500,50
SLS80a-w8SLS80b-w8
675742
0,500,55
0,620,68
14671468
0,500,50
0,500,50
SLS80a-F30SLS80b-F30
11971117
0,450,42
0,550,51
34653451
0,470,47
0,500,50
SLS100aSLS100bSLS100cSLS100dSLS100eSLS100fSLS100gSLS100h
1069986904822718592871732
0,650,600,550,500,522
0,532
0,530,572
0,840,780,710,650,642
0,632
0,690,692
22042153210322033092395622333369
0,510,490,480,510,710,910,510,77
0,460,450,440,460,640,820,460,70
SLS100a-F30SLS100b-F30
9291022
0,500,55
0,640,70
33223323
0,480,48
0,500,50
SLS100a-F40SLS100b-F40SLS100c-F40
100011001070
0,500,550,54
0,620,680,66
422542264223
0,450,450,45
0,500,500,50
SLS100a-w8SLS100b-w8SLS100c-w8SLS100d-w8SLS100e-w81
SLS100f-w8
472519641566519594
0,500,550,680,600,550,63
0,650,720,890,780,720,82
142814321431143014321432
0,500,500,500,500,500,50
0,500,500,500,500,500,50
SLS100a-LS 2265 0,50 0,64 11132 0,55 0,50
SLS125a 689 0,60 0,81 2208 0,53 0,50
SLS150aSLS150bSLS150cSLS150dSLS150e
629553465578486
0,740,650,652
0,680,692
1,040,910,912
0,960,962
20642087291821152960
0,490,500,700,510,71
0,490,490,690,500,70
SLS150a-LSSLS150b-LS
16121588
0,680,66
0,960,94
97589760
0,500,50
0,500,50
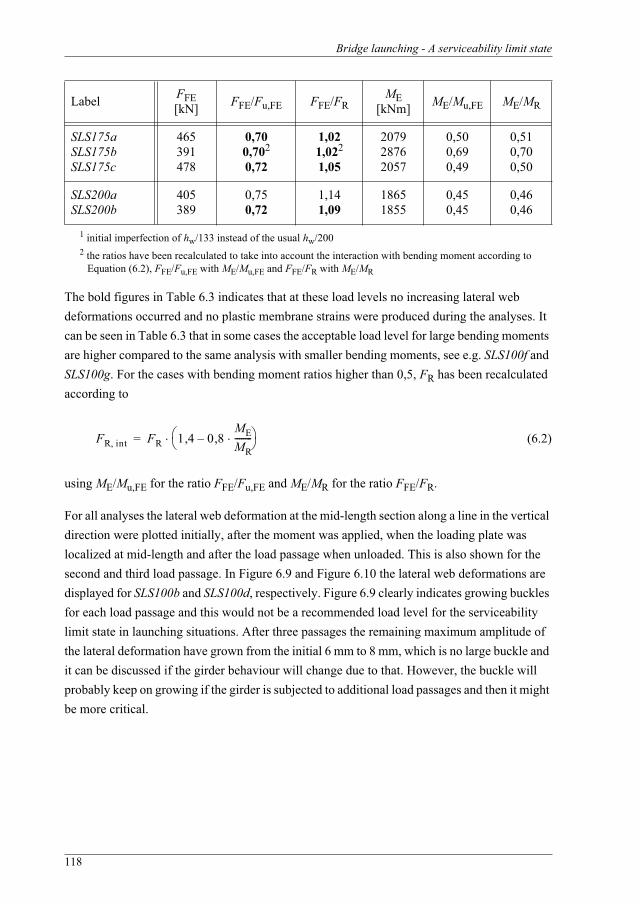
Bridge launching - A serviceability limit state
118
1 initial imperfection of hw/133 instead of the usual hw/2002 the ratios have been recalculated to take into account the interaction with bending moment according to
Equation (6.2), FFE/Fu,FE with ME/Mu,FE and FFE/FR with ME/MR
The bold figures in Table 6.3 indicates that at these load levels no increasing lateral web deformations occurred and no plastic membrane strains were produced during the analyses. It can be seen in Table 6.3 that in some cases the acceptable load level for large bending moments are higher compared to the same analysis with smaller bending moments, see e.g. SLS100f and SLS100g. For the cases with bending moment ratios higher than 0,5, FR has been recalculated according to
(6.2)
using ME/Mu,FE for the ratio FFE/Fu,FE and ME/MR for the ratio FFE/FR.
For all analyses the lateral web deformation at the mid-length section along a line in the vertical direction were plotted initially, after the moment was applied, when the loading plate was localized at mid-length and after the load passage when unloaded. This is also shown for the second and third load passage. In Figure 6.9 and Figure 6.10 the lateral web deformations are displayed for SLS100b and SLS100d, respectively. Figure 6.9 clearly indicates growing buckles for each load passage and this would not be a recommended load level for the serviceability limit state in launching situations. After three passages the remaining maximum amplitude of the lateral deformation have grown from the initial 6 mm to 8 mm, which is no large buckle and it can be discussed if the girder behaviour will change due to that. However, the buckle will probably keep on growing if the girder is subjected to additional load passages and then it might be more critical.
SLS175aSLS175bSLS175c
465391478
0,700,702
0,72
1,021,022
1,05
207928762057
0,500,690,49
0,510,700,50
SLS200aSLS200b
405389
0,750,72
1,141,09
18651855
0,450,45
0,460,46
Label FFE[kN] FFE/Fu,FE FFE/FR
ME[kNm] ME/Mu,FE ME/MR
FR int FR 1 4 0 8MEMR--------,–,=
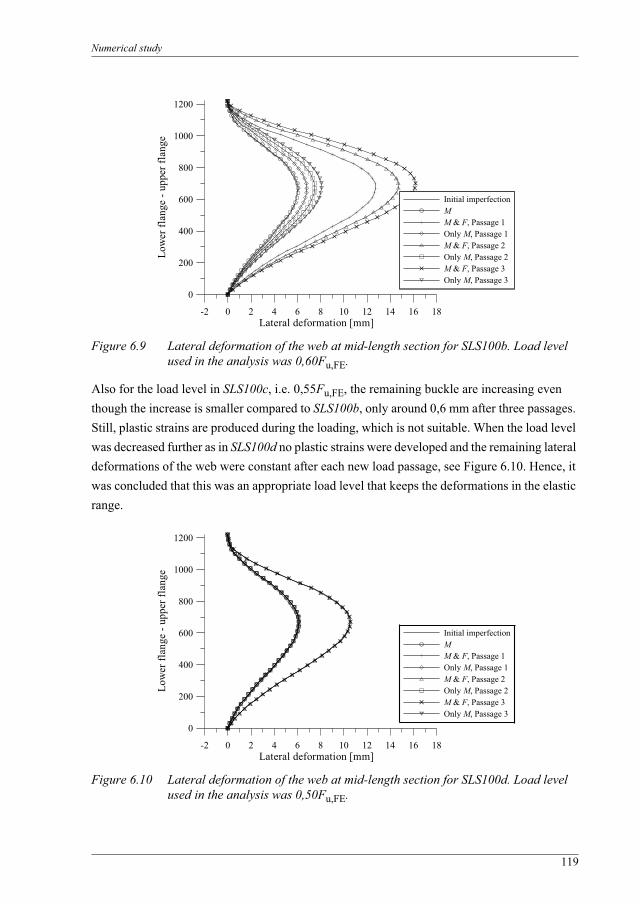
Numerical study
119
Figure 6.9 Lateral deformation of the web at mid-length section for SLS100b. Load level used in the analysis was 0,60Fu,FE.
Also for the load level in SLS100c, i.e. 0,55Fu,FE, the remaining buckle are increasing even though the increase is smaller compared to SLS100b, only around 0,6 mm after three passages. Still, plastic strains are produced during the loading, which is not suitable. When the load level was decreased further as in SLS100d no plastic strains were developed and the remaining lateral deformations of the web were constant after each new load passage, see Figure 6.10. Hence, it was concluded that this was an appropriate load level that keeps the deformations in the elastic range.
Figure 6.10 Lateral deformation of the web at mid-length section for SLS100d. Load level used in the analysis was 0,50Fu,FE.
-2 0 2 4 6 8 10 12 14 16 18Lateral deformation [mm]
0
200
400
600
800
1000
1200
Low
er fl
ange
- up
per f
lang
e
Initial imperfectionMM & F, Passage 1Only M, Passage 1M & F, Passage 2Only M, Passage 2M & F, Passage 3Only M, Passage 3
-2 0 2 4 6 8 10 12 14 16 18Lateral deformation [mm]
0
200
400
600
800
1000
1200
Low
er fl
ange
- up
per f
lang
e
Initial imperfectionMM & F, Passage 1Only M, Passage 1M & F, Passage 2Only M, Passage 2M & F, Passage 3Only M, Passage 3

Bridge launching - A serviceability limit state
120
When the web slenderness was increased to hw/tw = 150, i.e. SLS150, the relative load level could be increased compared to SLS100, without development of plastic strains and the remaining buckle stayed constant for every new load passage. The fact that SLS150 could resist a higher relative load level was expected due to the higher slenderness. This means that at ultimate load the SLS150 will fail at a lower stress level compared to the yield strength of the web material. Considering SLS100 on the other hand the stresses in the web will get higher and plastic deformations will develop earlier in relation to the ultimate load compared to SLS150and therefore the relative load level is lower.
Figure 6.11 show how the buckles develop at mid-length for the SLS150d girder, i.e. with a load level of 0,68Fu,FE. SLS150e shows the same behaviour as SLS150d, which indicates that this load level is adequate also for higher bending moments. Regarding Figure 6.11 the behaviour is satisfactory and not unexpectedly the size of the lateral deformations were larger compared to the SLS100 girder. The small difference in lateral deformation when the loading plate was situated approximately at mid-length of the section, the curves with both M and F in Figure 6.11, is explained by the fact that the position of the loading plate was not exactly the same. However, the lateral deformations when the girder is unloaded, i.e. only loaded with the applied constant bending moment, are constant and not increasing after several load passages.
Figure 6.11 Lateral deformation of the web at mid-length section for SLS150d. Load level used in the analysis was 0,68Fu,FE.
In order to limit the size of this Section the outcome of the other analyses are not shown in figures, only in tables. Regarding the large scale girders, they have the same behaviour as their corresponding smaller girders. Further, it should be mentioned that the different load levels were chosen by trial and error, i.e. if it was concluded that a level was too high it was changed to a lower until the residual deformation stayed constant. This means that there might be a level in between the one that was established as appropriate and the slightly higher level that was not
-2 0 2 4 6 8 10 12 14 16 18 20 22Lateral deformation [mm]
0
200
400
600
800
1000
1200
Low
er fl
ange
- up
per f
lang
e
Initial imperfectionMM & F, Passage 1Only M, Passage 1M & F, Passage 2Only M, Passage 2M & F, Passage 3Only M, Passage 3
Proposed criteria for bridge launching
121
acceptable. However, these FE-analyses are very time consuming and further studies are needed for a more exact level but the levels presented here are on the safe side. It would also be interesting to verify the results with experimental tests.
6.4 Proposed criteria for bridge launching
The aim with this study was to find a criterion that can be used when a bridge girder is launched into position. The criterion proposed here works when the load is travelling along the girder but would also work for a stationary load, i.e. a load that are only introduced at mid-span without any horizontal movements. For the latter case it would be on the safe side. This conclusion is based on simulations performed with a stationary load applied and removed three times, similar to the procedure described for the travelling load simulations. This was only carried out for the SLS100 and SLS150, but both girders could carry higher loads without increase of the remaining lateral web deformations. Hence, it was concluded that a moving load is worse compared to a stationary load, in terms of residual deformations.
As can be seen in the literature review on serviceability limit state for patch loading, Section 2.4, not many references can be found in this area. The only actual criterion found was the one presented by Granath (2000), see Equations (2.123) - (2.126).
The basic serviceability requirement is that the behaviour should be repeatable and therefore it is proposed here that the membrane strains should be elastic. This limit criterion makes sure that the growth of the lateral web deformations is limited and will be constant even for repeated travelling loads. The main idea was to keep the serviceability criterion as simple as possible and therefore a basic equation is proposed according to
(6.3)
in which is a function that reduces the resistance compared to the earlier proposed ultimate resistance, FR. In other words, instead of developing a completely different expression for FR,sls that includes all variables that is related to the resistance as in Granath (2000), those variables are taken into account by FR and only the slenderness, , will govern the relation between FR,sls and FR.
The data from the numerical study on girder sections subjected to a travelling repeated load serves as a basis for the calibration of . Table 6.4 shows and the final acceptable load levels, FFE,sls, in relation to Fu,FE and the proposed FR for the different sections.
FR sls, F sls, F FR=
F sls, F
F
F sls, F F
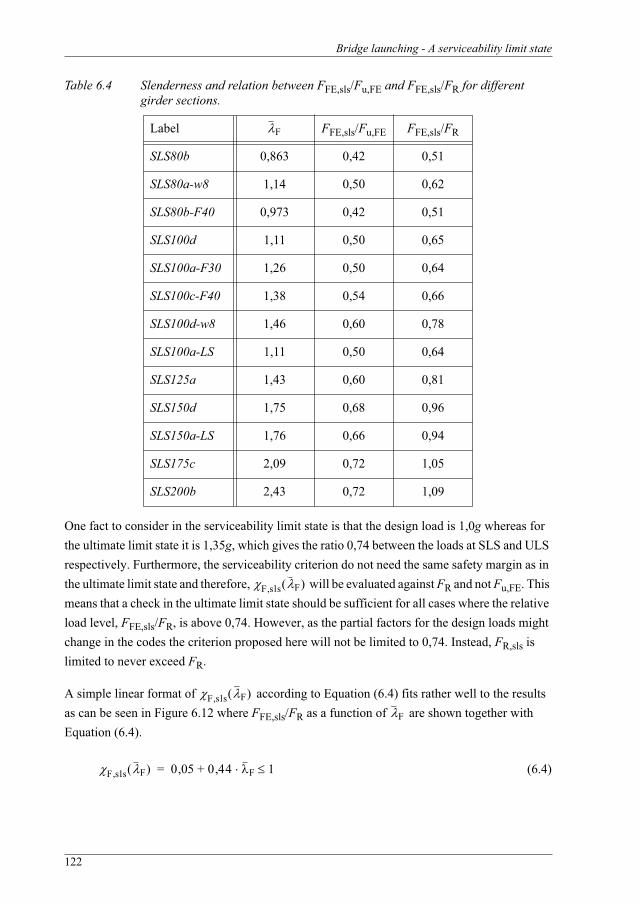
Bridge launching - A serviceability limit state
122
Table 6.4 Slenderness and relation between FFE,sls/Fu,FE and FFE,sls/FR for different girder sections.
One fact to consider in the serviceability limit state is that the design load is 1,0g whereas for the ultimate limit state it is 1,35g, which gives the ratio 0,74 between the loads at SLS and ULS respectively. Furthermore, the serviceability criterion do not need the same safety margin as in the ultimate limit state and therefore, will be evaluated against FR and not Fu,FE. This means that a check in the ultimate limit state should be sufficient for all cases where the relative load level, FFE,sls/FR, is above 0,74. However, as the partial factors for the design loads might change in the codes the criterion proposed here will not be limited to 0,74. Instead, FR,sls is limited to never exceed FR.
A simple linear format of according to Equation (6.4) fits rather well to the results as can be seen in Figure 6.12 where FFE,sls/FR as a function of are shown together with Equation (6.4).
(6.4)
Label FFE,sls/Fu,FE FFE,sls/FR
SLS80b 0,863 0,42 0,51
SLS80a-w8 1,14 0,50 0,62
SLS80b-F40 0,973 0,42 0,51
SLS100d 1,11 0,50 0,65
SLS100a-F30 1,26 0,50 0,64
SLS100c-F40 1,38 0,54 0,66
SLS100d-w8 1,46 0,60 0,78
SLS100a-LS 1,11 0,50 0,64
SLS125a 1,43 0,60 0,81
SLS150d 1,75 0,68 0,96
SLS150a-LS 1,76 0,66 0,94
SLS175c 2,09 0,72 1,05
SLS200b 2,43 0,72 1,09
F
F sls, F
F sls, F
F
F sls, F 0 05, 0 44 F 1,+=
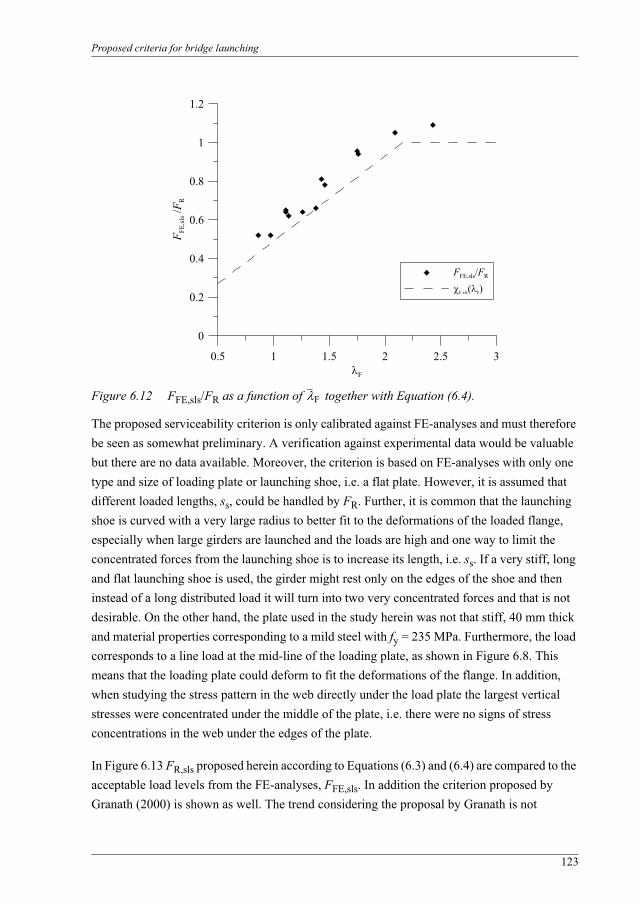
Proposed criteria for bridge launching
123
Figure 6.12 FFE,sls/FR as a function of together with Equation (6.4).
The proposed serviceability criterion is only calibrated against FE-analyses and must therefore be seen as somewhat preliminary. A verification against experimental data would be valuable but there are no data available. Moreover, the criterion is based on FE-analyses with only one type and size of loading plate or launching shoe, i.e. a flat plate. However, it is assumed that different loaded lengths, ss, could be handled by FR. Further, it is common that the launching shoe is curved with a very large radius to better fit to the deformations of the loaded flange, especially when large girders are launched and the loads are high and one way to limit the concentrated forces from the launching shoe is to increase its length, i.e. ss. If a very stiff, long and flat launching shoe is used, the girder might rest only on the edges of the shoe and then instead of a long distributed load it will turn into two very concentrated forces and that is not desirable. On the other hand, the plate used in the study herein was not that stiff, 40 mm thick and material properties corresponding to a mild steel with fy = 235 MPa. Furthermore, the load corresponds to a line load at the mid-line of the loading plate, as shown in Figure 6.8. This means that the loading plate could deform to fit the deformations of the flange. In addition, when studying the stress pattern in the web directly under the load plate the largest vertical stresses were concentrated under the middle of the plate, i.e. there were no signs of stress concentrations in the web under the edges of the plate.
In Figure 6.13 FR,sls proposed herein according to Equations (6.3) and (6.4) are compared to the acceptable load levels from the FE-analyses, FFE,sls. In addition the criterion proposed by Granath (2000) is shown as well. The trend considering the proposal by Granath is not
0.5 1 1.5 2 2.5 3F
0
0.2
0.4
0.6
0.8
1
1.2
F FE,sl
s /F R
FFE,sls/FR
F,sls( F)
F
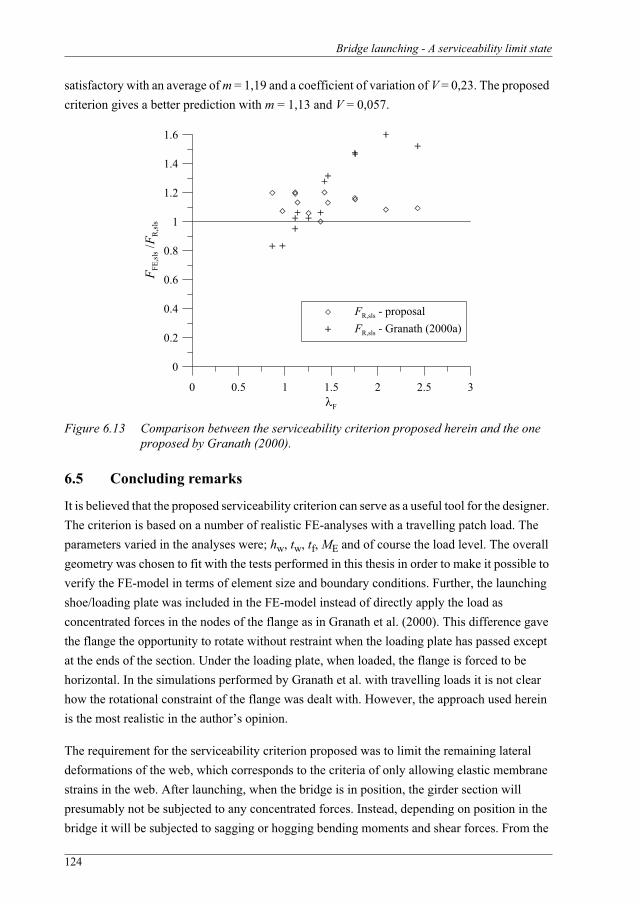
Bridge launching - A serviceability limit state
124
satisfactory with an average of m = 1,19 and a coefficient of variation of V = 0,23. The proposed criterion gives a better prediction with m = 1,13 and V = 0,057.
Figure 6.13 Comparison between the serviceability criterion proposed herein and the one proposed by Granath (2000).
6.5 Concluding remarks
It is believed that the proposed serviceability criterion can serve as a useful tool for the designer. The criterion is based on a number of realistic FE-analyses with a travelling patch load. The parameters varied in the analyses were; hw, tw, tf, ME and of course the load level. The overall geometry was chosen to fit with the tests performed in this thesis in order to make it possible to verify the FE-model in terms of element size and boundary conditions. Further, the launching shoe/loading plate was included in the FE-model instead of directly apply the load as concentrated forces in the nodes of the flange as in Granath et al. (2000). This difference gave the flange the opportunity to rotate without restraint when the loading plate has passed except at the ends of the section. Under the loading plate, when loaded, the flange is forced to be horizontal. In the simulations performed by Granath et al. with travelling loads it is not clear how the rotational constraint of the flange was dealt with. However, the approach used herein is the most realistic in the author’s opinion.
The requirement for the serviceability criterion proposed was to limit the remaining lateral deformations of the web, which corresponds to the criteria of only allowing elastic membrane strains in the web. After launching, when the bridge is in position, the girder section will presumably not be subjected to any concentrated forces. Instead, depending on position in the bridge it will be subjected to sagging or hogging bending moments and shear forces. From the
0 0.5 1 1.5 2 2.5 3F
0
0.2
0.4
0.6
0.8
1
1.2
1.4
1.6F F
E,sl
s /F R
,sls
FR,sls - proposalFR,sls - Granath (2000a)
Concluding remarks
125
criterion proposed herein, not allowing plastic membrane strains, it follows that the web depth is kept and hence, the section modulus W is not affected.
In general, when it comes to a real launching, if the distance between the supports are equal it is possible to decrease the support reaction and the bending moment during launching through the length of the launching nose. Nevertheless, if the supports are unevenly distributed this is not always possible but in this case it is not likely that some section of the bridge girder are in the worst position in every new span. Hence, every bridge launching depends on the conditions at site and must be evaluated by the designer. The criterion proposed here can be used in either case and always on the safe side but might be conservative for some cases.
One thing that definitely could be of interest to study a little further is how different loaded lengths affect the serviceability limit state. Herein it was assumed that the variation in ss was taken care of by FR, which is a fair assumption but it could be worth to investigate further.
Further, it is always desirable to have experimental results for verification of numerical simulations. It would be very interesting to perform some tests on small girders with a travelling load.

Bridge launching - A serviceability limit state
126
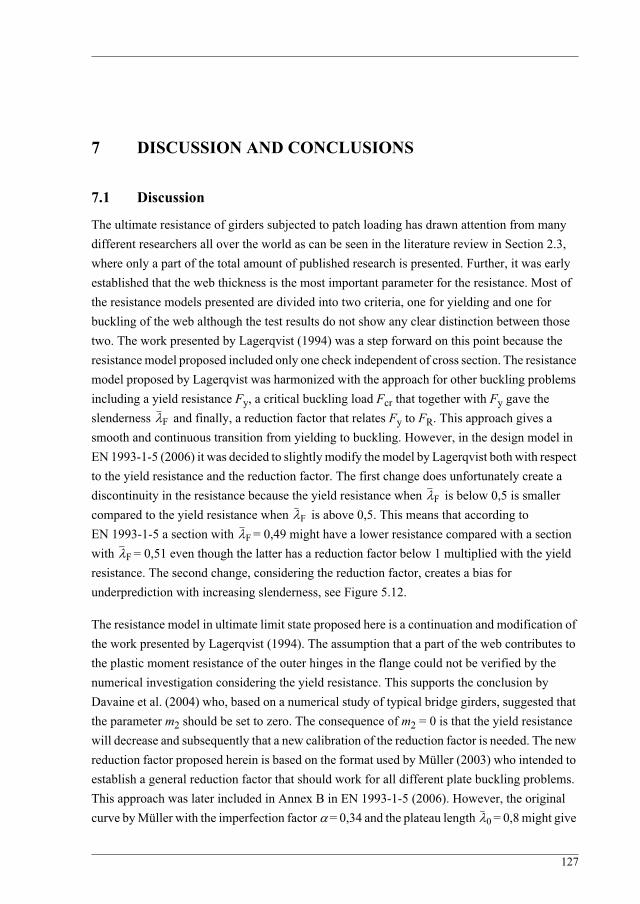
127
7 DISCUSSION AND CONCLUSIONS
7.1 Discussion
The ultimate resistance of girders subjected to patch loading has drawn attention from many different researchers all over the world as can be seen in the literature review in Section 2.3, where only a part of the total amount of published research is presented. Further, it was early established that the web thickness is the most important parameter for the resistance. Most of the resistance models presented are divided into two criteria, one for yielding and one for buckling of the web although the test results do not show any clear distinction between those two. The work presented by Lagerqvist (1994) was a step forward on this point because the resistance model proposed included only one check independent of cross section. The resistance model proposed by Lagerqvist was harmonized with the approach for other buckling problems including a yield resistance Fy, a critical buckling load Fcr that together with Fy gave the slenderness and finally, a reduction factor that relates Fy to FR. This approach gives a smooth and continuous transition from yielding to buckling. However, in the design model in EN 1993-1-5 (2006) it was decided to slightly modify the model by Lagerqvist both with respect to the yield resistance and the reduction factor. The first change does unfortunately create a discontinuity in the resistance because the yield resistance when is below 0,5 is smaller compared to the yield resistance when is above 0,5. This means that according to EN 1993-1-5 a section with = 0,49 might have a lower resistance compared with a section with = 0,51 even though the latter has a reduction factor below 1 multiplied with the yield resistance. The second change, considering the reduction factor, creates a bias for underprediction with increasing slenderness, see Figure 5.12.
The resistance model in ultimate limit state proposed here is a continuation and modification of the work presented by Lagerqvist (1994). The assumption that a part of the web contributes to the plastic moment resistance of the outer hinges in the flange could not be verified by the numerical investigation considering the yield resistance. This supports the conclusion by Davaine et al. (2004) who, based on a numerical study of typical bridge girders, suggested that the parameter m2 should be set to zero. The consequence of m2 = 0 is that the yield resistance will decrease and subsequently that a new calibration of the reduction factor is needed. The new reduction factor proposed herein is based on the format used by Müller (2003) who intended to establish a general reduction factor that should work for all different plate buckling problems. This approach was later included in Annex B in EN 1993-1-5 (2006). However, the original curve by Müller with the imperfection factor = 0,34 and the plateau length = 0,8 might give
F
F
F
F
F
0
Discussion and conclusions
128
an overestimation of the patch loading resistance, in the slenderness range between 0,7 and 2,5 according to Figure 7.1. Instead, the best fit to the test results available is obtained with = 0,5 and = 0,6. Further, it is shown by the test results on stocky girder webs that the ultimate load is clearly higher than the yield resistance and hence, it is proposed to allow the reduction factor to continue up to 1,2. Moreover, as the yield resistance was changed and proposed to be determined equally for all , the discontinuity in EN 1993-1-5 is removed.
Figure 7.1 Comparison of the herein proposed reduction factor and the reduction factor by Müller (2003) together with test results.
As the derivation of the reduction factor is empirical it is important to check if the essential parameters are reasonably represented by the proposed design model. In Appendix D and in Section 5.3 such checks are displayed but they showed no significant bias. However, the design procedure proposed still show a substantial scatter even though it is less compared to the existing procedure in EN 1993-1-5. One thing that affects the accuracy of the procedure is that the test results are taken from many different sources and put together in one data base. This may end up in systematic differences, for example different methods for evaluating the yield strength or if one girder is used for more than one test, e.g. tests on both flanges.
Clarin (2007) carried out a study on plate buckling, including both local buckling and patch loading of longitudinally stiffened girder webs. The study shows that the herein proposed reduction factor fits well also for the case with longitudinal stiffeners. Further, Clarin (2007) also show that the test results considering local buckling both performed by Clarin (2004) and by others seems to fit to this reduction factor as well. However, it should be noted that the stub column tests generally used for tests regarding local buckling, usually contains large welds compared to bridge girders. That might influence the results, as the residual stress distribution will be more significant compared to e.g. bridge girders where the welds are very small compared to the plates.
0
F
0 1 2 3 4 5 6F
0
0.5
1
1.5
2
F u/F
y
Test resultsProposalMüller (2003)
Discussion
129
The study herein also contains tests and numerical analyses of the influence from the loaded length on the patch loading resistance. This is important for bridge launching because the simplest way to increase the resistance is to increase the length of the launching shoe. ENV 1993-1-1 (1992) had a limitation that ss/hw should not be taken as larger than 0,2 while the rules in EN 1993-1-5 (2006) had a limitation of 1. The results in this thesis indicates that this limit can be increased further, at least up to 1,2. There is though a lack of test data with such long loaded lengths and it would therefore be very interesting to perform a numerical investigation verified by tests on girders with for example a/hw = 4 and ss up to 3hw. Such investigation could provide information regarding failure mode and if it still corresponds to a patch loading failure or if column like behaviour will occur, which might significantly reduce the resistance.
Considering the few tests with ss = a, they do not show any significant difference in resistance compared to the tests with shorter loaded lengths. However, they are in the high end of the scatter, which indicates that the resistance model for patch loading, with the mechanism model as basis, can be used on the safe side also for this type of loading, even though it can be discussed whether it is a patch load or not.
When it comes to steel bridge girders, the problem concerning patch loading resistance occurs during launching of the girder. Further, bridge launching involves a travelling concentrated load from the launching shoe, which can be repeated several times for each section depending on length and number of supports. As these concentrated forces can be of the magnitude that governs the web thickness it would be desirable to have a criterion in the serviceability limit state. The only criterion found in the literature is the one proposed by Granath (2000), which is based on stationary loadings and the limit criterion was that the effective stress on the web surface is not allowed to pass the yield strength of the material. This seems a bit conservative since bending of the web might give stresses of the magnitude of the yield stress while the membrane stresses still are below the yield strength, which would give a reversible behaviour. However, as can be seen in Figure 6.13 the proposal by Granath overestimates the resistance in some cases, which is explained by the fact that the serviceability criterion was based on stationary loadings.
The serviceability criterion herein is instead formulated such that no effective plastic membrane strains are allowed in the web. From the results of the FE-analyses presented in this thesis this was found as a suitable criterion which gave no increasing buckles in the web. Further, the criterion proposed herein is based on realistic FE-analyses performed in several steps using contact surfaces in between the loading plate and the loaded flange. The loading plate is travelling along the girder from one side to the other three times in order to verify whether the lateral deformations of the web are increasing after each passage or not.
A total of 13 different girder sections were analysed to find a load level FFE,sls that gives reversible behaviour. It was found from these analyses that the acceptable load levels did follow
Discussion and conclusions
130
the slenderness, , of the sections so that for low the load level was significantly lower than the design resistance in ultimate limit state, FR, but for higher the difference was not as large. With this in mind a simple criterion is proposed based on FR multiplied with a function
, i.e. instead of developing a completely different expression for FR,sls that includes all variables that is related to the resistance, those are taken into account by FR and only will govern the relation between FR,sls and FR. This seems like a fair assumption but there are still questions that need some further studies, e.g. the influence from different loaded lengths was not investigated even though it is assumed to be covered by FR.
Further, the proposed criterion considering the serviceability limit state are only based on numerical results and it is always desirable to have experimental results for verification of the model. It would be very interesting to perform some tests for verification of the model on small girders with a travelling load passing a few times over the girder.
The serviceability criterion proposed here was developed to fit the results from FE-analyses on girders subjected to travelling patch loading. However, it was found that travelling loads are worse compared to stationary loads when it comes to remaining lateral deformations of the web, i.e. the criterion can be used for stationary loadings as well though it will be conservative for such cases.
F F
F
F sls F
F
Conclusions
131
7.2 Conclusions
The following conclusions are drawn from the work presented:
• The three patch loading tests with varied loaded length was conducted successfully and falls in the middle of the scatter if compared to other tests found in the literature.
• The numerical calibration versus tests show good agreement with respect to deformations and ultimate load. The parametric study performed with the same FE-model together with the test results supports the definition of the loaded length in EN 1993-1-5 (2006), i.e. for more than one loading plate the centre-to-centre distance between the outer plates plus the load spread through the plates should be used as ss.
• The numerical study considering the yield resistance clearly implies that the contribution from the web to the bending moment resistance of the outer plastic hinges in the mechanism model should be neglected. This means that the yield resistance should be determined as in EN 1993-1-5 but with the parameter m2 set to zero, i.e. according to the model proposed by Roberts and Newark (1997) for direct yielding.
• The proposed design procedure, with a reduction factor in the same format as used by Müller (2003), gives a prediction of the ultimate load from tests with less scatter compared to the design model implemented in EN 1993-1-5.
• Based on the statistical evaluation of the proposed design procedure according to Annex D of EN 1990 (2002) the partial safety factor M1 = 1,0 is proposed.
• The simple serviceability limit state criterion developed for bridge launching fits well to the FE-results and should work as a useful tool for the bridge designer.
Discussion and conclusions
132
7.3 Future work
During the work with this thesis a number of questions have appeared. It was stated herein that no signs indicates that the limitation in EN 1993-1-5 for ss/hw is insufficient, at least not for the available test results and FE-results. Instead, the results show that the limit could be somewhat increased. However, there are no tests or FE-analyses, known by the author, that really can support that no limitation is needed. For this it would be interesting to perform FE-analyses and tests with larger aspect ratios and longer loaded lengths. For instance, a/hw = 4 and an ss from hw to 3hw, which could serve as basis for new conclusions considering this matter, i.e. if the usual buckling pattern will turn into column like behaviour or not.
Further, the knowledge considering the influence from bending moment on the patch loading resistance could definitely be improved. For this a test serie covering the entire interaction surface would be beneficial. As it looks today the interaction formulas are very influenced by what design models that are used.
The design procedure proposed herein for patch loading needs to be verified also considering opposite and end patch loading. However, there is a lack of test data considering opposite patch loading on welded girders in the literature, which would be valuable for such evaluation. Further, also rolled sections should be included in the design procedure.
Considering the serviceability limit state there are a need for some further investigations. It would be very interesting to verify the FE-analyses with some tests with travelling loads. This is a challenge but it should be possible to perform such tests on small girders with a load travelling over a few supports. Further, the FE-analyses carried out in this thesis were performed with a constant loaded length. This matter could be studied with a few analyses using different lengths on the loading plate for verification of the proposed serviceability limit criterion.
133
REFERENCES
ABAQUS (2006). ABAQUS Standard User’s Manual, ver. 6.6, ABAQUS, Inc.
Bergfelt, A. and Hövik, J. (1968). Thin-walled deep plate girders under static loads, Final report, IABSE Congress, New York, 465-477
Bergfelt, A. (1971). Studies and tests on slender plate girders without stiffeners - Shear strength and local web crippling, Proceedings, IABSE Colloquium, London, 67-83
Bergfelt, A. (1976). The behaviour and design of slender webs under partial edge loading, International conference on steel plated structures, Dowling, P. J., Harding, J. E., Frieze, P. A., eds., Imperial College, London, Crosby Lockwood Staples, 486-502
Bergfelt, A. (1979). Patch loading on a slender web - Influence of horizontal and vertical web stiffeners on the load carrying capacity, Chalmers University of Technology, Dept. of Structural Engineering, Div. of Steel and Timber Structures, publ. S 79:1, Göteborg
Bergfelt, A. (1983). Girder web stiffening for patch loading, Chalmers University of Technology, Dept. of Structural Engineering, Div. of Steel and Timber Structures, publ. S 83:1, Göteborg
Bergholtz, A. (1994). Lansering av brobalkar av stål - Lokal intryckning över stöd, publ. S 94:7, Avd. för Stål- och Träbyggnad, Chalmers tekniska högskola, Göteborg
Bossert, T. W. and Ostapenko, A. (1967). Buckling and ultimate loads for plate girder web plates under edge loading, Report No. 319.1, Fritz Engineering Laboratory, Dept. of Civil Engineering, Lehigh University, Bethlehem, Pa.
BSK 99 (1999). Boverkets handbok om stålkonstruktioner (The Swedish design code for steel structures), Boverket, Sweden
Carolin, A., Olofsson, T. and Täljsten, B. (2004). Photographic strain monitoring for Civil Engineering, The second International Conference on FRP Composites in Civil Engineering, Adelaide, Australia
Clarin, M. (2004). High Strength Steel - Local buckling and residual stresses, Licentiate thesis 2004:54, Luleå University of Technology, ISRN: LTU-LIC--04/54--SE
Clarin, M. (2007). Plate buckling resistance - Patch loading of longitudinally stiffened webs and local buckling, Doctoral thesis 2007:31, Luleå University of Technology, ISRN: LTU-DT--07/31--SE
ComBri (2007). Competitive Steel and Composite Bridges by Improved Steel Plated Structures, Final Report, RFCS Contract No. RFS-CR-03018
References
134
Davaine, L., Raoul, J. and Aribert, J. M. (2004). Patch load resistance of longitudinally stiffened bridge girder, Steelbridge 2004, International Symposium on Steel Bridges,Millau, France
Davaine, L. and Aribert, J. M. (2005). Launching of steel girder bridge, Proceedings of the fourth European conference on Steel and Composite Structures, Eurosteel 2005, Maastricht, Netherlands
Drdacky, M. and Novotny, R. (1977). Partial edge load-carrying capacity tests of thick plate girder webs, Acta Technica CSAV, 87, 614-620
Drdacky, M. (1986). Limit states of steel plate girder webs under patch loading, Proceedings, Regional Colloquium on Stability of Steel Structures, Ivanyi M. edt., Tihany, Hungary, 687-694
Edlund, B. (1988). Buckling and failure modes in slender plate girders under patch loading, Der Metallbau im Konstruktiven-Ingenieurbau (K-I), Karlsruhe, Germany, 461-469
Elgaaly, M. (1983). Web design under compressive edge loads, Engineering Journal, AISC, 20, 4th Q., 153-171
EN 1990 (2002). Eurocode - Basis of structural design, CEN, European Committee for Standardization, Brussels, Belgium
EN 1993-1-1 (2005). Eurocode 3: Design of steel structures, Part 1.1: General rules and rules for buildings, CEN, European Committee for Standardization, Brussels, Belgium
EN 1993-1-5 (2006). Eurocode 3: Design of steel structures, Part 1.5: Plated structural elements, CEN, European Committee for Standardization, Brussels, Belgium
EN 1993-2 (2003). Eurocode 3: Design of steel structures, Part 2: Steel bridges, CEN, European Committee for Standardization, Brussels, Belgium
EUR 20344 EN (2002). Partial safety factors for resistance of steel elements to EC3 and EC4 - Calibration of various steel products and failure criteria, Final report, European Commission, Luxembourg
Galéa, Y. and Martin, P. O. (2006). EBPlate - Elastic buckling of plates: Presentation manual of EBPlate, RFCS contract RFCS-CR-03018, ComBri-Report- CTICM-005, CTICM, France
Gozzi, J., Olsson, A. and Talja, A. (2004). Cold-formed stainless steel profiles subjected to bending and concentrated forces -Test results, numerical modelling and design guidance, Proceedings of the 10th Nordic Steel Construction Conference, Copenhagen, Denmark
Graciano, C. and Johansson, B. (2003). Resistance of longitudinally stiffened I-girders subjected to concentrated loads, Journal of Constructional Steel Research, 59, 561-586
Granath, P. (1998). Distribution of support reaction against a steel girder on a launching shoe, Journal of Constructional Steel Research, 47, 245-270
135
Granath, P. (2000). Serviceability limit state of I-shaped steel girders subjected to patch loading, Journal of Constructional Steel Research, 54, 387-408
Granath, P., Thorsson, A. and Edlund, B. (2000). I-shaped steel girders subjected to bending moment and travelling patch loading, Journal of Constructional Steel Research, 54, 409-421
Granholm, C. A. (1960). Tests on girders with extremely thin web plates (in Swedish), Report 202, Inst. för Byggnadsteknik, Göteborg
Herzog, M. A. M. (1986). Die Krüppellast von Blechträger- und Walzprofilstegen, Stahlbau,55(3), 87-88
Herzog, M. A. M. (1992). Web crippling with bending and shear of thin-walled plate girders, Journal of Constructional Steel Research, 22, 87-97
Johansson, B. and Lagerqvist, O. (1995). Resistance of plate edges to concentrated forces, Journal of Constructional Steel Research, 32, 69-105
Johansson, B., Maquoi, R. and Sedlacek, G. (2001). New design rules for plated structures in Eurocode 3, Journal of Constructional Steel Research, 57, 279-311
von Kármán, T., Sechler, E. E. and Donnel, L. H. (1932). The strength of thin plates in compression, Transactions ASME, APM 54-5, 53-57
Khan, M. Z. and Walker, A. C. (1972). Buckling of plates subjected to localized edge loading, The Structural Engineer, 50, No. 6, June, 225-232
Khan, M. Z. and Johns, K. C. (1975). Buckling of web plates under combined loadings, Journalof the Structural Division, Proceedings, ASCE, 101, No. ST10, October, 2079-2092
Khan, M. Z., Johns, K. C. and Hayman, B. (1977). Buckling of plates with partially loaded edges, Journal of the Structural Division, Proceedings, ASCE, 103, No. ST3, March, 547-558
Kuhlmann, U. and Seitz, M. (2004). Longitudinally stiffened girder webs subjected to patch loading, Steelbridge 2004, International Symposium on Steel Bridges, Millau, France
Kuhlmann, U. and Braun, B. (2007). Combined Shear- and Patch Loading: Numerical studies and development of an interaction equation, RFCS contract RFCS-CR-03018, ComBri-Report-USTUTT-002, Universität Stuttgart, Germany
Kutmanová, I. and Skaloud, M. (1992). Ultimate limit state of slender steel webs subjected to (i) constant and (ii) repeated partial edge loading, Journal of Constructional Steel Research, 21, 147-162
Lagerqvist, O. (1994). Patch loading - Resistance of steel girders subjected to concentrated forces, Doctoral thesis 1994:159D, Luleå University of Technology, ISRN: HLU-TH-T--159-D--SE
Lagerqvist, O. and Johansson, B. (1996). Resistance of I-girders to Concentrated loads, Journal of Constructional Steel Research, 39, 87-119
References
136
Lääne, A. (2003). Post-critical behaviour of composite bridges under negative moment and shear, Thesis no. 2889(2003), Lausanne EPFL, Switzerland
Maquoi, R. and Rondal, J. (1986). From thick to thin or from thin to thick?, Proceedings IABSE Colloquium, Thin-Walled Metal Structures in Buildings, Stockholm
Müller, C. (2003). Zum Nachweis ebener Tragwerke aus Stahl gegen seitliches Ausweichen,Stahlbau, RWTH Aachen, Heft 47, ISBN 3-8322-1574-3
Novak, P. and Skaloud, M. (1973). Incremental collapse of thin webs subjected to cyclic concentrated loads, Preliminary report, IABSE symposium, Lisbon, 179-184
Olsson, A. (2001). Stainless Steel Plasticity -Material modelling and structural applications-,Doctoral thesis 2001:19, Luleå University of Technology, ISRN: LTU-DT--01/19--SE
Raoul, J., Schaller, I. and Theillout, J. -N. (1990). Tests of buckling of panels subjected to in-plane patch loading, Proceedings, Contact Loading and Local Effects in Thin-walled Structures, IUTAM symposium, Prague, 173-183
Raoul, J., Spinassas, I. and Virlogeux, M. (1991). Étude par éléments finis d’une âme soumise à une charge locale dans son plan, Construction Metallique, No. 1, 29-40
Raoul, J. and Davaine, L. (2006). I-girder launching: Influence of load eccentricity, RFCScontract RFCS-CR-03018, ComBri-Report- SETRA-001, SETRA, France
Ren, T. and Tong, G. S. (2005). Elastic buckling of web plates in I-girders under patch and wheel loading, Engineering Structures, 27, 1528-1536
Roberts, T. M. and Rockey, K. C. (1978). Méthod pour prédire la charge de ruine d’une poutre a ame mince soumise a une charge simi-répartie dans le plan de l’ame, ConstructionMetallique, No. 3, 3-13
Roberts, T. M. and Rockey, K. C. (1979). A mechanism solution for predicting the collapse loads of slender plate girders when subjected to in-plane patch loading, Proc. Instn Civ. Engrs, Part 2, 67, 155-175
Roberts, T. M. (1981). Slender plate girders subjected to edge loading, Proc. Instn Civ. Engrs,Part 2, 71, 805-819
Roberts, T. M. and Chong, C. K. (1981). Collapse of plate girders under edge loading, ASCE,Jour. Struct. Div., ST8, 107, 1503-1509
Roberts, T. M. and Markovic, N. (1983). Stocky plate girders subjected to edge loading, Proc. Instn Civ. Engrs, Part 2, 75, 539-550
Roberts, T. M. and Coric, B. (1988). Collapse of plate girders subjected to patch loading, Miscellany Dedicated to the 65th Birthday of Academician Professor Dr. Nicola Hajdin,N. Naerlovic-Veljkovic edt., University of Belgrade, Belgrade, 203-209
Roberts, T. M. and Newark, A. C. B. (1997). Strength of webs subjected to compressive edge loading, Journal of Structural Engineering, 123(2), 176-183

137
Rockey, K. C. and Bagchi, D. K. (1970). Buckling of plate girder webs under partial edge loadings, International Journal of Mechanical Science, 12, 61-76
Rockey, K. C. and El-Gaaly, M. A. (1971). Ultimate strength of plates when subjected to in-plane patch loading, Proceedings, IABSE Colloquium, London, 401-407
Shahabian, F. and Roberts, T. M. (1999). Buckling of slender web plates subjected to combinations of in-plane loading, Journal of Constructional Steel Research, 51, 99-121
Shahabian, F. and Roberts, T. M. (2000). Combined Shear-and-Patch loading of plate girders, Journal of Structural engineering, 126(3), 316-321
Shimizu, S., Yabana, H. and Yoshida, S. (1989). A new collapse model for patch-loaded web plates, Journal of Constructional Steel Research, 13, 61-73
Skaloud, M. and Novak, P. (1972). Post-buckling behaviour and incremental collapse of webs subjected to concentrated loads, Proceedings, IABSE, 9th Congress, Amsterdam, 101-110
Skaloud, M. and Drdacky, M. (1975). Ultimate load design of webs of steel plated structures - Part 3 Webs under concentrated loads (in Czech), Staveb. Casopis, 23, C3, Veda Bratislava, 140-160
Spinassas, I., Raoul, J. and Virlogeux, M. (1990). Parametric study on plate girders subjected to patch loading, Proceedings, Contact Loading and Local Effects in Thin-walled Structures, IUTAM symposium, Prague, 192-203
Tryland, T., Hopperstad, O. S. and Langseth, M. (1999). Steel girders subjected to concentrated loading - Validation of numerical simulations, Journal of Constructional Steel Research,50, 199-216
Ungermann, D. (1990). Bemessungsverfahren für vollwand- und kastenträger unter besonderer berücksichtigung des stegverhaltens, Stahlbau, RWTH Aachen, Heft 17, ISSN 0722-1037
Unosson, E. (2003). Patch loading of stainless steel girders - Experiments and finite element analyses, Licentiate thesis 2003:12, Luleå University of Technology, ISRN: LTU-LIC--03/12--SE
Veljkovic, M. and Johansson, B. (2001). Design for buckling of plates due to direct stress, Proceedings of the 9th Nordic Steel Construction Conference, Helsinki, Finland
Winter, G. (1947). Strength of thin steel compression flanges, Transactions ASCE, 112, 527-544
Zetlin, L. (1955). Elastic instability of flat plates subjected to partial edge loads, Proceedings,ASCE, Vol. 81, Separate paper No. 795, 1-24
Zoetemeijer, P. (1980). The influence of normal-, bending- and shear stresses on the ultimate compression force exerted laterally to European rolled sections, Report 6-80-5, Facultiet der Civiele Techniek, Technische Universiteit Delft, Delft

References
138
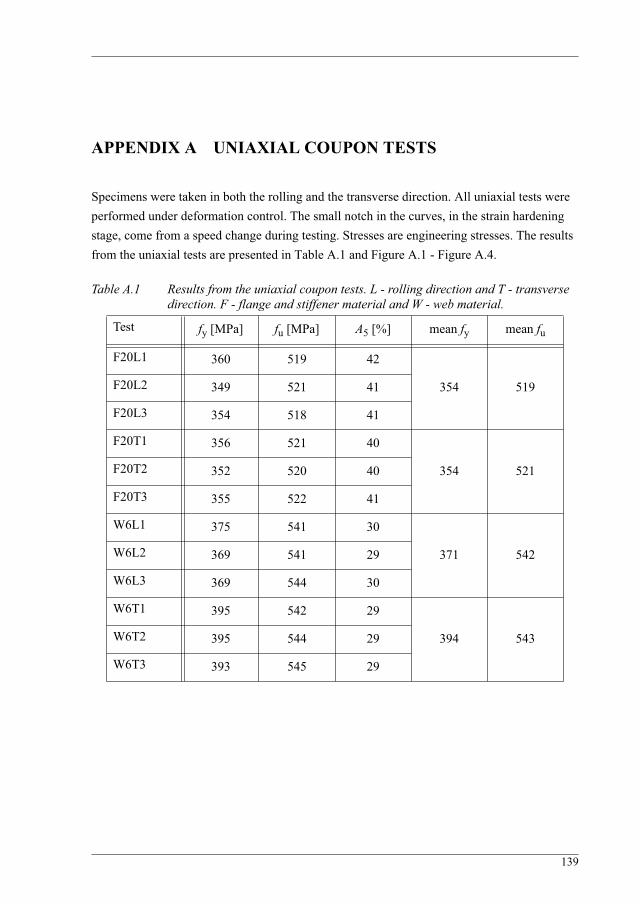
139
APPENDIX A UNIAXIAL COUPON TESTS
Specimens were taken in both the rolling and the transverse direction. All uniaxial tests were performed under deformation control. The small notch in the curves, in the strain hardening stage, come from a speed change during testing. Stresses are engineering stresses. The results from the uniaxial tests are presented in Table A.1 and Figure A.1 - Figure A.4.
Table A.1 Results from the uniaxial coupon tests. L - rolling direction and T - transverse direction. F - flange and stiffener material and W - web material.
Test fy [MPa] fu [MPa] A5 [%] mean fy mean fu
F20L1 360 519 42
354 519F20L2 349 521 41
F20L3 354 518 41
F20T1 356 521 40
354 521F20T2 352 520 40
F20T3 355 522 41
W6L1 375 541 30
371 542W6L2 369 541 29
W6L3 369 544 30
W6T1 395 542 29
394 543W6T2 395 544 29
W6T3 393 545 29
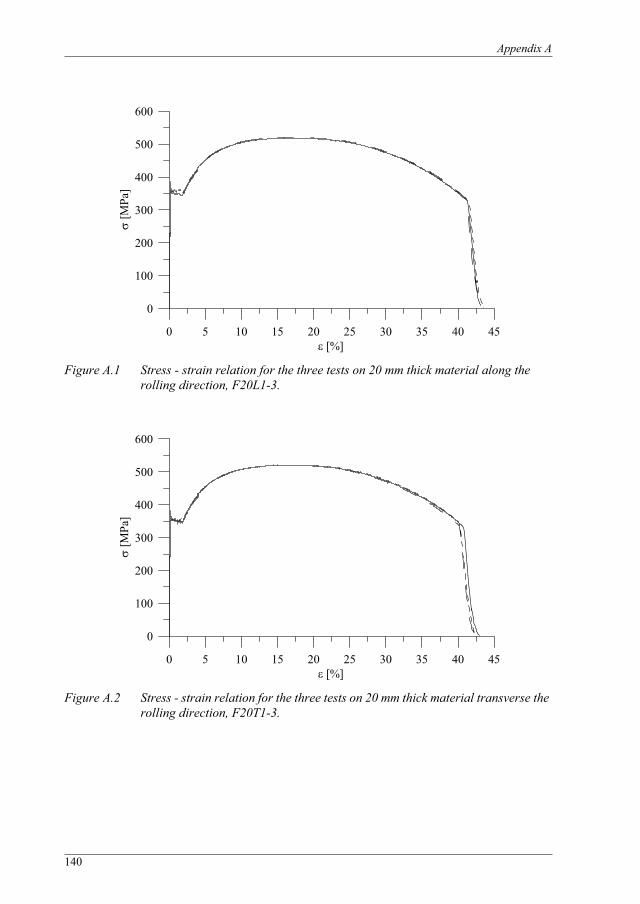
Appendix A
140
Figure A.1 Stress - strain relation for the three tests on 20 mm thick material along the rolling direction, F20L1-3.
Figure A.2 Stress - strain relation for the three tests on 20 mm thick material transverse the rolling direction, F20T1-3.
0 5 10 15 20 25 30 35 40 45[%]
0
100
200
300
400
500
600[M
Pa]
0 5 10 15 20 25 30 35 40 45[%]
0
100
200
300
400
500
600
[MPa
]

Uniaxial coupon tests
141
Figure A.3 Stress - strain relation for the three tests on 6 mm thick material along the rolling direction, W6L1-3.
Figure A.4 Stress - strain relation for the three tests on 6 mm thick material transverse the rolling direction, W6T1-3.
0 5 10 15 20 25 30 35 40 45[%]
0
100
200
300
400
500
600
[MPa
]
0 5 10 15 20 25 30 35 40 45[%]
0
100
200
300
400
500
600
[MPa
]

Appendix A
142

143
APPENDIX B PATCH LOADING TESTS
B.1 Measured girder dimensions
Mean values of the measured geometries of the tested girders are shown in Table B.1. Index ustands for the upper flange and l for the lower flange, respectively.
Table B.1 Measured geometry of the tested girders.
B.2 Strain gauge layout on girder webs
Strains were measured at the girder webs in the three tests performed. The strain gauge layout are shown in Figure B.1 - Figure B.3.
Figure B.1 Positions, orientation and labelling of strain gauges attached to side A of girder P200. Strain gauges were placed in the same positions on side B as well. Strains
x, y and xy are presented in accordance with the shown coordinate system.
Girderhw
[mm]tw
[mm]bfl
[mm]tfl
[mm]bfu
[mm]tfu
[mm]a
[mm]
P200 1198 5,9 446 20,0 449 20,0 2401
P700 1200 5,9 450 20,0 450 20,0 2400
P1440 1200 5,9 450 20,0 450 20,0 2400
200
P200100
270
30
2x100 320
50
100150
A
101 111 121 201211,212,213
311,312,313
301
401
501
80
y
x
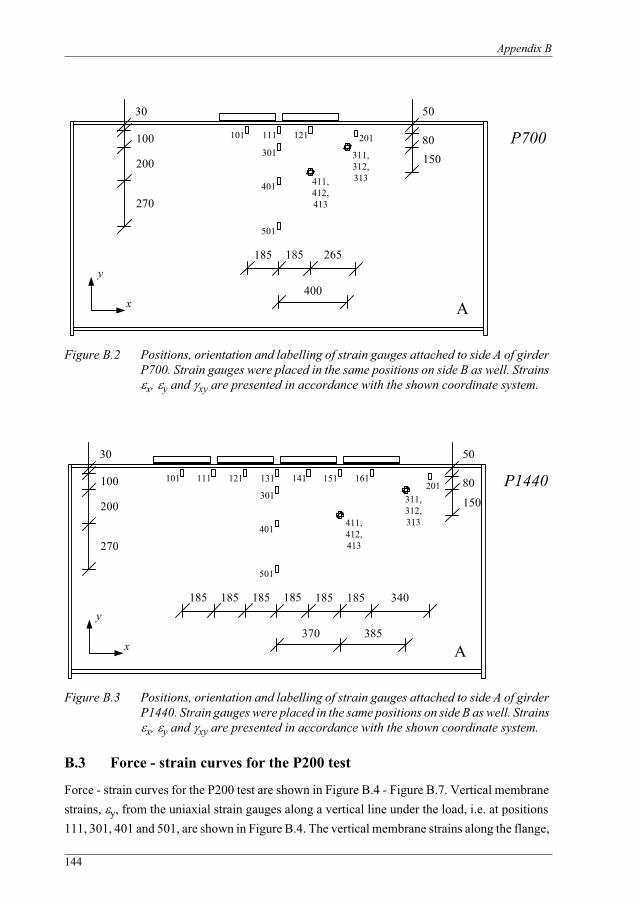
Appendix B
144
Figure B.2 Positions, orientation and labelling of strain gauges attached to side A of girder P700. Strain gauges were placed in the same positions on side B as well. Strains
x, y and xy are presented in accordance with the shown coordinate system.
Figure B.3 Positions, orientation and labelling of strain gauges attached to side A of girder P1440. Strain gauges were placed in the same positions on side B as well. Strains
x, y and xy are presented in accordance with the shown coordinate system.
B.3 Force - strain curves for the P200 test
Force - strain curves for the P200 test are shown in Figure B.4 - Figure B.7. Vertical membrane strains, y, from the uniaxial strain gauges along a vertical line under the load, i.e. at positions 111, 301, 401 and 501, are shown in Figure B.4. The vertical membrane strains along the flange,
200
P700100
270
30
185 265
50
400A
101 111 121 201
311,312,313411,
412,413
301
401
501
185
15080
y
x
200
P1440100
270
30
185 185
50
370A
111 121 131201
311,312,313411,
412,413
301
401
501
185
150
185 340185185
151141101 161
385
80
y
x
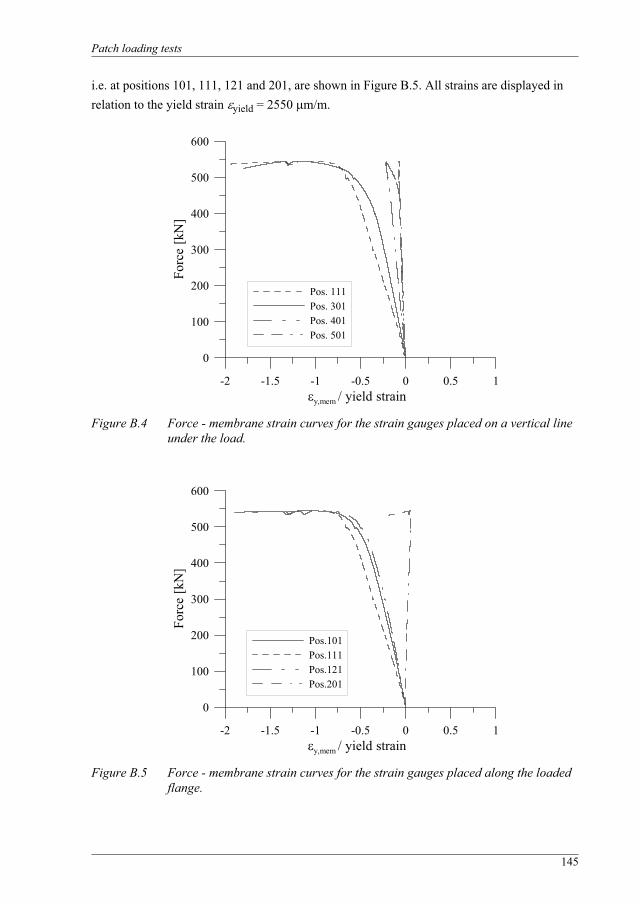
Patch loading tests
145
i.e. at positions 101, 111, 121 and 201, are shown in Figure B.5. All strains are displayed in relation to the yield strain yield = 2550 m/m.
Figure B.4 Force - membrane strain curves for the strain gauges placed on a vertical line under the load.
Figure B.5 Force - membrane strain curves for the strain gauges placed along the loaded flange.
-2 -1.5 -1 -0.5 0 0.5 1y,mem / yield strain
0
100
200
300
400
500
600
Forc
e [k
N]
Pos. 111Pos. 301Pos. 401Pos. 501
-2 -1.5 -1 -0.5 0 0.5 1y,mem / yield strain
0
100
200
300
400
500
600
Forc
e [k
N]
Pos.101Pos.111Pos.121Pos.201
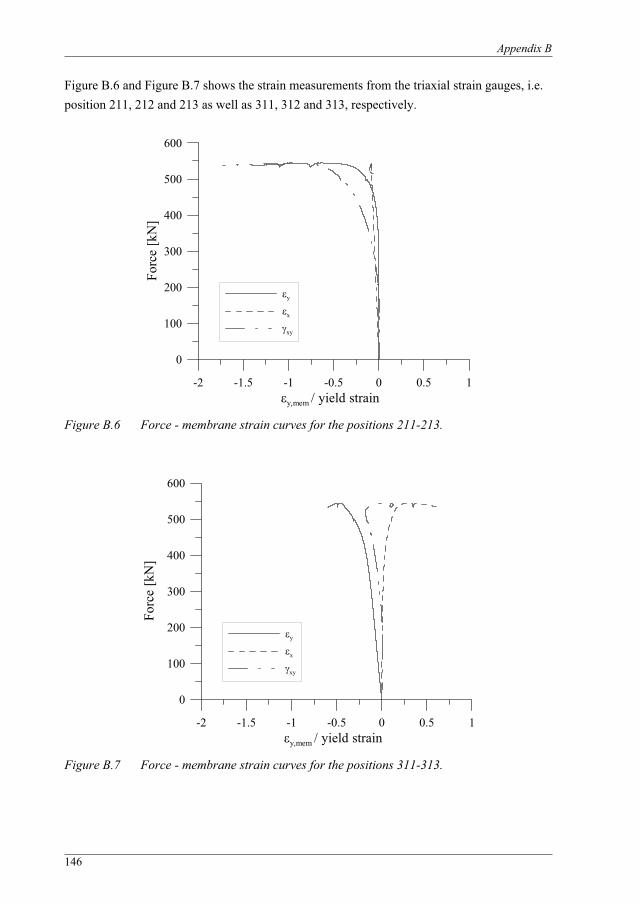
Appendix B
146
Figure B.6 and Figure B.7 shows the strain measurements from the triaxial strain gauges, i.e. position 211, 212 and 213 as well as 311, 312 and 313, respectively.
Figure B.6 Force - membrane strain curves for the positions 211-213.
Figure B.7 Force - membrane strain curves for the positions 311-313.
-2 -1.5 -1 -0.5 0 0.5 1y,mem / yield strain
0
100
200
300
400
500
600Fo
rce
[kN
]
y
x
xy
-2 -1.5 -1 -0.5 0 0.5 1y,mem / yield strain
0
100
200
300
400
500
600
Forc
e [k
N]
y
x
xy
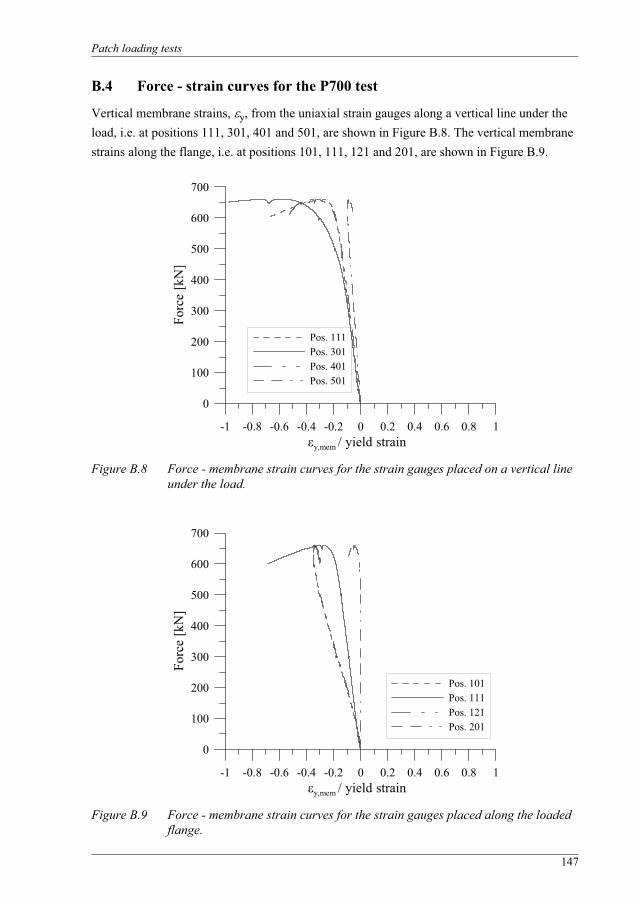
Patch loading tests
147
B.4 Force - strain curves for the P700 test
Vertical membrane strains, y, from the uniaxial strain gauges along a vertical line under the load, i.e. at positions 111, 301, 401 and 501, are shown in Figure B.8. The vertical membrane strains along the flange, i.e. at positions 101, 111, 121 and 201, are shown in Figure B.9.
Figure B.8 Force - membrane strain curves for the strain gauges placed on a vertical line under the load.
Figure B.9 Force - membrane strain curves for the strain gauges placed along the loaded flange.
-1 -0.8 -0.6 -0.4 -0.2 0 0.2 0.4 0.6 0.8 1y,mem / yield strain
0
100
200
300
400
500
600
700Fo
rce
[kN
]
Pos. 111Pos. 301Pos. 401Pos. 501
-1 -0.8 -0.6 -0.4 -0.2 0 0.2 0.4 0.6 0.8 1y,mem / yield strain
0
100
200
300
400
500
600
700
Forc
e [k
N]
Pos. 101Pos. 111Pos. 121Pos. 201

Appendix B
148
Figure B.10 and Figure B.11 shows the strain measurements from the triaxial strain gauges, i.e. position 311, 312 and 313 as well as 411, 412 and 413, respectively.
Figure B.10 Force - membrane strain curves for the positions 311-313.
Figure B.11 Force - membrane strain curves for the positions 411-413.
-1 -0.8 -0.6 -0.4 -0.2 0 0.2 0.4 0.6 0.8 1y,mem / yield strain
0
100
200
300
400
500
600
700Fo
rce
[kN
]
y
x
xy
-1 -0.8 -0.6 -0.4 -0.2 0 0.2 0.4 0.6 0.8 1y,mem / yield strain
0
100
200
300
400
500
600
700
Forc
e [k
N]
y
x
xy
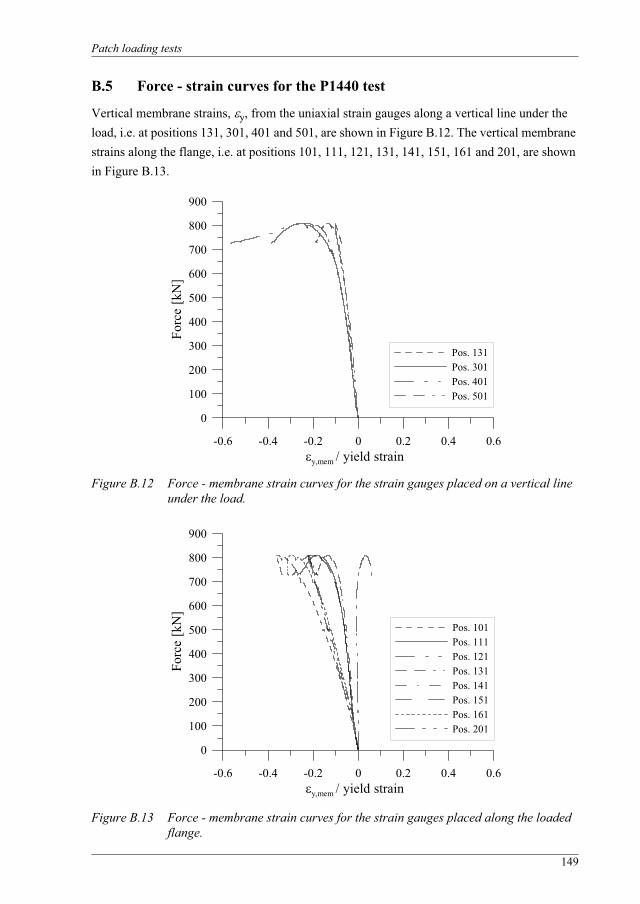
Patch loading tests
149
B.5 Force - strain curves for the P1440 test
Vertical membrane strains, y, from the uniaxial strain gauges along a vertical line under the load, i.e. at positions 131, 301, 401 and 501, are shown in Figure B.12. The vertical membrane strains along the flange, i.e. at positions 101, 111, 121, 131, 141, 151, 161 and 201, are shown in Figure B.13.
Figure B.12 Force - membrane strain curves for the strain gauges placed on a vertical line under the load.
Figure B.13 Force - membrane strain curves for the strain gauges placed along the loaded flange.
-0.6 -0.4 -0.2 0 0.2 0.4 0.6y,mem / yield strain
0
100
200
300
400
500
600
700
800
900
Forc
e [k
N]
Pos. 131Pos. 301Pos. 401Pos. 501
-0.6 -0.4 -0.2 0 0.2 0.4 0.6y,mem / yield strain
0
100
200
300
400
500
600
700
800
900
Forc
e [k
N]
Pos. 101Pos. 111Pos. 121Pos. 131Pos. 141Pos. 151Pos. 161Pos. 201
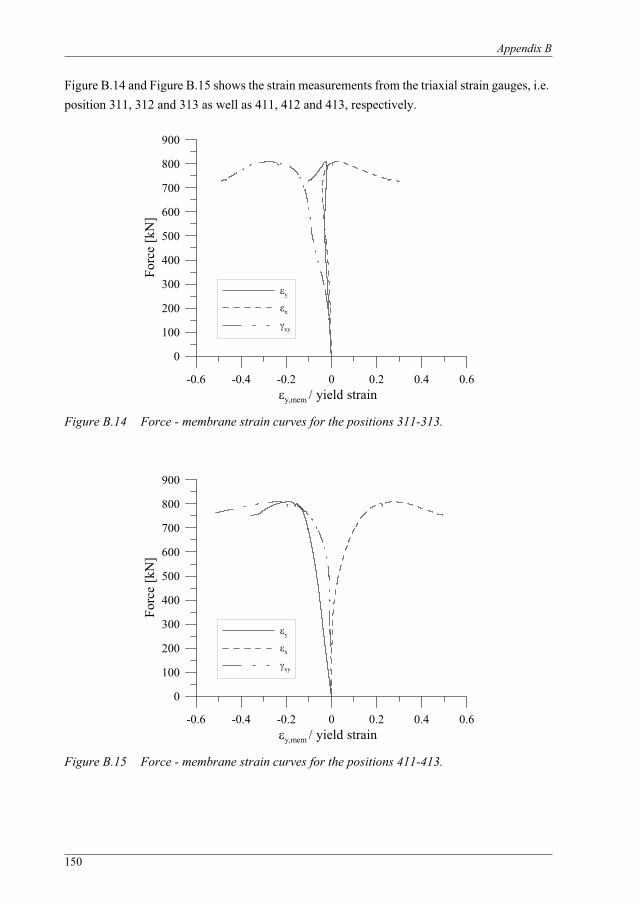
Appendix B
150
Figure B.14 and Figure B.15 shows the strain measurements from the triaxial strain gauges, i.e. position 311, 312 and 313 as well as 411, 412 and 413, respectively.
Figure B.14 Force - membrane strain curves for the positions 311-313.
Figure B.15 Force - membrane strain curves for the positions 411-413.
-0.6 -0.4 -0.2 0 0.2 0.4 0.6y,mem / yield strain
0
100
200
300
400
500
600
700
800
900Fo
rce
[kN
]
y
x
xy
-0.6 -0.4 -0.2 0 0.2 0.4 0.6y,mem / yield strain
0
100
200
300
400
500
600
700
800
900
Forc
e [k
N]
y
x
xy
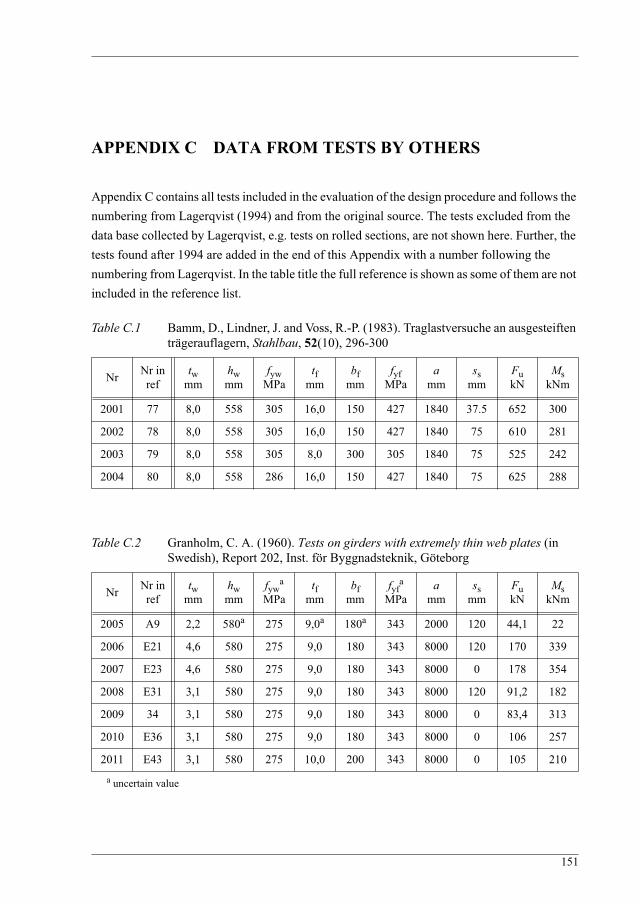
151
APPENDIX C DATA FROM TESTS BY OTHERS
Appendix C contains all tests included in the evaluation of the design procedure and follows the numbering from Lagerqvist (1994) and from the original source. The tests excluded from the data base collected by Lagerqvist, e.g. tests on rolled sections, are not shown here. Further, the tests found after 1994 are added in the end of this Appendix with a number following the numbering from Lagerqvist. In the table title the full reference is shown as some of them are not included in the reference list.
Table C.1 Bamm, D., Lindner, J. and Voss, R.-P. (1983). Traglastversuche an ausgesteiften trägerauflagern, Stahlbau, 52(10), 296-300
Table C.2 Granholm, C. A. (1960). Tests on girders with extremely thin web plates (in Swedish), Report 202, Inst. för Byggnadsteknik, Göteborg
a uncertain value
Nr Nr inref
twmm
hwmm
fywMPa
tfmm
bfmm
fyfMPa
amm
ssmm
FukN
MskNm
2001 77 8,0 558 305 16,0 150 427 1840 37.5 652 300
2002 78 8,0 558 305 16,0 150 427 1840 75 610 281
2003 79 8,0 558 305 8,0 300 305 1840 75 525 242
2004 80 8,0 558 286 16,0 150 427 1840 75 625 288
Nr Nr inref
twmm
hwmm
fywa
MPatf
mmbf
mmfyf
a
MPaa
mmss
mmFukN
MskNm
2005 A9 2,2 580a 275 9,0a 180a 343 2000 120 44,1 22
2006 E21 4,6 580 275 9,0 180 343 8000 120 170 339
2007 E23 4,6 580 275 9,0 180 343 8000 0 178 354
2008 E31 3,1 580 275 9,0 180 343 8000 120 91,2 182
2009 34 3,1 580 275 9,0 180 343 8000 0 83,4 313
2010 E36 3,1 580 275 9,0 180 343 8000 0 106 257
2011 E43 3,1 580 275 10,0 200 343 8000 0 105 210
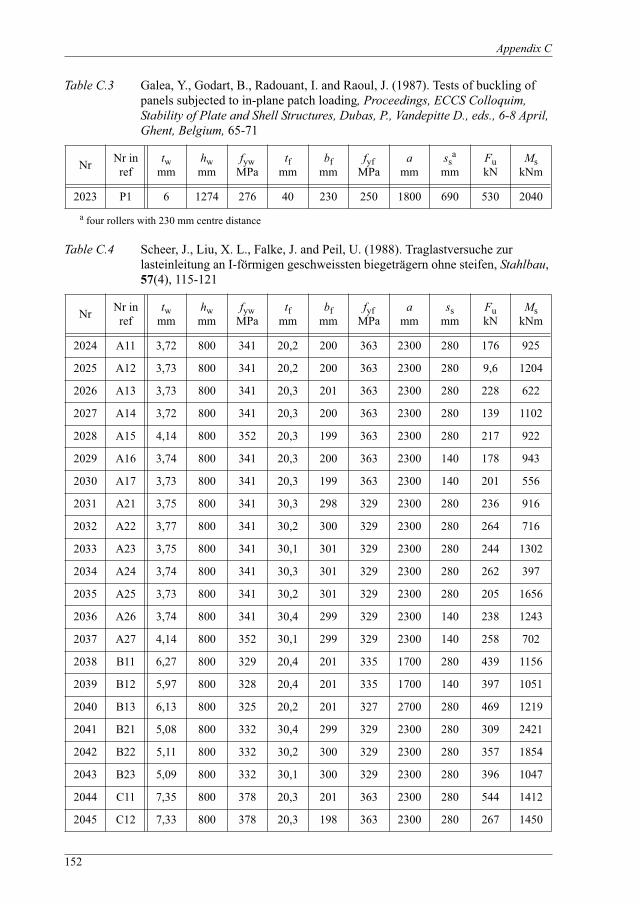
Appendix C
152
Table C.3 Galea, Y., Godart, B., Radouant, I. and Raoul, J. (1987). Tests of buckling of panels subjected to in-plane patch loading, Proceedings, ECCS Colloquim, Stability of Plate and Shell Structures, Dubas, P., Vandepitte D., eds., 6-8 April, Ghent, Belgium, 65-71
a four rollers with 230 mm centre distance
Table C.4 Scheer, J., Liu, X. L., Falke, J. and Peil, U. (1988). Traglastversuche zur lasteinleitung an I-förmigen geschweissten biegeträgern ohne steifen, Stahlbau,57(4), 115-121
Nr Nr inref
twmm
hwmm
fywMPa
tfmm
bfmm
fyfMPa
amm
ssa
mmFukN
MskNm
2023 P1 6 1274 276 40 230 250 1800 690 530 2040
Nr Nr inref
twmm
hwmm
fywMPa
tfmm
bfmm
fyfMPa
amm
ssmm
FukN
MskNm
2024 A11 3,72 800 341 20,2 200 363 2300 280 176 925
2025 A12 3,73 800 341 20,2 200 363 2300 280 9,6 1204
2026 A13 3,73 800 341 20,3 201 363 2300 280 228 622
2027 A14 3,72 800 341 20,3 200 363 2300 280 139 1102
2028 A15 4,14 800 352 20,3 199 363 2300 280 217 922
2029 A16 3,74 800 341 20,3 200 363 2300 140 178 943
2030 A17 3,73 800 341 20,3 199 363 2300 140 201 556
2031 A21 3,75 800 341 30,3 298 329 2300 280 236 916
2032 A22 3,77 800 341 30,2 300 329 2300 280 264 716
2033 A23 3,75 800 341 30,1 301 329 2300 280 244 1302
2034 A24 3,74 800 341 30,3 301 329 2300 280 262 397
2035 A25 3,73 800 341 30,2 301 329 2300 280 205 1656
2036 A26 3,74 800 341 30,4 299 329 2300 140 238 1243
2037 A27 4,14 800 352 30,1 299 329 2300 140 258 702
2038 B11 6,27 800 329 20,4 201 335 1700 280 439 1156
2039 B12 5,97 800 328 20,4 201 335 1700 140 397 1051
2040 B13 6,13 800 325 20,2 201 327 2700 280 469 1219
2041 B21 5,08 800 332 30,4 299 329 2300 280 309 2421
2042 B22 5,11 800 332 30,2 300 329 2300 280 357 1854
2043 B23 5,09 800 332 30,1 300 329 2300 280 396 1047
2044 C11 7,35 800 378 20,3 201 363 2300 280 544 1412
2045 C12 7,33 800 378 20,3 198 363 2300 280 267 1450

Data from tests by others
153
Table C.5 Shimizu, S., Yoshida, S. and Okuhara, H. (1987). An experimental study on patch-loaded web plates, Proceedings, ECCS Colloquim, Stability of Plate and Shell Structures, Dubas, P., Vandepitte D., eds., 6-8 April, Ghent, Belgium, 85-94
a uncertain value
Table C.6 Oxfort, J. and Gauger, H. -U. (1989). Beultraglast von Vollwandträgern unter Einzellasten, Stahlbau, 58(11), 331-339
2046 C13 7,31 800 378 20,2 200 363 2300 280 375 1574
2047 C14 7,33 800 378 20,2 200 363 2300 280 204 1698
2048 C15 6,42 800 373 20,1 199 363 2300 280 572 859
2049 C21 7,41 800 378 30,9 299 329 2300 280 806 2072
2050 C22 7,4 800 378 30,3 301 329 2300 280 314 2466
2051 C23 7,46 800 378 30,3 299 329 2300 280 623 2378
2052 C24 7,45 800 378 30,2 298 329 2300 280 500 2581
2053 C25 6,34 800 373 30,2 300 329 2300 280 631 951
Nr Nr inref
twmm
hwmm
fywMPa
tfmm
bfmm
fyfa
MPaa
mmss
mmFukN
MskNm
2054 AL-1 6 1000 319 9 300 320 1000 300 332 747
2055 AL-2 6 1000 320 9 300 320 1000 500 355 799
2056 AS-1 6 1000 320 9 300 320 1000 300 353 529
2057 AS-2 6 1000 325 9 300 320 1000 500 480 720
2058 BL-1 6 1000 340 9 300 320 600 180 274 616
2059 BL-2 6 1000 405 9 300 320 600 300 352 792
2060 BL-2C 6 1000 365 9 300 320 600 300 326 733
2061 BS-1 6 1000 320 9 300 320 600 180 356 533
Nr Nr inref
twmm
hwmm
fywMPa
tfmm
bfmm
fyfMPa
amm
ssmm
FukN
MskNm
2062 V1 11,8 1300 215 38,3 302 195 2000 100 888 2334
2063 V2 7,7 1300 339 38,1 261 329 2000 100 663 2975
Nr Nr inref
twmm
hwmm
fywMPa
tfmm
bfmm
fyfMPa
amm
ssmm
FukN
MskNm
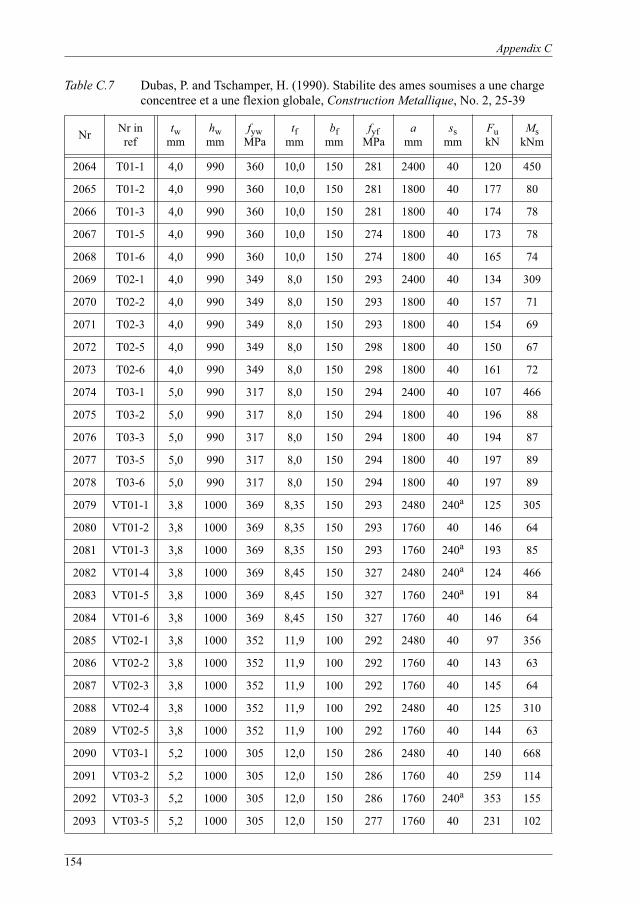
Appendix C
154
Table C.7 Dubas, P. and Tschamper, H. (1990). Stabilite des ames soumises a une charge concentree et a une flexion globale, Construction Metallique, No. 2, 25-39
Nr Nr inref
twmm
hwmm
fywMPa
tfmm
bfmm
fyfMPa
amm
ssmm
FukN
MskNm
2064 T01-1 4,0 990 360 10,0 150 281 2400 40 120 450
2065 T01-2 4,0 990 360 10,0 150 281 1800 40 177 80
2066 T01-3 4,0 990 360 10,0 150 281 1800 40 174 78
2067 T01-5 4,0 990 360 10,0 150 274 1800 40 173 78
2068 T01-6 4,0 990 360 10,0 150 274 1800 40 165 74
2069 T02-1 4,0 990 349 8,0 150 293 2400 40 134 309
2070 T02-2 4,0 990 349 8,0 150 293 1800 40 157 71
2071 T02-3 4,0 990 349 8,0 150 293 1800 40 154 69
2072 T02-5 4,0 990 349 8,0 150 298 1800 40 150 67
2073 T02-6 4,0 990 349 8,0 150 298 1800 40 161 72
2074 T03-1 5,0 990 317 8,0 150 294 2400 40 107 466
2075 T03-2 5,0 990 317 8,0 150 294 1800 40 196 88
2076 T03-3 5,0 990 317 8,0 150 294 1800 40 194 87
2077 T03-5 5,0 990 317 8,0 150 294 1800 40 197 89
2078 T03-6 5,0 990 317 8,0 150 294 1800 40 197 89
2079 VT01-1 3,8 1000 369 8,35 150 293 2480 240a 125 305
2080 VT01-2 3,8 1000 369 8,35 150 293 1760 40 146 64
2081 VT01-3 3,8 1000 369 8,35 150 293 1760 240a 193 85
2082 VT01-4 3,8 1000 369 8,45 150 327 2480 240a 124 466
2083 VT01-5 3,8 1000 369 8,45 150 327 1760 240a 191 84
2084 VT01-6 3,8 1000 369 8,45 150 327 1760 40 146 64
2085 VT02-1 3,8 1000 352 11,9 100 292 2480 40 97 356
2086 VT02-2 3,8 1000 352 11,9 100 292 1760 40 143 63
2087 VT02-3 3,8 1000 352 11,9 100 292 1760 40 145 64
2088 VT02-4 3,8 1000 352 11,9 100 292 2480 40 125 310
2089 VT02-5 3,8 1000 352 11,9 100 292 1760 40 144 63
2090 VT03-1 5,2 1000 305 12,0 150 286 2480 40 140 668
2091 VT03-2 5,2 1000 305 12,0 150 286 1760 40 259 114
2092 VT03-3 5,2 1000 305 12,0 150 286 1760 240a 353 155
2093 VT03-5 5,2 1000 305 12,0 150 277 1760 40 231 102
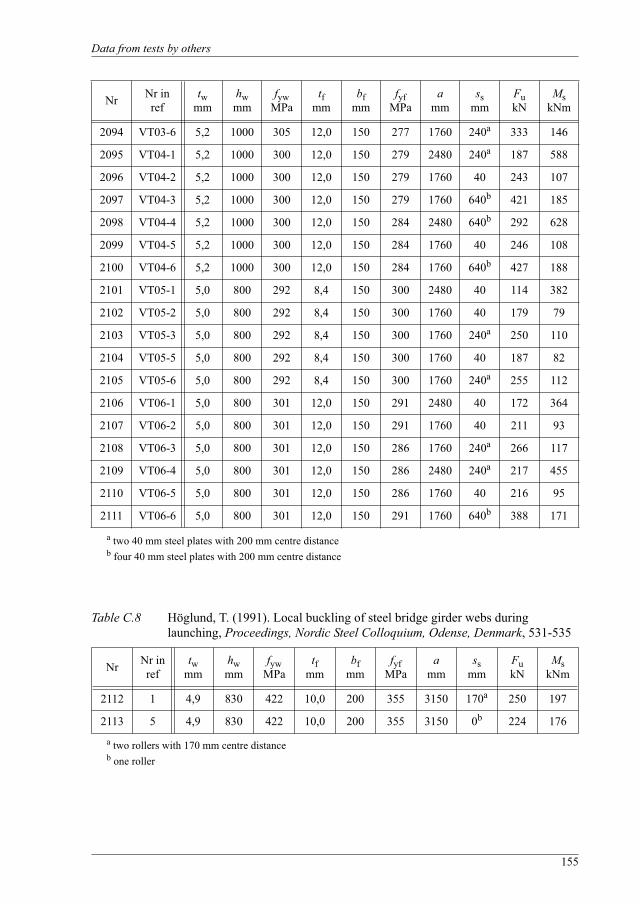
Data from tests by others
155
a two 40 mm steel plates with 200 mm centre distanceb four 40 mm steel plates with 200 mm centre distance
Table C.8 Höglund, T. (1991). Local buckling of steel bridge girder webs during launching, Proceedings, Nordic Steel Colloquium, Odense, Denmark, 531-535
a two rollers with 170 mm centre distanceb one roller
2094 VT03-6 5,2 1000 305 12,0 150 277 1760 240a 333 146
2095 VT04-1 5,2 1000 300 12,0 150 279 2480 240a 187 588
2096 VT04-2 5,2 1000 300 12,0 150 279 1760 40 243 107
2097 VT04-3 5,2 1000 300 12,0 150 279 1760 640b 421 185
2098 VT04-4 5,2 1000 300 12,0 150 284 2480 640b 292 628
2099 VT04-5 5,2 1000 300 12,0 150 284 1760 40 246 108
2100 VT04-6 5,2 1000 300 12,0 150 284 1760 640b 427 188
2101 VT05-1 5,0 800 292 8,4 150 300 2480 40 114 382
2102 VT05-2 5,0 800 292 8,4 150 300 1760 40 179 79
2103 VT05-3 5,0 800 292 8,4 150 300 1760 240a 250 110
2104 VT05-5 5,0 800 292 8,4 150 300 1760 40 187 82
2105 VT05-6 5,0 800 292 8,4 150 300 1760 240a 255 112
2106 VT06-1 5,0 800 301 12,0 150 291 2480 40 172 364
2107 VT06-2 5,0 800 301 12,0 150 291 1760 40 211 93
2108 VT06-3 5,0 800 301 12,0 150 286 1760 240a 266 117
2109 VT06-4 5,0 800 301 12,0 150 286 2480 240a 217 455
2110 VT06-5 5,0 800 301 12,0 150 286 1760 40 216 95
2111 VT06-6 5,0 800 301 12,0 150 291 1760 640b 388 171
Nr Nr inref
twmm
hwmm
fywMPa
tfmm
bfmm
fyfMPa
amm
ssmm
FukN
MskNm
2112 1 4,9 830 422 10,0 200 355 3150 170a 250 197
2113 5 4,9 830 422 10,0 200 355 3150 0b 224 176
Nr Nr inref
twmm
hwmm
fywMPa
tfmm
bfmm
fyfMPa
amm
ssmm
FukN
MskNm
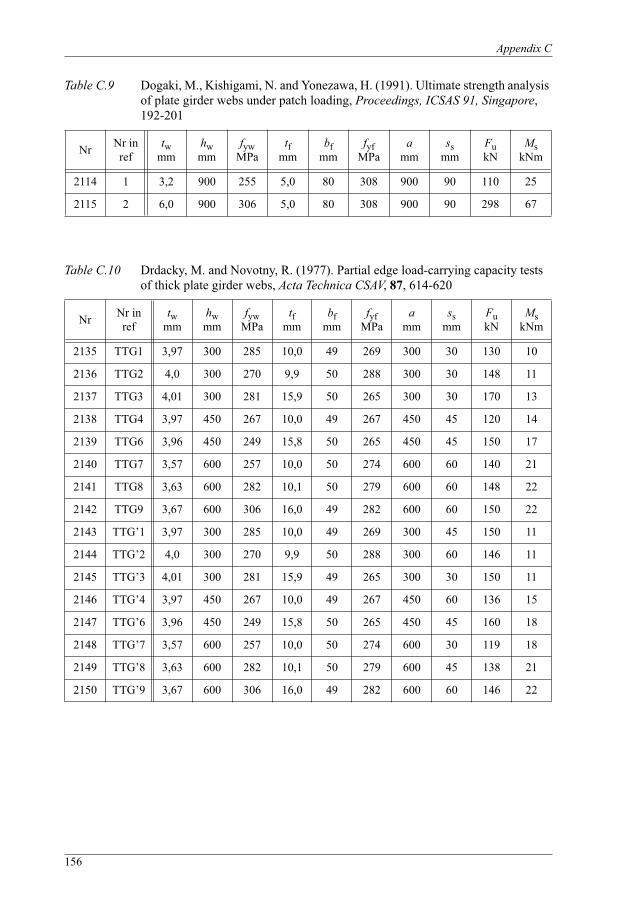
Appendix C
156
Table C.9 Dogaki, M., Kishigami, N. and Yonezawa, H. (1991). Ultimate strength analysis of plate girder webs under patch loading, Proceedings, ICSAS 91, Singapore,192-201
Table C.10 Drdacky, M. and Novotny, R. (1977). Partial edge load-carrying capacity tests of thick plate girder webs, Acta Technica CSAV, 87, 614-620
Nr Nr inref
twmm
hwmm
fywMPa
tfmm
bfmm
fyfMPa
amm
ssmm
FukN
MskNm
2114 1 3,2 900 255 5,0 80 308 900 90 110 25
2115 2 6,0 900 306 5,0 80 308 900 90 298 67
Nr Nr inref
twmm
hwmm
fywMPa
tfmm
bfmm
fyfMPa
amm
ssmm
FukN
MskNm
2135 TTG1 3,97 300 285 10,0 49 269 300 30 130 10
2136 TTG2 4,0 300 270 9,9 50 288 300 30 148 11
2137 TTG3 4,01 300 281 15,9 50 265 300 30 170 13
2138 TTG4 3,97 450 267 10,0 49 267 450 45 120 14
2139 TTG6 3,96 450 249 15,8 50 265 450 45 150 17
2140 TTG7 3,57 600 257 10,0 50 274 600 60 140 21
2141 TTG8 3,63 600 282 10,1 50 279 600 60 148 22
2142 TTG9 3,67 600 306 16,0 49 282 600 60 150 22
2143 TTG’1 3,97 300 285 10,0 49 269 300 45 150 11
2144 TTG’2 4,0 300 270 9,9 50 288 300 60 146 11
2145 TTG’3 4,01 300 281 15,9 49 265 300 30 150 11
2146 TTG’4 3,97 450 267 10,0 49 267 450 60 136 15
2147 TTG’6 3,96 450 249 15,8 50 265 450 45 160 18
2148 TTG’7 3,57 600 257 10,0 50 274 600 30 119 18
2149 TTG’8 3,63 600 282 10,1 50 279 600 45 138 21
2150 TTG’9 3,67 600 306 16,0 49 282 600 60 146 22
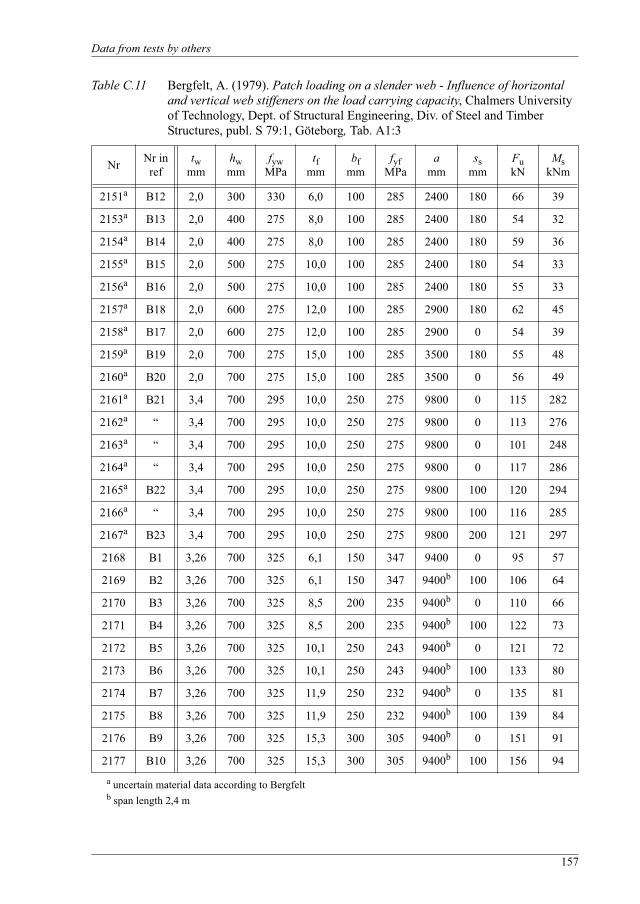
Data from tests by others
157
Table C.11 Bergfelt, A. (1979). Patch loading on a slender web - Influence of horizontal and vertical web stiffeners on the load carrying capacity, Chalmers University of Technology, Dept. of Structural Engineering, Div. of Steel and Timber Structures, publ. S 79:1, Göteborg, Tab. A1:3
a uncertain material data according to Bergfeltb span length 2,4 m
Nr Nr inref
twmm
hwmm
fywMPa
tfmm
bfmm
fyfMPa
amm
ssmm
FukN
MskNm
2151a B12 2,0 300 330 6,0 100 285 2400 180 66 39
2153a B13 2,0 400 275 8,0 100 285 2400 180 54 32
2154a B14 2,0 400 275 8,0 100 285 2400 180 59 36
2155a B15 2,0 500 275 10,0 100 285 2400 180 54 33
2156a B16 2,0 500 275 10,0 100 285 2400 180 55 33
2157a B18 2,0 600 275 12,0 100 285 2900 180 62 45
2158a B17 2,0 600 275 12,0 100 285 2900 0 54 39
2159a B19 2,0 700 275 15,0 100 285 3500 180 55 48
2160a B20 2,0 700 275 15,0 100 285 3500 0 56 49
2161a B21 3,4 700 295 10,0 250 275 9800 0 115 282
2162a “ 3,4 700 295 10,0 250 275 9800 0 113 276
2163a “ 3,4 700 295 10,0 250 275 9800 0 101 248
2164a “ 3,4 700 295 10,0 250 275 9800 0 117 286
2165a B22 3,4 700 295 10,0 250 275 9800 100 120 294
2166a “ 3,4 700 295 10,0 250 275 9800 100 116 285
2167a B23 3,4 700 295 10,0 250 275 9800 200 121 297
2168 B1 3,26 700 325 6,1 150 347 9400 0 95 57
2169 B2 3,26 700 325 6,1 150 347 9400b 100 106 64
2170 B3 3,26 700 325 8,5 200 235 9400b 0 110 66
2171 B4 3,26 700 325 8,5 200 235 9400b 100 122 73
2172 B5 3,26 700 325 10,1 250 243 9400b 0 121 72
2173 B6 3,26 700 325 10,1 250 243 9400b 100 133 80
2174 B7 3,26 700 325 11,9 250 232 9400b 0 135 81
2175 B8 3,26 700 325 11,9 250 232 9400b 100 139 84
2176 B9 3,26 700 325 15,3 300 305 9400b 0 151 91
2177 B10 3,26 700 325 15,3 300 305 9400b 100 156 94
Appendix C
158
Table C.12 Bergfelt, A. (1979). Patch loading on a slender web - Influence of horizontal and vertical web stiffeners on the load carrying capacity, Chalmers University of Technology, Dept. of Structural Engineering, Div. of Steel and Timber Structures, publ. S 79:1, Göteborg, ser. A, B, R, Tab. 1
Nr Nr inref
twmm
hwmm
fywMPa
tfmm
bfmm
fyfMPa
amm
ssmm
FukN
MskNm
2178 R1 2,05 800 266 15,5 300 295 800 40 60 12
2179 R12 2,05 800 266 15,5 300 295 800 40 66 13
2180 R3 2,0 800 266 5,07 120 285 800 40 38 7,6
2181 R32 2,0 800 266 5,07 120 285 800 40 41 8,2
2182 A11 2,12 800 300 15,4 300 295 2500 40 64 8
2183 A13 2,12 800 300 15,4 300 295 1200 40 66 20
2184 A21 3,03 800 245 12,0 250 265 2500 40 84 17
2185 A23 3,03 800 245 12,0 250 265 1200 40 85 26
2186 A31 2,08 680 354 5,05 120 290 2200 40 47,1 56
2187 A33 2,08 680 354 5,05 120 290 1020 40 50,7 13
2188 B8 2,07 800 285 5,03 120 290 800 40 48 9,6
2189 B6 2,07 600 285 5,03 120 290 800 40 42 8,4
2190 B4 2,07 400 285 5,03 120 290 800 40 48 9,6
2191 B3 2,07 300 285 5,03 120 290 800 40 49 9,8
2192 B41 2,07 400 285 5,03 120 290 400 40 53 5,3
2193 B31 2,07 300 285 5,03 120 290 400 40 51 5,1
2194 B83 2,9 800 328 12,4 250 298 800 40 121 24
2195 B63 2,9 600 328 12,4 250 298 800 40 120 24
2196 B43 2,9 400 328 12,4 250 298 800 40 119 24
2197 A15 2,12 800 300 15,4 300 295 600 40 84 13
2198 A25 3,03 800 245 12,0 250 265 600 40 96,8 14
2199 A35 2,08 680 354 5,05 120 290 510 40 51,5 6,6

Data from tests by others
159
Table C.13 Bergfelt, A. (1979). Patch loading on a slender web - Influence of horizontal and vertical web stiffeners on the load carrying capacity, Chalmers University of Technology, Dept. of Structural Engineering, Div. of Steel and Timber Structures, publ. S 79:1, Göteborg, Tab. A1:1
Nr Nr inref
twmm
hwmm
fywMPa
tfmm
bfmm
fyfMPa
amm
ssmm
Fua
kNMs
kNm
2200 IaBp 3,26 700 332 6,0 150 354 2400 100 106 64
2201 IaBae 3,26 700 332 6,0 150 354 1400 0 95,2 33
2202 IaCe 3,26 700 332 8,0 200 240 2400 0 110 66
2203 IaFp 3,26 700 332 8,0 200 240 2400 100 101 61
2204 IaCu,p 3,26 700 332 10,0 250 248 2400 100 134 81
2205 IaGu,e 3,26 700 332 10,0 250 248 2400 0 121 72
2206 IaDp 3,26 700 332 12,0 250 237 2400 100 99,1 59
2207 IaGe 3,26 700 332 12,0 250 237 2400 0 135 81
2208 IaEp 3,26 700 332 15,0 300 311 2400 100 155 93
2209 IaHce 3,26 700 332 15,0 300 311 2400 0 151 91
2210 IaH2e 3,26 700 332 15,0 300 311 2400 0 150 90
2211 IaBu,p 3,26 700 332 10,0 250 248 9400 100 128 302
2212 IaEu,e 3,26 700 332 10,0 250 248 9400 0 102 240
2213 Ib1e 3,26 700 332 6,0 152 279 9400 0 62,8 148
2214 Ib3p 3,26 700 332 6,0 152 279 9400 100 86,8 204
2215 Ib5e 3,26 700 332 6,0 152 279 2400 0 90,3 54
2216 Ib6p 3,26 700 332 6,0 152 279 2400 50 98,1 59
2217 Ic1e 2,91 700 310 6,0 150 294 9400 0 58,9 138
2218 Ic4e 2,91 700 310 5,9 151 294 2400 0 65,7 39
2219 Ic5p 2,91 700 310 5,9 151 294 2400 100 81,4 49
2220 II1e 3,05 700 309 12,1 251 815 2400 0 107 64
2221 II2p 3,08 700 305 8,2 200 705 2400 100 83,4 50
2222 II3e 3,08 700 305 6,8 151 788 2400 0 67,7 41
2223 II4e 2,9 700 600 6,8 152 788 2400 0 113 68
2224 II5e 2,9 700 600 8,1 200 705 2400 0 135 81
2225 II7e 2,9 700 600 2,9 100 600 2400 0 55,4 33
2226 III1e 2,1 500 355 3,9 151 288 2400 0 39,7 24
2227 III2e 2,1 500 355 8,6 203 328 2400 0 57,9 35
2228 III3e 2,1 500 355 9,8 253 269 2400 0 66,7 40
Appendix C
160
a test results from the first loading cycle close to ultimate load
Table C.14 Bergfelt, A. (1979). Patch loading on a slender web - Influence of horizontal and vertical web stiffeners on the load carrying capacity, Chalmers University of Technology, Dept. of Structural Engineering, Div. of Steel and Timber Structures, publ. S 79:1, Göteborg, Tab. A1:2
2229 III4e 2,1 500 355 5,9 151 282 2400 0 47,6 29
2230 III5p 2,1 500 355 8,6 203 323 2400 100 63,3 38
2231 III6p 2,1 500 355 3,9 151 288 2400 100 53,5 32
2232 III7p 2,1 500 355 9,9 253 269 2400 100 63,8 38
2233 III8p 2,1 500 355 5,9 151 282 2400 100 59,8 36
2234 III9p 2,1 500 355 5,9 150 282 9600 100 40,7 98
2235 III10e 2,1 500 355 6 151 282 9600 0 41,7 100
2236 IV1e 5,83 700 329 5,9 151 289 2400 0 178 107
2237 IV2e 5,83 700 329 8,7 203 328 2400 0 244 147
2238 IV3e 5,83 700 329 11,6 251 248 2400 0 280 168
2239 IV4e 5,83 700 329 17,7 355 263 2400 0 363 218
2240 IV5p 5,83 700 329 8,7 202 328 2400 100 291 175
2241 IV6p 5,83 700 329 11,7 253 248 2400 100 343 206
2242 IV7p 5,83 700 329 18,3 350 274 2400 100 417 250
2243 IV14p 5,83 700 329 11,7 251 248 2400 100 356 214
2244 IV17e 5,83 700 329 11,7 251 250 9600 0 212 509
Nr Nr inref
twmm
hwmm
fywMPa
tfmm
bfmm
fyfMPa
amm
ssmm
Fua
kNMs
kNm
2245 IaBe 3,26 700 332 6,0 150 354 2400 0 95,2 57
2246 IaCp 3,26 700 332 8,0 200 240 2400 100 122 73
2247 IaFe 3,26 700 332 8,0 200 240 2400 0 101 61
2248 IaCu,e 3,26 700 332 10,0 250 248 2400 0 121 72
2249 IaGu,p 3,26 700 332 10,0 250 248 2400 100 132 79
2250 IaDe 3,26 700 332 12,0 250 237 2400 0 117 70
2251 IaGp 3,26 700 332 12,0 250 237 2400 100 139 84
2252 IaEe 3,26 700 332 15,0 300 311 2400 0 153 92
Nr Nr inref
twmm
hwmm
fywMPa
tfmm
bfmm
fyfMPa
amm
ssmm
Fua
kNMs
kNm
Data from tests by others
161
2253 IaH2p 3,26 700 332 15,0 300 311 2400 100 158 95
2254 IaBu,e 3,26 700 332 10,0 250 248 9400 0 118 277
2255 IaEu,p 3,26 700 332 10,0 250 248 9400 100 118 277
2256 II1p 3,05 700 308 12,1 251 815 2400 100 108 65
2257 II2e 3,08 700 305 8,2 200 705 2400 0 78,5 47
2258 II3p 3,08 700 305 6,8 151 788 2400 100 70,6 42
2259 II4p 2,9 700 600 6,8 152 788 2400 100 126 76
2260 II5p 2,9 700 600 8,1 200 705 2400 100 140 84
2261 II6e 2,9 700 600 12,1 250 815 2400 0 149 89
2262 II6p 2,9 700 600 12,1 250 815 2400 100 158 95
2263 II7p 2,9 700 600 2,9 100 600 2400 100 59,8 36
2264 II7b,e 3,03 700 316 2,9 100 600 400 0 63,3 6,3
2265 II7b,p 3,03 700 316 2,9 100 600 400 100 80,9 8,1
2266 II8e 3,08 700 305 8,1 201 705 9600 0 88,3 212
2267 II9e 2,9 700 600 6,6 151 788 9600 0 73,6 177
2268 II11e 2,9 700 600 8,1 201 705 9600 0 99,1 238
2269 II51p 2,11 500 355 3,94 151 288 2400 100 45,1 27
2270 II52p 2,11 500 355 8,58 203 328 2400 100 59,8 36
2271 II53p 2,09 500 355 9,83 253 269 2400 100 69,7 42
2272 II54p 2,09 500 355 5,86 151 282 2400 100 52,5 32
2273 II55e 2,12 500 355 8,62 203 323 2400 0 56,9 34
2274 II56e 2,12 500 355 3,94 151 288 2400 0 43,2 26
2275 II57e 2,1 500 355 9,98 253 269 2400 0 58,9 35
2276 II58e 2,11 500 355 5,9 151 282 2400 0 40,2 24
2277 II59e 2,09 500 355 5,88 150 282 9600 0 39,7 95
2278 II510p 2,12 500 355 5,98 151 282 9600 100 43,9 105
2279 IV1p 5,83 700 329 5,93 151 289 2400 100 240 144
2280 IV1e 5,83 700 329 5,93 151 289 2400 0 169 101
2281 IV2p 5,83 700 329 8,66 203 328 2400 100 29 176
2282 IV3p 5,83 700 329 11,6 251 248 2400 100 324 194
2283 IV4p 5,83 700 329 17,7 355 263 2400 100 376 225
Nr Nr inref
twmm
hwmm
fywMPa
tfmm
bfmm
fyfMPa
amm
ssmm
Fua
kNMs
kNm
Appendix C
162
a test results from the second, or later, loading cycle close to ultimate load
Table C.15 Bergfelt, A. (1983).Girder web stiffening for patch loading, Chalmers University of Technology, Dept. of Structural Engineering, Div. of Steel and Timber Structures, publ., S 83:1, Göteborg
a0,2
2284 IV5e 5,83 700 329 8,69 202 328 2400 0 215 129
2285 IV6e 5,83 700 329 11,7 253 248 2400 0 235 141
2286 IV7e 5,83 700 329 18,3 350 274 2400 0 373 224
2287 IV14e 5,83 700 329 11,7 251 248 2400 0 274 164
Nr Nr inref
twmm
hwmm
fywa
MPatf
mmbf
mmfyf
MPaa
mmss
mmFukN
MskNm
2288 324 2,0 300 207 6,1 100 277 2400 40 39,8 24
2289 325 2,0 300 207 6,1 100 277 900 40 34,1 7,7
2290 326 2,0 300 207 6,1 100 277 900 120 38,3 8,6
2291 624 2,0 600 206 6,1 100 284 2400 40 35 21
2292 625 2,0 600 206 6,1 100 284 900 40 31 7
2293 626 2,0 600 206 6,1 100 284 900 120 37,5 8,4
2294 424 2,0 400 205 12,2 100 278 3000 40 40,7 30
2295 425 2,0 400 205 12,2 100 278 1100 40 36,9 10
2296 426 2,0 400 205 12,2 100 278 1100 120 42,1 12
2297 824 2,0 800 205 12,1 100 277 3000 40 41,9 31
2298 825 2,0 800 205 12,1 100 277 1100 40 40,5 11
2299 826 2,0 800 205 12,1 100 277 1100 120 46,5 13
2300 827 2,0 800 206 12,3 250 273 3000 40 38,2 29
2301 828 2,0 800 206 12,3 250 273 1100 40 41,4 11
2302 829 2,0 800 206 12,3 250 273 1100 120 41,4 11
2303 837 3,0 800 215 12 250 268 3000 40 81,5 61
2304 838 3,0 800 215 12 250 268 1100 40 90,7 25
2305 839 3,0 800 215 12 250 268 1100 120 92,5 25
Nr Nr inref
twmm
hwmm
fywMPa
tfmm
bfmm
fyfMPa
amm
ssmm
Fua
kNMs
kNm
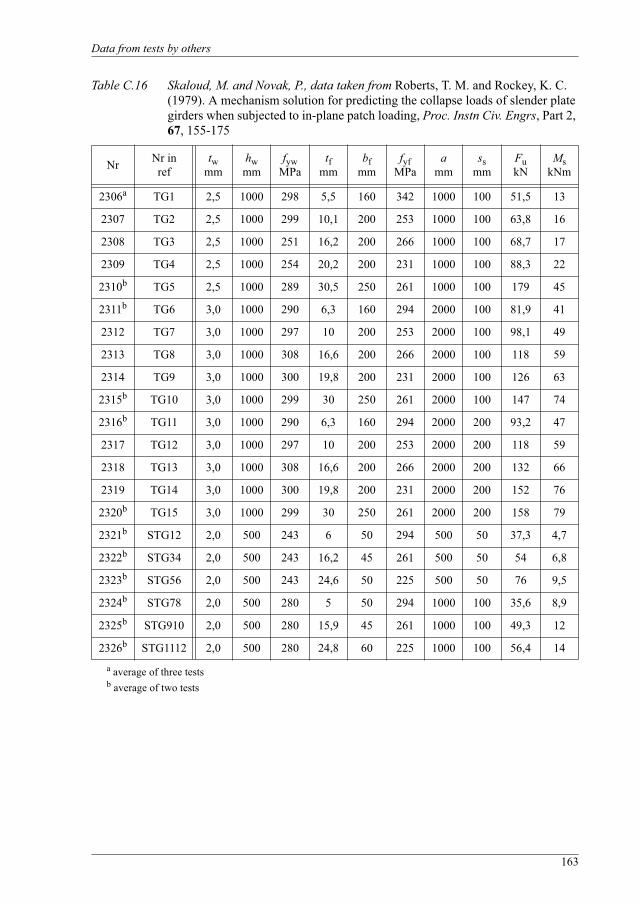
Data from tests by others
163
Table C.16 Skaloud, M. and Novak, P., data taken from Roberts, T. M. and Rockey, K. C. (1979). A mechanism solution for predicting the collapse loads of slender plate girders when subjected to in-plane patch loading, Proc. Instn Civ. Engrs, Part 2, 67, 155-175
a average of three testsb average of two tests
Nr Nr inref
twmm
hwmm
fywMPa
tfmm
bfmm
fyfMPa
amm
ssmm
FukN
MskNm
2306a TG1 2,5 1000 298 5,5 160 342 1000 100 51,5 13
2307 TG2 2,5 1000 299 10,1 200 253 1000 100 63,8 16
2308 TG3 2,5 1000 251 16,2 200 266 1000 100 68,7 17
2309 TG4 2,5 1000 254 20,2 200 231 1000 100 88,3 22
2310b TG5 2,5 1000 289 30,5 250 261 1000 100 179 45
2311b TG6 3,0 1000 290 6,3 160 294 2000 100 81,9 41
2312 TG7 3,0 1000 297 10 200 253 2000 100 98,1 49
2313 TG8 3,0 1000 308 16,6 200 266 2000 100 118 59
2314 TG9 3,0 1000 300 19,8 200 231 2000 100 126 63
2315b TG10 3,0 1000 299 30 250 261 2000 100 147 74
2316b TG11 3,0 1000 290 6,3 160 294 2000 200 93,2 47
2317 TG12 3,0 1000 297 10 200 253 2000 200 118 59
2318 TG13 3,0 1000 308 16,6 200 266 2000 200 132 66
2319 TG14 3,0 1000 300 19,8 200 231 2000 200 152 76
2320b TG15 3,0 1000 299 30 250 261 2000 200 158 79
2321b STG12 2,0 500 243 6 50 294 500 50 37,3 4,7
2322b STG34 2,0 500 243 16,2 45 261 500 50 54 6,8
2323b STG56 2,0 500 243 24,6 50 225 500 50 76 9,5
2324b STG78 2,0 500 280 5 50 294 1000 100 35,6 8,9
2325b STG910 2,0 500 280 15,9 45 261 1000 100 49,3 12
2326b STG1112 2,0 500 280 24,8 60 225 1000 100 56,4 14

Appendix C
164
Table C.17 Bagchi, D. K. and Rockey K. C., data from Roberts, T. M. and Rockey, K. C. (1979). A mechanism solution for predicting the collapse loads of slender plate girders when subjected to in-plane patch loading, Proc. Instn Civ. Engrs, Part 2, 67, 155-175
Table C.18 Roberts, T. M. (1981). Slender plate girders subjected to edge loading, Proc. Instn Civ. Engrs, Part 2, 71, 805-819
Nr Nr inref
twmm
hwmm
fywMPa
tfmm
bfmm
fyfMPa
amm
ssmm
FukN
MskNm
2327 BR1 3,25 635 250 12,7 152 250 660 75 141 23
2328 BR2 3,25 635 250 12,7 152 250 864 50 124 27
2329 BR3 3,25 635 250 12,7 152 250 1270 50 89,4 28
Nr Nr inref
twmm
hwmm
fywMPa
tfmm
bfmm
fyfMPa
amm
ssmm
FukN
MskNm
2330 A1-3 0,99 250 193 3,05 149 221 600 50 9,02 1,4
2331 A1-7 0,99 250 193 6,75 149 279 600 50 11,5 1,7
2332 A1-12 0,99 250 193 11,8 149 305 600 50 27,8 4,2
2333 A2-3 2,12 250 224 3,05 149 221 600 50 32,6 4,9
2334 A2-7 2,12 250 224 6,75 149 279 600 50 42,2 6,3
2335 A2-12 2,12 250 224 11,8 149 305 600 50 52,8 7,9
2336 A3-3 3,05 250 221 3,05 149 221 600 50 79,7 12
2337 A3-7 3,05 250 221 6,75 149 279 600 50 101 15
2338 A3-12 3,05 250 221 11,8 149 305 600 50 129 19
2339 B1-3 0,99 500 192 3,05 149 221 600 50 8,45 1,3
2340 B1-7 0,99 500 192 6,75 149 279 600 50 10,8 1,6
2341 B1-12 0,99 500 192 11,8 149 305 600 50 28,8 4,3
2342 B2-2 2,12 500 224 3,05 149 221 600 50 34,1 5,1
2343 B2-7 2,12 500 224 6,75 149 279 600 50 37,9 5,7
2344 B2-12 2,12 500 224 11,8 149 305 600 50 44,2 6,6
2345 B2-20 2,12 500 224 20,1 149 305 600 50 84,5 13
2346 B3-3 3,05 500 221 3,05 149 221 600 50 70,6 11
2347 B3-7 3,05 500 221 6,75 149 279 600 50 90,7 14
2348 B3-12 3,05 500 221 11,8 149 305 600 50 111,4 17
2349 B3-20 3,05 500 221 20,1 149 305 600 50 131 20
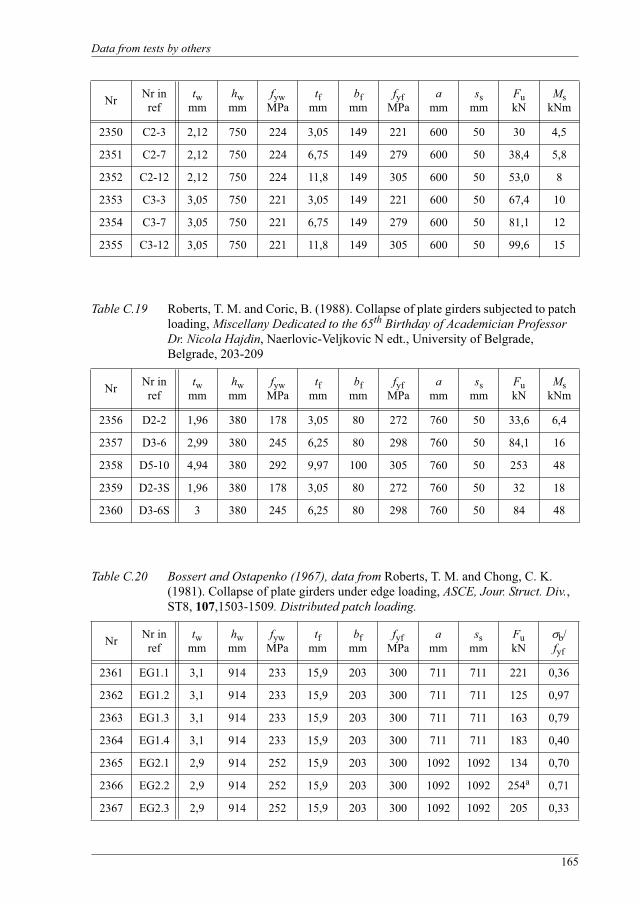
Data from tests by others
165
Table C.19 Roberts, T. M. and Coric, B. (1988). Collapse of plate girders subjected to patch loading, Miscellany Dedicated to the 65th Birthday of Academician Professor Dr. Nicola Hajdin, Naerlovic-Veljkovic N edt., University of Belgrade, Belgrade, 203-209
Table C.20 Bossert and Ostapenko (1967), data from Roberts, T. M. and Chong, C. K. (1981). Collapse of plate girders under edge loading, ASCE, Jour. Struct. Div.,ST8, 107,1503-1509. Distributed patch loading.
2350 C2-3 2,12 750 224 3,05 149 221 600 50 30 4,5
2351 C2-7 2,12 750 224 6,75 149 279 600 50 38,4 5,8
2352 C2-12 2,12 750 224 11,8 149 305 600 50 53,0 8
2353 C3-3 3,05 750 221 3,05 149 221 600 50 67,4 10
2354 C3-7 3,05 750 221 6,75 149 279 600 50 81,1 12
2355 C3-12 3,05 750 221 11,8 149 305 600 50 99,6 15
Nr Nr inref
twmm
hwmm
fywMPa
tfmm
bfmm
fyfMPa
amm
ssmm
FukN
MskNm
2356 D2-2 1,96 380 178 3,05 80 272 760 50 33,6 6,4
2357 D3-6 2,99 380 245 6,25 80 298 760 50 84,1 16
2358 D5-10 4,94 380 292 9,97 100 305 760 50 253 48
2359 D2-3S 1,96 380 178 3,05 80 272 760 50 32 18
2360 D3-6S 3 380 245 6,25 80 298 760 50 84 48
Nr Nr inref
twmm
hwmm
fywMPa
tfmm
bfmm
fyfMPa
amm
ssmm
FukN
b/fyf
2361 EG1.1 3,1 914 233 15,9 203 300 711 711 221 0,36
2362 EG1.2 3,1 914 233 15,9 203 300 711 711 125 0,97
2363 EG1.3 3,1 914 233 15,9 203 300 711 711 163 0,79
2364 EG1.4 3,1 914 233 15,9 203 300 711 711 183 0,40
2365 EG2.1 2,9 914 252 15,9 203 300 1092 1092 134 0,70
2366 EG2.2 2,9 914 252 15,9 203 300 1092 1092 254a 0,71
2367 EG2.3 2,9 914 252 15,9 203 300 1092 1092 205 0,33
Nr Nr inref
twmm
hwmm
fywMPa
tfmm
bfmm
fyfMPa
amm
ssmm
FukN
MskNm
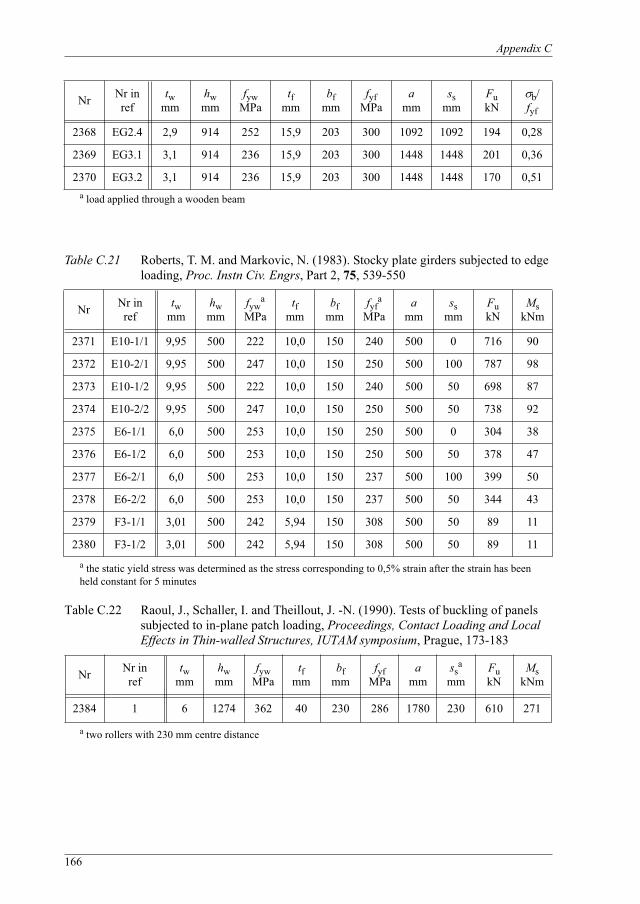
Appendix C
166
a load applied through a wooden beam
Table C.21 Roberts, T. M. and Markovic, N. (1983). Stocky plate girders subjected to edge loading, Proc. Instn Civ. Engrs, Part 2, 75, 539-550
a the static yield stress was determined as the stress corresponding to 0,5% strain after the strain has been held constant for 5 minutes
Table C.22 Raoul, J., Schaller, I. and Theillout, J. -N. (1990). Tests of buckling of panels subjected to in-plane patch loading, Proceedings, Contact Loading and Local Effects in Thin-walled Structures, IUTAM symposium, Prague, 173-183
a two rollers with 230 mm centre distance
2368 EG2.4 2,9 914 252 15,9 203 300 1092 1092 194 0,28
2369 EG3.1 3,1 914 236 15,9 203 300 1448 1448 201 0,36
2370 EG3.2 3,1 914 236 15,9 203 300 1448 1448 170 0,51
Nr Nr inref
twmm
hwmm
fywa
MPatf
mmbf
mmfyf
a
MPaa
mmss
mmFukN
MskNm
2371 E10-1/1 9,95 500 222 10,0 150 240 500 0 716 90
2372 E10-2/1 9,95 500 247 10,0 150 250 500 100 787 98
2373 E10-1/2 9,95 500 222 10,0 150 240 500 50 698 87
2374 E10-2/2 9,95 500 247 10,0 150 250 500 50 738 92
2375 E6-1/1 6,0 500 253 10,0 150 250 500 0 304 38
2376 E6-1/2 6,0 500 253 10,0 150 250 500 50 378 47
2377 E6-2/1 6,0 500 253 10,0 150 237 500 100 399 50
2378 E6-2/2 6,0 500 253 10,0 150 237 500 50 344 43
2379 F3-1/1 3,01 500 242 5,94 150 308 500 50 89 11
2380 F3-1/2 3,01 500 242 5,94 150 308 500 50 89 11
Nr Nr inref
twmm
hwmm
fywMPa
tfmm
bfmm
fyfMPa
amm
ssa
mmFukN
MskNm
2384 1 6 1274 362 40 230 286 1780 230 610 271
Nr Nr inref
twmm
hwmm
fywMPa
tfmm
bfmm
fyfMPa
amm
ssmm
FukN
b/fyf
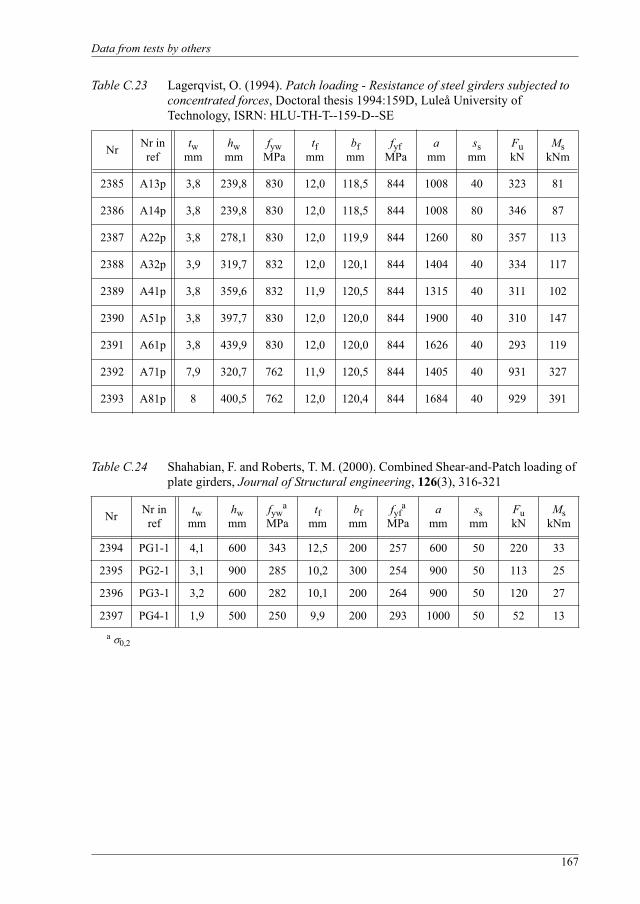
Data from tests by others
167
Table C.23 Lagerqvist, O. (1994). Patch loading - Resistance of steel girders subjected to concentrated forces, Doctoral thesis 1994:159D, Luleå University of Technology, ISRN: HLU-TH-T--159-D--SE
Table C.24 Shahabian, F. and Roberts, T. M. (2000). Combined Shear-and-Patch loading of plate girders, Journal of Structural engineering, 126(3), 316-321
a0,2
Nr Nr inref
twmm
hwmm
fywMPa
tfmm
bfmm
fyfMPa
amm
ssmm
FukN
MskNm
2385 A13p 3,8 239,8 830 12,0 118,5 844 1008 40 323 81
2386 A14p 3,8 239,8 830 12,0 118,5 844 1008 80 346 87
2387 A22p 3,8 278,1 830 12,0 119,9 844 1260 80 357 113
2388 A32p 3,9 319,7 832 12,0 120,1 844 1404 40 334 117
2389 A41p 3,8 359,6 832 11,9 120,5 844 1315 40 311 102
2390 A51p 3,8 397,7 830 12,0 120,0 844 1900 40 310 147
2391 A61p 3,8 439,9 830 12,0 120,0 844 1626 40 293 119
2392 A71p 7,9 320,7 762 11,9 120,5 844 1405 40 931 327
2393 A81p 8 400,5 762 12,0 120,4 844 1684 40 929 391
Nr Nr inref
twmm
hwmm
fywa
MPatf
mmbf
mmfyf
a
MPaa
mmss
mmFukN
MskNm
2394 PG1-1 4,1 600 343 12,5 200 257 600 50 220 33
2395 PG2-1 3,1 900 285 10,2 300 254 900 50 113 25
2396 PG3-1 3,2 600 282 10,1 200 264 900 50 120 27
2397 PG4-1 1,9 500 250 9,9 200 293 1000 50 52 13

Appendix C
168
Table C.25 Unosson, E. (2003). Patch loading of stainless steel girders - Experiments and finite element analyses, Licentiate thesis 2003:12, Luleå University of Technology, ISRN: LTU-LIC--03/12--SE
a Rp0,2b From test certificates delivered by the steel mill
Table C.26 Kuhlmann, U. and Seitz, M. (2004). Longitudinally stiffened girder webs subjected to patch loading, Steelbridge 2004, International Symposium on Steel Bridges, Millau, France
a upper yield strengthb four 100 mm wide loading plates with 200 mm centre distance
Nr Nr inref
twmm
hwmm
fywa
MPatf
mmbf
mmfyf
a
MPaa
mmss
mmFukN
MskNm
2398 Pli 4301:1 4,1 238,3 297 11,8 118,1 285 998 40 176 44
2399 Pli 4301:2 4,1 238,3 297 11,9 118,8 285 996 80 196 49
2400 Pli 4301:3 4,1 316,0 297 11,9 120,1 285 1397 40 168 59
2401 Pli 4301:4 4,1 438,4 297 12,0 121,1 285 1623 40 169 69
2402 Pli 4301:5 8,8 400,9 245b 12,0 120,5 285 1682 40 478 201
Nr Nr inref
twmm
hwmm
fywa
MPatf
mmbf
mmfyf
a
MPaa
mmss
b
mmFukN
MskNm
2403 I 6 1200 367 20 260 396 2400 700 659 395
169
APPENDIX D INFLUENCE OF VARIOUS PARAMETERS
Figure D.1 Fu/FR as a function of tw for 184 tests.
Figure D.2 Fu/FR as a function of a/hw for 184 tests.
0 1 2 3 4 5 6 7 8 9 10tw [mm]
0
0.5
1
1.5
2
2.5
3
F u/F
R
0 1 2 3 4 5 6 7 8a /hw
0
0.5
1
1.5
2
2.5
3
F u/F
R
Appendix D
170
Figure D.3 Fu/FR as a function of bf/tf for 184 tests.
Figure D.4 Fu/FR as a function of tf/tw for 184 tests.
0 5 10 15 20 25 30 35 40 45 50bf /tf
0
0.5
1
1.5
2
2.5
3
F u/F
R
0 1 2 3 4 5 6 7 8 9 10 11 12 13tf /tw
0
0.5
1
1.5
2
2.5
3
F u/F
R
Influence of various parameters
171
Figure D.5 Fu/FR as a function of hw/tw for 184 tests.
Figure D.6 Fu/FR as a function of fyf/fyw for 184 tests.
0 50 100 150 200 250 300 350 400hw /tw
0
0.5
1
1.5
2
2.5
3
F u/F
R
0 0.2 0.4 0.6 0.8 1 1.2 1.4 1.6 1.8 2fyf /fyw
0
0.5
1
1.5
2
2.5
3
F u/F
R

Appendix D
172
173
APPENDIX E ANNEX D OF EN 1990 (2002)
Here, the method for determination of the partial factor that should be applied to the resistance according to Annex D of EN 1990 (2002), will be described.
The statistical evaluation is initiated by the determination of a resistance function on the form
(E.1)
where grt is the resistance formulae proposed in Equations (5.22) - (5.28). X are the relevant basic variables that affect the resistance. In this stage measured values on the variables are used.
The theoretical resistance for each test, rti, is compared to the test results, rei, and the mean value of the correction factor b is estimated as the least square best-fit to the results according to
(E.2)
The probabilistic model for the resistance, r, can be represented as
(E.3)
in which is an error term.
The mean value of the theoretical resistance function, calculated using the mean values Xm of the basic variables, is obtained from
(E.4)
The next step is to estimate the coefficient of variation of the error term, . i for each experimental value rei is determined from
(E.5)
From the values of i an estimated value for the coefficient of variation of the error, is determined with Equations (E.6) - (E.9).
rt grt X=
bre rt
rt2
-------------------=
r b rt=
rm b rt Xm b grt Xm= =
irei
b rti------------=
V
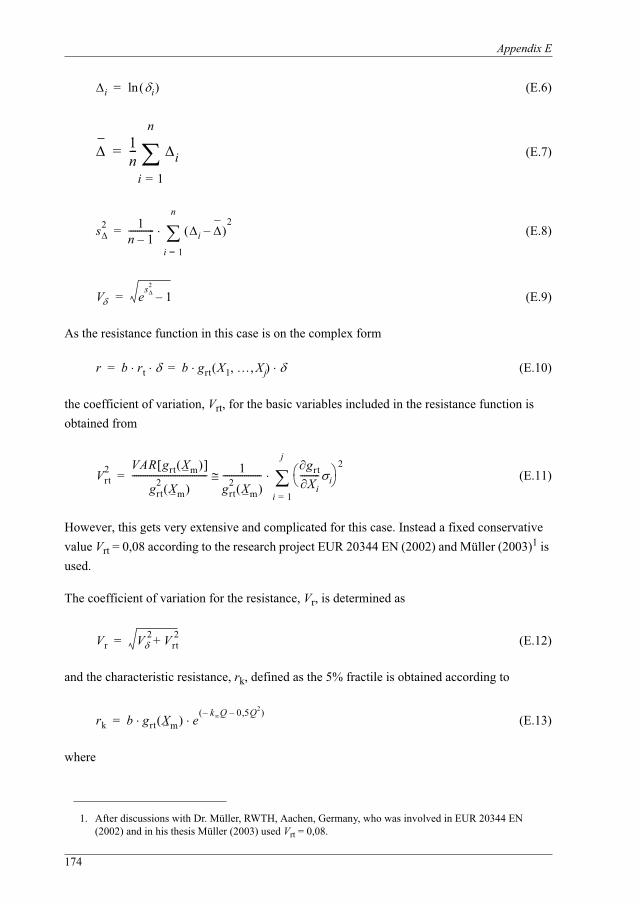
Appendix E
174
(E.6)
(E.7)
(E.8)
(E.9)
As the resistance function in this case is on the complex form
(E.10)
the coefficient of variation, Vrt, for the basic variables included in the resistance function is obtained from
(E.11)
However, this gets very extensive and complicated for this case. Instead a fixed conservative value Vrt = 0,08 according to the research project EUR 20344 EN (2002) and Müller (2003)1 is used.
The coefficient of variation for the resistance, Vr, is determined as
(E.12)
and the characteristic resistance, rk, defined as the 5% fractile is obtained according to
(E.13)
where
1. After discussions with Dr. Müller, RWTH, Aachen, Germany, who was involved in EUR 20344 EN (2002) and in his thesis Müller (2003) used Vrt = 0,08.
i iln=
1n--- i
i 1=
n
=
s2 1n 1–------------ i –
2
i 1=
n
=
V es2
1–=
r b rt b grt X1 Xj,= =
Vrt2 VAR grt Xm
grt2 Xm
----------------------------------- 1grt
2 Xm
------------------grtXi
--------- i
2
i 1=
j
=
Vr V 2 Vrt2+=
rk b grt Xm ek Q– 0 5Q2,–
=
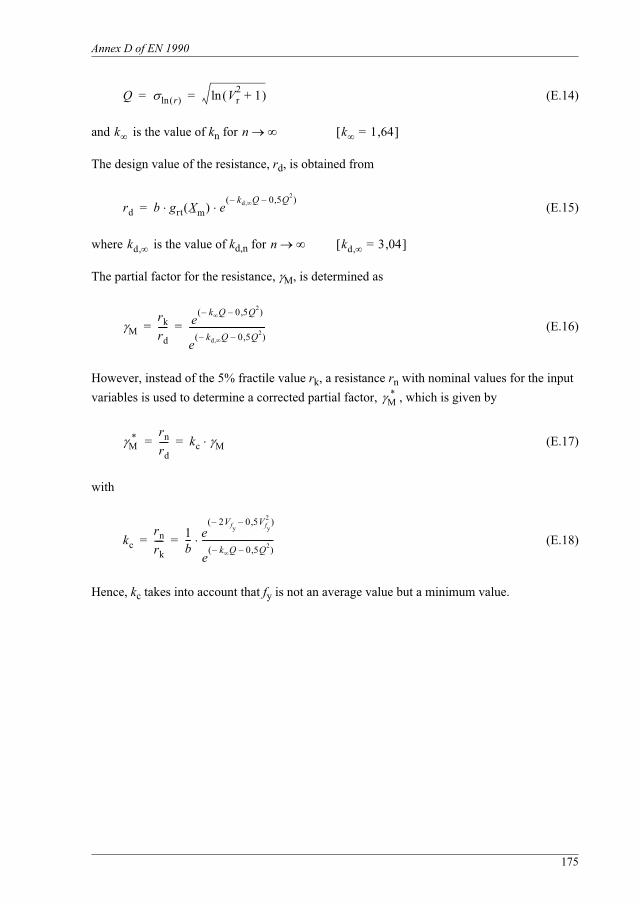
Annex D of EN 1990
175
(E.14)
and is the value of kn for
The design value of the resistance, rd, is obtained from
(E.15)
where is the value of kd,n for
The partial factor for the resistance, M, is determined as
(E.16)
However, instead of the 5% fractile value rk, a resistance rn with nominal values for the input variables is used to determine a corrected partial factor, , which is given by
(E.17)
with
(E.18)
Hence, kc takes into account that fy is not an average value but a minimum value.
Q rln Vr2 1+ln= =
k n k 1 64,=
rd b grt Xm ekd, Q– 0 5Q2,–
=
kd, n kd, 3 04,=
Mrkrd---- e
k Q– 0 5Q2,–
ekd, Q– 0 5Q2,–
-----------------------------------= =
M
Mrnrd---- kc M= =
kcrnrk---- 1
b--- e
2Vfy– 0 5Vfy
2,–
ek Q– 0 5Q2,–
---------------------------------= =

Appendix E
176