
Pataporn Sukontamarn London School of Economicssticerd.lse.ac.uk/dps/pepp/pepp10.pdf · Pataporn...
38
The Entry of NGO Schools and Girls’ Educational Outcomes in Bangladesh Pataporn Sukontamarn London School of Economics Political Economy and Public Policy Series The Suntory Centre Suntory and Toyota International Centres for Economics and Related Disciplines London School of Economics and Political Science Houghton Street London WC2A 2AE PEPP/10 July 2005 Tel: (020) 7955 6674 © The author. All rights reserved. Short sections of text, not to exceed two paragraphs, may be quoted without explicit permission provided that full credit, including © notice, is given to the source
Transcript of Pataporn Sukontamarn London School of Economicssticerd.lse.ac.uk/dps/pepp/pepp10.pdf · Pataporn...

The Entry of NGO Schools and Girls’ Educational Outcomes in Bangladesh
Pataporn Sukontamarn
London School of Economics
Political Economy and Public Policy Series The Suntory Centre Suntory and Toyota International Centres for Economics and Related Disciplines London School of Economics and Political Science Houghton Street London WC2A 2AE
PEPP/10 July 2005 Tel: (020) 7955 6674 © The author. All rights reserved. Short sections of text, not to exceed two paragraphs, may be quoted without explicit permission provided that full credit, including © notice, is given to the source

The Entry of NGO Schools and Girls’ EducationalOutcomes in Bangladesh
Pataporn Sukontamarn∗
London School of Economics†
January 2005
Abstract
This paper uses household, school, and test score data from Bangladeshto compare and contrast the effectiveness of NGO-run and state-run schoolsin the provision of primary education. I study how the entry of NGOs inprimary education has affected educational outcomes of girls and examine themechanisms which account for the relative performance of NGO versus stateschools in improving female educational outcomes. The results show that theentry of NGO schools has significantly increased girls’ enrollment as comparedto boys. Constructing cohorts from cross-sectional data using year of birth andyear of NGO school establishment, I show that cohorts which were exposed toNGO schools have higher probability of enrollment and the effect operatesmainly through girls. The two most prominent characteristics of NGO schoolsthat encourage girls’ enrollment are the high percentage of female teachers andhaving Parent-Teacher Associations (PTAs). NGO schools show strong effectsin improving children’s test scores.Keywords: NGOs, non-formal schools, girls’ education, Bangladesh.JEL classification: I21, O15.
∗I am most grateful to my supervisor, Robin Burgess, for his continuous guidance and support. Ihave also benefited from discussions with Shaheen Akter, Mohammad Asadullah, Oriana Bandiera,Nicholas Barr, Tim Besley, Frank Cowell, Jean Dreze, Maitreesh Ghatak, Altaf Hossain, GeetaKingdon, Shira Klien, Samir Nath, Imran Rasul, Paul Schultz, Pojanart Sunirand, researchers atBRAC’s Research and Evaluation Division, and seminar participants at EOPP, CSAE-STICERD,and CEPR workshops, and NEUDC 2003 conference. Financial support from the Department ofEconomics (LSE), and STICERD is gratefully acknowledged. All errors are my own.
†Address for correspondence: Department of Economics, London School of Economics, HoughtonStreet, London WC2A 2AE, United Kingdom. E-mail: [email protected]; tel: +44 (0)207955 6687; fax: +44 (0)207 955 6951.
1

1 Introduction
There has been a significant increase in the number and roles of non-governmentalorganizations (NGOs) around the world in the last few decades.1 In developingcountries NGOs have become heavily involved in the provision of public goods andservices including health care, education, and rural credit.2 As NGOs are rapidlybecoming important providers of public goods in developing countries, a key issue isto understand how they perform relative to the state.The objective of this paper is to examine how NGO expansion affects educational
attainment. Education is one area which has typically been preserved for the statebut has seen an increasing role for NGOs, where NGO involvement is often intendedto overcome state failure in the delivery of education. Whether and how NGOinvolvement affects educational outcomes is an important issue which has attractedthe interests of several researchers. For example, Miguel and Kremer (2003) find thatan NGO program of school-based mass treatment with deworming drugs in Kenyais effective in reducing school absenteeism. Banerjee et al. (2003) find an NGOremedial education program in India, where young women from the community arehired to teach children who lag behind in class, to be effective in improving children’stest scores. A school meals program implemented by an NGO is found to increaseschool participation in Kenya (Vermeersch, 2002).One of the key problems with studying NGOs and evaluating their effects relative
to the state is the fact that they are highly heterogeneous group. This motivated thepaper’s focus on Bangladesh, where there is one large NGO in primary education.With a large NGO operating under a single model, I can make clear comparisonsbetween NGO-run and state-run schools and identify the characteristics of each typeof school that affect educational outcomes.Using a large, nationally representative data from the Education Watch Project in
Bangladesh, the paper studies the effects of NGO schools on the educational outcomesof girls. Bangladesh is an important case study because the country is home to alarge number of active NGOs3, and NGOs play an important role in the provision ofprimary education. Moreover, there has been a rapid increase in the enrollment rateof girls in recent years such that Bangladesh is now the only country in South Asiato have achieved gender equity in primary enrollment.4 Eliminating gender disparity
1In the U.S. there are approximately 2 million NGOs, most of which were formed in the past30 years, while in Russia, where almost none existed before the fall of communism, at presentthe number is at least 65,000 (The Economist, 2000). Between 1990 and 2000 the number ofinternational NGOs has grown by almost 20% to 37,281 (Human Development Report, 2002).
2Besley and Ghatak (2001) analyze how ownership matters in public good provision, with appli-cations to NGOs.
3NGOs in Bangladesh are documented as being one of the most active in the world. There areabout 20,000 NGOs operating in Bangladesh’s 86,000 villages providing education, health, smallloans, and agricultural extension services (The Economist, 1998).
4In 1980, net primary enrollment rates for boys and girls were 62% and 47%; in 2000 the corre-
2

in primary education is a key part of the United Nations Millennium DevelopmentGoals.5 The education of girls is recognized as crucial to development, leading tohigher economic productivity, lower infant and maternal mortality, and improvedhealth. Understanding what factors led to gender parity in primary education andidentifying the role that NGOs played in this process is a key challenge. Bangladesh’sexperience can provide useful policy lessons for other countries aiming to achievegender equity in primary enrollment.NGOs in Bangladesh initiated non-formal primary education in the middle of
1980s as it was perceived that primary education provided by the government couldnot reach the poorest children in remote areas. Non-formal education has many char-acteristics that differ from formal education. For example, parents and the teacherdecide together on the timing of the lessons and vacation schedules. The schoolsusually have one classroom and one teacher. In most cases teachers are female, whichis believed to encourage the enrollment of girls. At present, around 1.4 million chil-dren or 8% of the children enrolled in primary schools are in NGOs’ non-formalschools (henceforth NGO schools). Figure 1 shows the expansion of NGO schoolsin Bangladesh. The largest NGO in the field of education is the Bangladesh RuralAdvancement Committee (BRAC), which provides non-formal education to 1.2 outof 1.4 million children receiving non-formal education. Even schools which are runby NGOs other than BRAC tend to follow the BRAC model. I therefore have theadvantage of comparing a largely homogenous group of NGO schools with state-runschools.Nationally representative data from the Education Watch Project shows that, in
1998, gender gap in primary enrollment in favor of boys existed only in the case ofurban households which reported their economic status as ‘surplus’. As Figures 2A,2B, and 2C show, girls from rural areas, and girls from poorer households appear todo better than boys in terms of net primary enrollment. In particular, girls fromrural BRAC target households, which are the poorest households in Bangladesh,and girls from households which reported their economic status as ‘always in deficit’have notably higher enrollment rate compared to boys. In many other developingcountries, the opposite is true. For example, in India and Nepal, gender gap in favorof boys is greatest in rural areas and for poorer households, as Figures 3A and 3Bshow. Why do girls from rural areas and poorer households in Bangladesh have suchhigh enrollment rates relative to boys? One possible explanation could be the worksof NGOs such as BRAC, as NGO schools in Bangladesh target poorer households.To investigate these issues I use household, school, and test score data from the
Education Watch Project to analyze the effects of NGO schools on the educational
sponding rates were 79.8% and 79.9%, respectively.5Goal 3, namely “Promote gender equality and empower women”, has the specific target to
“Eliminate gender disparity in primary and secondary education, preferably by 2005, and to alllevels of education no later than 2015.” Details of the Millennium Development Goals can be foundat www.un.org/millenniumgoals/ and www.developmentgoals.org.
3
outcomes of girls in Bangladesh. Combining household and school data, I first studyhow the entry of NGO schools affects girls’ enrollment as compared to boys. I thenanalyze the characteristics of NGO and state schools which affect girls’ enrollment.Finally, I investigate the learning outcomes of students attending NGO and stateschools using test score data.Constructing cohorts from cross-sectional data using year of birth and year of
NGO school establishment, I show that cohorts which were exposed to NGO schoolshave higher probability of enrollment, and the effect operates mainly through girls.Moreover, for primary school aged children, living in a village with at least oneNGO school, or a village with higher NGO school involvement, is associated withhigher probability of enrollment for girls as compared to boys, controlling for otherfactors. When rural and urban areas are studied separately, the effects of NGOschools in increasing girls’ enrollment are found mainly in the rural areas. Moreover,the effects of NGO schools in increasing girls’ enrollment are stronger for BRACtarget households6 compared to non-target households, suggesting that NGO schoolsincrease girls’ enrollment more for poorer households as BRAC target households arethe poorest group of the population. The two most prominent characteristics of NGOschools that encourage girls’ enrollment are the high percentage of female teachersand having Parent-Teacher Associations (PTAs). Being enrolled in an NGO schoolhas positive and strongly significant effects on children’s test scores, as measured byAssessment of Basic Competencies (ABC) test.The paper is organized as follows. The next section presents a theoretical frame-
work showing how NGO school entry might affect girls’ educational outcomes. Sec-tion three discusses the institutional background and the data. Section four describesthe methodology and presents the results. Section five concludes.
2 Theoretical Framework
The simple model in this section attempts to capture how NGO schools might affectthe enrollment of girls as compared to boys. The main assumption is that thereexists a disutility associated with sending a child to school, which differs by genderand by school type.7
Given household characteristics and characteristics of schools available, householdi chooses expenditure on the education of child i to maximize the following household
6BRAC target households are defined as households with less than 0.5 acre of land and at least1 person engaged in manual labor for at least 100 days a year (Nath, 1999).
7Possible reasons for gender differences in human capital investments include different expectedreturns by gender, different costs of investment, and tastes, which may reflect social and culturalnorms (Strauss and Thomas, 1995). For example, Alderman and King (1998) assume different ratesof returns and different expected transfers to explain differences in school enrollment. Garg andMorduch (1998a and 1998b) assume higher rates of return for males.
4

utility function:
B(xs)− pskj + U(Y − ckj − xs) (1)
where B(·) and U(·) are household i’s perceived benefits of education and utility fromcurrent consumption, respectively.8 B(·) and U(·) are assumed to be increasing andconcave. xs is expenditure on the education of a child of sex s, s = male (m) andfemale (f). pskj is the disutility associated with sending a child of sex s to schooltype k in village of residence j. Here k = government school (g) and NGO school(n). Y is household i’s income, and ckj is the opportunity cost of time of a childwhen enrolled in school type k in village j.The main assumption of the model is that, for each village j, pfgj > pmgj =
pmnj = pfnj. The disutility of sending a child to a government school is higher forgirls compared to boys. In the context of Bangladesh, this could be thought of as theworry of having the child far away from home, which is usually greater in the case ofgirls, or the disutility of having a girl taught by male teachers. The average distancebetween a government school and children’s homes is 3.2 kilometers, and over 60%of teachers in government schools are male (Jalaluddin and Chowdhury, 1996). Thedisutility of sending a child to an NGO school is assumed to be the same for boys andgirls, and is equal to the disutility of sending a boy to a government school. NGOschools have some characteristics that should be associated with lower disutility forgirls compared to government schools. For example, NGO schools are usually builtin the village nearby to children’s homes, and over 90% of NGO school teachers arefemale.The benefit function, B(·), is assumed to be the same for boys and girls, and the
same for government schools and NGO schools. The opportunity cost of time isassumed to be the same for boys and girls9, and higher in the case of governmentschools compared to NGO schools. This is because NGO schools are located nearbyto children’s homes and have class times decided by parents and the teacher to allowchildren to work outside of school time.Let x∗s(Y ) be the solution to the maximization problem (1), and let V (Y ) be the
maximum value function, given pskj and ckj. If household i decides not to enrol thechild, the household utility is U(Y ). The condition for household i to enrol the childis therefore:
V (Y )− U(Y ) > 0 (2)
It is straightforward to show that initial enrollment is non-decreasing with respectto Y , and non-increasing with respect to pskj and ckj.10 This is intuitive, since high
8Subscript i is omitted for simplicity.9Girls may help with child care and household chores while boys may work in the farm, thus in
general it is inconclusive whether the opportunity cost of time is higher for girls or boys (Straussand Thomas, 1995).10Applying the envelope theorem, the derivative of the left-hand side of (2) is ∂V
∂Y −∂U∂Y =
∂U(Y−ckj−xs)∂Y − ∂U(Y )
∂Y > 0 since U(·) is concave. Moreover, ∂V∂pskj
= −1 < 0 and ∂V∂ckj
= −∂U∂Y < 0 .
5

income makes it more ‘affordable’ to enrol a child, while high disutility associatedwith sending a child to school and high opportunity cost make it more ‘expensive’ toenrol a child.Let Y ∗skj be the threshold level of income above which a household will enrol a
child of sex s in school type k in village j, i.e., V (Y ∗skj) − U(Y ∗skj) = 0. Sincepfnj = pmnj = pmgj < pfgj and cnj < cgj, it follows that:
Y ∗fnj = Y ∗mnj < Y ∗mgj < Y ∗fgj (3)
Result 1: NGO schools contribute to an increase in the enrollment rates of boysand girls, with stronger effects for girls.
Let us further assume that NGOs target poor households with income less thanY tg. Suppose Y tg is such that (i) Y ∗mn = Y ∗fn < Y ∗mg < Y tg < Y ∗fg, or (ii) Y
∗mn = Y ∗fn <
Y tg < Y ∗mg < Y ∗fg.
Result 2: The effects of NGO schools in increasing girls’ enrollment relativeto boys will be stronger for NGOs’ target households. Moreover, gender gap inenrollment disappears for target households, but exists for non-target households.
3 The Program
With over 20,000 NGOs working in areas such as health, education, micro-credit andagricultural services, Bangladesh is documented as having one of the most activeNGOs in the world. NGOs in Bangladesh started to emerge after the War of Inde-pendence in 1971, when the country was in a state of upheaval and many refugeeswere returning home. At that time, most NGOs were aid and relief agencies. As theneeds of society changed, many NGOs evolved into development agencies. The num-ber of NGOs has also increased significantly. NGOs in Bangladesh range from smalllocal NGOs to large and internationally well-known NGOs such as the BangladeshRural Advancement Committee (BRAC) and the Grameen Bank. In the area of ed-ucation, NGOs in Bangladesh play a vital role in the provision of non-formal primaryeducation.Primary education in Bangladesh was initially the responsibility of the state.
After independence, under an Act of Parliament all primary schools in Bangladeshwere nationalized in 1973 (Jalaluddin and Chowdhury, 1996). From the second half of1980s, however, the state has allowed NGOs to experiment with a variety of deliverymechanisms to cater for basic education needs of the disadvantaged households. Theobjective of NGOs’ non-formal schools is to provide education to the poorest childrenwho did not attend or have dropped out of formal schools.Primary education in Bangladesh is 5 years in length, starting at age 6. There are
6

11 types of primary schools.11 Currently, around 1.4 million children, or 8 percentof children enrolled in primary schools, are in NGO-run schools. Around two-thirdsare enrolled in government schools, and another 20 percent in registered privatelymanaged schools. For other types of schools, the percentage of children attendingeach type is 2% or smaller. As Figure 1 shows, NGO schools are relatively new. Themajority of NGO schools in the rural areas were set up after 1992. For the urbanareas, most NGO schools were established after 1995. In the case of governmentschools, most were established before 1990, with only 2 out of 354 schools under thesurvey established after 1990.The Bangladesh Rural Advancement Committee (BRAC) is the single largest
NGO in non-formal primary education with over 30,000 non-formal primary schools.BRAC started the Non-Formal Primary Education (NFPE) in 1985 in response todemands from parents whose children did not have a chance to go to school. After2 years BRAC developed a model of non-formal schools which has become highlysuccessful.12
This unique characteristic of having one large NGO in education makes it possibleto compare how NGO and state schools function, which is usually not possible sinceNGOs in education are heterogeneous in most other countries.13 Using nationallyrepresentative data from the 1998 Education Watch Project, this paper examines howthe expansion of NGO schools affects the educational outcomes of girls, and whichcharacteristics of NGO and state schools matter for those outcomes.Table 1 gives means and standard deviations of the main variables.14 Panel A
shows individual level means of boys and girls aged 6 to 10 years old for all Bangladesh,and separately for rural and urban areas. The enrollment rate of girls has surpassedthat of boys for all Bangladesh and the rural areas. Girls’ enrollment rate hasincreased significantly in recent years.15 The table also shows differences betweenrural and urban areas in certain family characteristics, such as parental education
11These are: government schools, registered privately managed schools, unregistered privatelymanaged schools, primary schools attached to high schools, PTI’s experimental schools, indepen-dent religious schools, religious schools attached to high madrassas, kindergarten, satellite schools,community schools, and NGO schools (World Bank, 2000).12When BRAC started non-formal schools, the objective was to provide basic education to chil-
dren, and continuation into the fourth grade in the formal system was not expected. However,out of over 1.67 million students who have graduated from BRAC schools, 90% have gone on togovernment schools. Nath et al. (1999) find that graduates of BRAC schools have a high level ofbasic competency compared to other types of schools.13See, for example, Miguel and Kremer (2003).14Details on the Education Watch data are contained in the Data Appendix.15The increase in girls’ enrollment rate is believed to have been brought about by a number of
‘positive discriminatory’ actions taken by the state and NGOs in favor of girls and poor children inthe rural areas. Among these are: (i) non-formal primary education; (ii) Female Stipend program,where the state provides stipends to girls in secondary school and does not charge any tuition; and(iii) Food for Education program, where the state provides a food ration to children from ruralpoorer families for attending school (Chowdhury et al., 2001).
7

and household economic status. Despite having parents who have less education,girls in rural areas are more likely to be enrolled overall than urban girls and morelikely to be enrolled than rural boys.The expansion of NGO schools into a village is captured by ‘the involvement of
NGO schools in a village’, defined as the percentage of children aged 6 to 10 yearsold enrolled in NGO schools among children aged 6 to 10 years old enrolled in schoolin each village. ‘The involvement of government schools’ is similarly defined. PanelB gives village level means of ‘the involvement of NGO schools’ and ‘the involvementof government schools’.In general NGOs target villages with low enrollment rates. NGO schools are
usually built in villages where there is demand for the school, i.e. villages with manydropout and non-enrolled children. For BRAC, in villages where BRAC has itsdevelopment activities, a survey is conducted to find out the number of children whoare non-enrolled or have dropped out of school, and one school is open for 33 children.Panel C gives the school level means of the characteristics of NGO schools and
government schools. The differences between the two types of schools can be seenin many areas. For class size, NGO schools have much smaller class size, on averagearound 30 students in one class16, while government schools’ average class size is55. Teacher absenteeism appears higher in the case of government schools; thepercentage of teachers present on the day of school visit is 97% for NGO schools and86% for government schools. The percentage of female teachers is much higher forNGO schools, 92% compared to 35% in the case of government schools. Teachers’education is on average lower in the case of NGO schools. Government school teachershave on average almost 12 years of education, compared to 10 years for NGO schoolteachers.17 NGO school teachers also have much fewer years of experience, on average2.65 years compared to almost 20 years for government school teachers.
4 Empirical Analysis
To answer the question of how the entry of NGO schools affects girls’ educationaloutcomes, I start by analysing how NGO schools affect girls’ enrollment. For childrenaged 11 to 20 years old, I find out how exposure to NGO schools affects the probabilityof having been enrolled, and whether the effect differs between boys and girls. I alsostudy whether, for primary school aged children, being in a village with at least oneNGO school, or a village with higher NGO school involvement, affects girls’ enrollmentas compared to boys. Next I find out the characteristics of NGO and state schoolswhich affect female participation in education. Finally, I investigate the quality ofNGO schools by analysing the learning outcomes of boys and girls attending NGO
16For BRAC schools, class size is set at 33 children for each school, which is usually a one-roomconstruction with one teacher.17BRAC has a policy of hiring female teachers who have completed 9 or more years of school.
8

and state schools.Table 2 gives an overview of how the entry of NGO schools affects girls’ enrollment.
I show the percentage of children with no schooling in villages with at least one NGOschool and villages with no NGO school. I focus on two age groups, 17 to 20 and11 to 14, as most 17 to 20 year olds were not exposed to NGO schools while childrenin the 11 - 14 year range were.18 Comparing columns (1) and (4), it appears thatNGO schools entered villages with a higher percentage of children with no schooling.This is in line with the targeting policy of NGOs, where more schools are built invillages with demand for the schools, i.e. villages with many dropout or non-enrolledchildren. Columns (2) and (5) show that, for 11 to 14 years old children, girls invillages with at least one NGO school do better than girls in villages with no NGOschool. For boys, however, the opposite is true. Columns (3) and (6) show that thereduction in the percentage of children with no schooling has been fastest for girls invillages with at least one NGO school. In fact, from being the worst-off group beforeNGO schools entered, they became the group with the highest percentage of childrenhaving been enrolled. This issue is further explored in the following analysis.As Table 2 shows, NGOs appear to enter villages with low initial enrollment.
Table 3 confirms NGOs’ targeting policy. NGO school involvement is greater invillages where adults have lower average schooling, as defined by (i) average classpassed for adults 21 years and above, and (ii) percentage of adults 21 years andabove with no schooling.19 As NGO school placement is a function of the initial levelof education in the village, there is a possible endogeneity problem where the resultsfound are due to the targeting policy of NGOs and not the activities of NGO schools.To deal with this possible endogeity problem, I control for village fixed effects whenanalyzing children aged 11 to 20 years old. This is possible because for each village Ican divide the children into those who were exposed to NGO schools and those whowere not, using year of birth and year of NGO school establishment. In interpretingthe results, the identification assumption is that there is no omitted time-varying andregion specific effects correlated with the placement of NGO schools. When analyzingchildren aged 6 to 10 years old, I control for several village characteristics.20 Resultsshowing similar patterns emerge from analyzing 11 to 20 years old and 6 to 10 yearsold, suggesting that under the assumption that there is no time-varying componentthe results found are not driven by NGO school placement.
18As Figure 1 shows, most NGO schools started on or after 1992. Children aged 17 to 20 in1998 were 11 or older in 1992, thus most of them were not exposed to NGO schools as NGO schoolsusually enrol children aged 8 to 10 years old.19In Table 3, the dependent variable is the involvement of NGO schools in a village, and explana-
tory variables are village characteristics as listed. The education of adults 21 years and above isnot affected by whether there is an NGO school in the village, as those 21 years and above in 1998would be 11 years or older in 1988, and in 1988 there were hardly any NGO schools at all (as shownin Figure 1).20As all children aged 6 to 10 years old are exposed to NGO schools, it is not possible to control
for village fixed effects.
9
4.1 Entry of NGO Schools and Girls’ Enrollment
A. Basic Results
First I explore the key question of this paper - does the entry of NGO schools con-tribute to the increase in girls’ enrollment as compared to boys?To find out whether being exposed to NGO schools has different effects on the
enrollment status of girls as compared to boys, I estimate the following equation:
Pr(Sij = 1) = α0 + α1EXPij + α2Girl ∗EXPij + α3Cij + α4Girl ∗ Cij
+ α5Girl + α6Vj + error term (4)
where Sij is equal to 1 if individual i in village j has been enrolled in school, and0 otherwise. Here I focus on the age range of 11 to 20, as this age range includeschildren who were exposed to NGO schools as well as those who were not. EXPij
is equal to 1 if individual i in village j has been exposed to an NGO school in thevillage, and 0 otherwise. An individual is considered exposed to an NGO school ifhe/she was 10 years old or younger when the first NGO school in the village wasestablished, as most NGO schools enrol 8 to 10 years old children.21 Girl is thedummy variable for being a girl. I control for a number of individual and familycharacteristics, represented by vector Cij, and village fixed effects, Vj. Equation (4)is estimated by maximum likelihood logit. In this specification, and all others thatfollow, standard errors are clustered at the village level.22
I control for the following child and family characteristics to account for unob-served heterogeneity that might drive enrollment: age of the child, number of adultsin the household, number of siblings, percentage of boys among all siblings, whetherthe household is a female headed household, father’s education, mother’s education,household’s self-perceived economic status, whether mother has access to NGO credit,whether mother is engaged in income-generating activities, whether there is at leastone member of the household who sells labor more than 100 days/year, and religion.Columns (1) to (4) of Table 4 show that being exposed to NGO schools increases
the probability of having been enrolled for girls as compared to boys. Interactionterms with Girl are not included in column (1), and are included in column (2).Column (1) shows that, compared to those who were not exposed to NGO schools,being exposed to NGO schools increases the probability of having been enrolled forall children. In column (2), the interaction term ‘Girl*Exposed to NGO school’is positive and strongly significant, while the level term ‘Exposed to NGO school’becomes insignificant. This suggests that compared to children who were not exposedto NGO schools in the village, being exposed to NGO schools increases the probability
21I constructed this variable using the age of an individual and the year when the first NGO schoolwas established in the village of residence.22See Deaton (1997).
10

of having been enrolled for girls as compared to boys. The marginal effect suggeststhat being exposed to NGO schools increases girls’ probability of having been enrolledby 3% compared to boys.Columns (3) and (4) look at children who were exposed to NGO schools and
those who were not. I split the sample in this way to allow for child and familycharacteristics to have different effects on children who were exposed to NGO schoolsand whose who were not.23 For the group of children who were exposed to NGOschools, girls are more likely to be enrolled compared to boys, controlling for otherfactors. The coefficient of ‘Girl’ is positive and strongly significant in column (3).On the other hand, for children who were not exposed to NGO schools, the coefficientof ‘Girl’ is marginal and insignificant.Taken together, the results suggest that being exposed to NGO schools in the
village significantly increases the probability of having been enrolled for girls as com-pared to boys.Next I investigate whether the exposure to NGO schools leads to an increase in
class passed, defined as the last class which a child has completed, and whether theeffects are stronger for girls as compared to boys. Columns (5) and (6) of Table 4 showthe results from estimating equation (4) using the last class passed as the dependentvariable. The results are similar to those in the case of enrollment: being exposedto NGO schools increases class passed for all children, and the effect operates mainlythrough girls. The marginal effect suggests that being exposed to NGO schoolsincreases class passed for girls by 0.23 year as compared to boys.Columns (7) and (8) report the results from splitting the sample into those who
were exposed to NGO schools and those who were not. For the group of children whowere exposed to NGO schools, girls appear to have significantly higher class passedcompared to boys. The coefficient of ‘Girl’ is positive and significant at the 1% level.For children who were not exposed to NGO schools, the coefficient of ‘Girl’ is muchsmaller in magnitude and less strongly significant24 compared to the case of childrenwho were exposed to NGO schools.Taken together, the results suggest that the entry of NGO schools increases girls’
enrollment and class passed compared to boys.Table 5 shows the results from using a different identification strategy, where I
analyze how the intensity of NGO schools in the village affects enrollment and classpassed of children born in different years.25 The year of birth and the village of birthjointly determine an individual’s exposure to NGO schools. As Figure 1 shows, over95% of NGO schools were established in or after 1992. Since NGO schools usually
23It is possible that for children who were exposed to NGO schools, parents may become moresensitive towards girls’ needs for education due to NGO activities in the village of residence.24For children who were not exposed to NGO schools, the coefficient of ‘Girl’ is significant at 10%
level.25The intensity of NGO schools in a village is measured by the number of NGO schools in the
village per 100 children aged 11 to 20 years old.
11
enrol children aged 8 to 10 years old, those who were 11 or older in 1992 were notexposed to NGO schools. At the time of the survey in 1998, children who were 17years or older form the cohort who were too old to benefit from NGO schools. Icompare the effects of the intensity of NGO schools in the village of residence onchildren who were young enough to be exposed to the schools versus those who weretoo old to benefit from them. If exposure to NGO schools increases class passedrates for children, we would expect to find no effect for those 17 years or older, andincreasing effects for younger children.26
I estimate the following equation:
Yijk = α0 + α1NPj ∗ Tik + α2Tik + α3Cijk + α4Vj + error term (5)
where Yijk is (i) whether individual i in village j who is of age k has ever beenenrolled27, and (ii) the last class passed for individual i in village j who is of age k,where 11 ≤ k ≤ 20. NPj is the number of NGO schools in village j per 100 childrenaged 11 to 20 years old. Tik is the treatment dummy indicating the age of individuali. Cijk denotes child and family characteristics of individual i in village j who is ofage k.Columns (1) and (2) of Table 5 show that exposure to NGO schools has positive
effects on the probability of having been enrolled for girls. The coefficients of ‘NumberNGO schools*age k’ are positive and significant for girls aged 12 to 15, and positivethough insignificant at the 10% level for boys of the same age range. For both boysand girls, there appears to be little or no effect on those aged 17 and above. Hereage 20 is the omitted category. The results show that NGO schools increase theprobability of having been enrolled for children who were exposed to the schools,with stronger effects in the case of girls. Results regarding class passed, as shownin columns (3) and (4) of Table 5, are similar to those regarding enrollment. Thecoefficients of ‘Number NGO schools*age k’ are positive and significant for girls aged15 and below, and positive though mostly insignificant at the 10% level for boys ofthe same age range.Overall, the results in Table 5 point to the same direction as those in Table 4:
NGO schools appear to increase girls’ enrollment and class passed as compared toboys.Next I look at whether being in a village with an NGO school increases the
probability of being enrolled for children aged 6 to 10 years old. While studyingthe enrollment history of children 11 to 20 years old has the advantage of comparingbetween those who were exposed to NGO schools versus those who were not, focusingon 6 to 10 years old, the primary school age in Bangladesh, allows for the analysis ofthe current primary enrollment situation in Bangladesh.
26This is the same identification strategy as in Duflo (2001).27The variable is equal to 1 if the individual has ever been enrolled and 0 otherwise.
12

I estimate the following equation:
Pr(Sij = 1) = α0 + α1Nij + α2Girl ∗Nij + α3Gij + α4Girl ∗Gij + α5Cij
+ α6Girl ∗ Cij + α7Girl + α8Aj + α9V cj + error term (6)
where Nij represents two different measures of supply of NGO schools in village j.One is whether there is at least 1 NGO school in village j , and the other is theinvolvement of NGO schools in village j. ‘The involvement of NGO schools in avillage’ is defined as the percentage of children aged 6 to 10 years old enrolled inNGO schools among children aged 6 to 10 years old enrolled in school in each village,excluding the child from the sample. This variable shows the relative importanceof NGO schools in a village. Gij is similarly defined for government schools.28 Aj
represents the stratum in which village j is located, and V cj is a vector of village-level characteristics. Village characteristics included are percentage of adults withno schooling, whether there is an NGO micro-credit in the village, average economicstatus, percentage of landless households, percentage of households with memberswho sell labor more than 100 days/year, percentage of female headed households,and percentage of Muslims in the village. All other variables are as defined above.Columns (1) to (4) of Table 6 show the main findings. In column (2), the in-
teraction term ‘Girl*At least 1 NGO school’ is positive and significant at the 1%level, indicating that being in villages with at least 1 NGO school is associated withhigher probability of being enrolled for girls as compared to boys. The marginaleffect suggests that the magnitude of this effect is 3%, which is similar to the case of11 to 20 years old. The interaction term ‘Girl*Fraction NGO’ in column (4) is alsopositive and significant at the 10% level. Both results point to the same directionthat NGO schools increase girls’ enrollment as compared to boys. On the other hand,having at least 1 government school in the village or having more government schoolinvolvement does not show different effects on the probability of being enrolled forgirls as compared to boys. This suggests that it is exposure to NGO schools and notgovernment schools that drives up girls’ enrollment relative to boys.Column (3) shows that NGO school involvement is associated with lower proba-
bility of being enrolled for all children. As Tables 2 and 3 suggest, NGOs appear totarget villages with low enrollment rates.To conclude, the results in Tables 4, 5, and 6 point to the role of NGO schools in
increasing girls’ enrollment. Being exposed to NGO schools significantly increasesenrollment and class passed for girls as compared to boys. Moreover, living in a villagewith at least one NGO school, or a village with higher NGO school involvement, isassociated with higher enrollment for girls as compared to boys.29
28As there are 11 types of primary schools in Bangladesh, the involvement of NGO schools andthe involvement of government schools in a village do not add up to one.29Appendix 2, Table 12 shows the effects of child and family characteristics on the probability of
13

B. Extensions
Results in the previous subsection lead to the conclusion that NGO schools havecontributed to the increase in female enrollment in Bangladesh. However, given thecharacteristics of NGO schools which aim to suit the needs of the poorest children,it is possible that NGO schools may increase female enrollment for some groups (e.g.rural versus urban, BRAC target versus non-target households) and not others. Also,to draw out policy implications it is useful to find out how NGO schools affect femaleenrollment for different groups of the population.Here I analyze whether the effects of NGO schools in increasing girls’ enrollment
vary between rural and urban areas, and between BRAC target and non-target house-holds. The rural and urban areas in Bangladesh differ in many aspects which possiblyimpact how NGO schools affect female enrollment. For example, in the urban areasschools are more likely to be closer and there are more infrastructures such as roads.In the case of BRAC target and non-target households, when BRAC started its
NGO schools the main objective was to provide education to children from BRACtarget households, defined as households with less than 0.5 acre of land and at least1 person engaged in manual labor for at least 100 days a year (Nath, 1999). How-ever, as there were many children from non-target households who did not have aneducation, BRAC schools also enrol children from non-target households. BRACtarget households are the poorest group of the population, and whether NGO schoolsaffect target and non-target groups differently should provide insights into how NGOschools affect female enrollment.Panel A in Table 7 shows the results from estimating equation (4) separately
for rural and urban areas, while Panels B and C show the results from estimatingequation (6) for rural and urban areas. Columns (1) and (2) show that, for childrenaged 11 to 20 years old, the effect of being exposed to NGO schools on relative femaleenrollment can be found in both rural and urban areas, with the effect being strongerfor the rural areas. Panels B and C show that the effects of NGO schools in increasinggirls’ enrollment as compared to boys are found mainly in the rural areas. For PanelB, the coefficient of ‘Girl*At least 1 NGO school’ is positive and significant only forthe rural areas. For Panel C, the coefficient of ‘Girl*Fraction NGO’ is positive andsignificant for the rural areas, and insignificant for the urban areas.One possible reason NGO schools seem to increase relative female enrollment
mainly in the rural areas is that in rural villages government schools and other typesof schools are likely to be far away, therefore having an NGO school in the villagewould encourage parents to send the girls to school. As the theory suggested, thedisutility associated with sending a girl to school could be reduced by having NGO
being enrolled for boys and girls. Most of the child and family characteristics have the expected sign,although there are some exceptions. In line with Figure 2C, being from a household which reportstheir economic status as ‘surplus’ has a negative and significant relationship with the probability ofbeing enrolled for girls in the urban areas.
14

schools nearby to children’s homes. Moreover, in many cases the poorest childrenin urban areas who attend NGO schools are children of construction workers whooften have to move from site to site, making it difficult for the children to continuein school.30
Table 8 shows the results from estimating equation (6) separately for BRAC targetand non-target households. The results show that NGO schools have stronger effectsin increasing relative female enrollment for BRAC target households as comparedto non-target households.31 The coefficients of ‘Girl*At least 1 NGO school’ and‘Girl*Fraction NGO’ are positive and significant in the case of target households.The effects on non-target households are positive though not statistically significantat the 10% level. The results suggest that the effects of NGO schools in increasingrelative female enrollment is stronger for BRAC target households, although there isevidence of some effects in the case of non-target households as well. This is in linewith the fact that NGO schools also enrol children from non-target households.In summary, it appears that NGO schools increase relative female enrollment
mainly in the rural areas. Moreover, the effects of NGO schools in increasingrelative female enrollment are stronger for BRAC target households compared tonon-target households.32 These results make us more confident that the increase infemale versus male primary school enrollment is being driven by exposure of poorrural households (and in particular BRAC target households) to NGO schools.
C. Robustness Checks
Restricting to BRAC schools
The largest NGO in non-formal primary education is the Bangladesh Rural Advance-ment Committee (BRAC). The school data from the Education Watch Project showsthat 73% of NGO schools are BRAC schools. Many smaller NGOs also follow theBRAC model in setting up and managing their schools.33 For a robustness check ofwhether the previous findings are driven by BRAC schools, here I restrict the analysisto BRAC schools only.Table 9 shows that the main results regarding BRAC schools are very similar to
those in the case of all NGO schools. Columns (1) to (6) show that, for children 6 to 10years old, BRAC school involvement is significantly associated with higher probability
30I thank BRAC personnel who suggested this possibility.31As the criteria of land-owning is relevant only for the rural areas, the analysis focuses on BRAC
target and non-target households in the rural areas.32As the condition of having ‘at least 1 person engaged in manual labor for at least 100 days a
year’ may change each year, I also looked at the criterial of land-owning only. The results showthat the effects of NGO schools in increasing relative female enrollment are positive and significantfor households owning less than 0.5 acre of land and insignificant for households owning more than0.5 acre of land.33BRAC’s Education Support Programme provides support in the areas of technical, conceptual
and human skills to 303 NGOs for 2,505 schools.
15

of being enrolled for girls as compared to boys, moreover, the effect is found mainlyin the rural areas and the effects are stronger for BRAC target households comparedto non-target households.34 These results are very similar to those found in thecase of all NGO schools, and suggest that BRAC schools play an important role inincreasing girls’ enrollment in Bangladesh and that the BRAC model of non-formalprimary education contains certain characteristics which encourage girls’ enrollment.
4.2 What School Characteristics Determine Female Partici-pation in Education?
The previous section has shown that NGO schools contribute to an increase in femaleenrollment. The objective of this section is to uncover the mechanisms through whichNGO schools affect female participation in education.To find out the characteristics of NGO and government schools in the village of
residence which affect enrollment, I estimate the equation:
Pr(Sij = 1) = α0 + α1Ncj + α2Gcj + α3Cij + α4Aj + α5V cj + error term (7)
where Ncj is a vector of aggregate village-level characteristics of NGO schools invillage j, and Gcj is a vector of aggregate village-level characteristics of governmentschools in village j. All other variables are as defined above. Here the analysisis restricted to villages with at least one NGO school, therefore the sample size issmaller compared to the previous section.Interaction terms with Girl are included in the next equation to find out the
different effects that village-level school characteristics have on the probability ofbeing enrolled for girls as compared to boys.
Pr(Sij = 1) = α0 + α1Ncj + α2Girl ∗Ncj + α3Gcj + α4Girl ∗Gcj + α5Cij
+ α6Girl ∗ Cij + α7Girl + α8Aj + α9V cj + error term (8)
The results are reported in Table 10. Column (1) shows that the most prominentNGO school characteristic which appears to encourage enrollment for all children isthe high percentage of female teachers. The percentage of female teachers in NGOschools also appears to increase girls’ enrollment as compared to boys, the coefficientof ‘percentage of female teachers in NGO schools*Girl’ is positive and significant atthe 5% level. For NGO schools, having Parent-Teacher Associations (PTAs) alsoseems to encourage enrollment for all children.For government schools, larger class size appears to discourage enrollment, and
the effects appear similar for boys and girls. Having government school teachers with
34Similar results are found using ‘whether there is at least 1 BRAC school’ instead of ‘BRACschool involvement’.
16

more experience seems to encourage girls’ enrollment, although there is no significanteffect in the case of boys. Having School Management Committees (SMCs), on theother hand, appears to encourage boys’ enrollment with no effect in the case of girls.Overall, the results suggest that high percentage of female teachers and having
PTAs are important NGO school characteristics which encourage enrollment for bothboys and girls. In particular, high percentage of female teachers appears to be themost prominent NGO school characteristic which encourages girls’ enrollment.35
4.3 How do NGO Schools Affect Learning Outcomes?
The impact of NGO schools on welfare depends not only on enrollment, but also onhow the students are learning as a result of attending NGO schools. In this sectionI further investigate the quality of NGO schools using test score data. NGO schoolsuse a different model of teaching compared to state schools, and there is no obviousreason why NGO school students should perform better or worse compared to thoseattending state schools.Under the Assessment of Basic Competencies (ABC) survey, in each village 7
boys and 7 girls aged 11-12 years old were randomly selected to take the ABC test.36
Using this sample, I estimate the following equation:
Yij = α0 + α1Tij + α2Girl ∗ Tij + α3Cij + α4Girl ∗ Cij + α5Vj
+ error term (9)
where Yij represents (i) whether a child passed the ABC test or not, and (ii) test scoresof life-skills, reading, writing, and numeracy sections. Tij is the dummy variable forthe type of school that the child was attending at the time of suvey. I control forchildren who have dropped out of school, and the omitted category is the group whohave never been enrolled. Other variables are as defined above.A child is considered to have ‘basic education’, i.e. to pass the ABC test, if
he/she satisfied the following criteria: (i) answering correctly at least 7 out of 10 lifeskills questions; (ii) answering correctly at least 3 of the 4 questions from the readingcomprehension passage; (iii) correctly communicating a given message through aletter; and (iv) answering correctly at least 3 of the 4 mental arithmetic questions(Chowdhury et al., 1999).
35As shown in Table 1, attendance rate is much higher in NGO schools compared to governmentschools (85% versus 55%). OLS regressions with attendance rate as dependent variable and schoolcharacteristics and school type dummies as explanatory variables show that the determinants ofattendance are similar for boys and girls (results not shown). The single most important determinantof attendance is the percentage of teachers present on the day of school visit. Teacher absenteeismtherefore appears to discourage attendance of both boys and girls. Teacher absenteeism is also quitecommon and is a major concern in other developing countries such as India (The PROBE team,1999).36The Data Appendix contains detail on the ABC test.
17

Table 11 shows that, for both boys and girls, attending an NGO school has positiveand significant effects on the probability of passing the ABC test, and all test scores.Attending an NGO school also significantly increases the probability of passing theABC test for girls as compared to boys. For each section’s test scores, however, theeffects do not differ between boys and girls.Attending a government school appears to significantly increase the probability of
passing the ABC test for girls, although there seems to be no effect for boys. For allchildren, attending a government school significantly increases reading and writingscores. The effect on numeracy section is positive though not significant, and thereappears to be no effect on life skills section.37 For each section, the effect of attendinga government school do not differ between boys and girls.The effects of attending an NGO school on test scores are larger than the effects of
attending a government school. For reading skills38, compared to children who havenever been enrolled, attending an NGO school increases the scores of reading skillsby 21% for boys and 22% for girls. For government schools, the corresponding effectsare 9% and 8% respectively. For writing skills39, attending an NGO school increasesthe scores by 26% for boys and 31% for girls, while the corresponding effects are 10%for both boys and girls in the case of government schools. Attending a governmentschool does not show significant effects in improving scores for the life skills andnumeracy skills sections.The strongest determinant of test scores for all sections is the last class passed.
Listening to the radio, watching television, and reading newspaper are positivelyassociated with the scores of life skills section. Listening to the radio and readingnewspaper also significantly increase the probability of passing the ABC test. Mostfactors related to household economic status do not significantly affect children’s testscores. Most of the determinants of test scores appear similar for boys and girls.40
Results from Table 11 suggest that, controlling for other factors, attending anNGO school shows stronger effects in improving children’s test scores compared toattending a government school. For children who took the ABC test, those inNGO schools would have been in school for a shorter period of time compared totheir peers in government schools, since NGO schools enrol children 8-10 years oldwhile government schools enrol children 6 years or above. Moreover, NGO schoolstudents are mainly those from the poorest families who were non-enrolled or havedropped out of school. As NGO schools use a different model of teaching, including a
37The different effects of NGO schools and government schools on life skills section could be dueto the curriculum. NGO schools emphasize more on matters such as health and personal hygiene,which are tested in the life skills section.38There are 4 questions for reading skills section.39The full score for writing skills section is 9.40The most notable exception is that being from economically well-off families has a positive and
significant relationship with the reading and writing scores for girls compared to boys. In fact,being from well-off families appears to have a negative effect on reading and writing scores for boys,a rather surprising result.
18

child-centered approach, simple textbooks which are relevant to rural life, continuousevaluation instead of exams, and flexible class times, the strong effect of NGO schoolson test scores is very likely the result of the NGO model of teaching.Overall, the results indicate that NGO schools significantly improve children’s
competencies in all areas tested by the ABC test. Moreover, attending an NGOschool significantly increases the probability of passing the ABC test for girls ascompared to boys. The effects, however, do not appear to differ between boys andgirls for each section’s test scores.
5 Conclusions
Bangladesh has achieved gender parity in primary enrollment in spite of being oneof the poorest countries in the world. More surprisingly, it is among the pooresthouseholds in the rural areas where net enrollment rate of girls is most notably higherthan that of boys. This is contrary to the situation in other low income countries.For Bangladesh, the entry of NGOs in primary education appears to be an importantpart of the success story. NGOs in Bangladesh are heavily involved in the provisionof primary education, in particular to the poorest children.Understanding what factors led to gender parity in primary enrollment is a key
issue which has important policy implications. In this paper I identify the effects ofNGO schools on girls’ enrollment and examine the characteristics which account forthe relative performance of NGO versus state schools in improving girls’ educationaloutcomes.The results show that the entry of NGO schools has significantly increased girls’
enrollment as compared to boys. For children aged 11 to 20 years old, being exposedto NGO schools significantly increases the probability of having been enrolled for girlsas compared to boys. Moreover, for children aged 6 to 10 years old, living in a villagewith at least one NGO school or a village with higher NGO school involvement isassociated with higher enrollment for girls as compared to boys. When divided intorural and urban areas, the effects of NGO schools in increasing girls’ enrollment arefound mainly in the rural areas, where circumstances are likely to allow NGO schoolsto function well. Moreover, the effects of NGO schools in increasing girls’ enrollmentare stronger for BRAC target households, the original target group of NGO schools,compared to non-target households. The two most prominent characteristics of NGOschools that encourage girls’ enrollment are the high percentage of female teachersand having Parent-Teacher Associations (PTAs). NGO schools also show strongeffects in improving children’s test scores.The innovative ways of NGO schools and the resulting increase in girls’ enroll-
ment show what can be achieved when policies are designed to suit the needs of thepoor. In this paper I have identified some characteristics of NGO schools which af-fect educational outcomes. However, certain characteristics that are believed to havecontributed to the success of NGO schools are those related to pedagogy practices
19

and motivation. Such characteristics are difficult to capture in quantitative data.How dancing and singing are part of the curriculum and how NGO school teachersactually visited houses to convince parents to send their children to school are onlysome examples. There are other aspects of NGO schools that are beyond the scopeof this paper.
References
[1] Alderman, H. and E. King, 1998, Gender differences in parental investment ineducation, Structural Change and Economic Dynamics 9, 453-468.
[2] Banerjee, A., S. Cole, E. Duflo, and L. Linden, 2003, Remedying education:Evidence from two randomized experiments in India, Mimeo, MIT.
[3] Besley, T. and M. Ghatak, 2001, Government versus private ownership of publicgoods, Quarterly Journal of Economics 116(4), 1343-1372.
[4] BRAC, web-based material at: http://www.brac.net
[5] Chowdhury, AMR, et al. (eds), 1999, Hope not complacency: State of primaryeducation in Bangladesh 1999, The University Press Limited, Dhaka.
[6] Chowdhury, AMR, S. Nath, and R. Choudhury, 2001, Equity gains in Bangladeshprimary education, BRAC Research Monograph Series No. 20.
[7] Deaton, A., 1997, The Analysis of Household Surveys: A MicroeconometricApproach to Development Policy, Johns Hopkins University.
[8] Duflo, E., 2001, Schooling and labor market consequences of school constructionin Indonesia: Evidence from an unusual policy experiment, American EconomicReview 91 (4), 795-813.
[9] The Economist, July 25th, 1998, The other government in Bangladesh, page 74.
[10] The Economist, January 29th, 2000, Sins of the secular missionaries, pages 25-28.
[11] Filmer, D., 2003, Educational Attainment and Enrollment Profiles: A ResourceBook based on an Analysis of Demographic and Health Survey Data, mimeo,Development Research Group, The World Bank.
[12] Garg, A. and J. Morduch, 1998a, Sibling rivalry, Development Discussion PaperNo. 630, Harvard Institute for International Development, Harvard University.
[13] Garg, A. and J. Morduch, 1998b, Sibling rivalry and the gender gap: Evidencefrom child health outcomes in Ghana, Journal of Population Economics 11(4),471-493.
20

[14] Human Development Report, 2002, UNDP.
[15] Jalaluddin, A. K., and A. M. Chowdhury, 1996, Getting Started: UniversalisingQuality Primary Education in Bangladesh, The University Press Limited, Dhaka.
[16] Miguel, E. and M. Kremer, 2003, Worms: Identifying impacts on education andhealth in the presence of treatment externalities, forthcoming in Econometrica.
[17] Nath, S.R., 1999, Level, pattern, and socio-economic determinants of enrolmentin formal schools of the graduates of BRAC’s non-formal schools, Perspectivesin Education 15(3): 179-189.
[18] Nath, S. R., K. Sylva and J. Grimes, 1999, Raising basic education levels in ruralBangladesh: the impact of a non-formal education programme, InternationalReview of Education 45(1).
[19] The PROBE Team, 1999, Public Report on Basic Education in India, OxfordUniversity Press.
[20] Strauss, J. and D. Thomas, 1995, Human resources: Empirical modeling ofhousehold and family decisions, in Behrman and Srinivasan (eds.), Handbook ofDevelopment Economics, vol. 3A.
[21] Vermeersch, C., 2002, School meals, educational achievement and school compe-tition: Evidence from a randomized experiment, Mimeo, Harvard University.
[22] World Bank, 2000, Bangladesh: Education Sector Review, Volumes 1 & 2, TheUniversity Press Limited, Dhaka.
6 Data Appendix
The data used in this study came from the Education Watch Project. The Educa-tion Watch project was initiated in 1998 by the Campaign for Popular Education(CAMPE), a coalition of more than 400 NGOs involved in non-formal primary edu-cation, together with concerned individuals and organizations. The project aims tocreate more transparency in the education system in Bangladesh by collecting andproviding accurate information relating to education, particularly primary education.CAMPE provided the secretariat for the project, while the Research and EvaluationDivision of BRAC carried out the actual management and execution of the study.Three rounds of data have been collected; the first round in 1998, and the second andthird rounds in 2000. Each round of data contains information on certain aspects of
21

education in Bangladesh. This paper uses the first round of data, which focuses onthe internal efficiency41 of primary education system in Bangladesh.The survey was conducted during October and November 1998, and data from
42,584 households and 885 schools in 240 clusters covering all 64 districts in Bangladeshwas collected. Out of 240 villages under the survey, 81 villages have at least 1 NGOschool.Three survey instruments were used to collect the data:(1.) Household Survey Questionnaire (42,584 households from 312 villages in all
64 districts with 31,092 children). This questionnaire has 4 sections: profile of eachhousehold member, schooling of the members aged 4-20 years, parental information,and household level information.(2.) Assessment of Basic Competencies (ABC) Questionnaire (3,360 children: 7
boys and 7 girls from each of the 240 clusters). This part of the survey is intended toprovide information on the level of basic competencies of the children as an indicatorof achievement. There are four sections: life skills/knowledge, reading, writing, andnumeracy.A child is considered to have ‘basic education’ if he/she satisfied the following
criteria: (i) answering correctly at least seven of the ten life skills questions; (ii) an-swering correctly at least three of the four questions from the reading comprehensionpassage; (iii) correctly communicating a given message through a letter; and (iv)answering correctly at least three of the four mental arithmetic questions.(3.) School Observation Checklist (885 schools). There are seven sections in the
checklist: general information about the school, classroom information, teachers’ pro-file, community participation, retention and dropout, school visit by the supervisors,and losses due to the flood of 1998.The sampling procedure was designed in such a way that the data is nation-
ally representative. Because of variations in educational attainment in differentgeographical regions in Bangladesh, eight different surveys were carried out in eachstrata. The strata considered were six rural divisions, the metropolitan cities and thenon-metropolitan urban areas.42 For each stratum the same sample size and similarsampling strategy were followed. Employing a multi-stage sampling procedure, atthe first stage, for each stratum 30 thanas (pourashava for non-metropolitan urbanareas) were selected through systematic random sampling technique with probabilityproportional to size (PPS). At the second stage, one union (or ward for the urbanstrata) for each selected thana/pourashava was selected randomly. At the thirdstage, one village (mahala for the urban strata) was selected, again randomly, for
41In education literature two types of efficiencies are identified: external and internal. Externalefficiency refers to broader social goals such as better health and productive person-power for thelabour market, while internal efficiency refers to objectives which are internal to the educationsystem such as enrollment and achievement (Chowdhury et al., 1999).42The six rural divisions are rural Dhaka, rural Chittagong, rural Rajshahi, rural Khulna, rural
Barisal, and rural Sylhet, while the metropolitan cities and the non-metropolitan urban areas arelocated throughout the country.
22

each selected union/ward. In other words, 30 villages/mahalla were selected for eachstratum, totalling 240 for the whole of Bangladesh. It came out that all 64 districtsof the country were represented in the sample.For each village/mahalla, the number of households interviewed varied between
125 and 200, depending on the size of the village/mahalla. The interviewers started inthe north-west corner of the village/mahalla, and surveyed the first household of thecorner, and then moved anti-clockwise for the next household, and continued doing so.If the village/mahalla was small, and the number of households did not reach 125, thenthe interviewers moved to the closest village/mahallah and completed the interview.If there were more than 200 households in the village/mahallah, then the surveystopped at reaching the 200th household. For each village/mahallah, 14 children (7boys and 7 girls) aged 11-12 years, chosen randomly from the surveyed households,were interviewed for the ABC survey. For the school survey, all schools located in theselected village/mahallah and its adjacent village/mahallah were surveyed throughthe School Observation Checklist.
23

TABLE 1 SUMMARY OF MAIN VARIABLES
Panel A: Individual Level Means* All Bangladesh Rural Urban Boys Girls Boys Girls Boys Girls Enrollment rate .766 .791 .760 .793 .793 .784 (.42) (.41) (.43) (.41) (.41) (.41) Number of adults in household 2.59 2.59 2.57 2.57 2.67 2.66 (1.37) (1.36) (1.31) (1.34) (1.56) (1.45) Number of siblings 3.83 3.90 3.92 4.00 3.51 3.50 (1.72) (1.69) (1.72) (1.70) (1.68) (1.58) Proportion of boys among siblings .67 .36 .66 .37 .68 .32 (.23) (.23) (.23) (.22) (.24) (.24) Proportion of female headed households .030 .030 .032 .032 .024 .026 (.17) (.17) (.18) (.18) (.15) (.16) Father’s education (class passed) 3.13 3.18 2.64 2.70 5.04 4.95 (4.22) (4.25) (3.77) (3.82) (5.19) (5.17) Mother’s education (class passed) 1.99 2.00 1.58 1.62 3.57 3.41 (3.19) (3.17) (2.68) (2.72) (4.31) (4.17) Proportion of households ‘always in deficit’ .33 .32 .35 .34 .24 .23 (.47) (.47) (.48) (.48) (.43) (.42) Proportion of households ‘sometimes in deficit’ .33 .34 .35 .36 .29 .29 (.47) (.48) (.48) (.48) (.45) (.45) Proportion of households economically ‘balance’ .24 .24 .22 .22 .33 .32 (.43) (.43) (.41) (.41) (.47) (.47) Proportion of households economically ‘surplus’ .09 .10 .08 .08 .15 .16 (.29) (.30) (.27) (.27) (.36) (.37) Proportion of households: mother access to NGO .18 .18 .19 .19 .12 .13 credit (.38) (.38) (.39) (.39) (.33) (.33) Proportion of household: mother involved in .25 .25 .27 .26 .19 .21 income generating activities (.43) (.43) (.44) (.44) (.39) (.41) Proportion of households: member sells labor at .48 .48 .51 .52 .37 .35 least 100 days/year (.50) (.50) (.50) (.50) (.48) (.48) Number of observations 15846 15187 12568 11965 3278 3222 Panel B: Village Level Means All Bangladesh Rural Urban Involvement of NGO schools .07 .066 .084 (.13) (.13) (.15) Involvement of government schools .61 .65 .49 (.29) (.30) (.24) Number of observations 240 180 60 Panel C: School Level Means NGO schools Gov. schools Class size 29.8 55.3 (5.1) (30.7) Proportion of teachers present on day of visit .97 .86 (.15) (.18) Proportion of female teachers .92 .35 (.26) (.33) Teachers’ education (years) 10.1 11.8 (1.3) (1.0) Teachers’ experience (years) 2.65 19.5 (2.4) (5.7) Proportion of schools with PTAs .34 .70 (.47) (.46) Proportion of schools with SMCs .77 .99 (.42) (.09) Attendance rate .85 .55 (.16) (.15) Number of observations 215 353 * Individual Level Means are those of individuals aged 6-10 years old. Standard deviations are in parentheses. See the Data Appendix for detail on the 1998 Education Watch Data.
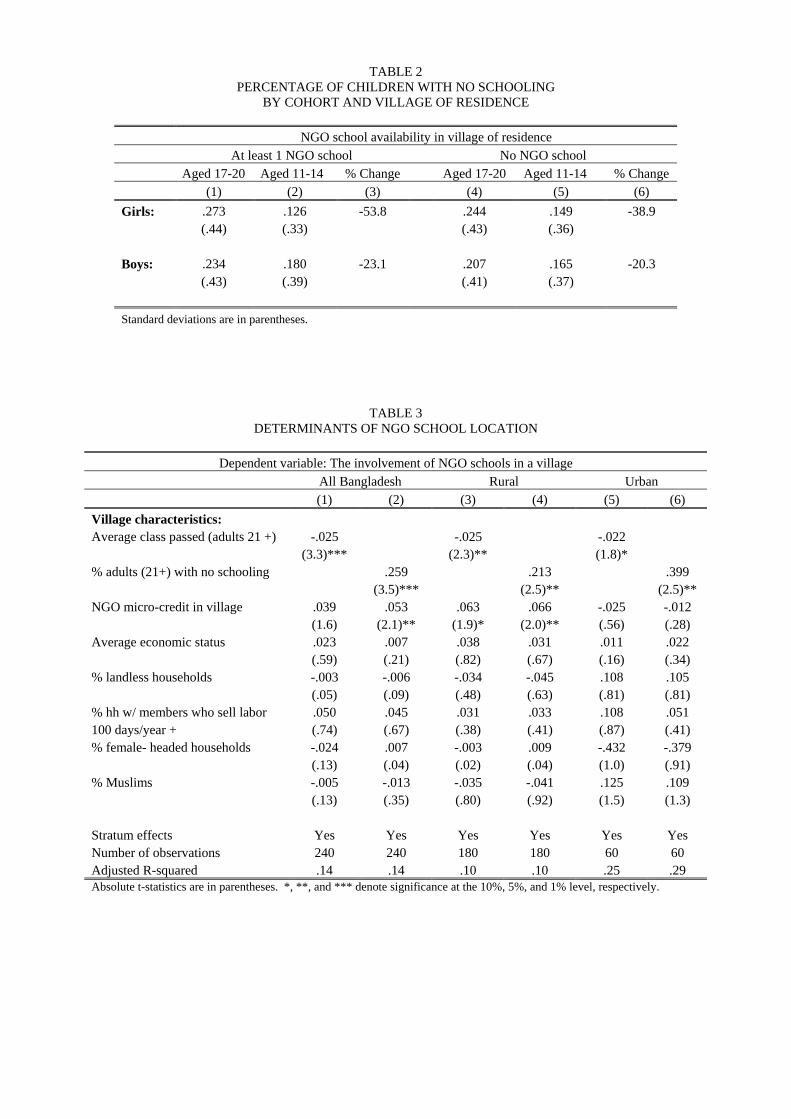
TABLE 2 PERCENTAGE OF CHILDREN WITH NO SCHOOLING
BY COHORT AND VILLAGE OF RESIDENCE
NGO school availability in village of residence At least 1 NGO school No NGO school Aged 17-20 Aged 11-14 % Change Aged 17-20 Aged 11-14 % Change (1) (2) (3) (4) (5) (6) Girls: .273 .126 -53.8 .244 .149 -38.9 (.44) (.33) (.43) (.36) Boys: .234 .180 -23.1 .207 .165 -20.3 (.43) (.39) (.41) (.37) Standard deviations are in parentheses.
TABLE 3 DETERMINANTS OF NGO SCHOOL LOCATION
Dependent variable: The involvement of NGO schools in a village
All Bangladesh Rural Urban (1) (2) (3) (4) (5) (6) Village characteristics: Average class passed (adults 21 +) -.025 -.025 -.022 (3.3)*** (2.3)** (1.8)* % adults (21+) with no schooling .259 .213 .399 (3.5)*** (2.5)** (2.5)** NGO micro-credit in village .039 .053 .063 .066 -.025 -.012 (1.6) (2.1)** (1.9)* (2.0)** (.56) (.28) Average economic status .023 .007 .038 .031 .011 .022 (.59) (.21) (.82) (.67) (.16) (.34) % landless households -.003 -.006 -.034 -.045 .108 .105 (.05) (.09) (.48) (.63) (.81) (.81) % hh w/ members who sell labor .050 .045 .031 .033 .108 .051 100 days/year + (.74) (.67) (.38) (.41) (.87) (.41) % female- headed households -.024 .007 -.003 .009 -.432 -.379 (.13) (.04) (.02) (.04) (1.0) (.91) % Muslims -.005 -.013 -.035 -.041 .125 .109 (.13) (.35) (.80) (.92) (1.5) (1.3) Stratum effects Yes Yes Yes Yes Yes Yes Number of observations 240 240 180 180 60 60 Adjusted R-squared .14 .14 .10 .10 .25 .29 Absolute t-statistics are in parentheses. *, **, and *** denote significance at the 10%, 5%, and 1% level, respectively.

TABLE 4ENTRY OF NGO SCHOOLS AND GIRLS’ ENROLLMENT AND CLASS PASSED:
BOYS AND GIRLS AGED 11 TO 20
Dependent variable: Ever enrolled = 1 Dependent variable: Last class passed All children Exposed Non-
exposed All children Exposed Non-
exposed (1) (2) (3) (4) (5) (6) (7) (8) Exposed to NGO school .182 .004 .207 .089 (2.0)** (.03) (1.7)* (.69) Girl*Exposed to NGO school .385 .231 (2.9)*** (2.8)*** Girl .065 -1.53 .308 .036 .102 -1.88 .290 .079 (1.3) (6.4)*** (2.7)*** (.70) (2.6)** (7.1)*** (3.1)*** (1.9)* Control for child and Yes Yes Yes Yes Yes Yes Yes Yes family characteristics Village effects Yes Yes Yes Yes Yes Yes Yes Yes Number of observations 43738 43738 4369 39264 43677 43677 4468 39209 Pseudo R2 / Adjusted R2 .254 .258 .253 .257 .449 .449 .408 .449 For columns (1) – (4), absolute z-statistics are in parentheses. For columns (5) – (8), absolute t-statistics are in parentheses. *, **, and *** denote significance at the 10%, 5%, and 1% level, respectively. Standard errors are corrected for clustering at the village level. Child and family characteristics include: age of the child, number of adults in the household, number of siblings, percentage of boys among all siblings, whether the household is a female headed household, father’s education, mother’s education, household’s self-perceived economic status, whether mother has access to NGO credit, whether mother is engaged in income-generating activities, whether there is at least one member of the household who sells labor more than 100 days/year, and religion. A child is considered ‘exposed to an NGO school’ if he/she was 10 years old or younger when the first NGO school in the village was established.

TABLE 5ENTRY OF NGO SCHOOLS, ENROLLMENT, AND CLASS PASSED:
BOYS AND GIRLS AGED 11 TO 20
Dep Var: Ever enrolled = 1 Dep var: Last class passed Boys Girls Boys Girls (1) (2) (3) (4) Number NGO schools*age11 .003 .093 .231 .261 (.03) (1.0) (1.6) (1.9)*
12 .130 .162 .229 .269 (1.4) (2.1)** (1.8)* (2.1)**
13 .007 .177 .206 .245 (.08) (2.3)** (1.5) (1.7)*
14 .049 .161 .138 .294 (.38) (2.2)** (.93) (2.1)**
15 .102 .196 .194 .266 (1.1) (2.5)** (1.4) (2.1)**
16 .012 .099 .088 .171 (.14) (1.5) (.68) (1.4)
17 -.020 .116 .030 .138 (.25) (1.5) (.24) (1.1)
18 .030 .099 .010 .109 (.36) (1.3) (.07) (.93)
19 -.042 .023 -.080 -.034 (.41) (.20) (.46) (.19) Control for child and Yes Yes Yes Yes family characteristics Village effects Yes Yes Yes Yes Number of observations 22081 21657 22052 21629 Pseudo R2 / Adjusted R2 .238 .304 .448 .459 For columns (1) and (2), absolute z-statistics are in parentheses. For columns (3) and (4), absolute t-statistics are in parentheses. *, **, and *** denote significance at the 10%, 5%, and 1% level, respectively. Standard errors are corrected for clustering at the village level. Child and family characteristics include: age of the child, number of adults in the household, number of siblings, percentage of boys among all siblings, whether the household is a female headed household, father’s education, mother’s education, household’s self-perceived economic status, whether mother has access to NGO credit, whether mother is engaged in income-generating activities, whether there is at least one member of the household who sells labor more than 100 days/year, and religion. A child is considered ‘exposed to an NGO school’ if he/she was 10 years old or younger when the first NGO school in the village was established.

TABLE 6 SCHOOL ENROLLMENT: BOYS AND GIRLS AGED 6 TO 10
Dependent variable: Currently enrolled in school = 1
(1) (2) (3) (4) At least 1 NGO school .013 -.114 (.15) (1.2) Girl*At least 1 NGO school .220 (2.6)*** At least 1 government school .107 .089 (.71) (.54) Girl*At least 1 government school .045 (.36) NGO school involvement -.656 -.917 (1.7)* (2.2)** Girl*NGO school involvement .543 (1.8)* Government school involvement .075 -.006 (.47) (.04) Girl*Gov. school involvement .168 (1.3) Girl .114 -.748 .114 -.680 (2.6)*** (2.6)*** (2.7)*** (2.3)** Control for child and family Yes Yes Yes Yes characteristics Control for village characteristics Yes Yes Yes Yes Stratum effects Yes Yes Yes Yes Number of observations 31033 31033 31033 31033 Pseudo R2 .143 .146 .143 .146 Absolute z-statistics are in parentheses. *, **, and *** denote significance at the 10%, 5%, and 1% level, respectively. Standard errors are corrected for clustering at the village level. Child and family characteristics include: age of the child, number of adults in the household, number of siblings, percentage of boys among all siblings, whether the household is a female headed household, father’s education, mother’s education, household’s self-perceived economic status, whether mother has access to NGO credit, whether mother is engaged in income-generating activities, whether there is at least one member of the household who sells labor more than 100 days/year, and religion. Village characteristics include percentage of adults with no schooling, whether there is an NGO micro-credit in the village, average economic status, percentage of landless households, percentage of households with members who sell labor more than 100 days/year, percentage of female headed households, and percentage of Muslims in the village.

TABLE 7SCHOOL ENROLLMENT: RURAL VERSUS URBAN AREAS
Rural versus urban Dep var: Ever enrolled = 1 Dep var: Currently enrolled = 1 Rural Urban Rural Urban (1) (2) (3) (4) PANEL A: 11-20 years old Exposed to NGO school .010 -.104 (.08) (.58) Girl*Exposed to NGO school .315 .594 (2.2)** (1.9)* Girl -1.37 -2.23 (4.4)*** (4.1)*** PANEL B: 6-10 years old Measure of supply of NGO schools (1) At least 1 NGO school -.149 -.103 (1.4) (.51) Girl*At least 1 NGO .195 .211 school (2.0)** (1.5) At least 1 gov. school .015 .157 (.07) (.77) Girl*At least 1 gov. -.022 .020 school (.13) (.14) Girl -.639 -.407 (2.0)** (.87) PANEL C: 6-10 years old Measure of supply of NGO schools (2) Fraction: NGO schools -1.02 -1.88 (1.9)* (2.5)** Girl*Fraction NGO .796 -.086 (2.2)** (.22) Fraction: Gov. schools -.198 -.025 (1.1) (.06) Girl*Fraction Gov. .116 .015 (.85) (.06) Girl -.591 -.305 (1.8)* (.60) Control for child and Yes Yes Yes Yes family characteristics Control for village No No Yes Yes characteristics Stratum effects No No Yes Yes Village effects Yes Yes No No Absolute z-statistics are in parentheses. *, **, and *** denote significance at the 10%, 5%, and 1% level, respectively. Standard errors are corrected for clustering at the village level. Child and family characteristics include: age of the child, number of adults in the household, number of siblings, percentage of boys among all siblings, whether the household is a female headed household, father’s education, mother’s education, household’s self-perceived economic status, whether mother has access to NGO credit, whether mother is engaged in income-generating activities, whether there is at least one member of the household who sells labor more than 100 days/year, and religion. Village characteristics include percentage of adults with no schooling, whether there is an NGO micro-credit in the village, average economic status, percentage of landless households, percentage of households with members who sell labor more than 100 days/year, percentage of female headed households, and percentage of Muslims in the village.

TABLE 8 SCHOOL ENROLLMENT: BRAC TARGET VERSUS NON-TARGET HOUSEHOLDS
BOYS AND GIRLS AGED 6 TO 10
Dependent variable: Currently enrolled in school = 1 BRAC target versus non-target households Target Non-target Target Non-target (1) (2) (3) (4)
At least 1 NGO school -.138 -.181 (1.0) (1.7)* Girl*At least 1 NGO school .214 .169 (1.7)* (1.5) At least 1 government school .187 -.299 (.88) (1.2) Girl*At least 1 government school -.259 .352 (1.4) (1.4) NGO school involvement -.737 -1.39 (1.1) (3.4)** Girl*NGO school involvement .872 .648 (2.0)** (1.6) Government school involvement -.029 -.364 (.14) (1.8) Girl*Gov. school involvement .198 -.026 (1.1) (.14) Girl -.403 -.608 -.684 -.216 (1.0) (1.6) (1.6) (.66) Control for child and family Yes Yes Yes Yes characteristics Control for village characteristics Yes Yes Yes Yes Stratum effects Yes Yes Yes Yes Number of observations 10331 14202 10331 14202 Pseudo R2 .107 .142 .107 .142 Absolute z-statistics are in parentheses. *, **, and *** denote significance at the 10%, 5%, and 1% level, respectively. Standard errors are corrected for clustering at the village level. Child and family characteristics include: age of the child, number of adults in the household, number of siblings, percentage of boys among all siblings, whether the household is a female headed household, father’s education, mother’s education, household’s self-perceived economic status, whether mother has access to NGO credit, whether mother is engaged in income-generating activities, whether there is at least one member of the household who sells labor more than 100 days/year, and religion. Village characteristics include percentage of adults with no schooling, whether there is an NGO micro-credit in the village, average economic status, percentage of landless households, percentage of households with members who sell labor more than 100 days/year, percentage of female headed households, and percentage of Muslims in the village.

TABLE 9BRAC SCHOOLS AND ENROLLMENT:
BOYS AND GIRLS AGED 6 TO 10
Dependent variable: Currently enrolled = 1 All Bangladesh Rural Urban Target Non-target (1) (2) (3) (4) (5) (6) Fraction: BRAC schools -1.42 -1.91 -1.80 3.34 -2.00 -1.63 (3.4)*** (5.1)*** (4.4)*** (4.2)*** (4.1)*** (3.7)*** Girl*Fraction BRAC 1.05 1.27 -.144 1.61 .836 (2.3)** (3.1)*** (.26) (3.1)*** (1.8)* Fraction: Gov. schools .044 .037 -.234 .319 -.094 -.352 (.28) (.23) (1.3) (.85) (.47) (1.8)* Girl*Fraction Gov. .169 .126 -.031 .211 -.021 (1.4) (.91) (.12) (1.2) (.12) Girl .116 -.680 -.606 -.169 -.716 -.226 (2.7)*** (2.3)** (1.9)* (.32) (1.7)* (.69) Control for child and Yes Yes Yes Yes Yes Yes family characteristics Control for village Yes Yes Yes Yes Yes Yes characteristics Stratum effects Yes Yes Yes Yes Yes Yes Number of observations 31033 31033 24533 6500 10331 14202 Pseudo R2 .146 .148 .151 .190 .109 .142 Absolute z-statistics are in parentheses. *, **, and *** denote significance at the 10%, 5%, and 1% level, respectively. Standard errors are corrected for clustering at the village level. Child and family characteristics include: age of the child, number of adults in the household, number of siblings, percentage of boys among all siblings, whether the household is a female headed household, father’s education, mother’s education, household’s self-perceived economic status, whether mother has access to NGO credit, whether mother is engaged in income-generating activities, whether there is at least one member of the household who sells labor more than 100 days/year, and religion. Village characteristics include percentage of adults with no schooling, whether there is an NGO micro-credit in the village, average economic status, percentage of landless households, percentage of households with members who sell labor more than 100 days/year, percentage of female headed households, and percentage of Muslims in the village.

TABLE 10 SCHOOL CHARACTERISTICS AND ENROLLMENT:
BOYS AND GIRLS AGED 6 TO 10
Dependent variable: Currently enrolled in school = 1 Pooled Interacted Level *Girl (1) (2) (3) Class size (NGO) .012 .004 .016 (.67) (.19) (.78) Class size (Gov.) -.008 -.007 -.001 (2.5)** (2.2)** (.18) % teachers present (NGO) -.577 -.304 -.811 (.22) (.11) (0.38) % teachers present (Gov.) -.254 -.096 -.497 (.48) (.17) (1.1) % female teachers (NGO) 1.41 .927 1.04 (4.3)*** (2.7)*** (2.3)** % female teachers (Gov.) .165 .007 .276 (.30) (.01) (.67) Teachers' education (NGO) -.026 .002 -.056 (.31) (.02) (.89) Teachers' education (Gov.) .056 .003 .133 (.39) (.02) (1.2) Teachers' experience (NGO) -.013 -.027 .019 (.44) (.67) (.47) Teachers' experience (Gov.) .034 .006 .065 (1.3) (.23) (2.7)*** % of schools with PTAs (NGO) .367 .364 -.005 (1.8)* (1.7)* (.03) % of schools with PTAs (Gov.) -.047 -.025 -.078 (.28) (.15) (.50) % of schools with SMCs (NGO) .316 .474 -.331 (1.4) (2.0)** (1.7)* % of schools with SMCs (Gov.) 1.84 2.72 -1.97 (1.5) (1.9)* (1.5) Control for child and Yes Yes family characteristics Control for village Yes Yes characteristics Stratum effects Yes Yes Number of observations 8611 8611 Pseudo R2 .158 .168 Absolute z-statistics are in parentheses. *, **, and *** denote significance at the 10%, 5%, and 1% level, respectively. Standard errors are clustered at the village level. Child and family characteristics include: age of the child, number of adults in the household, number of siblings, percentage of boys among all siblings, whether the household is a female headed household, father’s education, mother’s education, household’s self-perceived economic status, whether mother has access to NGO credit, whether mother is engaged in income-generating activities, whether there is at least one member of the household who sells labor more than 100 days/year, and religion. Village characteristics include percentage of adults with no schooling, whether there is an NGO micro-credit in the village, average economic status, percentage of landless households, percentage of households with members who sell labor more than 100 days/year, percentage of female headed households, and percentage of Muslims in the village.

TABLE 11 TEST SCORES: BOYS AND GIRLS AGED 11 TO 12
ABC Life skills Reading Writing Numeracy Level *Girl Level *Girl Level *Girl Level *Girl Level *Girl (1) (2) (3) (4) (5) (6) (7) (8) (9) (10) Currently attending .902 2.02 .708 .498 .838 .053 2.35 .468 .384 .105 NGO school (1.6) (2.5)** (2.6)*** (1.4) (4.6)*** (.20) (5.6)*** (.79) (2.3)** (.45) Currently attending -.046 1.51 -.132 .269 .361 -.030 0.89 .015 .212 -.068 government school (.10) (1.9)* (.56) (.88) (2.6)** (.16) (3.1)*** (.04) (1.4) (.30) Indicator: Girl -1.48 -.850 .604 .383 -.943 (1.1) (1.5) (1.9)* (.73) (4.0)*** Class passed .761 -.062 .399 -.049 .525 -.005 1.08 .025 .226 .102 (8.6)*** (.53) (9.3)*** (.87) (17.4)*** (.12) (17.5)*** (.31) (9.0)*** (2.7)***Listen to the radio .526 -.494 .226 .029 .136 -.026 .200 -.201 -.014 .074 (3.1)*** (2.0)** (2.5)** (.23) (2.1)** (.28) (1.6) (1.0) (.26) (.94) Watch television -.058 .140 .208 -.061 .041 -.110 -.013 -.061 .039 -.144 (.32) (.62) (2.0)** (.46) (.55) (1.1) (.10) (.33) (.71) (1.7)* Read newspaper .973 .078 .366 .048 -.090 .427 -.030 .686 -.023 .218 (2.9)*** (.18) (2.6)** (.20) (.90) (2.9)*** (.15) (2.0)** (.38) (1.9)* Father's education .035 .005 .016 .001 .019 .002 .051 .004 -.002 -.000 (1.4) (.14) (1.1) (.03) (1.8)* (.15) (2.7)*** (.14) (.22) (.02) Mother’s education .054 -.028 .011 .024 -.018 .013 -.003 .019 .010 -.003 (1.5) (.58) (.56) (.96) (1.4) (.75) (.11) (.55) (1.1) (.18) Always in deficit -.206 .341 .096 .017 -.073 .013 -.159 .047 .034 .059 (.83) (1.0) (.71) (.10) (.81) (.11) (.89) (.19) (.43) (.53) Sometimes in deficit -.252 .331 -.078 .006 -.066 .086 -.256 .180 -.010 .106 (1.3) (1.1) (.63) (.04) (.83) (.71) (1.7) (.78) (.15) (1.2) Surplus -.540 .708 -.153 .022 -.237 .343 -.614 .683 -.072 .181 (1.9)* (1.9)* (.99) (.11) (2.0)** (2.1)** (2.7)*** (2.2)** (.92) (1.5) Mother: access to NGO credit -.037 .294 .156 -.026 -.070 .146 -.164 .089 .035 .028 (.16) (.95) (1.4) (.16) (.70) (1.2) (.86) (.38) (.53) (.29) Mother: involve in income .010 -.125 -.067 .115 -.051 -.031 -.122 -.138 .030 -.030 generating activities (.05) (.48) (.62) (.78) (.64) (.29) (.78) (.69) (.50) (.33) At least 1 member of hh .215 -.179 .026 -.170 .037 -.153 .052 -.197 .029 .060 sells labor 100 days/year + (1.1) (.65) (.26) (1.2) (.52) (1.6) (.35) (1.0) (.53) (.70) Control for other family charac. Yes Yes Yes Yes Yes and other school types Village effects Yes Yes Yes Yes Yes Number of observations 3061 3324 3324 3324 3324 Pseudo R2 / Adjusted R2 .339 .363 .518 .577 .295 For columns (1) and (2), absolute z-statistics are in parentheses. For columns (3) to (10), absolute t-statistics are in parentheses. *, **, and *** denote significance at the 10%, 5%, and 1% level, respectively. Standard errors are clustered at the village level. Child and family characteristics include: age of the child, number of adults in the household, number of siblings, percentage of boys among all siblings, whether the household is a female headed household, father’s education, mother’s education, household’s self-perceived economic status, whether mother has access to NGO credit, whether mother is engaged in income-generating activities, whether there is at least one member of the household who sells labor more than 100 days/year, and religion.

Appendix 2:
TABLE 12 DETERMINANTS OF SCHOOL ENROLLMENT: BOYS AND GIRLS AGED 6 TO 10
Dependent variable: Currently enrolled in school = 1
All Bangladesh Rural Urban Boys Girls Boys Girls Boys Girls (1) (2) (3) (4) (5) (6) NGO school involvement -.862 -.444 -.870 -.403 -1.73 -2.10 (2.2)** (-1.0) (1.7)* (.77) (2.3)** (2.0)** Government school involvement .039 .130 -.140 -.142 .045 -.063 (.24) (.71) (.75) (.73) (.10) (.10) Number adults .080 .080 .094 .111 .019 -.018 (3.9)*** (4.1)*** (4.2)*** (5.0)*** (.40) (.49) Number siblings -.036 -.058 -.057 -.074 .059 -.004 (2.3)** (3.5)*** (3.5)*** (4.1)*** (1.7)* (.10) Percentage of boys -.447 .174 -.463 .168 -.382 .197 (5.0)*** (1.5) (4.5)*** (1.3) (2.1)** (.82) Female head of household -.213 -.052 -.257 -.082 .070 .129 (1.9)* (.38) (2.1)** (.53) (.21) (.39) Father's education .078 .107 .093 .116 .042 .090 (8.6)*** (10.4)*** (8.9)*** (10.7)*** (2.2)** (4.1)*** Mother's education .139 .140 .128 .126 .193 .188 (10.5)*** (9.2)*** (8.3)*** (6.7)*** (7.1)*** (6.6)*** Always in deficit -.530 -.536 -.512 -.571 -.642 -.311 (7.6)*** (7.1)*** (6.7)*** (6.8)*** (4.2)*** (2.0)** Sometimes in deficit -.106 -.100 -.143 -.184 .005 .199 (1.7)** (1.3) (2.1)** (2.2)** (.04) (1.3) Surplus .168 -.432 .120 -.111 .315 -.731 (1.6) (3.1)*** (.94) (.75) (1.7)* (3.3)*** Mother: access to NGO credit .257 .285 .172 .189 .667 .637 (3.3)*** (3.6)*** (2.1)** (2.3)** (4.1)*** (3.4)*** Mother: income generating -.009 -.132 .054 -.108 -.391 -.333 activities (.16) (1.9)** (.84) (1.3) (3.6)*** (2.7)*** At lease 1 household member -.490 -.357 -.537 -.364 -.308 -.394 sells labour 100 days/year + (9.7)*** (6.2)*** (9.6)*** (5.7)*** (2.9)*** (3.3)*** Stratum effects Yes Yes Yes Yes Yes Yes Number of observations 15846 15187 12568 11965 3278 3222 Pseudo R2 .143 .153 .140 .162 .191 .185 Absolute z-statistics are in parentheses. *, **, and *** denote significance at the 10%, 5%, and 1% level, respectively.Standard errors are corrected for clustering at the village level. Child and family characteristics include: age of the child, number of adults in the household, number of siblings, percentage of boys among all siblings, whether the household is a female headed household, father’s education, mother’s education, household’s self-perceived economic status, whether mother has access to NGO credit, whether mother is engaged in income-generating activities, whether there is at least one member of the household who sells labor more than 100 days/year, and religion. Villagecharacteristics include percentage of adults with no schooling, whether there is an NGO micro-credit in the village, average economic status, percentage of landless households, percentage of households with members who sell labor more than 100 days/year, percentage of female headed households, and percentage of Muslims in the village. Percentage of adults with no schooling has a negative and significant relationship with the probability of being enrolled for both boys and girls. Percentage of households with members who sell labor more than 100 days/year has a positive and significant relationship with the probability of being enrolled for boys. All other village characteristics are insignificant.

0
50
100
150
200
250
1963 1984 1985 1986 1988 1990 1991 1992 1993 1994 1995 1996 1997 1998Year
Num
ber o
f NG
O s
choo
ls in
are
as u
nder
th
e Ed
ucat
ion
Wat
ch s
urve
y
All Bangladesh Rural areas Urban areas
FIGURE 1: EXPANSION OF NGO SCHOOLS IN BANGLADESH
Notes: All variables refer to the cumulative number of NGO schools. The variables are constructed using information from the 1998 Education Watch data. The Data Appendix provides a full description of the data.

0102030405060708090
100
AllBangladesh
Rural Urban Rural BRACTarget
Rural Non-target
Net
enr
ollm
ent (
%)
BoysGirls
FIGURE 2A: NET ENROLLMENT IN BANGLADESH
0102030405060708090
100
Always indeficit
Sometimesin deficit
Balance Surplus
Self perceived economic status
Net
enr
ollm
ent (
%)
BoysGirls
FIGURE 2B: NET ENROLLMENT AND SELF PERCEIVED ECONOMIC STATUS IN RURAL BANGLADESH
0102030405060708090
100
Always indeficit
Sometimesin deficit
Balance Surplus
Self perceived economic status
Net
enr
ollm
ent (
%)
BoysGirls
FIGURE 2C: NET ENROLLMENT AND SELF PERCEIVED ECONOMIC STATUS IN URBAN BANGLADESH
Notes: The variables are constructed using information from the 1998 Education Watch data. The Data Appendix provides a full description of the data. BRAC target households are defined as households with less than 0.5 acre of land and at least 1 person engaged in manual labor for at least 100 days a year (Nath, 1999).

0
10
20
30
40
50
60
70
80
90
100
RuralBangladesh
UrbanBangladesh
Rural India Urban India Rural Nepal UrbanNepal
Net
enr
ollm
ent (
%)
BoysGirls
FIGURE 3A: NET ENROLLMENT IN BANGLADESH, INDIA, AND NEPAL: BY AREA
0
1020
30
40
5060
70
8090
100
Bangladeshrich 20%
Bangladeshpoor 40%
India rich20%
India poor40%
Nepal rich20%
Nepal poor40%
Net
enr
ollm
ent (
%)
BoysGirls
FIGURE 3B: NET ENROLLMENT IN BANGLADESH, INDIA, AND NEPAL: BY ECONOMIC STATUS
Notes: The variables are constructed using information from the Demographic and Health Survey (Bangladesh 1999, India 1998/99, and Nepal 2001), as reported in the data sheet in support of Filmer (2003).


