Partners Trust Q4 2015 Market Statistics
40
Q4 2015 MARKET STATS REAL ESTATE REPORT
-
Upload
partners-trust -
Category
Documents
-
view
215 -
download
1
description
A review of current real estate market conditions for the Los Angeles area featuring year-over-year data broken down by neighborhood.
Transcript of Partners Trust Q4 2015 Market Statistics

Q4 2015 MARKET STATSREAL ESTATE REPORT


Q4 2015 MARKET STATSREAL ESTATE REPORT
INTRODUCTION ............................................................. 3
Los Angeles & WestsideCOASTAL COMMUNITIES ............................................ 7
THE HILLS ........................................................................ 9
WESTSIDE ........................................................................ 11
HOLLYWOOD HILLS & MID-CITY .............................. 13
WESTSIDE / SOUTH ...................................................... 15
METRO LOS ANGELES ................................................. 17
San Fernando ValleySAN FERNANDO VALLEY - WEST OF 405 ........... 21
SAN FERNANDO VALLEY - EAST OF 405 ............ 23
San Gabriel ValleyPASADENA ...................................................................... 27
LA CAÑADA FLINTRIDGE ........................................... 29
NORTHEAST LOS ANGELES ...................................... 31
EAST SAN GABRIEL VALLEY ..................................... 33
South BayMANHATTAN BEACH.................................................... 37


3PARTNERS TRUST 2015 Q4 MARKET STATS REPORT | 2015 MLS/CLAW/PFAR/CRMLS DATA™
INTRODUCTION
The fourth quarter of 2015 saw home prices continue to rise in most areas of the Los Angeles market while the number of sales decreased, following a nationwide trend. Buyers, however, continue to seek value, resulting in an increase in home sales in a few select Los Angeles neighborhoods.
The November report from the National Association of Realtors® (NAR) showed that nationwide total existing home sales fell 10.5% to a seasonally adjusted annual rate of 4.76 million, the slowest pace in 19 months. Analysts suspect that the new federal “Know Before You Owe” disclosure rule may have slowed sales, along with delayed escrow closings, which potentially pushed some would-be November transactions into December. Local escrow companies reported that transactions involving loans were delayed on average 12-15 days. Locally, Deal Seeking Continues Days on market have been steadily increasing for homes at the upper price points while more modestly priced homes continue to trade briskly. Overall, sales in the fourth quarter were down even as prices continued to rise in many areas. From 2014 to 2015, the average price for a single-family residence in Brentwood increased more than 50%, from $3,055,358 to $4,695,773, making it one of the leaders on the Westside. More condos continue to come on the market in the Westwood-Century City area. An influx of units drove sales dramatically and pushed the average sale prices up to $1.274 million. The San Fernando Valley continued its 2015 trend of stronger sales and moderately rising prices. Sales in some areas slowed as housing prices in areas such as Encino, Sherman Oaks and Studio City rose to Westside levels. The average sold price in Studio City was $1,466,108 and the average price for a sold single-family residence in Encino was $1,354,661. The trendy areas on the Eastside, such as Silver Lake-Echo Park and Glassell Park, saw sales increase as buyers sought value in gentrifying areas. Average sale prices also rose in Mount Washington, Eagle Rock, and Highland Park. These areas continue to attract development as well as retail and commercial opportunities. Housing affordability remains around 30% in Los Angeles, and low inventory remains an ongoing issue. Rents in some areas of Los Angeles rose by double digits in 2015 and that trend is only expected to increase. Rental vacancy rates remain low, generating strong interest in
income-producing multifamily buildings. Development is a hot topic across the city as planned interim ordinances could limit some homeowners’ ability to expand their homes. At Partners Trust, we are keeping an eye on this situation and attending town hall meetings so we are informed on the latest changes. Interest Rates Rise
In December, the Federal Reserve Board finally enacted a long-awaited rate hike, raising the benchmark interest rate by 0.25% percentage points. “The economic recovery has clearly come a long way, although it is not complete,” the Fed’s chairwoman, Janet L. Yellen, said at a press conference at the time of the announcement. The final third quarter GDP estimate put economic growth at a modest but steady 2%. Most economists predict that future interest rate increases will be slow and modest to avoid jostling a still unsteady economy. Mortgage rates are expected to rise but remain close to or under 5% for most of 2016. Job creation has been strong in the past two years. Now, wages are slowly catching up. The latest data from the Labor Department shows that wages are up 2.5% from a year ago. Construction is continuing to fuel that market as well. Nationwide builders added 45,000 jobs in December after a 48,000 increase in November. Both housing starts and permits rose in November and November marked the eighth straight month that starts were above 1 million units; which is the longest stretch since 2007. In Los Angeles County, the unemployment rate for November dipped below 6% for the first time in eight years and many local employers are continuing with plans to add employees and offices in 2016.
Looking Forward
Although 2016 has gotten off to a bit of an unsteady start in the stock market, indications are strong for the economy’s path of modest improvement to continue. An election year can be a time when the economy slows a bit but overall the table is set for a year very similar to 2015 in the real estate market. One of the biggest challenges remains low inventory. People have been staying in their homes longer, putting millennials who are ready for homeownership at a disadvantage. However, there continues to be opportunities for those who are both patient and prepared.

4 | LOS ANGELES & WESTSIDE

LOS ANGELES& WESTSIDE

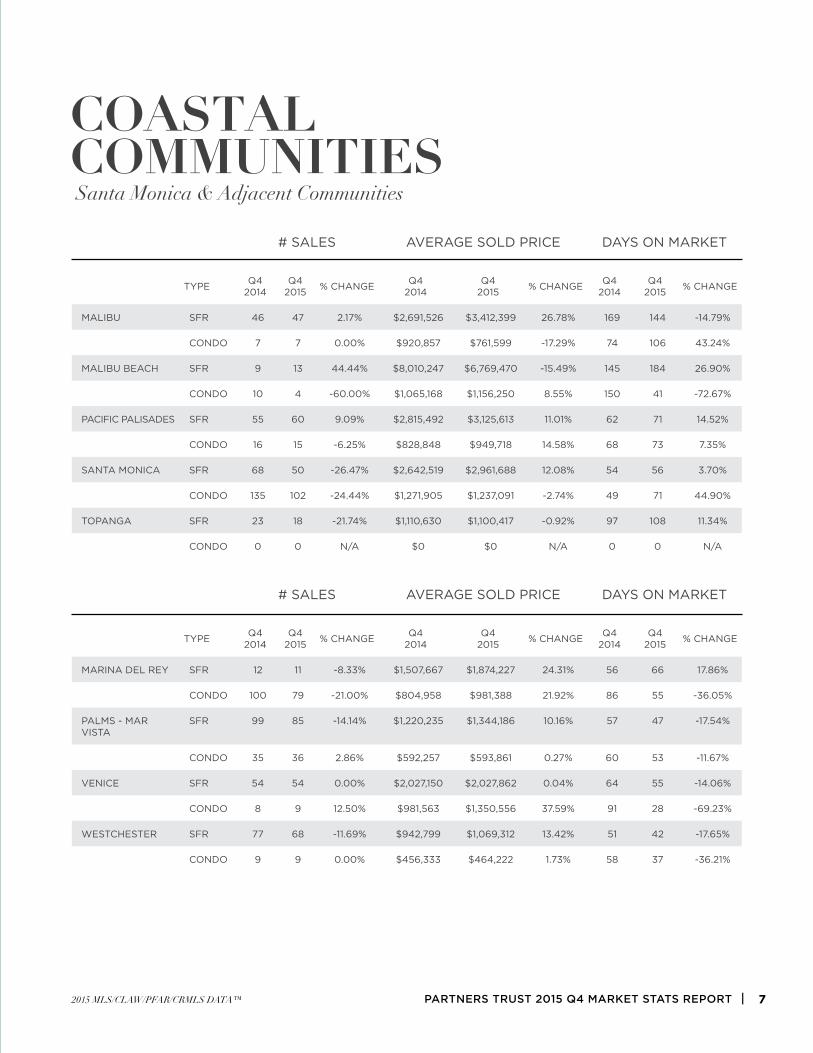
In Santa Monica, single-family residence sales continued to decline, as inventory remained low. Sales were down -26.47% year over year while prices rose over 12% to over $2.96 million. Single-family residences in Pacific Palisades were up 9% and the average sale price was over $3.125 million.
7PARTNERS TRUST 2015 Q4 MARKET STATS REPORT | 2015 MLS/CLAW/PFAR/CRMLS DATA™
# SALES AVERAGE SOLD PRICE DAYS ON MARKET
TYPE Q42014
Q42015 % CHANGE Q4
2014Q4
2015 % CHANGE Q42014
Q42015 % CHANGE
MALIBU SFR 46 47 2.17% $2,691,526 $3,412,399 26.78% 169 144 -14.79%
CONDO 7 7 0.00% $920,857 $761,599 -17.29% 74 106 43.24%
MALIBU BEACH SFR 9 13 44.44% $8,010,247 $6,769,470 -15.49% 145 184 26.90%
CONDO 10 4 -60.00% $1,065,168 $1,156,250 8.55% 150 41 -72.67%
PACIFIC PALISADES SFR 55 60 9.09% $2,815,492 $3,125,613 11.01% 62 71 14.52%
CONDO 16 15 -6.25% $828,848 $949,718 14.58% 68 73 7.35%
SANTA MONICA SFR 68 50 -26.47% $2,642,519 $2,961,688 12.08% 54 56 3.70%
CONDO 135 102 -24.44% $1,271,905 $1,237,091 -2.74% 49 71 44.90%
TOPANGA SFR 23 18 -21.74% $1,110,630 $1,100,417 -0.92% 97 108 11.34%
CONDO 0 0 N/A $0 $0 N/A 0 0 N/A
COASTALCOMMUNITIESSanta Monica & Adjacent Communities
# SALES AVERAGE SOLD PRICE DAYS ON MARKET
TYPE Q42014
Q42015 % CHANGE Q4
2014Q4
2015 % CHANGE Q42014
Q42015 % CHANGE
MARINA DEL REY SFR 12 11 -8.33% $1,507,667 $1,874,227 24.31% 56 66 17.86%
CONDO 100 79 -21.00% $804,958 $981,388 21.92% 86 55 -36.05%
PALMS - MAR VISTA
SFR 99 85 -14.14% $1,220,235 $1,344,186 10.16% 57 47 -17.54%
CONDO 35 36 2.86% $592,257 $593,861 0.27% 60 53 -11.67%
VENICE SFR 54 54 0.00% $2,027,150 $2,027,862 0.04% 64 55 -14.06%
CONDO 8 9 12.50% $981,563 $1,350,556 37.59% 91 28 -69.23%
WESTCHESTER SFR 77 68 -11.69% $942,799 $1,069,312 13.42% 51 42 -17.65%
CONDO 9 9 0.00% $456,333 $464,222 1.73% 58 37 -36.21%

In Bel-Air / Holmby Hills, the average price of a single-family residence rose to $4.27 million, while days on market shrank -20.25%. The average single-family residence price dropped -5.42% to $6.63 million in Beverly Hills.

9PARTNERS TRUST 2015 Q4 MARKET STATS REPORT | 2015 MLS/CLAW/PFAR/CRMLS DATA™
# SALES AVERAGE SOLD PRICE DAYS ON MARKET
TYPE Q42014
Q42015 % CHANGE Q4
2014Q4
2015 % CHANGE Q42014
Q42015 % CHANGE
BEL AIR - HOLMBY HILLS
SFR 39 29 -25.64% $3,600,536 $4,278,776 18.84% 79 63 -20.25%
CONDO 2 2 0.00% $970,000 $515,000 -46.91% 110 56 -49.09%
BEVERLY HILLS SFR 35 29 -17.14% $7,012,350 $6,632,176 -5.42% 84 60 -28.57%
CONDO 21 25 19.05% $1,101,055 $1,460,219 32.62% 86 77 -10.47%
BEVERLY HILLS P.O. SFR 44 45 2.27% $4,016,730 $3,912,644 -2.59% 95 84 -11.58%
CONDO 1 0 N/A $585,000 $0 N/A 323 0 N/A
THEHILLSBeverly Hills & Adjacent Communities

In Brentwood, average sale prices for single-family homes elevated 53.69% to over $4.695 million, while sales dropped nearly 24%. Sales of condos in the area rose 9.62% as days on market fell and the average price lifted to $834,205.

11PARTNERS TRUST 2015 Q4 MARKET STATS REPORT | 2015 MLS/CLAW/PFAR/CRMLS DATA™
# SALES AVERAGE SALES PRICE DAYS ON MARKET
TYPE Q42014
Q42015 % CHANGE Q4
2014Q4
2015 % CHANGE Q42014
Q42015 % CHANGE
BEVERLYWOOD SFR 51 38 -25.49% $1,022,878 $1,138,489 11.30% 57 54 -5.26%
CONDO 21 15 -28.57% $676,869 $646,000 -4.56% 65 77 18.46%
BRENTWOOD SFR 70 53 -24.29% $3,055,358 $4,695,773 53.69% 58 64 10.34%
CONDO 52 57 9.62% $807,918 $834,205 3.25% 59 51 -13.56%
CHEVIOT HILLS - RANCHO PARK
SFR 21 13 -38.10% $1,691,113 $1,586,692 -6.17% 41 42 2.44%
CONDO 0 1 N/A $0 $1,200,000 N/A 0 50 N/A
WESTWOOD - CENTURY CITY
SFR 38 43 13.16% $1,793,711 $2,113,340 17.82% 48 43 -10.42%
CONDO 9 134 1388.89% $456,333 $1,274,490 179.29% 58 68 17.24%
WESTSIDEBeverlywood & Adjacent Communities

West Hollywood showed increasing strength, with single-family residence sales up 9.68% and condo sales up 10.34%. Average single-family residence prices also rose 21.97% up to $1.667 million, and condo prices were up 16.29% to $762,407.

13PARTNERS TRUST 2015 Q4 MARKET STATS REPORT | 2015 MLS/CLAW/PFAR/CRMLS DATA™
# SALES AVERAGE SOLD PRICE DAYS ON MARKET
TYPE Q42014
Q42015 % CHANGE Q4
2014Q4
2015 % CHANGE Q42014
Q42015 % CHANGE
HOLLYWOOD HILLS EAST
SFR 37 37 0.00% $1,410,731 $1,301,815 -7.72% 67 59 -11.94%
CONDO 12 10 -16.67% $405,042 $488,300 20.56% 103 80 -22.33%
SUNSET STRIP - HOLLYWOOD HILLS WEST
SFR 104 115 10.58% $2,464,066 $2,115,935 -14.13% 79 70 -11.39%
CONDO 21 24 14.29% $688,548 $665,338 -3.37% 81 72 -11.11%
WEST HOLLYWOOD
SFR 31 34 9.68% $1,367,353 $1,667,785 21.97% 56 65 16.07%
CONDO 87 96 10.34% $655,628 $762,407 16.29% 62 50 -19.35%
# SALES AVERAGE SOLD PRICE DAYS ON MARKET
TYPE Q42014
Q42015 % CHANGE Q4
2014Q4
2015 % CHANGE Q42014
Q42015 % CHANGE
BEVERLY CENTER - MIRACLE MILE
SFR 50 40 -20.00% $1,535,736 $1,613,892 5.09% 62 54 -12.90%
CONDO 23 24 4.35% $650,587 $770,745 18.47% 73 40 -45.21%
HANCOCK PARK - WILSHIRE
SFR 77 66 -14.29% $1,786,605 $1,904,877 6.62% 53 53 0.00%
CONDO 35 36 2.86% $644,997 $554,925 -13.96% 77 63 -18.18%
HOLLYWOOD HILLS& MID-CITYHollywood Hills & Adjacent Communities

Single-family home average sale prices in Ladera Heights rose 21.25% in Q4 to crest over $1 million to $1.007 million. Park Hills Heights is gaining heat; sales of single-family residences were up 13.83% as prices in this affordable neighborhood hit an average of $548,574, up 11.61%.

15PARTNERS TRUST 2015 Q4 MARKET STATS REPORT | 2015 MLS/CLAW/PFAR/CRMLS DATA™
# SALES AVERAGE SOLD PRICE DAYS ON MARKET
TYPE Q42014
Q42015 % CHANGE Q4
2014Q4
2015 % CHANGE Q42014
Q42015 % CHANGE
CULVER CITY SFR 54 59 9.26% $927,111 $1,079,747 16.46% 45 54 20.00%
CONDO 60 62 3.33% $483,226 $557,863 15.45% 47 37 -21.28%
INGLEWOOD SFR 55 51 -7.27% $394,729 $421,627 6.81% 74 52 -29.73%
CONDO 26 26 0.00% $215,538 $253,361 17.55% 70 35 -50.00%
LADERA HEIGHTS SFR 17 15 -11.76% $830,531 $1,007,037 21.25% 57 43 -24.56%
CONDO 0 3 N/A $0 $374,233 N/A 0 78 N/A
PARK HILLS HEIGHTS
SFR 94 107 13.83% $491,498 $548,574 11.61% 65 44 -32.31%
CONDO 11 13 18.18% $297,636 $328,877 10.50% 66 54 -18.18%
WESTSIDE /SOUTHCulver City & Adjacent Communities

Demand for both single-family residences and condos is high in Hollywood but lack of inventory drove sales and days on market down. The average price for single-family residences was up 17.75% to $970,206.

17PARTNERS TRUST 2015 Q4 MARKET STATS REPORT | 2015 MLS/CLAW/PFAR/CRMLS DATA™
# SALES AVERAGE SOLD PRICE DAYS ON MARKET
TYPE Q42014
Q42015 % CHANGE Q4
2014Q4
2015 % CHANGE Q42014
Q42015 % CHANGE
DOWNTOWN L.A.
SFR 17 25 47.06% $254,359 $344,179 35.31% 49 51 4.08%
CONDO 107 101 -5.61% $608,182 $643,308 5.78% 65 68 4.62%
HOLLYWOOD SFR 35 18 -48.57% $823,928 $970,206 17.75% 58 52 -10.34%
CONDO 27 25 -7.41% $626,444 $684,960 9.34% 99 72 -27.27%
LOS FELIZ SFR 60 44 -26.67% $1,622,516 $1,917,565 18.18% 63 53 -15.87%
CONDO 6 12 100.00% $493,667 $581,292 17.75% 35 72 105.71%
SILVER LAKE -ECHO PARK
SFR 88 101 14.77% $995,027 $905,823 -8.96% 51 44 -13.73%
CONDO 7 13 85.71% $514,271 $617,118 20.00% 68 42 -38.24%
METROLOS ANGELESDowntown Los Angeles & Adjacent Communities

18 | SAN FERNANDO VALLEY

SAN FERNANDOVALLEY

Celebrity-friendly Calabasas saw a sales spike in single-family residences in Q4, up 76.32% to 67 homes, while the average sale price dropped -15.58% to $1,483,011.

21PARTNERS TRUST 2015 Q4 MARKET STATS REPORT | 2015 MLS/CLAW/PFAR/CRMLS DATA™
# SALES AVERAGE SOLD PRICE DAYS ON MARKET
TYPE Q42014
Q42015 % CHANGE Q4
2014Q4
2015 % CHANGE Q42014
Q42015 % CHANGE
AGOURA SFR 71 76 7.04% $983,505 $943,704 -4.05% 96 78 -18.75%
CONDO 36 41 13.89% $407,081 $439,908 8.06% 68 74 8.82%
CALABASAS SFR 38 67 76.32% $1,756,605 $1,483,011 -15.58% 81 99 22.22%
CONDO 18 22 22.22% $419,103 $457,550 9.17% 98 72 -26.53%
CHATSWORTH SFR 62 56 -9.68% $772,250 $681,777 -11.72% 80 74 -7.50%
CONDO 36 41 13.89% $344,636 $353,403 2.54% 65 53 -18.46%
ENCINO SFR 115 106 -7.83% $1,274,780 $1,354,661 6.27% 64 61 -4.69%
CONDO 55 65 18.18% $373,766 $387,690 3.73% 79 68 -13.92%
HIDDEN HILLS SFR 8 7 -12.50% $3,781,250 $4,152,143 9.81% 120 131 9.17%
CONDO 0 0 N/A $0 $0 N/A 0 0 N/A
# SALES AVERAGE SOLD PRICE DAYS ON MARKET
TYPE Q42014
Q42015 % CHANGE Q4
2014Q4
2015 % CHANGE Q42014
Q42015 % CHANGE
NORTHRIDGE SFR 192 192 0.00% $622,542 $677,308 8.80% 67 66 -1.49%
CONDO 38 39 2.63% $391,771 $410,513 4.78% 70 55 -21.43%
TARZANA SFR 55 78 41.82% $966,436 $959,733 -0.69% 81 73 -9.88%
CONDO 48 35 -27.08% $319,352 $301,399 -5.62% 60 77 28.33%
WESTLAKE VILLAGE
SFR 91 72 -20.88% $1,484,927 $1,662,103 11.93% 112 83 -25.89%
CONDO 38 51 34.21% $571,579 $581,011 1.65% 57 77 35.09%
WOODLAND HILLS SFR 161 164 1.86% $748,254 $828,552 10.73% 63 66 4.76%
CONDO 46 60 30.43% $361,433 $383,537 6.12% 69 61 -11.59%
SAN FERNANDO VALLEYWEST OF 405Agoura & Adjacent Communities

After a rise of over 25% in Q3, Studio City sales were mostly flat in Q4, but days on market shrunk by nearly 22% as the average price rose 13.05% to $1.466 million.

23PARTNERS TRUST 2015 Q4 MARKET STATS REPORT | 2015 MLS/CLAW/PFAR/CRMLS DATA™
# SALES AVERAGE SOLD PRICE DAYS ON MARKET
TYPE Q42014
Q42015 % CHANGE Q4
2014Q4
2015 % CHANGE Q42014
Q42015 % CHANGE
BURBANK SFR 133 129 -3.01% $704,323 $797,294 13.20% 48 55 14.58%
CONDO 52 56 7.69% $439,934 $466,066 5.94% 66 48 -27.27%
SHERMAN OAKS SFR 166 148 -10.84% $959,513 $1,131,116 17.88% 55 60 9.09%
CONDO 71 66 -7.04% $436,601 $468,747 7.36% 69 56 -18.84%
STUDIO CITY SFR 84 85 1.19% $1,296,908 $1,466,108 13.05% 74 58 -21.62%
CONDO 35 43 22.86% $534,670 $534,442 -0.04% 70 68 -2.86%
TOLUCA LAKE SFR 19 16 -15.79% $1,163,254 $1,188,844 2.20% 67 43 -35.82%
CONDO 16 10 -37.50% $439,125 $502,950 14.53% 39 62 58.97%
SAN FERNANDO VALLEYEAST OF 405Sherman Oaks & Adjacent Communities

24 | SAN GABRIEL VALLEY

SAN GABRIELVALLEY

Single-family residence prices were back on the rise in Pasadena; up 12.52% to $1,045,875 and sales went up 7.18%. Condo sales also lifted 19.05% as prices were up 6.68% to an average of $629,847.

27PARTNERS TRUST 2015 Q4 MARKET STATS REPORT | 2015 MLS/CLAW/PFAR/CRMLS DATA™
# SALES AVERAGE SOLD PRICE DAYS ON MARKET
TYPE Q42014
Q42015 % CHANGE Q4
2014Q4
2015 % CHANGE Q42014
Q42015 % CHANGE
ALHAMBRA SFR 49 59 20.41% $582,008 $587,560 0.95% 51 55 7.84%
CONDO 18 21 16.67% $426,097 $456,833 7.21% 46 61 32.61%
ALTADENA SFR 94 106 12.77% $726,365 $784,359 7.98% 52 66 26.92%
CONDO 1 0 N/A $265,000 $0 N/A 67 0 N/A
PASADENA SFR 195 209 7.18% $929,540 $1,045,875 12.52% 44 57 29.55%
CONDO 84 100 19.05% $590,424 $629,847 6.68% 61 59 -3.28%
SAN GABRIEL SFR 77 60 -22.08% $761,096 $732,247 -3.79% 41 56 36.59%
CONDO 6 16 166.67% $439,354 $528,951 20.39% 62 43 -30.65%
SAN MARINO SFR 24 32 33.33% $2,183,286 $2,376,115 8.83% 35 48 37.14%
CONDO 0 0 N/A $0 $0 N/A 0 0 N/A
SOUTH PASADENA SFR 35 32 -8.57% $1,263,651 $1,288,553 1.97% 48 47 -2.08%
CONDO 11 10 -9.09% $589,682 $536,630 -9.00% 40 52 30.00%
PASADENAPasadena & Adjacent Communities

La Cañada Flintridge remains a hot market. Days on market fell -10.77%, while prices remained mostly stable, with the average sale price inching down -1.12% to $1,927,259. Sales rose 5.36% with 59 homes sold. In nearby Glendale, the condo market continues to grow with sales up 11.25%.

29PARTNERS TRUST 2015 Q4 MARKET STATS REPORT | 2015 MLS/CLAW/PFAR/CRMLS DATA™
# SALES AVERAGE SOLD PRICE DAYS ON MARKET
TYPE Q42014
Q42015 % CHANGE Q4
2014Q4
2015 % CHANGE Q42014
Q42015 % CHANGE
ATWATER SFR 15 13 -13.33% $596,430 $776,000 30.11% 55 52 -5.45%
CONDO 0 0 N/A $0 $0 N/A 0 0 N/A
GLENDALE SFR 143 124 -13.29% $837,224 $845,148 0.95% 43 52 20.93%
CONDO 80 89 11.25% $391,721 $427,988 9.26% 47 46 -2.13%
LA CAÑADA FLINTRIDGE
SFR 56 59 5.36% $1,949,111 $1,927,259 -1.12% 65 58 -10.77%
CONDO 0 0 N/A $0 $0 N/A 0 0 N/A
LA CRESCENTA -MONTROSE - SPARR HEIGHTS
SFR 80 76 -5.00% $722,719 $777,951 7.64% 53 44 -16.98%
CONDO 7 13 85.71% $374,143 $413,092 10.41% 56 59 5.36%
SUNLAND - TUJUNGA
SFR 91 99 8.79% $475,657 $514,174 8.10% 52 56 7.69%
CONDO 1 8 700.00% $402,000 $326,875 -18.69% 22 43 95.45%
LA CAÑADAFLINTRIDGELa Cañada Flintridge & Adjacent Communities

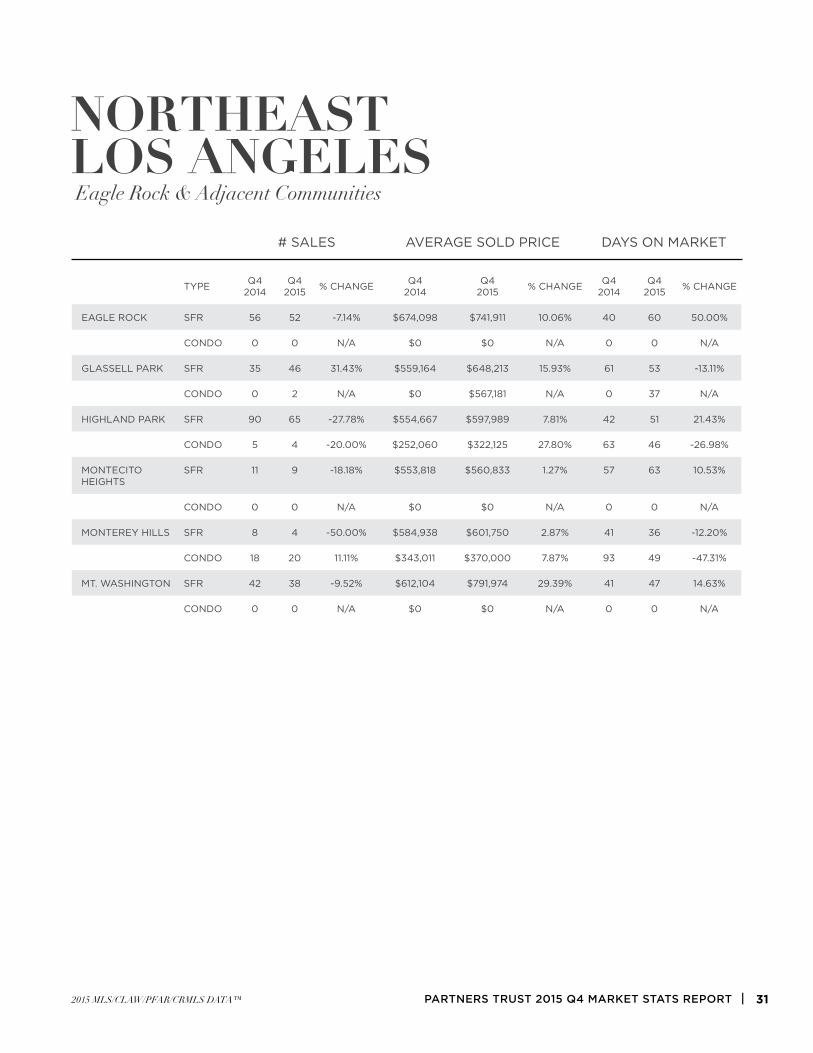
Prices in Northeast Los Angeles still seem to have room for expansion. Eagle Rock saw prices for single-family homes rise by 10.06% to $741,911, Mount Washington saw a 29.39% increase in year-over-year average sold prices to $791,974, Glassell Park saw a 15.93% rise to $648,213, and in Highland Park, the average single-family home price lifted 7.81% to $597,989.
31PARTNERS TRUST 2015 Q4 MARKET STATS REPORT | 2015 MLS/CLAW/PFAR/CRMLS DATA™
# SALES AVERAGE SOLD PRICE DAYS ON MARKET
TYPE Q42014
Q42015 % CHANGE Q4
2014Q4
2015 % CHANGE Q42014
Q42015 % CHANGE
EAGLE ROCK SFR 56 52 -7.14% $674,098 $741,911 10.06% 40 60 50.00%
CONDO 0 0 N/A $0 $0 N/A 0 0 N/A
GLASSELL PARK SFR 35 46 31.43% $559,164 $648,213 15.93% 61 53 -13.11%
CONDO 0 2 N/A $0 $567,181 N/A 0 37 N/A
HIGHLAND PARK SFR 90 65 -27.78% $554,667 $597,989 7.81% 42 51 21.43%
CONDO 5 4 -20.00% $252,060 $322,125 27.80% 63 46 -26.98%
MONTECITO HEIGHTS
SFR 11 9 -18.18% $553,818 $560,833 1.27% 57 63 10.53%
CONDO 0 0 N/A $0 $0 N/A 0 0 N/A
MONTEREY HILLS SFR 8 4 -50.00% $584,938 $601,750 2.87% 41 36 -12.20%
CONDO 18 20 11.11% $343,011 $370,000 7.87% 93 49 -47.31%
MT. WASHINGTON SFR 42 38 -9.52% $612,104 $791,974 29.39% 41 47 14.63%
CONDO 0 0 N/A $0 $0 N/A 0 0 N/A
NORTHEASTLOS ANGELESEagle Rock & Adjacent Communities

In Arcadia, Q3 saw a rise in sales while Q4 saw sales flat, but a 4.34% increase in average sold price to $1,813,564, while the average condo price rose 14.73% to $695,596.

33PARTNERS TRUST 2015 Q4 MARKET STATS REPORT | 2015 MLS/CLAW/PFAR/CRMLS DATA™
# SALES AVERAGE SOLD PRICE DAYS ON MARKET
TYPE Q42014
Q42015 % CHANGE Q4
2014Q4
2015 % CHANGE Q42014
Q42015 % CHANGE
ARCADIA SFR 117 117 0.00% $1,738,188 $1,813,564 4.34% 42 74 76.19%
CONDO 22 25 13.64% $606,309 $695,596 14.73% 33 73 121.21%
AZUSA SFR 74 59 -20.27% $409,041 $429,810 5.08% 40 66 65.00%
CONDO 24 23 -4.17% $280,283 $301,257 7.48% 50 54 8.00%
BRADBURY SFR 7 2 -71.43% $1,795,714 $5,825,000 224.38% 30 136 353.33%
CONDO 0 0 N/A $0 $0 N/A 0 0 N/A
MONROVIA SFR 67 61 -8.96% $673,383 $719,881 6.91% 42 75 78.57%
CONDO 15 11 -26.67% $419,533 $410,082 -2.25% 41 76 85.37%
MONTEREY PARK SFR 55 57 3.64% $597,628 $602,845 0.87% 42 58 38.10%
CONDO 20 22 10.00% $353,215 $442,969 25.41% 63 67 6.35%
SIERRA MADRE SFR 27 29 7.41% $1,039,394 $970,834 -6.60% 46 59 28.26%
CONDO 2 1 -50.00% $505,000 $475,000 -5.94% 39 32 -17.95%
EAST SAN GABRIEL VALLEYArcadia & Adjacent Communities

34 | SOUTH BAY

SOUTH BAY

Prices remain high in the Beach Cities. In Manhattan Beach, the single-family residence average sale price for Q4 was $2,536,889, down -3.5% year over year. In nearby Hermosa Beach, the average sale price of $2,301,665 represented a 56.14% increase.

37PARTNERS TRUST 2015 Q4 MARKET STATS REPORT | 2015 MLS/CLAW/PFAR/CRMLS DATA™
# SALES AVERAGE SOLD PRICE DAYS ON MARKET
TYPE Q42014
Q42015 % CHANGE Q4
2014Q4
2015 % CHANGE Q42014
Q42015 % CHANGE
EL SEGUNDO SFR 18 18 0.00% $1,150,889 $1,147,758 -0.27% 94 56 -40.43%
CONDO 9 3 -66.67% $472,778 $424,667 -10.18% 64 23 -64.06%
HERMOSA BEACH SFR 22 29 31.82% $1,474,064 $2,301,665 56.14% 45 63 40.00%
CONDO 3 15 400.00% $492,667 $758,740 54.01% 39 38 -2.56%
HAWTHORNE SFR 72 66 -8.33% $495,209 $538,602 8.76% 52 46 -11.54%
CONDO 9 11 22.22% $489,110 $448,182 -8.37% 76 33 -56.58%
MANHATTAN BEACH
SFR 94 65 -30.85% $2,628,976 $2,536,889 -3.50% 49 61 24.49%
CONDO 0 2 N/A $0 $651,000 N/A 0 16 N/A
PALOS VERDES ESTATES
SFR 37 20 -45.95% $2,352,472 $2,179,530 -7.35% 95 76 -20.00%
CONDO 2 2 0.00% $540,000 $637,000 17.96% 130 34 -73.85%
PLAYA DEL REY SFR 12 9 -25.00% $1,180,833 $1,430,410 21.14% 54 48 -11.11%
CONDO 35 26 -25.71% $458,614 $627,519 36.83% 62 49 -20.97%
PLAYA VISTA SFR 6 2 -66.67% $1,510,433 $2,310,000 52.94% 55 15 -72.73%
CONDO 24 15 -37.50% $753,146 $1,030,667 36.85% 69 29 -57.97%
RANCHO PALOS VERDES
SFR 88 98 11.36% $1,305,985 $1,368,370 4.78% 72 66 -8.33%
CONDO 7 11 57.14% $525,429 $545,273 3.78% 76 66 -13.16%
REDONDO BEACH SFR 103 87 -15.53% $1,101,802 $1,122,650 1.89% 51 54 5.88%
CONDO 34 30 -11.76% $549,714 $645,597 17.44% 71 51 -28.17%
ROLLING HILLS ESTATES
SFR 20 19 -5.00% $1,702,153 $1,663,685 -2.26% 71 75 5.63%
CONDO 6 1 -83.33% $329,417 $835,000 153.48% 38 71 86.84%
TORRANCE SFR 209 207 -0.96% $668,086 $701,061 4.94% 55 59 7.27%
CONDO 53 63 18.87% $346,154 $365,475 5.58% 53 56 5.66%
SOUTH BAYManhattan Beach & Adjacent Communities

THEPARTNERSTRUST.COMBeverly Hills | Brentwood | La Cañada Flintridge | Malibu | Manhattan Beach | Ocean Park | Pasadena | Santa Monica | Shanghai
CALBRE# 01869103