PARTNER WORLDWIDE A FUND Schedule of Investments … · 2018-06-15 · 60,599 Empire Company, ......
23
PARTNER WORLDWIDE ALLOCATION FUND Schedule of Investments as of January 31, 2018 (unaudited) The accompanying Notes to Schedule of Investments are an integral part of this schedule. 1 Shares Common Stock (89.2%) Value Australia (4.0%) 10,424 Abacus Property Group $30,367 27,096 Altium, Ltd. 332,213 1,032 Ansell, Ltd. 20,873 111,755 Aristocrat Leisure, Ltd. 2,147,253 15,915 Asaleo Care, Ltd. 20,839 245,105 Australia & New Zealand Banking Group, Ltd. 5,629,873 136,909 Australian Pharmaceutical Industries, Ltd. 164,927 67,131 BHP Billiton, Ltd. 1,641,703 39,920 Breville Group, Ltd. 394,665 21,166 Carsales.com, Ltd. 255,669 28,251 CSL, Ltd. 3,321,744 720,862 CSR, Ltd. 2,919,093 75,741 FlexiGroup, Ltd. 110,468 88,896 Genworth Mortgage Insurance Australia, Ltd. 208,022 116,375 Iluka Resources, Ltd. 944,483 242,501 Investa Office Fund 864,487 61,836 IOOF Holdings, Ltd. 548,803 14,475 McMillan Shakespeare, Ltd. 204,402 553,994 Medibank Private, Ltd. 1,491,797 964,928 Metcash, Ltd. 2,488,484 817,780 Mirvac Group 1,453,152 103,145 Monadelphous Group, Ltd. 1,458,357 73,519 OZ Minerals, Ltd. 552,687 304,872 Qantas Airways, Ltd. 1,292,022 26,202 Rio Tinto, Ltd. 1,613,215 123,409 Sandfire Resources NL 712,725 8,805 Seven Group Holdings, Ltd. 115,780 103,035 Sigma Healthcare, Ltd. 74,308 74,001 Sims Metal Management, Ltd. 978,492 721,199 South32, Ltd. 2,214,711 184,285 Southern Cross Media Group, Ltd. 174,101 71,902 Star Entertainment Group, Ltd. 350,700 197,191 Treasury Wine Estates, Ltd. 2,716,241 358,104 Vita Group, Ltd. a 513,128 358,547 Whitehaven Coal, Ltd. 1,422,445 Total 39,382,229 Austria (0.9%) 32,719 Erste Group Bank AG 1,648,066 2,240 Lenzing AG 284,784 76,495 OMV AG 4,925,265 1,139 Osterreichische Post AG 54,250 36,556 Raiffeisen Bank International AG b 1,571,465 4,004 S IMMO AG 74,866 19,262 UNIQA Insurance Group AG 237,116 Total 8,795,812 Belgium (0.8%) 14,155 Agfa-Gevaert NV b 71,105 13,399 Anheuser-Busch InBev NV 1,517,573 1,687 Barco NV 208,194 24,614 bpost SA 818,394 1,547 Compagnie d' Entreprises CFE 223,568 1,443 Fagron NV b 20,385 2,208 Gimv NV 141,180 6,029 KBC Ancora 407,438 6,406 Melexis NV 674,614 6,296 Mobistar SA 133,035 15,940 NV Bekaert SA 724,137 7,007 SA D'Ieteren NV 327,250 17,834 Solvay SA 2,582,284 Shares Common Stock (89.2%) Value Belgium (0.8%) - continued 5,536 Tessenderlo Group b $265,308 Total 8,114,465 Bermuda (<0.1%) 18,208 BW Offshore, Ltd. b 90,699 4,000 Johnson Electric Holdings, Ltd. 16,322 Total 107,021 Brazil (2.0%) 351,400 Ambev SA 2,422,544 353,133 Banco Bradesco SA ADR 4,484,789 133,408 BRF SA b 1,480,416 233,600 Lojas Renner SA 2,776,280 77,666 Multiplan Empreendimentos Imobiliarios SA 1,769,692 118,412 Ultrapar Participacoes SA 3,032,101 234,596 Vale SA ADR 3,070,862 Total 19,036,684 Canada (2.5%) 73,068 CAE, Inc. 1,348,491 42,748 Canadian National Railway Company 3,426,096 9,755 CI Financial Corporation 234,834 32,645 Dollarama, Inc. 4,463,606 60,599 Empire Company, Ltd. 1,172,566 55,480 Finning International, Inc. 1,527,729 18,790 Genworth MI Canada, Inc. a 645,276 20,643 Gluskin Sheff + Associates, Inc. 265,674 16,189 IGM Financial, Inc. 578,197 1,194 Magna International, Inc. 68,237 59,546 Manulife Financial Corporation 1,263,537 21,832 Premium Brands Holdings Corporation 1,899,207 59,935 Stars Group, Inc. b 1,522,739 68,833 Teck Resources, Ltd. 1,998,955 52,200 Transcanada Corporation 2,403,322 72,164 Transcontinental, Inc. 1,459,121 Total 24,277,587 Cayman Islands (1.1%) 460,000 China Resources Land, Ltd. 1,830,776 103,700 Tencent Holdings, Ltd. 6,127,368 1,877,830 WH Group, Ltd. c 2,321,756 414,000 Xinyi Glass Holdings Company, Ltd. 627,263 Total 10,907,163 Chile (0.3%) 50,646 Banco Santander Chile SA ADR 1,724,496 150,675 S.A.C.I. Falabella 1,581,695 Total 3,306,191 China (1.3%) 211,398 China International Travel Service Corporation, Ltd. 1,722,912 340,297 Hangzhou Hikvision Digital Technology Company, Ltd. 2,153,886 23,395 Kweichow Moutai Company, Ltd. 2,843,033 220,900 Midea Group Company, Ltd. 2,098,726 133,500 Ping An Insurance Company of China, Ltd. 1,572,362 262,682 Shanghai International Airport Company, Ltd. 1,958,863 Total 12,349,782 Denmark (1.5%) 7,803 Bavarian Nordic AS b 300,638
Transcript of PARTNER WORLDWIDE A FUND Schedule of Investments … · 2018-06-15 · 60,599 Empire Company, ......

Partner WorldWide allocation Fund Schedule of Investments as of January 31, 2018
(unaudited)
The accompanying Notes to Schedule of Investments are an integral part of this schedule.1
Shares Common Stock (89.2%) ValueAustralia (4.0%)
10,424 Abacus Property Group $30,36727,096 Altium, Ltd. 332,213
1,032 Ansell, Ltd. 20,873111,755 Aristocrat Leisure, Ltd. 2,147,253
15,915 Asaleo Care, Ltd. 20,839245,105 Australia & New Zealand Banking
Group, Ltd. 5,629,873136,909 Australian Pharmaceutical Industries,
Ltd. 164,92767,131 BHP Billiton, Ltd. 1,641,70339,920 Breville Group, Ltd. 394,66521,166 Carsales.com, Ltd. 255,66928,251 CSL, Ltd. 3,321,744
720,862 CSR, Ltd. 2,919,09375,741 FlexiGroup, Ltd. 110,46888,896 Genworth Mortgage Insurance
Australia, Ltd. 208,022116,375 Iluka Resources, Ltd. 944,483242,501 Investa Office Fund 864,487
61,836 IOOF Holdings, Ltd. 548,80314,475 McMillan Shakespeare, Ltd. 204,402
553,994 Medibank Private, Ltd. 1,491,797964,928 Metcash, Ltd. 2,488,484817,780 Mirvac Group 1,453,152103,145 Monadelphous Group, Ltd. 1,458,357
73,519 OZ Minerals, Ltd. 552,687304,872 Qantas Airways, Ltd. 1,292,022
26,202 Rio Tinto, Ltd. 1,613,215123,409 Sandfire Resources NL 712,725
8,805 Seven Group Holdings, Ltd. 115,780103,035 Sigma Healthcare, Ltd. 74,308
74,001 Sims Metal Management, Ltd. 978,492721,199 South32, Ltd. 2,214,711184,285 Southern Cross Media Group, Ltd. 174,101
71,902 Star Entertainment Group, Ltd. 350,700197,191 Treasury Wine Estates, Ltd. 2,716,241358,104 Vita Group, Ltd.a 513,128358,547 Whitehaven Coal, Ltd. 1,422,445
Total 39,382,229
Austria (0.9%) 32,719 Erste Group Bank AG 1,648,066
2,240 Lenzing AG 284,78476,495 OMV AG 4,925,265
1,139 Osterreichische Post AG 54,25036,556 Raiffeisen Bank International AGb 1,571,465
4,004 S IMMO AG 74,86619,262 UNIQA Insurance Group AG 237,116
Total 8,795,812
Belgium (0.8%) 14,155 Agfa-Gevaert NVb 71,10513,399 Anheuser-Busch InBev NV 1,517,573
1,687 Barco NV 208,19424,614 bpost SA 818,394
1,547 Compagnie d' Entreprises CFE 223,5681,443 Fagron NVb 20,3852,208 Gimv NV 141,1806,029 KBC Ancora 407,4386,406 Melexis NV 674,6146,296 Mobistar SA 133,035
15,940 NV Bekaert SA 724,1377,007 SA D'Ieteren NV 327,250
17,834 Solvay SA 2,582,284
Shares Common Stock (89.2%) ValueBelgium (0.8%) - continued
5,536 Tessenderlo Groupb $265,308Total 8,114,465
Bermuda (<0.1%) 18,208 BW Offshore, Ltd.b 90,699
4,000 Johnson Electric Holdings, Ltd. 16,322Total 107,021
Brazil (2.0%) 351,400 Ambev SA 2,422,544353,133 Banco Bradesco SA ADR 4,484,789133,408 BRF SAb 1,480,416233,600 Lojas Renner SA 2,776,280
77,666 Multiplan Empreendimentos Imobiliarios SA 1,769,692
118,412 Ultrapar Participacoes SA 3,032,101234,596 Vale SA ADR 3,070,862
Total 19,036,684
Canada (2.5%) 73,068 CAE, Inc. 1,348,49142,748 Canadian National Railway Company 3,426,0969,755 CI Financial Corporation 234,834
32,645 Dollarama, Inc. 4,463,60660,599 Empire Company, Ltd. 1,172,56655,480 Finning International, Inc. 1,527,72918,790 Genworth MI Canada, Inc.a 645,27620,643 Gluskin Sheff + Associates, Inc. 265,67416,189 IGM Financial, Inc. 578,197
1,194 Magna International, Inc. 68,23759,546 Manulife Financial Corporation 1,263,53721,832 Premium Brands Holdings
Corporation 1,899,20759,935 Stars Group, Inc.b 1,522,73968,833 Teck Resources, Ltd. 1,998,95552,200 Transcanada Corporation 2,403,32272,164 Transcontinental, Inc. 1,459,121
Total 24,277,587
Cayman Islands (1.1%) 460,000 China Resources Land, Ltd. 1,830,776103,700 Tencent Holdings, Ltd. 6,127,368
1,877,830 WH Group, Ltd.c 2,321,756414,000 Xinyi Glass Holdings Company, Ltd. 627,263
Total 10,907,163
Chile (0.3%) 50,646 Banco Santander Chile SA ADR 1,724,496
150,675 S.A.C.I. Falabella 1,581,695Total 3,306,191
China (1.3%) 211,398 China International Travel Service
Corporation, Ltd. 1,722,912340,297 Hangzhou Hikvision Digital
Technology Company, Ltd. 2,153,88623,395 Kweichow Moutai Company, Ltd. 2,843,033
220,900 Midea Group Company, Ltd. 2,098,726133,500 Ping An Insurance Company of China,
Ltd. 1,572,362262,682 Shanghai International Airport
Company, Ltd. 1,958,863Total 12,349,782
Denmark (1.5%) 7,803 Bavarian Nordic ASb 300,638

Partner WorldWide allocation Fund Schedule of Investments as of January 31, 2018
(unaudited)
The accompanying Notes to Schedule of Investments are an integral part of this schedule.2
Shares Common Stock (89.2%) ValueDenmark (1.5%) - continued
32,405 Danske Bank AS $1,315,8676,154 DFDS AS 369,266
23,463 GN Store Nord AS 791,2218,563 Jyske Bank AS 495,024
117,356 Novo Nordisk AS 6,513,0685,574 Rockwool International AS 1,557,0389,231 Royal Unibrew AS 560,836
14,983 Spar Nord Bank AS 178,49670,521 Sydbank AS 2,884,127
Total 14,965,581
Faroe Islands (<0.1%) 3,712 Bakkafrost PF 151,271
Total 151,271
Finland (1.1%) 10,494 Cramo Oyj 256,01824,867 Finnair Oyj 301,02015,468 KONE Oyj 885,478
4,268 Konecranes Oyj 216,6784,812 Outokumpu Oyj 41,2781,293 Raisio Oyj 7,168
20,062 Ramirent Oyj 201,382229,783 UPM-Kymmene Oyj 7,747,991
43,280 Valmet Oyj 971,108Total 10,628,121
France (5.0%) 80,742 Air France-KLMb 1,252,362
2,275 Alten SA 230,31317,996 Amundi SAc 1,698,09712,583 AtoS 1,984,430
164,089 AXA SA 5,396,50138,612 BNP Paribas SA 3,189,13113,283 Capgemini SA 1,763,202
1,278 Cie Plastic Omnium SA 65,64733,534 CNP Assurances 859,477
6,811 Derichebourg 68,30215,554 Eiffage SA 1,885,70378,676 Engie 1,366,146
4,034 Eramet SAb 569,3512,786 Eurofins Scientific SE 1,813,593
111,321 Eutelsat Communications 2,450,1758,014 Ipsos SA 306,1253,985 Jacquet Metal Service 147,9532,445 Kaufman & Broad SA 127,5866,832 Kering SA 3,460,7447,031 Legrand SA 585,044
13,728 LVMH Moet Hennessy Louis Vuitton SE 4,300,337
12,563 Metropole Television SA 341,81312,563 Neopost SA 374,09611,348 Nexity SA 683,79550,895 Peugeot SA 1,143,17625,102 Safran SA 2,836,071
7,475 Schneider Electric SEb 700,3916,509 SCOR SE 291,332
90,893 Total SA 5,270,00219,172 UbiSoft Entertainment SAb 1,640,819
953 Vilmorin & Cie SA 104,24016,994 Vinci SA 1,836,702
366 Worldline SAb,c 20,703Total 48,763,359
Germany (7.1%) 12,599 Aareal Bank AG 636,912
Shares Common Stock (89.2%) ValueGermany (7.1%) - continued
1,627 Aixtron SEb $24,57924,568 Allianz SE 6,213,93348,742 Alstria Office REIT AG 769,7033,305 Amadeus Fire AG 340,578
16,783 Aurubis AG 1,763,62390,411 BASF SE 10,603,26148,695 Bayer AG 6,380,902
299 Bechtle AG 27,27018,822 Covestro AGc 2,167,372
6,604 CTS Eventim AG & Company KGaA 330,2022,889 Deutsche Beteiligungs AG 178,320
54,298 Deutsche Pfandbriefbank AGc 1,003,63181,785 Deutsche Post AG 3,863,09473,798 Deutz AG 685,279
2,183 DIC Asset AG 28,0363,567 Duerr AG 491,421
58,803 Evonik Industries AG 2,323,63242,871 Freenet AG 1,643,94811,834 Gerresheimer AG 1,033,65214,409 Hamburger Hafen und Logistik AG 402,37525,038 Hannover Rueckversicherung SE 3,424,32117,275 Hugo Boss AG 1,586,604
1,196 Isra Vision AG 278,40217,611 Jenoptik AG 730,94215,333 Jungheinrich AG 758,27616,176 Leoni AG 1,242,1557,359 Merck KGaA 805,5149,269 Pfeiffer Vacuum Technology AG 1,837,827
24,329 Rheinmetall AG 3,443,7953,261 SAF-Holland SA 76,521
10,907 Salzgitter AG 658,79120,820 SAP SE 2,355,60040,887 Siemens AG 6,206,855
322 Siltronic AGb 53,45811,646 Software AG 632,11739,560 TAG Immobilien AG 781,990
5,309 Takkt AG 147,6487,202 Wacker Chemie AG 1,445,1036,452 Wacker Neuson SE 264,356
16,442 Wirecard AG 2,049,98158 XING AG 20,287
Total 69,712,266
Hong Kong (2.3%) 494,400 AIA Group, Ltd. 4,222,920242,000 Champion REIT 179,737370,500 China Mobile, Ltd. 3,901,512
86,000 CITIC Telecom International Holdings, Ltd. 25,884
199,633 CK Asset Holdings, Ltd. 1,899,628108,000 Giordano International, Ltd. 55,225
10,000 Great Eagle Holdings, Ltd. 52,47684,000 Haitong International Securities
Group, Ltd. 59,422619,000 Hang Lung Group, Ltd. 2,349,543
61,106 Hong Kong Exchanges and Clearing, Ltd. 2,305,267
40,500 Hopewell Holdings, Ltd. 163,469291,000 Luk Fook Holdings International, Ltd. 1,041,591818,000 Melco International Development,
Ltd. 2,448,941154,000 Shun Tak Holdings, Ltd. 66,257225,000 Sun Hung Kai Properties, Ltd. 3,889,990
35,000 Sunlight Real Estate Investment Trust 24,474Total 22,686,336

Partner WorldWide allocation Fund Schedule of Investments as of January 31, 2018
(unaudited)
The accompanying Notes to Schedule of Investments are an integral part of this schedule.3
Shares Common Stock (89.2%) ValueHungary (0.2%)
55,410 Richter Gedeon Nyrt $1,424,071Total 1,424,071
India (2.1%) 90,300 Aditya Birla Capital, Ltd.b 241,24947,500 Grasim Industries, Ltd. 863,98331,679 Hero Motocorp, Ltd. 1,836,765
115,000 Hindustan Unilever, Ltd. 2,475,880188,191 Housing Development Finance
Corporation 5,782,539676,301 ITC, Ltd. 2,885,80682,200 Kotak Mahindra Bank, Ltd. 1,431,00038,418 Tata Consultancy Services, Ltd. 1,876,95948,428 Ultra Tech Cement, Ltd. 3,332,233
Total 20,726,414
Indonesia (0.8%) 5,504,800 Astra International Tbk PT 3,491,1991,071,600 Indocement Tunggal Prakarsa Tbk PT 1,744,8471,216,400 PT Bank Central Asia Tbk 2,065,181
Total 7,301,227
Ireland (0.2%) 126,820 UDG Healthcare plc 1,477,238
Total 1,477,238
Isle of Man (<0.1%) 21,778 GVC Holdings plc 286,642
Total 286,642
Israel (0.1%) 235,294 El Al Israel Airlines, Ltd. 96,765
75,803 Israel Discount Bank, Ltd.b 226,75523,509 Shufersal, Ltd. 169,243
Total 492,763
Italy (2.2%) 11,600 Ascopiave SPA 51,12742,941 Assicurazioni Generali SPA 851,91513,492 ASTM SPA 366,011
6,893 Azimut Holding SPA 156,9851,788 Banca Generali SPA 66,974
533 Banca IFIS SPA 25,36224,950 Banca Popolare Di Sondrio SCRL 100,675
135,920 Beni Stabili SPA 125,9179,861 Biesse SPA 554,197
23,575 DiaSorin SPA 2,280,6457,838 EL En SPA 287,658
148,565 Enav SPAc 777,281263,178 Enel SPA 1,673,138447,936 Iren SPA 1,449,423
1,528 Italmobiliare SPA 46,6696,287 La Doria SPA 120,0515,366 Maire Tecnimont SPA 27,964
148,637 Mediobanca SPA 1,807,71414,085 Moncler SPA 464,17746,878 Prysmian SPA 1,649,10748,700 Recordati SPA 2,217,734
786,874 Saras SPA 1,718,99350,666 Societa Cattolica di Assicurazioni
SCRL 630,935107,788 Societa Iniziative Autostradali e
Servizi SPA 2,028,787251,658 Terna Rete Elettrica Nazionale SPA 1,514,747
Total 20,994,186
Shares Common Stock (89.2%) ValueJapan (19.4%)
26,300 Adeka Corporation $466,9867,000 Aisan Industry Company, Ltd. 84,499
29,400 Aisin Seiki Company, Ltd. 1,720,82934,800 All Nippon Airways Company, Ltd. 1,419,668
4,700 Alpen Company, Ltd. 108,79018,300 AOKI Holdings, Inc. 277,52310,800 Aoyama Trading Company, Ltd. 425,306
7,200 Aozora Bank, Ltd. 292,4456,300 Arcland Sakamoto Company, Ltd. 108,695
59,100 Arcs Company, Ltd. 1,372,8645,600 Asahi Diamond Industrial Company,
Ltd. 69,1779,200 ASKA Pharmaceutical Company, Ltd. 178,324
113,400 Astellas Pharmaceutical, Inc. 1,491,34729,600 Autobacs Seven Company, Ltd. 592,58417,700 Avex, Inc. 264,39853,700 Brother Industries, Ltd. 1,379,49319,500 Canon Electronics, Inc. 508,00870,500 Canon, Inc. 2,812,95016,900 Capcom Company, Ltd. 646,495
6,100 Cawachi, Ltd. 148,58930,600 Chiyoda Company, Ltd.a 759,340
2,300 Chiyoda Integre Company, Ltd. 55,12353,500 Chubu Electric Power Company, Inc. 674,20615,100 Citizen Watch Company, Ltd. 116,01912,900 Cosmo Energy Holdings Company,
Ltd. 507,8932,500 Daido Steel Company, Ltd. 147,8801,800 Daiichi Jitsugyo Company, Ltd. 54,857
12,900 Daiichikosho Company, Ltd. 704,6541,700 Dainichiseika Color & Chemicals
Manufacturing Company, Ltd. 83,5452,500 Daishi Bank, Ltd. 118,670
66,700 DMG Mori Company, Ltd. 1,527,31613,100 Doutor Nichires Holdings Company,
Ltd. 311,20347,600 DTS Corporation 1,741,62613,700 Ebara Corporation 562,36448,300 EDION Corporation 617,846
2,800 EN-Japan, Inc. 149,97213,500 EPS Holdings, Inc. 328,126
4,100 Fancl Corporation 128,9963,000 Ferrotec Holdings Corporation 78,7122,600 Fields Corporation 28,763
78,300 Financial Products Group Company, Ltd. 1,196,780
23,300 Foster Electric Company, Ltd. 690,09124,700 Fuji Machine Manufacturing
Company, Ltd. 522,62813,600 Fuji Oil Holdings, Inc. 414,999
7,000 Fuji Soft, Inc. 241,0376,700 Fujibo Holdings, Inc. 249,486
304,000 Fujitsu, Ltd. 2,244,61612,800 Goldcrest Company, Ltd. 283,82312,100 Gree, Inc. 78,694
115,800 Haseko Corporation 1,810,89436,300 Heiwa Corporation 727,544
146 Heiwa Real Estate REIT, Inc. 134,27116,400 Hitachi Zosen Corporation 89,092
355,000 Hitachi, Ltd. 2,832,8291,000 Hogy Medical Company, Ltd. 75,843
45,800 Hokuetsu Kishu Paper Company, Ltd. 300,953327,400 Honda Motor Company, Ltd. 11,546,013
3,300 Horiba, Ltd. 212,87364,500 IBIDEN Company, Ltd. 1,005,45214,200 Ichiyoshi Securities Co., Ltd. 183,895

Partner WorldWide allocation Fund Schedule of Investments as of January 31, 2018
(unaudited)
The accompanying Notes to Schedule of Investments are an integral part of this schedule.4
Shares Common Stock (89.2%) ValueJapan (19.4%) - continued
11,900 INES Corporation $125,369130,500 ITOCHU Corporation 2,567,809
17,400 JAFCO Company, Ltd. 990,28331,200 Japan Airlines Company, Ltd. 1,178,97040,000 Japan Aviation Electronics Industry,
Ltd. 672,442186 Japan Rental Housing Investments,
Inc. 146,865117,800 JVC Kenwood Corporation 456,527162,000 Kajima Corporation 1,608,350
98,000 Kaneka Corporation 912,2381,300 Kanematsu Electronics, Ltd. 38,482
32,900 Kao Corporation 2,286,1782,800 Kato Works Company, Ltd. 88,787
23,000 Keihin Corporation 479,512148 Kenedix Office Investment
Corporation 932,21691 Kenedix Residential Investment
Corporation 260,48865,600 Kinden Corporation 1,097,90860,000 KITZ Corporation 519,25912,000 Klab, Inc. 207,956
5,600 Kobayashi Pharmaceutical Company, Ltd. 370,929
11,600 Koei Tecmo Holdings Company, Ltd. 257,09616,400 Kohnan Shoji Company, Ltd. 413,17734,800 Kokuyo Company, Ltd. 646,828
186,700 Konica Minolta Holdings, Inc. 1,868,90339,700 Konoike Transport Company, Ltd. 724,388
104,100 K's Holdings Corporation 2,907,78724,000 Kurabo Industries, Ltd. 77,830
6,700 KYB Company, Ltd. 436,9467,200 Kyokuto Kaihatsu Kogyo Company,
Ltd. 126,05064,400 Kyowa Exeo Corporation 1,671,885
213 LaSalle Logiport REIT 230,03336,500 Leopalace21 Corporation 303,224
7,200 Link and Motivation, Inc. 62,636108,000 Makino Milling Machine Company,
Ltd. 1,220,70915,600 Mandom Corporation 557,138
142,900 Marubeni Corporation 1,074,74432,100 Marusan Securities Company, Ltd. 314,063
6,600 Maruwa Company, Ltd. 591,11413,400 Marvelous, Inc. 121,08132,600 Matsumotokiyoshi Holdings Company,
Ltd. 1,339,43238,400 Maxell Holdings, Ltd. 887,153
2,600 Megmilk Snow Brand Company, Ltd. 75,0938,100 Meiko Network Japan Company, Ltd. 98,4617,800 MEITEC Corporation 429,141
27,400 Ministop Company, Ltd. 573,934165,400 Mitsubishi Chemical Holdings
Corporation 1,803,903113,800 Mitsubishi Corporation 3,189,287
5,900 Mitsubishi Shokuhin Company, Ltd. 175,902108,200 Mitsui & Company, Ltd. 1,903,723
900 Mitsui Mining and Smelting Company, Ltd. 50,546
5,600 Mitsui Sugar Company, Ltd. 238,6412,229,100 Mizuho Financial Group, Inc. 4,225,821
35,200 Monex Group, Inc. 130,87513 Mori Trust Sogo REIT, Inc. 19,414
7,700 Nagase & Co., Ltd. 140,4416,500 NEC Networks & System Integration
Corporation 174,175
Shares Common Stock (89.2%) ValueJapan (19.4%) - continued
38,000 NICHIAS Corporation $517,79051,700 Nichirei Corporation 1,387,862
1,000 Nihon Chouzai Company, Ltd. 31,59435,800 Nikkiso Company, Ltd. 424,64012,400 Nikkon Holdings Company, Ltd. 338,092
7,900 Nintendo Company, Ltd. 3,578,027700 Nippon Chemi-Con Corporation 23,757
41,000 Nippon Electric Glass Company, Ltd. 1,695,240447,400 Nippon Light Metal Holdings
Company, Ltd. 1,319,79410,000 Nippon Shokubai Company, Ltd. 712,11595,400 Nippon Telegraph & Telephone
Corporation 4,568,19916,400 Nippon Thompson Company, Ltd. 129,01426,200 Nishimatsu Construction Company,
Ltd. 744,855883,978 Nissan Motor Company, Ltd. 9,469,627
13,100 Nisshin Oillio Group, Ltd. 395,43015,800 Nisshin Steel Company, Ltd. 266,39318,800 Nissin Kogyo Company, Ltd. 354,84713,983 Nitto Kogyo Corporation 240,211
7,300 Noritz Corporation 144,35817,800 NSD Company, Ltd. 376,381
209,200 NTN Corporation 1,078,95661,800 NTT DOCOMO, Inc. 1,535,570
114,800 Obayashi Corporation 1,386,0434,300 Oiles Corporation 89,562
16,000 Oki Electric Industry Company, Ltd. 232,8746,000 Okuma Corporation 414,194
98,500 ORIX Corporation 1,845,071222,900 Osaka Gas Company, Ltd. 4,434,091
10,600 Paramount Bed Holdings Company, Ltd. 558,719
5,300 Plenus Company, Ltd. 103,90194 Premier Investment Corporation 100,225
204,000 Prima Meat Packers, Ltd. 1,396,0446,600 Qol Company, Ltd. 131,2844,600 Raito Kogyo Company, Ltd. 52,229
12,700 Relo Group, Inc. 377,1512,200 Riken Vitamin Company, Ltd. 85,461
18,300 Rohm Company, Ltd. 2,016,02829,000 ROHTO Pharmaceutical Company, Ltd. 779,44243,100 Round One Corporation 799,271
8,300 Ryoyo Electro Corporation 147,3022,700 Sakai Moving Service Company, Ltd. 129,4091,400 Sanden Holdings Corporationb 30,601
56,300 Sangetsu Company, Ltd. 1,121,4853,800 Sanki Engineering Company, Ltd. 43,062
65,500 Sankyo Company, Ltd. 2,128,13113,500 Sankyu, Inc. 630,114
1,300 Sanyo Special Steel Company, Ltd. 33,0032,000 SCREEN Holdings Company, Ltd. 174,325
41,900 Sega Sammy Holdings, Inc. 586,4737,000 Seiko Holdings Corporation 201,5754,900 Seino Holdings Company, Ltd. 81,483
83 Sekisui House Residential Investment Corporation 95,624
20,800 Sekisui House, Ltd. 382,16636,300 Senko Group Holdings Company, Ltd. 261,13222,300 Shikoku Electric Power Company 253,38023,000 SHIMAMURA Company, Ltd. 2,703,997
3,100 Shindengen Electric Manufacturing Company, Ltd. 287,135
77,300 Shinko Electric Industries Company, Ltd. 657,505
72,100 ShinMaywa Industries, Ltd. 693,657

Partner WorldWide allocation Fund Schedule of Investments as of January 31, 2018
(unaudited)
The accompanying Notes to Schedule of Investments are an integral part of this schedule.5
Shares Common Stock (89.2%) ValueJapan (19.4%) - continued
13,300 Ship Healthcare Holdings, Inc. $432,99011,100 SHOWA Corporation 139,6247,200 Sintokogio, Ltd. 92,687
17,200 Sodick Company, Ltd. 240,44039,900 SoftBank Group Corporation 3,315,208
2,400 Square ENIX Holdings Company, Ltd. 109,6292,000 STUDIO ALICE Company, Inc.b 51,479
109,300 Sumitomo Corporation 1,889,86336,700 Sumitomo Heavy Industries, Ltd. 1,683,029
2,200 Sumitomo Seika Chemicals Company, Ltd. 114,843
13,000 Sun Frontier Fudousan Co., Ltd. 164,32844,000 Suzuki Motor Corporation 2,527,14311,300 Taiho Kogyo Company, Ltd. 171,76823,200 Taikisha, Ltd. 810,57281,900 Taiyo Yuden Company, Ltd. 1,386,04119,100 Takara Holdings, Inc. 235,726
134,400 Takara Leben Company, Ltd. 601,72732,300 Takeda Pharmaceutical Company,
Ltd. 1,891,9347,700 Tatsuta Electric Wire and Cable
Company, Ltd. 56,9917,700 TechnoPro Holdings, Inc. 422,844
15,500 TIS, Inc. 549,95133,800 Toagosei Company, Ltd. 437,443
3,500 Toho Titanium Company, Ltd. 49,6371,400 Toho Zinc Company, Ltd. 85,298
21,800 Tokai Rika Company, Ltd. 474,26514,100 Tokyo Electron, Ltd. 2,659,857
142,100 Tokyo Gas Company, Ltd. 3,390,60220,300 Tokyo Seimitsu Company, Ltd. 888,856
317 Tokyu REIT, Inc. 403,328106,000 Toppan Printing Company, Ltd. 999,213
2,200 Topy Industries, Ltd. 71,81625,600 Tosei Corporation 316,46768,000 Toshiba Machine Company, Ltd. 557,80010,100 Toyo Construction Company, Ltd. 57,86512,800 Toyo Tanso Company, Ltd. 443,27871,700 Toyoda Gosei Company, Ltd. 1,908,16153,100 Toyota Motor Corporation 3,658,452
1,000 Tsubaki Nakashima Company, Ltd. 28,55824,000 Tsubakimoto Chain Company 202,668
4,000 Tsugami Corporation 59,79074,200 TV Asahi Holdings Corporation 1,534,3724,600 UACJ Corporation 124,107
15,100 Ube Industries, Ltd. 451,04526,200 ULVAC, Inc. 1,756,25910,800 Unipres Corporation 287,79116,500 UNIZO Holdings Company, Ltd. 475,73011,500 Ushio, Inc. 176,362
5,800 Wakita & Company, Ltd. 71,94126,700 West Japan Railway Company 2,008,429
1,600 Ya-Man, Ltd. 26,73210,200 Yamato Kogyo Company, Ltd. 292,24911,300 Yodogawa Steel Works, Ltd. 350,44617,500 Yumeshin Holdings Company, Ltd. 206,50310,400 Zenkoku Hosho Company, Ltd. 487,50433,100 ZEON Corporation 499,546
Total 189,017,124
Jersey (<0.1%) 49,101 Boohoo.Com PLCb 129,219
Total 129,219
Luxembourg (0.5%) 74,342 Arcelor Mittalb 2,692,485
Shares Common Stock (89.2%) ValueLuxembourg (0.5%) - continued
25,822 B&M European Value Retail SA $152,4144,672 Oriflame Holdings AG 209,233
130,710 Subsea 7 SA 2,035,961Total 5,090,093
Malaysia (0.2%) 306,500 Public Bank Berhad 1,728,400
Total 1,728,400
Mexico (0.8%) 32,500 Fomento Economico Mexicano SAB
de CV ADR 3,170,0509,500 Grupo Aeroportuario del Sureste SAB
de CV ADR 1,844,995411,208 Grupo Financiero Banorte SAB de CV
ADR 2,633,605Total 7,648,650
Netherlands (3.3%) 203,399 ABN AMRO Group NVc 6,884,706
3,558 AMG Advanced Metallurgical Group NV 190,262
12,480 ASM International NV 898,13035,571 ASR Nederland NV 1,553,77918,251 BE Semiconductor Industries NV 1,756,43436,390 Euronext NVc 2,465,24319,006 Ferrari NV 2,267,58880,695 Fiat Chrysler Automobiles NVb 1,950,30220,941 Koninklijke DSM NV 2,165,15634,943 NN Group NV 1,648,090
1,680 NSI NV 74,25554,274 Philips Lighting NVc 2,134,06571,835 RELX NV 1,590,689
112,264 Unilever NV 6,480,157Total 32,058,856
New Zealand (0.1%) 98,183 a2 Milk Company, Ltd.b 665,677
147,608 Air New Zealand, Ltd. 335,04346,539 Contact Energy, Ltd. 191,69164,795 Infratil, Ltd. 155,190
8,574 Z Energy, Ltd. 48,337Total 1,395,938
Norway (2.0%) 106,919 Aker BP ASA 3,094,031
20,841 Aker Solutions ASAb 120,18414,466 Borregaard ASA 129,106
290,810 DnB ASA 5,910,787896,024 DNO International ASAb 1,145,031
2,018 Entra ASAc 30,52321,406 Grieg Seafood ASA 189,15829,882 Leroy Seafood Group ASA 152,178
176,154 Norsk Hydro ASA 1,282,63818,095 SalMar ASA 491,99515,937 SpareBank 1 Nord-Norge 134,47916,764 SpareBank 1 SMN 190,06339,535 Storebrand ASA 353,894
250,104 Telenor ASA 5,847,3489,534 TGS Nopec Geophysical Company ASA 239,517
Total 19,310,932
Philippines (0.5%) 11,120 Ayala Corporation 227,642
3,199,800 Ayala Land, Inc. 2,760,061

Partner WorldWide allocation Fund Schedule of Investments as of January 31, 2018
(unaudited)
The accompanying Notes to Schedule of Investments are an integral part of this schedule.6
Shares Common Stock (89.2%) ValuePhilippines (0.5%) - continued
911,364 Bank of the Philippine Islands $2,116,369Total 5,104,072
Poland (0.1%) 34,898 Bank Pekao SA 1,416,564
Total 1,416,564
Portugal (0.6%) 42,320 Altri SGPS SA 255,792
2,978,379 Banco Espirito Santo SAb,d,e 370110,783 CTT-Correios de Portugal SA 474,525110,848 Galp Energia SGPS SA 2,117,462
73,827 Jeronimo Martins SGPS SA 1,572,4353,850 Semapa-Sociedade de Investimento e
Gestao, SGPS SA 87,857981,527 Sonae 1,575,678
Total 6,084,119
Russia (0.3%) 25,100 Lukoil ADR 1,658,47016,297 Magnit PJSC 1,545,245
Total 3,203,715
Singapore (0.5%) 229,700 CapitaLand Retail China Trust 295,924
50,900 China Aviation Oil (Singapore) Corporation Ltd 63,115
206,800 Frasers Commercial Trust 230,16335,700 OUE, Ltd. 58,474
106,900 United Engineers, Ltd. 215,13790,100 United Overseas Bank, Ltd. 1,880,65199,300 Venture Corporation, Ltd. 1,739,572
245,600 Yanlord Land Group, Ltd. 346,367Total 4,829,403
South Africa (0.6%) 123,390 Massmart Holdings, Ltd. 1,441,464177,800 MTN Group, Ltd. 1,968,815241,111 Truworths International, Ltd. 1,994,629
Total 5,404,908
South Korea (0.6%) 3,914 Amorepacific Corporationb 569,9567,488 Amorepacific Groupb 995,7353,615 LG Chem, Ltd. 1,462,1602,948 NAVER Corporation 2,511,136
Total 5,538,987
Spain (1.8%) 4,200 Acerinox SA 61,763
36,752 ACS Actividades de Construccion y Servicios, SA 1,470,548
35,579 Amadeus IT Holding SA 2,758,41729,269 Applus Services SA 422,803
123,664 Banco Bilbao Vizcaya Argentaria SA 1,160,539117,961 Banco de Sabadell SA 280,372
531 CIE Automotive SA 18,1975,309 Construcciones y Auxiliar de
Ferrocarriles SA 247,178183,067 Distribuidora Internacional de
Alimentacion SA 978,150122,263 Ence Energia y Celulosa SA 785,547
16,460 Hispania Activos Inmobiliarios SA 344,34715,882 International Consolidated Airlines
Group SA 144,3104,443 Let's GOWEX SAb,d,e 1
Shares Common Stock (89.2%) ValueSpain (1.8%) - continued
64,004 Melia Hotels International SA $904,494114,461 Merlin Properties Socimi SA 1,648,072
22,913 NH Hotel Group SA 174,216251,487 Repsol SA 4,733,248124,523 Telefonica SA 1,277,431
3,445 Viscofan SA 240,943Total 17,650,576
Sweden (2.6%) 42,147 Atlas Copco AB, Class B 1,759,08023,382 Betsson ABb 189,729
4,926 Biotage AB 54,57454,755 Boliden AB 1,987,76813,862 Bonava AB 197,554
6,319 Bure Equity AB 79,14262,492 Dometic Group ABc 676,32240,754 Granges AB 428,85534,479 Hemfosa Fastigheter AB 473,966
8,538 Investor AB 417,52048,000 JM AB 1,082,70860,607 Loomis AB 2,423,22024,616 NetEnt ABb 139,76335,281 Nobina ABc 250,283
279,263 Nordea Bank AB 3,447,5293,615 Peab AB 31,014
49,073 Scandic Hotels Group ABc 542,97029,566 Skandinaviska Enskilda Banken AB 373,649
144,905 SKF AB 3,581,602135,529 SSAB AB, Class Bb 705,113253,920 Svenska Cellulosa AB SCA 2,627,525
63,589 Swedish Orphan Biovitrum ABb 1,117,0972,483 Vitrolife AB 217,337
143,647 Volvo AB 2,931,913Total 25,736,233
Switzerland (5.1%) 12,359 Adecco SA 1,016,911
846 Bachem Holding AG 127,9784,324 BKW FMB Energie 276,5222,419 Bobst Group SA 317,209
522 Bossard Holding AG 134,816678 Bucher Industries AG 310,650
4,279 Cembra Money Bank AG 422,107197 Conzzeta AG 239,841
38,966 Ferguson plc 3,009,117243,536 Ferrexpo plc 1,008,653
34,104 GAM Holding AGb 640,578902 Georg Fischer AG 1,305,782
676,840 Glencore Xstrata plcb 3,879,237161 Gurit Holding AG 180,244
2,312 Implenia AG 167,722955 Inficon Holding AG 597,618
1,270 Kardex AG 172,75510,268 Lonza Group AG 2,852,826
778 Mobimo Holding AG 217,64495,249 Nestle SA 8,227,79659,226 Novartis AG 5,345,566
1,659 OC Oerlikon Corporation AGb 29,60018,747 Pargesa Holding SA 1,709,0192,544 Partners Group Holding AG 1,976,829
868 Rieter Holding AG 231,84031,744 Roche Holding AG 7,843,1265,428 Roche Holding AG-BR 1,356,358
205 Schweiter Technologies AG 256,4551,269 Siegfried Holding AG 454,1891,099 Sulzer, Ltd. 156,186

Partner WorldWide allocation Fund Schedule of Investments as of January 31, 2018
(unaudited)
The accompanying Notes to Schedule of Investments are an integral part of this schedule.7
Shares Common Stock (89.2%) ValueSwitzerland (5.1%) - continued
9,610 TE Connectivity, Ltd. $985,3133,340 Tecan Group AG 739,3145,714 Temenos Group AG 789,6553,021 Valora Holding AG 1,111,7564,947 Vontobel Holding AG 357,4102,867 Zurich Insurance Group AG 943,094
Total 49,391,716
Taiwan (0.7%) 788,362 Taiwan Semiconductor Manufacturing
Company, Ltd. 6,889,736Total 6,889,736
Thailand (0.5%) 186,150 Siam Cement pcl 2,920,233465,000 Siam Commercial Bank pcl 2,334,731
Total 5,254,964
Turkey (0.4%) 410,258 Akbank TAS 1,189,10584,296 BIM Birlesik Magazalar AS 1,680,341
385,000 Turkiye Garanti Bankasi AS 1,255,907Total 4,125,353
United Kingdom (12.8%) 112,049 3i Group plc 1,481,627
15,345 Abcam plc 267,811126,673 Anglo American plc 3,070,672112,159 Ashmore Group plc 684,650
74,682 Ashtead Group plc 2,232,47543,825 Associated British Foods plc 1,699,742
769 Aveva Group plc 32,58179,008 Aviva plc 576,39720,197 Barratt Developments plc 167,77372,935 BBA Aviation plc 364,51731,117 Bellway plc 1,466,911
472,554 BHP Billiton plc 10,523,88811,818 Big Yellow Group plc 145,56517,652 Bodycote plc 242,226
396,896 BP plc 2,831,61134,440 Brewin Dolphin Holdings plc 182,60754,783 British American Tobacco plc 3,744,236
4,264 Burford Capital, Ltd. 74,46751,043 Coca-Cola HBC AG 1,714,81367,367 Crest Nicholson Holdings plc 483,516
127,010 Diageo plc 4,571,39015,011 Dialog Semiconductor plcb 457,654
281,440 Direct Line Insurance Group plc 1,475,537137,724 Electrocomponents plc 1,198,29358,340 Elementis plc 239,76472,430 Fenner plc 487,666
5,826 Fevertree Drinks plc 202,50031,101 Galliford Try plc 482,21372,184 Grainger plc 296,378
255,848 Hansteen Holdings plc 515,837394,065 Hays plc 1,131,285254,051 Howden Joinery Group plc 1,675,254
1,654,349 HSBC Holdings plc 17,649,67937,873 Ibstock plcc 138,330
120,188 Inchcape plc 1,237,500151,406 Intermediate Capital Group plc 2,489,416149,281 JD Sports Fashion plc 776,185205,361 Jupiter Fund Management plc 1,725,238146,672 KAZ Minerals plcb 1,706,824382,437 Legal & General Group plc 1,469,089
1,745,202 Lloyds TSB Group plc 1,724,259
Shares Common Stock (89.2%) ValueUnited Kingdom (12.8%) - continued
233,823 Man Group plc $720,777433,781 Marks and Spencer Group plc 1,854,972
61,972 Mondi plc 1,651,74713,787 Morgan Advanced Materials plc 67,849
140,556 National Express Group plc 731,90037,757 NEX Group plc 317,903
5,831 Next plc 421,03336,155 NMC Health plc 1,711,40633,358 Northgate plc 192,29561,255 OneSavings Bank plc 347,196
371,004 PageGroup plc 2,867,40195,883 Paragon Banking Group plc 671,72945,479 Persimmon plc 1,615,625
191,839 QinetiQ Group plc 560,836115,820 Redrow plc 985,037
68,888 RELX plc 1,524,4822,624 Renishaw plc 184,770
125,105 Rentokil Initial plc 527,69817,176 Royal Dutch Shell plc 603,17491,748 Royal Dutch Shell plc, Class A 3,216,564
223,774 Royal Dutch Shell plc, Class B 7,937,817595,584 Royal Mail plc 3,968,169
40,323 Safestore Holdings plc 285,81533,557 Savills plc 487,89431,227 Schroders plc 1,648,989
101,050 Smith & Nephew plc 1,818,243133,689 Smiths Group plc 3,036,083
3,292 Spectris plc 121,95714,377 Spirax-Sarco Engineering plc 1,157,961
286,733 SSP Group plc 2,481,104123,132 Standard Chartered plcb 1,432,670
92,968 Synthomer plc 625,683134,367 Thomas Cook Group plc 240,765
64,188 Unilever plc 3,632,80318,880 UNITE Group plc 213,65058,172 Vesuvius plc 497,4063,665 Victrex plc 132,974
200,716 William Hill plc 883,458Total 125,016,211
United States (0.3%) 12,581 Kulicke and Soffa Industries, Inc.b 289,48960,600 Yum China Holding, Inc. 2,811,234
Total 3,100,723
Total Common Stock (cost $710,750,253) 871,012,901
Principal Amount Long-Term Fixed Income (7.9%)
Argentina (0.8%) Argentina Government International
Bond
$830,00024.309%, (BADLARPP + 2.75%), 3/1/2018f,g 44,174
525,00024.226%, (BADLARPP + 2.5%), 3/11/2019f,g 28,275
700,00024.809%, (BADLARPP + 3.25%), 3/1/2020f,g 39,037
14,195,00027.277%, (ARPP7DRR FLAT), 6/21/2020f,g 819,818
230,000 6.875%, 4/22/2021 245,295
1,225,00024.225%, (BADLARPP + 2%), 4/3/2022f,g 67,692
420,000 3.375%, 1/15/2023h 525,365 80,000 16.000%, 10/17/2023f 4,278

Partner WorldWide allocation Fund Schedule of Investments as of January 31, 2018
(unaudited)
The accompanying Notes to Schedule of Investments are an integral part of this schedule.8
Principal Amount Long-Term Fixed Income (7.9%) Value
Argentina (0.8%) - continued $460,000 7.500%, 4/22/2026 $507,150
30,000 15.500%, 10/17/2026f 1,612 800,000 6.875%, 1/26/2027 843,208 240,000 5.875%, 1/11/2028 233,520 420,000 5.250%, 1/15/2028h 529,839 426,592 7.820%, 12/31/2033h 608,422 137,610 7.820%, 12/31/2033h 198,205 235,543 8.280%, 12/31/2033 261,099 850,000 7.125%, 7/6/2036 869,550 100,000 2.260%, 12/31/2038h,i 89,582
1,030,000 2.500%, 12/31/2038i 722,030 100,000 6.250%, 11/9/2047h 123,480 330,000 6.875%, 1/11/2048 319,605
Argentina Treasury Bond BONCER 100,000 2.500%, 7/22/2021f 6,723
Cablevision SA 150,000 6.500%, 6/15/2021c 158,307
Central Bank of Argentina 1,400,000 Zero Coupon, 5/16/2018f 66,339
Total 7,312,605
Azerbaijan (<0.1%) Azerbaijan Government International
Bond 150,000 3.500%, 9/1/2032c 132,611
Total 132,611
Bahrain (<0.1%) Bahrain Government International
Bond 370,000 6.750%, 9/20/2029c 365,005
Total 365,005
Belize (<0.1%) Belize Government International Bond
135,900 4.938%, 2/20/2034* 80,860Total 80,860
Bermuda (0.1%) Bermuda Government International
Bond 200,000 3.717%, 1/25/2027c 200,000
Digicel, Ltd. 200,000 6.000%, 4/15/2021* 198,000 330,000 6.750%, 3/1/2023c 328,350
Total 726,350
Brazil (0.3%) Banco do Brasil SA/Cayman
400,000 9.000%, 6/18/2024g,j 431,200Brazil Government International Bond
85,000 Zero Coupon, 5/15/2055k 94,366Brazil Letras do Tesouro Nacional
1,680,000 Zero Coupon, 10/1/2019k 466,258Brazil Loan Trust 1
295,039 5.477%, 7/24/2023* 308,466Brazil Minas SPE via State of Minas
Gerais 260,000 5.333%, 2/15/2028* 263,900
Brazil Notas do Tesouro Nacional 147,000 10.000%, 1/1/2025k 47,607
Itau Unibanco Holding SA 200,000 6.125%, 12/12/2022*,g,j 203,340
Principal Amount Long-Term Fixed Income (7.9%) Value
Brazil (0.3%) - continued Samarco Mineracao SA
$200,000 4.125%, 11/1/2022l $157,600Total 1,972,737
Cayman Islands (<0.1%) China Evergrande Group
200,000 8.750%, 6/28/2025 206,471Kaisa Group Holdings, Ltd.
200,000 9.375%, 6/30/2024 195,008Total 401,479
Chile (0.2%) Chile Government International Bond
680,000 3.240%, 2/6/2028m 676,940GNL Quintero SA
310,000 4.634%, 7/31/2029c 323,950Itau CorpBanca
286,000 3.875%, 9/22/2019c 290,584Sociedad Quimica y Minera de Chile
SA 200,000 3.625%, 4/3/2023 202,250 200,000 4.375%, 1/28/2025* 208,500
Total 1,702,224
Colombia (0.2%) Banco de Bogota SA
450,000 6.250%, 5/12/2026c 488,250Colombia Government International
Bond 30,000 8.125%, 5/21/2024 37,800
100,000 3.875%, 3/22/2026h 144,269 390,000 5.625%, 2/26/2044 445,380 585,000 5.000%, 6/15/2045 615,420
Total 1,731,119
Costa Rica (0.2%) Banco de Costa Rica
200,000 5.250%, 8/12/2018 201,040 220,000 5.250%, 8/12/2018c 221,144
Banco Nacional de Costa Rica 220,000 4.875%, 11/1/2018c 220,286
Costa Rica Government International Bond
30,000 9.995%, 8/1/2020 33,975 210,000 5.625%, 4/30/2043c 190,050 200,000 5.625%, 4/30/2043 181,000 450,000 7.158%, 3/12/2045c 479,250
Total 1,526,745
Dominican Republic (0.3%) Aeropuertos Dominicanos Siglo XXI SA
270,000 6.750%, 3/30/2029c 295,650Dominican Republic Government
International Bond 4,000,000 15.000%, 4/5/2019n 88,766
900,000 16.000%, 7/10/2020n 21,849 400,000 7.500%, 5/6/2021 434,200 600,000 11.500%, 5/10/2024n 14,117 290,000 8.625%, 4/20/2027 353,075
1,600,000 18.500%, 2/4/2028*,n 49,362 2,900,000 11.375%, 7/6/2029n 67,148
990,000 6.850%, 1/27/2045 1,101,375 560,000 6.850%, 1/27/2045c 623,000
Total 3,048,542

Partner WorldWide allocation Fund Schedule of Investments as of January 31, 2018
(unaudited)
The accompanying Notes to Schedule of Investments are an integral part of this schedule.9
Principal Amount Long-Term Fixed Income (7.9%) Value
Ecuador (0.4%) Ecuador Government International
Bond$390,000 10.750%, 3/28/2022 $453,375 230,000 7.950%, 6/20/2024 243,225 210,000 9.650%, 12/13/2026 239,400 700,000 9.650%, 12/13/2026c 798,000 540,000 9.625%, 6/2/2027c 612,900 770,000 8.875%, 10/23/2027c 838,338 380,000 7.875%, 1/23/2028c 385,890
EP PetroEcuador
143,6847.316%, (LIBOR 3M + 5.63%), 9/24/2019g 146,917
Total 3,718,045
Egypt (0.1%) Citigroup Global Markets Holdings,
Inc. 8,100,000 Zero Coupon, 5/10/2018c,o 437,657
Total 437,657
El Salvador (<0.1%) El Salvador Government International
Bond 100,000 7.375%, 12/1/2019 105,000
40,000 7.750%, 1/24/2023 43,871 32,000 5.875%, 1/30/2025 32,080
109,000 6.375%, 1/18/2027 111,453 50,000 8.625%, 2/28/2029c 58,875
Total 351,279
France (<0.1%) CMA CGM SA
100,000 5.250%, 1/15/2025c,h 119,289Total 119,289
Guatemala (0.2%) Agromercantil Senior Trust
170,000 6.250%, 4/10/2019c 174,063Guatemala Government International
Bond 810,000 5.750%, 6/6/2022 863,938 230,000 4.500%, 5/3/2026c 231,665 350,000 4.375%, 6/5/2027c 349,125 500,000 4.875%, 2/13/2028 513,870
Total 2,132,661
Honduras (0.1%) Honduras Government International
Bond 290,000 8.750%, 12/16/2020* 326,815 400,000 8.750%, 12/16/2020 450,780
Total 777,595
India (<0.1%) NTPC, Ltd.
100,000 2.750%, 2/1/2027h 127,880Reliance Industries, Ltd.
300,000 3.667%, 11/30/2027c 290,831Total 418,711
Indonesia (0.6%) Indonesia Government International
Bond 320,000 3.700%, 1/8/2022c 326,910 843,000 5.875%, 1/15/2024 951,099
Principal Amount Long-Term Fixed Income (7.9%) Value
Indonesia (0.6%) - continued $200,000 4.125%, 1/15/2025 $206,240 520,000 3.375%, 7/30/2025h 731,153 200,000 3.750%, 6/14/2028c,h 289,891 420,000 3.750%, 6/14/2028h 608,772 280,000 8.500%, 10/12/2035 412,035 280,000 5.250%, 1/17/2042 308,059 600,000 6.750%, 1/15/2044 791,458
Perusahaan Penerbit SBSN Indonesia III
200,000 3.400%, 3/29/2022c 201,000 260,000 4.325%, 5/28/2025 268,125
1,020,000 4.150%, 3/29/2027c 1,040,400Total 6,135,142
Ireland (<0.1%) Credit Bank of Moscow
210,000 8.875%, 11/10/2022g,j 194,250Phosagro OAO
220,000 3.949%, 4/24/2023c 220,000Total 414,250
Isle of Man (<0.1%) Gohl Capital, Ltd.
200,000 4.250%, 1/24/2027 201,503Total 201,503
Israel (<0.1%) Delek and Avner Yam Tethys, Ltd.
128,000 3.839%, 12/30/2018c 128,275Total 128,275
Italy (0.1%) Wind Tre SPA
240,000 2.625%, 1/20/2023c,h 277,116 260,000 3.125%, 1/20/2025c,h 296,922 340,000 5.000%, 1/20/2026c 308,591
Total 882,629
Japan (0.1%) SoftBank Group Corporation
400,000 6.000%, 7/19/2023g,j 397,580Universal Entertainment Corporation
257,8835.914%,PIK 2.586%, 8/24/2020*,p 265,619
Total 663,199
Kenya (0.1%) Kenya Government International
Bond 840,000 6.875%, 6/24/2024 884,898
Total 884,898
Kuwait (<0.1%) State of Kuwait
340,000 3.500%, 3/20/2027 338,504Total 338,504
Luxembourg (0.1%) Altice Financing SA
200,000 6.625%, 2/15/2023c 202,580 200,000 7.500%, 5/15/2026 207,626
Gazprom OAO Via Gaz Capital SA 200,000 9.250%, 4/23/2019 214,530
Sberbank of Russia Via SB Capital SA 200,000 5.500%, 2/26/2024g 203,500

Partner WorldWide allocation Fund Schedule of Investments as of January 31, 2018
(unaudited)
The accompanying Notes to Schedule of Investments are an integral part of this schedule.10
Principal Amount Long-Term Fixed Income (7.9%) Value
Luxembourg (0.1%) - continued Telefonica Celular del Paraguay SA
$200,000 6.750%, 12/13/2022 $205,194Total 1,033,430
Macedonia, The Former Yugoslav Republic Of (0.1%) Macedonia Government International
Bond 280,000 5.625%, 7/26/2023c,h 410,539 460,000 2.750%, 1/18/2025c,h 577,541
Total 988,080
Mauritius (0.1%) Greenko Investment Company
200,000 4.875%, 8/16/2023c 194,517MTN (Mauritius) Investments, Ltd.
200,000 5.373%, 2/13/2022 206,604Neerg Energy, Ltd.
200,000 6.000%, 2/13/2022c 203,021Total 604,142
Mexico (0.6%) America Movil SAB de CV
2,010,000 6.000%, 6/9/2019q 104,271Banco Mercantil del Norte SA
220,000 7.625%, 1/10/2028c,g,j 243,815BBVA Bancomer SA
200,000 5.125%, 1/18/2033c,g 197,830Cemex SAB de CV
100,000 2.750%, 12/5/2024c,h 126,266Gruma, SAB de CV
200,000 4.875%, 12/1/2024c 212,500Mexican Bonos
7,324,800 6.500%, 6/9/2022q 378,733 9,206,100 8.000%, 12/7/2023q 505,600
Mexico Government International Bond
128,000 5.750%, 10/12/2110 133,888 200,000 4.350%, 1/15/2047 189,700 440,000 4.600%, 2/10/2048 432,300
Petroleos Mexicanos 70,000 3.500%, 7/23/2020 70,595
330,000 6.375%, 2/4/2021 358,215 120,000 5.375%, 3/13/2022c 127,080
10,000 3.500%, 1/30/2023 9,795 860,000 5.125%, 3/15/2023h 1,238,633
80,000 6.875%, 8/4/2026 90,680 390,000 6.500%, 3/13/2027c 426,075 250,000 6.500%, 3/13/2027c 273,125
89,000 5.500%, 6/27/2044 81,783 20,000 6.375%, 1/23/2045 20,030
160,000 6.750%, 9/21/2047c 167,600 97,000 6.750%, 9/21/2047 101,607
Total 5,490,121
Netherlands (0.2%) Greenko Dutch BV
290,000 5.250%, 7/24/2024c 288,768Metinvest BV
29,7475.082%,PIK 4.291%, 12/31/2021p 30,565
99,1565.082%,PIK 4.291%, 12/31/2021p 101,882
Petrobras Global Finance BV 570,000 6.125%, 1/17/2022 607,620 106,000 5.299%, 1/27/2025c 106,795
Principal Amount Long-Term Fixed Income (7.9%) Value
Netherlands (0.2%) - continued $27,000 5.999%, 1/27/2028c $27,270
Syngenta Finance NV 100,000 1.250%, 9/10/2027h 107,643
Total 1,270,543
Nigeria (0.1%) Nigeria Government International
Bond 206,000 6.750%, 1/28/2021 219,431 200,000 6.375%, 7/12/2023 212,560 200,000 6.500%, 11/28/2027c 207,516 400,000 7.875%, 2/16/2032 451,640 200,000 7.625%, 11/28/2047c 213,651
Total 1,304,798
Oman (0.1%) Oman Government International Bond
1,140,000 6.750%, 1/17/2048c 1,159,380Total 1,159,380
Pakistan (0.1%) Pakistan Government International
Bond 1,010,000 6.875%, 12/5/2027c 1,019,748
Third Pakistan International Sukuk Company, Ltd.
290,000 5.625%, 12/5/2022c 291,814Total 1,311,562
Panama (<0.1%) Panama Notas del Tesoro
50,000 4.875%, 2/5/2021 53,106Total 53,106
Paraguay (0.1%) Banco Regional SAECA
150,000 8.125%, 1/24/2019 156,000 180,000 8.125%, 1/24/2019c 187,200
Paraguay Government International Bond
410,000 5.000%, 4/15/2026c 436,137 350,000 4.700%, 3/27/2027c 363,563 200,000 6.100%, 8/11/2044 228,500
Total 1,371,400
Peru (0.1%) Abengoa Transmision Sur SA
317,984 6.875%, 4/30/2043* 351,770Corporacion Financiera de Desarrollo
SA 200,000 4.750%, 2/8/2022c 209,740
Corporacion Lindley SA 90,000 6.750%, 11/23/2021* 98,887
260,000 6.750%, 11/23/2021 285,675 22,000 4.625%, 4/12/2023 22,798 80,000 4.625%, 4/12/2023c 82,900
Total 1,051,770
Romania (<0.1%) Romania Government International
Bond 170,000 2.375%, 4/19/2027c,h 216,341
Total 216,341

Partner WorldWide allocation Fund Schedule of Investments as of January 31, 2018
(unaudited)
The accompanying Notes to Schedule of Investments are an integral part of this schedule.11
Principal Amount Long-Term Fixed Income (7.9%) Value
Russia (0.3%) Gazprom OAO Via Gaz Capital SA
$300,000 7.288%, 8/16/2037 $376,540Lukoil International Finance BV
200,000 6.125%, 11/9/2020 213,826Phosagro OAO via Phosagro Bond
Funding, Ltd. 200,000 4.204%, 2/13/2018* 200,009
Russia Government International Bond
200,000 4.875%, 9/16/2023c 213,592 1,000,000 4.750%, 5/27/2026 1,062,750
400,000 4.250%, 6/23/2027c 410,314 200,000 5.250%, 6/23/2047 210,500 400,000 5.250%, 6/23/2047c 421,000
Total 3,108,531
South Africa (0.4%) Eskom Holdings SOC, Ltd.
200,000 6.750%, 8/6/2023 207,234 200,000 7.125%, 2/11/2025 209,819
South Africa Government International Bond
1,100,000 5.875%, 9/16/2025 1,199,550 1,080,000 8.000%, 1/31/2030r 84,735 2,830,000 7.000%, 2/28/2031r 201,527 8,735,000 8.250%, 3/31/2032r 683,295 1,020,000 8.875%, 2/28/2035r 82,249 1,830,000 6.250%, 3/31/2036r 112,708 2,085,000 9.000%, 1/31/2040r 166,432
570,000 6.500%, 2/28/2041r 34,586 2,700,000 8.750%, 1/31/2044r 209,285 1,050,000 5.650%, 9/27/2047 1,078,381
Total 4,269,801
Sri Lanka (0.2%) Sri Lanka Government International
Bond 200,000 5.750%, 1/18/2022c 207,005 200,000 6.125%, 6/3/2025 210,424 370,000 6.850%, 11/3/2025c 404,694 200,000 6.825%, 7/18/2026 218,858 430,000 6.200%, 5/11/2027 452,164
Total 1,493,145
Supranational (<0.1%) Eastern and Southern African Trade
and Development Bank 200,000 5.375%, 3/14/2022 205,836
Total 205,836
Suriname (0.1%) Suriname Government International
Bond 200,000 9.250%, 10/26/2026 211,000 280,000 9.250%, 10/26/2026c 295,400
Total 506,400
Tajikistan (<0.1%) Tajikistan Government International
Bond 200,000 7.125%, 9/14/2027c 194,560
Total 194,560
Principal Amount Long-Term Fixed Income (7.9%) Value
Turkey (0.6%) Export Credit Bank of Turkey
$200,000 5.875%, 4/24/2019 $204,800Hazine Mustesarligi Varlik Kiralama
AS 690,000 5.004%, 4/6/2023c 704,367
TC Ziraat Bankasi AS 200,000 5.125%, 5/3/2022 199,531
Turkey Government International Bond
710,000 7.000%, 6/5/2020 761,432 600,000 6.250%, 9/26/2022 648,269 200,000 3.250%, 3/23/2023 189,052 640,000 5.750%, 3/22/2024 674,728 600,000 3.250%, 6/14/2025h 758,335
10,000 6.875%, 3/17/2036 11,001 100,000 6.750%, 5/30/2040 108,619 200,000 6.000%, 1/14/2041 199,524 600,000 4.875%, 4/16/2043 514,320
1,040,000 5.750%, 5/11/2047 987,480Total 5,961,458
Ukraine (0.2%) Ukraine Government International
Bond 190,000 7.750%, 9/1/2021 206,796 120,000 7.750%, 9/1/2022 130,752 280,000 7.750%, 9/1/2023 304,200 470,000 7.750%, 9/1/2024 508,578 270,000 7.750%, 9/1/2025 290,893 100,000 7.750%, 9/1/2026 106,874 100,000 7.750%, 9/1/2027 106,766 210,000 7.375%, 9/25/2032c 213,096
Total 1,867,955
United Arab Emirates (0.2%) Abu Dhabi Crude Oil Pipeline, LLC
790,000 4.600%, 11/2/2047c 793,988Abu Dhabi Government International
Bond 200,000 3.125%, 5/3/2026 194,460 500,000 3.125%, 10/11/2027c 479,790
Dolphin Energy, Ltd. 210,000 5.500%, 12/15/2021 226,275
Ruwais Power Company PJSC 360,000 6.000%, 8/31/2036c 423,000
Total 2,117,513
United States (0.2%) Cemex Finance, LLC.
140,000 4.625%, 6/15/2024h 188,516Citigroup Global Markets Holdings,
Inc. 5,000,000 Zero Coupon, 5/3/2018c,s 270,881
Comcel Trust 200,000 6.875%, 2/6/2024 210,840
Commonwealth of Puerto Rico G.O. 120,000 8.000%, 7/1/2035, Ser. Ae,l 32,160
Commonwealth of Puerto Rico Public Improvement Refg. G.O.
30,000 5.500%, 7/1/2032, Ser. Ae,l 7,500 10,000 5.500%, 7/1/2039, Ser. Ae,l 2,500
100,000 6.000%, 7/1/2039, Ser. Be,l 25,000JPMorgan Chase Bank NA
6,525,000 Zero Coupon, 2/15/2018c,t 365,884

Partner WorldWide allocation Fund Schedule of Investments as of January 31, 2018
(unaudited)
The accompanying Notes to Schedule of Investments are an integral part of this schedule.12
Principal Amount Long-Term Fixed Income (7.9%) Value
United States (0.2%) - continued Puerto Rico Sales Tax Financing
Corporation Refg. Rev.$10,000 5.375%, 8/1/2038, Ser. Ce,l $1,538
490,000 5.250%, 8/1/2041, Ser. Ce,l 75,338 75,000 5.000%, 8/1/2043, Ser. A-1e,l 11,531
5,000 5.250%, 8/1/2043, Ser. A-1e,l 769Puerto Rico Sales Tax Financing
Corporation Rev. 95,000 5.500%, 8/1/2028, Ser. Ae,l 14,606 55,000 6.750%, 8/1/2032, Ser. Ae,l 8,456 25,000 5.500%, 8/1/2037, Ser. Ae,l 3,844 35,000 5.375%, 8/1/2039, Ser. Ae,l 5,381
550,000 5.500%, 8/1/2042, Ser. Ae,l 84,563 35,000 6.000%, 8/1/2042, Ser. Ae,l 5,381
Puerto Rico Sales Tax Financing Corporation Sales Tax Rev.
35,000 5.750%, 8/1/2037, Ser. Ae,l 5,381U.S. Treasury Notes
370,000 2.250%, 12/31/2024 360,432Total 1,680,501
Venezuela (0.2%) Petroleos de Venezuela SA
5,360,000 6.000%, 10/28/2022l 951,400 3,360,000 6.000%, 5/16/2024l 789,600
947,000 6.000%, 11/15/2026l 219,704 680,000 5.375%, 4/12/2027 161,500
70,000 5.500%, 4/12/2037 16,450Venezuela Government International
Bond 119,000 8.250%, 10/13/2024l 30,940 483,000 9.250%, 5/7/2028l 130,410 260,000 9.375%, 1/13/2034 70,200
Total 2,370,204
Vietnam (<0.1%) Debt and Asset Trading Corporation
200,000 1.000%, 10/10/2025 143,141Total 143,141
Virgin Islands, British (<0.1%) Central American Bottling Corporation
140,000 5.750%, 1/31/2027c 146,790Total 146,790
Zambia (0.1%) Zambia Government International
Bond 380,000 8.970%, 7/30/2027c 421,507
Total 421,507
Total Long-Term Fixed Income (cost $76,706,018) 76,945,929
Shares Preferred Stock (1.0%)Germany (0.2%)
3,844 Draegerwerk AG & Company KGaA 374,74510,914 Henkel AG & Company KGaA, 1.620% 1,526,276
Total 1,901,021
Shares Preferred Stock (1.0%) ValueSouth Korea (0.8%)
4,254 Samsung Electronics Company, Ltd. $8,407,426Total 8,407,426
Total Preferred Stock (cost $5,702,937) 10,308,447
SharesCollateral Held for Securities Loaned (0.2%)
1,623,400 Thrivent Cash Management Trust 1,623,400Total Collateral Held for Securities Loaned (cost $1,623,400) 1,623,400
Shares or Principal Amount Short-Term Investments (1.1%)
Federal Home Loan Bank Discount Notes
200,000 1.300%, 2/16/2018u,v 199,892Thrivent Core Short-Term Reserve
Fund1,039,854 1.640% 10,398,546
Total Short-Term Investments (cost $10,598,438) 10,598,438Total Investments (cost $805,381,046) 99.4% $970,489,115Other Assets and Liabilities, Net 0.6% 5,812,899Total Net Assets 100.0% $976,302,014
a All or a portion of the security is on loan. b Non-income producing security.c Denotes securities sold under Rule 144A of the Securities
Act of 1933, which exempts them from registration. These securities may be resold to other dealers in the program or to other qualified institutional buyers. As of January 31, 2018, the value of these investments was $46,952,637 or 4.8% of total net assets.
d Security is valued using significant unobservable inputs. Further information on valuation can be found in the Notes to Financial Statements.
e In bankruptcy. Interest is not being accrued.f Principal amount is displayed in Argentine Pesos. g Denotes variable rate securities. The rate shown is as of
January 31, 2018.h Principal amount is displayed in Euros. i Denotes step coupon securities. Step coupon securities pay an
initial coupon rate for the first period and then different coupon rates for following periods. The rate shown is as of January 31, 2018.
j Denotes perpetual securities. Perpetual securities pay an indefinite stream of interest and have no contractual maturity date. Date shown, if applicable, is next call date.
k Principal amount is displayed in Brazilian Real. l Defaulted security. Interest is not being accrued.m Denotes investments purchased on a when-issued or delayed
delivery basis.n Principal amount is displayed in Dominican Republic Pesos. o Principal amount is displayed in Egyptian Pounds. Security is
linked to Egypt Government International Bond due 5/8/2018p Denotes payment-in-kind security. The security paid an interest
or dividend payment with additional fixed income or equity securities in lieu of, or in addition to a cash payment. The cash rate and/or payment-in-kind rate shown are as of January 31, 2018.

Partner WorldWide allocation Fund Schedule of Investments as of January 31, 2018
(unaudited)
The accompanying Notes to Schedule of Investments are an integral part of this schedule.13
q Principal amount is displayed in Mexican Pesos. r Principal amount is displayed in South African Rand. s Principal amount is displayed in Egyptian Pounds. Security is
linked to Egypt Government International Bond due 5/1/2018t Principal amount is displayed in Egyptian Pounds. Security is
linked to Egypt Government International Bond due 2/13/2018u The interest rate shown reflects the yield, coupon rate or the
discount rate at the date of purchase.v All or a portion of the security is held on deposit with the
counterparty and pledged as the initial margin deposit for open futures contracts.
* Denotes restricted securities. Restricted securities are investment securities which cannot be offered for public sale without first being registered under the Securities Act of 1933. The value of all restricted securities held in Partner Worldwide Allocation Fund as of January 31, 2018 was $2,555,528 or 0.3% of total net assets. The following table indicates the acquisition date and cost of restricted securities shown in the schedule as of January 31, 2018.
Security Acquisition Date CostAbengoa Transmision Sur SA,
4/30/2043 4/8/2014 $317,968Belize Government International
Bond, 2/20/2034 3/22/2017 90,768Brazil Loan Trust 1, 7/24/2023 7/25/2013 301,586Brazil Minas SPE via State of
Minas Gerais, 2/15/2028 3/22/2013 277,756Corporacion Lindley SA,
11/23/2021 11/18/2011 90,000Digicel, Ltd., 4/15/2021 1/20/2016 185,968Dominican Republic Government
International Bond, 2/4/2028 3/6/2013 45,451
Honduras Government International Bond, 12/16/2020 12/11/2013 290,000
Itau Unibanco Holding SA, 12/12/2022 12/5/2017 200,000
Phosagro OAO via Phosagro Bond Funding, Ltd., 2/13/2018 2/6/2013 200,000
Sociedad Quimica y Minera de Chile SA, 1/28/2025 10/23/2014 198,820
Universal Entertainment Corporation, 8/24/2020 10/18/2016 258,102
The following table presents the total amount of securities loaned with continuous maturity, by type, offset by the gross payable upon return of collateral for securities loaned by Thrivent Partner Worldwide Allocation Fund as of January 31, 2018:
Securities Lending TransactionsCommon Stock $1,542,139Total lending $1,542,139Gross amount payable upon return of collateral for securities loaned $1,623,400Net amounts due to counterparty $81,261
Definitions:ADR - American Depositary Receipt, which are certificates for an
underlying foreign security's shares held by an issuing U.S. depository bank.
G.O. - General ObligationPIK - Payment-In-Kind
Refg. - RefundingREIT - Real Estate Investment Trust is a company that buys,
develops, manages and/or sells real estate assets.Rev. - RevenueSer. - Series
Reference Rate Index:ARPP7DRR - Argentina Central Bank 7 Day Repo
Reference RateBADLARPP - Argentina Deposit Rates Badlar Private
BanksLIBOR 3M - ICE Libor USD Rate 3 Month

Partner WorldWide allocation Fund Schedule of Investments as of January 31, 2018
(unaudited)
The accompanying Notes to Schedule of Investments are an integral part of this schedule.14
Fair Valuation Measurements The following table is a summary of the inputs used, as of January 31, 2018, in valuing Partner Worldwide Allocation Fund's assets carried at fair value.
Investments in Securities Total Level 1 Level 2 Level 3Common Stock
Consumer Discretionary 126,240,488 2,879,471 123,361,017 –Consumer Staples 85,082,450 3,170,050 81,912,400 –Energy 51,453,300 – 51,453,300 –Financials 160,767,520 6,209,285 154,557,865 370Health Care 60,655,208 – 60,655,208 –Industrials 141,474,090 1,844,995 139,629,095 –Information Technology 78,553,979 1,274,802 77,279,177 –Materials 100,111,877 3,070,862 97,041,015 –Real Estate 27,303,297 – 27,303,297 –Telecommunications Services 24,216,951 – 24,216,950 1Utilities 15,153,741 – 15,153,741 –
Long-Term Fixed IncomeBasic Materials 1,120,806 – 1,120,806 –Capital Goods 314,782 – 314,782 –Communications Services 3,101,981 – 3,101,981 –Consumer Cyclical 662,130 – 662,130 –Consumer Non-Cyclical 849,550 – 849,550 –Energy 8,439,760 – 8,439,760 –Financials 5,661,916 – 5,661,916 –Foreign Government 53,608,747 – 53,608,747 –Transportation 738,889 – 738,889 –U.S. Government and Agencies 360,432 – 360,432 –U.S. Municipals 283,948 – 283,948 –Utilities 1,802,988 – 1,802,988 –
Preferred StockConsumer Staples 1,526,276 – 1,526,276 –Health Care 374,745 – 374,745 –Information Technology 8,407,426 – 8,407,426 –
Short-Term Investments 199,892 – 199,892 –Subtotal Investments in Securities $958,467,169 $18,449,465 $940,017,333 $371Other Investments * TotalShort-Term Investments 10,398,546 Collateral Held for Securities Loaned 1,623,400 Subtotal Other Investments $12,021,946
Total Investments at Value $970,489,115
* Certain investments are measured at fair value using a net asset value per share that is not publicly available (practical expedient). According to disclosure requirements of Accounting Standards Codification (ASC) 820, Fair Value Measurement, securities valued using the practical expedient are not classified in the fair value hierarchy. The fair value amounts presented in this table are intended to permit reconciliation of the fair value hierarchy to the amounts presented in the Statement of Assets and Liabilities.
Other Financial Instruments Total Level 1 Level 2 Level 3Asset Derivatives
Futures Contracts 338,585 338,585 – –Foreign Currency Forward Contracts 1,553,992 – 1,553,992 –
Total Asset Derivatives $1,892,577 $338,585 $1,553,992 $–Liability Derivatives
Futures Contracts 253,737 253,737 – –Foreign Currency Forward Contracts 1,412,117 – 1,412,117 –
Total Liability Derivatives $1,665,854 $253,737 $1,412,117 $–
There were no significant transfers between Levels during the period ended January 31, 2018. Transfers between Levels are identified as of the end of the period.

Partner WorldWide allocation Fund Schedule of Investments as of January 31, 2018
(unaudited)
The accompanying Notes to Schedule of Investments are an integral part of this schedule.15
The following table presents Partner Worldwide Allocation Fund's futures contracts held as of January 31, 2018. Investments and/or cash totaling $529,470 were pledged as the initial margin deposit for these contracts.
Futures Contracts Description
Number of Contracts
Long/(Short)Expiration
DateNotional Principal
Amount
Value and Unrealized
Appreciation/Depreciation
CBOT 2-Yr. U.S. Treasury Note 45 March 2018 $9,640,928 ($45,381)CBOT 5-Yr. U.S. Treasury Note 56 March 2018 6,483,915 ( 60,103)CBOT U.S. Long Bond 17 March 2018 2,604,665 ( 91,852)CME Ultra Long Term U.S. Treasury Bond 12 March 2018 1,997,273 ( 54,023)Eurex 2-Yr. Euro SCHATZ 2 March 2018 277,767 ( 130)Eurex Euro STOXX 50 Index 22 March 2018 978,664 5,469FTSE 100 Index 5 March 2018 527,635 2,820ICE mini MSCI EAFE Index 30 March 2018 3,063,035 155,215SFE S&P ASX Share Price Index 200 2 March 2018 242,455 ( 1,480)SGX MSCI Singapore Index 2 February 2018 62,217 ( 768)TSE Tokyo Price Index 4 March 2018 657,731 16,264Total Futures Long Contracts $26,536,285 ($73,969)CBOT 10-Yr. U.S. Treasury Note (28) March 2018 ($3,419,272) $15,084Eurex 10-Yr. Euro BUND (18) March 2018 ( 3,633,304) 86,895Eurex 30-Yr. Euro BUXL (1) March 2018 ( 207,198) 6,936Eurex 5-Yr. Euro BOBL (23) March 2018 ( 3,774,152) 49,902Total Futures Short Contracts ($11,033,926) $158,817Total Futures Contracts $15,502,359 $84,848

Partner WorldWide allocation Fund Schedule of Investments as of January 31, 2018
(unaudited)
The accompanying Notes to Schedule of Investments are an integral part of this schedule.16
Reference Description:ASX - Australian Securities ExchangeCBOT - Chicago Board of TradeCME - Chicago Mercantile ExchangeEAFE - Europe, Australasia and Far East FTSE - Financial Times Stock ExchangeICE - Intercontinental ExchangeMSCI - Morgan Stanley Capital InternationalS&P - Standard & Poor'sSFE - Sydney Futures ExchangeSGX - Singapore Stock ExchangeTSE - Tokyo Stock Exchange
The following table presents Partner Worldwide Allocation Fund's foreign currency forward contracts held as of January 31, 2018.
Foreign Currency Forward Contracts
Counter-party
Contracts to Deliver/ Receive Settlement Date
Value on Settlement
Date Value
Unrealized Appreciation/(Depreciation)
PurchasesArgentina Peso MSC 5,859,131 2/1/2018 $306,644 $298,402 ($8,242)Argentina Peso MSC 913,709 2/5/2018 48,881 46,429 ( 2,452)Argentina Peso MSC 1,263,309 2/15/2018 67,611 63,902 ( 3,709)Argentina Peso MSC 1,195,020 2/20/2018 64,128 60,309 ( 3,819)Argentina Peso MSC 2,177,063 2/21/2018 116,079 109,820 ( 6,259)Argentina Peso MSC 4,952,350 2/27/2018 266,799 249,130 ( 17,669)Argentina Peso MSC 2,159,760 2/28/2018 117,852 108,597 ( 9,255)Argentina Peso MSC 4,129,480 3/14/2018 224,245 206,233 ( 18,012)Argentina Peso MSC 2,489,760 3/15/2018 131,351 124,282 ( 7,069)Argentina Peso MSC 1,874,900 3/22/2018 99,980 93,268 ( 6,712)Argentina Peso MSC 4,398,612 3/27/2018 227,785 218,272 ( 9,513)Argentina Peso MSC 4,321,056 3/28/2018 214,179 214,318 139Argentina Peso MSC 6,885,047 4/4/2018 349,463 340,301 ( 9,162)Argentina Peso MSC 2,929,565 4/12/2018 143,924 144,215 291Argentina Peso MSC 913,709 5/2/2018 44,419 46,535 2,116Brazilian Real MSC 11,316,078 2/2/2018 3,479,848 3,551,815 71,967Brazilian Real MSC 861,606 3/2/2018 272,035 269,707 ( 2,328)Chilean Peso MSC 266,373,035 2/5/2018 439,146 441,895 2,749Chilean Peso MSC 82,024,983 2/8/2018 136,042 136,079 37Chilean Peso MSC 451,198,890 2/22/2018 738,024 748,650 10,626Chilean Peso MSC 183,394,584 4/20/2018 304,364 304,223 ( 141)Chinese Yuan MSC 4,395,763 2/5/2018 675,247 698,481 23,234Chinese Yuan MSC 4,395,762 3/30/2018 690,832 696,175 5,343Chinese Yuan Offshore HSBC 871,840 3/21/2018 135,990 138,089 2,099Chinese Yuan Offshore BNP 1,965,665 3/21/2018 295,509 311,337 15,828Colombian Peso MSC 426,998,130 2/5/2018 144,535 150,440 5,905Colombian Peso MSC 1,337,277,997 2/12/2018 462,995 471,073 8,078Colombian Peso MSC 426,998,130 4/20/2018 149,679 150,458 779Czech Republic Koruna MSC 60,976,591 3/21/2018 2,841,744 3,005,690 163,946Euro MSC 3,678,441 3/21/2018 4,481,349 4,580,949 99,600Hong Kong Dollar MSC 10,902,548 3/21/2018 1,396,255 1,395,368 ( 887)Hong Kong Dollar MSC 3,622,070 3/27/2018 464,017 463,645 ( 372)Hong Kong Dollar HSBC 3,597,481 3/27/2018 462,000 460,497 ( 1,503)Hungarian Forint MSC 787,692,987 3/21/2018 3,033,780 3,162,834 129,054Indian Rupee MSC 69,427,209 2/2/2018 1,068,584 1,091,558 22,974Indian Rupee MSC 8,643,503 2/9/2018 136,014 135,752 ( 262)Indian Rupee MSC 62,303,349 2/15/2018 960,236 977,819 17,583Indian Rupee MSC 97,902,257 2/26/2018 1,527,827 1,534,525 6,698Indian Rupee MSC 8,647,170 2/28/2018 135,962 135,504 ( 458)Indian Rupee MSC 62,049,393 4/5/2018 965,836 968,067 2,231Indian Rupee MSC 60,345,663 4/27/2018 940,550 938,560 ( 1,990)Indonesian Rupiah MSC 7,326,180,000 2/2/2018 543,100 547,200 4,100Indonesian Rupiah MSC 1,825,241,467 2/5/2018 135,033 136,287 1,254Indonesian Rupiah MSC 7,338,074,821 2/8/2018 545,971 547,824 1,853Indonesian Rupiah MSC 21,296,591,152 2/20/2018 1,572,764 1,588,725 15,961Indonesian Rupiah MSC 11,306,026,486 3/20/2018 839,879 841,824 1,945Indonesian Rupiah MSC 12,113,904,925 4/11/2018 897,677 900,511 2,834Indonesian Rupiah MSC 13,964,332,104 4/16/2018 1,041,511 1,037,661 ( 3,850)Japanese Yen DB 9,957,000 2/2/2018 91,549 91,206 ( 343)

Partner WorldWide allocation Fund Schedule of Investments as of January 31, 2018
(unaudited)
The accompanying Notes to Schedule of Investments are an integral part of this schedule.17
Foreign Currency Forward Contracts
Counter-party
Contracts to Deliver/ Receive Settlement Date
Value on Settlement
Date Value
Unrealized Appreciation/(Depreciation)
Purchases Mexican Peso MSC 51,413,866 3/21/2018 $2,685,348 $2,741,493 $56,145Mexican Peso MSC 7,490,860 3/28/2018 398,943 398,949 6New Taiwan Dollar MSC 23,467,291 2/2/2018 804,270 805,177 907New Taiwan Dollar MSC 4,638,903 2/5/2018 156,932 159,200 2,268New Taiwan Dollar MSC 31,550,581 2/8/2018 1,083,468 1,082,520 ( 948)New Taiwan Dollar MSC 12,021,261 2/9/2018 407,994 412,625 4,631New Taiwan Dollar MSC 18,278,475 2/21/2018 621,837 627,741 5,904New Taiwan Dollar MSC 7,871,106 2/27/2018 272,045 270,392 ( 1,653)New Taiwan Dollar MSC 4,962,174 3/8/2018 166,477 170,545 4,068New Taiwan Dollar MSC 9,411,903 4/17/2018 324,997 324,233 ( 764)Peruvian Nuevo Sol MSC 440,307 2/5/2018 136,065 136,897 832Peruvian Nuevo Sol MSC 3,564,183 2/8/2018 1,109,135 1,108,082 ( 1,053)Peruvian Nuevo Sol MSC 878,064 2/28/2018 272,763 272,951 188Philippines Peso MSC 3,404,537 2/20/2018 66,874 66,322 ( 552)Philippines Peso MSC 24,081,732 2/22/2018 476,138 469,095 ( 7,043)Philippines Peso MSC 8,049,522 3/22/2018 161,216 156,616 ( 4,600)Polish Zloty MSC 12,397,229 3/21/2018 3,511,597 3,709,209 197,612Russian Ruble MSC 201,707,559 2/12/2018 3,419,040 3,585,185 166,145Singapore Dollar MSC 1,705,095 3/21/2018 1,280,566 1,301,495 20,929South African Rand MSC 47,252,063 3/22/2018 3,650,824 3,962,306 311,482South Korean Won MSC 519,782,104 2/2/2018 485,193 486,756 1,563South Korean Won MSC 369,333,887 2/5/2018 346,851 345,945 ( 906)South Korean Won MSC 742,443,996 2/9/2018 696,635 695,553 ( 1,082)South Korean Won MSC 1,123,383,943 2/20/2018 1,051,594 1,052,959 1,365Thai Baht MSC 21,436,036 2/5/2018 666,177 684,537 18,360Thai Baht MSC 8,364,665 4/12/2018 266,875 267,639 764Turkish Lira MSC 8,623,432 3/21/2018 2,207,643 2,264,155 56,512Total Purchases $61,156,721 $62,493,018 $1,336,297
SalesArgentina Peso MSC 5,859,131 2/1/2018 $299,012 $298,402 $610Argentina Peso MSC 913,709 2/5/2018 46,499 46,535 ( 36)Argentina Peso MSC 1,613,718 3/15/2018 87,607 80,552 7,055Brazilian Real MSC 11,316,077 2/2/2018 3,472,191 3,551,812 ( 79,621)Brazilian Real MSC 2,178,944 3/2/2018 688,203 682,800 5,403Chilean Peso MSC 266,373,035 2/5/2018 439,531 441,879 ( 2,348)Chilean Peso MSC 408,898,440 2/22/2018 675,342 678,463 ( 3,121)Chinese Yuan MSC 4,395,762 2/5/2018 693,338 698,481 ( 5,143)Chinese Yuan MSC 2,240,983 2/22/2018 347,475 355,683 ( 8,208)Chinese Yuan MSC 1,076,507 2/28/2018 169,606 170,791 ( 1,185)Chinese Yuan Offshore SB 2,649,497 3/21/2018 407,023 419,648 ( 12,625)Chinese Yuan Offshore HSBC 897,615 3/21/2018 135,000 142,171 ( 7,171)Chinese Yuan Offshore ABG 863,794 3/21/2018 135,996 136,815 ( 819)Chinese Yuan Offshore JPM 1,761,639 3/21/2018 269,056 279,023 ( 9,967)Colombian Peso MSC 426,998,130 2/5/2018 150,404 150,458 ( 54)Colombian Peso MSC 783,144,654 2/12/2018 272,958 275,872 ( 2,914)Czech Republic Koruna MSC 27,009,613 3/21/2018 1,304,628 1,331,373 ( 26,745)Euro MSC 8,400,960 3/21/2018 10,021,844 10,462,146 ( 440,302)Euro MSC 5,592,071 3/23/2018 6,952,985 6,965,143 ( 12,158)Hong Kong Dollar SB 2,112,537 3/27/2018 273,168 270,416 2,752Hong Kong Dollar CITI 6,576,465 3/27/2018 850,279 841,824 8,455Hong Kong Dollar MSC 5,216,891 3/27/2018 670,784 667,791 2,993Hong Kong Dollar DB 854,343 3/27/2018 109,981 109,361 620Hong Kong Dollar HSBC 3,315,718 3/27/2018 428,340 424,430 3,910Hong Kong Dollar SB 4,020,260 5/11/2018 519,000 515,148 3,852Hong Kong Dollar HSBC 5,236,742 9/19/2018 675,000 672,209 2,791Hungarian Forint MSC 365,910,977 3/21/2018 1,434,235 1,469,247 ( 35,012)Indian Rupee MSC 69,427,208 2/2/2018 1,089,351 1,091,558 ( 2,207)Indian Rupee MSC 17,297,775 2/9/2018 271,981 271,672 309Indian Rupee MSC 28,876,323 2/15/2018 451,232 453,199 ( 1,967)Indian Rupee MSC 56,972,796 2/26/2018 891,986 892,994 ( 1,008)Indian Rupee MSC 16,962,608 2/28/2018 265,792 265,810 ( 18)Indonesian Rupiah MSC 7,326,180,000 2/2/2018 548,997 547,200 1,797Indonesian Rupiah MSC 1,825,241,467 2/5/2018 137,185 136,287 898Indonesian Rupiah MSC 7,338,074,821 2/8/2018 547,577 547,824 ( 247)
Partner WorldWide allocation Fund Schedule of Investments as of January 31, 2018
(unaudited)
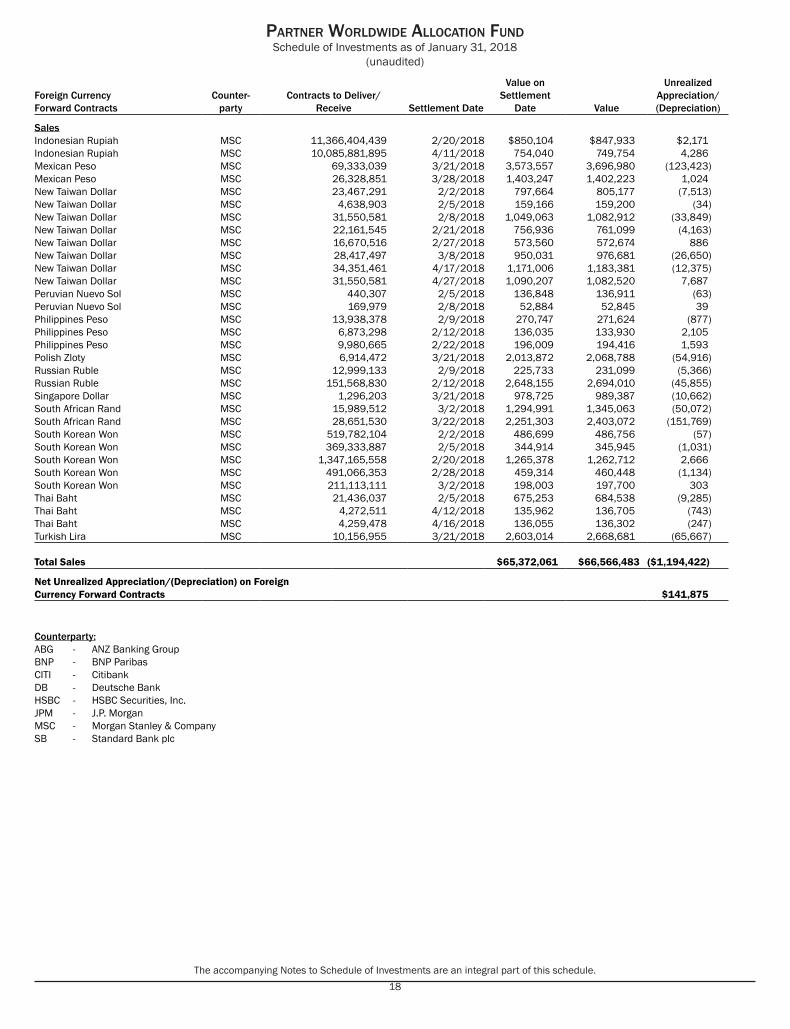
The accompanying Notes to Schedule of Investments are an integral part of this schedule.18
Foreign Currency Forward Contracts
Counter-party
Contracts to Deliver/ Receive Settlement Date
Value on Settlement
Date Value
Unrealized Appreciation/(Depreciation)
Sales Indonesian Rupiah MSC 11,366,404,439 2/20/2018 $850,104 $847,933 $2,171Indonesian Rupiah MSC 10,085,881,895 4/11/2018 754,040 749,754 4,286Mexican Peso MSC 69,333,039 3/21/2018 3,573,557 3,696,980 ( 123,423)Mexican Peso MSC 26,328,851 3/28/2018 1,403,247 1,402,223 1,024New Taiwan Dollar MSC 23,467,291 2/2/2018 797,664 805,177 ( 7,513)New Taiwan Dollar MSC 4,638,903 2/5/2018 159,166 159,200 ( 34)New Taiwan Dollar MSC 31,550,581 2/8/2018 1,049,063 1,082,912 ( 33,849)New Taiwan Dollar MSC 22,161,545 2/21/2018 756,936 761,099 ( 4,163)New Taiwan Dollar MSC 16,670,516 2/27/2018 573,560 572,674 886New Taiwan Dollar MSC 28,417,497 3/8/2018 950,031 976,681 ( 26,650)New Taiwan Dollar MSC 34,351,461 4/17/2018 1,171,006 1,183,381 ( 12,375)New Taiwan Dollar MSC 31,550,581 4/27/2018 1,090,207 1,082,520 7,687Peruvian Nuevo Sol MSC 440,307 2/5/2018 136,848 136,911 ( 63)Peruvian Nuevo Sol MSC 169,979 2/8/2018 52,884 52,845 39Philippines Peso MSC 13,938,378 2/9/2018 270,747 271,624 ( 877)Philippines Peso MSC 6,873,298 2/12/2018 136,035 133,930 2,105Philippines Peso MSC 9,980,665 2/22/2018 196,009 194,416 1,593Polish Zloty MSC 6,914,472 3/21/2018 2,013,872 2,068,788 ( 54,916)Russian Ruble MSC 12,999,133 2/9/2018 225,733 231,099 ( 5,366)Russian Ruble MSC 151,568,830 2/12/2018 2,648,155 2,694,010 ( 45,855)Singapore Dollar MSC 1,296,203 3/21/2018 978,725 989,387 ( 10,662)South African Rand MSC 15,989,512 3/2/2018 1,294,991 1,345,063 ( 50,072)South African Rand MSC 28,651,530 3/22/2018 2,251,303 2,403,072 ( 151,769)South Korean Won MSC 519,782,104 2/2/2018 486,699 486,756 ( 57)South Korean Won MSC 369,333,887 2/5/2018 344,914 345,945 ( 1,031)South Korean Won MSC 1,347,165,558 2/20/2018 1,265,378 1,262,712 2,666South Korean Won MSC 491,066,353 2/28/2018 459,314 460,448 ( 1,134)South Korean Won MSC 211,113,111 3/2/2018 198,003 197,700 303Thai Baht MSC 21,436,037 2/5/2018 675,253 684,538 ( 9,285)Thai Baht MSC 4,272,511 4/12/2018 135,962 136,705 ( 743)Thai Baht MSC 4,259,478 4/16/2018 136,055 136,302 ( 247)Turkish Lira MSC 10,156,955 3/21/2018 2,603,014 2,668,681 ( 65,667)
Total Sales $65,372,061 $66,566,483 ($1,194,422)
Net Unrealized Appreciation/(Depreciation) on Foreign Currency Forward Contracts $141,875
Counterparty:ABG - ANZ Banking GroupBNP - BNP ParibasCITI - CitibankDB - Deutsche BankHSBC - HSBC Securities, Inc.JPM - J.P. MorganMSC - Morgan Stanley & CompanySB - Standard Bank plc

Partner WorldWide allocation Fund Schedule of Investments as of January 31, 2018
(unaudited)
The accompanying Notes to Schedule of Investments are an integral part of this schedule.19
Investment in Affiliates Affiliated issuers, as defined under the Investment Company Act of 1940, include those in which the Fund's holdings of an issuer represent 5% or more of the outstanding voting securities of an issuer, any affiliated mutual fund, or a company which is under common ownership or control with the Fund. The Fund owns shares of Thrivent Cash Management Trust for the purpose of securities lending and Thrivent Core Short-Term Reserve Fund primarily to serve as a cash sweep vehicle for the Fund. Thrivent Cash Management Trust and Thrivent Core Funds are established solely for investment by Thrivent entities.
A summary of transactions (in thousands) for the fiscal year to date, in Partner Worldwide Allocation Fund, is as follows:
FundValue
10/31/2017Gross
PurchasesGross Sales
Net Realized Gain/(Loss)
Change in Unrealized
Appreciation/(Depreciation)
Shares Held at 1/31/2018
Value 1/31/2018
Income Earned 11/1/2017
- 1/31/2018Cash Management Trust- Collateral Investment $— $1,734 $111 $– $– 1,623 $1,623 $1
Core Short-Term Reserve 11,779 43,125 44,505 – – 1,040 10,399 43Total Value and Income Earned $11,779 $– $– $12,022 $44
Notes to schedule of INvestmeNtsas of January 31, 2018
(unaudited)
20
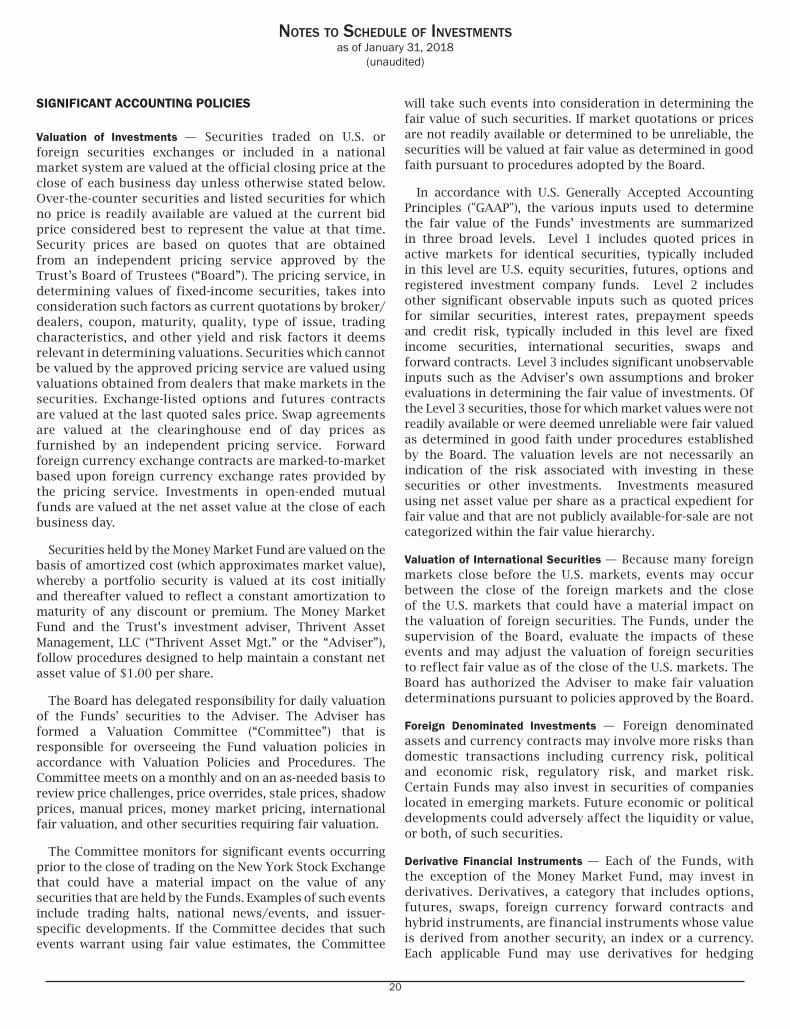
SIGNIFICANT ACCOUNTING POLICIES
Valuation of Investments — Securities traded on U.S. or foreign securities exchanges or included in a national market system are valued at the official closing price at the close of each business day unless otherwise stated below. Over-the-counter securities and listed securities for which no price is readily available are valued at the current bid price considered best to represent the value at that time. Security prices are based on quotes that are obtained from an independent pricing service approved by the Trust’s Board of Trustees (“Board”). The pricing service, in determining values of fixed-income securities, takes into consideration such factors as current quotations by broker/dealers, coupon, maturity, quality, type of issue, trading characteristics, and other yield and risk factors it deems relevant in determining valuations. Securities which cannot be valued by the approved pricing service are valued using valuations obtained from dealers that make markets in the securities. Exchange-listed options and futures contracts are valued at the last quoted sales price. Swap agreements are valued at the clearinghouse end of day prices as furnished by an independent pricing service. Forward foreign currency exchange contracts are marked-to-market based upon foreign currency exchange rates provided by the pricing service. Investments in open-ended mutual funds are valued at the net asset value at the close of each business day.
Securities held by the Money Market Fund are valued on the basis of amortized cost (which approximates market value), whereby a portfolio security is valued at its cost initially and thereafter valued to reflect a constant amortization to maturity of any discount or premium. The Money Market Fund and the Trust’s investment adviser, Thrivent Asset Management, LLC (“Thrivent Asset Mgt.” or the “Adviser”), follow procedures designed to help maintain a constant net asset value of $1.00 per share.
The Board has delegated responsibility for daily valuation of the Funds' securities to the Adviser. The Adviser has formed a Valuation Committee (“Committee”) that is responsible for overseeing the Fund valuation policies in accordance with Valuation Policies and Procedures. The Committee meets on a monthly and on an as-needed basis to review price challenges, price overrides, stale prices, shadow prices, manual prices, money market pricing, international fair valuation, and other securities requiring fair valuation.
The Committee monitors for significant events occurring prior to the close of trading on the New York Stock Exchange that could have a material impact on the value of any securities that are held by the Funds. Examples of such events include trading halts, national news/events, and issuer-specific developments. If the Committee decides that such events warrant using fair value estimates, the Committee
will take such events into consideration in determining the fair value of such securities. If market quotations or prices are not readily available or determined to be unreliable, the securities will be valued at fair value as determined in good faith pursuant to procedures adopted by the Board.
In accordance with U.S. Generally Accepted Accounting Principles ("GAAP"), the various inputs used to determine the fair value of the Funds’ investments are summarized in three broad levels. Level 1 includes quoted prices in active markets for identical securities, typically included in this level are U.S. equity securities, futures, options and registered investment company funds. Level 2 includes other significant observable inputs such as quoted prices for similar securities, interest rates, prepayment speeds and credit risk, typically included in this level are fixed income securities, international securities, swaps and forward contracts. Level 3 includes significant unobservable inputs such as the Adviser’s own assumptions and broker evaluations in determining the fair value of investments. Of the Level 3 securities, those for which market values were not readily available or were deemed unreliable were fair valued as determined in good faith under procedures established by the Board. The valuation levels are not necessarily an indication of the risk associated with investing in these securities or other investments. Investments measured using net asset value per share as a practical expedient for fair value and that are not publicly available-for-sale are not categorized within the fair value hierarchy.
Valuation of International Securities — Because many foreign markets close before the U.S. markets, events may occur between the close of the foreign markets and the close of the U.S. markets that could have a material impact on the valuation of foreign securities. The Funds, under the supervision of the Board, evaluate the impacts of these events and may adjust the valuation of foreign securities to reflect fair value as of the close of the U.S. markets. The Board has authorized the Adviser to make fair valuation determinations pursuant to policies approved by the Board.
Foreign Denominated Investments — Foreign denominated assets and currency contracts may involve more risks than domestic transactions including currency risk, political and economic risk, regulatory risk, and market risk. Certain Funds may also invest in securities of companies located in emerging markets. Future economic or political developments could adversely affect the liquidity or value, or both, of such securities.
Derivative Financial Instruments — Each of the Funds, with the exception of the Money Market Fund, may invest in derivatives. Derivatives, a category that includes options, futures, swaps, foreign currency forward contracts and hybrid instruments, are financial instruments whose value is derived from another security, an index or a currency. Each applicable Fund may use derivatives for hedging

Notes to schedule of INvestmeNtsas of January 31, 2018
(unaudited)
21
(attempting to offset a potential loss in one position by establishing an interest in an opposite position). This includes the use of currency-based derivatives to manage the risk of its positions in foreign securities. Each applicable Fund may also use derivatives for replication of a certain asset class or speculation (investing for potential income or capital gain). These contracts may be transacted on an exchange or over-the-counter (OTC).
A derivative may incur a mark to market loss if the value of the derivative decreases due to an unfavorable change in the market rates or values of the underlying derivative. Losses can also occur if the counterparty does not perform under the derivative. A Fund’s risk of loss from the counterparty credit risk on OTC derivatives is generally limited to the aggregate unrealized gain netted against any collateral held by such Fund. With exchange traded futures and centrally cleared swaps, there is minimal counterparty credit risk to the Funds because the exchange’s clearinghouse, as counterparty to such derivatives, guarantees against a possible default. The clearinghouse stands between the buyer and the seller of the derivative; thus, the credit risk is limited to the failure of the clearinghouse. However, credit risk still exists in exchange traded futures and centrally cleared swaps with respect to initial and variation margin that is held in a broker’s customer accounts. While brokers are required to segregate customer margin from their own assets, in the event that a broker becomes insolvent or goes into bankruptcy and at that time there is a shortfall in the aggregate amount of margin held by the broker for all its clients, U.S. bankruptcy laws will typically allocate that shortfall on a pro-rata basis across all the broker’s customers, potentially resulting in losses to the Funds. Using derivatives to hedge can guard against potential risks, but it also adds to the Funds' expenses and can eliminate some opportunities for gains. In addition, a derivative used for mitigating exposure or replication may not accurately track the value of the underlying asset. Another risk with derivatives is that some types can amplify a gain or loss, potentially earning or losing substantially more money than the actual cost of the derivative.
In order to define their contractual rights and to secure rights that will help the Funds mitigate their counterparty risk, the Funds may enter into an International Swaps and Derivatives Association, Inc. Master Agreement (“ISDA Master Agreement”) or similar agreement with its derivative contract counterparties. An ISDA Master Agreement is a bilateral agreement between a Fund and a counterparty that governs OTC derivatives and foreign exchange contracts and typically includes, among other things, collateral posting terms and netting provisions in the event of a default and/or termination event. Under an ISDA Master Agreement, each Fund may, under certain circumstances, offset with the counterparty certain derivatives' payables and/or receivables with collateral held and/or posted and create
one single net payment. The provisions of the ISDA Master Agreement typically permit a single net payment in the event of a default (close-out netting) including the bankruptcy or insolvency of the counterparty. Note, however, that bankruptcy and insolvency laws of a particular jurisdiction may impose restrictions on or prohibitions against the right of offset in bankruptcy, insolvency or other events.
Collateral and margin requirements vary by type of derivative. Margin requirements are established by the broker or clearinghouse for exchange traded and centrally cleared derivatives (futures, options, and centrally cleared swaps). Brokers can ask for margining in excess of the minimum in certain situations. Collateral terms are contract specific for OTC derivatives (foreign currency exchange contracts, options, swaps). For derivatives traded under an ISDA Master Agreement, the collateral requirements are typically calculated by netting the mark to market amount for each transaction under such agreement and comparing that amount to the value of any collateral currently pledged by the Fund and the counterparty. For financial reporting purposes, non-cash collateral that has been pledged to cover obligations of the Fund has been noted in the Schedule of Investments. To the extent amounts due to the Fund from its counterparties are not fully collateralized, contractually or otherwise, the Fund bears the risk of loss from counterparty nonperformance. The Funds attempt to mitigate counterparty risk by only entering into agreements with counterparties that they believe have the financial resources to honor their obligations and by monitoring the financial stability of those counterparties.
Options — All Funds, with the exception of the Money Market Fund, may buy put and call options and write put and covered call options. The Funds intend to use such derivative instruments as hedges to facilitate buying or selling securities or to provide protection against adverse movements in security prices or interest rates. The Funds may also enter into options contracts to protect against adverse foreign exchange rate fluctuations. Option contracts are valued daily and unrealized appreciation or depreciation is recorded. A Fund will realize a gain or loss upon expiration or closing of the option transaction. When an option is exercised, the proceeds upon sale for a written call option or the cost of a security for purchased put and call options is adjusted by the amount of premium received or paid.
Buying put options tends to decrease a Fund’s exposure to the underlying security while buying call options tends to increase a Fund’s exposure to the underlying security. The risk associated with purchasing put and call options is limited to the premium paid. There is no significant counterparty risk on exchange-traded options as the exchange guarantees the contract against default. Writing put options tends to increase a Fund’s exposure to the underlying security while writing call options tends to decrease a Fund’s exposure to

Notes to schedule of INvestmeNtsas of January 31, 2018
(unaudited)
22
the underlying security. The writer of an option has no control over whether the underlying security may be bought or sold, and therefore bears the market risk of an unfavorable change in the price of the underlying security. The counterparty risk for purchased options arises when a Fund has purchased an option, exercises that option, and the counterparty doesn’t buy from the Fund or sell to the Fund the underlying asset as required. In the case where a Fund has written an option, the Fund doesn’t have counterparty risk. Counterparty risk on purchased over-the-counter options is partially mitigated by the Fund’s collateral posting requirements. As the option increases in value to the Fund, the Fund receives collateral from the counterparty. Risks of loss may exceed amounts recognized on the Statement of Assets and Liabilities.
During the three months ended January 31, 2018, Balanced Income Plus Fund and Opportunity Income Plus Fund used treasury options to manage the duration of the Fund versus the benchmark. Options on mortgage backed securities were used to generate income.
Futures Contracts — All Funds, with the exception of the Money Market Fund, may use futures contracts to manage the exposure to interest rate and market or currency fluctuations. Gains or losses on futures contracts can offset changes in the yield of securities. When a futures contract is opened, cash or other investments equal to the required “initial margin deposit” are held on deposit with and pledged to the broker. Additional securities held by the Funds may be earmarked to cover open futures contracts. The futures contract’s daily change in value (“variation margin”) is either paid to or received from the broker, and is recorded as an unrealized gain or loss. When the contract is closed, realized gain or loss is recorded equal to the difference between the value of the contract when opened and the value of the contract when closed. Futures contracts involve, to varying degrees, risk of loss in excess of the variation margin disclosed in the Statement of Assets and Liabilities. Exchange-traded futures have no significant counterparty risk as the exchange guarantees the contracts against default.
During the three months ended January 31, 2018, Aggressive Allocation Fund, Balanced Income Plus Fund, Government Bond Fund, Income Fund, Limited Maturity Bond Fund, Moderate Allocation Fund, Moderately Aggressive Allocation Fund, Moderately Conservative Allocation Fund, Opportunity Income Plus Fund and Partner Worldwide Allocation Fund used treasury futures to manage the duration and yield curve exposure of the Fund versus the benchmark.
During the three months ended January 31, 2018, Aggressive Allocation Fund, Balanced Income Plus Fund, Large Cap Stock Fund, Low Volatility Equity Fund, Moderate Allocation Fund, Moderately Aggressive Allocation Fund, Moderately Conservative Allocation Fund, Opportunity
Income Plus Fund and Partner Worldwide Allocation Fund used equity futures to manage exposure to the equities markets.
Foreign Currency Forward Contracts — In connection with purchases and sales of securities denominated in foreign currencies, all Funds, with the exception of the Money Market Fund, may enter into foreign currency forward contracts. Additionally, the Funds may enter into such contracts to mitigate currency and counterparty exposure to other foreign-currency-denominated investments. These contracts are recorded at value and the related realized and change in unrealized foreign exchange gains and losses are included in the Statement of Operations. In the event that counterparties fail to settle these forward contracts, the Funds could be exposed to foreign currency fluctuations. Foreign currency contracts are valued daily and unrealized appreciation or depreciation is recorded daily as the difference between the contract exchange rate and the closing forward rate applied to the face amount of the contract. A realized gain or loss is recorded at the time a forward contract is closed. These contracts are over-the-counter and the Fund is exposed to counterparty risk equal to the discounted net amount of payments to the Fund.
During the three months ended January 31, 2018, Partner Worldwide Allocation Fund used foreign currency forward contracts in order to gain active currency exposure and to hedge unwanted currency exposure.
Swap Agreements — All Funds, with the exception of the Money Market Fund, may enter into swap transactions, which involve swapping one or more investment characteristics of a security or a basket of securities with another party. Such transactions include market risk, risk of default by the other party to the transaction, risk of imperfect correlation and manager risk and may involve commissions or other costs. Swap transactions generally do not involve delivery of securities, other underlying assets or principal. Accordingly, the risk of loss with respect to swap transactions is generally limited to the net amount of payments that the Fund is contractually obligated to make, or in the case of the counterparty defaulting, the net amount of payments that the Fund is contractually entitled to receive. Risks of loss may exceed amounts recognized on the Statement of Assets and Liabilities. If there is a default by the counterparty, the Fund may have contractual remedies pursuant to the agreements related to the transaction. The contracts are valued daily and unrealized appreciation or depreciation is recorded. Swap agreements are valued at the clearinghouse end of day prices as furnished by an independent pricing service. The pricing service takes into account such factors as swap curves, default probabilities, recent trades, recovery rates and other factors it deems relevant in determining valuations. Daily fluctuations in the value of the centrally cleared credit default contracts are recorded in variation margin in the Statement of Assets

Notes to schedule of INvestmeNtsas of January 31, 2018
(unaudited)
23
and Liabilities and recorded as unrealized gain or loss. The Fund accrues for the periodic payment and amortizes upfront payments, if any, on swap agreements on a daily basis with the net amount recorded as realized gains or losses in the Statement of Operations. Receipts and payments received or made as a result of a credit event or termination of the contract are also recognized as realized gains or losses in the Statement of Operations. Collateral, in the form of cash or securities, may be required to be held with the Fund’s custodian, or a third party, in connection with these agreements. Certain swap agreements are over-the-counter and the Fund is exposed to counterparty risk, which is the discounted net amount of payments owed to the Fund. This risk is partially mitigated by the Fund’s collateral posting requirements. As the swap increases in value to the Fund, the Fund receives collateral from the counterparty. Certain interest rate and credit default index swaps must be cleared through a clearinghouse or central counterparty.
Credit Default Swaps — A credit default swap is a swap agreement between two parties to exchange the credit risk of a particular issuer, basket of securities or reference entity. In a credit default swap transaction, a buyer pays periodic fees in return for payment by the seller which is contingent upon an adverse credit event occurring in the underlying issuer or reference entity. The seller collects periodic fees from the buyer and profits if the credit of the underlying issuer or reference entity remains stable or improves while the swap is outstanding, but the seller in a credit default swap contract would be required to pay the amount of credit loss, determined as specified in the agreement, to the buyer in the event of an adverse credit event in the reference entity. A buyer of a credit default swap is said to buy protection whereas a seller of a credit default swap is said to sell protection. The Funds may be either the protection seller or the protection buyer.
Certain Funds enter into credit default derivative contracts directly through credit default swaps (CDS) or through credit default swap indices (CDX Indices). CDX indices are static pools of equally weighted credit default swaps referencing corporate bonds and/or loans designed to provide diversified credit exposure to these asset classes. Funds sell default protection and assume long-risk positions in individual credits or indices. Index positions are entered into to gain exposure to the corporate bond and/or loan markets in a cost-efficient and diversified structure. In the event that a position defaults, by going into bankruptcy and failing to pay interest or principal on borrowed money, within any given CDX Index held, the maximum potential amount of future payments required would be equal to the pro-rata share of that position within the index based on the notional amount of the index. In the event of a default under a CDS contract the maximum potential amount of future payments would be the notional amount. For CDS, the default events
could be bankruptcy and failing to pay interest or principal on borrowed money or a restructuring. A restructuring is a change in the underlying obligations which would include reduction in interest or principal, maturity extension and subordination to other obligations.
During the three months ended January 31, 2018, High Yield Fund used CDX indexes (comprised of credit default swaps) to help manage credit risk exposures within the fund.
For financial reporting purposes, the Funds do not offset derivative assets and derivative liabilities that are subject to netting arrangements in the Statement of Assets and Liabilities.
Additional information for the Funds’ policy regarding valuation of investments and other significant accounting policies can be obtained by referring to the Funds’ most recent annual or semiannual shareholder report.