Particle-Size-Grouping Model of Precipitation Kinetics …ccc.illinois.edu/s/Reports12/XU-K...
18
Particle-Size-Grouping Model of Precipitation Kinetics in Microalloyed Steels KUN XU and BRIAN G. THOMAS The formation, growth, and size distribution of precipitates greatly affects the microstructure and properties of microalloyed steels. Computational particle-size-grouping (PSG) kinetic models based on population balances are developed to simulate precipitate particle growth resulting from collision and diffusion mechanisms. First, the generalized PSG method for col- lision is explained clearly and verified. Then, a new PSG method is proposed to model diffusion- controlled precipitate nucleation, growth, and coarsening with complete mass conservation and no fitting parameters. Compared with the original population-balance models, this PSG method saves significant computation and preserves enough accuracy to model a realistic range of particle sizes. Finally, the new PSG method is combined with an equilibrium phase fraction model for plain carbon steels and is applied to simulate the precipitated fraction of aluminum nitride and the size distribution of niobium carbide during isothermal aging processes. Good matches are found with experimental measurements, suggesting that the new PSG method offers a promising framework for the future development of realistic models of precipitation. DOI: 10.1007/s11661-011-0938-y Ó The Minerals, Metals & Materials Society and ASM International 2011 I. INTRODUCTION THE demand for steels with higher strength, ductil- ity, and toughness is always increasing. Many alloying additions act to improve these properties through the formation of precipitate particles. In addition to pre- cipitation strengthening, precipitates often act by pin- ning grain boundaries and inhibiting grain growth. These effects depend on both the volume fraction and size distribution of the precipitates. [1–4] Many small particles are more effective than a few large particles. An unfortunate side effect is a decrease in high-temperature ductility and possible crack formation during processes such as casting and hot rolling, caused by the growth of voids around precipitate particles on the weak grain boundaries. It is, therefore, important to control the spatial distribution, morphological characteristics, and size distribution of precipitates during all stages of steel processing. These parameters are generally determined by the alloy composition, and temperature history. In high-deformation processes such as rolling, they also depend strongly on strain and strain rate. The accurate modeling of precipitate growth includes at least two analysis steps: (1) supersaturation, based on equilibrium precipitation thermodynamics and (2) kinetic effects. Many models to predict equilibrium precipitation are available in commercial packages based on minimizing Gibbs free energy, including Thermo- Calc (Thermo-Calc Software, Stockholm, Sweden), [5,6] FactSage (Center for Research in Computational Thermochemistry, Montreal, Canada), [7] ChemSage (GTT-Technologies, Aachen, Germany), [8] JMatPro (Sente Software, Guildford, United Kingdom), [9] other CALPHAD models, [10,11] and other thermodynamic models based on solubility products in previous litera- ture. [12–16] A recent equilibrium model predicts the stable formation of typical oxides, sulfides, nitrides and car- bides in microalloyed steels efficiently by solving the fully coupled nonlinear system of solubility-product equa- tions. [17] The model has been validated with analytical solutions of simple cases, results of a commercial package, and previous experimental results. A useful equilibrium model must predict accurately the occur- rence and stability of precipitates, their equilibrium amounts, and compositions for different steel composi- tions, phases, and temperatures to calculate the super- saturation/driving force for a kinetic model. Theoretically, precipitates start to form when the solubility limit is exceeded, but reaching equilibrium usually takes a long time. For most steel processes, especially at lower temperatures, equilibrium is seldom approached due to limited time. Thus, kinetic models of precipitate growth are a practical necessity for realistic predictions. An early effort to predict phase transformation kinetics is the KJMA model, by Kolmogorov, [18] John- son and Mehl, [19] and Avrami, [20] which is used widely to study precipitation processes and to generate time- temperature-transformation diagrams. The general isothermal KJMA equation to describe transformed fraction f as a function of time t is given by [21] fðtÞ¼ 1 expðK t n Þ ½1 where K is the rate function for nucleation and growth that depends on chemical composition and temperature and n is the Avrami exponent, typically ranging from KUN XU, Graduate Student, and BRIAN G. THOMAS, C.J. Gauthier Professor, are with the Mechanical Science and Engineering Department, University of Illinois at Urbana-Champaign, Urbana, IL 61801. Contact e-mail: [email protected] Manuscript submitted October 10, 2010. Article published online October 19, 2011 METALLURGICAL AND MATERIALS TRANSACTIONS A VOLUME 43A, MARCH 2012—1079
Transcript of Particle-Size-Grouping Model of Precipitation Kinetics …ccc.illinois.edu/s/Reports12/XU-K...
Particle-Size-Grouping Model of Precipitation Kinetics inMicroalloyed Steels
KUN XU and BRIAN G. THOMAS
The formation, growth, and size distribution of precipitates greatly affects the microstructureand properties of microalloyed steels. Computational particle-size-grouping (PSG) kineticmodels based on population balances are developed to simulate precipitate particle growthresulting from collision and diffusion mechanisms. First, the generalized PSG method for col-lision is explained clearly and verified. Then, a new PSG method is proposed to model diffusion-controlled precipitate nucleation, growth, and coarsening with complete mass conservation andno fitting parameters. Compared with the original population-balance models, this PSG methodsaves significant computation and preserves enough accuracy to model a realistic range ofparticle sizes. Finally, the new PSG method is combined with an equilibrium phase fractionmodel for plain carbon steels and is applied to simulate the precipitated fraction of aluminumnitride and the size distribution of niobium carbide during isothermal aging processes. Goodmatches are found with experimental measurements, suggesting that the new PSG method offersa promising framework for the future development of realistic models of precipitation.
DOI: 10.1007/s11661-011-0938-y� The Minerals, Metals & Materials Society and ASM International 2011
I. INTRODUCTION
THE demand for steels with higher strength, ductil-ity, and toughness is always increasing. Many alloyingadditions act to improve these properties through theformation of precipitate particles. In addition to pre-cipitation strengthening, precipitates often act by pin-ning grain boundaries and inhibiting grain growth.These effects depend on both the volume fraction andsize distribution of the precipitates.[1–4] Many smallparticles are more effective than a few large particles. Anunfortunate side effect is a decrease in high-temperatureductility and possible crack formation during processessuch as casting and hot rolling, caused by the growth ofvoids around precipitate particles on the weak grainboundaries. It is, therefore, important to control thespatial distribution, morphological characteristics, andsize distribution of precipitates during all stages of steelprocessing. These parameters are generally determinedby the alloy composition, and temperature history. Inhigh-deformation processes such as rolling, they alsodepend strongly on strain and strain rate.
The accurate modeling of precipitate growth includesat least two analysis steps: (1) supersaturation, based onequilibrium precipitation thermodynamics and (2)kinetic effects. Many models to predict equilibriumprecipitation are available in commercial packages basedon minimizing Gibbs free energy, including Thermo-Calc (Thermo-Calc Software, Stockholm, Sweden),[5,6]
FactSage (Center for Research in Computational
Thermochemistry, Montreal, Canada),[7] ChemSage(GTT-Technologies, Aachen, Germany),[8] JMatPro(Sente Software, Guildford, United Kingdom),[9] otherCALPHAD models,[10,11] and other thermodynamicmodels based on solubility products in previous litera-ture.[12–16] A recent equilibrium model predicts the stableformation of typical oxides, sulfides, nitrides and car-bides in microalloyed steels efficiently by solving the fullycoupled nonlinear system of solubility-product equa-tions.[17] The model has been validated with analyticalsolutions of simple cases, results of a commercialpackage, and previous experimental results. A usefulequilibrium model must predict accurately the occur-rence and stability of precipitates, their equilibriumamounts, and compositions for different steel composi-tions, phases, and temperatures to calculate the super-saturation/driving force for a kinetic model.Theoretically, precipitates start to form when the
solubility limit is exceeded, but reaching equilibriumusually takes a long time. For most steel processes,especially at lower temperatures, equilibrium is seldomapproached due to limited time. Thus, kinetic models ofprecipitate growth are a practical necessity for realisticpredictions.An early effort to predict phase transformation
kinetics is the KJMA model, by Kolmogorov,[18] John-son and Mehl,[19] and Avrami,[20] which is used widely tostudy precipitation processes and to generate time-temperature-transformation diagrams. The generalisothermal KJMA equation to describe transformedfraction f as a function of time t is given by[21]
fðtÞ ¼ 1� expð�K � tnÞ ½1�
where K is the rate function for nucleation and growththat depends on chemical composition and temperatureand n is the Avrami exponent, typically ranging from
KUN XU, Graduate Student, and BRIAN G. THOMAS, C.J.Gauthier Professor, are with the Mechanical Science and EngineeringDepartment, University of Illinois at Urbana-Champaign, Urbana, IL61801. Contact e-mail: [email protected]
Manuscript submitted October 10, 2010.Article published online October 19, 2011
METALLURGICAL AND MATERIALS TRANSACTIONS A VOLUME 43A, MARCH 2012—1079
1 to 4, which depends on growth dimensionality (onedimensional, two dimensional, and three dimensional),nucleation index (zero, decreasing, constant, or increas-ing nucleation rate), and growth index (interface-con-trolled or diffusion-controlled). The parameters K and nare determined from experimental measurements atdifferent test temperatures and compositions, and oftenthey vary during precipitation. Although this model canmatch many precipitated fraction measurements,[22,23]
its empirical nature prevents it from describing alternatethermomechanical processes without refitting theparameters with further measurements. Moreover, sizedistributions are not predicted with this model.
Precipitates can form at many different stages andlocations during metal refining, casting, and thermalprocessing, including in the liquid metal because ofcollision, the mushy-zone between dendrites because ofrapid diffusion during solidification, and on the grainboundaries or inside the grains because of slow solid-state diffusion. This process results in different compo-sitions, shapes, and size distributions of precipitates,which greatly influence product quality. Precipitateparticles grow via two major mechanisms: (1) collisionin the liquid and (2) diffusion in both liquid and solid.Both mechanisms have been studied extensively, andbetter computational models are now available with fastimproved computer power in recent decades.
Collisions between particles and rapid diffusion in theliquid phase increase the number of large particles andenhance inclusion removal by flotation. The evolution ofparticle concentration and size distribution because ofcollisions has been modeled using the collision frequencybetween particles per unit volume of liquid medium,[24]
and such models have been applied successfully forvarious collision mechanisms, including turbulent colli-sion,[25] Stokes collision,[26] Brownian collision,[27] andgradient collision.[28]
The entire diffusion-controlled precipitation processin the solid is separated classically into three stages:nucleation, growth, and coarsening. The nucleationstage includes an induction period to form stable nuclei.It is based on the critical embryo size needed for thevolume-energy decrease to exceed the surface-energyincrease and a time-dependent Arrhenius relation todescribe the nucleation rate.[29] Such a classic model ofsteady-state nucleation has been applied successfully topredict the start times of strain-induced Ti(C,N) precip-itation in austenite,[30] as measured via stress relaxationexperiments.[31]
After nucleation, particles of all sizes can growbecause of the high supersaturation that defines thegrowth stage. After the nucleation and growth stages,precipitates of various sizes are dispersed in the matrixphase. Once the supersaturation has decreased toequilibrium, the solute concentrations in the matrixand at the particle/matrix interface are comparable andcapillary effects become dominant, causing coarseningor Ostwald ripening.[32] Governed by the minimizationof the total surface energy, coarsening is driven by thedifference in concentration gradients near precipi-tate particles of different sizes. The larger particlesare surrounded by low concentration; they grow by
diffusion from thehigh concentration surrounding smallerparticles, which are less stable and shrink. Thus, the netnumber density of all particles now decreases with time.Each of these three stages is dominated by different
mechanisms, and particle size evolution follows differentlaws. Coarsening increases with time according to themean particle size cubed,[33,34] according to LSW theory,which is slower than the square relation during thegrowth stage.[35] More discussion is given elsewhere onclassic nucleation,[36] growth,[37] and coarsening[38] phe-nomena.Growth and coarsening are often treated as one
continuous and competing process, assuming a Gibbs-Thomson exponential relation for interface concentra-tion with particle size.[39] Together with a classicnucleation model, these models describe the volumefraction and size distribution of precipitates evolvingwith time.[40] Such combinations of classic models havebeen applied to simulate the precipitation of AlN inmatrix and grain boundary of low-carbon steels,[41] andNbC on dislocation in ferrite.[42]
Taking advantage of faster computers, more compu-tational models of precipitation kinetics have beendeveloped recently. The most fundamental method issolving the quantum mechanics equations.[43,44] At theatomic scale, kinetic Monte Carlo models describediffusion statistically through vacancy jumps and havebeen applied to calcualte precipitation, such as Al3Zrand Al3Sc in aluminum[45] and Y2O3 in ferrite.[46]
However, these small-scale models are only suitablefor fine particles, such as at the nucleation stage. Phasefield methods are based on minimization of free energyand have been applied to calculate the interface dynam-ics and effects such as strain, interface curvature, anddiffusivity on growth of an isolated preciptiate in asupersaturated matrix,[47,48] such as M23C6 carbide insteel.[49] Recently, a commerical precpitation-kineticssoftware package, Matcalc, was developed based onthermodymamic extremum principles, and it wasapplied to simulate multiphase precipitation kinetics inmulticomponent systems, including separate modelswithin the matrix[50,51] and on grain boundaries.[52]
Cluster dynamics model precipitation using mesoscop-ical clusters, also called ‘‘nanoparticles,’’ so these modelspotentially can link between atomistic simulations andmacroscopic models. This method does not requireexplicit laws for the nucleation, growth and coarseningstages, and considers the condensation and evaporationrates between neighboring clusters, based on a thermo-dynamic model of the free energy of the system.[53–55]
Molecule-based models such as Smoluchowski[24] forcollision and Kampmann and Kahlweit[56] for diffusionare attractive because (1) the particles evolve automat-ically without any explicit laws for the different stages,(2) particles of all sizes are tracked, and (3) the fewparameters are fundamental physical constants them-selves. Unfortunately, these models encounter inevitabledifficulties when they are applied to simulate practicalprocesses, where the precipitate particle size rangesgreatly from a single ‘‘pseudomolecule’’ of ~0.1 nm tocoarsened particles larger than 100 lm. A pseudomol-ecule (or called a ‘‘monomer’’ in collision models[57,58]) is
1080—VOLUME 43A, MARCH 2012 METALLURGICAL AND MATERIALS TRANSACTIONS A
a stoichiometric cluster of atoms that consists of as fewas a single metallic/interstitial atom pair. Randomthermal diffusion creates unstable clusters of chemicallybonded pseudomolecules called ‘‘embryos,’’ which growinto stable ‘‘nuclei’’ if they exceed a critical size.Realistic particles range in size over at least 6 ordersof magnitude and contain from 1 to 10[18] pseudomol-ecules. With such an overwhelming linear scale, it isimpossible to solve realistic problems using traditionalmodels based on molecules.
Attempting to overcome this difficulty, the particle-size-grouping (PSG) method has been introduced inseveral previous studies and has proven to be effective incalculating the evolution of particle size distributions forcollision-coagulation growth over a large size range.[59–64] Rather than track each individual particle size, themain idea of this technique is to divide the entirepossible particle size range into a set of size ‘‘groups,’’each with a specific mean size and size range. Carefulattention is required to formulate the equations toensure proper interaction and mass conservation.[59]
Several researchers applied this PSG method to simulateinclusion agglomeration in liquid steel caused by colli-sions, coagulation, and removal. Such models have beenapplied to RH degassers,[60] continuous casting tundish-es,[61,62] and ladle refining.[63,64] To start these PSGmodels, an initial size distribution is still required, whichcan be found from either experimental measurements orassumptions.
To make the PSG method more usable, Nakaokaet al.[65] used different volume ratios between neighbor-ing size groups, taking advantage of the exponentialincrease in sizes that accompany powers of 2. Thisinnovation allows modeling from single pseudomole-cules to realistic particle sizes with only 20 to 80 sizegroups. Particle collisions were modeled consideringboth intergroup and intragroup interactions, andnumerical results agreed well with experimental agglom-eration curves. However, little work has been done toapply the PSG method to diffusion, which is thedominant mechanism for precipitate growth in manyprocesses including steel casting and rolling. One studyby Zhang and Pluschkell[66] coupled both collision anddiffusion into a PSG model, but inter-group diffusionwas not considered. Zhang and colleagues[57,58] includeda discrete-sectional technique by Gelbard et al.[67] andWu and Flagan[68] into the PSG model, but this weakensthe efficiency of the method and the accuracy of thetreatment of diffusion. The insurance of mass conserva-tion has not been verified. No previous study hasdemonstrated accurate simulation of diffusion using aPSG method.
The purpose of the current study is to developaccurate, robust, and versatile PSG methods to simulateprecipitate growth from both collision and diffusionmechanisms. The standard PSG method for collisionproblem is developed first, and then a new PSG methodfor diffusion is created. Both methods are verified bycomparison with exact solutions of the primary popu-lation equations in test problems. The new PSG methodis shown to be a time-efficient calculation with completemass balance and high accuracy. Finally, the new PSG
method is applied to simulate several practical precip-itation processes in solid steels and is compared withexperimental measurements.
II. PARTICLE COLLISION MODEL
The population balance model for collision firstsuggested by Smoluchowski[24] is
dnidt¼ 1
2
Xi�1
k¼1Uk;i�knkni�k � ni
X1
k¼1Ui;knk ½2�
where ni is the number of size i particles per unit vol-ume or ‘‘number density’’ and Fi,j is the collision fre-quency between size i and size j particles. The firstterm on the right-hand side generates size i particlesbecause of the collision of two smaller particles, andthe second term decreases the number of size i parti-cles by their collision with particles of any size tobecome larger particles. The generation term is halvedto avoid counting collision pairs twice. However, whentwo particles generating size i particles have same size,the generation term should not be halved because thecollision pair is unique. Moreover, the loss termshould be doubly counted when size i particles collidewith themselves. The number of pseudomoleculescomposing the largest agglomerated particle must be afinite number iM in numerical computation. Mak-ing these appropriate changes gives the followingimproved expression:
dnidt¼ 1
2
Xi�1
k¼1ð1þ dk;i�kÞUk;i�knkni�k � ni
XiM
k¼1ð1þ di;kÞUi;knk
½3�
where di,k is the Kronecker delta, di,k = 1 for i = k,and di,k = 0 for i „ k. When i = 1, the populationbalance for dissolved single pseudomolecules simplifiesto
dn1dt¼ �n1
XiM
k¼1ð1þ d1;kÞU1;knk ½4�
Thus, the number density of single pseudomoleculesalways decreases with collisions. Evaluating Eqs. [3] and[4] requires summing over and tracking every possiblesize from 1 to iM pseudomolecules, so it is not practicalfor realistic particle sizes. The results from theseequations, however, comprise the exact solution forcollision test problems.
III. PRECIPITATE PARTICLE DIFFUSIONMODEL
Kampmann and Kahlweit[56] suggested the followingdiffusion-controlled model to treat the kinetics ofnucleation, growth, and coarsening as one continuousand simultaneous process:
METALLURGICAL AND MATERIALS TRANSACTIONS A VOLUME 43A, MARCH 2012—1081
dnidt¼�bin1niþbi�1n1ni�1�aiAiniþaiþ1Aiþ1niþ1 ði� 2Þ
½5�
where bi, ai, and Ai are the diffusion growth rate, dis-sociation rate, and reaction sphere surface area for asize i particle containing i pseudomolecules. The firstand second terms on the right-hand side account forthe loss and generation of size i particles from ‘‘diffu-sion growth’’ by adding a single pseudomolecule tosize i and i – 1 particles, respectively. The third andfourth terms account for the loss and generation of sizei particles from particle ‘‘dissociation’’ by losing a sin-gle pseudomolecule from size i and i + 1 particles,respectively. For single pseudomolecules, i = 1, thespecial cases of double loss when two pseudomoleculesreact with each other and double generation of singlepseudomolecules when size 2 particles dissociate arenot counted exactly in Kampmann’s initial work. Thus,the following revised balance equation is suggested:
dn1dt¼ �n1
XiM
k¼1ð1þ d1;kÞbknk þ
XiM
k¼2ð1þ d2;kÞakAknk ½6�
Assuming a uniform spherical concentration field ofsingle pseudomolecules with a boundary layer thicknessapproximated by ri around each size i particle, the dif-fusion growth rate of size i particles is expressed by[56]
bi ¼ 4pDri ½7�
whereD is the diffusion coefficient in thematrix phase andri is the radius of size i particles. As precipitation reactionsalways involve more than one element, this coefficient ischosen for the slowest-diffusing element, which is assumedto control the diffusion rate. Because the diffusion ofinterstitial elements such as O, S, N, and C is much faster,usually the diffusion rate is determined by the diffusioncoefficient of the alloying metal element in the precipitate.
The following relation is assumed for the dissociationrate, which is the number of pseudomolecules lost perunit surface area of size i particles per unit time, basedon a mass balance of a particle in equilibrium with thesurrounding matrix phase[56]:
ai ¼ bin1i=Ai ¼ Dn1i=ri ½8�
The concentration of single pseudomolecules n1i inequilibrium around the surface of the size i particle isneeded to evaluate this equation. This is estimated usingthe Gibbs-Thomson equation and decreases withincreasing particle size as follows[39]:
n1i ¼ n1;eq exp2rVP
RgT
1
ri
� �½9�
where n1,eq is the number density of dissolved singlepseudomolecules in equilibrium with a plane interface ofthe precipitate phase, r is the interfacial energy betweenthe precipitate particles and the matrix phase, VP is themolar volume of the precipitate, Rg is the gas constant,and T is the absolute temperature. This equation
indicates that increasing particle radius causes thenearby solute concentration to decrease greatly, byseveral orders of magnitude.Equations [5] through [9] include the effects of equi-
librium, diffusion growth, dissociation, curvature effects,and mass conservation, with parameters all havingappropriate physical significance. The results from theseequations are regarded as the exact solution for diffu-sion test problems.
IV. PARTICLE-SIZE-GROUPING (PSG)METHOD
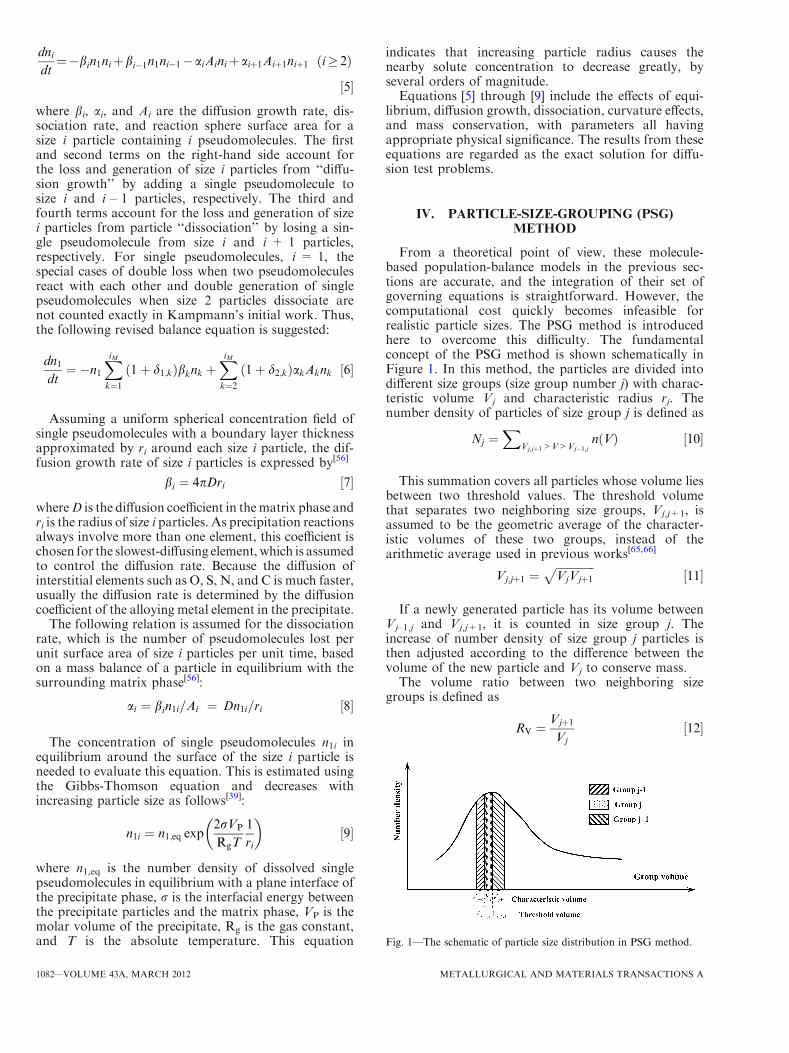
From a theoretical point of view, these molecule-based population-balance models in the previous sec-tions are accurate, and the integration of their set ofgoverning equations is straightforward. However, thecomputational cost quickly becomes infeasible forrealistic particle sizes. The PSG method is introducedhere to overcome this difficulty. The fundamentalconcept of the PSG method is shown schematically inFigure 1. In this method, the particles are divided intodifferent size groups (size group number j) with charac-teristic volume Vj and characteristic radius rj. Thenumber density of particles of size group j is defined as
Nj ¼X
Vj;jþ1>V>Vj�1;jnðVÞ ½10�
This summation covers all particles whose volume liesbetween two threshold values. The threshold volumethat separates two neighboring size groups, Vj,j+1, isassumed to be the geometric average of the character-istic volumes of these two groups, instead of thearithmetic average used in previous works[65,66]
Vj;jþ1 ¼ffiffiffiffiffiffiffiffiffiffiffiffiffiffiVjVjþ1
p½11�
If a newly generated particle has its volume betweenVj–1,j and Vj,j+1, it is counted in size group j. Theincrease of number density of size group j particles isthen adjusted according to the difference between thevolume of the new particle and Vj to conserve mass.The volume ratio between two neighboring size
groups is defined as
RV ¼Vjþ1Vj
½12�
Fig. 1—The schematic of particle size distribution in PSG method.
1082—VOLUME 43A, MARCH 2012 METALLURGICAL AND MATERIALS TRANSACTIONS A
To generate regularly spaced threshold values, RV isusually varied. However, for constant RV, the PSGcharacteristic and threshold volumes can be expressed as
Vj ¼ Rj�1V V1; Vj;jþ1 ¼ R
ðj�1=2ÞV V1 ½13�
where the volume of a single pseudomolecule V1 iscomputed using the molar volume of its precipitatecrystal structure VP
V1 ¼VP
NA½14�
where NA is Avogadro’s number and the small effectsof temperature change and vacancies are neglected.Because the particle volume is calculated from a bulkproperty VP, consideration of the packing factor is notneeded. The number of pseudomolecules contained ina given PSG volume is
mj ¼Vj
V1; mj;jþ1 ¼
Vj;jþ1V1
½15�
In the PSG method, it is easy to introduce fractaltheory to consider the effect of particle morphology. Theeffective radius of a particle can be expressed by
rj ¼ r1Vj
V1
� �1=Df
½16�
where Df is the fractal dimension, which can vary from 1(needle-shaped precipitates) to 3 (complete coalescenceinto smooth spheres). Tozawa et al.[69] proposedDf = 1.8 for Al2O3 clusters in liquid steel, and Df = 3is adopted everywhere in this work for simplicity.
After the number of single pseudomolecules compos-ing the largest agglomerated particles iM is determined,the corresponding total number of size groups GM mustbe large enough for the second largest size group tocontain the largest agglomerated particle iM. Thus, forconstant RV, GM must satisfy
GM � ceilðlogRViMÞ þ 2 ½17�
The largest size group is a boundary group thatalways has zero number density. The accuracy of thePSG method should increase with decreasing RV, asmore size groups are used. From the logarithm relation
shown in Eq. [17], it can be observed that the PSGmethod is efficient for real problems with a large rangeof particle sizes.
A. PSG Method for Collision
Applying the PSG method to model colliding particlesinvolves the following rules, affecting size group j:
(a) A size group j particle colliding with a small parti-cle, from group 1 to kc,j, remains in group j and in-creases the number density Nj.
(b) A group j particle colliding with a relatively largeparticle, from a group larger than kc,j, generates aparticle in group j + 1 or higher.
(c) A group j – 1 particle colliding with a particle fromgroup kc,j to j – 1 generates a group j particle.
Combining these rules gives the following equation,where the coefficients involving mean volumes areneeded to conserve volume
with kc;j ¼j� 1 4:000>RV>2:148j� 2 2:148>RV>1:755j� 3 1:755>RV>1:587
8<
: ½19�
The RV ranges in Eq. [19] are found by solvingthe following equations, after inserting the Eq. [13]expressions:
Vj þ Vkc;jþ1>Vj;jþ1 ½20�
Finally, the number density of single pseudomoleculesis calculated by
dN1
dt¼ �N1
XGM
k¼1ð1þ d1;kÞU1;kNk ½21�
Equations [18], [19], and [21] are integrated over timefor all size groups. The small number of size groupsenables the model to simulate practical problems.
B. PSG Method for Diffusion
Applying the PSG method to solid-state diffusionprocesses would seem to involve fewer rules than theparticle collision method just presented because precip-itate growth by diffusion involves gain or loss of onlyone individual pseudomolecule at a time. However,adding a single pseudomolecule to a particle rarely gives
[18]
METALLURGICAL AND MATERIALS TRANSACTIONS A VOLUME 43A, MARCH 2012—1083
enough particle growth to count it in the next larger sizegroup. In addition, size groups j – 1, j, and j + 1 allinfluence the evolution of size group j number densityduring a given time interval. Thus, some knowledge ofthe particle distribution inside each size group isnecessary, especially near the size group thresholdswhere the intergroup interaction occurs. This requirescareful consideration of diffusion growth and dissocia-tion both inside and between size groups.
All particles inside a size group jwill still stay in group jeven after a diffusion growth or dissociation event, exceptfor those ‘‘border sizes’’ that fall on either side of thethreshold sizes which define the neighboring size groups:nLj (closest toVj–1,j) and nRj (closest toVj,j+1). Size group jparticles also can be generated if particles nRj�1 from sizegroup j – 1 jump into size group j by diffusion growth orparticles nLjþ1 from size group j + 1 fall into size group jbydissociation.At the same time, size group jparticles canbelost if particles nRj jump to size group j + 1 by diffusiongrowth or particles nLj fall to size group j – 1 by dissoci-ation. These considerations are incorporated into a newPSG method, taking care to conserve mass, as follows:
dNj
dt¼m1
mjbjN1ðNj�nRj Þ�
m1
mjajAjðNj�nLj Þ
þceilðmj�1;jÞmj
bRj�1N1n
Rj�1þ
floorðmj;jþ1Þmj
aLjþ1ALjþ1n
Ljþ1
� floorðmj;jþ1Þmj
bRj N1n
Rj �
ceilðmj�1;jÞmj
aLj ALj n
Lj ðj�2Þ
½22�
where nLj is the number density of those particles in sizegroup j that fall into size group j – 1 by losing onepseudomolecule, and nRj is the number density of thoseparticles in size group j that jump into size group j + 1by gaining one pseudomolecule. Function ceil calculatesthe smallest integer that is not less than the given realnumber, and floor calculates for the largest integer thatis not larger than the given real number. In Eq. [22], thefirst and second terms on the right-hand side account forthe diffusion growth and dissociation inside size group j,and the third and fourth terms account for the gener-ation of size group j particles by intergroup diffusiongrowth and dissociation of neighboring groups. The lasttwo terms are for the loss of size group j particlesbecause of the diffusion growth and dissociation of sizegroup j particles themselves.
Single pseudomolecules are a special case because theycomprise the only group that interacts with all other sizegroups. Thus, the new PSGmethod for diffusion uses thefollowing population balance equation for j = 1:
dN1
dt¼�N1
XGM
k¼1ð1þ d1;kÞbkðNk � nRk Þ
þXGM
k¼2akAkðNk � nLk Þ �N1
XGM
k¼1ð1þ d1;kÞbR
k nRk
þXGM
k¼2ð1þ d2;kÞaLkAL
k nLk ½23�
The diffusion growth rate bj and dissociation rate aj ofsize group j particles needed to solve Eqs. [22] and [23]are calculated with Eqs. [7] through [9] using thecharacteristic (mean) radius given by Eq. [16]. Theradius, diffusion growth rate, and dissociation rate forthe border-sized particles are as follows:
rLj ¼ ceil mj�1;j� �� �1=Dfr1; r
Rj ¼ floor mj;jþ1
� �� �1=Dfr1 ½24�
bLj ¼ 4pDrLj ; bR
j ¼ 4pDrRj ½25�
aLj ¼bLj N1;eq
ALj
exp2rVP
RgT
1
rLj
!; aRj ¼
bRj N1;eq
ARj
exp2rVP
RgT
1
rRj
!
½26�
The particle number densities for the border sizes nLjand nRj are estimated from a geometric progressionapproximation
nLj ¼ nCj�1nCj
nCj�1
!ceilðmj�1;jÞ�mj�1mj�mj�1
; nRj ¼ nCjnCjþ1nCj
!floorðmj;jþ1Þ�mjmjþ1�mj
½27�
To propagate particle growth, if nLj 6¼ 0 andnCjþ1 ¼ 0; nRj is calculated by
nRj ¼ nLjnCj
nLj
!floorðmj;jþ1Þ�ceilðmj�1;jÞmj�ceilðmj�1;jÞ
½28�
The particle number density at the center of each sizegroup j is calculated by assuming two geometricprogressions inside each size group
nCj ¼Nj
Pmj�ceilðmj�1;jÞk¼1 ð1=qLj Þ
k þ 1þPfloorðmj;jþ1Þ�mj
k¼1 ðqRj Þk
½29�
with qLj ¼�nj
�nj�1
� � 1mj�mj�1
; qRj ¼�njþ1�nj
� � 1mjþ1�mj
½30�
The average number density of size group j iscalculated as
�nj ¼Nj
floorðmj;jþ1Þ � ceilðmj�1;jÞ þ 1½31�
Because the boundary (ceil, floor) and mean values ofsize groups are used directly and RV is not explicitlyfound in these equations, this model is flexible to apply.This allows arbitrary size increments between groups ina single simulation, making it easy to improve accuracywith smaller RV in size ranges of interest and to improvecomputation with larger RV in other sizes. Alternatively,
1084—VOLUME 43A, MARCH 2012 METALLURGICAL AND MATERIALS TRANSACTIONS A
the group sizes can be chosen to produce linearly spacedparticle radius intervals, which are needed to comparewith experiments.
V. VALIDATION OF NEW PSG METHODWITH TEST PROBLEMS
A. Collision Test Problem
Saffman and Turner[25] suggested the turbulent colli-sion frequency per unit volume of liquid medium to be
Uij ¼ 1:3aðe=tÞ1=2ðri þ rjÞ3 ½32�
where e is turbulent energy dissipation rate and t iskinematic viscosity. The empirical coefficient a wassuggested by Higashitani et al.[70] and is assumedconstant here. This model has been applied often tostudy inclusion agglomeration in liquid steel.[57,58,60–64,66] It is chosen here as a test problem to validate thecollision model, using the complete integer-range equa-tions in Section II as the exact solution.
Substituting into the dimensionless form of numberdensity and time
n�i ¼ ni=n0; t� ¼ 1:3aðe=tÞ1=2r31n0t ½33�
where n0 and r1 are the initial number density and theradius of single pseudomolecules. The initial condition isgiven by ni
* = 1 for i = 1 and ni* = 0 for i> 1. The size
of the largest agglomerated particle is iM = 12,000, sothat accuracy within 0.05 pct error in the total particlevolume is guaranteed up to t* = 1. The boundarycondition is always zero number density of the largestagglomerated particle (exact solution) and for thelargest size group (PSG method). The Runge-Kutta-Gill method is applied for time integration with a timestep of Dt* = 0.0025. Smaller time step sizes producenegligible difference.
The total dimensionless number density of pseudo-molecules and particles are defined as
N�M ¼XiM
i¼1i � n�i ; N�T ¼
XiM
i¼1n�i for exact solution
N�M ¼XGM
j¼1mj �N�j ; N�T ¼
XGM
j¼1N�j for PSG method
½34�
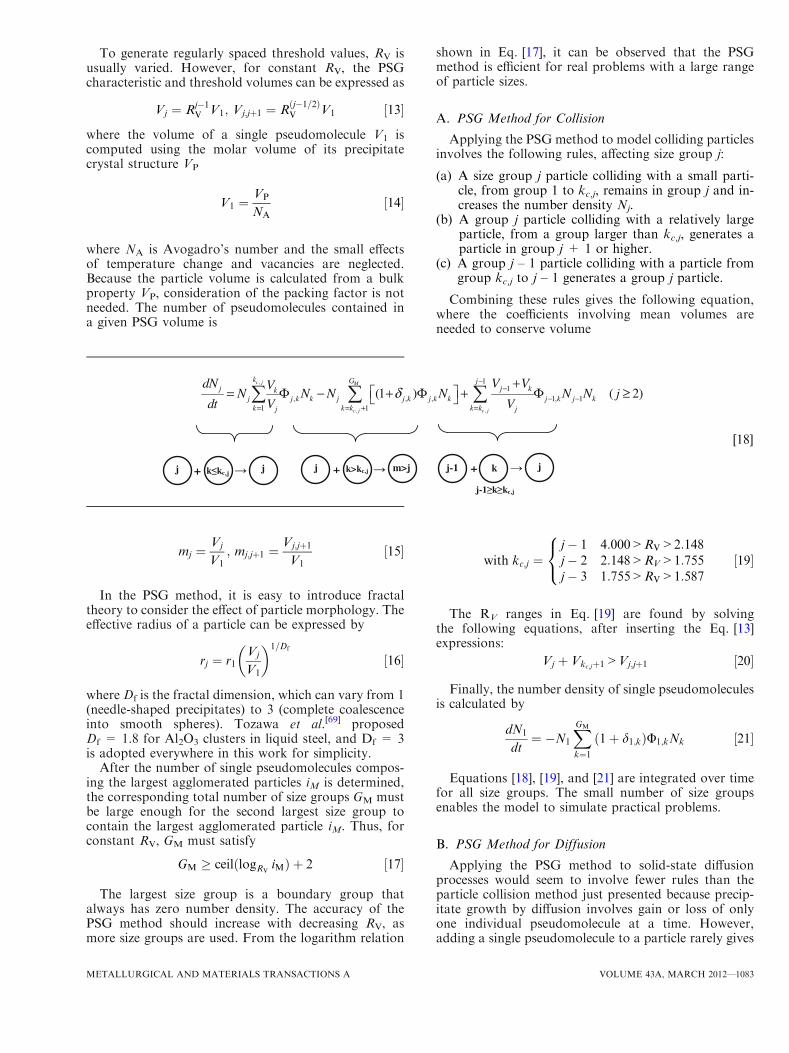
The mass balance requiresNM* to be constant (equal to
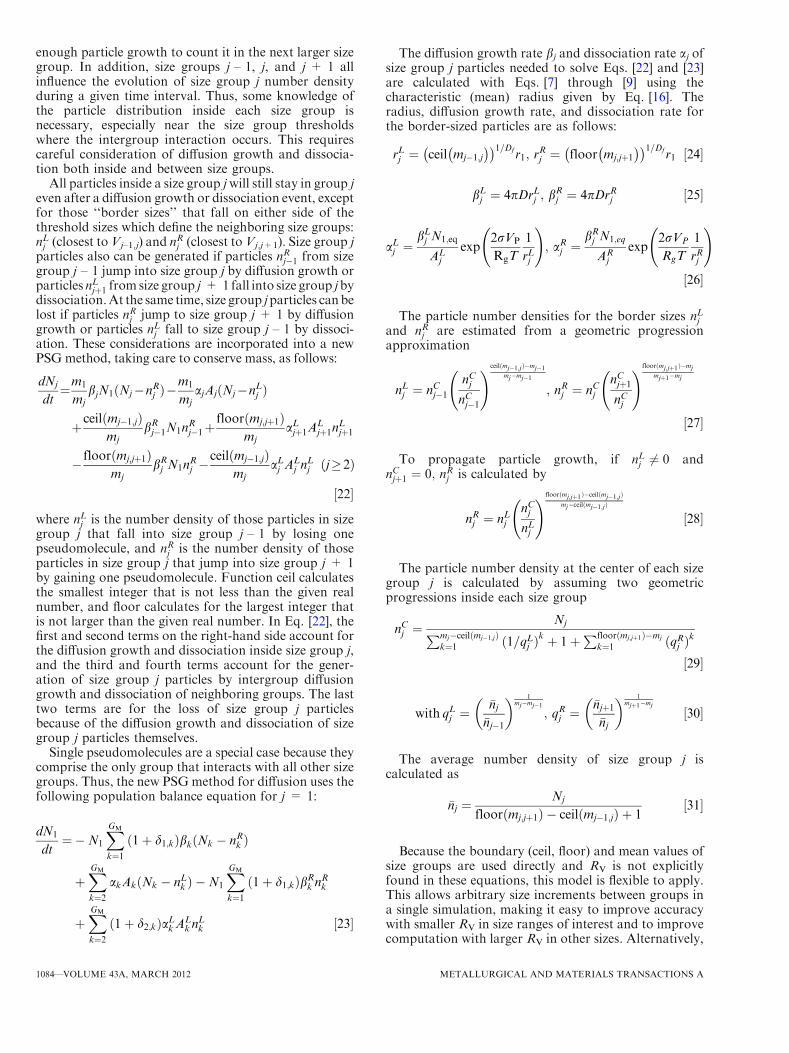
1) through the entire calculation. Figure 2 shows the totalparticle volume is conserved for both the exact solutionand PSG method. There is also good agreement betweenboth cases for RV = 3 and RV = 2 for the total particlenumber density, which decreases with time because ofagglomeration. Figure 3 shows that the evolution of thenumber densities of each size group with time from thePSG method also agrees reasonably with the exactsolution for bothRV cases. With smallerRV, the accuracyof the PSG method increases as expected.
Fig. 2—Comparison of collision curve calculated by PSG methodwith exact solution for different RV.
Fig. 3—Comparison of collision curve of each size group calculatedby PSG method with exact solution for different RV. (a) RV = 3 (b)RV = 2.
METALLURGICAL AND MATERIALS TRANSACTIONS A VOLUME 43A, MARCH 2012—1085
As time increases, collisions form large particles,leaving fewer smaller particles. For example, size groupN10 in RV = 2 contains all particle sizes from 363 to724 pseudomolecules, with a central size of 512pseudomolecules. The number density of intermediatesize groups increases at early times, reaches a maxi-mum, and decreases at later times. The exact solutionhas limited maximum time because of its prohibitivecomputational cost. The tremendous computationalefficiency of the PSG method is observed by examina-tion of Table I.
B. Diffusion Test Problem
To validate the PSG diffusion model, a test problem ischosen where the total number density of single pseudo-molecules in the system is produced by an isothermalfirst-order reaction[56]
n�s ðt�Þ ¼ nsðt�Þ=n1;eq ¼XiM
i¼1 i � n�i ¼ 9½1� expð�0:1t�Þ�
½35�
The number density of dissolved single pseudomole-cules must be adjusted with time to match the increaseof ns
*. This increase with time can be interpreted as anincrease in supersaturation caused by the decreasingtemperature in a practical cooling process. The dimen-sionless terms are defined as
n�i ¼ ni=n1;eq; t� ¼ 4pD1r1n1;eqt ½36�
To calculate the dissociation rate in Eq. [9], 2rVP/(RgTr1) = 3.488.[56] The initial condition is no particles,or ni
* = 0 for i ‡ 1.The boundary condition is always zero number
density for the largest agglomerated particle (exactsolution) or for the largest size group (PSG method).The maximum size of agglomerated particle is chosen asiM = 50,000 to ensure that mass conservation is satis-fied up to t* = 10,000. The explicit Runge-Kutta-Gillmethod was used for integration with time step size ofDt* = 0.01 chosen for accuracy. The maximum time
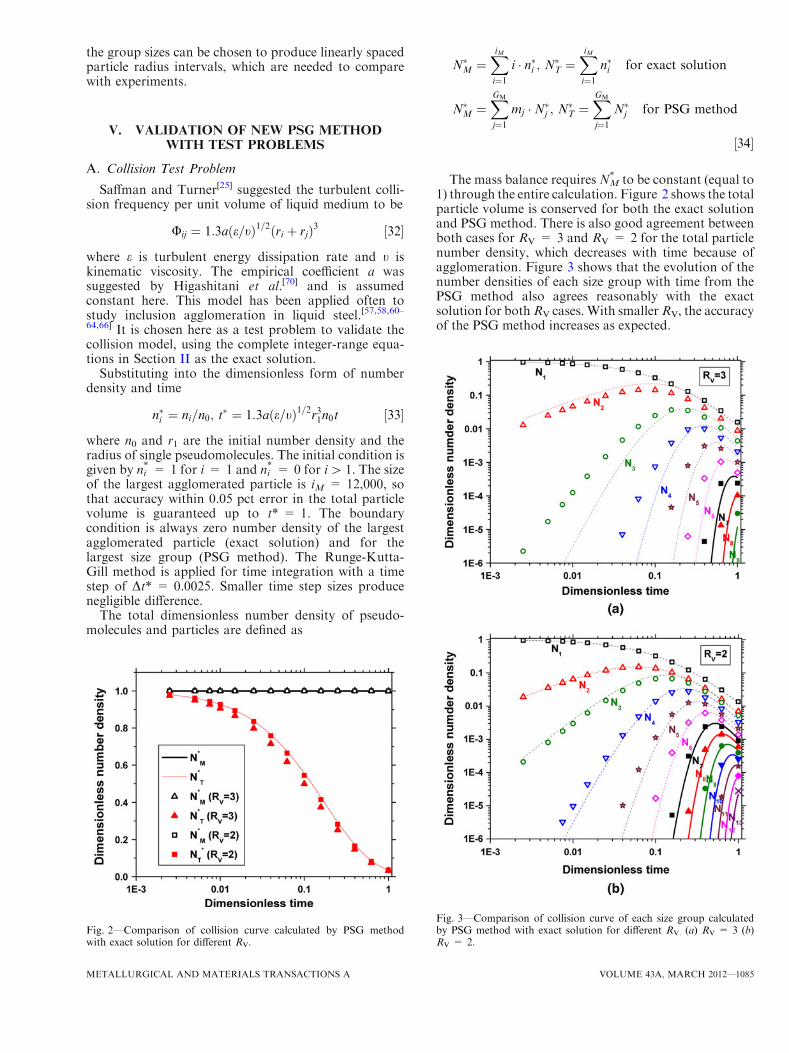
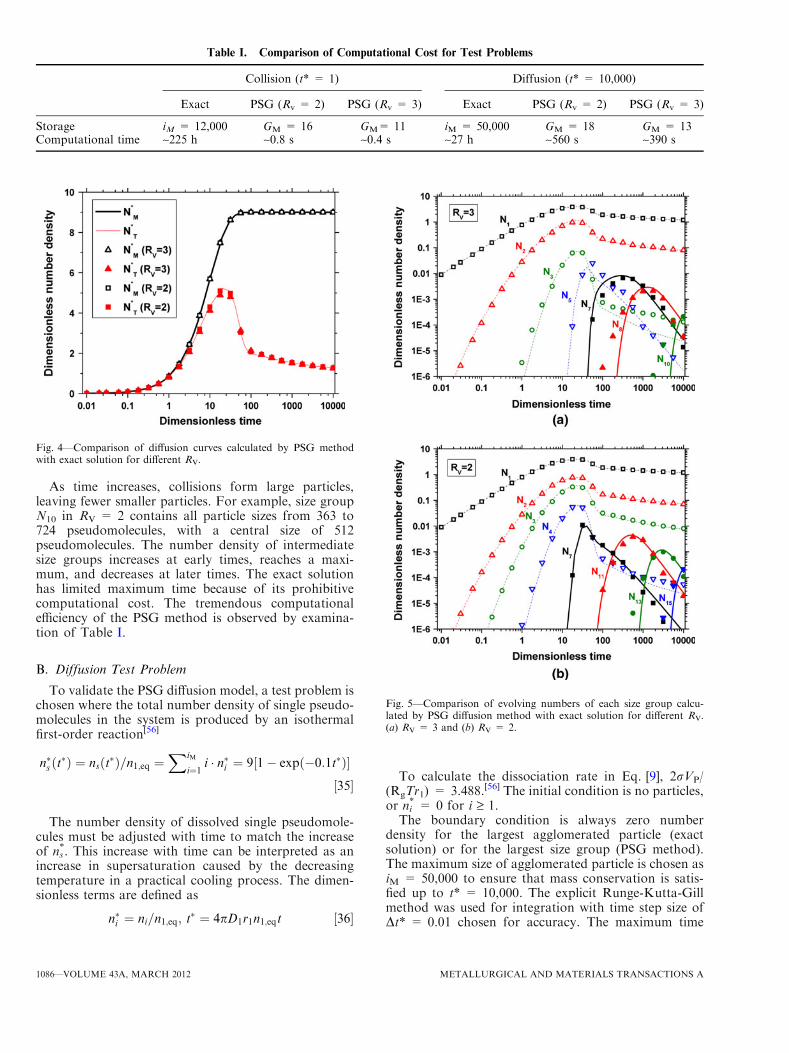
Table I. Comparison of Computational Cost for Test Problems
Collision (t* = 1) Diffusion (t* = 10,000)
Exact PSG (Rv = 2) PSG (Rv = 3) Exact PSG (Rv = 2) PSG (Rv = 3)
Storage iM = 12,000 GM = 16 GM= 11 iM = 50,000 GM = 18 GM = 13Computational time ~225 h ~0.8 s ~0.4 s ~27 h ~560 s ~390 s
Fig. 4—Comparison of diffusion curves calculated by PSG methodwith exact solution for different RV.
Fig. 5—Comparison of evolving numbers of each size group calcu-lated by PSG diffusion method with exact solution for different RV.(a) RV = 3 and (b) RV = 2.
1086—VOLUME 43A, MARCH 2012 METALLURGICAL AND MATERIALS TRANSACTIONS A
step for stability is roughly Dt* = 0.04 for bothmethods for this problem.
As shown in Figure 4, the total volume of particles isconserved for both the exact solution and the PSGmethod. This total increases with time and asymptotesat 9, according to Eq. [35]. The number density historiesfrom all three cases also agree. Its behavior can beexplained by examining Figure 5.
Figure 5 shows how the particle size distributionevolves because of the changing concentration gradientsnear particles of different size groups. At early times, allsize group particles grow because of the driving force ofincreasing supersaturation. At later times, the resultsshow Ostwald ripening. The large particles have lowconcentrations that tend to grow at the expense ofsmaller particles, which have high local concentrations,and eventually shrink. For example, the size group N1
(dissolved single pseudomolecules) reaches its peak andstarts to decrease in number after t* = 20. There isreasonable agreement for both total particle numberdensity and number densities of each size group betweenthe PSG method and the exact solution for both cases ofRV = 3 and RV = 2. The results for RV = 2 naturallymatch the exact solution more closely.
C. Computation Times
The computation times for both test problems arelisted in Table I. All the calculations are run withMatlab on Dell OPTIPLEX GX270 with P4 3.20GHzCPU and 2 GB RAM to enable a fair comparison. Thecomputational cost decreases dramatically for the PSGmethod. It is interesting to note that the computationcost for the collision problem is proportional to iM
2 forthe exact solution or GM
2 for the PSG method, whereas itis proportional to iM or GM, respectively, for thediffusion problem. Because the details of particle distri-bution inside the size groups must be captured to enablean accurate solution in a diffusion problem, the timesaving is not as large. The savings increase exponentiallywith increasing maximum particle size. This is enough tomake practical precipitation calculations possible, con-sidering that less than 60 size groups cover particle sizesup to 100 lm with constant RV = 2 for most nitridesand carbides in microalloyed steels.
VI. PRACTICAL APPLICATIONS
When the PSG method is applied to model a realprecipitation process, additional models are needed forthe temperature history and for the mass concentrationsof each element dissolved at equilibrium. The currentwork assumes the temperature history is given and usesa 13-element and 18-precipitate equilibrium precipita-tion model for microalloyed steels.[17] This modelincludes solubility limits for oxide, sulfide, carbide,and nitride precipitates in liquid, ferrite, and austenite;the influence of Wagner interaction on activities; andmass conservation of all elements during precipita-tion. Mutual solubility is incorporated for appropriate
precipitates with similar crystal structures and latticeparameters.For a given steel composition and temperature
history, the first step is to use the equilibrium modelto compute the dissolved concentrations of every ele-ment at every temperature and to identify the criticalelement that restricts the number of single pseudomol-ecules available to form the precipitate of interest, as afunction of time. The initial condition starting from theliquid state is complete dissolution with the numberdensity of single pseudomolecules, N1(t = 0), equal tothe total number density ns of the precipitate of interest.For a given steel composition containing M0 of elementM and X0 of element X, then ns for precipitate MxXy is
ns ¼ minM0
100
qsteel
xAMNA ;
X0
100
qsteel
yAXNA
� �½37�
where AM and AX are the atomic masses of elements Mand X, and qsteel is the density of the steel matrix(7500 kg m�3). All other particle sizes have zero numberdensities.Sometimes, such as after a solution treatment, some
of the initial processing steps from the liquid state can beignored or replaced with a measured initial distribution.Because the current model can handle only one precip-itate, the initial composition must be the dissolvedconcentration available for that precipitate after takingaway the other precipitates that form first. For example,in the cases involving nitride AlN formation, a new Alconcentration is used after subtracting the more stableoxide Al2O3.The equilibrium number density of single pseudomol-
ecules of the precipitate in the steel n1,eq is calculatedfrom the dissolved mass concentrations [M] and [X] atequilibrium in the same way
n1;eq ¼ min½M�100
qsteel
xAMNA ;
½X�100
qsteel
yAXNA
� �½38�
Although the current work only calculates size distri-butions for a single precipitate, other alloys may affectthe results by forming other precipitates that change theequilibrium dissolved concentrations of the elements inthe precipitate of interest. These effects are includedthrough the equilibrium model, in addition to Wagnerinteractions.[17]
The PSG kinetic model is then run, knowing thehistory of the equilibrium number density of singlepseudomolecules of the chosen precipitate. The diffusioncoefficients and dissociation rates in Eqs. [7] through [9]and [24] through [26] are updated for each time stepaccording to the temperature history. This modelcalculates how the particle size distribution evolves withtime.When running the PSG model, time steps must be
large enough to enable reasonable computation cost,while avoiding stability problems resulting from disso-ciation exceeding diffusion growth. Thus, the implicitEuler scheme is adopted here to integrate Eqs. [22]through [31] through time
METALLURGICAL AND MATERIALS TRANSACTIONS A VOLUME 43A, MARCH 2012—1087
1þDtðm1
mjajAjþ
floorðmj;jþ1Þmj
bRj N
iþ11 þ
ceilðmj�1;jÞmj
aLj ALj Þ
� �
�Niþ1j ¼ Ni
j þ Dtm1
mjbjN
iþ11 ðNiþ1
j � nRj Þ þm1
mjajAjn
Lj
�
þ ceilðmj�1;jÞmj
bRj�1N
iþ11 nRj�1 þ
floorðmj;jþ1Þmj
aLjþ1ALjþ1n
Ljþ1
þ floorðmj;jþ1Þmj
bRj N
iþ11 ðNiþ1
j � nRj Þ
þ ceilðmj�1;jÞmj
aLj ALj ðNiþ1
j � nLj Þ�ðj � 2Þ ½39�
where i is the time-step index. This implicit schemeallows over 104-fold increase in time step size, comparedwith the original explicit scheme, for realistic precipitate/matrix interfacial energies ~0.5 J/m2. The precedingequation system is solved with the iterative Gauss-Seidelmethod until the largest relative change of Niþ1
j con-verges to within less than 10�5 between two iterations.The upper limits of nLj and nRj are Niþ1
j and are evaluatedat each iteration. Although this scheme is stable for anytime step size, its accuracy may deteriorate if the timestep is too large. Thus, a reasonable time step must bechosen where results stay almost the same with a smallertime step.
Having validated mass conservation with test prob-lems, the number density of single pseudomolecules isthen computed as follows to save computation timerelative to Eq. [23]:
Niþ11 ¼ ns �
XGM
j¼2mjN
iþ1j ½40�
To postprocess the results, the total number density ofprecipitate particles np, fraction precipitated fP, meanprecipitate particle radius �rP, and precipitate volumefraction uP are computed from the number densities asfollows:
nP ¼XGM
j¼GT
Nj ½41�
fP ¼PGM
j¼GTmjNj
ns½42�
�rP ¼PGM
j¼GTrjNj
nP½43�
uP ¼ fPns
ns � n1;eq
qsteel
qP
weP
100½44�
where size group GT, which contains particles just largerthan a ‘‘truncating’’ threshold radius rT–1,T, is introducedto define the split between ‘‘dissolved’’ and measurableparticles. This parameter must be introduced because allexperimental techniques have resolution limits, whereas
the current PSG model simulates particles of all sizesincluding single pseudomolecules. qP is the density of theprecipitate phase, and we
P is the mass concentration ofprecipitate at equilibrium (wt pct).The complete PSG model is applied in this study to
two different example precipitate systems, where mea-surements are available for validation.
A. Precipitated Fraction for Isothermal AlNPrecipitation
The first validation problem for the PSG diffusionmodel was to simulate the isothermal precipitation ofAlN in a 0.09 pct C, 0.20 pct Si, 0.36 pct Mn, 0.051 pctAl, and 0.0073 pct N steel for the experimental condi-tions measured by Vodopivec.[71] Specimens were solu-tion treated at 1573 K (1300 �C) for 2 hours, ‘‘directly’’cooled to the precipitation temperature of 1113 K or973 K (840 �C or 700 �C), aged for various times, andquenched. The AlN content in steel was measured usingthe Beeghly method.[72]
The initial experimental measurements (zero andshort aging times) report 6.4 pct of the total N(N0 = 0.0073 pct) precipitated as AlN, perhaps becausethe cooling stages were not fast enough. The finalprecipitated amounts of nitrogen as AlN do not reachthe predictions of the equilibrium model, even after longholding times, when the precipitated fraction becomesnearly constant. This might be because N was consumedinto other types of nitrides. Thus, the measurements arenormalized to zero at zero aging time, and (N0-[N])/N0
at long times.As shown in Figure 6, the equilibrium model[17]
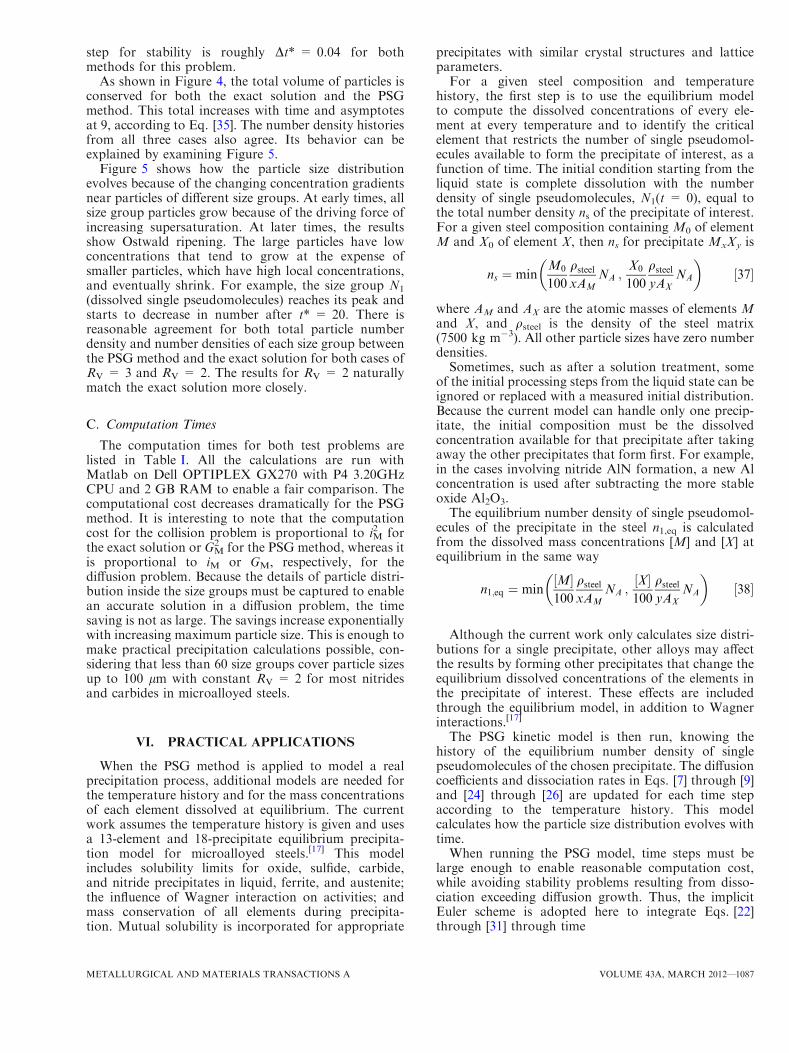
predicts AlN to start forming at 1509 K (1236 �C),and the equilibrium dissolved concentration of nitrogenin steel is ~0.00022 wt pct at 1113 K (840 �C) and~0.0000031 wt pct at 973 K (700 �C). A sharp decreaseof equilibrium dissolved aluminum concentration can be
Fig. 6—Calculated equilibrium dissolved mass concentration of Nfor Vodopivec case[71] and Nb for Perrard case[79] showing aging testtemperatures.
1088—VOLUME 43A, MARCH 2012 METALLURGICAL AND MATERIALS TRANSACTIONS A
observed over the cfia phase transformation, 1138 K to988 K (865 �C to 715 �C), because of the lower solubil-ity limit of AlN in ferrite predicted by the equilibriummodel.
Isothermal precipitation simulations of 1 hour at973 K (700 �C) and 3 hours at 1113 K (840 �C) wererun, neglecting the cooling histories before and after,which were not clearly reported. The molar volume ofAlN is 12.54 9 10�6m3/mol[73] and the diffusioncoefficient of Al in steel DAl(m
2/s) is taken as 2.51 910�4exp(–253400/RT)[74] in austenite, and 0.3 910�2exp(�234500/RT)[73] in ferrite. The interfacial ener-gies for these two precipitation temperatures are calcu-lated in the appendix, where the value is observed to be10pct higher at 973 K (700 �C) in ferrite than at 1113 K(840 �C) in austenite. The number densities of precip-itate particles are calculated based on the nitrogenconcentration because this element is insufficient whenreacting with aluminum to form AlN for this steelcomposition. Constant RV = 2 and 32 size groups areused in the simulation, which covers particle radii up toapproximately 200 nm. The time step is 0.001 secondswith ~1000 decreasing to ~100 iterations required withineach time step for convergence of the implicit methodwith Gauss-Seidel solver. Because it has been suggestedthat the Beeghly technique cannot detect fine precipitateparticles which could pass through the filter,[75,76] thetruncating precipitate radius is set to 2.0nm in thesimulation to match the measurements.
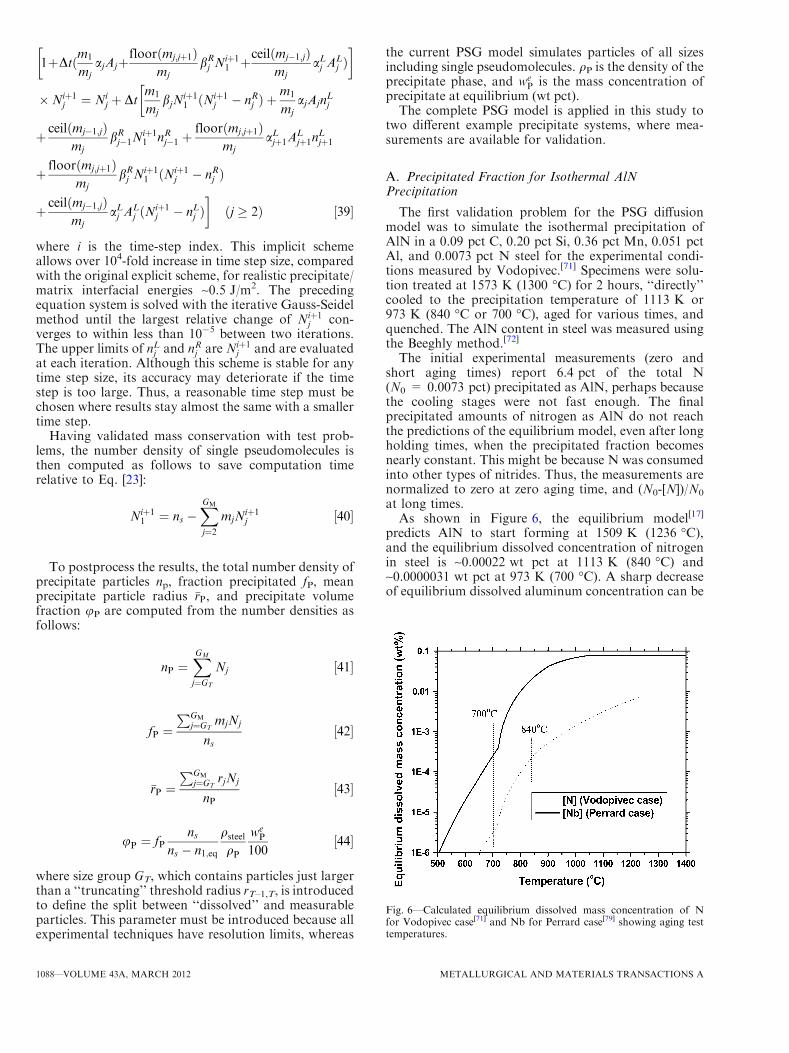
The predicted AlN precipitate fractions are shownand compared with experimental measurements inFigure 7. Reasonable matches are shown at bothtemperatures. The calculation verifies the experimentalobservation of much faster precipitation in ferrite thanin austenite because of the lower solubility limit of AlNand the faster diffusion rate of aluminum in ferrite thanin austenite. The disagreement could be to the result ofAlN precipitation on the grain boundaries because thephysical properties assumed in the simulation are based
on homogeneous precipitation in the steel matrix. Thesame mismatch in predicting AlN precipitation has beenfound and discussed by other researchers.[77,78]
B. Size Distribution for Isothermal NiobiumPrecipitation
The second validation problem is to simulate the sizedistribution of niobium precipitate particles in steelcontaining 0.079 pct Nb, 0.011 pct C, 0.001 pct N,0.002 pct Mn, 0.0023 pct S, 0.001 pct P, 0.006 pct Al,and 0.0013 pct O to compare the PSG simulationpredictions with the niobium precipitate distributionmeasured in ferrite.[79] The alloy was vacuum inductionmelted, cast into ingots, and hot rolled from 50 mm to5 mm thickness. After homogenization at 1623 K(1350 �C) for 45 minutes, the specimens were quenchedrapidly to an aging temperature of 973 K (700 �C) andheld for various times. Small-angle neutron scattering(SANS) and transmission electron microscopy (TEM)were used to measure precipitate size.The equilibrium calculation in Figure 6 predicts that
the niobium precipitates in this steel first become stableat 1327 K (1054 �C), and the equilibrium dissolved massconcentration of the niobium is 0.0002506 wt pct at973 K (700 �C).[17] For the PSG precipitation simula-tion, the diffusion coefficient of Nb in ferrite is taken asDNb(m
2/s) = 50.2 9 10�4exp(–252000/RT),[80] the mo-lar volume of NbC is 13.39 9 10�6 m3/mol,[73] thedensity of NbC is 7.84 9 103 kg/m3,[73] and theinterfacial energy is calculated in the appendix. The com-position of the niobium precipitates in the simulationwas regarded as NbN0.08C0.80, according to the predic-tions of the equilibrium model,[17] for this steel, wherepct C>pct N. This composition agrees with theexperimental observation of ‘‘niobium carbide’’ precip-itates and the nonstoichiometric ratio of NbC0.87
measured in other work.[81] Lacking data for thiscomplex Nb precipitate, property data were taken forNbC, which are believed to be similar, as the latticeconstants of NbC and NbC0.87 differ by only~0.2 pct.[82]
To compare with the experimental measurements, RV
was set equal to 2 for particles with radius smaller than0.3 nm and larger than 10 nm, and these values variedto give constant 0.2-nm size groups for 0.3 to 8.5 nm,and 0.5 nm size groups for 8.5 to 10 nm. A total of 50size groups were used to model particle sizes up to20 nm to cover the largest particle observed in theexperiments. The implicit time step was 0.01 seconds,with less than 10 iterations needed for convergence atmost times, resulting in ~2.5 days of total CPU time on a3.20 GHz processor PC for the 600,000 seconds (7 days)simulation. Rapid quenching from solution treatment toaging temperature and from aging to ambient isassumed, so only an isothermal simulation at 973 K(700 �C) was performed.Predicted evolutions of precipitate mean size, size
distribution, and volume fraction results from the PSGsimulation are shown in Figures 8 and 9, and werecompared with available measurements.[79] Becausethe many dislocations in the matrix from the prior
Fig. 7—Calculated and measured precipitated fraction of AlN in0.051 wt pct Al-0.0073 wt pct N steel during isothermal aging at1113 K and 973 K (840 �C and 700 �C) (experimental data fromVodopivec[71]).
METALLURGICAL AND MATERIALS TRANSACTIONS A VOLUME 43A, MARCH 2012—1089
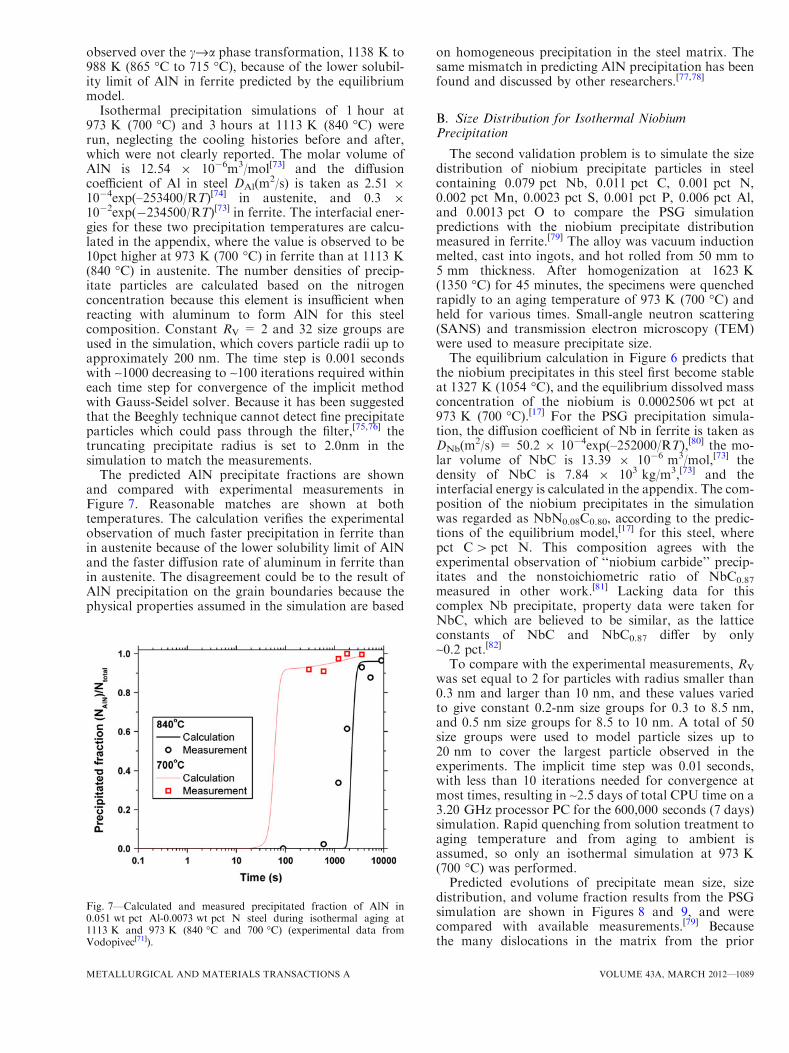
deformation may relax the lattice mismatch anddecrease the interface energy, they become favoredlocations for precipitation. Figure 8 shows that lowering
the interface energy to 0.3 J/m2 and choosing a trun-cating radius of 0.7 nm gives the best match of bothmean precipitate size and volume fraction with theSANS measurements. These results also indicate thatdecreasing interface energy makes the capillary effectsmaller, which makes large particles more difficult togrow, so a finer precipitate size and slower precipitationare predicted. All volume fraction curves eventuallyreach the equilibrium value of 0.084 pct for aging at973 K (700 �C). These calcaultions of decreasing inter-face energy are qualitatively consistent with the exper-imental observations of deforamtion-induced nanosizedCu precpitation.[83] Increasing the truncating radiusfrom 0.5 nm to 0.7 nm significantly delays the apparantprecipitation, although it has only minor influence onthe calculated mean precipitate size and only during theinitial stage of precipitation.The simulation results with the adjusted interface
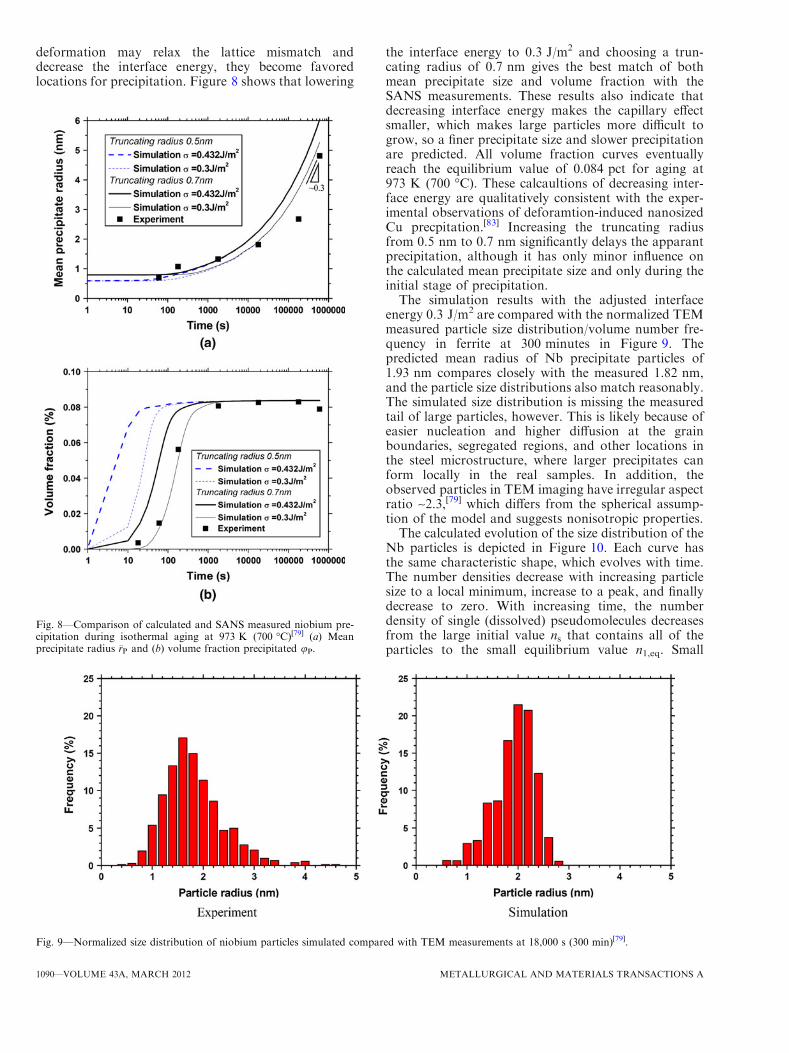
energy 0.3 J/m2 are compared with the normalized TEMmeasured particle size distribution/volume number fre-quency in ferrite at 300 minutes in Figure 9. Thepredicted mean radius of Nb precipitate particles of1.93 nm compares closely with the measured 1.82 nm,and the particle size distributions also match reasonably.The simulated size distribution is missing the measuredtail of large particles, however. This is likely because ofeasier nucleation and higher diffusion at the grainboundaries, segregated regions, and other locations inthe steel microstructure, where larger precipitates canform locally in the real samples. In addition, theobserved particles in TEM imaging have irregular aspectratio ~2.3,[79] which differs from the spherical assump-tion of the model and suggests nonisotropic properties.The calculated evolution of the size distribution of the
Nb particles is depicted in Figure 10. Each curve hasthe same characteristic shape, which evolves with time.The number densities decrease with increasing particlesize to a local minimum, increase to a peak, and finallydecrease to zero. With increasing time, the numberdensity of single (dissolved) pseudomolecules decreasesfrom the large initial value ns that contains all of theparticles to the small equilibrium value n1,eq. Small
Fig. 8—Comparison of calculated and SANS measured niobium pre-cipitation during isothermal aging at 973 K (700 �C)[79] (a) Meanprecipitate radius �rP and (b) volume fraction precipitated uP.
Fig. 9—Normalized size distribution of niobium particles simulated compared with TEM measurements at 18,000 s (300 min)[79].
1090—VOLUME 43A, MARCH 2012 METALLURGICAL AND MATERIALS TRANSACTIONS A
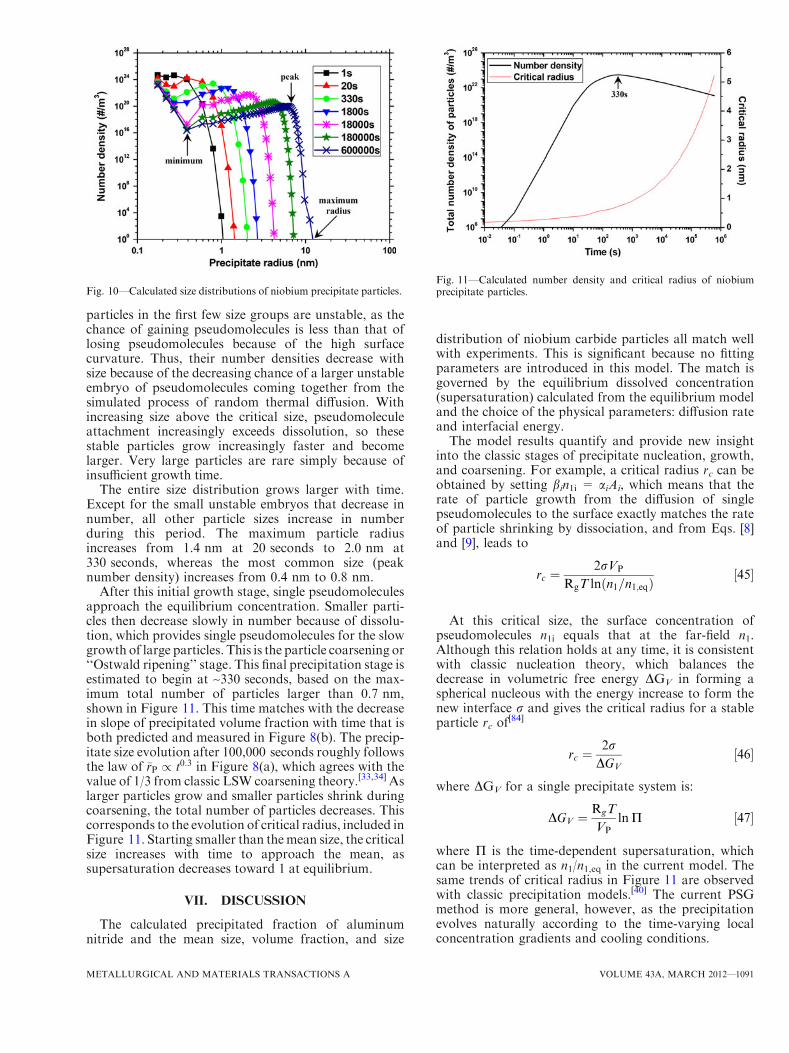
particles in the first few size groups are unstable, as thechance of gaining pseudomolecules is less than that oflosing pseudomolecules because of the high surfacecurvature. Thus, their number densities decrease withsize because of the decreasing chance of a larger unstableembryo of pseudomolecules coming together from thesimulated process of random thermal diffusion. Withincreasing size above the critical size, pseudomoleculeattachment increasingly exceeds dissolution, so thesestable particles grow increasingly faster and becomelarger. Very large particles are rare simply because ofinsufficient growth time.
The entire size distribution grows larger with time.Except for the small unstable embryos that decrease innumber, all other particle sizes increase in numberduring this period. The maximum particle radiusincreases from 1.4 nm at 20 seconds to 2.0 nm at330 seconds, whereas the most common size (peaknumber density) increases from 0.4 nm to 0.8 nm.
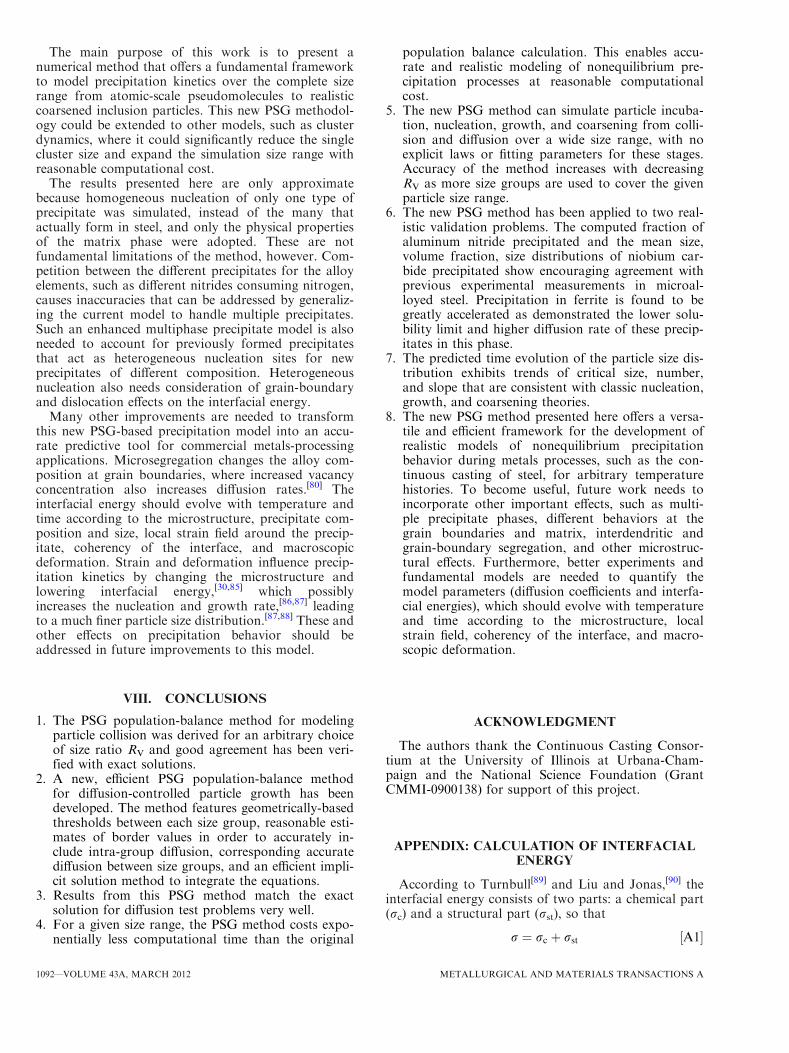
After this initial growth stage, single pseudomoleculesapproach the equilibrium concentration. Smaller parti-cles then decrease slowly in number because of dissolu-tion, which provides single pseudomolecules for the slowgrowth of large particles. This is the particle coarsening or‘‘Ostwald ripening’’ stage. This final precipitation stage isestimated to begin at ~330 seconds, based on the max-imum total number of particles larger than 0.7 nm,shown in Figure 11. This time matches with the decreasein slope of precipitated volume fraction with time that isboth predicted and measured in Figure 8(b). The precip-itate size evolution after 100,000 seconds roughly followsthe law of �rP / t0:3 in Figure 8(a), which agrees with thevalue of 1/3 from classic LSW coarsening theory.[33,34] Aslarger particles grow and smaller particles shrink duringcoarsening, the total number of particles decreases. Thiscorresponds to the evolution of critical radius, included inFigure 11. Starting smaller than themean size, the criticalsize increases with time to approach the mean, assupersaturation decreases toward 1 at equilibrium.
VII. DISCUSSION
The calculated precipitated fraction of aluminumnitride and the mean size, volume fraction, and size
distribution of niobium carbide particles all match wellwith experiments. This is significant because no fittingparameters are introduced in this model. The match isgoverned by the equilibrium dissolved concentration(supersaturation) calculated from the equilibrium modeland the choice of the physical parameters: diffusion rateand interfacial energy.The model results quantify and provide new insight
into the classic stages of precipitate nucleation, growth,and coarsening. For example, a critical radius rc can beobtained by setting bin1i = aiAi, which means that therate of particle growth from the diffusion of singlepseudomolecules to the surface exactly matches the rateof particle shrinking by dissociation, and from Eqs. [8]and [9], leads to
rc ¼2rVP
RgT lnðn1=n1;eqÞ½45�
At this critical size, the surface concentration ofpseudomolecules n1i equals that at the far-field n1.Although this relation holds at any time, it is consistentwith classic nucleation theory, which balances thedecrease in volumetric free energy DGV in forming aspherical nucleous with the energy increase to form thenew interface r and gives the critical radius for a stableparticle rc of
[84]
rc ¼2r
DGV½46�
where DGV for a single precipitate system is:
DGV ¼RgT
VPlnP ½47�
where P is the time-dependent supersaturation, whichcan be interpreted as n1/n1,eq in the current model. Thesame trends of critical radius in Figure 11 are observedwith classic precipitation models.[40] The current PSGmethod is more general, however, as the precipitationevolves naturally according to the time-varying localconcentration gradients and cooling conditions.
Fig. 10—Calculated size distributions of niobium precipitate particles.Fig. 11—Calculated number density and critical radius of niobiumprecipitate particles.
METALLURGICAL AND MATERIALS TRANSACTIONS A VOLUME 43A, MARCH 2012—1091
The main purpose of this work is to present anumerical method that offers a fundamental frameworkto model precipitation kinetics over the complete sizerange from atomic-scale pseudomolecules to realisticcoarsened inclusion particles. This new PSG methodol-ogy could be extended to other models, such as clusterdynamics, where it could significantly reduce the singlecluster size and expand the simulation size range withreasonable computational cost.
The results presented here are only approximatebecause homogeneous nucleation of only one type ofprecipitate was simulated, instead of the many thatactually form in steel, and only the physical propertiesof the matrix phase were adopted. These are notfundamental limitations of the method, however. Com-petition between the different precipitates for the alloyelements, such as different nitrides consuming nitrogen,causes inaccuracies that can be addressed by generaliz-ing the current model to handle multiple precipitates.Such an enhanced multiphase precipitate model is alsoneeded to account for previously formed precipitatesthat act as heterogeneous nucleation sites for newprecipitates of different composition. Heterogeneousnucleation also needs consideration of grain-boundaryand dislocation effects on the interfacial energy.
Many other improvements are needed to transformthis new PSG-based precipitation model into an accu-rate predictive tool for commercial metals-processingapplications. Microsegregation changes the alloy com-position at grain boundaries, where increased vacancyconcentration also increases diffusion rates.[80] Theinterfacial energy should evolve with temperature andtime according to the microstructure, precipitate com-position and size, local strain field around the precip-itate, coherency of the interface, and macroscopicdeformation. Strain and deformation influence precip-itation kinetics by changing the microstructure andlowering interfacial energy,[30,85] which possiblyincreases the nucleation and growth rate,[86,87] leadingto a much finer particle size distribution.[87,88] These andother effects on precipitation behavior should beaddressed in future improvements to this model.
VIII. CONCLUSIONS
1. The PSG population-balance method for modelingparticle collision was derived for an arbitrary choiceof size ratio RV and good agreement has been veri-fied with exact solutions.
2. A new, efficient PSG population-balance methodfor diffusion-controlled particle growth has beendeveloped. The method features geometrically-basedthresholds between each size group, reasonable esti-mates of border values in order to accurately in-clude intra-group diffusion, corresponding accuratediffusion between size groups, and an efficient impli-cit solution method to integrate the equations.
3. Results from this PSG method match the exactsolution for diffusion test problems very well.
4. For a given size range, the PSG method costs expo-nentially less computational time than the original
population balance calculation. This enables accu-rate and realistic modeling of nonequilibrium pre-cipitation processes at reasonable computationalcost.
5. The new PSG method can simulate particle incuba-tion, nucleation, growth, and coarsening from colli-sion and diffusion over a wide size range, with noexplicit laws or fitting parameters for these stages.Accuracy of the method increases with decreasingRV as more size groups are used to cover the givenparticle size range.
6. The new PSG method has been applied to two real-istic validation problems. The computed fraction ofaluminum nitride precipitated and the mean size,volume fraction, size distributions of niobium car-bide precipitated show encouraging agreement withprevious experimental measurements in microal-loyed steel. Precipitation in ferrite is found to begreatly accelerated as demonstrated the lower solu-bility limit and higher diffusion rate of these precip-itates in this phase.
7. The predicted time evolution of the particle size dis-tribution exhibits trends of critical size, number,and slope that are consistent with classic nucleation,growth, and coarsening theories.
8. The new PSG method presented here offers a versa-tile and efficient framework for the development ofrealistic models of nonequilibrium precipitationbehavior during metals processes, such as the con-tinuous casting of steel, for arbitrary temperaturehistories. To become useful, future work needs toincorporate other important effects, such as multi-ple precipitate phases, different behaviors at thegrain boundaries and matrix, interdendritic andgrain-boundary segregation, and other microstruc-tural effects. Furthermore, better experiments andfundamental models are needed to quantify themodel parameters (diffusion coefficients and interfa-cial energies), which should evolve with temperatureand time according to the microstructure, localstrain field, coherency of the interface, and macro-scopic deformation.
ACKNOWLEDGMENT
The authors thank the Continuous Casting Consor-tium at the University of Illinois at Urbana-Cham-paign and the National Science Foundation (GrantCMMI-0900138) for support of this project.
APPENDIX: CALCULATION OF INTERFACIALENERGY
According to Turnbull[89] and Liu and Jonas,[90] theinterfacial energy consists of two parts: a chemical part(rc) and a structural part (rst), so that
r ¼ rc þ rst ½A1�
1092—VOLUME 43A, MARCH 2012 METALLURGICAL AND MATERIALS TRANSACTIONS A

The chemical interfacial energy is estimated from thedifference between the energies of bonds broken in theseparation process and of bonds made in forming theinterface, with only the nearest neighbors considered. Asgiven by Russell[36]
rc ¼DE0NsZs
NAZlðXP � XMÞ2 ½A2�
where DE0 is the heat of solution of precipitates in adilute solution in the matrix, Ns is the number of atomsper unit area across the interface, Zs is the number ofbonds per atom across the interface, Zl is the coordinatenumber of nearest neighbors within the precipitatecrystal lattice, and XP and XM are the molar concentra-tions of the precipitate-forming element in the precip-itate (P) and matrix (M) phase, respectively. DE0 isestimated to equal –DH, the heat of formation of theprecipitate. XP = 0.5 and XP >>XM.
Van Der Merwe[91] presented a calculation of struc-tural energy for a planar interface. When the two phaseshave the same structure and orientation but differentlattice spacing, the mismatch may be accommodated bya planar array of edge dislocations. Including the strainenergy in both crystals, rst is given as
rst¼lI�c
4p21þb�ð1þb2Þ1=2�bln 2bð1þb2Þ1=2�2b2
h in o
½A3�
with2
�c¼ 1
ceMþ 1
ceP; b ¼ 2pd
kþlI
;2
lI
¼ 1
lM
þ 1
lP
;
d ¼2 ceM � ceP ceM þ ceP
;1
kþ¼ 1� mM
lM
þ 1� mPlP
½A4�
where ceM and ceP are the nearest-neighbor distanceacross the interface, which are estimated from the latticeparameters cM, cP, and interface orientations; �c is thespacing of a reference lattice across the matrix/precip-itate interface; lM, lP, and lI are shear modulii in thematrix (M), precipitate (P), and interface (I), respec-tively; mM and mP are Poisson’s ratios; and d is the latticemisfit across the interface.
The crystallographic relationships between the AlN(hexagonal close packed [hcp]), NbC (face centeredcubic [fcc]), and steel matrix austenite phase (fcc) orferrite phase (base-centered cubic [bcc]) are chosen asð100ÞNbC==ð100Þa�Fe,
[92]ð0001ÞAlN==ð111Þc�Fe,[93,94] and
ð0001ÞAlN==ð110Þa�Fe.[95]
The physical properties used in the calculation are
�DHA1NðKJ/molÞ ¼ 341:32� 4:98� 10�2T� 1:12� 10�6
T2 � 2813=T,[96] �DHNbCðKJ/molÞ ¼ 157:76� 4:54 �10�2T� 3:84 � 10�6T2,[97] lc�FeðGPaÞ ¼ 81 1� 0:91½ðT� 300Þ=1810�,[98] mc�Fe ¼ 0:29,[99] cc�FeðnmÞ ¼ 0:357,[73]
la�Fe ðGPaÞ ¼ 69:2 1� 1:31ðT� 300Þ=1810½ �,[98] ma�Fe ¼0:29,[99] ca�FeðnmÞ ¼ 0:286,[73] lAlNðGPaÞ ¼ 127,[100]
mAlN ¼ 0:23,[100] aAlNðnmÞ ¼ 0:311, cAlNðnmÞ ¼0:497,[73] lNbC ðGPaÞ ¼ 134 1� 0:18ðT� 300Þ=3613½ �,[98]
mNbC ¼ 0:194,[98] cNbCðnmÞ ¼ 0:446.[73]
For c-Fe (111) plane, Zc�Fes ¼ 3 and Nc�Fe
s ¼4=ð
ffiffiffi3p
c2c�FeÞ. For a-Fe, (110) plane Za�Fes ¼ 4; Na�Fe
s ¼ffiffiffi2p
=c2a�Fe, (100) plane Za�Fes ¼ 4, and Na�Fe
s ¼ 1=c2a�Fe.For both fcc and hcp precipitate structures, Zl ¼ 12.The calculated interfacial energy decreases slightly astemperature increases and also decreases for NbC(relative to AlN) because of lower heat of formation.The values used in the current simulations are
rc�FeAlN ð840
oCÞ ¼ 0:908 J/m2
ra�FeAlN ð700 oCÞ ¼ 0:997 J/m2
ra�FeNbC ð700 oCÞ ¼ 0:432 J/m2
NOMENCLATURE
a empirical coefficient for turbulencecollision
cM; cP lattice parameter of the matrix andprecipitate phase (m)
ceM; ce
P nearest-neighbor distance across theinterface for matrix and precipitate phase(m)
f transformed fraction in phasetransformation
fP particle (or mass) fraction precipitated(relative to 100pct at zero dissolved)
iM number of pseudomolecules for the largestagglomerated particle in simulation
mj number of pseudomolecules contained inPSG volume Vj
mj�1;j number of pseudomolecules contained inPSG threshold volume Vj–1,j
n Avrami exponent in KJMA modeln0 initial total number density of single
pseudomolecules for collision problem(# m–3)
n1;eq equilibrium concentration of dissolvedsingle pseudomolecules for diffusionproblem (# m–3)
n1i equilibrium concentration of singlepseudomolecules at surface of size iparticles (# m–3)
ni number density of size i particles (# m–3)np total number density of precipitate
particles (# m–3)ns released number density of single
pseudomolecules for diffusion problem(# m–3)
nCj number density of particles at the center of
size group j (# m–3)nL
j number density of border particles,representing the smallest particles in sizegroup j (# m–3)
nRj number density of border particles,
representing the largest particles in sizegroup j (# m–3)
METALLURGICAL AND MATERIALS TRANSACTIONS A VOLUME 43A, MARCH 2012—1093
ri ; rj characteristic radius of size i particles, orsize group j particles (m)
rj�1;j threshold radius to separate size groupj � 1 and size group j particles in PSGmethod (m)
rc the critical radius for nucleation (m)�rP average precipitate particle size (m)t time (s)Dt time step size in numerical computation (s)we
P equilibrium mass concentration ofprecipitate phase (wt pct)
Ai; Aj the surface area of size i particles, or sizegroup j particles (m2)
AM atomic mass unit of element M (g mol–1)D diffusion coefficient of the precipitation in
the parent phase (m2 s–1)Df fractal dimension for precipitate
morphologyGM number of size groups for the largest
agglomerated particle in PSG methodGT truncating size group in PSG method to
match experimental resolutionK rate function for nucleation and growth in
KJMA modelM0 total mass concentration of alloying
element M in the steel composition (wt pct)½M� equilibrium mass concentration of alloying
element M (wtpct)Nj total number density of size group j
particles in PSG method (# m�3)NA Avogadro number (6.022 9 1023 # mol–1)NM total number density of pseudomolecules
(# m–3)Ns number of atoms per unit area across the
interface (# m–2)NT total number density of all particles (# m–3)Rg gas constant (8.314 J K–1 mol–1)RV particle volume ratio between two
neighboring particle size groupsT absolute temperature (K)Vi; Vj characteristic volume of size i particles or
size group j particles (m3)Vj�1;j threshold volume to separate size group
j – 1 and size group j particles in PSGmethod (m3)
VP molar volume of precipitated phase(m3 mol–1)
XM; XP molar concentration of precipitate-formingelement in matrix and precipitate phases
Zs number of bonds per atom across theinterface
Zl coordinate number of nearest neighborswithin the crystal lattice
ai dissociation rate of size i particles (m2 s–1)bi diffusion growth rate of size i particles
(m3 #–1 s–1)d relative lattice misfit across the interface
between pairs of precipitate and matrixatoms
di;k Kronecker’s delta function (di,k = 1 for i= k, di,k = 0 for i „ k)
e turbulent energy dissipation rate (m2 s–3)lM; lP; lI shear modulus of the matrix, precipitate
phase, and interface (Pa)mM; mP Poisson’s ratio of the matrix and
precipitate phasesqsteel; qp density of steel matrix and precipitate
phase (kg m–3)r interfacial energy between precipitated
particle/matrix (J m–2)rc chemical interfacial energy between
precipitated particle/matrix (J m–2)rst structural interfacial energy between
precipitated particle/matrix (J m–2)t kinematic viscosity (m2 s–1)uP volume fraction of precipitate phaseUi;k collision frequency between size i and size k
particles (m3 #�1 s–1)P supersaturationDE0 heat of solution of precipitate in a dilute
solution of matrix (J mol–1)DGV change of Gibbs free energy per unit
volume during precipitation (J m–3)DH heat of formation of precipitate (J mol–1)
SUPERSCRIPTS
� dimensionless value� average valueL, R, C left, right border-size, and center-size
particles in each size group
FUNCTIONS
ceilðxÞ the smallest integer which is not less than realnumber x
floorðxÞ the largest integer which is not larger thanreal number x
REFERENCES1. C. Zener: Trans. Am. Inst. Miner. Metall. Soc., 1948, vol. 175,
pp. 15–51.2. M. Hillert: Acta Metall., 1965, vol. 13, pp. 227–38.3. T. Gladman: Proc. Roy. Soc. London Ser. A, 1966, vol. 294,
pp. 298–309.4. P.A. Manohar, M. Ferry, and T. Chandra: ISIJ Int., 1998,
vol. 38, pp. 913–24.5. N. Yoshinaga, K. Ushioda, S. Akamatsu, and O. Akisue: ISIJ
Int., 1994, vol. 34, pp. 24–32.6. E.E. Kashif, K. Asakura, T. Koseki, and K. Shibata: ISIJ Int.,
2004, vol. 44, pp. 1568–75.7. S.C. Park, I.H. Jung, K.S. OH, and H.G. Lee: ISIJ Int., 2004,
vol. 44, pp. 1016–23.8. Y. Li, J.A. Wilson, D.N. Crowther, P.S. Mitchell, A.J. Craven,
and T.N. Baker: ISIJ Int., 2004, vol. 44, pp. 1093–1102.9. R.L. Klueh, K. Shiba, and M.A. Sokolov: J. Nucl. Mater., 2008,
vol. 377, pp. 427–37.10. J.Y. Choi, B.S. Seong, S.C. Baik, and H.C. Lee: ISIJ Int., 2002,
vol. 42, pp. 889–93.11. B.J. Lee: Metall. Mater. Trans. A, 2001, vol. 32A, pp. 2423–39.
1094—VOLUME 43A, MARCH 2012 METALLURGICAL AND MATERIALS TRANSACTIONS A
12. R.C. Hudd, A. Jones, and M.N. Kale: J. Iron Steel Inst., 1971,vol. 209, pp. 121–25.
13. T. Gladman: The Physical Metallurgy of Microalloyed Steels, TheInstitute of Materials, London, UK, 1997, pp. 82–130.
14. W.J. Liu and J.J. Jonas: Metall. Trans. A, 1989, vol. 20A,pp. 1361–74.
15. N. Gao and T.N. Baker: ISIJ Int., 1997, vol. 37, pp. 596–604.16. J.Y. Park, J.K. Park, and W.Y. Choo: ISIJ Int., 2000, vol. 40,
pp. 1253–59.17. K. Xu, B.G. Thomas, and R. O’Malley: Metall. Mater. Trans. A,
2011, vol. 42A, pp. 524–39.18. A.N. Kolmogorov: Izv. Akad. Nauk SSSR, Ser. Fiz., 1937, vol. 1,
pp. 335–38.19. W.A. Johnson and R.F. Mehl: Trans. AIME, 1939, vol. 135,
pp. 416–42.20. M. Avrami: J. Chem. Phys., 1939, vol. 7, pp. 1103–12.21. J.W. Christian: The Theory of Transformation in Metals and
Alloys, Part I, Pergamon Press, Oxford, UK, 1975.22. N.Y. Zolotorevsky, V.P. Pletenev, and Y.F. Titovets: Model.
Simul. Mater. Sci. Eng., 1998, vol. 6, pp. 383–91.23. H.C. Kang, S.H. Lee, D.H. Shin, K.J. Lee, S.J. Kim, and K.S.
Lee: Mater. Sci. Forum, 2004, vol. 449-452, pp. 49–52.24. M. Smoluchowski: Z. Phys. Chem., 1917, vol. 92, pp. 127–55.25. P.G. Saffman and J.S. Turner: J. Fluid Mech., 1956, vol. 1,
pp. 16–30.26. U. Lindborg and K. Torssell: Trans. TMS-AIME, 1968, vol. 242,
pp. 94–102.27. S.K. Friedlander and C.S. Wang: J. Colloid Interface Sci., 1966,
vol. 22, pp. 126–32.28. V.G. Levich: Physicochemical Hydrodynamics, Prentice-Hall, Inc,
Englewood Cliffs, NJ, 1962, p. 211.29. D. Turnbull and J.C. Fisher: J. Chem. Phys., 1949, vol. 17,
pp. 71–73.30. W.J. Liu and J.J. Jonas: Metall. Trans. A, 1989, vol. 20A,
pp. 689–97.31. W.J. Liu and J.J. Jonas: Metall. Trans. A, 1988, vol. 19A,
pp. 1403–13.32. W. Ostwald: Lehrbruck der allgemeinen Chemie, 1896, vol. 2,
Leipzig, Germany.33. I.M. Lifshitz and V.V. Slyozov: J. Phys. Chem. Solids, 1961,
vol. 19, pp. 35–50.34. C. Wagner: Zeitschrift Zeitschr. Elektrochemie, 1961, vol. 65,
pp. 581–91.35. C. Zener: J. Appl. Phys., 1949, vol. 20, pp. 950–53.36. K.C. Russell:Adv. Colloid Interface Sci., 1980, vol. 13, pp. 205–318.37. H.I. Aaronson, L. Laird, and K.R. Kinsman: Phase Transfor-
mations, Ed. H.I. Aaronson, ASM, Materials Park, OH, 1970,pp. 313–96.
38. M. Kahlweit: Adv. Colloid Interface Sci., 1975, vol. 5, pp. 1–35.39. J. Miyake and M.E. Fine: Scripta Metall. Mater., 1991, vol. 25,
pp. 191–94.40. R. Kampmann, H. Eckerlebe, and R. Wagner: Mater. Res. Soc.
Symp. Proc., 1987, vol. 57, pp. 526–42.41. L.M. Cheng, E.B. Hawbolt, and T.R. Meadowcroft: Metall.
Mater. Trans. A, 2000, vol. 31A, pp. 1907–16.42. F. Perrard, A. Deschamps, and P. Maugis: Acta Mater., 2007,
vol. 55, pp. 1255–66.43. J. Stavek and M. Sıpek: Cryst. Res. Technol., 1995, vol. 30,
pp. 1033–49.44. S. Muller, C. Wolverton, L.W. Wang, and A. Zunger: Europhys.
Lett., 2001, vol. 55, pp. 33–39.45. E. Clouet, M. Nastar, and C. Sigli: Phys. Rev. B, 2004, vol. 69,
p. 064109.46. C. Hin, B.D. Wirth, and J.B. Neaton: Phys. Rev. B, 2009, vol. 80,
p. 134118.47. R. Mukherjee, T.A. Abinandanan, and M.P. Gururajan: Acta
Mater., 2009, vol. 57, pp. 3947–54.48. R. Mukherjee, T.A. Abinandanan, and M.P. Gururajan: Scripta
Mater., 2010, vol. 62, pp. 85–88.49. Y. Tsukada, A. Shiraki, Y. Murata, S. Takaya, T. Koyama, and
M. Morinaga: J. Nucl. Mater., 2010, vol. 401, pp. 154–58.50. J. Svoboda, F.D. Fischer, P. Fratzl, and E. Kozeschnik: Mater.
Sci. Eng. A, 2004, vol. 385, pp. 166–74.51. E. Hozeschnik, J. Svoboda, P. Fratzl, and F.D. Fischer: Mater.
Sci. Eng. A, 2004, vol. 385, pp. 157–65.
52. E. Kozeschnik, J. Svoboda, R. Radis, and F.D. Fischer: Model.Simul. Mater. Sci. Eng., 2010, vol. 18, p. 015011.
53. E. Clouet, A. Barby, L. Lae, and G. Martin: Acta Mater., 2005,vol. 52, pp. 2313–25.
54. J. Lepinoux: Acta Mater., 2009, vol. 57, pp. 1086–94.55. J. Lepinoux: Philos. Mag., 2010, vol. 90, pp. 3261–80.56. L. Kampmann and M. Kahlweit: Ber. Bunsenges. Phys. Chem.,
1970, vol. 74, pp. 456–62.57. J. Zhang and H. Lee: ISIJ Int., 2004, vol. 44, pp. 1629–38.58. Y.J. Kwon, J. Zhang, and H.G. Lee: ISIJ Int., 2008, vol. 48,
pp. 891–900.59. N. Zhang and Z.C. Zheng: J. Phys. D: Appl. Phys., 2007, vol. 40,
pp. 2603–12.60. Y. Miki, B.G. Thomas, A. Denissov, and Y. Shimada: Ironmaker
Steelmaker, 1997, vol. 24, pp. 31–38.61. Y. Miki and B.G. Thomas: Metall. Mater. Trans. B, 1999,
vol. 30B, pp. 639–54.62. L. Zhang, S. Tanighchi, and K. Cai: Metall. Mater. Trans. B,
2000, vol. 31B, pp. 253–66.63. D. Sheng, M. Soder, P. Jonsson, and L. Jonsson: Scand. J.
Metall., 2002, vol. 31, pp. 134–47.64. M. Hallberg, P.G. Jonsson, T.L.I. Jonsson, and R. Eriksson:
Scand. J. Metall., 2005, vol. 34, pp. 41–56.65. T. Nakaoka, S. Taniguchi, K. Matsumoto, and S.T. Johansen:
ISIJ Int., 2001, vol. 41, pp. 1103–11.66. L. Zhang and W. Pluschkell: Ironmaking Steelmaking, 2003,
vol. 30, pp. 106–10.67. F. Gelbard, Y. Tambour, and J.H. Seinfeld: J. Colloid Interface
Sci., 1980, vol. 76, pp. 541–56.68. J.J. Wu and R.C. Flagan: J. Colloid Interface Sci., 1988, vol. 123,
pp. 339–52.69. H. Tozawa, Y. Kato, K. Sorimachi, and T. Nakanishi: ISIJ Int.,
1999, vol. 39, pp. 426–34.70. K. Higashitani, Y. Yamauchi, Y. Matsuno, and G. Hosokawa: J.
Chem. Eng. Jpn., 1983, vol. 116, pp. 299–304.71. F. Vodopivec: J. Iron Steel Inst., 1973, vol. 211, pp. 664–65.72. H.F. Beeghly: Ind. Eng. Chem., 1942, vol. 14, pp. 137–40.73. T. Gladman: The Physical Metallurgy of Microalloyed Steels, The
Institute of Materials, London, UK, 1997, pp. 206–07.74. H. Oikawa: Tetsu-to-Hagane, 1982, vol. 68, pp. 1489–97.75. W.C. Leslie, R.L. Rickett, C.L. Dotson, and C.S. Walton: Trans.
Am. Soc. Metall., 1954, vol. 46, pp. 1470–99.76. F.G. Wilson and T. Gladman: Int. Mater. Rev., 1988, vol. 33,
pp. 221–86.77. R. Radis and E. Kozeschnik: Mater. Sci. Forum, 2010, vols. 636–
637, pp. 605–11.78. R. Radis and E. Kozeschnik: Model. Simul. Mater. Sci. Eng.,
2010, vol. 18, p. 055003.79. F. Perrard, A. Deschamps, F. Bley, P. Donnadieu, and P.
Maugis: J. Appl. Crystallogr., 2006, vol. 39, pp. 473–82.80. J. Geise and C. Herzig: Z. Metallkd, 1985, vol. 76, pp. 622–26.81. T. Gladman: The Physical Metallurgy of Microalloyed Steels, The
Institute of Materials, London, UK, 1997, pp. 82–130.82. E.K. Strorms and N.H. Krikorian: J. Phys. Chem., 1960, vol. 64,
pp. 1471–77.83. S.M. He, N.H. Van Dijk, M. Paladugu, H. Schut, J. Kohlbrecher,
F.D. Tichelaar, and S. VanDer Zwaag:Phys. Rev. B, 2010, vol. 82,p. 174111.
84. F.F. Abraham: Homogeneous Nucleation Theory. AcademicPress, New York, NY, 1974.
85. B. Dutta and C.M. Sellars: Mater. Sci. Technol., 1987, vol. 3,pp. 197–206.
86. J.P. Michel and J.J. Jonas:ActaMetall., 1981, vol. 29, pp. 513–26.87. A. LE Bon, J. Rofes-Vernis, and C. Rossard: Met. Sci., 1975,
vol. 9, pp. 36–40.88. A.R. Jones, P.R. Howell, and B. Ralph: J. Mater. Sci., 1976,
vol. 11, pp. 1600–06.89. D. Turnbull: Impurities and Imperfections, Seminar Proceedings,
ASM, Cleveland, OH, 1955, pp. 121–44.90. W.J.Liu andJ.J. Jonas:Mater. Sci. Technol., 1989, vol. 5, pp. 8–12.91. J.H. Van Der Merwe: J. Appl. Phys., 1963, vol. 34, pp. 117–22.92. R.G. Baker and J. Nutting: Precipitation Process in Steels, Spe-
cial Report No. 64, The Iron and Steel Institute, London, UK,1959, pp. 1–22.
93. H. Shoji: Z. Kristallogr., 1931, vol. 77, pp. 381–410.
METALLURGICAL AND MATERIALS TRANSACTIONS A VOLUME 43A, MARCH 2012—1095

94. Z. Nishiyama: Science Report, Tohoku Imperial Univ., 1936,vol. 25, p. 79.
95. W.G. Burgers: Physica, 1934, vol. 1, pp. 561–86.96. N.W. Chase, Jr.: NIST-JANAF Thermochemical Tables, 4th ed.,
J. Phys. Chem. Ref. Data, 1998, pp. 1–1951.97. L.E. Toth: Transaction Metal Carbides and Nitrides, Academic
Press, New York, NY, 1971.
98. H.J. Frost and M.F. Ashby: Deformation-Mechanism Maps,Pergamon Press, Oxford, UK, 1982, pp. 20–70.
99. L.M. Cheng, E.B. Hawbolt, and T.R. Meadowcroft: Metall.Mater. Trans. A, 2000, vol. 31A, pp. 1907–16.
100. L.R. Zhao, K. Chen, Q. Yang, J.R. Rodgers, andS.H. Chiou: Surf. Coat. Technol., 2005, vol. 200, pp. 1595–99.
1096—VOLUME 43A, MARCH 2012 METALLURGICAL AND MATERIALS TRANSACTIONS A