Participatory Vulnerability Mapping: A case study on community...
7
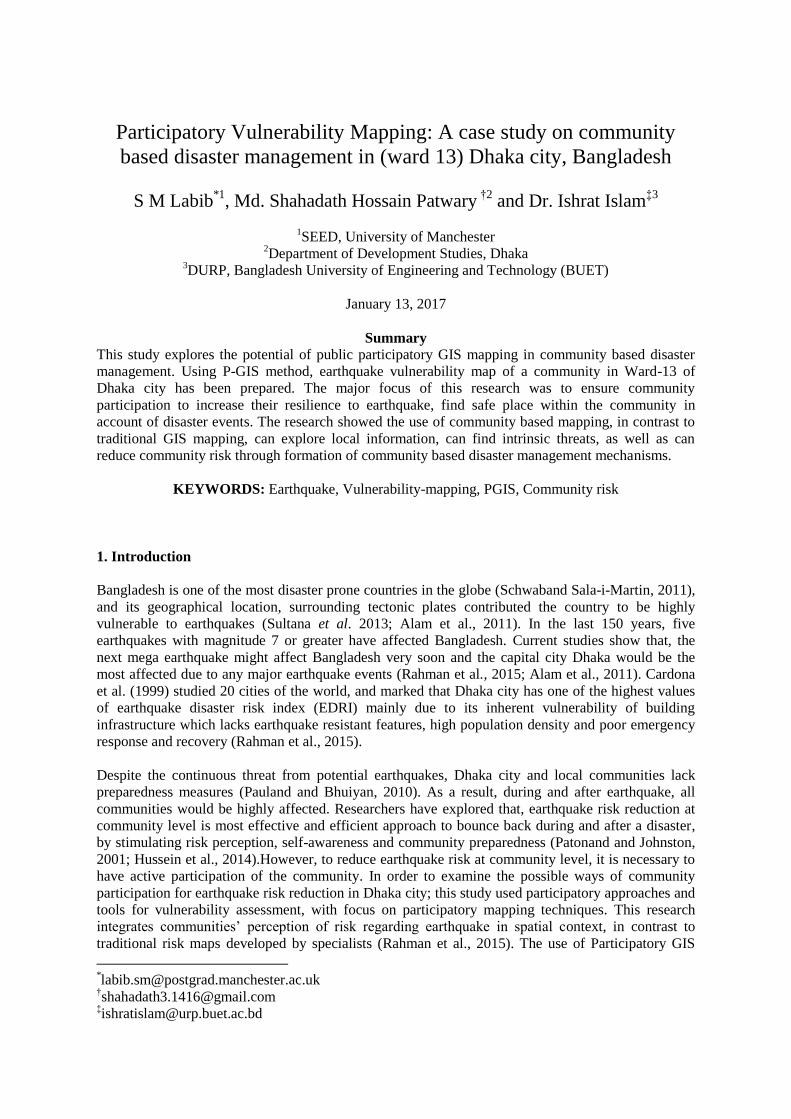
Participatory Vulnerability Mapping: A case study on community based disaster management in (ward 13) Dhaka city, Bangladesh S M Labib *1 , Md. Shahadath Hossain Patwary †2 and Dr. Ishrat Islam ‡3 1 SEED, University of Manchester 2 Department of Development Studies, Dhaka 3 DURP, Bangladesh University of Engineering and Technology (BUET) January 13, 2017 Summary This study explores the potential of public participatory GIS mapping in community based disaster management. Using P-GIS method, earthquake vulnerability map of a community in Ward-13 of Dhaka city has been prepared. The major focus of this research was to ensure community participation to increase their resilience to earthquake, find safe place within the community in account of disaster events. The research showed the use of community based mapping, in contrast to traditional GIS mapping, can explore local information, can find intrinsic threats, as well as can reduce community risk through formation of community based disaster management mechanisms. KEYWORDS: Earthquake, Vulnerability-mapping, PGIS, Community risk 1. Introduction Bangladesh is one of the most disaster prone countries in the globe (Schwaband Sala-i-Martin, 2011), and its geographical location, surrounding tectonic plates contributed the country to be highly vulnerable to earthquakes (Sultana et al. 2013; Alam et al., 2011). In the last 150 years, five earthquakes with magnitude 7 or greater have affected Bangladesh. Current studies show that, the next mega earthquake might affect Bangladesh very soon and the capital city Dhaka would be the most affected due to any major earthquake events (Rahman et al., 2015; Alam et al., 2011). Cardona et al. (1999) studied 20 cities of the world, and marked that Dhaka city has one of the highest values of earthquake disaster risk index (EDRI) mainly due to its inherent vulnerability of building infrastructure which lacks earthquake resistant features, high population density and poor emergency response and recovery (Rahman et al., 2015). Despite the continuous threat from potential earthquakes, Dhaka city and local communities lack preparedness measures (Pauland and Bhuiyan, 2010). As a result, during and after earthquake, all communities would be highly affected. Researchers have explored that, earthquake risk reduction at community level is most effective and efficient approach to bounce back during and after a disaster, by stimulating risk perception, self-awareness and community preparedness (Patonand and Johnston, 2001; Hussein et al., 2014).However, to reduce earthquake risk at community level, it is necessary to have active participation of the community. In order to examine the possible ways of community participation for earthquake risk reduction in Dhaka city; this study used participatory approaches and tools for vulnerability assessment, with focus on participatory mapping techniques. This research integrates communities’ perception of risk regarding earthquake in spatial context, in contrast to traditional risk maps developed by specialists (Rahman et al., 2015). The use of Participatory GIS * [email protected] † [email protected] ‡ [email protected]
Transcript of Participatory Vulnerability Mapping: A case study on community...
Participatory Vulnerability Mapping: A case study on community
based disaster management in (ward 13) Dhaka city, Bangladesh
S M Labib*1
, Md. Shahadath Hossain Patwary †2
and Dr. Ishrat Islam‡3
1SEED, University of Manchester
2Department of Development Studies, Dhaka
3DURP, Bangladesh University of Engineering and Technology (BUET)
January 13, 2017
Summary This study explores the potential of public participatory GIS mapping in community based disaster
management. Using P-GIS method, earthquake vulnerability map of a community in Ward-13 of
Dhaka city has been prepared. The major focus of this research was to ensure community
participation to increase their resilience to earthquake, find safe place within the community in
account of disaster events. The research showed the use of community based mapping, in contrast to
traditional GIS mapping, can explore local information, can find intrinsic threats, as well as can
reduce community risk through formation of community based disaster management mechanisms.
KEYWORDS: Earthquake, Vulnerability-mapping, PGIS, Community risk
1. Introduction
Bangladesh is one of the most disaster prone countries in the globe (Schwaband Sala-i-Martin, 2011),
and its geographical location, surrounding tectonic plates contributed the country to be highly
vulnerable to earthquakes (Sultana et al. 2013; Alam et al., 2011). In the last 150 years, five
earthquakes with magnitude 7 or greater have affected Bangladesh. Current studies show that, the
next mega earthquake might affect Bangladesh very soon and the capital city Dhaka would be the
most affected due to any major earthquake events (Rahman et al., 2015; Alam et al., 2011). Cardona
et al. (1999) studied 20 cities of the world, and marked that Dhaka city has one of the highest values
of earthquake disaster risk index (EDRI) mainly due to its inherent vulnerability of building
infrastructure which lacks earthquake resistant features, high population density and poor emergency
response and recovery (Rahman et al., 2015).
Despite the continuous threat from potential earthquakes, Dhaka city and local communities lack
preparedness measures (Pauland and Bhuiyan, 2010). As a result, during and after earthquake, all
communities would be highly affected. Researchers have explored that, earthquake risk reduction at
community level is most effective and efficient approach to bounce back during and after a disaster,
by stimulating risk perception, self-awareness and community preparedness (Patonand and Johnston,
2001; Hussein et al., 2014).However, to reduce earthquake risk at community level, it is necessary to
have active participation of the community. In order to examine the possible ways of community
participation for earthquake risk reduction in Dhaka city; this study used participatory approaches and
tools for vulnerability assessment, with focus on participatory mapping techniques. This research
integrates communities’ perception of risk regarding earthquake in spatial context, in contrast to
traditional risk maps developed by specialists (Rahman et al., 2015). The use of Participatory GIS

(PGIS) has been the concern of this paper and it demonstrated the ways of public engagement and
stakeholders’ involvement in building resilient community.
2. Methods
The study was conducted at community level (Name: Maddhya Monipur) within ward 13 of Dhaka
city corporation (DCC) (Figure 1). Maddhya Monipur selected as study area, as this area has been
marked as most vulnerable area in context of building damage probability due to earthquake incident.
According to the category of “Number of buildings completely damage” this area shows highest
mark. Around 300-600 buildings of this ward would be completely or extensively damaged (CDMP,
2010).
Figure1: Selected community (MaddhyaMonipur) within DCC
In this research, earthquake vulnerability map was prepared for this community, by the people of this
community. Vulnerability Map is an illustration of vulnerability for a community in terms of social,
physical, economic context toward a specific hazard; in this case it is earthquake. The process of
mapping started with formation of two Focus groups; consist of 20 members for each group, and the
group members were selected randomly. However, the groups were consisted of people from different
ages, education and occupation. After formation of the groups, they made a transect walk in the study
area, and make notes, about the resources they have in terms of place for refuge (i.e. Open ground,
near pond area) in time of earthquake shocks. Such information is later drawn on a sketch map (i.e.
Resource map). In addition, while doing the walk, the members have pointed some buildings and
roads they found at risk. In this case, they have used their indigenous knowledge about the buildings
and local observations; such as: when they were built, how old they are? Were they built on water
bodies (filling with sand)? Did they done any piling activities? Do these buildings have proper access
to roads? Did these buildings have maintained setbacks and followed building construction rules
(BCR)? Some photographs were taken during the transect walk (Figure 2). All these are very local
information, only the community can explore these as insider. Their participation ensures these
aspects are considered when developing vulnerability maps. After the walk, there were two group
discussion sessions with two different groups and each of them have drawn resource map and made
rough vulnerability sketch map on paper. While mapping the vulnerability, they got access to hard
map (Figure 1) of the area by City Corporation and they were aided with satellite image of the area

(Figure 3).
Figure 2: Conditions of buildings and roads as identified by the participants during transect walk
Figure 3: Satellite map to aid the groups to identify their area (Source: Google Earth, 2014)

Two draft sketch maps were then merged to produce single vulnerability map, and an extensive group
discussion were taken place, where the two groups argue and finally agreed with each other regarding
the vulnerability zones within the locality. After finalizing the vulnerability map, a validation process
taken place, where some of the members along with the researcher showed the maps to random
people of the study area, and get their comments regarding the accuracy and acceptability of the map
(Figure 4).
Figure 4: Validating the vulnerability map with other members of the community.
4. Results and discussion
The result of these PGIS mapping showed in figure 5. Figure 5a illustrates the local resources, and
identified the area within the community where people can take shelter during or after earthquake
(The green box areas); additionally the resource map shows the location of school fields (Black
boxes), where it is possible to make earthquake preparedness drills. Furthermore, the main outcome
of this process is the vulnerability map (Figure 5b). Vulnerability map shows that people in the
locality found majority of the areas are vulnerable to earthquake events. In the map, they sketch the
roads and building zones with different colors to depict different level of vulnerability. As illustrated
in figure 5(b), the most vulnerable roads are the narrow roads with very limited accessibility, and the
main reasons identified by the groups are; people are not willing to provide space for roads, no layout
plan of the study area. In case of building vulnerability, the participatory groups identified old
buildings (no repair activities), high density buildings with limited accessibility and violation of BCR
are the reasons for the increased vulnerability conditions. PGIS process provided some zones (with a
fuzzy boundary), where buildings and roads are highly vulnerable, as agreed by the participants. As
these areas were sketched and not integrated with formal GIS data, issues related to accuracy and
precision emerged. However the process identifies and includes the inherent problems of the
community come in light with the participation of different people in the process of mapping and
validating the maps. Thus, not only the participants but the whole community were informed about
potential earthquake events, and where they can take shelter and how they can contribute before,
during and after an earthquake event.

Figure 5: (a) Resource map of the area, showing place of refugee (b) vulnerability map of the area.

The main success of the research was to make people aware about their own conditions and risks. At
the final stage of the project, the maps were disseminated at the local schools, Mosques, and people
were informed about the vulnerability conditions. As well as conceptual model for community based
disaster management committee (CDMC) has been proposed to them, and with the help of local
volunteers the CDMC was formed and come in action. The CDMC has a core team consist of
members listed in Table 1.
Table 1: Potential members of CDMC
Members for CDMC Minimum Possible Numbers
School Committee and teachers 3
Land and building owners / CBO members 3
Influential people 2
Cooperatives executives 2
Mosque Committee members and Imams 2*
* Number of mosques/other religious institutions
These members have different functions, and they work with several volunteer teams formed by the
members of participatory mapping groups. There are eight volunteer teams, they are provided in
figure 6.
Figure 6: Formation of community Volunteer Teams
5. Conclusion
Community participation is one essential agenda of current sustainable development goals, it helps
building community resilience. And community participation can ensure, the public are involved
properly and their thoughts are integrated in building resilience (Kienberger, S. and Steinbruch,
2005). This research found, use of participatory GIS to map vulnerability, not only help to identify
inherent vulnerability of the community to earthquake events, it can also encourage the community to
form their own resilience and management team. Therefore, more active participatory method should
be explored in future research regarding disaster management and participatory methods, especially
focusing on use of GIS tools in participatory environment.
Acknowledgements
The authors acknowledge the contributions of Md. Zahidur Rahaman, who was directly involved in
this particular area, while doing the focus group discussion and vulnerability mapping. In addition,
the authors acknowledge the contribution of the community member of Maddhya Monipur.
Biography
S.M. Labib is a Post-graduate student, at SEED in University of Manchester; his research interest
includes use of GIS in transportation, disaster management, and environmental modelling. He also
keens to work in the area of thermal remote sensing.
Md. Shahadath Hossain Patwary is doing is Masters in Development studies, from Department of
development studies, in Dhaka University. His research interests are urban housing, environmental
management and urban transportation planning.
Dr Ishrat Islam is the head of the department, and professor in the department of urban and regional
planning, Bangladesh University of Engineering and technology. Her research interests span Land use
planning, disaster management, and urban design.
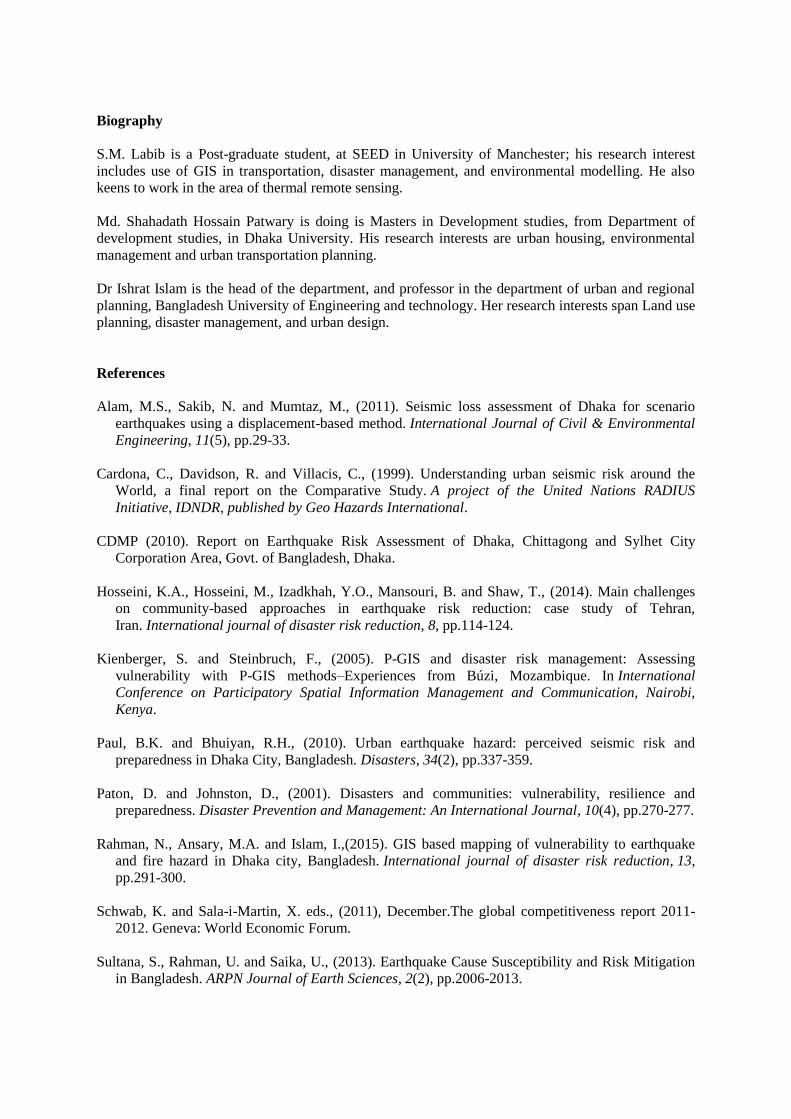
References
Alam, M.S., Sakib, N. and Mumtaz, M., (2011). Seismic loss assessment of Dhaka for scenario
earthquakes using a displacement-based method. International Journal of Civil & Environmental
Engineering, 11(5), pp.29-33.
Cardona, C., Davidson, R. and Villacis, C., (1999). Understanding urban seismic risk around the
World, a final report on the Comparative Study. A project of the United Nations RADIUS
Initiative, IDNDR, published by Geo Hazards International.
CDMP (2010). Report on Earthquake Risk Assessment of Dhaka, Chittagong and Sylhet City
Corporation Area, Govt. of Bangladesh, Dhaka.
Hosseini, K.A., Hosseini, M., Izadkhah, Y.O., Mansouri, B. and Shaw, T., (2014). Main challenges
on community-based approaches in earthquake risk reduction: case study of Tehran,
Iran. International journal of disaster risk reduction, 8, pp.114-124.
Kienberger, S. and Steinbruch, F., (2005). P-GIS and disaster risk management: Assessing
vulnerability with P-GIS methods–Experiences from Búzi, Mozambique. In International
Conference on Participatory Spatial Information Management and Communication, Nairobi,
Kenya.
Paul, B.K. and Bhuiyan, R.H., (2010). Urban earthquake hazard: perceived seismic risk and
preparedness in Dhaka City, Bangladesh. Disasters, 34(2), pp.337-359.
Paton, D. and Johnston, D., (2001). Disasters and communities: vulnerability, resilience and
preparedness. Disaster Prevention and Management: An International Journal, 10(4), pp.270-277.
Rahman, N., Ansary, M.A. and Islam, I.,(2015). GIS based mapping of vulnerability to earthquake
and fire hazard in Dhaka city, Bangladesh. International journal of disaster risk reduction, 13,
pp.291-300.
Schwab, K. and Sala-i-Martin, X. eds., (2011), December.The global competitiveness report 2011-
2012. Geneva: World Economic Forum.
Sultana, S., Rahman, U. and Saika, U., (2013). Earthquake Cause Susceptibility and Risk Mitigation
in Bangladesh. ARPN Journal of Earth Sciences, 2(2), pp.2006-2013.