PARTICIPATION IN SWIMMING BY AUSTRALIAN CHILDREN 2003 …€¦ · · 2016-12-07PARTICIPATION IN...
23
PARTICIPATION IN SWIMMING BY AUSTRALIAN CHILDREN 2003 – 2012 Report prepared by the Australian Sports Commission
Transcript of PARTICIPATION IN SWIMMING BY AUSTRALIAN CHILDREN 2003 …€¦ · · 2016-12-07PARTICIPATION IN...

PARTICIPATION IN SWIMMING BY
AUSTRALIAN CHILDREN 2003 – 2012
Report prepared by the Australian Sports Commission
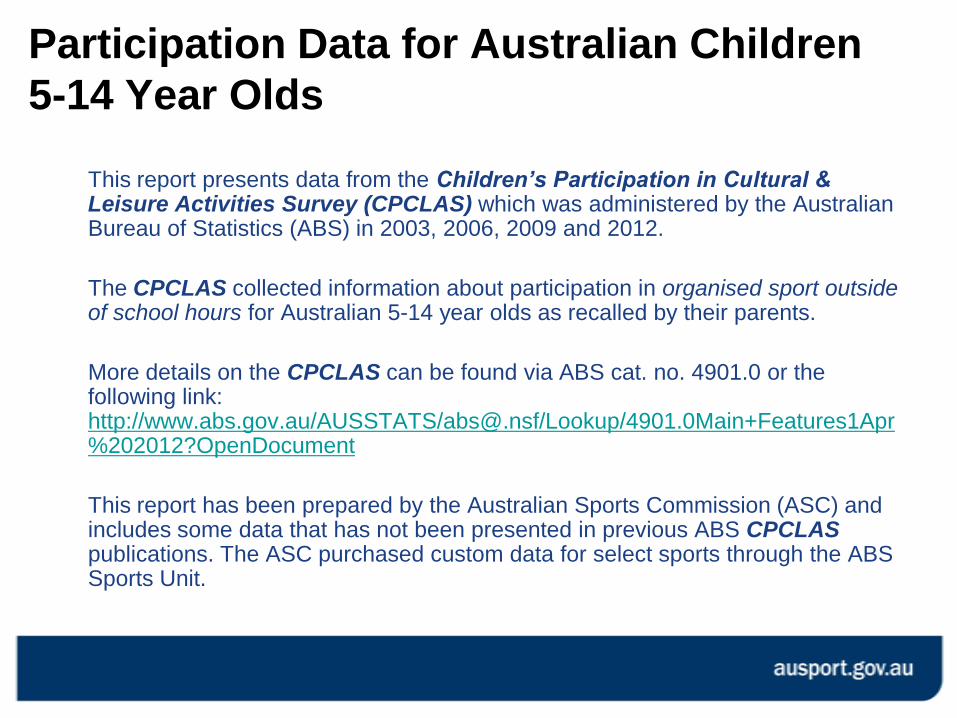
This report presents data from the Children’s Participation in Cultural & Leisure Activities Survey (CPCLAS) which was administered by the Australian Bureau of Statistics (ABS) in 2003, 2006, 2009 and 2012.
The CPCLAS collected information about participation in organised sport outside of school hours for Australian 5-14 year olds as recalled by their parents.
More details on the CPCLAS can be found via ABS cat. no. 4901.0 or the following link: http://www.abs.gov.au/AUSSTATS/[email protected]/Lookup/4901.0Main+Features1Apr%202012?OpenDocument
This report has been prepared by the Australian Sports Commission (ASC) and includes some data that has not been presented in previous ABS CPCLAS publications. The ASC purchased custom data for select sports through the ABS Sports Unit.
Participation Data for Australian Children
5-14 Year Olds

The Children’s Participation in Cultural & Leisure
Activities Survey asked parents:
Which sports has [Child name] played or trained for outside of school hours since this time last year?
In each year the survey was administered, a number of
parents responded:
Swimming*
The Children’s Participation in Cultural &
Leisure Activities Survey
* In this report the definition of swimming participation also includes diving, but excludes triathlon.

Data from the CPCLAS should not be directly compared with results from
other sport participation surveys, such as the Exercise Recreation And Sport
Survey (ERASS) or the ABS adult sport participation surveys, without
considering the difference in methodology, scope and years.
It should be noted that the CPCLAS data: • Is based upon a different data collection process to the ERASS adults’ data
• Is not collected in the same years as the ERASS and ABS adults’ data
• Reflects parent responses, while the ERASS and ABS adults’ data reflects participant responses
• Reflects participation outside of school hours only, while the ERASS and ABS adults’ data also
included measures of total participation
• Reflects organised participation only, while information on non-organised participation data was
also collected for the ERASS and ABS adults
• Reports different participation frequency categories to the ERASS adults data (e.g. Regular
participation for the children’s data is defined as 27 times or more a year, while for the adults data
is defined as 26 times or more a year)
Explanatory notes for interpreting the
Children’s Participation Data

Some of the data in this report has not been publically released by the ABS. The ASC sourced custom data tables
from the ABS containing information relevant for sports. Please note that the ASC did not have access to the raw data.
As the ABS reported the total survey sample size (sample size in 2003 = 8,900; sample size in 2006 = 8,682; sample
size in 2009 = 5,825; sample size in 2012 = 7,300), it was possible to compare the proportion of Australian children
participating in a sport across the four time periods with significance testing. The ABS, however, did not report the
sample sizes for the demographic (e.g. age or gender) categories, so it was not possible to conduct significance tests
on demographic subgroups. As such, the interpretation of data relating to the demographic subgroups in this report is
indicative only.
The ABS does not publically release data with high Relative Standard Errors (RSEs). It is important to note that all the
swimming data presented in this report was associated with acceptable RSEs. For further information* related to
RSEs associated with the data please refer to ABS cat. no. 4901.0.
Please note that scales may differ between charts.
Australian children’s population (5–14 year olds) by year from ABS population estimates:
2003: 2,647,500 2006: 2,664,700
2009: 2,722,500 2012: 2,786,100
Participation frequency definitions:
• Annual defined as participating in a given sport at least once a year
• Regular defined as participating in a given sport at least 27 times a year
• Non-regular defined as participating in a given sport at least once but less than 27 times a year
*http://www.abs.gov.au/AUSSTATS/[email protected]/Latestproducts/4901.0Technical%20Note1Apr%202012?opendocument&tabname=Notes&prodn
o=4901.0&issue=Apr%202012&num=&view=
How to interpret the Children’s Participation
Data
Summary of Trends

Between 2003 and 2012 there was a significant increase in children’s organised
participation in the following sports:
• Gymnastics and rugby union had a significant increase in annual, regular and non-regular
participation rates.
• Rugby union had a significant increase in annual and non-regular participation rates.
• Touch football and football had a significant increase in the non-regular participation rate.
Between 2003 and 2012 there was a significant decrease in children’s organised
participation in the following sports:
• Hockey had a significant decrease in annual, regular and non-regular participation rates.
• Netball, tennis and softball had a significant decrease in annual and regular participation
rates.
• Athletics had a significant decrease in the annual participation rate.
• Cricket, touch football and golf had a significant decrease in the regular participation rate.
For information on general trends in children’s organised participation across sports please refer to the following ABS
reports:
1. http://www.ausport.gov.au/__data/assets/pdf_file/0011/276914/ABS_-_Childrens_participation_in_organised_-_2003_-
_2006.pdf
2. http://www.ausport.gov.au/__data/assets/pdf_file/0009/197829/childrens_participation_in_organised_sport_2003_2006_surv
ey_multi-variate_analysis.pdf
Summary of General Trends in Children’s
Participation Among 21 Selected Sports

Organised swimming participation Between 2003 and 2012:
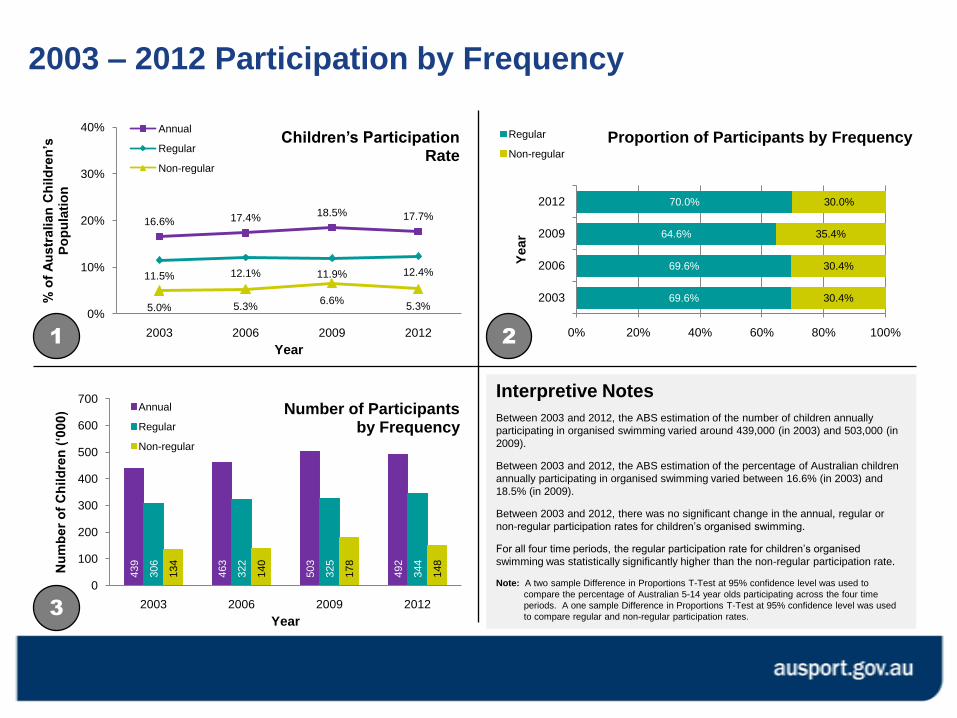
• The ABS estimation of the number of children annually participating in organised swimming varied around 439,000 (in 2003) and 503,000 (in 2009).
• The ABS estimation of the percentage of Australian children annually participating in organised swimming varied between 16.6% (in 2003) and 18.5% (in 2009).
• There was no significant change in the annual, regular or non-regular participation rates for children’s organised swimming.
Comparison of regular v. non-regular organised swimming participationFor all four time periods, the regular participation rate for children’s organised swimming was statistically significantly higher than the non-regular participation rate.
Demographic analysis of organised swimming participationFor all four time periods, the ABS estimated that slightly more girls than boys participated in swimming annually and regularly.
The annual and regular participation rate in organised swimming decreased with age. For all four time periods, the 12-14 year old category had the lowest participation rate and the 5-8 year old category had the highest participation rate.
Summary of General Trends in Children’s
Swimming Participation

Organised* Participation in
Swimming^
* The CPCLAS refers to "organised sport" as a sport which is played or trained for outside of school hours and is
organised by a school, club or association
^ Includes swimming and diving. Excludes triathlon.
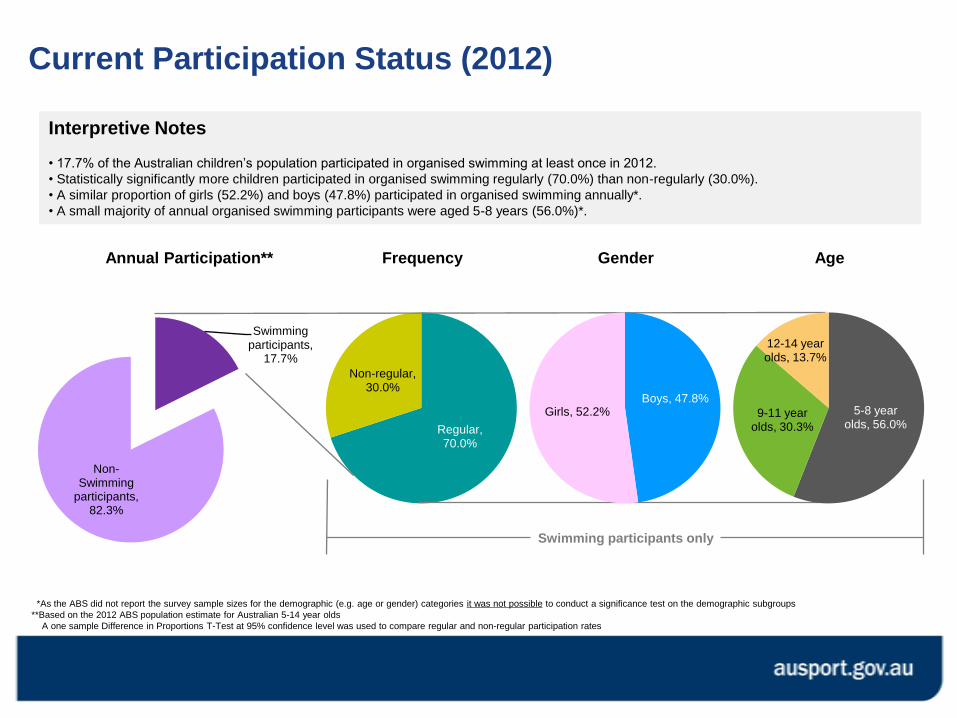
Current Participation Status (2012)
Regular, 70.0%
Non-regular, 30.0%
Frequency
Swimming participants,
17.7%
Non-Swimming
participants, 82.3%
Annual Participation**
Boys, 47.8%Girls, 52.2%
Gender
5-8 year olds, 56.0%
9-11 year olds, 30.3%
12-14 year olds, 13.7%
Age
Swimming participants only
Interpretive Notes
• 17.7% of the Australian children’s population participated in organised swimming at least once in 2012.
• Statistically significantly more children participated in organised swimming regularly (70.0%) than non-regularly (30.0%).
• A similar proportion of girls (52.2%) and boys (47.8%) participated in organised swimming annually*.
• A small majority of annual organised swimming participants were aged 5-8 years (56.0%)*.
*As the ABS did not report the survey sample sizes for the demographic (e.g. age or gender) categories it was not possible to conduct a significance test on the demographic subgroups
**Based on the 2012 ABS population estimate for Australian 5-14 year olds
A one sample Difference in Proportions T-Test at 95% confidence level was used to compare regular and non-regular participation rates
439
463
503
492
306
322
325
344
134
140
178
148
0
100
200
300
400
500
600
700
2003 2006 2009 2012
Nu
mb
er
of
Ch
ild
ren
(‘0
00)
Year
Number of Participantsby Frequency
Annual
Regular
Non-regular
2003 – 2012 Participation by Frequency
16.6% 17.4%18.5% 17.7%
11.5% 12.1% 11.9% 12.4%
5.0% 5.3%6.6%
5.3%0%
10%
20%
30%
40%
2003 2006 2009 2012
% o
f A
ustr
ali
an
Ch
ild
ren
’s
Po
pu
lati
on
Year
Children’s ParticipationRate
Annual
Regular
Non-regular
1 2
3
69.6%
69.6%
64.6%
70.0%
30.4%
30.4%
35.4%
30.0%
2003
2006
2009
2012
0% 20% 40% 60% 80% 100%
Year
Proportion of Participants by FrequencyRegular
Non-regular
Interpretive Notes
Between 2003 and 2012, the ABS estimation of the number of children annually
participating in organised swimming varied around 439,000 (in 2003) and 503,000 (in
2009).
Between 2003 and 2012, the ABS estimation of the percentage of Australian children
annually participating in organised swimming varied between 16.6% (in 2003) and
18.5% (in 2009).
Between 2003 and 2012, there was no significant change in the annual, regular or
non-regular participation rates for children’s organised swimming.
For all four time periods, the regular participation rate for children’s organised
swimming was statistically significantly higher than the non-regular participation rate.
Note: A two sample Difference in Proportions T-Test at 95% confidence level was used to
compare the percentage of Australian 5-14 year olds participating across the four time
periods. A one sample Difference in Proportions T-Test at 95% confidence level was used
to compare regular and non-regular participation rates.

Annual Participation
Demographic Analysis

48.6%
48.8%
47.7%
47.8%
51.4%
51.2%
52.3%
52.2%
2003
2006
2009
2012
0% 20% 40% 60% 80% 100%
Year
Proportion of Annual Participantsby Gender
Boys
Girls
Annual Participation by Gender
214
226
240
235
226
237
263
257
0
100
200
300
400
500
600
700
2003 2006 2009 2012
Nu
mb
er
of
Ch
ild
ren
(‘0
00)
Year
Number of Annual Participantsby Gender
Boys
Girls
Interpretive Notes
The data presented on this slide appears to indicate the following:
• For annual organised swimming participation, the proportion of
girls to boys was relatively consistent between 2003 and 2012, with
a little over half of participating children being girls.
• Over the years, the number of girls and boys participating in
organised swimming increased from 2003 to 2009 and then was
steady from 2009 to 2012. Unfortunately, with the data provided to
the ASC by the ABS, it was not possible to statistically examine
whether these changes over time were significant.
21
3
15.7% 16.5% 17.2% 16.5%
17.5% 18.2%19.8% 18.9%
0%
10%
20%
30%
40%
2003 2006 2009 2012
% o
f A
ustr
ali
an
Bo
ys/G
irls
Year
Annual Participation Rateby Gender
Boys
Girls

Annual Participation by Age
55.7%
55.0%
55.6%
56.0%
31.9%
30.2%
30.6%
30.3%
12.4%
14.8%
13.8%
13.7%
2003
2006
2009
2012
0% 20% 40% 60% 80% 100%
Year
Proportion of Annual Participantsby Age
5-8 year olds
9-11 year olds
12-14 year olds
245
254
280
276
140
140
154
1495
5
68
70
67
0
100
200
300
400
500
600
700
2003 2006 2009 2012
Nu
mb
er
of
Ch
ild
ren
(‘0
00)
Year
Number of Annual Participantsby Age
5-8 year olds
9-11 year olds
12-14 year olds
Interpretive Notes
The data presented on this slide appears to indicate the following:
• The annual participation rate for organised swimming decreased
with age. For all four time periods, the 12-14 year old category had
the lowest annual participation rate and the 5-8 year old category
had the highest annual participation rate.
• From 2003 to 2012, a little over half of annual swimming
participants were 5-8 years of age.
21
3
23.5%
24.6%26.2%
24.5%
17.4%19.3%
18.8% 18.1%
6.8%8.3% 8.3% 8.0%
0%
10%
20%
30%
40%
2003 2006 2009 2012
% o
f A
ustr
ali
an
Ch
ild
ren
F
rom
E
ach
Ag
e C
ate
go
ry
Year
Annual Participation Rateby Age
5-8 year olds
9-11 year olds
12-14 year olds
Regular Participation
Demographic Analysis
48.9%
48.0%
44.3%
47.1%
51.1%
52.0%
55.7%
52.9%
2003
2006
2009
2012
0% 20% 40% 60% 80% 100%
Year
Proportion of Regular Participantsby Gender
Boys
Girls
Regular Participation by Gender
149
155
144
162
156
167
181
182
0
100
200
300
400
500
600
700
2003 2006 2009 2012
Nu
mb
er
of
Ch
ild
ren
(‘0
00)
Year
Number of Regular Participantsby Gender
Boys
Girls
Interpretive Notes
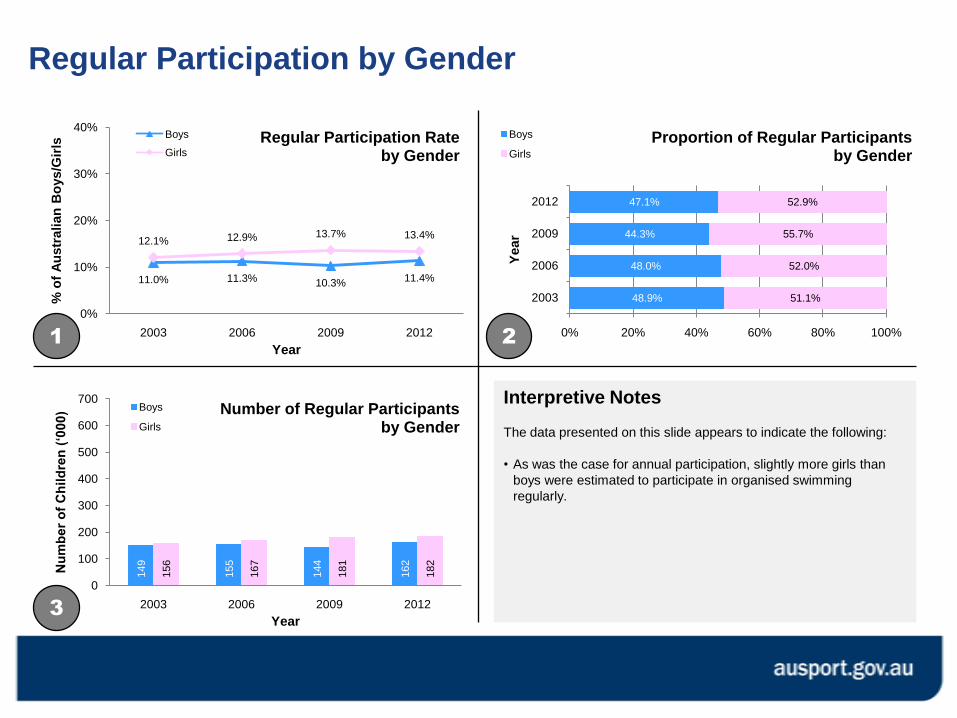
The data presented on this slide appears to indicate the following:
• As was the case for annual participation, slightly more girls than
boys were estimated to participate in organised swimming
regularly.
21
3
11.0% 11.3% 10.3% 11.4%
12.1% 12.9% 13.7% 13.4%
0%
10%
20%
30%
40%
2003 2006 2009 2012
% o
f A
ustr
ali
an
Bo
ys/G
irls
Year
Regular Participation Rateby Gender
Boys
Girls

Regular Participation by Age
56.3%
53.6%
55.3%
57.7%
31.0%
31.5%
30.4%
30.5%
12.7%
14.8%
14.3%
11.8%
2003
2006
2009
2012
0% 20% 40% 60% 80% 100%
Year
Proportion of Regular Participantsby Age
5-8 year olds
9-11 year olds
12-14 year olds
172
173
180
199
95
102
99
10539 48
46
41
0
100
200
300
400
500
600
700
2003 2006 2009 2012
Nu
mb
er
of
Ch
ild
ren
(‘0
00)
Year
Number of Regular Participantsby Age
5-8 year olds
9-11 year olds
12-14 year olds
Interpretive Notes
The data presented on this slide appears to indicate the following:
• The regular participation rate in organised swimming for each age
category was relatively consistent across the years.
• The proportion of regular swimming participants from each age
group was similar to the annual participation analysis.
21
3
16.5% 16.7% 16.9% 17.7%
11.8% 12.6% 12.1% 12.7%
4.9% 5.8% 5.5% 4.8%0%
10%
20%
30%
40%
2003 2006 2009 2012
% o
f A
ustr
ali
an
Ch
ild
ren
F
rom
E
ach
Ag
e C
ate
go
ry
Year
Regular Participation Rateby Age
5-8 year olds
9-11 year olds
12-14 year olds

Sport Comparison

2012
RankingSPORT
2003
Ranking
2012
RankingSPORT
2003
Ranking
1 Swimming 1 - 12 Touch Football 13 1
2 Football 2 - 13 Hockey 11 2
3 Australian Football 6 3 14 Softball 12 2
4 Netball 3 1 15 Surf Lifesaving 16 1
5 Basketball 5 - 16 Horse activities 15 1
6 Tennis 4 2 17 Golf 17 -
7 Gymnastics 9 2 18 Baseball 18 -
8 Cricket 7 1 19 Volleyball 19 -
9 Rugby League 10 1 20 Surf sports 21 1
10 Track and Field Athletics 8 2 21 Cycling 20 1
11 Rugby Union 14 3
The Table represents a ranking of 21 selected sports
Table sorted on 2012 rankings
#1 ranking = sport with the highest participation among the 21 selected sports
Ranking of Selected Sports According to Annual
Participation

0%
2%
4%
6%
8%
10%
12%
14%
16%
18%
% o
f A
us
trali
an
5-1
4 Y
ear
Old
s
Annual
Regular
Non-regular
2012 Annual v. Regular v. Non-regular Participation Rates
for Selected Sports
Annual defined as participating in a given sport at least once a year
Regular defined as participating in a given sport at least 27 times a year
Non-regular defined as participating in a given sport at least once but less than 27 times a year
NB. Sports are sorted on annual participation rates in descending order
In 2012 sports with regular organised participation rates statistically significantly higher than
non-regular organised participation rates were swimming, football, netball, basketball,
tennis, gymnastics, rugby league, horse activities and baseball
In 2012 sports with non-regular organised participation rates statistically significantly higher
than regular organised participation rates were cricket, athletics, touch football, surf
lifesaving and golf
Note: A one sample Difference in Proportions T-Test at 95% confidence level was used to compare regular and non-regular participation rates.

0%
2%
4%
6%
8%
10%
12%
14%
16%
18%
% o
f A
us
trali
an
5-1
4 Y
ear
Old
s
2003
2012
2003 v. 2012 Annual Participation Rates for Selected Sports
Annual defined as participating in a given sport at least once a yearNB. Sports are sorted on 2012 annual participation rates in descending order
Between 2003 and 2012 there was a statistically significant increase in children
annually participating in organised gymnastics, rugby league and rugby union.
In this same period there was a statistically significant decrease in children annually
participating in organised netball, tennis, athletics, hockey and softball.
Note: A two sample Difference in Proportions T-Tests at 95% confidence level was used to compare the percentage of Australian 5-14 year olds participating in 2003 and 2012.

0%
2%
4%
6%
8%
10%
12%
14%
% o
f A
us
trali
an
5-1
4 Y
ear
Old
s
2003
2012
2003 v. 2012 Regular Participation Rates for Selected
Sports
Regular defined as participating in a given sport at least 27 times a yearNB. Sports are sorted on 2012 regular participation rates in descending order
Between 2003 and 2012 there was a significant increase in children regularly
participating in organised gymnastics and rugby union.
In this same period there was a significant decrease in children regularly participating in
organised netball, tennis, cricket, hockey, softball, touch football and golf.
Note: A two sample Difference in Proportions T-Tests at 95% confidence level was used to compare the percentage of Australian 5-14 year olds participating in 2003 and 2012.

0%
2%
4%
6%
8%
10%
% o
f A
ustr
ali
an
5-1
4 Y
ear
Old
s
2003
2012
2003 v. 2012 Non-regular Participation Rates for Selected
Sports
Non-regular defined as participating in a given sport at least once but less than 27 times a year
NB. Sports are sorted on 2012 non-regular participation rates in descending order
Between 2003 and 2012 there was a significant increase in children non-regularly
participating in organised football, gymnastics, touch football, rugby league
and rugby union.
In this same period there was a significant decrease in children non-regularly
participating in organised hockey.
Note: A two sample Difference in Proportions T-Tests at 95% confidence level was used to compare the percentage of Australian 5-14 year olds participating in 2003 and 2012.


![The Longitudinal Study of Australian Children 2012–13 [145.1 kB]](https://static.fdocuments.net/doc/165x107/588874131a28ab30728c3eba/the-longitudinal-study-of-australian-children-201213-1451-kb.jpg)