Partially Enclosed Vertical Axis Wind Turbine · Partially Enclosed Vertical Axis Wind Turbine ....
85
WORCESTER POLYTECHNIC INSTITUTE PROJECT ID: BJS – WS14 Partially Enclosed Vertical Axis Wind Turbine Major Qualifying Project 2013-2014 Paige Archinal, Jefferson Lee, Ryan Pollin, Mark Shooter 4/24/2014 1
Transcript of Partially Enclosed Vertical Axis Wind Turbine · Partially Enclosed Vertical Axis Wind Turbine ....
WORCESTER POLYTECHNIC INSTITUTE PROJECT ID: BJS – WS14
Partially Enclosed Vertical Axis Wind Turbine
Major Qualifying Project 2013-2014
Paige Archinal, Jefferson Lee, Ryan Pollin, Mark Shooter
4/24/2014
1

Acknowledgments
We would like to thank Professor Brian Savilonis for his guidance throughout this project. We
would like to thank Herr Peter Hefti for providing and maintaining an excellent working environment
and ensuring that we had everything we needed. We would especially like to thank Kevin Arruda and
Matt Dipinto for their manufacturing expertise, without which we would certainly not have succeeded in
producing a product.
2

Abstract
Vertical Axis Wind Turbines (VAWTs) are a renewable energy technology suitable for low-speed
and multidirectional wind environments. Their smaller scale and low cut-in speed make this technology
well-adapted for distributed energy generation, but performance may still be improved. The addition of
a partial enclosure across half the front-facing swept area has been suggested to improve the coefficient
of performance, but it undermines the multidirectional functionality. To quantify its potential gains and
examine ways to mitigate the losses of unidirectional functionality, a Savonius blade VAWT with an
independently rotating enclosure with a passive tail vane control was designed, assembled, and
experimentally tested. After analyzing the output of the system under various conditions, it was
concluded that this particular enclosure shape drastically reduces the coefficient of performance of a
VAWT with Savonius blades. However, the passive tail vane rotated the enclosure to the correct
orientation from any offset position, enabling the potential benefits of an advantageous enclosure
design in multidirectional wind environments.
3
Executive Summary
Introduction
Vertical Axis Wind Turbines (VAWTs) are a renewable energy technology suitable for low-speed
and multidirectional wind environments. Their smaller scale and low cut-in speed make this technology
well-adapted for distributed energy distribution, but performance may still be improved. The addition of
a partial enclosure across half the front-facing swept area has been suggested to improve the coefficient
of performance, but it undermines the multidirectional functionality.
A partial enclosure surrounding could reduce the wind striking the returning blades and increase
the flow speed flowing into the advancing blade (Mohamed, 2010). Previous research by Brandmaier, et
al. specifies an enclosure shape for a flat-plate bladed VAWT, optimized with flow simulation and
verified experimentally at a small scale (Brandmaier, et al. 2012). To ensure that the benefits of the
enclosure will be realized, it must be in the optimal position, which changes with varying wind direction.
The simplest passive system utilizes a tail vane to align the turbine into the wind.
Based on the research outlined above, a two-stage, Savonius-bladed VAWT with a passive tail
vane was constructed. The optimized enclosure shape from Brandmaier, et al. was scaled up to fit the
new turbine.
There were two objectives to the project, which build the body of research on enclosures
relating to VAWTs. First, the project quantified the effects of an enclosure on the coefficient of
performance of a near-market scale Savonius-bladed VAWT. Second, the project designed and evaluated
a wind direction control system to align the proposed enclosure in an environment with changing wind
direction. Figure 1 below shows the VAWT fully constructed and under testing.
4

Figure 1: VAWT and Enclosure/Tail Vane System under Testing
Methodology
After construction of the turbine, base, and enclosure, various experimental tests were designed
and conducted with the purpose of quantifying the coefficient of performance, as well as torque and
power output of the VAWT. A large floor fan provided constant wind speed for all experimental tests.
Mechanical torque of the system was measure using a brake dynamometer. The brake dynamometer
device consisted of a strap looped around a pulley on the shaft of the turbine. A load was applied with
the strap to provide a torque against the rotation of the shaft. By measuring the turbine angular velocity
over increasing torques applied by the brake dynamometer, a power curve can be generated, and
subsequently the coefficient of performance.
To quantify the performance of the wind direction device, an experiment was performed that
measured the time elapsed as the enclosure and tail vane return to the correct orientation after being
initially set at an offset position. This test was conducted at 45°, 90°, 135°, 180°, -135°, -90°, and -45°
degrees offset from the correct orientation. Figure 2 below demonstrates this experimental set up.
5

Figure 2: Tail Vane Experimental Setup
Results
After analyzing the output of the system under various conditions, it was concluded that this
particular enclosure shape drastically reduces all performance of a VAWT with Savonius blades. Figure 3
below shows the mechanical power output of the turbine with and without the enclosure for the higher
of two tested wind speeds. The results are typical of both wind speeds.
Figure 3: Effect of Enclosure on VAWT Output Power
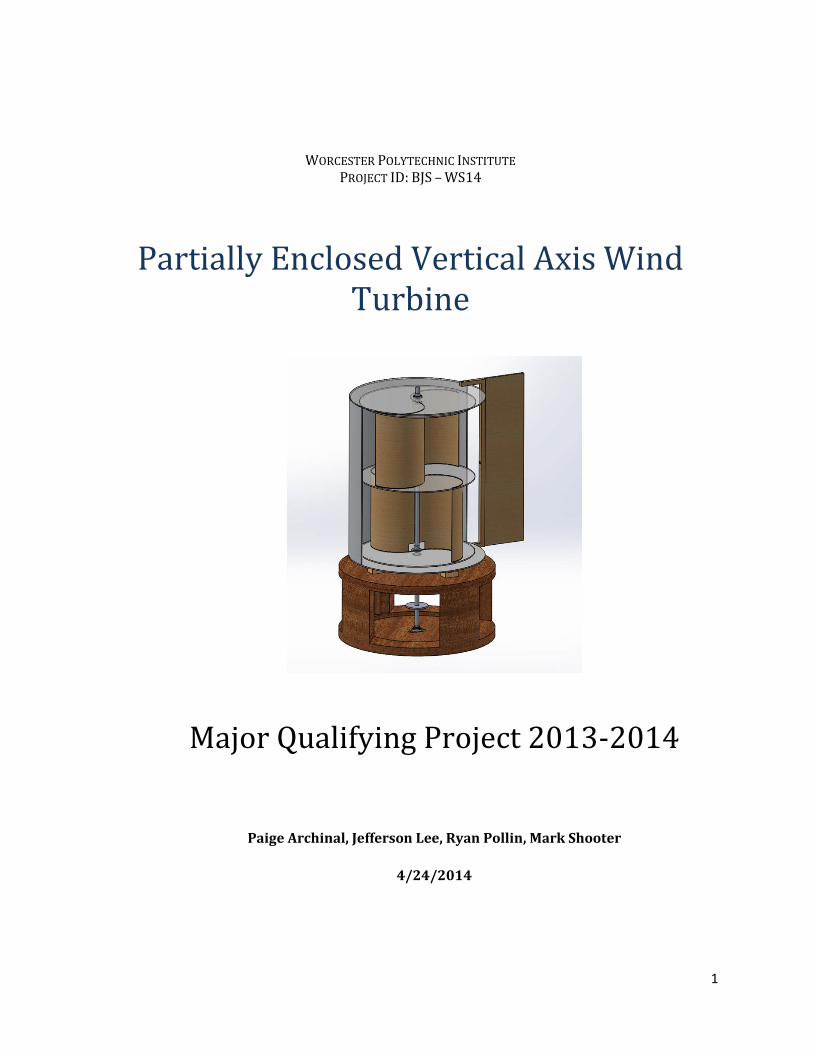
The effects of the enclosure are summarized in Table 1, below.
0.000
0.200
0.400
0.600
0.800
1.000
0 20 40 60 80 100
Pow
er (W
atts
)
Angular Velocity (RPM)
Power at 3.7 m/s Wind Speed
Enclosure Off
Enclosure On
6
Table 1: Summary of Enclosure Validation Tests
Observed Property Percent Change
Torque, low wind Torque, high wind
-56% -86%
Power, low wind Power, high wind
-49% -92%
Coefficient of Performance, low wind Coefficient of Performance, high wind
-83% -72%
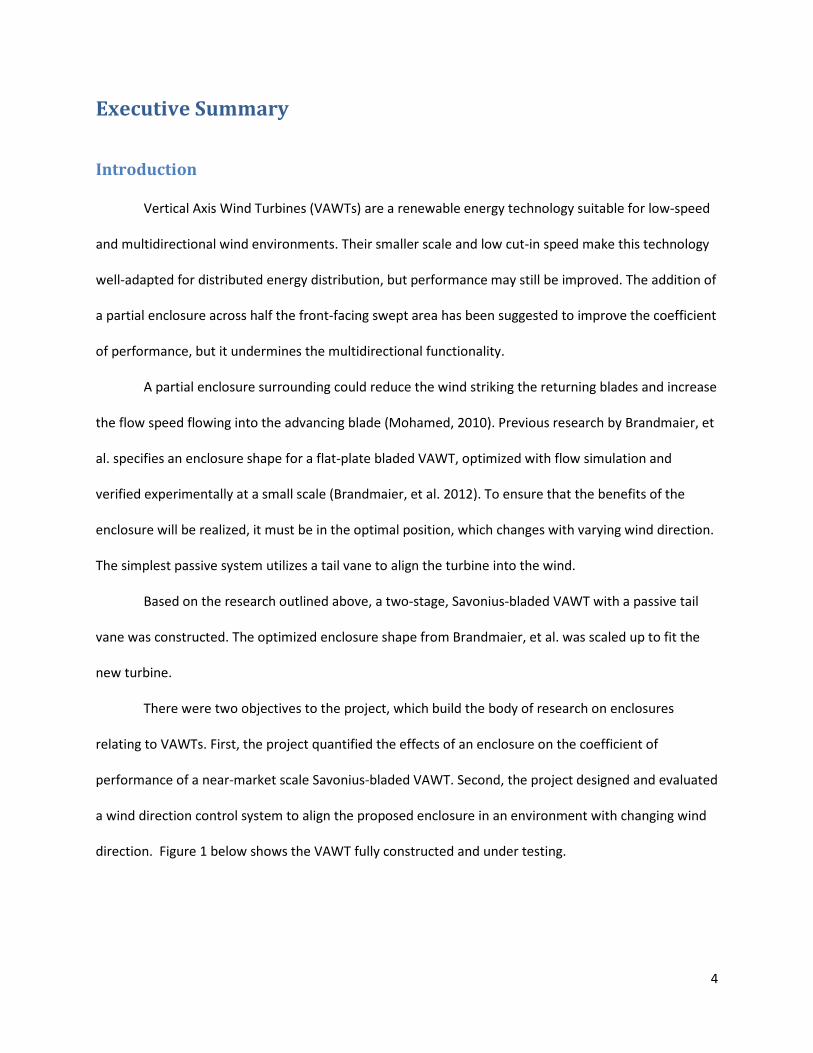
The wind direction control device was a passively controlled tail vane. The tail vane aligned the
turbine very well at all angles, as seen below in Figure 4.
Figure 4: Tail Vane Alignment Reaction Speed
Discussion
The performance of the VAWT with the enclosure was surprising, since the previous data for
drag-based blades showed significant improvements in coefficient of performance. Two primary factors
can be attributed to this difference: the blade shape and the gap between turbine and enclosure.
Moving from flat blades to Savonius blades made a significant change in the solidity of the turbine,
02468
10121416
-135 -90 -45 0 45 90 135 180
Tim
e to
Alig
n (s
econ
ds)
Wind Angle (degrees)
Tail Vane Alignment Speed
7
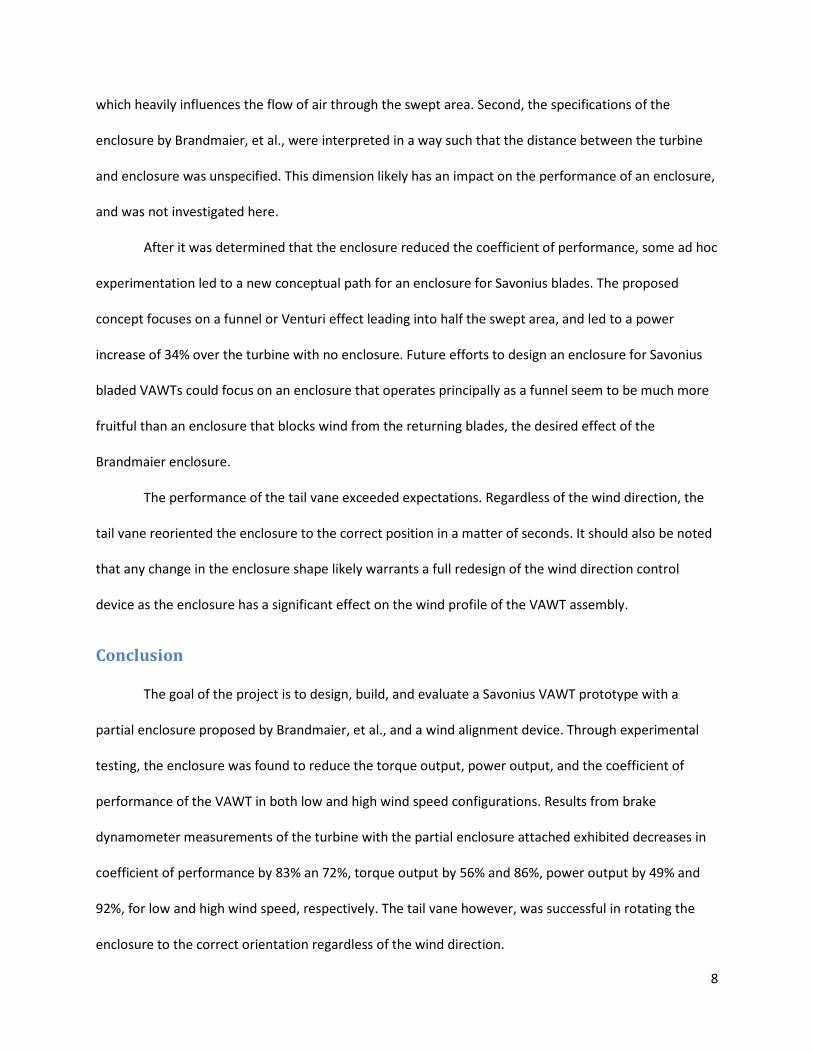
which heavily influences the flow of air through the swept area. Second, the specifications of the
enclosure by Brandmaier, et al., were interpreted in a way such that the distance between the turbine
and enclosure was unspecified. This dimension likely has an impact on the performance of an enclosure,
and was not investigated here.
After it was determined that the enclosure reduced the coefficient of performance, some ad hoc
experimentation led to a new conceptual path for an enclosure for Savonius blades. The proposed
concept focuses on a funnel or Venturi effect leading into half the swept area, and led to a power
increase of 34% over the turbine with no enclosure. Future efforts to design an enclosure for Savonius
bladed VAWTs could focus on an enclosure that operates principally as a funnel seem to be much more
fruitful than an enclosure that blocks wind from the returning blades, the desired effect of the
Brandmaier enclosure.
The performance of the tail vane exceeded expectations. Regardless of the wind direction, the
tail vane reoriented the enclosure to the correct position in a matter of seconds. It should also be noted
that any change in the enclosure shape likely warrants a full redesign of the wind direction control
device as the enclosure has a significant effect on the wind profile of the VAWT assembly.
Conclusion
The goal of the project is to design, build, and evaluate a Savonius VAWT prototype with a
partial enclosure proposed by Brandmaier, et al., and a wind alignment device. Through experimental
testing, the enclosure was found to reduce the torque output, power output, and the coefficient of
performance of the VAWT in both low and high wind speed configurations. Results from brake
dynamometer measurements of the turbine with the partial enclosure attached exhibited decreases in
coefficient of performance by 83% an 72%, torque output by 56% and 86%, power output by 49% and
92%, for low and high wind speed, respectively. The tail vane however, was successful in rotating the
enclosure to the correct orientation regardless of the wind direction.
8

Table of Contents
Acknowledgments............................................................................................................................ 2
Abstract ............................................................................................................................................ 3
Executive Summary .......................................................................................................................... 4
Introduction ................................................................................................................................. 4
Methodology ................................................................................................................................ 5
Results .......................................................................................................................................... 6
Discussion .................................................................................................................................... 7
Conclusion .................................................................................................................................... 8
List of Figures ................................................................................................................................. 11
List of Tables .................................................................................................................................. 13
Introduction ................................................................................................................................... 14
Project Goal.................................................................................................................................... 15
Literature Review ........................................................................................................................... 16
Savonius vs. Darrieus Blades ...................................................................................................... 16
Optimal Rotor and Blade Design ................................................................................................ 16
Enclosure .................................................................................................................................... 23
Alignment Methods ................................................................................................................... 24
Design Overview ............................................................................................................................ 28
Mathematical Modeling............................................................................................................. 28
Size and Geometry ..................................................................................................................... 32
Blades ......................................................................................................................................... 33
Enclosure and Wind-Alignment Device ..................................................................................... 35
Materials .................................................................................................................................... 36
Assembly .................................................................................................................................... 38
Design Iterations .................................................................................................................... 39
Turbine ................................................................................................................................... 41
Enclosure and Tail Vane ......................................................................................................... 42
Base and Downstream Mechanical Components .................................................................. 43
Methodology .................................................................................................................................. 44
Results ............................................................................................................................................ 48
Enclosure Verification ................................................................................................................ 48
Direction Control ........................................................................................................................ 51
Discussion ...................................................................................................................................... 53
9

Enclosure Verification ................................................................................................................ 53
Direction Control ........................................................................................................................ 54
Recommendations ......................................................................................................................... 56
Enclosure Verification ................................................................................................................ 56
Directional Control ..................................................................................................................... 58
Conclusion ...................................................................................................................................... 59
Bibliography ................................................................................................................................... 60
Appendices ..................................................................................................................................... 63
Appendix A: Design Proof Calculations ...................................................................................... 63
Appendix B: Material Detail Matrices ........................................................................................ 83
Appendix C: Prototype Fabrication ............................................... Error! Bookmark not defined.
10
List of Figures
Figure 1: VAWT and Enclosure/Tail Vane System under Testing ..................................................... 5
Figure 2: Tail Vane Experimental Setup ........................................................................................... 6
Figure 3: Effect of Enclosure on VAWT Output Power .................................................................... 6
Figure 4: Tail Vane Alignment Reaction Speed ................................................................................ 7
Figure 5: VAWT Turbines with Varying Stages (Saha et al., 2008) ................................................. 17
Figure 6: Traditional Savonius blades (Mohamed, Janiga, Pap, & Thevenin, 2010) ...................... 19
Figure 7: Savonius Blade Optimization (Mohamed, 2011) ............................................................ 20
Figure 8: Optimum Savonius Blade Comparison (Mohamed, 2011) ............................................. 21
Figure 9: Modified Savonius Rotor (Menet, 2001) ........................................................................ 22
Figure 10: Static torque coefficient on the optimized rotor (Menet, 2001) .................................. 23
Figure 11: Pressure Contours (Pa) on the Optimized Rotor (ϴ = 45 degrees) (Menet, 2001) ....... 23
Figure 12: Active Yaw Controlled by Pressure Sensors at 13 and 15 (Enevoldsen, 2010) ............. 25
Figure 13: Passive Tail Vane Design (Kodric, 1989) ........................................................................ 26
Figure 14: Passive Tail Vane Design (Kuo, Hai P. 2011) ................................................................. 27
Figure 15: "Wind Shark" Tail Vane (Poole, 2007) .......................................................................... 27
Figure 16: Final Turbine Assembly with Base ................................................................................ 28
Figure 17: Shaft Endurance Limit Based on Torque Applied ......................................................... 30
Figure 18: Turbine Assembly Height to Width Ratio, shown in inches .......................................... 33
Figure 19: Savonius Blade Notched for End Cap Construction ...................................................... 34
Figure 20: Enclosure and Tail Vane ................................................................................................ 35
Figure 21: Lower Shaft Assembly ................................................................................................... 38
Figure 22: Upper Shaft Assembly Exploded View .......................................................................... 39
Figure 23: Four bladed VAWT initial design ................................................................................... 40
11
Figure 24: Separator disk with engraved blade troughs ................................................................ 40
Figure 25: Cap feature to secure turbine assembly ....................................................................... 41
Figure 26: Exploded view of turbine assembly .............................................................................. 42
Figure 27: Base ............................................................................................................................... 43
Figure 28: Tail Vane Experimental Setup ....................................................................................... 45
Figure 29: Portable Electronic Spring Scale ................................................................................... 46
Figure 30: Digital Laser Tachometer .............................................................................................. 47
Figure 31: Digital Anemometer ...................................................................................................... 47
Figure 32: Torque at Low Wind Speed ........................................................................................... 48
Figure 33: Power at Low Wind Speed ............................................................................................ 49
Figure 34: Torque at High Wind Speed .......................................................................................... 49
Figure 35: Power at High Wind Speed ........................................................................................... 50
Figure 36: Tail Vane Alignment Reaction Speed ............................................................................ 52
Figure 37: Funneling Experimental Setup ...................................................................................... 56
Figure 38: Torque Comparison of Funneling Setup ....................................................................... 57
Figure 39: Power Comparison of Funneling Setup ........................................................................ 57
12

List of Tables Table 1: Summary of Enclosure Validation Tests ............................................................................. 7
Table 2: Performance of Savonius Turbine Designs (Saha, Thotla, & Malty, 2008) ...................... 19
Table 3: Blade feature coordinates for optimal shape (Mohamed, 2011) .................................... 20
Table 4: Mathematical Modeling Values Summary ....................................................................... 32
Table 5: Blade and Enclosure Materials Matrix ............................................................................. 36
Table 6: Tail Vane Material Design Matrix ..................................................................................... 37
13
Introduction
Climate change is a heavily researched phenomenon that has been attributed to the increase of
greenhouse gases. Energy production is the primary producer of greenhouse gases, specifically carbon
dioxide, released into the atmosphere. Coal burning power plants are accountable for about 30% of the
global carbon dioxide emission. Burning coal provides approximately 40% of the world’s energy supply
(Greenpeace, 2013). With an ever-increasing population and energy demand, coal power plants will
inevitably grow in number if other forms of energy production do not replace it.
Wind power is a sustainable and renewable alternative energy source that contributes minimal
carbon dioxide emissions into the atmosphere. Wind power generation is increasing by 30% annually;
however, it was only responsible for 2.5% of global energy in 2010 (Kroldrup, 2010). Wind turbines are
currently used in 83 countries to produce electricity. The most common turbine design used in wind
farm applications is a horizontal axis wind turbine (HAWT). A vertical axis wind turbine (VAWT) design is
an alternative design consisting of blades rotating around a vertical axle. There are two most widely
used sub-categories of VAWTs that are defined by blade shape. Savonius blades feature a cup shape,
catching the wind and advancing the blade using drag force. Darrieus blade designs use airfoils to create
lift and rotate the turbine. HAWTs are more commercially produced because they are capable of
generating more electricity at higher wind speeds. VAWTs are more feasible in rapidly varying wind
direction because their design allows them to generate electricity regardless.
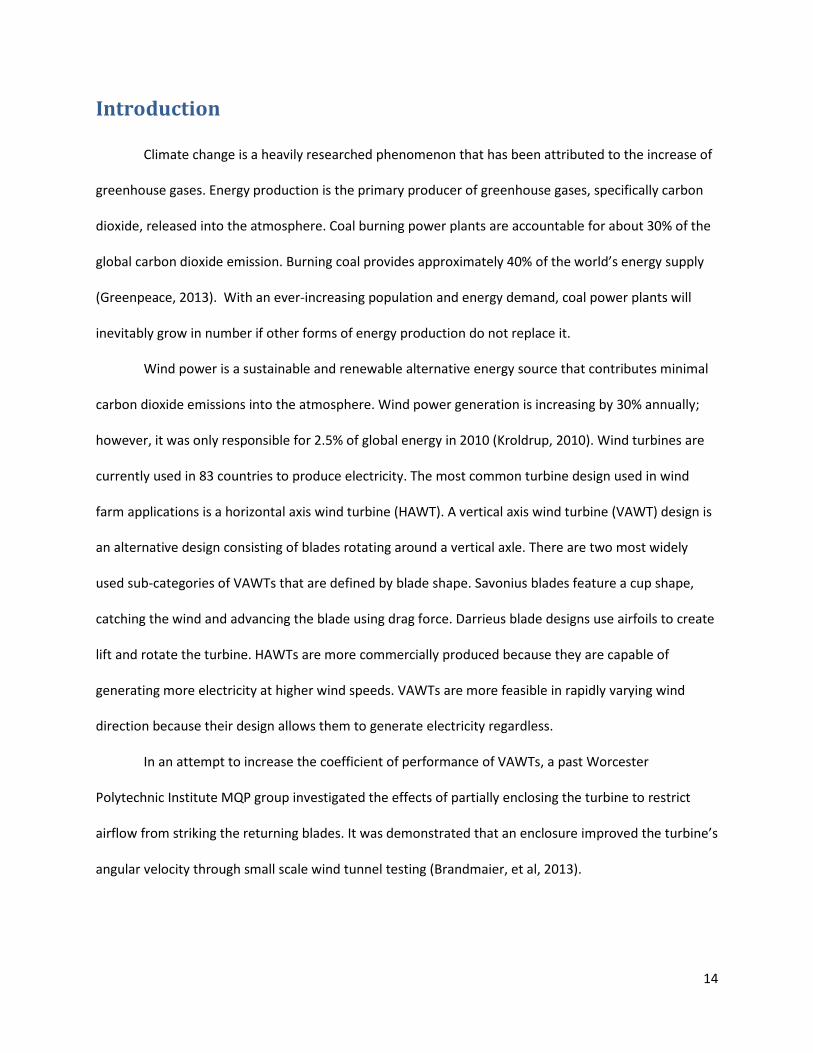
In an attempt to increase the coefficient of performance of VAWTs, a past Worcester
Polytechnic Institute MQP group investigated the effects of partially enclosing the turbine to restrict
airflow from striking the returning blades. It was demonstrated that an enclosure improved the turbine’s
angular velocity through small scale wind tunnel testing (Brandmaier, et al, 2013).
14
Project Goal
The goal of this research was to design, build, and evaluate a Savonius VAWT prototype with the
Brandmaier, et al, partial enclosure with the addition of a wind alignment device. The primary objective
of the project is to show the proof of concept of a VAWT using an enclosure to increase the coefficient
of performance. The secondary objective is to design an effective wind-direction that will keep the
enclosure in the optimal position relative to the wind direction.
Understanding the effects of a simple enclosure on VAWT coefficient of performance may prove
instrumental for creating a VAWT that is cost competitive with conventional, fossil fuel energy
generation. Clean and renewable distributed energy generation will benefit from lower cost and more
efficient VAWT design.
15

Literature Review
Savonius vs. Darrieus Blades
Savonius and Darrieus blades are the two main types of vertical axis wind turbine blades. The
rotation of Darrieus turbines is dependent on lifting forces that develop as wind hits the airfoils. The
rotation of Savonius turbines is dependent on drag forces that develop when the turbine blades cup the
wind. The lifting forces of the Darrieus turbines cause large centrifugal forces, so the blades of these
turbines must be strong. Since Darrieus turbines can rotate at a faster speed than the prevailing wind,
these turbines are typically used to generate electricity. On the other hand, Savonius turbines rotate
slower than the prevailing wind and generate larger torque outputs. This combination makes these
turbines suitable for pumping water or grinding grain (Reuk, 2013).
Optimal Rotor and Blade Design
Within Savonius style blades, there are a number of configurations that have been examined to
increase the coefficient of performance of VAWTs. The coefficient of performance, 𝐶𝐶𝐶𝐶, is defined as
𝐶𝐶𝐶𝐶 =𝑃𝑃𝑃𝑃𝑃𝑃
where P is the power of an airstream with a mass flow rate moving through a defined area calculated
with the equation
𝑃𝑃 = 𝜌𝜌𝜌𝜌𝜌𝜌12𝜌𝜌2 =
12𝜌𝜌𝜌𝜌𝜌𝜌3
where 𝜌𝜌 is the density of the air, 𝜌𝜌 is the swept area of the blades and 𝜌𝜌 is the velocity of the air. Ps is
the power of the turbine shaft is calculated with experimentally measured brake torque and angular
velocity.
Modifying the cup shape, adding gaps for vortices at the central axis, and helical blades are
common improvements to the basic Savonius shape.
16
The aspect ratio of the VAWT is given by the height of the turbine divided by the diameter of the
turbine blades. The typical aspect ratio of VAWTs is 1.5, meaning the height should be 1.5 times greater
than the diameter of a VAWT (Paraschivoiu, 2002).
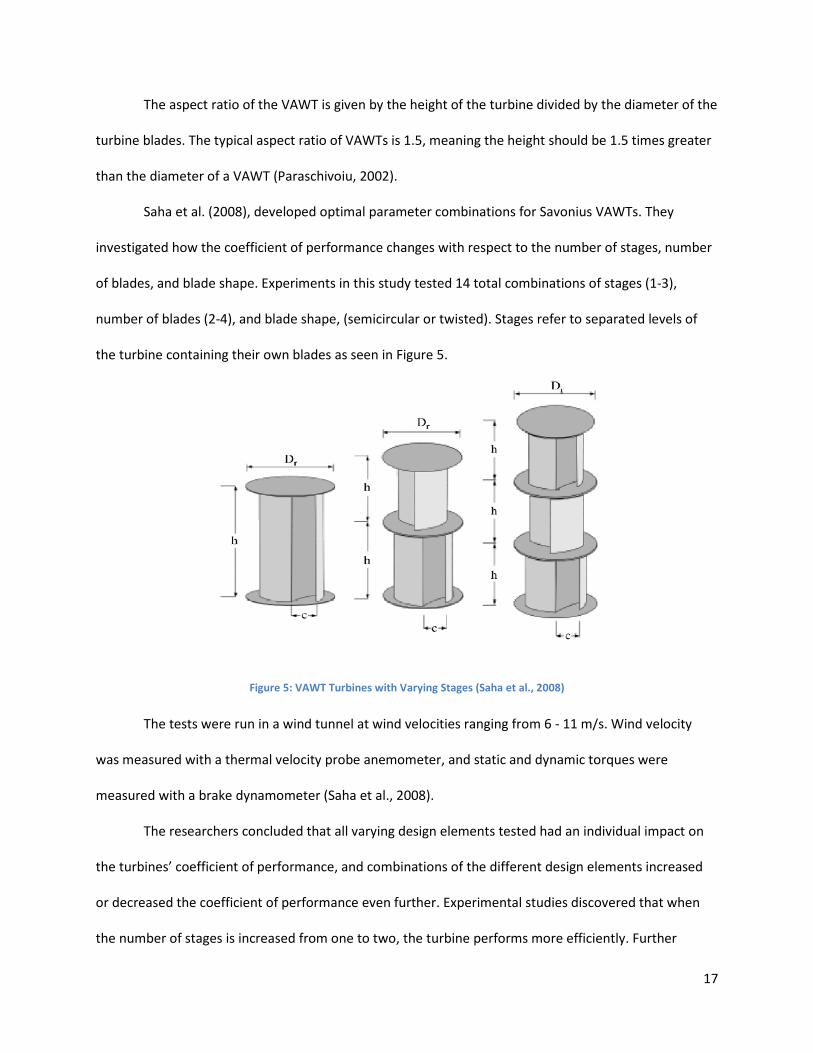
Saha et al. (2008), developed optimal parameter combinations for Savonius VAWTs. They
investigated how the coefficient of performance changes with respect to the number of stages, number
of blades, and blade shape. Experiments in this study tested 14 total combinations of stages (1-3),
number of blades (2-4), and blade shape, (semicircular or twisted). Stages refer to separated levels of
the turbine containing their own blades as seen in Figure 5.
The tests were run in a wind tunnel at wind velocities ranging from 6 - 11 m/s. Wind velocity
was measured with a thermal velocity probe anemometer, and static and dynamic torques were
measured with a brake dynamometer (Saha et al., 2008).
The researchers concluded that all varying design elements tested had an individual impact on
the turbines’ coefficient of performance, and combinations of the different design elements increased
or decreased the coefficient of performance even further. Experimental studies discovered that when
the number of stages is increased from one to two, the turbine performs more efficiently. Further
Figure 5: VAWT Turbines with Varying Stages (Saha et al., 2008)
17

increasing the number of stages from two to three reduces the coefficient of performance due to the
increased rotor inertia (Saha et al., 2008).
Blade design was experimentally tested in conjunction with the number of stages. A semicircular
blade (twist = 0° degrees) and a twisted blade (twist = 12.5° degrees) were the two variations tested.
The twisted blade outperformed the semicircular blade in all levels of stages (1-3). Exact value
differences can be seen in Table 1. With a twisted blade, the maximum force migrates and acts at the tip
of the blade, instead of centrally in the case of the semicircular blade. A longer moment arm for the
twisted blade increases the torque created leading to a higher coefficient of performance (Saha et al.,
2008).
Another variation investigated was the effect of increasing the number of blades from two to
three. In all stage variations, the increase in blades reduced the turbine’s coefficient of performance.
Three-bladed systems performed worse in all tests comparatively to two-bladed systems. This was
associated this decrease in performance to additional wind turbulence. When wind is captured by the
advancing blade, some is reflected back and contacts the returning blade. With three blades, there is
less space between each advancing and returning blade, increasing the negative effects of this
phenomenon (Saha et al., 2008).
All the results gathered by the investigators were organized into a table expressing the varying
design combinations and their respective experimental characteristics. Table 2 shown below from the
publication shows the results of the investigation.
18

Table 2: Performance of Savonius Turbine Designs (Saha, Thotla, & Malty, 2008)
Islam et al. (2005) tested the impact two, three, and four blade rotors have on the normal drag
coefficient, tangential drag coefficient, and torque coefficient. Their results showed that as the number
of blades increased, there was no significant change in drag coefficient or net output torque. Their
studies also showed that as the number of blades increased, the starting torque increases (Islam et al.,
2005). These results further proved that a two bladed rotor is the best option for the design.
Mohamed et al. (2011), showed how to modify a semicircular blade to catch the wind more
effectively. Figure 6 shows a traditional Savonius set of blades.
Figure 6: Traditional Savonius blades (Mohamed, Janiga, Pap, & Thevenin, 2010)
For the duration of their trials, fixed distances were used for the parameters e and a, which
were equal to 0 and R/3, respectively. It is also important to note that in this study, a shield was used to
19
limit the wind that hits the returning blade (Mohamed et al., 2011). Since an enclosure was used to
perform the same task, it can be assumed that the results from this study are applicable to the current
VAWT enclosure design.
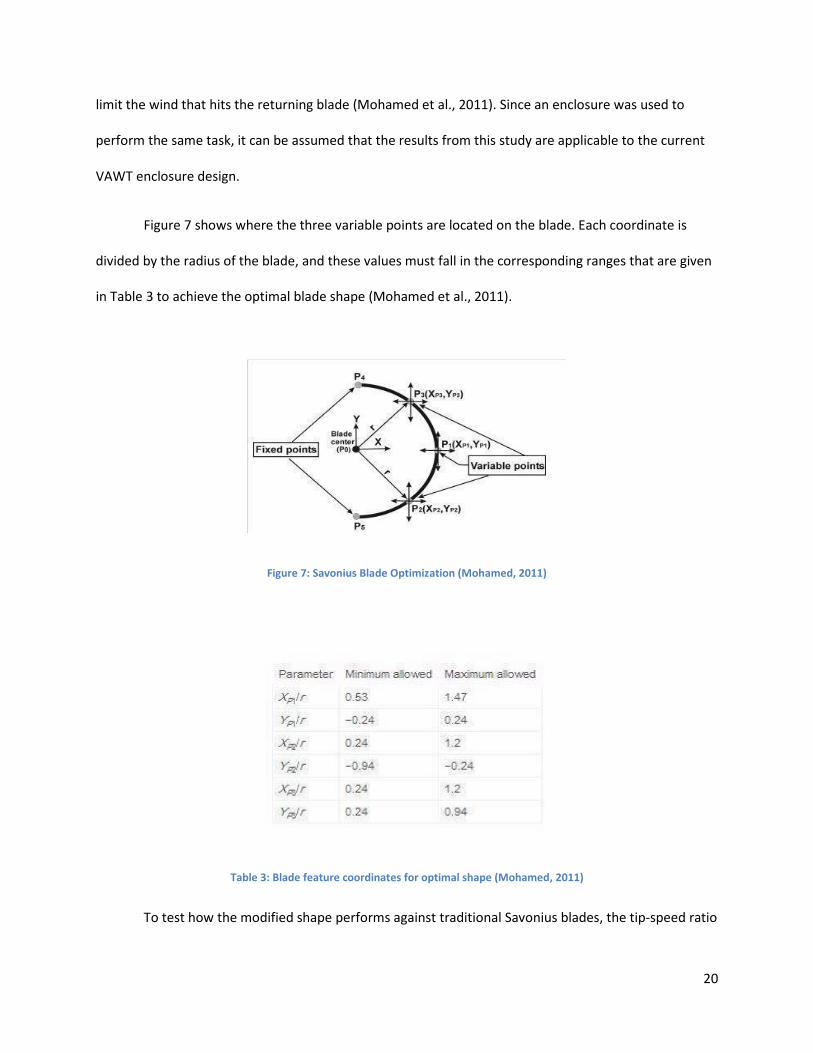
Figure 7 shows where the three variable points are located on the blade. Each coordinate is
divided by the radius of the blade, and these values must fall in the corresponding ranges that are given
in Table 3 to achieve the optimal blade shape (Mohamed et al., 2011).
Figure 7: Savonius Blade Optimization (Mohamed, 2011)
Table 3: Blade feature coordinates for optimal shape (Mohamed, 2011)
To test how the modified shape performs against traditional Savonius blades, the tip-speed ratio
20

is compared to the torque coefficient and the coefficient of performance for three scenarios. The
scenarios included in the graphical analysis are; traditional Savonius blades without the obstacle
discussed in the past study, traditional Savonius blades with the obstacle, and the optimally shaped
Savonius blades with the obstacle. The graphical analysis can be seen in Figure 8, and it shows that the
optimally shaped blade yields a tip-speed ratio (λ) than the traditionally shaped blade (Mohamed et al.,
2011). λ is defined as
𝜆𝜆 = 𝜔𝜔𝜔𝜔
2𝜌𝜌
where ω is the angular velocity of the turbine, 𝜔𝜔 is the diameter of the turbine, and 𝜌𝜌 is the wind
velocity.
Figure 8: Optimum Savonius Blade Comparison (Mohamed, 2011)
L.J. Menet conducted a study that focused on the optimal orientation of Savonius blades. He
proposed that the blades should not be directly aligned with each other. In this study, Menet tested how
rotating one of the blades toward the second blade would affect the static torque of the rotor. This
21

modified orientation is depicted in Figure 9 below.
Figure 9: Modified Savonius Rotor (Menet, 2001)
Menet conducted static flow simulation experiments that compared the modified Savonius
rotor with the traditional Savonius rotor, and concluded that the modified rotor maximizes static torque.
These results are shown in Figure 10.
22
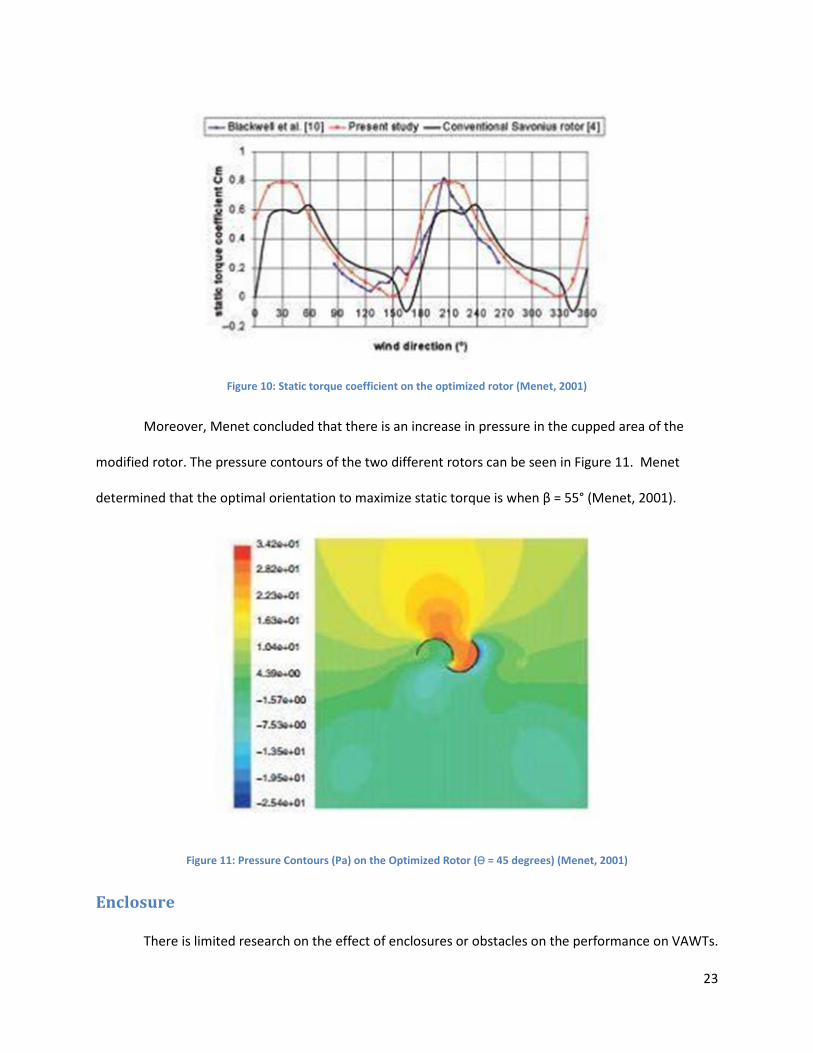
Figure 10: Static torque coefficient on the optimized rotor (Menet, 2001)
Moreover, Menet concluded that there is an increase in pressure in the cupped area of the
modified rotor. The pressure contours of the two different rotors can be seen in Figure 11. Menet
determined that the optimal orientation to maximize static torque is when β = 55° (Menet, 2001).
Figure 11: Pressure Contours (Pa) on the Optimized Rotor (ϴ = 45 degrees) (Menet, 2001)
Enclosure
There is limited research on the effect of enclosures or obstacles on the performance on VAWTs.
23

Some results showed that an enclosure could significantly increase its coefficient of power (Cp) and
torque coefficient (Cm). Wind pushes both forward and against the rotor blades during its rotation, so
efforts to minimize wind flow onto the blades in the returning direction would theoretically increase
performance. A typical VAWT with Savonius rotor blades experiences wind in both directions, and spins
only because of the difference in drag coefficients of the blades as the angle of attack changes. An
enclosure or an obstacle could reduce the wind flowing into the returning blades and increase the flow
speed flowing into the advancing blade (Mohamed, 2010).
Researchers at University of Magdebury in Germany conducted a study on the placement of a
flat plate that reduces the oncoming wind in front of the return blade of the VAWT. They found that an
obstacle with approximately a 100° degree angle was the optimal value for two-blade Savonius turbine,
given their specific testing geometry. With this set up, the torque coefficient (Cm) increased from 0.33
to 0.46 and the coefficient of performance increased 30 percent at speed ratio of 0.3 (Mohamed, 2010).
On average, Savonius shaped blades have a coefficient of performance of 0.15-0.3 (Wortman, 1983).
The effect from an obstacle had a significant numerical result on improving the coefficient of
performance. Based on this research, an enclosure was added on our wind turbine.
A design proposed by Letcher used a nozzle to increase the velocity of wind going into the
advancing blade and deflecting the wind entering to the returning blade. Again, the research shows an
increase in coefficient of performance due to reductions in the negatively-affecting side of the turbine
area. The researchers noted clearly that use of a nozzle, while increasing efficiency, poses
implementation issues with sites that have more than one prevailing wind direction (Letcher, 2010).
Alignment Methods
To ensure that the benefits of the enclosure will be realized, it must be in the optimal position,
which changes with varying wind direction. If the enclosure is angled incorrectly, it may block all the
wind from the turbine and inhibit power generation. There are a number of alignment methods used in
24

vertical and horizontal wind turbines, and they fall into categories of either active or passive systems.
An active alignment system senses the wind direction, and uses powered motion to rotate, or
yaw, into the wind. These active systems typically use pressure sensors, wind vanes, or anemometers.
By mounting a pressure sensor on each side of the wind turbine, and comparing their readouts
simultaneously, the system can infer which direction to rotate. When the pressures are equal, the
turbine is perfectly aligned with the wind (Enevoldsen, Frydendal, Poulsen, & Rubak, 2010). Figure 12,
shows a HAWT diagram with pressure sensors, labeled 13 and 15.
Figure 12: Active Yaw Controlled by Pressure Sensors at 13 and 15 (Enevoldsen, 2010)
A wind vane can be used in conjunction with a potentiometer and yaw gear. The wind vane
detects the direction of the wind and the potentiometer converts this linear motion into a change in
resistance. The change in resistance can then control the yaw drive (Elliot, 2001). An anemometer can
be used to record wind speeds and directions. These recordings control the yaw drive and it will rotate
into optimal position. An ultrasonic anemometer detects speed variations in pulses of ultrasonic waves
to infer wind direction and velocity. Active alignment options allow precise adjustments and easier
integration of disaster-condition operations. As such, they are standard for high-output HAWTs.
The simplest passive system utilizes a tail vane to align the turbine into the wind. When not
aligned, wind hits the surface of the vane and creates an unbalanced moment about the central axis,
25

which turns the turbine until the angle at which the wind hits the vane becomes zero. There are two
major design choices with this system, shape and placement. There are many patents and patent
applications for tail vane designs. Some tail vane examples are depicted below, which display the wide
variety of shapes that can function as a tail vane. Figure 13 is a design that is similar to the tail of an
airplane, and Figure 14 shows a wind turbine with a simple tail vane similar to that of a weather vane.
The tail vane shown in Figure 15 is a component of a VAWT called the “Wind Shark Vertical Turbine.” It
is critical that the rotation caused by the tail vane is stronger than the moment incurred by the
asymmetrical shape of the enclosure itself in all these examples, as well as our design.
Figure 13: Passive Tail Vane Design (Kodric, 1989)
26

Figure 14: Passive Tail Vane Design (Kuo, Hai P. 2011)
Figure 15: "Wind Shark" Tail Vane (Poole, 2007)
In addition to the shape, the location of the fin must also be assessed. The tail vane could be
mounted above, in-line, or below the swept area of the VAWT. If the vane is offset, either above or
below the enclosure, changing wind direction would also induce a pitch or roll moment, pressing the
turbine’s central axis off of perfectly vertical. However, in an installation with many turbines, it may be
advantageous to mount the tail vane outside the swept area, as it would reduce the turbulence of the
wind.
27
Design Overview
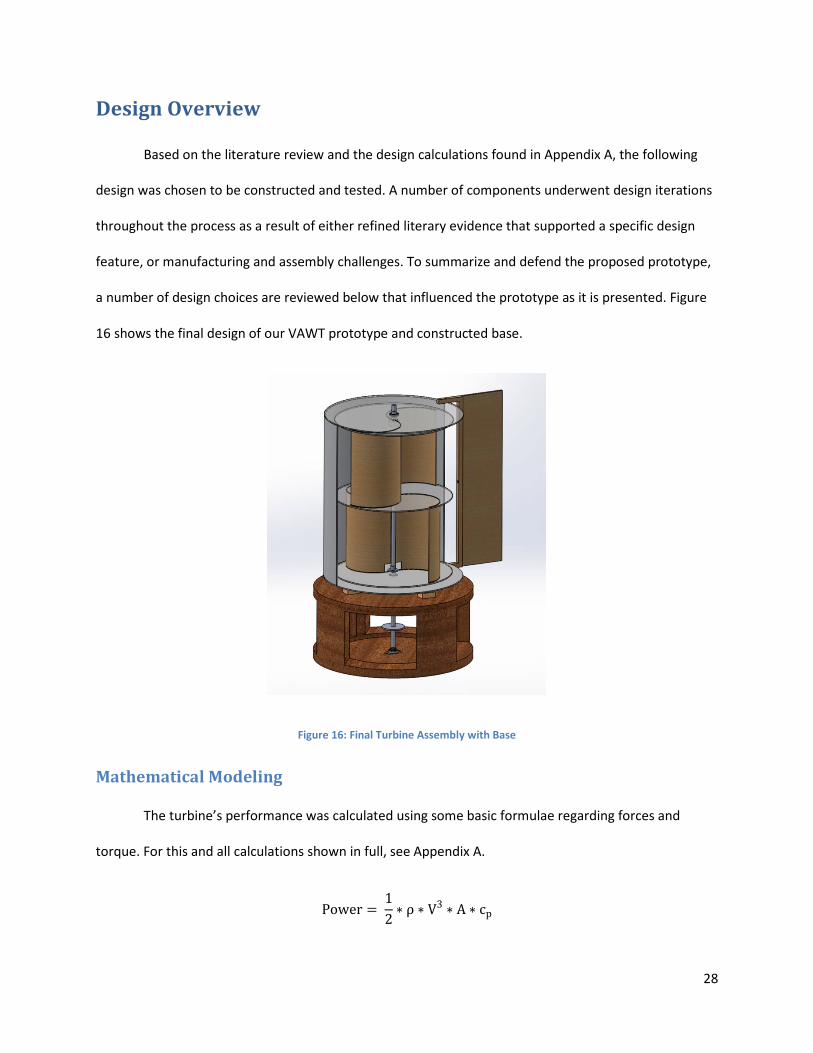
Based on the literature review and the design calculations found in Appendix A, the following
design was chosen to be constructed and tested. A number of components underwent design iterations
throughout the process as a result of either refined literary evidence that supported a specific design
feature, or manufacturing and assembly challenges. To summarize and defend the proposed prototype,
a number of design choices are reviewed below that influenced the prototype as it is presented. Figure
16 shows the final design of our VAWT prototype and constructed base.
Figure 16: Final Turbine Assembly with Base
Mathematical Modeling
The turbine’s performance was calculated using some basic formulae regarding forces and
torque. For this and all calculations shown in full, see Appendix A.
Power = 12∗ ρ ∗ V3 ∗ A ∗ cp
28

Where ρ is the density of air, V is the mean velocity of the wind, A is the swept area (front
facing), and cp is the estimated coefficient of performance of the turbine. The coefficient of
performance was assumed using similar turbines whose coefficient was found experimentally. Values
for this and all calculations are summarized below in Table 3. Torque applied to the shaft is found by:
T =Power
Angular Velocity
where
Angular Velocity =V
t ∗ r
and
𝑡𝑡 = 𝑊𝑊𝑊𝑊𝑊𝑊𝑊𝑊 𝜌𝜌𝑉𝑉𝑉𝑉𝑉𝑉𝑉𝑉𝑊𝑊𝑡𝑡𝑉𝑉
𝐵𝐵𝑉𝑉𝐵𝐵𝑊𝑊𝑉𝑉 𝑇𝑇𝑊𝑊𝐶𝐶 𝐿𝐿𝑊𝑊𝑊𝑊𝑉𝑉𝐵𝐵𝑛𝑛 𝜌𝜌𝑉𝑉𝑉𝑉𝑉𝑉𝑉𝑉𝑊𝑊𝑡𝑡𝑉𝑉=
𝜌𝜌𝑊𝑊𝑊𝑊𝑊𝑊𝑊𝑊
𝜌𝜌𝐵𝐵𝐵𝐵𝐵𝐵𝑊𝑊𝐵𝐵
t is the tip speed ratio of the blades, and r is the radius of the blades. The tip speed ratio was found
experimentally. The literature review shows an optimal tip speed ratio of 0.8, which we aimed to
achieve.
The allowable torque stress on the shaft was estimated using the equation:
N =Sy
τmax
where N is the safety factor, Sy is the yield strength, and τmax is the maximum shear stresses. τmax was
found using the formula:
τmax =T ∗ r2 ∗ I
where T is the torque applied, r is the radius of the shaft, and I is the area moment of inertia of the
29
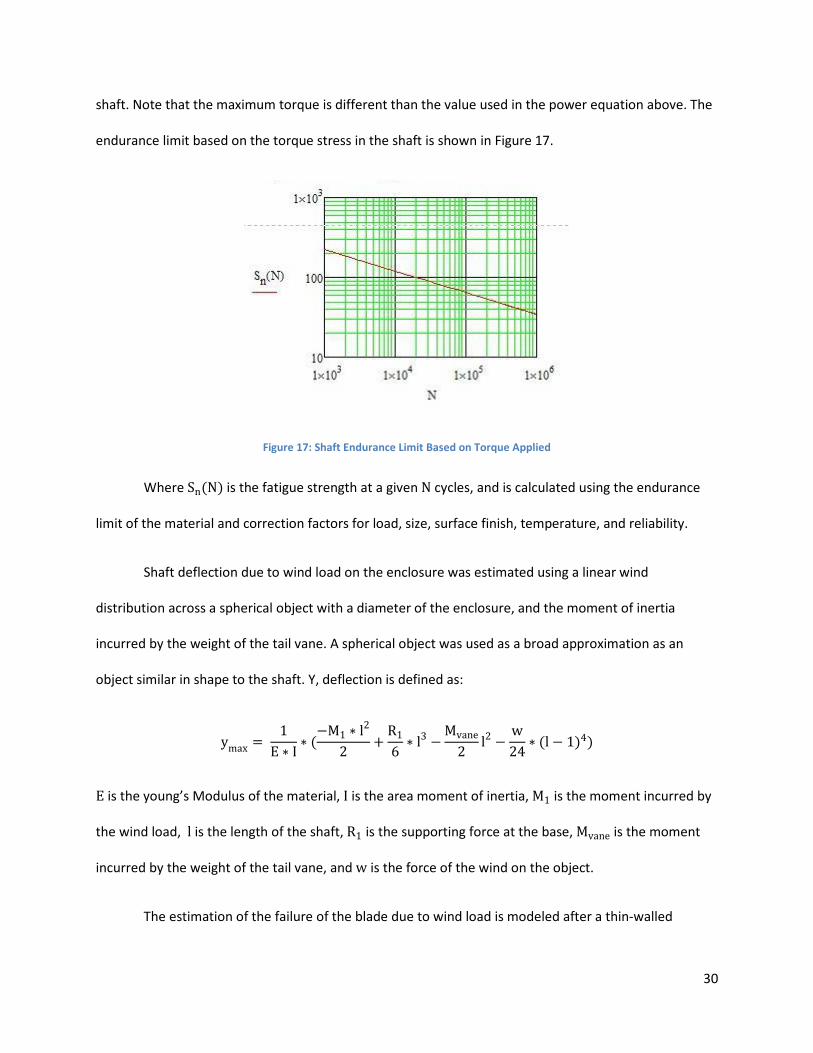
shaft. Note that the maximum torque is different than the value used in the power equation above. The
endurance limit based on the torque stress in the shaft is shown in Figure 17.
Figure 17: Shaft Endurance Limit Based on Torque Applied
Where Sn(N) is the fatigue strength at a given N cycles, and is calculated using the endurance
limit of the material and correction factors for load, size, surface finish, temperature, and reliability.
Shaft deflection due to wind load on the enclosure was estimated using a linear wind
distribution across a spherical object with a diameter of the enclosure, and the moment of inertia
incurred by the weight of the tail vane. A spherical object was used as a broad approximation as an
object similar in shape to the shaft. Y, deflection is defined as:
ymax = 1
E ∗ I∗ (−M1 ∗ l2
2+
R1
6∗ l3 −
Mvane
2l2 −
w24
∗ (l − 1)4)
E is the young’s Modulus of the material, I is the area moment of inertia, M1 is the moment incurred by
the wind load, l is the length of the shaft, R1 is the supporting force at the base, Mvane is the moment
incurred by the weight of the tail vane, and w is the force of the wind on the object.
The estimation of the failure of the blade due to wind load is modeled after a thin-walled
30

pressure vessel. The longitudinal and tangential stresses are:
σL = p ∗ r2 ∗ t
σT = p ∗ r
t
Where p is the pressure due to wind, r is the radius of the blade, and t is the thickness of the
blade. These two are combined into a von Mises stress, σ′, and compared to the yield strength of the
material, Sy , below:
N =Sy
σ′
The stresses on the tail vane are calculated using a concentrated force on the centroid of the tail
vane action on a moment on the shaft. These are combined using von Mises theory, similar to above,
and examined both at the base, and at the tail vane mount, which experience different stressed due to
their different material and area.
The acceleration of the enclosure is given by the formula:
𝛼𝛼 =𝜏𝜏𝐼𝐼
Where 𝜏𝜏 is the torque applied to the tail vane by the wind and I is the area moment of inertia of the tail
vane and enclosure. Time to rotate from initial to final position is found by the equation:
𝑡𝑡 = �𝜃𝜃
. 5 ∗ 𝛼𝛼�
.5
31

Table 4: Mathematical Modeling Values Summary
Key Property Value Unit
Power .16 Watts
Torque .03 Newton Meters
Angular Velocity 48 Revolutions per minute
Tip Speed Ratio .98
Safety Factor 11.5
Maximum Allowable Torque 1.1x10⁷ Newton Meters
Maximum Deflection 11.2 Millimeters
It is important to understand that these key values were the mathematic approximations of the
turbine that were used to determine its geometry as-built. To clarify, the power in the table above is not
the target maximum power of the turbine, but rather the power at the wind speed that we expected to
be able to test. The true performance of the turbine was not known until after the testing methodology
was completed.
Size and Geometry
The size of the prototype was confined by a number of design criteria. Primarily, it needed to be
large enough to demonstrate the principles of the enclosure and wind-alignment device compared to
the prototype with the enclosure and alignment device removed. This means it must be large enough to
harvest wind in the design environment, rather than a wind tunnel. Additionally, the prototype should
reflect a marketable product, since this is the next step in a commercialization process. A prototype that
is approximately the same size as a viable product will be more useful for answering questions about
manufacturing, expected power generation, and marketability. Another constraint is the budget of the
32

prototype project. This limits the size and material complexity of the prototype considerably, as a
number of materials needed to be purchased and manufactured in order to test the design.
The specific geometry of the turbine was defined through basic calculations of operation at
desired wind speeds. The optimal aspect ratio, height to width, of the turbine is discussed by
Paraschivoiu in the literature review, and as a result was closely set to 1.5 shown in Figure 18.
Figure 18: Turbine Assembly Height to Width Ratio, shown in inches
Blades
The concept and previous tests of the VAWT enclosure by Brandmaier, et al, was all conducted
using drag-type turbine blades. While it may be possible to use an enclosure with lift-style blades like an
H-rotor or Darrieus blades, it was decided to continue testing drag-type turbine blades for the enclosure
concept. Given the expected marketable size of a VAWT with an enclosure, it will likely be performing in
low- or no-wind conditions for the majority of the time. In light of this, it is fitting to use a drag-type
blade that can be self-starting.
33
The blade shapes of Savonius VAWTs are under constant improvement. When selecting the
blade shape, a balance between performance, cost, and ease of manufacture were the priorities. To
accomplish this, classic Savonius-profile blades in a two-stage turbine were chosen, as demonstrated by
Saha, et al, in the literature review. This combination best suited the need for a design that had a high
coefficient of performance and manufacturability. As Saha, et al, determined the design choices that
yielded the largest coefficient of performance were: two blades rather than three, a two stage turbine
rather than a one or three stage, and blades with a 12.5 degree twist. The increase in the coefficient of
performance from one stage to two, using semicircular blades, is 0.18 to 0.29. The coefficient of
performance for a two blade, two stage design with semicircular blades is 0.29. Adding a 12.5 degree
twist to the blade would marginally increase the coefficient of performance to 0.31, which was not done
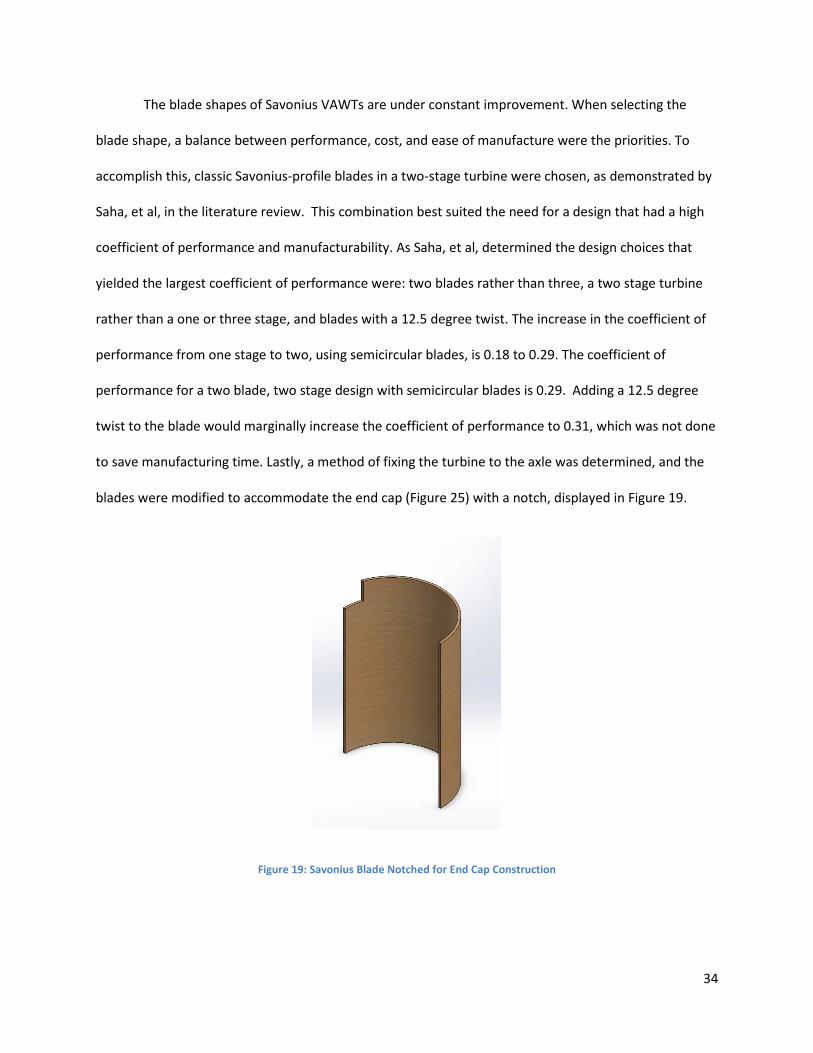
to save manufacturing time. Lastly, a method of fixing the turbine to the axle was determined, and the
blades were modified to accommodate the end cap (Figure 25) with a notch, displayed in Figure 19.
Figure 19: Savonius Blade Notched for End Cap Construction
34

Enclosure and Wind-Alignment Device
The enclosure that was tested in the prototype was the selected design from Brandmaier, et al.,
(2013). Their geometry will be replicated, and the appropriate gap between the turbine and enclosure
was assumed to be 2 inches. This dimension was not recorded by Brandmaier, et al.
After reviewing the literature, a passive wind-alignment device was chosen as the best fit for the
prototype. The enclosure will be lightweight and its center of gravity will be nearly concentric with the
center of the shaft, so only a small moment is needed to turn the enclosure. Active systems need
additional electronics and their associated cost exceeded the available budget. The tail vane concept
was chosen as the best means to control yaw for the wind-alignment device. After reviewing the forces
on the system, it was decided that the tail vane should be mounted in same horizontal plane as the
enclosure, rather than above or below, to avoid introducing additional roll or pitch to the shaft and
system. After design iterations and calculation of the effect of the tail vane size on a number of
parameters included in Appendix A, the proposed design was selected, shown below in Figure 20.
Figure 20: Enclosure and Tail Vane
35
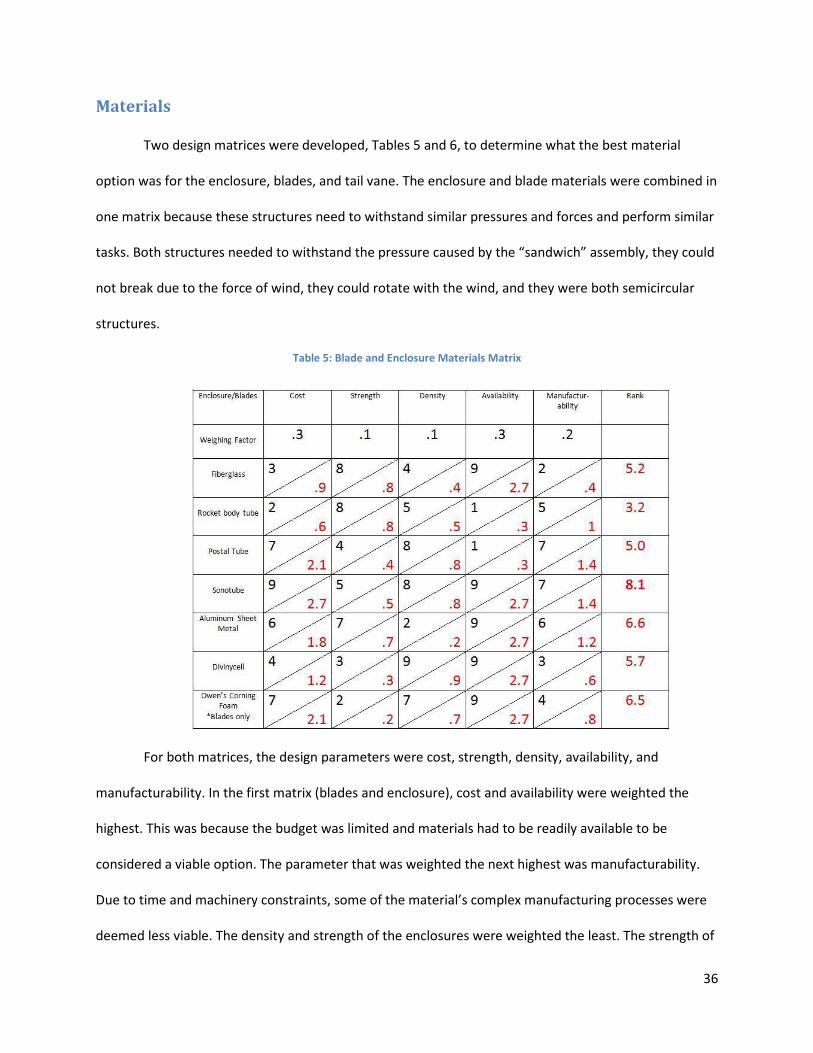
Materials
Two design matrices were developed, Tables 5 and 6, to determine what the best material
option was for the enclosure, blades, and tail vane. The enclosure and blade materials were combined in
one matrix because these structures need to withstand similar pressures and forces and perform similar
tasks. Both structures needed to withstand the pressure caused by the “sandwich” assembly, they could
not break due to the force of wind, they could rotate with the wind, and they were both semicircular
structures.
Table 5: Blade and Enclosure Materials Matrix
For both matrices, the design parameters were cost, strength, density, availability, and
manufacturability. In the first matrix (blades and enclosure), cost and availability were weighted the
highest. This was because the budget was limited and materials had to be readily available to be
considered a viable option. The parameter that was weighted the next highest was manufacturability.
Due to time and machinery constraints, some of the material’s complex manufacturing processes were
deemed less viable. The density and strength of the enclosures were weighted the least. The strength of
36
the blades is not as important for this application because the project only examined a prototype tested
in lower winds. The density was also listed as having lower importance because the structures
supporting the blades and enclosures could be made stronger to support a denser part, even though less
dense was preferred. Based on this matrix, the sonotube was concluded to be the best material choice
for the blades.
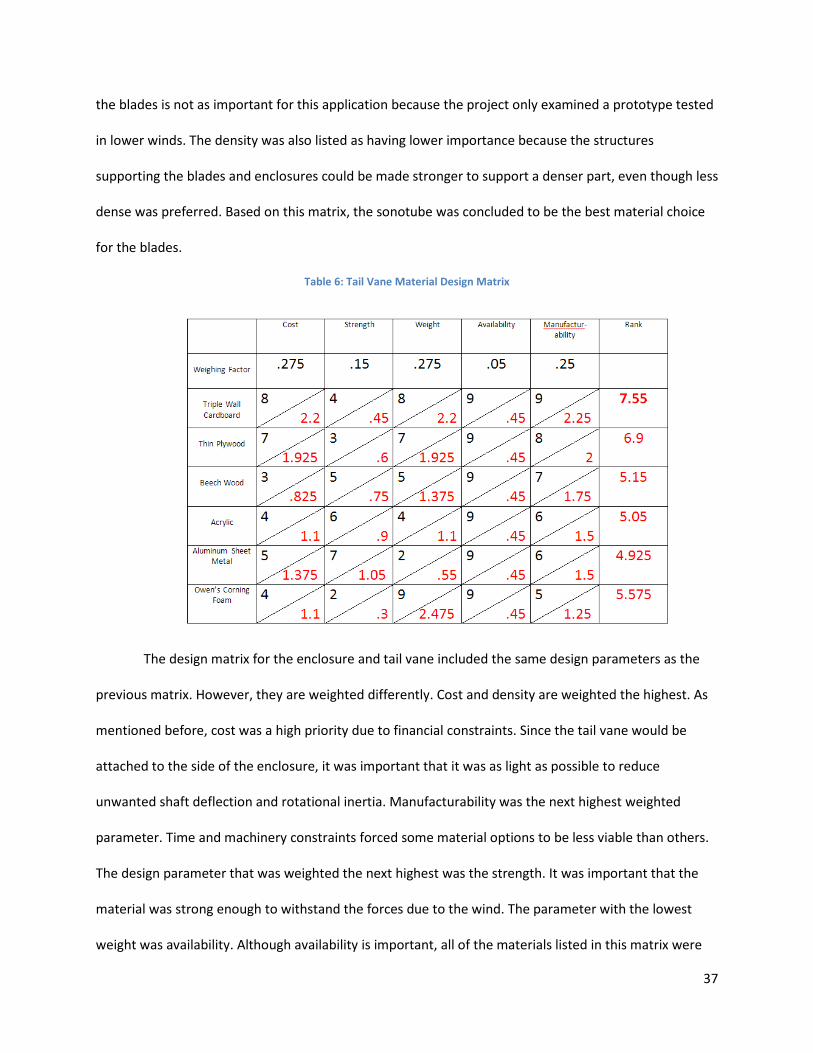
Table 6: Tail Vane Material Design Matrix
The design matrix for the enclosure and tail vane included the same design parameters as the
previous matrix. However, they are weighted differently. Cost and density are weighted the highest. As
mentioned before, cost was a high priority due to financial constraints. Since the tail vane would be
attached to the side of the enclosure, it was important that it was as light as possible to reduce
unwanted shaft deflection and rotational inertia. Manufacturability was the next highest weighted
parameter. Time and machinery constraints forced some material options to be less viable than others.
The design parameter that was weighted the next highest was the strength. It was important that the
material was strong enough to withstand the forces due to the wind. The parameter with the lowest
weight was availability. Although availability is important, all of the materials listed in this matrix were
37

readily available.
For this tail vane matrix, low cost, low density, high strength, high availability, and quick and
easy manufacturability received high ranks. The reasoning for this corresponds with the reasoning
previously discussed. Based on this matrix, triple-wall cardboard should be used for the tail vane. While
cardboard was shown to rank higher for the enclosure as well, sheet metal was later chosen due to its
ease of assembly. All of the specific information regarding the parameters can be found in Appendix B.
Assembly
The prototype was comprised of two distinct sub-assemblies, the turbine and enclosure, and
their respective fasteners and bearings, and the downstream components, the gearbox and motor. The
enclosure subassembly was supported by four ball transfer rollers mounted on the base, which act as
one large thrust bearing. This carried the load of the enclosure and allowed it to rotate about the shaft
independently. The turbine assembly was fixed to the shaft using two end caps, and rested on the
enclosure using another thrust bearing, not exploded in the view. This thrust bearing between the
turbine and enclosure supported the weight of the shaft, gear, and turbine assembly, as shown below in
Figure 21.
Figure 21: Lower Shaft Assembly
The upper section of the shaft can be seen below in Figure 22. The enclosure top disk, G, was
38

mated to the shaft, E, using a radial bearing, F. This radial bearing helped to keep the enclosure
concentric with the turbine shaft. The turbine subassembly was fixed to the shaft using two end caps,
one of which is seen here at H. The end caps secured to the upper and lower acrylic plates, and to the
shaft using set screws.
Figure 22: Upper Shaft Assembly Exploded View
Design Iterations
The design underwent a number of iterations as the component assembly was visualized and
the potential difficulties it presented. These iterations involved adapting materials selection as well as
part geometries to minimize assembly challenges. As new literary sources were acquired and
understood, the prototype was adapted accordingly to optimize the design. Brandmaier, et al, used
rectangular flat blades for ease of manufacturing. The blade design was changed despite the
manufacturing benefits and selected Savonius type blades because of their capability to increase the
coefficient of performance the turbine, as described in our literary review. Originally, the prototype only
included one stage with four Savonius blades shown in Figure 23 below.
39
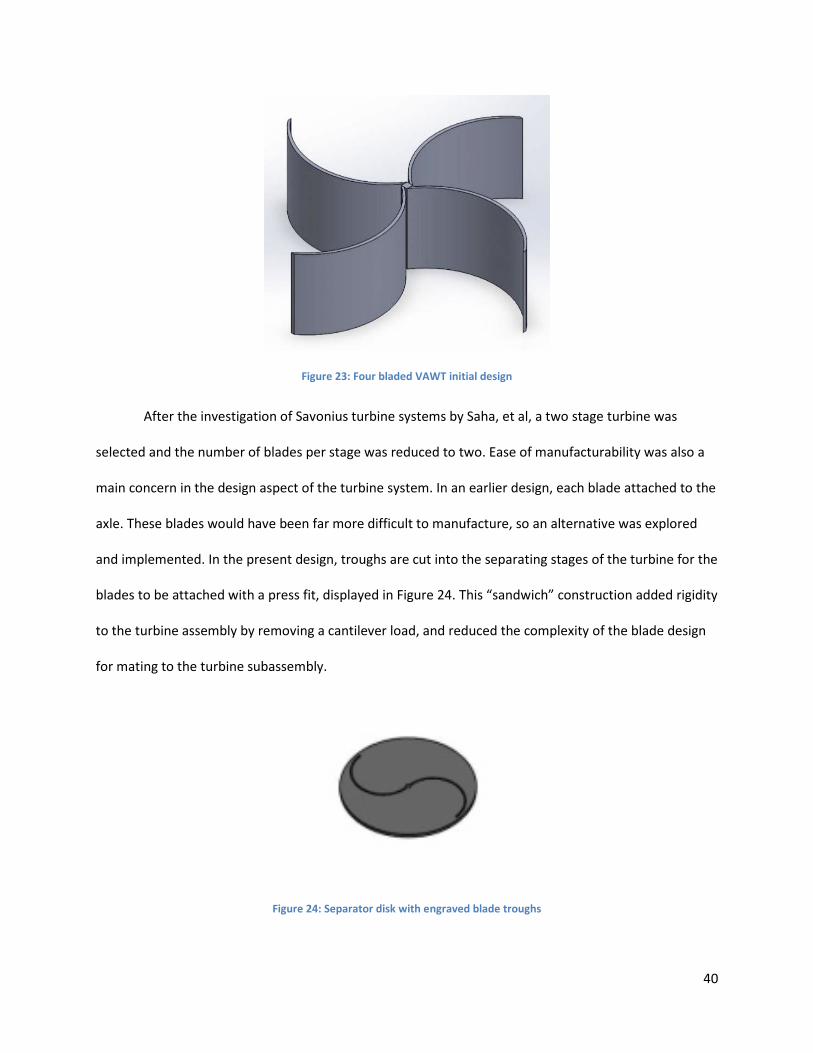
Figure 23: Four bladed VAWT initial design
After the investigation of Savonius turbine systems by Saha, et al, a two stage turbine was
selected and the number of blades per stage was reduced to two. Ease of manufacturability was also a
main concern in the design aspect of the turbine system. In an earlier design, each blade attached to the
axle. These blades would have been far more difficult to manufacture, so an alternative was explored
and implemented. In the present design, troughs are cut into the separating stages of the turbine for the
blades to be attached with a press fit, displayed in Figure 24. This “sandwich” construction added rigidity
to the turbine assembly by removing a cantilever load, and reduced the complexity of the blade design
for mating to the turbine subassembly.
Figure 24: Separator disk with engraved blade troughs
40
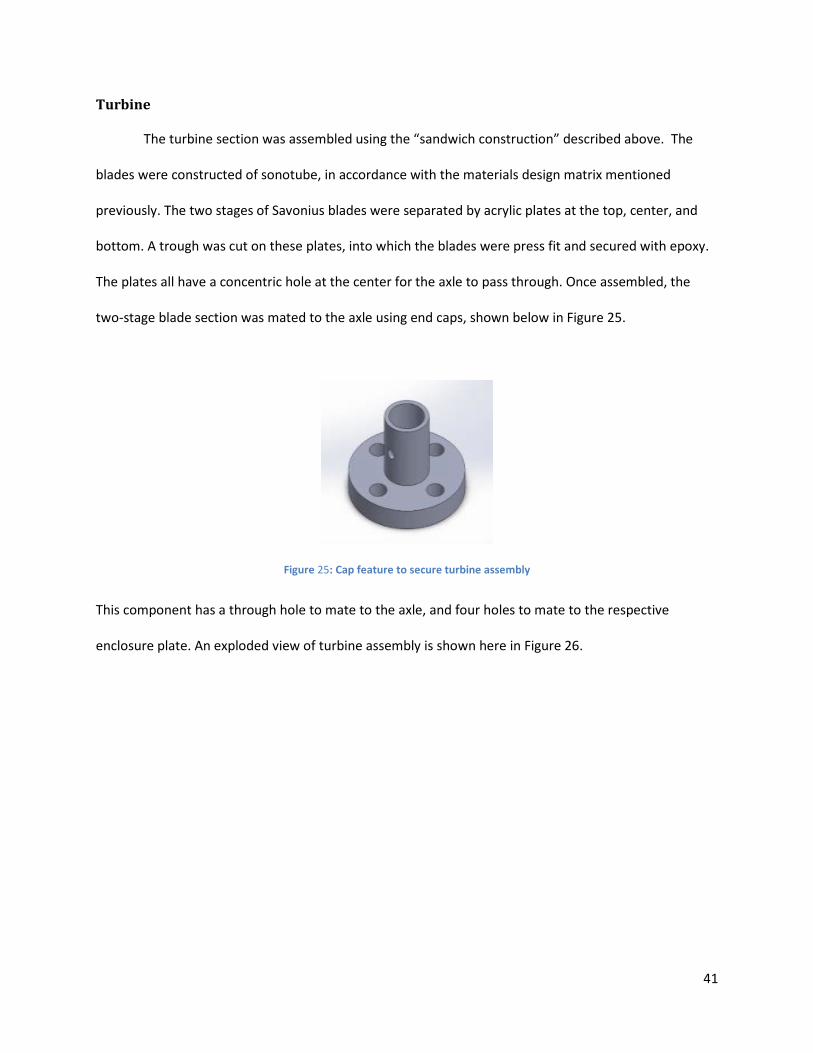
Turbine
The turbine section was assembled using the “sandwich construction” described above. The
blades were constructed of sonotube, in accordance with the materials design matrix mentioned
previously. The two stages of Savonius blades were separated by acrylic plates at the top, center, and
bottom. A trough was cut on these plates, into which the blades were press fit and secured with epoxy.
The plates all have a concentric hole at the center for the axle to pass through. Once assembled, the
two-stage blade section was mated to the axle using end caps, shown below in Figure 25.
Figure 25: Cap feature to secure turbine assembly
This component has a through hole to mate to the axle, and four holes to mate to the respective
enclosure plate. An exploded view of turbine assembly is shown here in Figure 26.
41
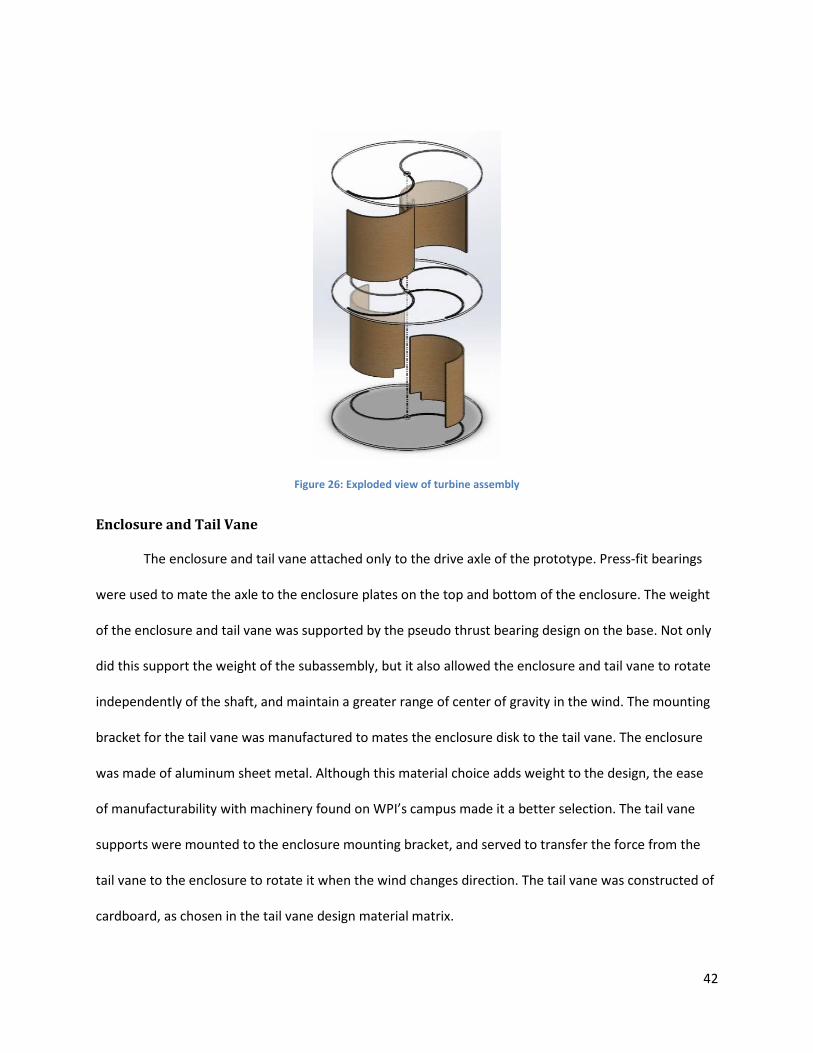
Figure 26: Exploded view of turbine assembly
Enclosure and Tail Vane
The enclosure and tail vane attached only to the drive axle of the prototype. Press-fit bearings
were used to mate the axle to the enclosure plates on the top and bottom of the enclosure. The weight
of the enclosure and tail vane was supported by the pseudo thrust bearing design on the base. Not only
did this support the weight of the subassembly, but it also allowed the enclosure and tail vane to rotate
independently of the shaft, and maintain a greater range of center of gravity in the wind. The mounting
bracket for the tail vane was manufactured to mates the enclosure disk to the tail vane. The enclosure
was made of aluminum sheet metal. Although this material choice adds weight to the design, the ease
of manufacturability with machinery found on WPI’s campus made it a better selection. The tail vane
supports were mounted to the enclosure mounting bracket, and served to transfer the force from the
tail vane to the enclosure to rotate it when the wind changes direction. The tail vane was constructed of
cardboard, as chosen in the tail vane design material matrix.
42
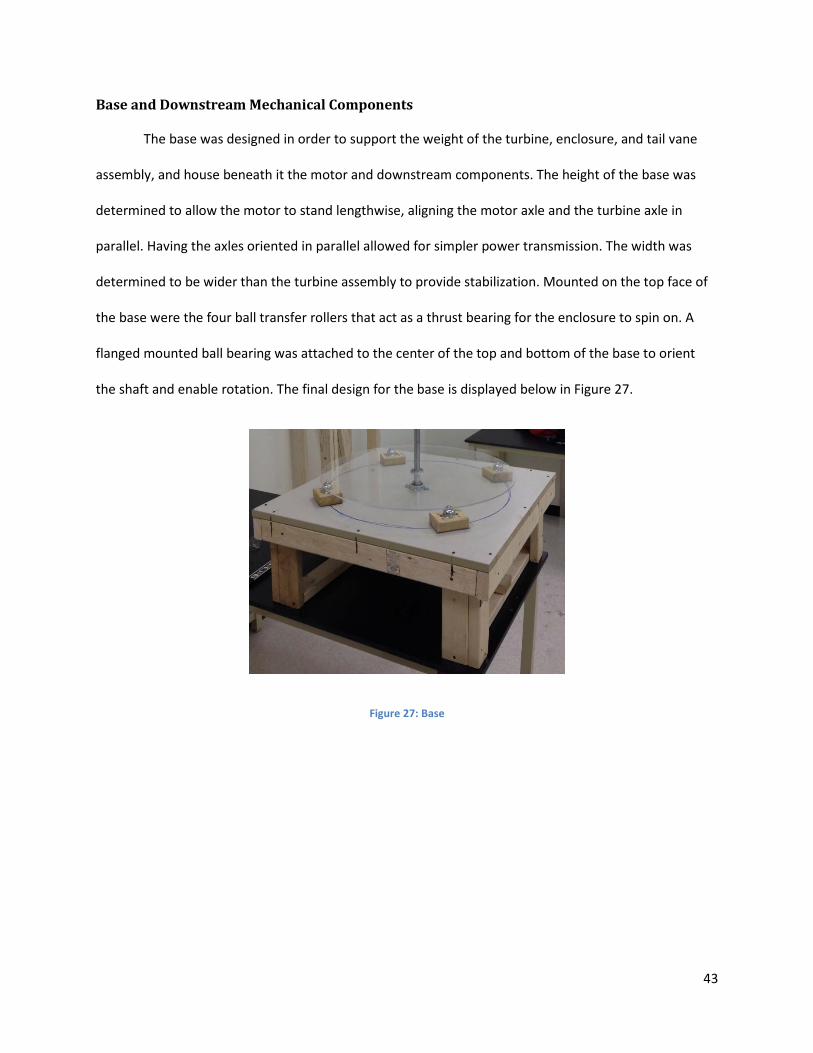
Base and Downstream Mechanical Components
The base was designed in order to support the weight of the turbine, enclosure, and tail vane
assembly, and house beneath it the motor and downstream components. The height of the base was
determined to allow the motor to stand lengthwise, aligning the motor axle and the turbine axle in
parallel. Having the axles oriented in parallel allowed for simpler power transmission. The width was
determined to be wider than the turbine assembly to provide stabilization. Mounted on the top face of
the base were the four ball transfer rollers that act as a thrust bearing for the enclosure to spin on. A
flanged mounted ball bearing was attached to the center of the top and bottom of the base to orient
the shaft and enable rotation. The final design for the base is displayed below in Figure 27.
Figure 27: Base
43
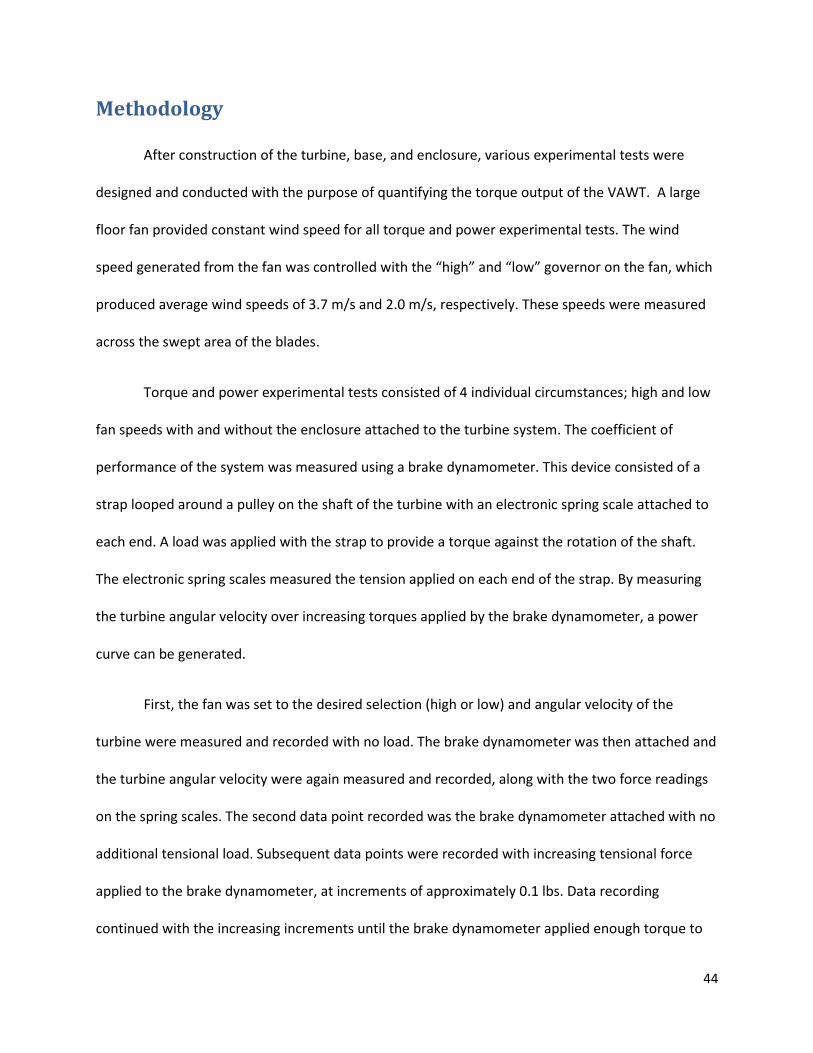
Methodology
After construction of the turbine, base, and enclosure, various experimental tests were
designed and conducted with the purpose of quantifying the torque output of the VAWT. A large
floor fan provided constant wind speed for all torque and power experimental tests. The wind
speed generated from the fan was controlled with the “high” and “low” governor on the fan, which
produced average wind speeds of 3.7 m/s and 2.0 m/s, respectively. These speeds were measured
across the swept area of the blades.
Torque and power experimental tests consisted of 4 individual circumstances; high and low
fan speeds with and without the enclosure attached to the turbine system. The coefficient of
performance of the system was measured using a brake dynamometer. This device consisted of a
strap looped around a pulley on the shaft of the turbine with an electronic spring scale attached to
each end. A load was applied with the strap to provide a torque against the rotation of the shaft.
The electronic spring scales measured the tension applied on each end of the strap. By measuring
the turbine angular velocity over increasing torques applied by the brake dynamometer, a power
curve can be generated.
First, the fan was set to the desired selection (high or low) and angular velocity of the
turbine were measured and recorded with no load. The brake dynamometer was then attached and
the turbine angular velocity were again measured and recorded, along with the two force readings
on the spring scales. The second data point recorded was the brake dynamometer attached with no
additional tensional load. Subsequent data points were recorded with increasing tensional force
applied to the brake dynamometer, at increments of approximately 0.1 lbs. Data recording
continued with the increasing increments until the brake dynamometer applied enough torque to
44
the shaft to stall the turbine.
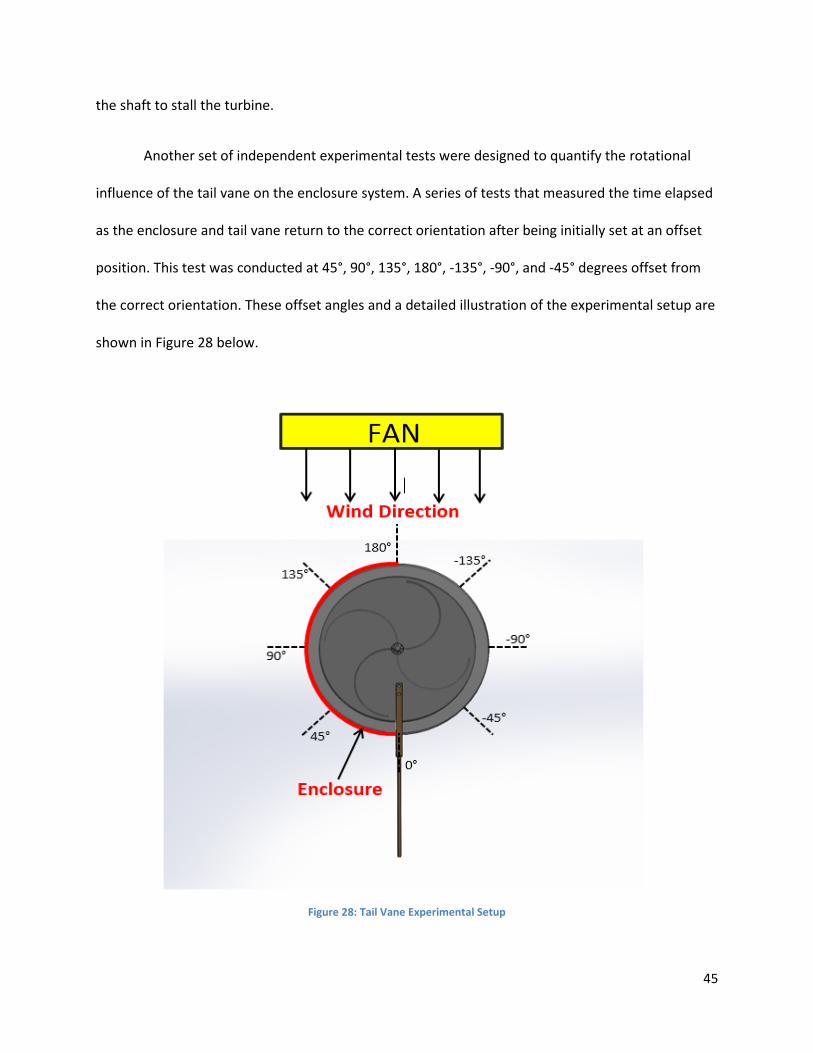
Another set of independent experimental tests were designed to quantify the rotational
influence of the tail vane on the enclosure system. A series of tests that measured the time elapsed
as the enclosure and tail vane return to the correct orientation after being initially set at an offset
position. This test was conducted at 45°, 90°, 135°, 180°, -135°, -90°, and -45° degrees offset from
the correct orientation. These offset angles and a detailed illustration of the experimental setup are
shown in Figure 28 below.
Figure 28: Tail Vane Experimental Setup
45

The fan blade speed was set to the high on the governor, providing the same 3.7 m/s
average wind speed across the swept area of the turbine. The tail vane was set each test to an
initial position of increasing multiples of 45°. The tail vane was then released, and elapsed time was
recorded as the tail vane rotated the enclosure system to the correct orientation.
Equipment selection for all of the experimental testing was primarily driven by availability at
facilities on WPI’s campus and budget limitations. The main component of the brake dynamometer
was a digital spring scale shown in Figure 29. The load capacity of the scale is 40 kg, and is accurate
to ± 10 grams.
Figure 29: Portable Electronic Spring Scale
The angular velocity of the turbine was also measured during experimental testing. Angular
velocity was measured in units of revolutions per minute (rpm) using a digital laser tachometer,
shown in Figure 30. The operational range of this instrument is 2.5 to 99,999 rpm and is accurate to
± 0.05%.
46
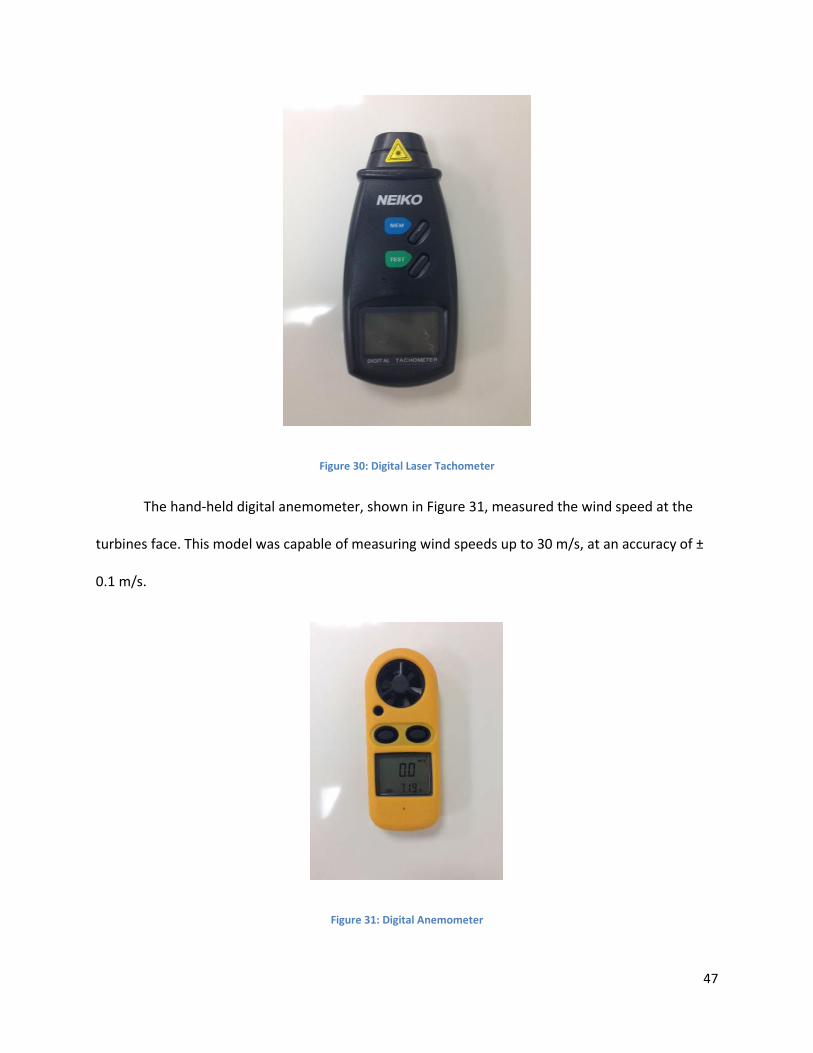
Figure 30: Digital Laser Tachometer
The hand-held digital anemometer, shown in Figure 31, measured the wind speed at the
turbines face. This model was capable of measuring wind speeds up to 30 m/s, at an accuracy of ±
0.1 m/s.
Figure 31: Digital Anemometer
47
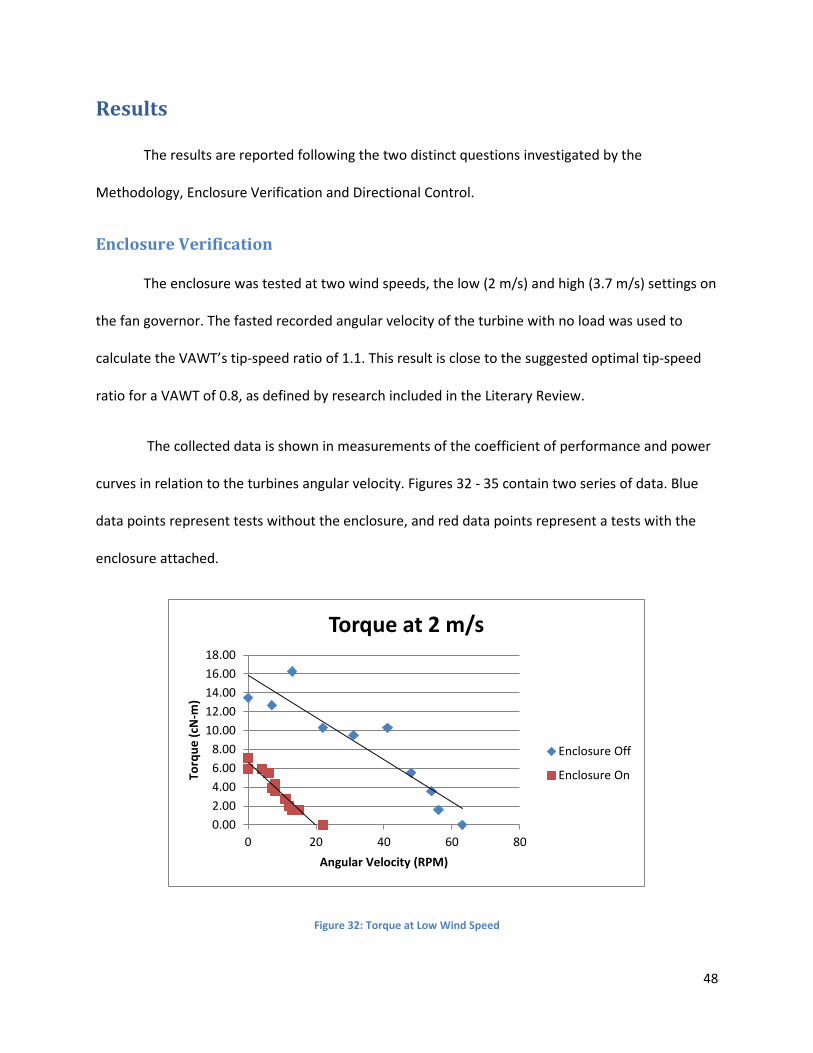
Results The results are reported following the two distinct questions investigated by the
Methodology, Enclosure Verification and Directional Control.
Enclosure Verification The enclosure was tested at two wind speeds, the low (2 m/s) and high (3.7 m/s) settings on
the fan governor. The fasted recorded angular velocity of the turbine with no load was used to
calculate the VAWT’s tip-speed ratio of 1.1. This result is close to the suggested optimal tip-speed
ratio for a VAWT of 0.8, as defined by research included in the Literary Review.
The collected data is shown in measurements of the coefficient of performance and power
curves in relation to the turbines angular velocity. Figures 32 - 35 contain two series of data. Blue
data points represent tests without the enclosure, and red data points represent a tests with the
enclosure attached.
Figure 32: Torque at Low Wind Speed
0.002.004.006.008.00
10.0012.0014.0016.0018.00
0 20 40 60 80
Torq
ue (c
N-m
)
Angular Velocity (RPM)
Torque at 2 m/s
Enclosure Off
Enclosure On
48

Figure 33: Power at Low Wind Speed
Figure 34: Torque at High Wind Speed
0.0000.0500.1000.1500.2000.2500.3000.3500.4000.4500.500
0 20 40 60 80
Pow
er (W
atts
)
Angular Velocity (RPM)
Power at 2 m/s
Enclosure Off
Enclosure On
0.00
5.00
10.00
15.00
20.00
25.00
30.00
0 20 40 60 80 100
Torq
ue (c
N-m
)
Angular Velocity (RPM)
Torque at 3.7 m/s
Enclosure Off
Enclosure On
49
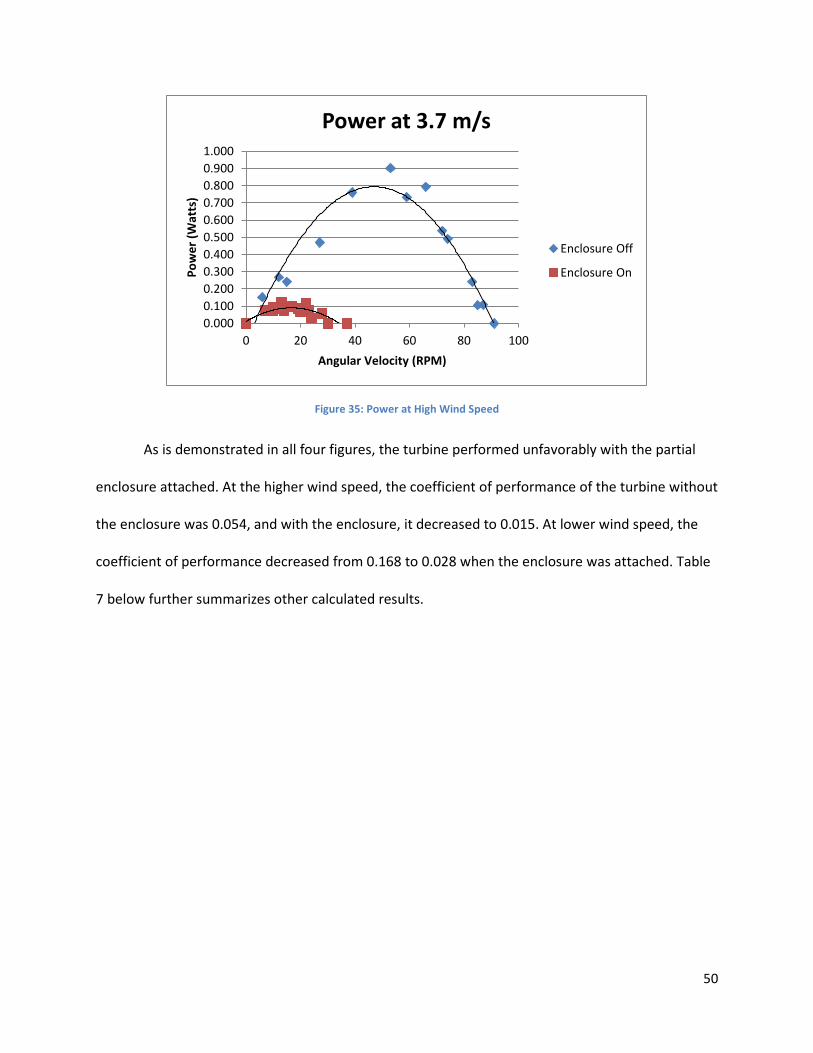
Figure 35: Power at High Wind Speed
As is demonstrated in all four figures, the turbine performed unfavorably with the partial
enclosure attached. At the higher wind speed, the coefficient of performance of the turbine without
the enclosure was 0.054, and with the enclosure, it decreased to 0.015. At lower wind speed, the
coefficient of performance decreased from 0.168 to 0.028 when the enclosure was attached. Table
7 below further summarizes other calculated results.
0.0000.1000.2000.3000.4000.5000.6000.7000.8000.9001.000
0 20 40 60 80 100
Pow
er (W
atts
)
Angular Velocity (RPM)
Power at 3.7 m/s
Enclosure Off
Enclosure On
50
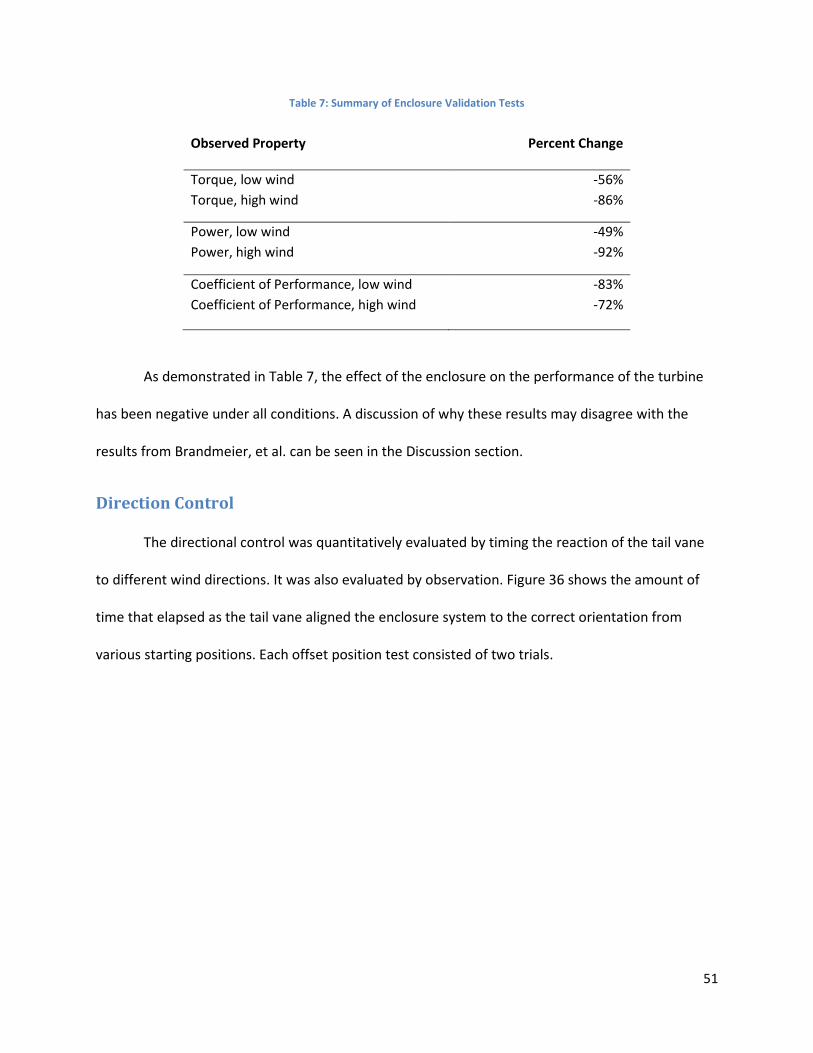
Table 7: Summary of Enclosure Validation Tests
Observed Property Percent Change
Torque, low wind Torque, high wind
-56% -86%
Power, low wind Power, high wind
-49% -92%
Coefficient of Performance, low wind Coefficient of Performance, high wind
-83% -72%
As demonstrated in Table 7, the effect of the enclosure on the performance of the turbine
has been negative under all conditions. A discussion of why these results may disagree with the
results from Brandmeier, et al. can be seen in the Discussion section.
Direction Control
The directional control was quantitatively evaluated by timing the reaction of the tail vane
to different wind directions. It was also evaluated by observation. Figure 36 shows the amount of
time that elapsed as the tail vane aligned the enclosure system to the correct orientation from
various starting positions. Each offset position test consisted of two trials.
51

Figure 36: Tail Vane Alignment Reaction Speed
As demonstrated in the data, the direction of wind change has a notable effect on the
reaction time of the tail vane. Positive angles, wind blowing into the enclosure creating a mostly
blocked front facing area, were adjusted to quicker than negative angles. Notice that with the
exception of the tail vane being aligned directly into the wind, the -45 degree data points took
longer than any other wind angle to align the enclosure. At 180 degrees, the enclosure rotated
around the positive direction, fully blocking the turbine from oncoming wind during the alignment.
Observational assessment of the tail vane allowed assessment of the performance of the
tail vane in ways that are not captured by the reaction time test. Under steady conditions, the tail
vane maintains a straight alignment with little oscillation, which is critical to the success of the
turbine in the environment. There was some concern that the tail vane would find equilibrium on a
skewed angle; that did not occur. If that were the case, the position or mounting angle of the tail
vane would have to be adjusted. When the wind angle changes, there is a few second lag before the
enclosure is realigned with the wind.
52

Discussion
Enclosure Verification
After comparing the results of the enclosure evaluation, it was determined that the partial
enclosure reduced the coefficient of performance significantly by 83% in low wind speed and 72% in
high wind speed tests. The other two calculated characteristics, output torque and power, also
demonstrated large decreases in both wind conditions. These results clearly contradict the conclusions
determined by Brandmaier, et al. There are two primary factors that may have led to the conflicting
results, as well as other notable challenges that may have affected the results. These factors include the
difference in blade shape and variations in enclosure dimensions, as well as testing setup challenges.
The most significant difference between the two studies is the blade shape. Brandmaier, et al.,
designed a turbine with flat blades during their testing, as opposed to the Savonius blades chosen due
to their increased coefficient of performance and ability to self-start, both critical for small scale VAWTs.
The difference in blade shape has significant effects on the fluid flow primarily due to turbine solidity
and appears to have great effect on the merits of an enclosure. The tested enclosure shape had been
optimized for flat blade turbines, so by extension there may be a shape more optimal for Savonius
blades, which have much higher solidity than flat blades, which relies on an entirely different flow
strategy to increase performance.
The second factor that may contribute to contrasting results is that a dimension regarding the
distance between the turbine and enclosure was omitted from the prototype drawings in the study
conducted by Brandmaier, et al. This space will affect the fluid flow inside the turbine blades and
enclosure and affect its coefficient of performance. As a result, an approximation was made following a
significant scale increase in the entire turbine system, which may lead to conflicting results.
53

There were additional limitations that restricted testing options. Since one objective of the
project was to test the prototype for “real world” application, the ideal testing environment would have
been in an outdoor setting with a data acquisition system. However, initial testing of the turbine
required a controlled environment. As a result, a testing procedure that relied on a floor fan was
adopted, for its advantages in providing constant wind speed and directions, a necessity when recording
data manually with handheld devices.
The available wind tunnels were inadequate for the scale of the studied turbine, so a large floor
fan was used as a controlled wind source. The floor fan posed many limitations in regards to its airspeed
uniformity, max wind speed, and diameter. The wind speed generated by the fan was nearly zero at the
center and increased radially outward. It was clear that the tests were performed without uniform flow
across the turbine, but it was unclear how this inconsistency may have affected the fluid flow. The
output area of the fan was a different shape than the turbine swept area, which created further
inconsistencies in creating uniform flow. Given the variability in wind speeds, an approximation of the
average wind speed over the turbine had to be used. Since fan output was limited, the maximum
observable wind speed was lower than projected real-world conditions, causing the turbine to produce
a lower torque than design estimates. The torque produced was not enough to overcome the startup
torque of the motor. As a result, the use of a brake dynamometer was used to measure torque, which
provided more reliable results. These factors made the testing scenario vary considerably from real-
world, outdoor performance.
Direction Control
The tail vane was able to effectively rotate the enclosure into the optimal position from various
initial positions. Predictably, the slowest time occurred when the tail vane was in the 180° position, as it
took some time before the tail vane was far enough to one side to catch the wind. In outdoor scenarios
54
this would not be a concern as the wind is seldom perfectly straight long enough for this delay to occur.
Aside from this position, the -45° position was the next slowest. This result was also expected because in
this position the enclosure and tail vane are on opposite sides of the turbine in respect to the wind
source. The enclosure catches wind and enacts a torque on the shaft just like the tail vane, and in this -
45° position they are opposed. Since the enclosure caused a decrease in coefficient of performance, the
usefulness of the tail vane is questionable. Any redesign of the enclosure will require revising the design
strategy of the tail vane.
55

Recommendations
Enclosure Verification
After it was determined that the enclosure reduced the coefficient of performance, some ad hoc
experimentation led to a new conceptual path for an enclosure for Savonius blades. Barriers were
arranged as depicted in Figure 37 to generate a funneling effect towards the advancing blade, increasing
the speed of the incoming wind. These barriers concentrated the wind on the advancing blade, and led
to a power increase of 34%. This test was only conducted with the fan speed governor set to high (3.7
m/s).
Figure 37: Funneling Experimental Setup
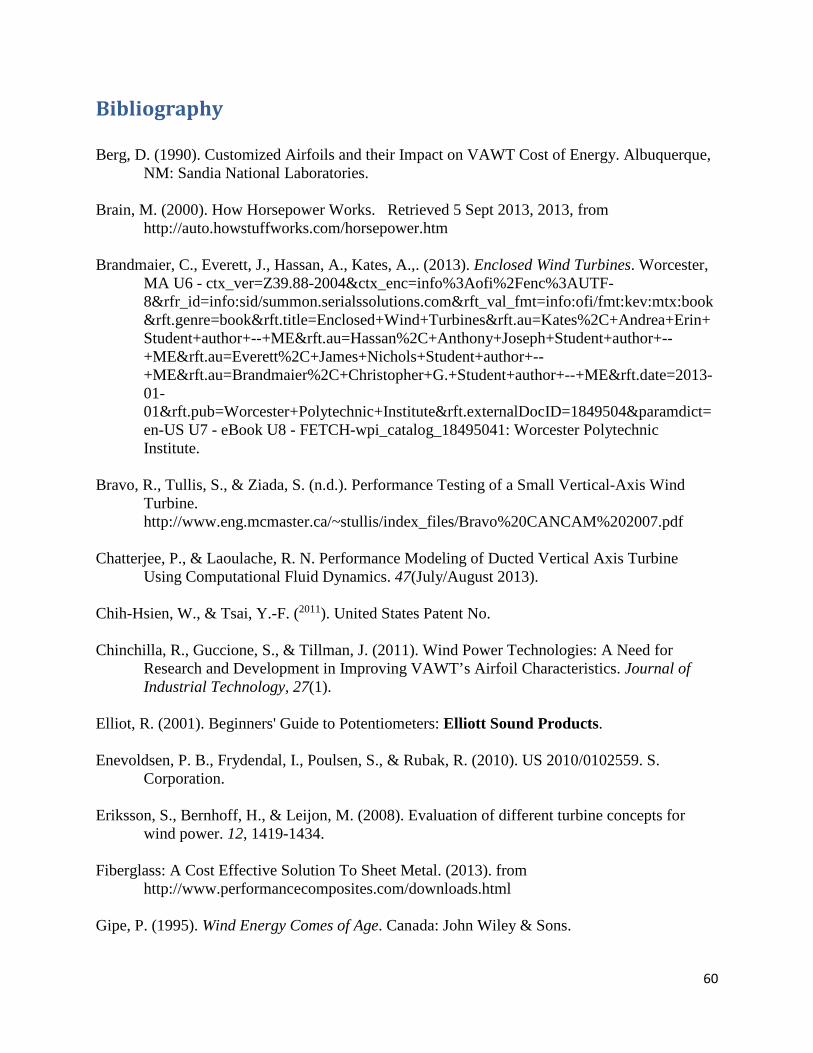
It was concluded that the funneling of the wind increased power more effectively than blocking
56
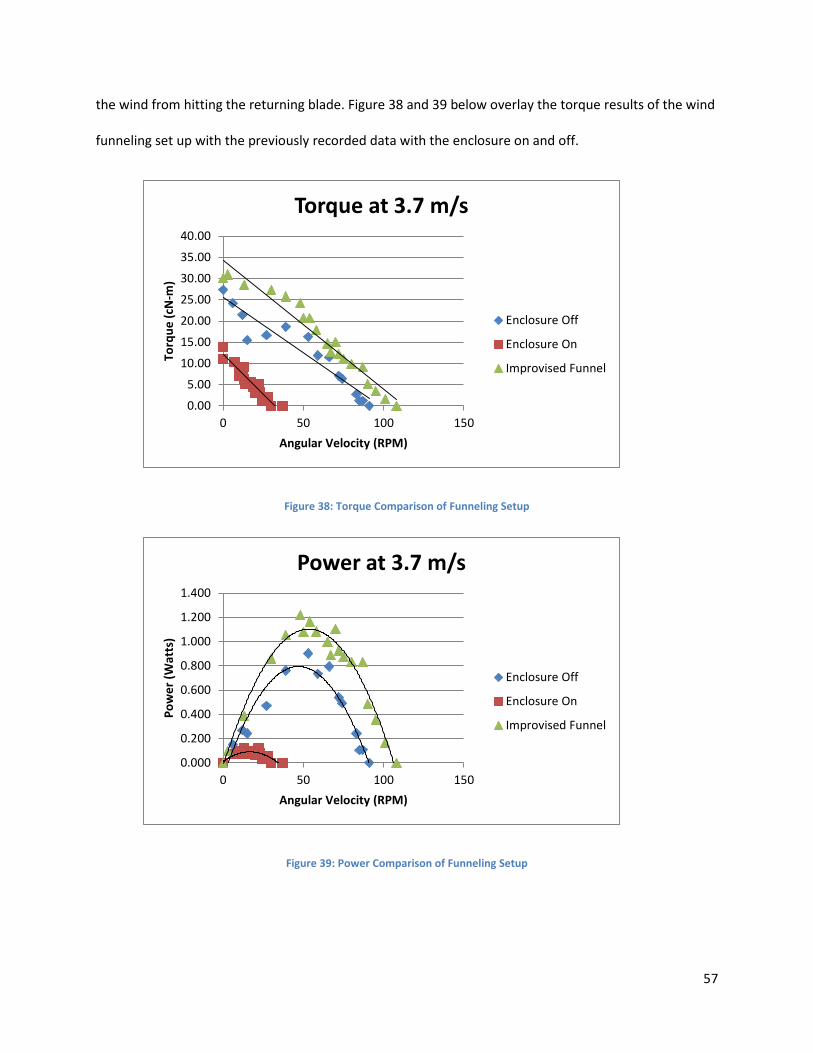
the wind from hitting the returning blade. Figure 38 and 39 below overlay the torque results of the wind
funneling set up with the previously recorded data with the enclosure on and off.
Figure 38: Torque Comparison of Funneling Setup
Figure 39: Power Comparison of Funneling Setup
0.00
5.00
10.00
15.00
20.00
25.00
30.00
35.00
40.00
0 50 100 150
Torq
ue (c
N-m
)
Angular Velocity (RPM)
Torque at 3.7 m/s
Enclosure Off
Enclosure On
Improvised Funnel
0.000
0.200
0.400
0.600
0.800
1.000
1.200
1.400
0 50 100 150
Pow
er (W
atts
)
Angular Velocity (RPM)
Power at 3.7 m/s
Enclosure Off
Enclosure On
Improvised Funnel
57

A similar setup where the front barrier was placed blocking the same area of the turbine
without funneling it into the blades performed much worse. Future efforts to design an enclosure for
Savonius bladed VAWTs could focus on an enclosure that operates principally as a funnel or Venturi
seem to be much more fruitful than an enclosure that blocks wind from the returning blades, the
desired effect of the partial enclosure proposed by Brandmaier, et al.
Directional Control
A wind concentrating enclosure would also need to be aligned with wind direction. The shape
and size of the new enclosure design will determine whether a passive or active alignment device should
be used. If the enclosure increases in profile by any substantial margin, an active device may be needed.
58

Conclusion
VAWT technology is a promising energy harnessing vessel for low speed and
multidirectional wind environments. As with all technologies, research and development can
discover improvements in coefficient of performance of VAWTs. Brandmaier, et al. presented
research that a partial enclosure across half the front-facing swept area of a flat bladed turbine
improved the angular velocity of the turbine, suggesting an increase in the coefficient of
performance. The goal of this project was to design, build, and evaluate a Savonius VAWT prototype
with the Brandmaier, et al, enclosure and a wind alignment device.
Through experimental testing, the Brandmaier, et al, enclosure was found to reduce the
torque output, power output, and the coefficient of performance of the VAWT in both low and high
wind speed configurations. Results from brake dynamometer measurements of the turbine with the
partial enclosure attached exhibited decreases in coefficient of performance by 92% and 86%,
torque output by 56% and 86%, and power output by 49% and 92%, for low and high wind speed,
respectively. However, ad hoc testing of the funneling arrangement improved the coefficient of
performance 34% against the results of those without the enclosure.
A passive tail vane was proposed to enable the enclosure to continuously reorient itself in
the optimal position contingent on the wind direction. After testing the tail vane in seven offset
positions at multiples of 45°, it was concluded the tail vane acts properly, and rotates the enclosure
to the correct orientation regardless of the wind direction including completely opposing wind.
Although the overall results prove the effectiveness of the current tail vane and enclosure system,
any modification to the enclosure design will mandate a reevaluation of an appropriate wind
alignment device.
59
Bibliography
Berg, D. (1990). Customized Airfoils and their Impact on VAWT Cost of Energy. Albuquerque, NM: Sandia National Laboratories.
Brain, M. (2000). How Horsepower Works. Retrieved 5 Sept 2013, 2013, from
http://auto.howstuffworks.com/horsepower.htm Brandmaier, C., Everett, J., Hassan, A., Kates, A.,. (2013). Enclosed Wind Turbines. Worcester,
MA U6 - ctx_ver=Z39.88-2004&ctx_enc=info%3Aofi%2Fenc%3AUTF-8&rfr_id=info:sid/summon.serialssolutions.com&rft_val_fmt=info:ofi/fmt:kev:mtx:book&rft.genre=book&rft.title=Enclosed+Wind+Turbines&rft.au=Kates%2C+Andrea+Erin+Student+author+--+ME&rft.au=Hassan%2C+Anthony+Joseph+Student+author+--+ME&rft.au=Everett%2C+James+Nichols+Student+author+--+ME&rft.au=Brandmaier%2C+Christopher+G.+Student+author+--+ME&rft.date=2013-01-01&rft.pub=Worcester+Polytechnic+Institute&rft.externalDocID=1849504¶mdict=en-US U7 - eBook U8 - FETCH-wpi_catalog_18495041: Worcester Polytechnic Institute.
Bravo, R., Tullis, S., & Ziada, S. (n.d.). Performance Testing of a Small Vertical-Axis Wind
Turbine. http://www.eng.mcmaster.ca/~stullis/index_files/Bravo%20CANCAM%202007.pdf
Chatterjee, P., & Laoulache, R. N. Performance Modeling of Ducted Vertical Axis Turbine
Using Computational Fluid Dynamics. 47(July/August 2013). Chih-Hsien, W., & Tsai, Y.-F. (2011). United States Patent No. Chinchilla, R., Guccione, S., & Tillman, J. (2011). Wind Power Technologies: A Need for
Research and Development in Improving VAWT’s Airfoil Characteristics. Journal of Industrial Technology, 27(1).
Elliot, R. (2001). Beginners' Guide to Potentiometers: Elliott Sound Products. Enevoldsen, P. B., Frydendal, I., Poulsen, S., & Rubak, R. (2010). US 2010/0102559. S.
Corporation. Eriksson, S., Bernhoff, H., & Leijon, M. (2008). Evaluation of different turbine concepts for
wind power. 12, 1419-1434. Fiberglass: A Cost Effective Solution To Sheet Metal. (2013). from
http://www.performancecomposites.com/downloads.html Gipe, P. (1995). Wind Energy Comes of Age. Canada: John Wiley & Sons.
60

Golecha, K., Eldho, T. I., & Pradbu, S. V. Performance Study of modified Savonius water turbine with two deflector plates. Bombay, India: Indian Institute of Technology.
Greenpeace. (2013). Quit Coal. Retrieved September 29th, 2013, from
http://www.greenpeace.org/international/en/campaigns/climate-change/coal/ Guittet, L., Kusulja, M., & Maitre, T. (2004). Setting up of an experiment to test vertical axis
water turbines. Heath, M. A., Walshe, J. D., & Watson, S. J. (2007). Estimating the potential Yield of Small
Building-mounted Wind Turbines. Wind Energy, (10), 271-287. Holak, R., & Mourkas, M. (2012). Enclosed Vertical Axis Wind Turbines (pp. 41): Worcester
Polytechnic Institute. Islam, M. (2010). Design and Development of a Vertical Axis Micro Wind Turbine. (Master of
Science), University of Manchester. Islam, M., Ahmed, F. U., Ting, D. S., & Fartaj, A. (2008). Design analysis of fixed-pitch
straight-bladed vertical axis wind turbines with an alternative material. Retrieved May, 5, 2010.
Islam, M., Ting, D. S.-K., & Fartaj, A. (2008). Aerodynamic models for Darrieus-type straight-
bladed vertical axis wind turbines. Renewable and Sustainable Energy Reviews, 12(4), 1087-1109.
Islam, M. Q., Hasan, M. N., & Saha, S. (2005). EXPERIMENTAL INVESTIGATION OF
AERODYNAMIC CHARACTERISTICS OF TWO, THREE AND FOUR BLADED S-SHAPED STATIONARY SAVONIUS ROTORS. Paper presented at the The Proceeding of International Conference on Mechanical Engineering.
Johnson, G. L. (1985). Wind energy systems: Prentice-Hall Englewood Cliffs (NJ). Kodric, A. A. (1989). United States Patent No. Kroldrup, L. (2010). Gains in Global Wind Capacity Reported, The New York Times. Retrieved
from http://green.blogs.nytimes.com/2010/02/15/gains-in-global-wind-capacity-reported/ Kuo, Hai P. (2011) U.S Patent “Wind turbine with gale protection”: Google Patents Letcher, T. (2010). Small Scale Wind Turbines Optimized for Low Wind Speeds.
Manwell, J. F., McGowan, J. G., & Rogers, A. L. (2002). Wind Energy Explained - Theory, Design & Applications (1 ed.): Wiley. Menet, J., Valdes, L., & Menart, B. (2001). A Comparative Calculation of the Wind Turbines
61

Capacities on the Basis of the L–σ Criterion (pp. 491-506). Mohamed, M. H., Janiga, G., Pap, E., & Thévenin, D. (2010). Optimization of Savonius turbines
using an obstacle shielding the returning blade. Renewable Energy, 35(11), 2618-2626. doi: http://dx.doi.org/10.1016/j.renene.2010.04.007
Mohamed, M. H., Janiga, G., Pap, E., & Thévenin, D. (2011). Optimal blade shape of a modified
Savonius turbine using an obstacle shielding the returning blade. Energy Conversion and Management, 52(1), 236-242. doi: http://dx.doi.org/10.1016/j.enconman.2010.06.070
Paraschivoiu, I. (2002). Wind Turbine Design: With Emphasis on Darrieus Concept Peinke, J., Schaumann, P., & Barth, S. (2007). Wind Energy: Proceeding of the Euromech
Colloquium: Springer-Verlang Berlin Heidelberg. Poole, A. B. (2007). Infuser augmented vertical wind turbine electrical generating system:
Google Patents. Saha, U., Thotla, S., & Maity, D. (2008). Optimum design configuration of Savonius rotor
through wind tunnel experiments. Journal of Wind Engineering and Industrial Aerodynamics, 96(8), 1359-1375.
Seguro, J., & Lambert, T. (2000). Modern estimation of the parameters of the Weibull wind
speed distribution for wind energy analysis. Journal of Wind Engineering and Industrial Aerodynamics, 85(1), 75-84.
WindStreamPower. (2013). Permanent Magnet DC Generator 443540. Retrieved 9/12/2013 Wortman, A. J. (1983). Introduction to Wind Turbine Engineering: Butterworth-Heinemann.
62

Appendices
Appendix A: Design Proof Calculations
These calculations are shown with preliminary values that have been altered numerous times
throughout the design and experimental testing processes. However, the governing equations have
remained intact.
63

64

65
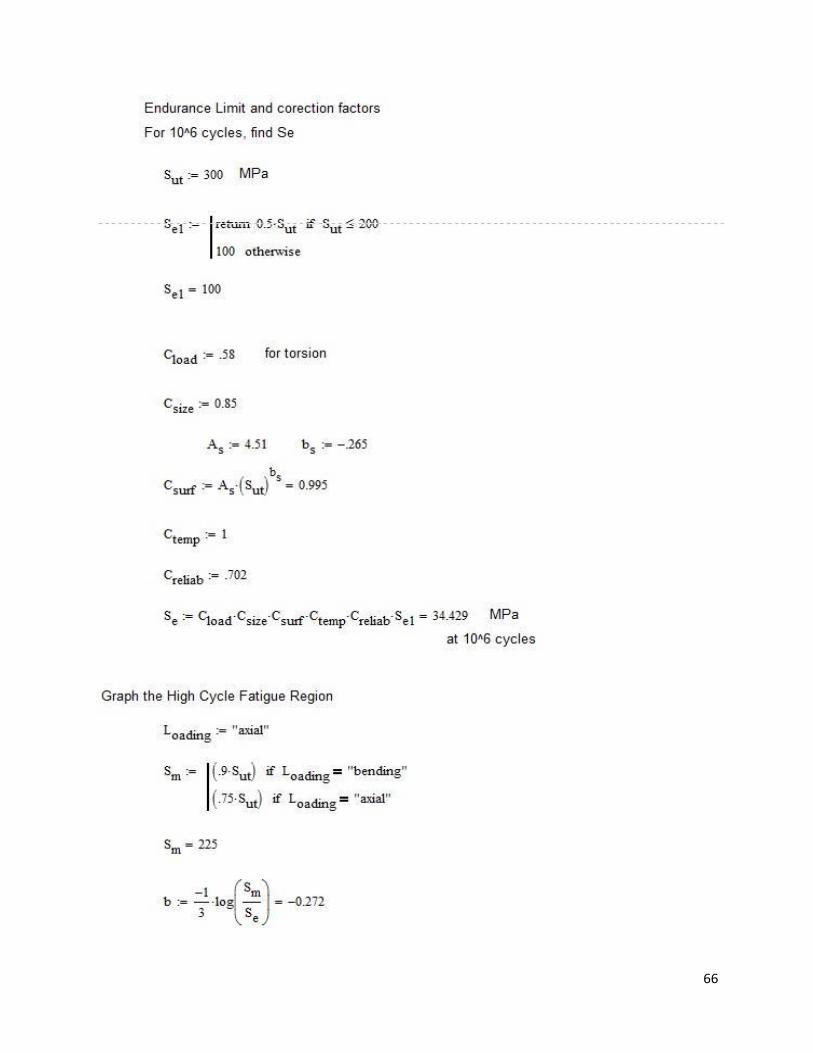
66

67

68
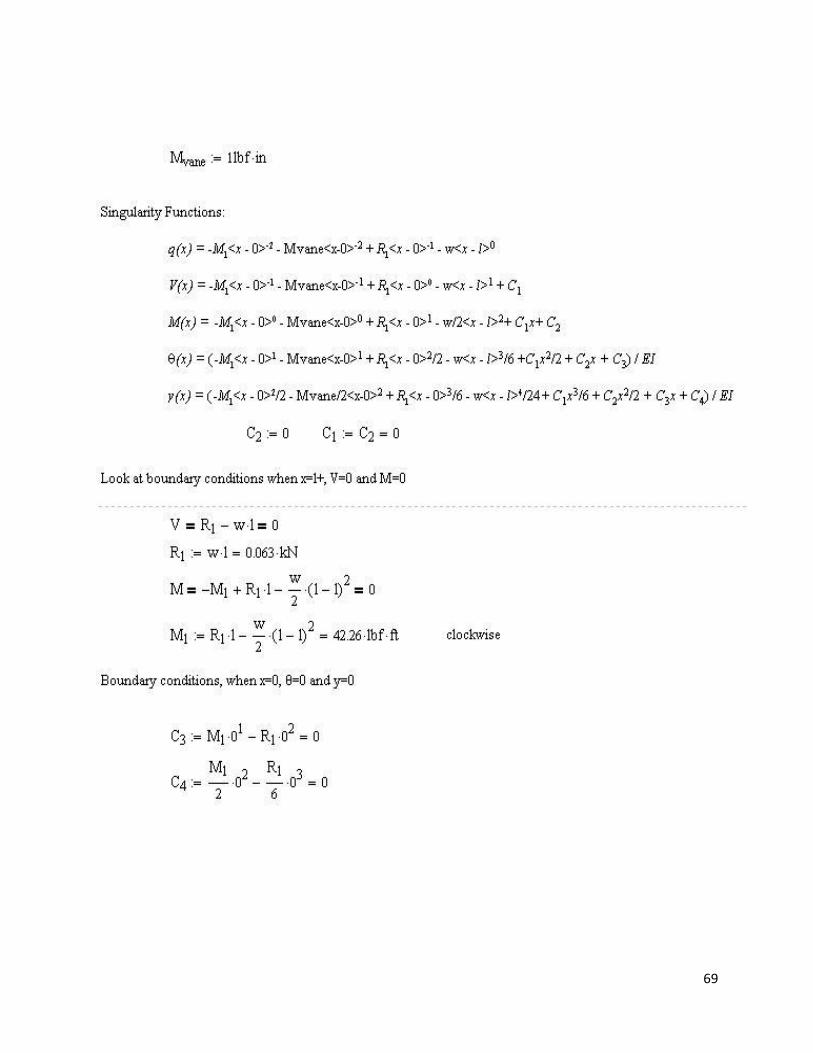
69

70
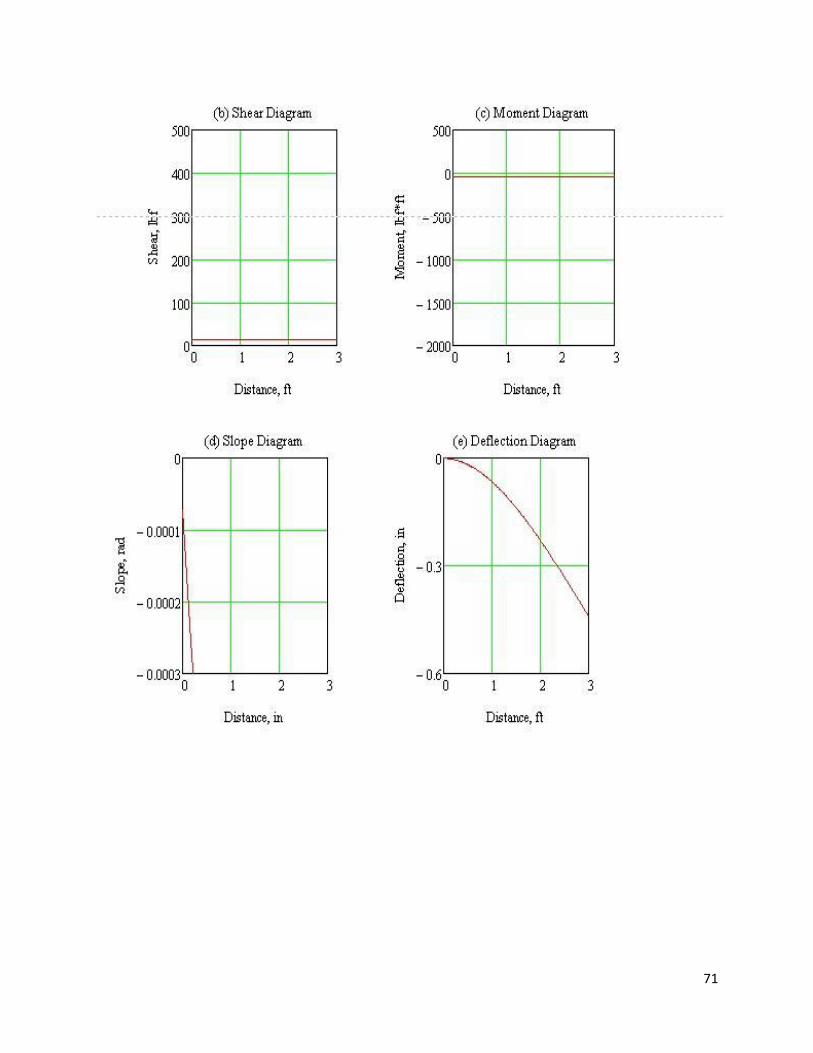
71

72

73
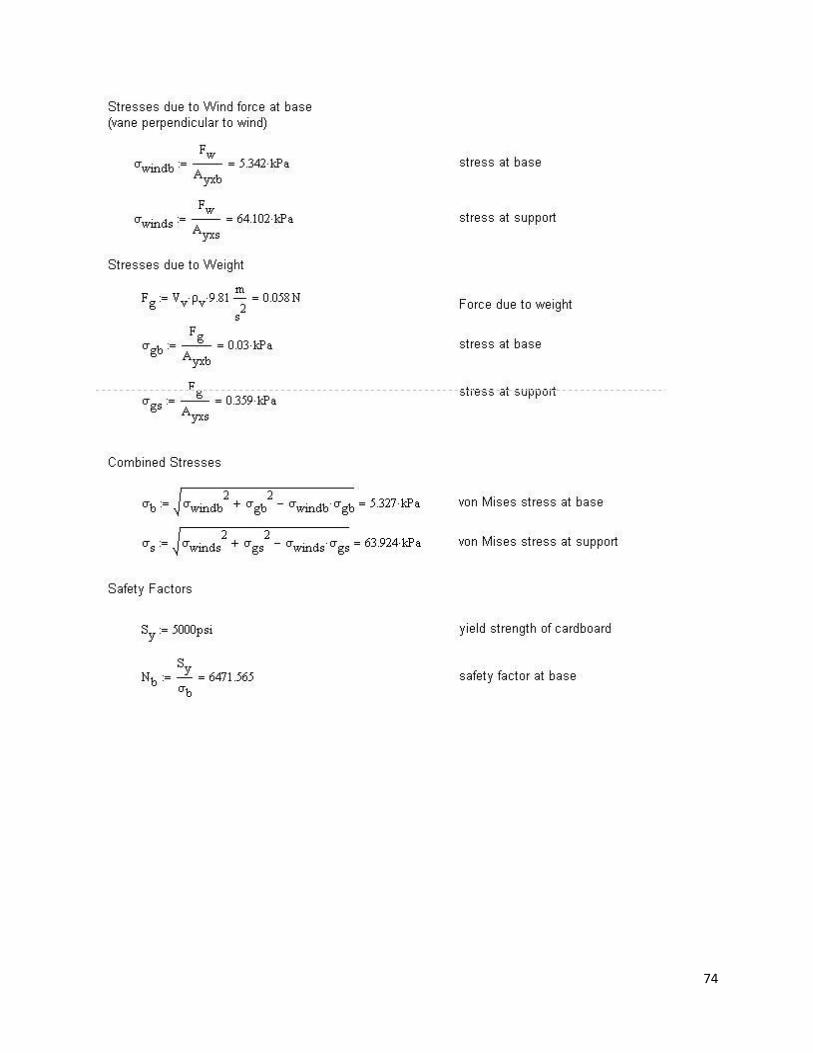
74

75

76

77
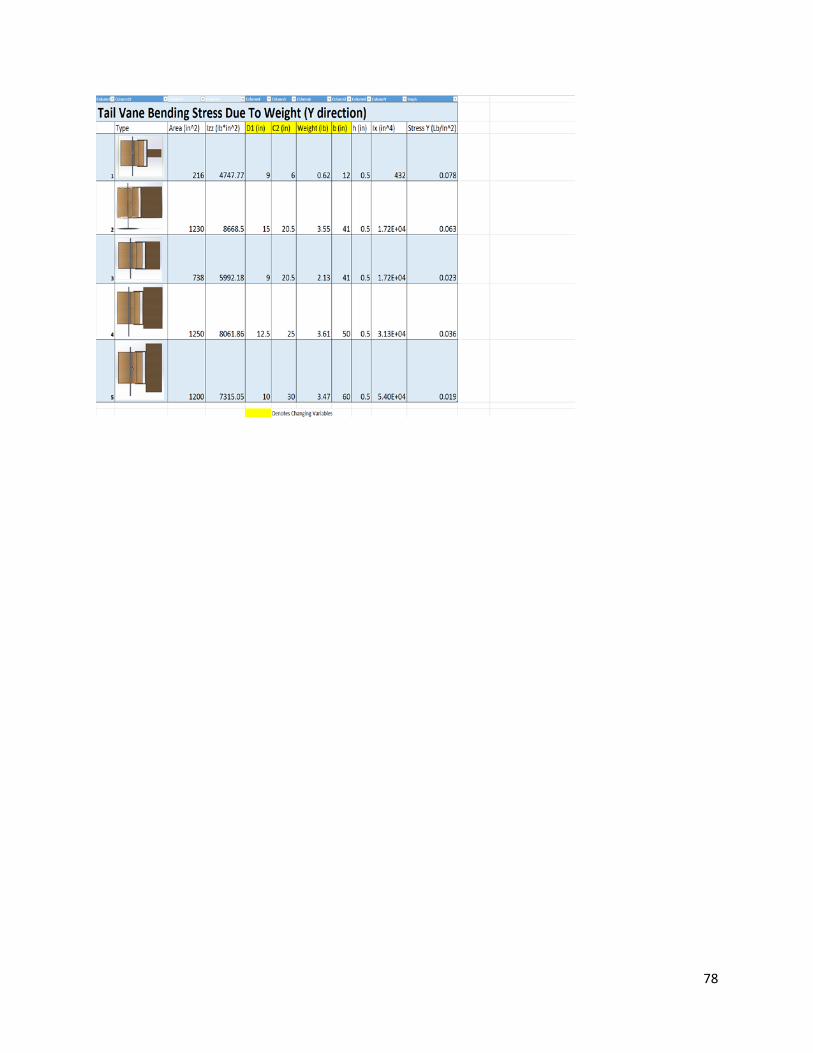
78
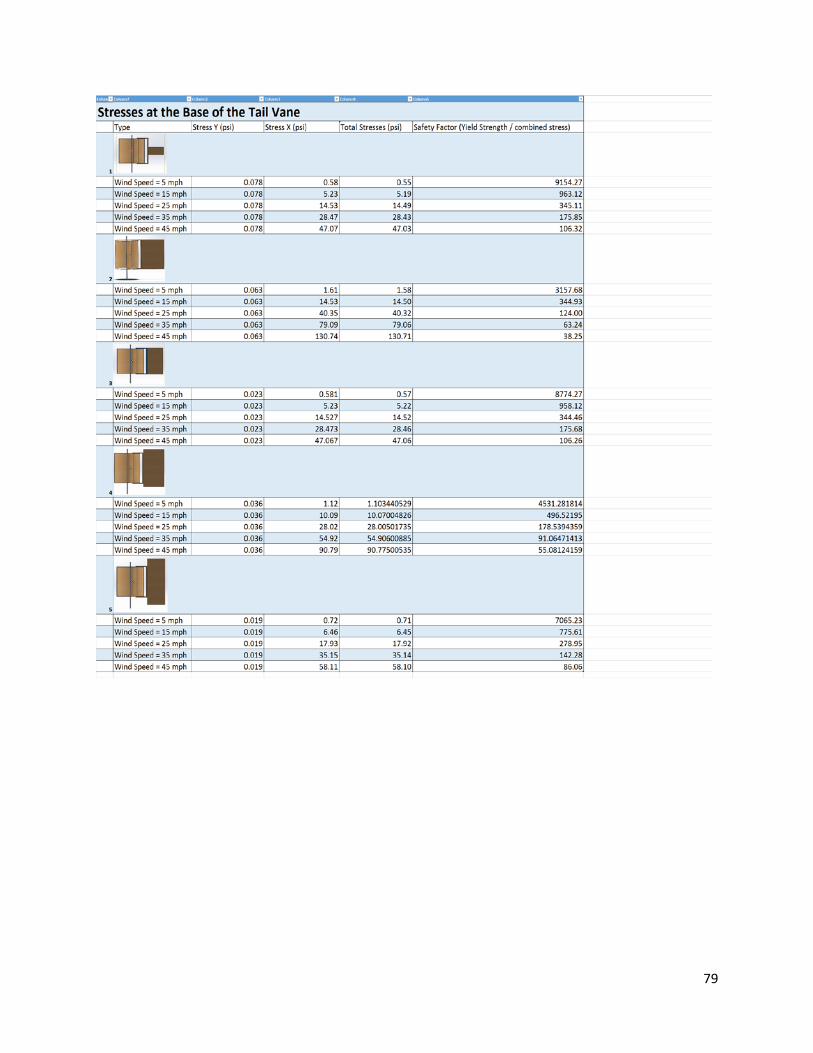
79

80

81
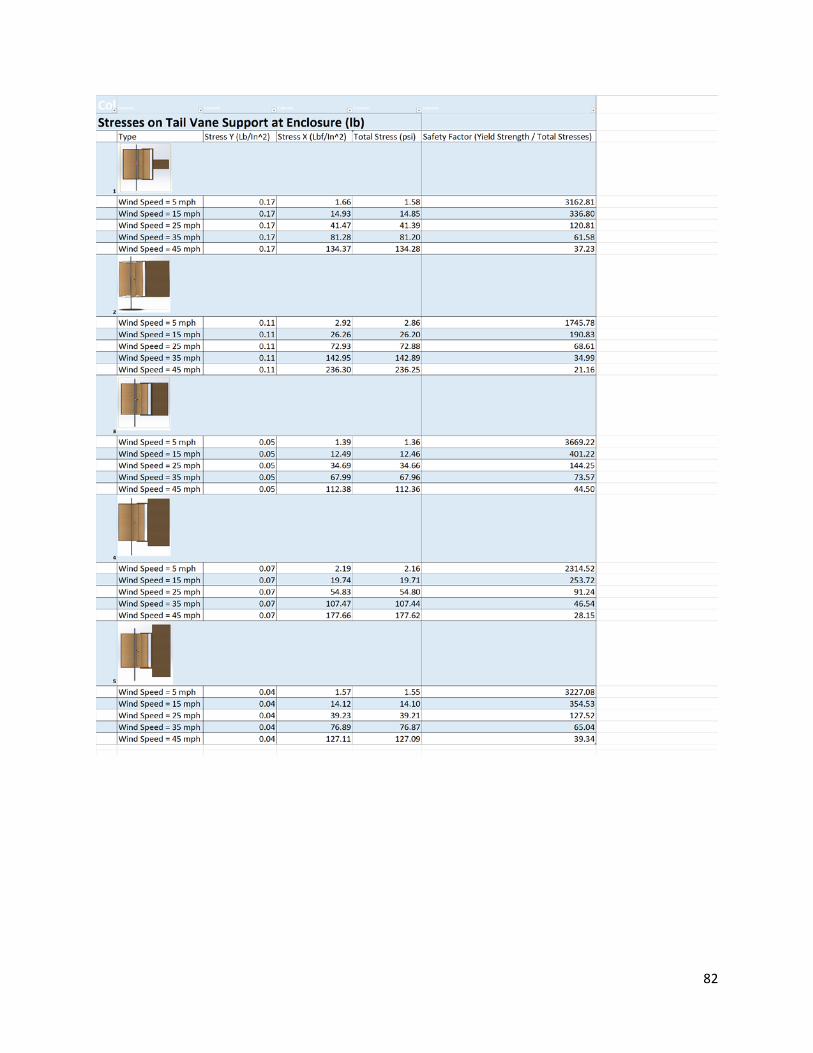
82

Appendix B: Material Detail Matrices
83

84

85