Partial review of the Shortage Occupation List · 5.1 Introduction ... primary, secondary and ......
170
Partial review of the Shortage Occupation List Migration Advisory Committee January 2017 Review of teachers
Transcript of Partial review of the Shortage Occupation List · 5.1 Introduction ... primary, secondary and ......

Partial review of the Shortage Occupation List
Migration Advisory Committee
January 2017
Review of teachers

Migration Advisory Committee, 3rd Floor, Seacole Building, 2 Marsham Street, London, SW1P 4DF. www.gov.uk/government/organisations/migration-advisory-committee email: [email protected] Twitter: @MACindependent

Partial review of the Shortage Occupation List
Review of teachers
Migration Advisory Committee
January 2017
Contents
Chairman’s Foreword ........................................................................................... 1
The Migration Advisory Committee and Secretariat .......................................... 5
Chapter 1 Introduction .................................................................................. 7
1.1 About the MAC .............................................................................. 7
1.2 What we were asked to do ............................................................ 7
1.3 What we did ................................................................................... 9
1.4 Structure of the report .................................................................. 10
1.5 Thank you .................................................................................... 11
Chapter 2 The commission and wider policy context .............................. 13
2.1 Introduction .................................................................................. 13
2.2 Migrant teachers and the Shortage Occupation List (SOL) ......... 13
2.3 Scope of our commission from the government........................... 16
2.4 Recent policy developments impacting on teacher recruitment ... 16
2.5 Routes into teaching .................................................................... 20
2.6 Previous consideration of teachers by the MAC .......................... 22
Chapter 3 The labour market for teachers ................................................ 25
3.1 Introduction .................................................................................. 25
3.2 The organisation of the education system across the UK ............ 25
3.3 The teaching workforce in the UK ................................................ 28
3.3.1 Teaching employment ................................................................. 29
3.3.2 Characteristics of the teaching workforce .................................... 31
3.4 Demand side factors .................................................................... 32
3.4.1 Changes in the number of pupils and teachers ........................... 32
3.4.2 Pupil teacher ratios ...................................................................... 34
3.5 Supply side factors ...................................................................... 36
3.5.1 Teacher recruitment - Initial Teaching Training (ITT) targets ....... 36
Contents
Contents
3.5.2 Initial teacher training and the economic cycle ............................ 39
3.5.3 Retention of qualified teachers .................................................... 41
3.5.4 Teacher status in the UK ............................................................. 44
3.6 Teachers’ pay .............................................................................. 46
3.6.1 Teachers’ historical pay growth ................................................... 46
3.6.2 Comparing teachers’ starting salaries to other occupations ........ 47
3.6.3 Pay progression for teachers ....................................................... 50
3.6.4 Pay distribution ............................................................................ 50
3.6.5 Pay differentials by subject .......................................................... 51
3.7 Summary ..................................................................................... 53
Chapter 4 Evidence on teacher shortages ................................................ 55
4.1 Introduction .................................................................................. 55
4.2 Are teachers in shortage across the whole occupation? .............. 56
4.2.1 Top-down shortage indicators ..................................................... 56
4.2.2 Vacancy data ............................................................................... 59
4.2.3 Teacher training targets - shortfall of new entrants in the teaching profession .................................................................................. 64
4.2.4 The number of teaching job postings ........................................... 65
4.3 Is there a shortage of teachers at in particular subjects? ............. 71
4.3.1 Subject specific data on vacancies .............................................. 71
4.3.2 Teacher training targets - shortfall of new entrants in the teaching profession by subject ................................................................. 73
4.3.3 Curriculum changes affecting demand for teachers..................... 75
4.3.4 The number of teaching job postings by subject .......................... 77
4.3.5 Pool of potential subject specialist teachers ................................ 82
4.3.6 The proportion of lessons taught by teachers without subject-relevant qualifications ................................................................ 85
4.4 Summary ..................................................................................... 88
Chapter 5 The use of migrant teachers ..................................................... 91
5.1 Introduction .................................................................................. 91
5.2 Foreign born teachers currently working in the UK ...................... 91
5.3 Overall migration flows ................................................................ 92
5.4 Tier 2 ........................................................................................... 92
5.5 Tier 5 ........................................................................................... 98
5.6 International teachers – UK QTS awards .................................. 100
5.7 Tier 2 migrant teachers – nationality .......................................... 101
Contents
5.8 Regional distribution of Tier 2 migrant teachers......................... 102
5.9 Subject areas ............................................................................. 103
5.10 Sponsor organisations ............................................................... 104
5.11 Migrant teacher pay ................................................................... 106
5.12 Length of stay of non-EEA migrants .......................................... 107
5.13 Summary ................................................................................... 108
Chapter 6 Is there a shortage of teachers? ............................................. 111
6.1 Introduction ................................................................................ 111
6.2 Teacher shortages at an occupational level .............................. 111
6.3 Teacher shortages by subject .................................................... 111
6.4 Conclusions ............................................................................... 122
Chapter 7 Sensible .................................................................................... 123
7.1 Introduction ................................................................................ 123
7.2 The Department for Education evidence ................................... 131
7.3 Department for Education evidence on specific subjects ........... 133
7.4 Evidence from other partners..................................................... 134
7.5 Other issues............................................................................... 135
7.6 Summary and conclusions ......................................................... 138
Chapter 8 Summary of recommendations .............................................. 145
8.1 Introduction ................................................................................ 145
8.2 Teachers presently on the SOL ................................................. 145
8.3 Other teaching subjects ............................................................. 146
8.4 Migration routes ......................................................................... 146
8.5 Recommendations ..................................................................... 146
Annex A Consultation ............................................................................. 147
A.1 List of organisations that responded to the call for evidence who did not request anonymity ........................................................ 147
Annex B Burning Glass data conversion methodology ...................... 149
Annex C Supply of total teachers in England ....................................... 150
Annex D Supply of teachers in England by subject ............................. 151
Abbreviations ................................................................................................... 153
References ................................................................................................... 155

1
Chairman’s Foreword
In May 2016, the Home Secretary wrote to the Chair of the MAC asking that the MAC undertake a comprehensive review of the labour market for teachers in nursery, primary, secondary and special needs education, to determine whether there is a shortage which it would be sensible to fill, at least in part, through non-European Economic Area (EEA) migration.
In her letter commissioning the MAC, the Home Secretary said:
“Secondary school teachers in mathematics, physics and chemistry are currently included on the [shortage occupation list] SOL. The Department for Education has suggested that teachers in Mandarin, computer science and design & technology might also warrant inclusion. Increasing demand for teachers in these subjects is linked to the Government’s manifesto commitments on Mandarin teachers and the English Baccalaureate. The MAC is asked to consider all teaching subjects, including (but not limited to) the above and special needs teachers. As education is a devolved matter, the MAC is asked to consider the evidence from sector bodies and stakeholders based in all parts of the UK.”
It should be noted that the fraction of teachers who are migrants is lower than the share of migrants in employment as a whole. Of all the nursery, primary and secondary teachers in the UK, 3 per cent of teachers are from EEA countries and 5 per cent from non-EEA countries in 2014. In spite of this, some parts of the teaching profession have been on the SOL since its inception. Currently, maths, physics and chemistry teachers are on the SOL, though in the past special needs teachers have also been included.
For jobs on the SOL, employers do not have to pass the resident labour market test, do not have to meet the £35k minimum salary required for permanent settlement and are given priority in the allocation of certificates of sponsorship if the quota on Tier 2 General is met. But, it is important to realise that not being on the SOL does not prevent the use of non-EEA migrants to fill vacancies through the Resident Labour Market Test (RLMT) part of Tier 2 route. Such migrants, whether on the SOL or not, have to meet the same minimum salary levels.
Chairman’s Foreword
Chairman’s Foreword
2
In order to be placed on the SOL an occupation must pass three hurdles: is it skilled to the required level? Is it in shortage? Is it sensible to fill vacancies with non-EEA labour? These will be considered in turn.
Skill
There are three broad occupations we were asked to consider – secondary school teachers, primary and nursery school teachers and special needs teachers. There is no doubt that all these occupations are skilled to National Qualifications Framework level 6 and above (the required level) so that only the shortage and skilled criteria deserve detailed discussion.
Shortage
To assess shortage we consider our ‘top-down’ indicators as well as ‘bottom-up’ information from partners and other data sources. This report is the first in which we use our newly-revised methodology of national shortage described in a separate report.1 Of the nine ‘top-down’ indicators, secondary school teachers show no evidence of shortage according to any of them, while primary and nursery teachers pass one and special needs teachers pass three. Similar results are obtained using the previous methodology once accounting for indicators that were either obsolete or not fit for purpose. This impression of no overall shortage is supported by other evidence and all devolved administrations were in a similar position. Accordingly, we concluded that there is no generalised shortage in any of the teaching professions.
We next considered whether there are shortages in specific subjects. We collected a wide variety of indicators by subject on vacancy rates, pay in teaching relative to other professions, the proportion of lessons taught by non-specialists, the extent to which teacher training targets are being met and current use of the Tier 2 route. Not all of these indicators point in the same direction for all subjects but some clear patterns emerge consistent, for the most part, with partner evidence.
There seems to be evidence for shortage among maths, physics, science, computer science and modern foreign languages. For Mandarin there is less evidence because there are currently so few Mandarin teachers but we were persuaded that it is hard to recruit teachers in that subject because so few students have studied it in the past that there is only a small pool from which to recruit potential teachers.
Sensible
We considered alternative ways in which teacher shortages in some subjects could be addressed without recourse to the use of non-EEA migrants. It is important that predictable future increases in the demand for teachers caused by rises in pupil numbers and curriculum changes are reflected in teacher training targets. As the National Audit Office has commented, the Department for Education’s Teacher Supply Model is quite sophisticated but there is always room for improvement. And the School Teachers’ Pay Review Body has drawn
1 Migration Advisory Committee (2017). Assessing labour market shortages - A methodology
update: Migration Advisory Committee, London, 2017.
Chairman’s Foreword
3
attention to the fact that continued public sector pay restraint may cause problems with recruiting and retaining teachers if the wider labour market continues to strengthen.
For maths, physics, science, computer science and Mandarin we concluded it is sensible to use non-EEA migrants to fill current shortages. Maths and physics have been on the SOL for many years and one might wonder why the use of migrants is still needed. It seemed to us that the basic problem is that the earnings on offer in occupations other than teaching for graduates in these subjects is considerably above the likely earnings as a teacher – this is not true for many other subjects. Although there are more generous bursaries on offer for teachers in these subjects, and some evidence of the use of limited salary supplements, the fact remains that salaries as teachers do not vary greatly by subject but salaries for graduates in occupations other than teaching vary greatly by subject. There is understandable reluctance to have differential pay by subject because it may be divisive but bursaries do not reward those who spend a life in teaching and the difficulties in recruiting and retaining teachers in maths, physics and computer science are likely to remain.
It also came to our attention that schools are often trying to recruit science teachers required to teach physics, chemistry and biology. We thought it sensible to place general purpose science teachers on the SOL on the understanding that such teachers are expected to teach physics as part of their role.
For modern foreign languages other than Mandarin we did not conclude it was sensible to place them on the SOL. The current usage of the Tier 2 route for teachers in these subjects is limited and it would seem natural to assume that the EEA is a natural source for teachers of French, German and Spanish. This might be different if there is any change to current freedom of movement rules but this report is about the rules that apply now.
Tier 5
It should be noted that current usage of the Tier 2 route to recruit teachers is quite limited, considerably lower than, for example, nurses. We received evidence from partners that many schools found the process of being an accredited sponsor, and the paperwork necessary to obtain a certificate of sponsorship, to be burdensome especially when they might be interested in recruiting only one or a handful of teachers. However, we did find evidence suggestive of considerable use by schools of the Tier 5 (Youth Mobility) route which allows young people from selected countries to come to the UK for any purpose (work, study, leisure) for up to 2 years. It is hard to know exactly how many migrant teachers are recruited through this route because the visa information for this particular migration route contains no details of employment. We do suggest that more attempts be made to collect information on the types of jobs being done by Tier 5 migrants.
This is the first report to be completed since I became Chair of the MAC but the bulk of the work was done under the leadership of my predecessor, David Metcalf. He was the founding chair of the MAC and, ably supported by the Secretariat and other members, its success in building its current reputation as a

Chairman’s Foreword
4
reliable, independent, authoritative voice in an area where passions often run high, is due largely to him. I hope that the MAC maintains this reputation while I am Chair.
Professor Alan Manning

5
The Migration Advisory Committee and Secretariat
The Migration Advisory Committee (MAC) is a non-statutory, non-time limited, non-departmental public body (NDPB) which was established in 2007 and is funded by the Home Office. The MAC is comprised of economists and migration experts who are publicly appointed in line with guidance published by the Office of the Commissioner for Public Appointments along with a representative from the Home Office.
Chair Members Home Office
representative
Professor Alan Manning from March 2015
Dr Jennifer Smith from November 2012
Professor Jackline Wahba from November 2012
Paul Regan
Madeleine Sumption from July 2016
The secretariat
Alessandra Caroni; Maria Del Castillo; Ciaran Devlin; Stephen Earl; Emily Fowler; Paul Garner; Tim Harrison; Christopher Haynes; Baljit Khinder; Jessica Latchford; Christine Stone; Yasmine Stoner; Josephine Thomas.
The Migration Advisory Committee and Secretariat

7
Chapter 1 Introduction
1.1 About the MAC
1.1 The Migration Advisory Committee (MAC) is a non-departmental public body comprised of economists and migration experts that provides transparent, independent and evidence-based advice to the Government on migration issues. The questions we address are determined by the Government.
1.2 One of the primary roles of the MAC is to review occupations and job titles for inclusion on the Shortage Occupation List (SOL). This report is the eleventh time that we have been asked to review the SOL, both partially and in full. Similar to our previous commission on nurses (Migration Advisory Committee, 2016b), we are focusing on a single profession, which has allowed us to go into much greater depth to establish whether or not there is a shortage.
1.3 The MAC have also advised the government on a wider range of economic migration issues such as low-skilled migration into the UK (Migration Advisory Committee 2015a) and the reviews of the Tier 1 (Investor and Entrepreneur) (Migration Advisory Committee, 2015b) and Tier 2 work visa routes (Migration Advisory Committee, 2016a).
1.2 What we were asked to do
1.4 In May 2016, the Home Secretary wrote to the Chair of the MAC asking that the MAC undertake a comprehensive review of the labour market for teachers in nursery, primary and secondary education, to determine whether there is a shortage which it would be sensible to fill, at least in part, through non-European Economic Area (EEA) migration.
1.5 In her letter commissioning the MAC, the Home Secretary said:
“Secondary school teachers in mathematics, physics and chemistry are currently included on the SOL. The Department for Education has suggested that teachers in Mandarin, computer science and design & technology might also warrant inclusion. Increasing demand for teachers in these subjects is linked to the Government’s manifesto commitments on Mandarin teachers and the English Baccalaureate. The MAC is asked to consider all teaching subjects, including (but not limited to) the above and special needs teachers.
As education is a devolved matter, the MAC is asked to consider the evidence from sector bodies and stakeholders based in all parts of the UK.”
Chapter 1 Introduction
Chapter 1: Introduction
8
1.6 The MAC was asked to submit its report to the Government by 30 November 2016.
1.7 In June 2016, the United Kingdom held an EU referendum and voted to leave the European Union. However, the result did not change the wording of our commission and we continued to focus on the non-EEA migrant workforce. While EEA teaching nationals are out of scope for this commission as, for the moment, the rules regarding EEA migrants are unchanged, we do present some relevant data during the course of this report.
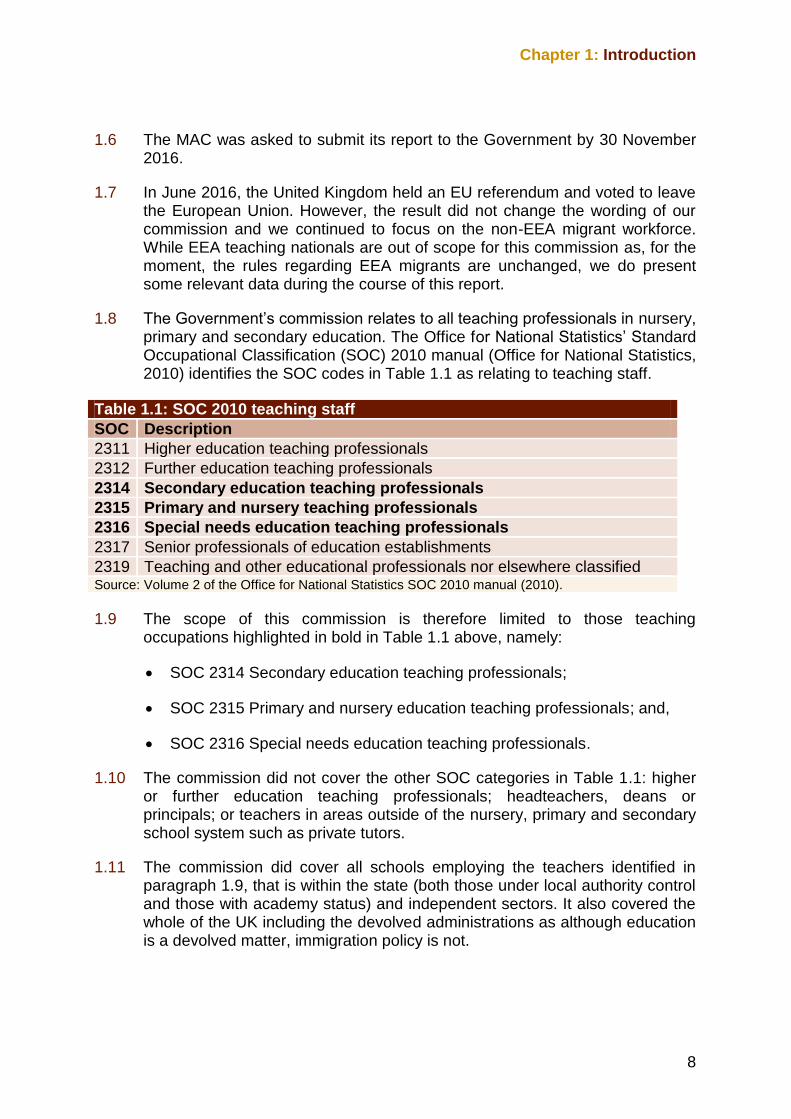
1.8 The Government’s commission relates to all teaching professionals in nursery, primary and secondary education. The Office for National Statistics’ Standard Occupational Classification (SOC) 2010 manual (Office for National Statistics, 2010) identifies the SOC codes in Table 1.1 as relating to teaching staff.
Table 1.1: SOC 2010 teaching staff
SOC Description
2311 Higher education teaching professionals
2312 Further education teaching professionals
2314 Secondary education teaching professionals
2315 Primary and nursery teaching professionals
2316 Special needs education teaching professionals
2317 Senior professionals of education establishments
2319 Teaching and other educational professionals nor elsewhere classified Source: Volume 2 of the Office for National Statistics SOC 2010 manual (2010).
1.9 The scope of this commission is therefore limited to those teaching occupations highlighted in bold in Table 1.1 above, namely:
SOC 2314 Secondary education teaching professionals;
SOC 2315 Primary and nursery education teaching professionals; and,
SOC 2316 Special needs education teaching professionals.
1.10 The commission did not cover the other SOC categories in Table 1.1: higher or further education teaching professionals; headteachers, deans or principals; or teachers in areas outside of the nursery, primary and secondary school system such as private tutors.
1.11 The commission did cover all schools employing the teachers identified in paragraph 1.9, that is within the state (both those under local authority control and those with academy status) and independent sectors. It also covered the whole of the UK including the devolved administrations as although education is a devolved matter, immigration policy is not.

Chapter 1: Introduction
9
1.3 What we did
MAC Methodology
1.12 The MAC’s methodological approach to assess whether an occupation or job title should be placed or retained on the SOL is set out in detail in our previous reports on the SOL. In brief, we assess against three tests:
we consider whether individual occupations or job titles are sufficiently skilled to be included on the SOL;
we also consider whether there is a shortage of labour within each skilled occupation or job; and,
finally, we consider whether it is sensible for immigrant labour from outside the EEA to be used to fill these shortages.
1.13 The requisite skill level for inclusion on the SOL is presently National Qualifications Framework level 6 and above (NQF6+). Appendix J to the Immigration Rules lists the occupations regarded as being skilled to this level (Home Office, 2016).
1.14 To be considered for inclusion on the SOL, jobs need to be in one of the skilled occupations listed in the document above. All three SOC codes identified above as relating to teachers and within scope of this review are regarded as being skilled to this level. Therefore, there was no need for us to consider any further evidence or data in relation to the skill test for any job falling within the three SOC codes.
1.15 Our consideration in this report, therefore, focuses on the shortage and sensible parts of our methodology. We look at the evidence of teacher shortages in Chapter 4 and, together with evidence on the number of migrant teachers presented in Chapter 5, conclude our findings on whether teachers are in shortage in Chapter 6. Thereafter, we assess in Chapter 7 whether it is sensible to recommend retaining or adding teachers to the SOL.
1.16 This report refers to “corporate partners” or just “partners” in relation to the submission of evidence. This term is used to cover all parties with an interest in our work or its outcomes, so private and public sector employers, trade unions, representative bodies and private individuals are included within this term.
Call for evidence
1.17 We issued a call for evidence on 6 June 2016, which ran until 16 September 2016. The call for evidence asked partners to provide evidence on the shortage and sensible criteria.
Chapter 1: Introduction
10
Shortage
1.18 The remit of the MAC is to consider whether there is a national shortage in a given occupation. This means either a shortage across the whole of the UK or just in Scotland alone, as the latter has its own SOL. In order to determine whether there is a shortage in teachers, the call for evidence asked for details on the overall supply of teachers in the UK, including issues surrounding retention and recruitment, subject specific shortages and regional shortages. Additionally, the call for evidence asked questions on the existing demand for teachers from outside the EEA.
Sensible
1.19 The MAC further considers four broad criteria of whether it is sensible to employ migrants from outside the UK in an occupation judged to be in shortage. The call for evidence asked for information on:
what alternatives there are to employing migrants;
how recruiting skilled migrant workers affects incentives for UK employers to invest in training of the UK workforce;
how employing skilled migrants impacts on wider investment, innovation and productivity growth in the UK economy; and,
whether adding occupations and job titles to the SOL will affect the wider UK labour market and economy.
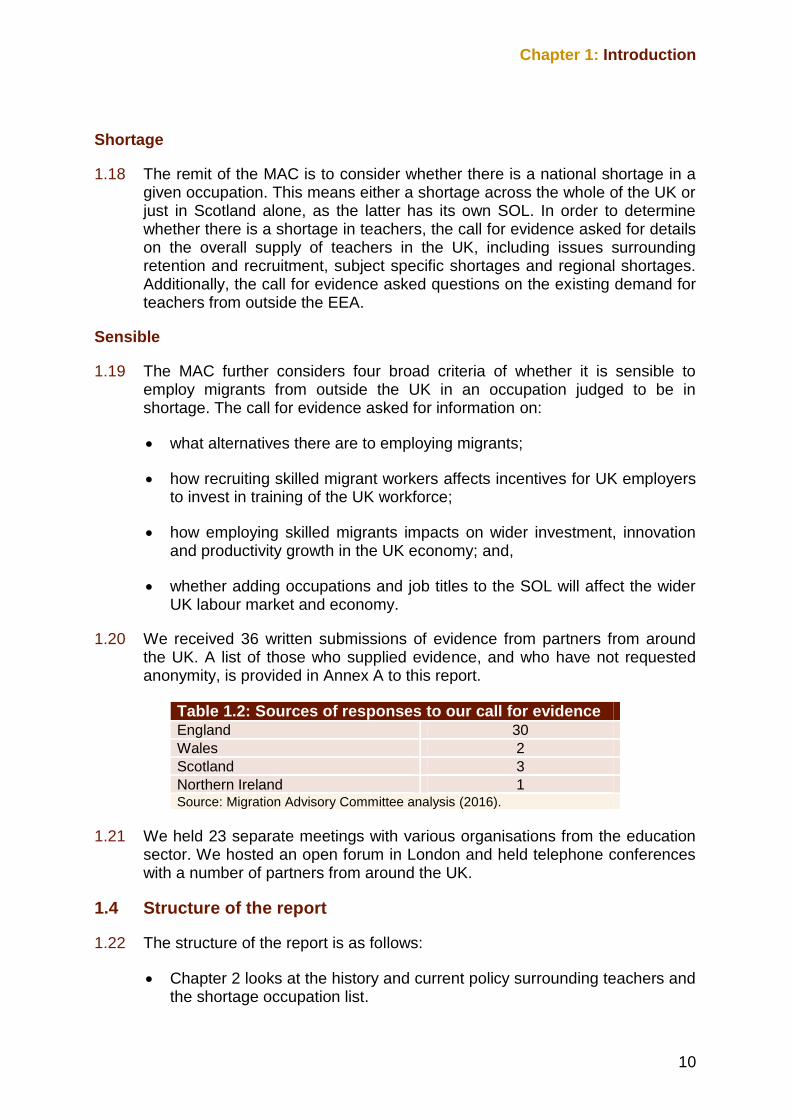
1.20 We received 36 written submissions of evidence from partners from around the UK. A list of those who supplied evidence, and who have not requested anonymity, is provided in Annex A to this report.
Table 1.2: Sources of responses to our call for evidence England 30
Wales 2
Scotland 3
Northern Ireland 1 Source: Migration Advisory Committee analysis (2016).
1.21 We held 23 separate meetings with various organisations from the education sector. We hosted an open forum in London and held telephone conferences with a number of partners from around the UK.
1.4 Structure of the report
1.22 The structure of the report is as follows:
Chapter 2 looks at the history and current policy surrounding teachers and the shortage occupation list.
Chapter 1: Introduction
11
Chapter 3 presents an overview of the teacher labour market and we discuss the factors affecting the demand for, and supply of, teachers in the UK.
Chapter 4 looks at the evidence on the shortage of teachers both in general and specific subjects.
Chapter 5 considers how many migrant teachers are currently being used, predominately looking at the Tier 2 and Tier 5 routes.
Chapter 6 takes the evidence presented in Chapters 4 and 5 and determines whether there is a shortage of teachers, either in general or in specific subjects.
Chapter 7 considers whether it is sensible to recommend retaining or adding teachers to the shortage occupation list.
Chapter 8 summarises our recommendations.
1.5 Thank you
1.23 We are grateful to all our partners who responded to our call for evidence, who engaged with us at meetings and events and those who provided us with data to inform our analysis.

13
Chapter 2 The commission and wider policy context
2.1 Introduction
2.1 This chapter places our commission in the context of wider policy developments that affect teacher recruitment along with some relevant reports that have commented on this issue. It sets out the routes through which migrant teachers can come to the UK and also how UK graduates can enter the teaching profession. It also considers the history of teachers included on the shortage occupation list focussing on our previous consideration of teacher shortages as well as changes to the Tier 2 route.
2.2 Migrant teachers and the Shortage Occupation List (SOL)
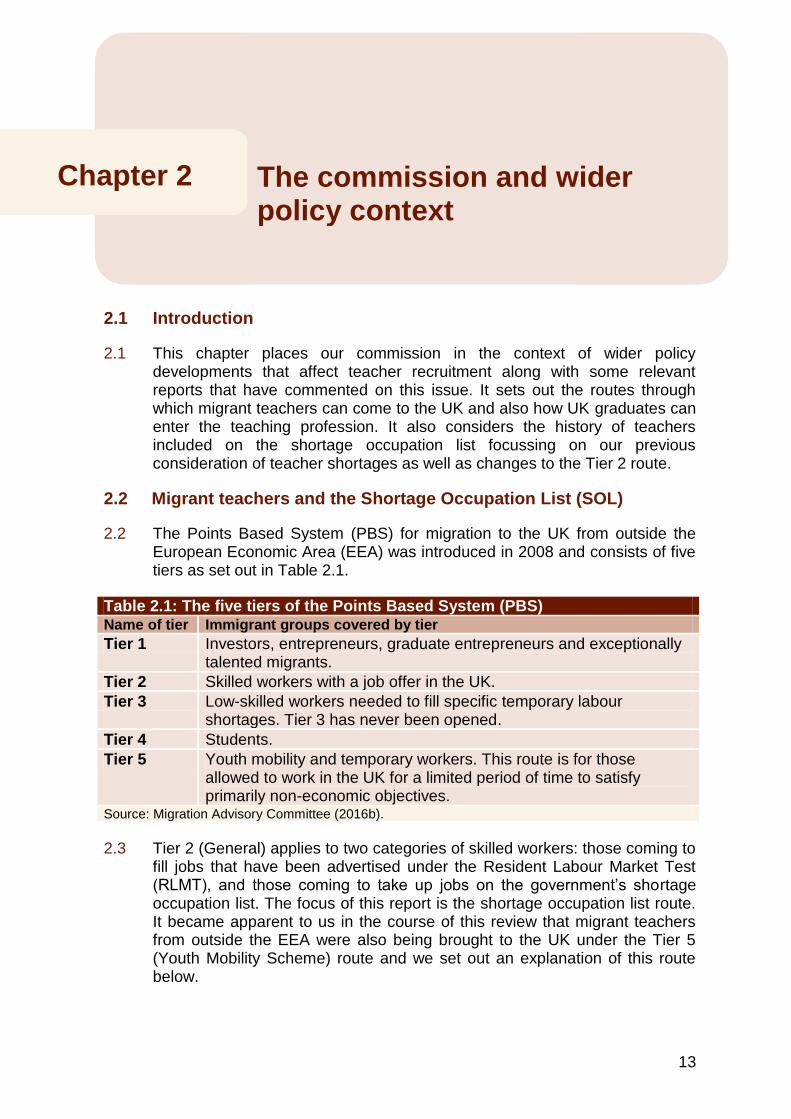
2.2 The Points Based System (PBS) for migration to the UK from outside the European Economic Area (EEA) was introduced in 2008 and consists of five tiers as set out in Table 2.1.
Table 2.1: The five tiers of the Points Based System (PBS) Name of tier Immigrant groups covered by tier
Tier 1 Investors, entrepreneurs, graduate entrepreneurs and exceptionally talented migrants.
Tier 2 Skilled workers with a job offer in the UK.
Tier 3 Low-skilled workers needed to fill specific temporary labour shortages. Tier 3 has never been opened.
Tier 4 Students.
Tier 5 Youth mobility and temporary workers. This route is for those allowed to work in the UK for a limited period of time to satisfy primarily non-economic objectives.
Source: Migration Advisory Committee (2016b).
2.3 Tier 2 (General) applies to two categories of skilled workers: those coming to fill jobs that have been advertised under the Resident Labour Market Test (RLMT), and those coming to take up jobs on the government’s shortage occupation list. The focus of this report is the shortage occupation list route. It became apparent to us in the course of this review that migrant teachers from outside the EEA were also being brought to the UK under the Tier 5 (Youth Mobility Scheme) route and we set out an explanation of this route below.
Chapter 2 The commission and wider policy context
Chapter 2: The commission and wider policy context
14
2.4 Tier 2 requires that a migrant worker be sponsored by an employer. The employer is required to register as a sponsor with UK Visas and Immigration. Should the employer wish to recruit a migrant worker, they are required to apply for a Certificate of Sponsorship (CoS). Once the CoS is issued, the migrant can then apply for a visa.
2.5 The RLMT route enables an employer to bring in a worker from outside the EEA if there is no suitably qualified worker within the UK or the EEA available to fill the specific skilled vacancy. Employers are required to advertise the relevant vacancy through Jobcentre Plus and at least one other medium for 28 calendar days or, for new graduate posts, by visiting at least three UK universities and advertising on a listed graduate recruitment website and at least one other medium.
2.6 Employers can apply to bring in workers from outside of the EEA without going through the RLMT if the vacancy to be filled is for a job title on the Tier 2 shortage occupation list (SOL). This details the occupations and job titles presently held to be experiencing a labour shortage that would be sensibly filled using non-EEA labour either across the UK as a whole or in Scotland only. We recommend the occupations and jobs to be included on the SOL and these recommendations are revised periodically, most recently in March 2016 (Migration Advisory Committee, 2016b) in respect of nurses. The current Tier 2 SOL has been operational since 19 November 2015.
2.7 For an occupation or job title to be recommended for inclusion on the SOL it must be:
skilled to the required skill level for Tier 2 (currently National Qualifications Framework level 6 and above (NQF6+), which is broadly equivalent to degree level, with some exceptions);
experiencing a national shortage of labour; and
demonstrably sensible to fill these shortages using labour from outside the EEA.
2.8 Migrants under Tier 2 must be paid the minimum pay set out in the Home Office Tier 2 codes of practice. Since 2011, Tier 2 (General) has been subject to an annual limit of 20,700. A monthly limit is calculated on the basis of this and if the monthly limit is reached, the allocation of Tier 2 CoS is currently based on points scored and prioritised based against a set of criteria, including salary. When the monthly allocation is oversubscribed, the Tier 2 CoS are first allocated to those occupations on the SOL and PhD level positions. The remaining applications are then ordered by salary, with the places allocated starting from the highest paid and extra points awarded for graduate recruitment.
2.9 Tier 2 (General) migrants can come to the UK for a maximum of five years and one month or the time given on their CoS plus one month, whichever is shorter. They can apply to extend this visa for up to another five years, as
Chapter 2: The commission and wider policy context
15
long as their total stay is not more than six years. At the end of their time in the UK, they must leave the country or switch into another immigration category unless they have successfully applied for settlement in the UK.
2.10 In 2012, following the recommendations our 2011 report (Migration Advisory Committee, 2011b), the government set in place a minimum pay threshold of £35,000 for settlement in the UK under Tier 2. This threshold came into effect on 6 April 2016 and applies to those admitted from April 2011 who are seeking to settle in the UK after five years’ residence as a Tier 2 worker.
2.11 In addition, we said that any adverse impacts of applying economic criteria to settlement decisions could be mitigated for some specific occupations including some in the public sector. The government chose to provide for migrants to be exempt from the £35,000 income threshold if their job title had been on the shortage occupation list at any time during the period for which they held a Tier 2 visa.
2.12 The advantages of an occupation or job being included on the SOL, therefore, are that sponsors do not have to carry out a resident labour market test and migrants are not subject to the £35,000 salary threshold if they wish to apply for settlement. Additionally, jobs and occupations on the SOL receive prioritisation in the event of the monthly Tier 2 limit being reached.
2.13 Tier 2 also contains three other routes which are not subject to a limit: the intra-company transfer, ministers of religion, and sportsperson routes. Additionally, those applying for Tier 2 (General) who are already in the UK, for example students transferring from Tier 4, are exempt from the limit.
2.14 The Tier 5 (Youth Mobility Scheme) is for persons aged 18 to 30 who wish to live and work in the UK for up to two years. They must have £1,890 in savings. It is only open to citizens of the following countries and territories:
Australia
Canada
Japan
Monaco
New Zealand
Hong Kong
Republic of Korea
Taiwan
2.15 Other persons can apply if they hold the following status:

Chapter 2: The commission and wider policy context
16
British overseas citizen;
British overseas territories citizen; or
British national (overseas).
2.16 People are ineligible to apply if:
they have children who live with them;
they have children for whom they are financially responsible;
they have already been in the UK under the Tier 5 (Youth Mobility Scheme) or the previous Working Holidaymaker Scheme.
2.17 Applicants do not need to be sponsored by an employer or by the sending country under this route, apart from citizens of Hong Kong, Republic of Korea and (until the end of this year when the sponsor requirement will be lifted) Taiwan.
2.3 Scope of our commission from the government
2.18 Our commission requires that we consider both state and independent sector schools. Where relevant in this report we identify the sector being discussed. There tends to be a focus on discussion of the state sector because it is much larger and there are more data available. But we have made efforts to collect information on the independent sector and make it clear where these schools are being discussed.
2.19 We also consider the whole of the UK including the devolved administrations. Again, the relative size of the schools sector in each country means that there is a focus on data pertaining to England but we identify where we are discussing each devolved administration separately and where we are talking about the whole of the UK.
2.4 Recent policy developments impacting on teacher recruitment
2.20 This section outlines some recent policy developments that could have an impact on teacher recruitment. We introduce these issues here and then consider later in the report whether they have an impact or not.
Education White Paper
2.21 In March 2016, the Department for Education published a white paper “Educational Excellence Everywhere” (Department for Education, 2016) which sets out the government’s plans for education for the next five years. It gives seven elements that the government intends to pursue to deliver these plans and the first of these is a commitment to deliver high quality teachers where they are needed. In helping to deliver this commitment, the government says that it will do a number of things including:

Chapter 2: The commission and wider policy context
17
reforming the executive agency with responsibility for improving the quality of the education and early years workforce and helping schools to help each other improve (the National College for Training and Leadership) with the aim of reducing costs for schools;
introducing simple web tools so schools can advertise vacancies for free on a new national teacher vacancy website;
reforming the allocation of initial teacher training (ITT) to base it on need, demand and quality;
strengthening ITT content with new quality criteria for ITT providers; and,
replacing Qualified Teacher Status (QTS) with a stronger, more challenging accreditation.
2.22 The white paper recognises issues around teacher recruitment.
“Teacher recruitment is becoming more difficult as the economy grows stronger, competition for the best graduates and career changers increases and we face smaller pools of graduates from which to recruit in key subjects. At the same time, the number of teachers we need is steadily increasing as pupil numbers grow, and as schools invest more teaching hours in core subjects, the demand for teachers in some subjects is rising even faster. So we recognise that the challenge is increasing, and we will need to improve continuously the proportion of each graduating class that is attracted to teaching.”
“Educational Excellence Everywhere” Department for Education (2016)
Other Government initiatives
2.23 As part of the 2013 MAC partial shortage occupation list review, the Department for Education (DfE) submitted evidence which highlighted a number of policy changes which in theory would have increased the demand for teachers in England.
Increased numbers of pupils studying English and maths
2.24 From September 2013, students between the ages of 16 and 19 are required to study towards English and mathematics GCSE A*-C if they have not already achieved this by age 16. At the time, DfE told us that initial analysis indicated an additional 1,300 maths teachers would be required from 2013-14 to meet additional demand. This accounts for 4 per cent of the total number of maths teachers (headcount) reported in 2015 in the Teacher Workforce Census (2016). When broken down by education type, the analysis indicated that the vast majority of additional teachers would be required in the further education sector (1,150), leaving 150 additional teachers required in school sixth forms.
Chapter 2: The commission and wider policy context
18
2.25 In addition, DfE informed us of a new policy designed to encourage more pupils to study mathematics post-16 who have achieved a grade C or above. In 2013, DfE told us that the sector would demand an additional 3,500 maths teachers, with approximately half of those required in school sixth forms. This 3,500 accounts for 10 per cent of the total number of maths teachers reported in 2015 in the Teacher Workforce Census (2016).
English Baccalaureate
2.26 In 2010, the government introduced the English Baccalaureate (EBacc). The EBacc is a performance measure for schools showing the proportion of pupils entering and achieving GCSEs (grade C or above) in the core academic subjects at key stage 4 in any government-funded school in England. In June 2015, the government announced its intention that all pupils who start year 7 in September 2015 take the EBacc subjects when they reach their GCSEs in 2020. The EBacc is made up of English, maths, history or geography, the sciences and a foreign language.
2.27 The government’s consultation document on implementing the EBacc (Department for Education, 2015) recognised that these proposals would have a potential impact on teacher recruitment.
“The scale of the government’s ambition will certainly require greater teacher recruitment in some subjects and may require schools to rethink how they plan their curriculum.”
Consultation on implementing the English Baccalaureate, Department for Education (2015)
2.28 The document also cited a decline in the proportion of pupils studying a modern foreign language. In 2000, 76 per cent of pupils took a modern foreign language at GCSE. This had fallen to 43 per cent by 2010. The Department for Education told us that the number of students gaining an A level at A*- E grades in French and German had been decreasing ,17.4 per cent and 15.8 per cent respectively from 2012 to 2016, but there had been an increase in A level Spanish numbers (18.7 per cent) over the same period.
Manifesto commitment on Mandarin teachers
2.29 The 2015 Conservative Party Manifesto contained the following commitment: “We will increase the number of teachers able to teach Mandarin in schools in England, so we can compete in the global race”. This commitment is reflected in our commission from the government.
Chapter 2: The commission and wider policy context
19
Plans to recruit more maths and physics teachers
2.30 In December 2014 the coalition government announced plans to recruit 2,500 new maths and physics teachers and to up-skill 15,000 existing teachers who do not specialise in maths and physics. This 2,500 and 15,000 teachers account for 6 per cent and 38 per cent of the total number of maths and physics teachers (headcount) reported in 2015 in the Teacher Workforce Census (2016). This scheme will cost up to £67 million and will last over 5 years. The present government’s commitment to this scheme was restated as recently as 20 October 2016 in response to a written parliamentary question.2
Recent reports on teachers
2.31 There have been a number of recent reports published which are relevant to the issue of teacher supply. These have been taken into account when preparing this report. The main points of each report are summarised here and the information within the reports is highlighted at relevant points in the rest of the report where we have drawn on this information.
House of Commons – Teachers: supply, retention and workload
2.32 In February 2016, the House of Commons published a briefing paper on Teacher supply, retention and workload that summarised much of the research that has been done in recent years in this area. Among the findings it highlighted are:
a shortfall in meeting teacher training targets across secondary schools and in particular for hard to fill subjects;
a 2012 Education Committee report (House of Commons Education Committee (2012)) which found that retention rates across broadly similar professions resemble those of teachers and retention rates for teachers present less cause for concern than is sometimes suggested (we note that this comparison in 2012 was limited to public sector graduate professions with similar starting salaries to teaching and cited the NHS Graduate Management Training Scheme as an example – the range of comparators is therefore somewhat limited);
DfE have attempted to address the key drivers hindering teacher retention including: policy interventions in improving pupil behaviour and reducing unnecessary work by teachers.
2 Parliament written questions and answer statements. Question asked on the 7
th October 2016 by
Gloria De Piero (MP of Ashfield) and answered by Nick Gibb (MP of Bognor Regis and Littlehampton) on the 20
th October 2016.
Chapter 2: The commission and wider policy context
20
National Audit Office – Training new teachers
2.33 In February 2016, the National Audit Office (National Audit Office, 2016 ) published a report on training new teachers. The key findings of this report were that schools relied on a constant supply of newly qualified teachers to replace teachers leaving the workforce and to address increasing pupil numbers. Indicators suggested that some teacher shortages were growing although it was difficult on the basis of current data to quantify accurately the extent to which shortages exist. The NAO found that the Department for Education’s teacher supply model had strengths but may still inaccurately predict schools’ need for trainee teachers.
School Teachers Review Body – 26th report
2.34 In July 2016, the School Teachers Review Body (the body charged with making recommendations on the pay, professional duties and working time of school teachers in England and Wales), recommended a 1 per cent uplift to the minima and maxima of all classroom teacher pay ranges and leadership pay ranges in the national pay framework, and to classroom teacher allowances (School Teachers’ Review Body, 2016). However, if current recruitment and retention trends continue, the Body said it expected an uplift to the pay framework significantly higher than 1 per cent will be required in the course of this Parliament to ensure an adequate supply of good teachers for schools in England and Wales. Accordingly, the report recommended the Department, and other bodies, take steps to help schools prepare for such an eventuality. Given the budgetary context, the report said that this will require school leaders and governing bodies to be confident in both managing their workforce and in setting pay policies which enable differentiated performance-based awards to individuals, such that teachers and leaders can be appropriately rewarded within the available budget.
2.5 Routes into teaching
2.35 There are a number of different ways in which graduates can enter into teaching and we have focussed on the main routes. To become a qualified teacher, graduates must first undertake Initial Teacher Training (ITT) or Initial Teacher Education Training (ITET). This leads to Qualified Teacher Status (QTS) in England and Wales and the Teaching Qualification (TQ) in Scotland. QTS may not be required to work in some independent schools, academies and free schools.
2.36 Teachers who have gained QTS but not completed a statutory twelve-month induction programme are said to have newly qualified teacher (NQT) status. NQTs are not permitted to work permanently in state-maintained schools unless they have completed or are completing NQT induction. They are permitted to perform supply work in state-maintained schools for the first five years after gaining QTS.

Chapter 2: The commission and wider policy context
21
Initial teacher training and Postgraduate Certificates in Education
2.37 Teacher training programmes are either school or university led and all include:
24 weeks of practical classroom experience in two schools or more;
academic study;
experienced professional mentoring and tutoring in classroom management; and,
ongoing assessment of teaching skills.
2.38 Graduates can also study for a Postgraduate Certificate in Education (PGCE) although they will still need to attain QTS.
School Direct (England only)
2.39 Schools can recruit and train teachers on the job, in partnership with an accredited ITT provider. School Direct courses lead to QTS and possibly a PGCE. There is an expectation, but not a guarantee, of employment within the training school at the end. Trainees are based in at least two schools.
2.40 The School Direct programme takes one year if studied full time and has two options:
unsalaried - available for all graduates, and trainees may be eligible for a scholarship or bursary of up to £30,000;
salaried - employment based, trainees will be paid on the unqualified teachers’ pay scale if working in a maintained school, and the cost of training will be covered.
School-centred initial teacher training (SCITT)
2.41 Leading to QTS, SCITT courses are delivered across England by clusters of neighbouring schools and training providers. Most of the training is delivered in the classroom by experienced, practising teachers, with programmes tailored towards local needs.
Teach First
2.42 The Teach First charity based in England and Wales aims to address educational disadvantages by training teachers to teach in challenging schools. Applicants should have 300 UCAS points and a 2:1 degree or above. The two-year scheme offers a Leadership Development Programme and management skills training. Both primary and secondary teaching trainees gain a PGCE and QTS during this two-year period while working in the classroom and earning a salary.
Chapter 2: The commission and wider policy context
22
Scholarships and bursaries
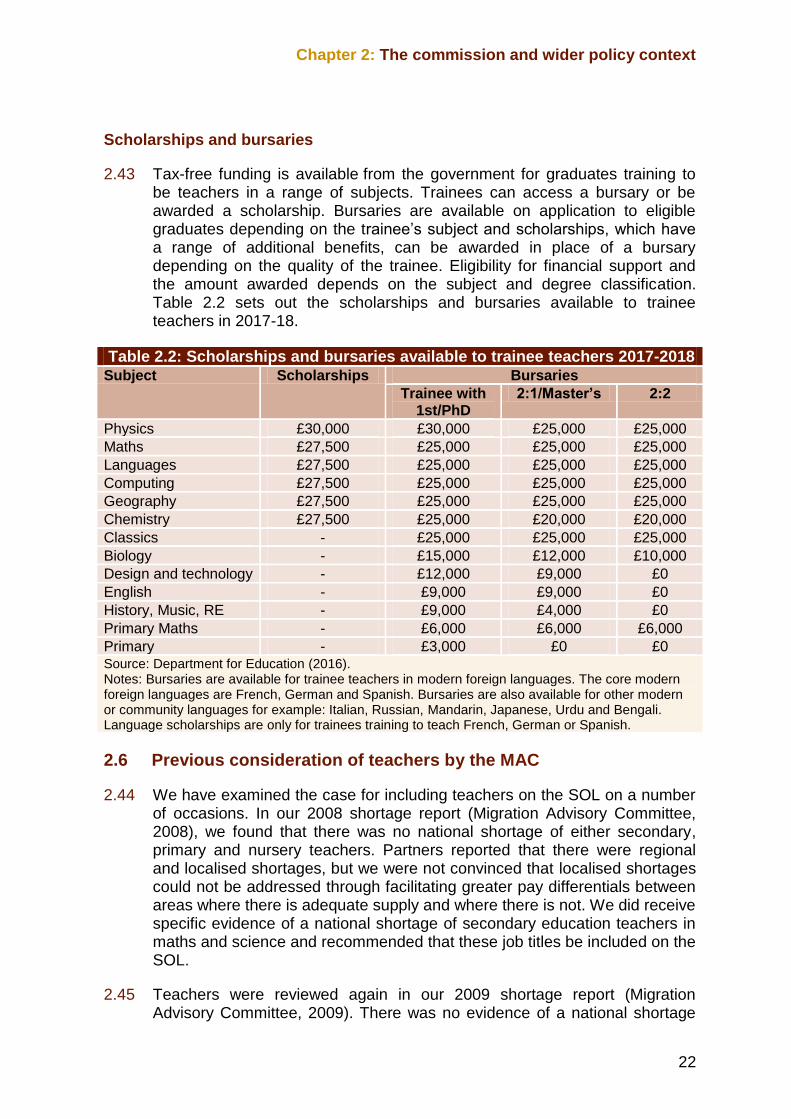
2.43 Tax-free funding is available from the government for graduates training to be teachers in a range of subjects. Trainees can access a bursary or be awarded a scholarship. Bursaries are available on application to eligible graduates depending on the trainee’s subject and scholarships, which have a range of additional benefits, can be awarded in place of a bursary depending on the quality of the trainee. Eligibility for financial support and the amount awarded depends on the subject and degree classification. Table 2.2 sets out the scholarships and bursaries available to trainee teachers in 2017-18.
Table 2.2: Scholarships and bursaries available to trainee teachers 2017-2018 Subject Scholarships Bursaries
Trainee with 1st/PhD
2:1/Master’s 2:2
Physics £30,000 £30,000 £25,000 £25,000
Maths £27,500 £25,000 £25,000 £25,000
Languages £27,500 £25,000 £25,000 £25,000
Computing £27,500 £25,000 £25,000 £25,000
Geography £27,500 £25,000 £25,000 £25,000
Chemistry £27,500 £25,000 £20,000 £20,000
Classics - £25,000 £25,000 £25,000
Biology - £15,000 £12,000 £10,000
Design and technology - £12,000 £9,000 £0
English - £9,000 £9,000 £0
History, Music, RE - £9,000 £4,000 £0
Primary Maths - £6,000 £6,000 £6,000
Primary - £3,000 £0 £0 Source: Department for Education (2016). Notes: Bursaries are available for trainee teachers in modern foreign languages. The core modern foreign languages are French, German and Spanish. Bursaries are also available for other modern or community languages for example: Italian, Russian, Mandarin, Japanese, Urdu and Bengali. Language scholarships are only for trainees training to teach French, German or Spanish.
2.6 Previous consideration of teachers by the MAC
2.44 We have examined the case for including teachers on the SOL on a number of occasions. In our 2008 shortage report (Migration Advisory Committee, 2008), we found that there was no national shortage of either secondary, primary and nursery teachers. Partners reported that there were regional and localised shortages, but we were not convinced that localised shortages could not be addressed through facilitating greater pay differentials between areas where there is adequate supply and where there is not. We did receive specific evidence of a national shortage of secondary education teachers in maths and science and recommended that these job titles be included on the SOL.
2.45 Teachers were reviewed again in our 2009 shortage report (Migration Advisory Committee, 2009). There was no evidence of a national shortage
Chapter 2: The commission and wider policy context
23
but again we received evidence of specific shortages in relation to maths and science teachers. We did not receive evidence indicating a shortage of primary and nursery teachers but did receive evidence of a specific shortage of special needs teachers. We recommended retaining maths and science secondary school teachers on the SOL and adding all teachers in special schools. We did note the reported substantial increases in applications for teacher training in relevant courses, and said we would look to see if this translated to additional teachers in secondary schools and the elimination of the shortage.
2.46 We next looked at teachers in our 2011 shortage report (Migration Advisory Committee, 2011a), again concluding there was no national shortage across the occupation but continuing specific shortages in maths and science and special needs. One slight difference was that partners stated there was no shortage of biology teachers. We therefore recommended that teachers in maths and science (chemistry and physics only) and teachers in special schools be retained on the SOL.
2.47 Our most recent review of teachers was in our 2013 shortage report (Migration Advisory Committee, 2013). This recommended retaining teachers in maths and science (chemistry and physics only) on the SOL but concluded that teachers in special schools could be removed as these were no longer in shortage.
Salary threshold for settlement
2.48 The minimum salary threshold for settlement in the UK is now £35,000 for those admitted from April 2011 and after five years’ residence as a Tier 2 worker. Given that the starting salary for a teacher is approximately between £22,000 and £23,000, it is likely that a high proportion of Tier 2 teachers will not be able to meet the £35,000 threshold within five years. Being recognised as a shortage occupation and being placed on the SOL would provide teachers with an exemption from this minimum pay threshold and provide non-EEA teachers with a reasonable chance of settlement.
Review of Tier 2
2.49 Early in 2016, we published our review of Tier 2 of the Points Based System in response to a government commission on possible changes to Tier 2 to address concerns about the rising number of migrants in that route and reliance on them to fill shortages (Migration Advisory Committee, 2015b). One of the questions we were asked to consider was the economic rationale for and the impact on net migration of setting new minimum salary thresholds to ensure that Tier 2 migrants were not undercutting the resident labour force. We concluded that the overall minimum salary threshold should be based on the salary distribution for all employees working within occupations skilled to National Qualifications Framework level 6 and above (the minimum qualifying criteria for Tier 2 occupations). We recommended that this be set at the 25th percentile (£30,000). For new entrants within Tier
Chapter 2: The commission and wider policy context
24
2 we recommended the threshold should be set at the 10th percentile (£23,000).
2.50 We recognised that the public sector may require time to transition to the new salary thresholds but did not recommend a permanent exemption from higher thresholds for the public sector. Instead, we recommended that the thresholds for the predominantly public sector occupations should gradually be increased over time to reach the £30,000 threshold.
2.51 The government announced its response to these recommendations in a House of Commons written statement on 24 March 2016. The government said that it would implement the higher salary thresholds but, in order to reflect ongoing public sector pay restraint and specific recruitment challenges, it would exempt a number of occupations from these changes until July 2019. The occupations identified included secondary school teachers in maths, physics, chemistry, computer science and Mandarin. The government chose to maintain the salary threshold at £20,800 for new entrants under Tier 2 (General).
2.52 We also reviewed the prioritisation method under the annual limit on Tier 2 and were content that the approach was consistent with our advice that salary provides the most objective way of prioritising applications. However, we did consider that as low paid public sector jobs were more likely to lose out when the limit is hit, the Government may wish to consider giving temporary priority to these occupations in the short term. In the longer term, wages in these occupations should rise to reflect their scarcity and there should be no special treatment applied.
2.53 We discuss all of these policy issues as they impact on teacher shortages in the rest of this report. The next chapter looks at the labour market for teachers.

25
Chapter 3 The labour market for teachers
3.1 Introduction
3.1 This chapter sets out information about the labour market for teachers and the key factors affecting the demand for, and the supply of, teachers in the UK.
3.2 The first part of this chapter presents the organisation of the education system and sets out data on the teacher workforce across the UK.
3.3 In the second part of this chapter we discuss the factors partners have highlighted as affecting the demand for, and supply of, teachers in the UK.
Demand side factors – this covers changing pupil demographics, curriculum changes and pupil teacher ratios (PTR). We use the PTR to assess whether the total supply of teachers has kept up with the number of pupils entering the education system.
Supply side factors – this includes the number of new entrants required as calculated by the DfE’s Teacher Supply Model (TSM), teacher retention and the status of teachers in the UK. We look at teacher retention of new entrants into the profession as well as those already in the profession to better understand whether teachers are staying in the profession once recruited. We also explore the evidence underpinning the factors that influence the number of new joiners to the profession including the economic cycle.
Teachers pay – this section presents how teachers’ earning potential compares to other skilled occupations. We see whether graduates can gain higher financial rewards in the teaching profession compared to other occupations.
3.2 The organisation of the education system across the UK
3.4 All children in England between the ages of 5 and 16 are entitled to a free place at a state school. Maintained schools in England are required to follow the statutory National Curriculum. In addition to meeting their statutory duties, schools are free to teach any other subject or topic they deem relevant for their pupils, as part of the school’s wider curriculum. Academies (including free schools) can set their own curriculum.
Chapter 3 The labour market for teachers

Chapter 3: The labour market for teachers
26
Local authorities
3.5 With the exception of academies, local authorities in England and Wales are responsible for education within their jurisdiction.
3.6 England has several tiers of local government and the relevant local authority varies. Within Greater London, the 32 London borough councils and the Common Council of the City of London are the local authorities responsible for education; in the metropolitan counties, it is the 36 metropolitan borough councils; and in the non-metropolitan counties, it is the 27 county councils or, where there is no county council, the councils of the 55 unitary authorities. There are 152 local authorities in England with responsibility for education.
3.7 In Wales, the councils of the counties and county boroughs are responsible for education. There are 22 in Wales. Since 5 May 2010, the terms local education authority and children's services authority have been repealed and replaced in both England and Wales by the single term 'local authority' in both primary and secondary legislation.
3.8 In Scotland, state schools are owned and operated by the local authorities which act as Education Authorities, and schools are supported in delivering learning and teaching by Education Scotland (formerly Learning and Teaching Scotland).
3.9 In Northern Ireland, the Education Authority (EA) was established under the Education Act Northern Ireland 2014 and became operational on 1 April 2015. It is a non-departmental body sponsored by the Department of Education. The EA is responsible for ensuring that efficient and effective primary and secondary education services are available to meet the needs of children and young people, and support for the provision of efficient and effective youth services.
Primary and Nursery Schools
3.10 Nurseries fall within the generic term of nursery schools. Primary schools refer to either maintained or academy schools. The other type of school for pre-secondary school children is the preparatory school, which is a fee-paying school for children of the ages of 8 – 13, often preparing them for entry into independent schools.
Academy Schools
3.11 The earliest academies opened in September 2002. In 2010, the government introduced legislation to make it possible for all schools to become academies. Since then there has been a rapid increase in the number of academy schools in England. The majority of academies are secondary schools however a number of primary and special schools have also converted to academies. At present, England is the only country

Chapter 3: The labour market for teachers
27
amongst the devolved administrations to have academies embedded within their education system.
3.12 Under the Academies act 2010, Academies are run by a governing body of trustees or directors, independent from the local council, and can set their own curriculum. They have to follow the same rules on admissions, special educational needs and exclusions as other state schools. Academies get money direct from the government, not the local authority. Some academies have sponsors such as businesses, universities, other schools, faith groups or voluntary groups. It is the responsibility of the governing body to employ all academy staff, agree levels of pay, agree on conditions of service with its employees, and decide on the policies for staffing structure, career development, discipline, and performance management.
3.13 In addition to primary, secondary and special academy schools there are also 16 – 19 academies and alternative provision academies.
Other school types
3.14 Grammar schools, run by the council, a foundation body or a trust - they select all or most of their pupils based on academic ability and there is normally an entrance exam.
3.15 Special education needs schools, provide solely for children with an education, health or care plan naming the school, or for children who are dual registered with another school are attending temporarily to have their special education needs assessed. Schools can specialise in one of the four special education needs:
communication and interaction;
cognition and learning;
social, emotional and mental health;
sensory and physical needs.
3.16 State boarding schools, run by local councils, and some are run as academies or free schools, provide free education but charge fees for boarding.
3.17 Free schools, these are new academies (i.e. with no predecessor maintained school).
3.18 Foundation and trust schools, are self-governing schools within the local authority maintained family of schools, which own their own land and assets, and employ their own staff. All capital costs of the school are met by the local authority.
Chapter 3: The labour market for teachers
28
3.19 Voluntary schools, operate under foundations (usually trusts) which own the premises and appoint a number of the governors. They divide into:
Voluntary controlled schools which have all their costs met by the state and are controlled by the local authority;
Voluntary aided schools are 90 per cent funded by the state, with a foundation responsible for the remaining 10 per cent of capital costs and having some influence over the school e.g. in employment matters, admissions and in the RE curriculum.
3.20 City technology colleges, are independent schools in urban areas, owned and funded by companies as well as central government (not the local authority) and have a particular emphasis on technological and practical skills.
3.21 Faith schools, can be different kinds of schools, e.g. voluntary aided schools, free schools, academies etc, but are associated with a particular faith body or religion. They are mostly run like other state schools but the admissions criteria and staffing policies may be different.
Independent sector secondary schools
3.22 Independent schools charge fees to attend instead of being funded by the government. They do not have to follow the national curriculum but must all be registered with the government and inspected regularly. Some independent schools specialise in teaching children with special educational needs.
3.3 The teaching workforce in the UK
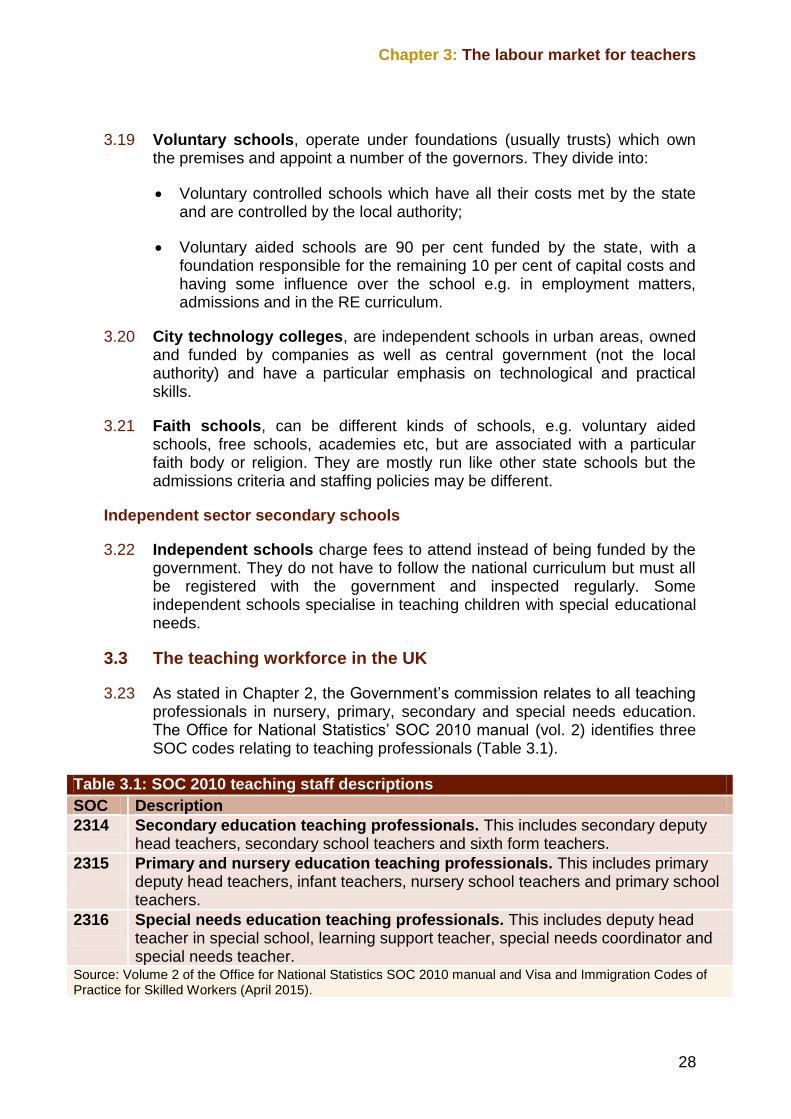
3.23 As stated in Chapter 2, the Government’s commission relates to all teaching professionals in nursery, primary, secondary and special needs education. The Office for National Statistics’ SOC 2010 manual (vol. 2) identifies three SOC codes relating to teaching professionals (Table 3.1).
Table 3.1: SOC 2010 teaching staff descriptions
SOC Description
2314
Secondary education teaching professionals. This includes secondary deputy head teachers, secondary school teachers and sixth form teachers.
2315
Primary and nursery education teaching professionals. This includes primary deputy head teachers, infant teachers, nursery school teachers and primary school teachers.
2316
Special needs education teaching professionals. This includes deputy head teacher in special school, learning support teacher, special needs coordinator and special needs teacher.
Source: Volume 2 of the Office for National Statistics SOC 2010 manual and Visa and Immigration Codes of Practice for Skilled Workers (April 2015).
Chapter 3: The labour market for teachers
29
3.24 In this section we look at the key characteristics of the teacher workforce including data on the number of teachers as well as the distribution of teachers across different types of schools and region.
3.3.1 Teaching employment
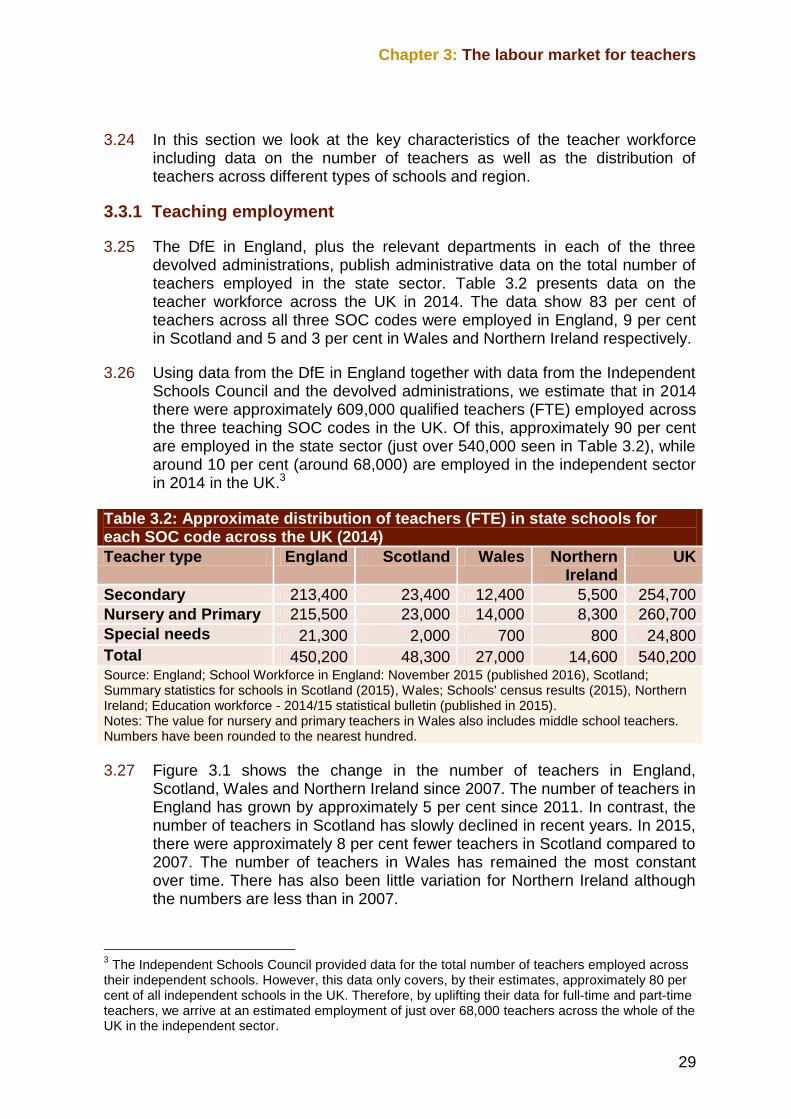
3.25 The DfE in England, plus the relevant departments in each of the three devolved administrations, publish administrative data on the total number of teachers employed in the state sector. Table 3.2 presents data on the teacher workforce across the UK in 2014. The data show 83 per cent of teachers across all three SOC codes were employed in England, 9 per cent in Scotland and 5 and 3 per cent in Wales and Northern Ireland respectively.
3.26 Using data from the DfE in England together with data from the Independent Schools Council and the devolved administrations, we estimate that in 2014 there were approximately 609,000 qualified teachers (FTE) employed across the three teaching SOC codes in the UK. Of this, approximately 90 per cent are employed in the state sector (just over 540,000 seen in Table 3.2), while around 10 per cent (around 68,000) are employed in the independent sector in 2014 in the UK.3
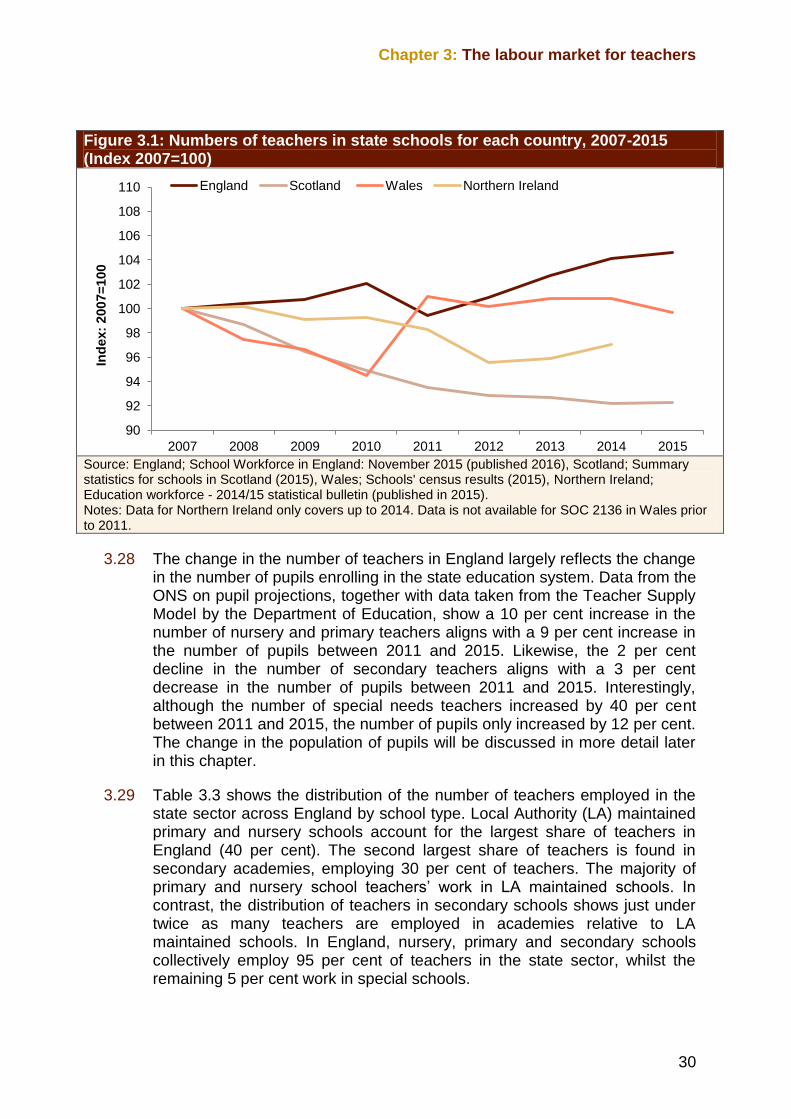
3.27 Figure 3.1 shows the change in the number of teachers in England, Scotland, Wales and Northern Ireland since 2007. The number of teachers in England has grown by approximately 5 per cent since 2011. In contrast, the number of teachers in Scotland has slowly declined in recent years. In 2015, there were approximately 8 per cent fewer teachers in Scotland compared to 2007. The number of teachers in Wales has remained the most constant over time. There has also been little variation for Northern Ireland although the numbers are less than in 2007.
3 The Independent Schools Council provided data for the total number of teachers employed across
their independent schools. However, this data only covers, by their estimates, approximately 80 per cent of all independent schools in the UK. Therefore, by uplifting their data for full-time and part-time teachers, we arrive at an estimated employment of just over 68,000 teachers across the whole of the UK in the independent sector.
Table 3.2: Approximate distribution of teachers (FTE) in state schools for each SOC code across the UK (2014)
Teacher type England Scotland Wales Northern Ireland
UK
Secondary 213,400 23,400 12,400 5,500 254,700
Nursery and Primary 215,500 23,000 14,000 8,300 260,700
Special needs 21,300 2,000 700 800 24,800
Total 450,200 48,300 27,000 14,600 540,200 Source: England; School Workforce in England: November 2015 (published 2016), Scotland; Summary statistics for schools in Scotland (2015), Wales; Schools' census results (2015), Northern Ireland; Education workforce - 2014/15 statistical bulletin (published in 2015). Notes: The value for nursery and primary teachers in Wales also includes middle school teachers. Numbers have been rounded to the nearest hundred.
Chapter 3: The labour market for teachers
30
Figure 3.1: Numbers of teachers in state schools for each country, 2007-2015 (Index 2007=100)
Source: England; School Workforce in England: November 2015 (published 2016), Scotland; Summary statistics for schools in Scotland (2015), Wales; Schools' census results (2015), Northern Ireland; Education workforce - 2014/15 statistical bulletin (published in 2015). Notes: Data for Northern Ireland only covers up to 2014. Data is not available for SOC 2136 in Wales prior to 2011.
3.28 The change in the number of teachers in England largely reflects the change in the number of pupils enrolling in the state education system. Data from the ONS on pupil projections, together with data taken from the Teacher Supply Model by the Department of Education, show a 10 per cent increase in the number of nursery and primary teachers aligns with a 9 per cent increase in the number of pupils between 2011 and 2015. Likewise, the 2 per cent decline in the number of secondary teachers aligns with a 3 per cent decrease in the number of pupils between 2011 and 2015. Interestingly, although the number of special needs teachers increased by 40 per cent between 2011 and 2015, the number of pupils only increased by 12 per cent. The change in the population of pupils will be discussed in more detail later in this chapter.
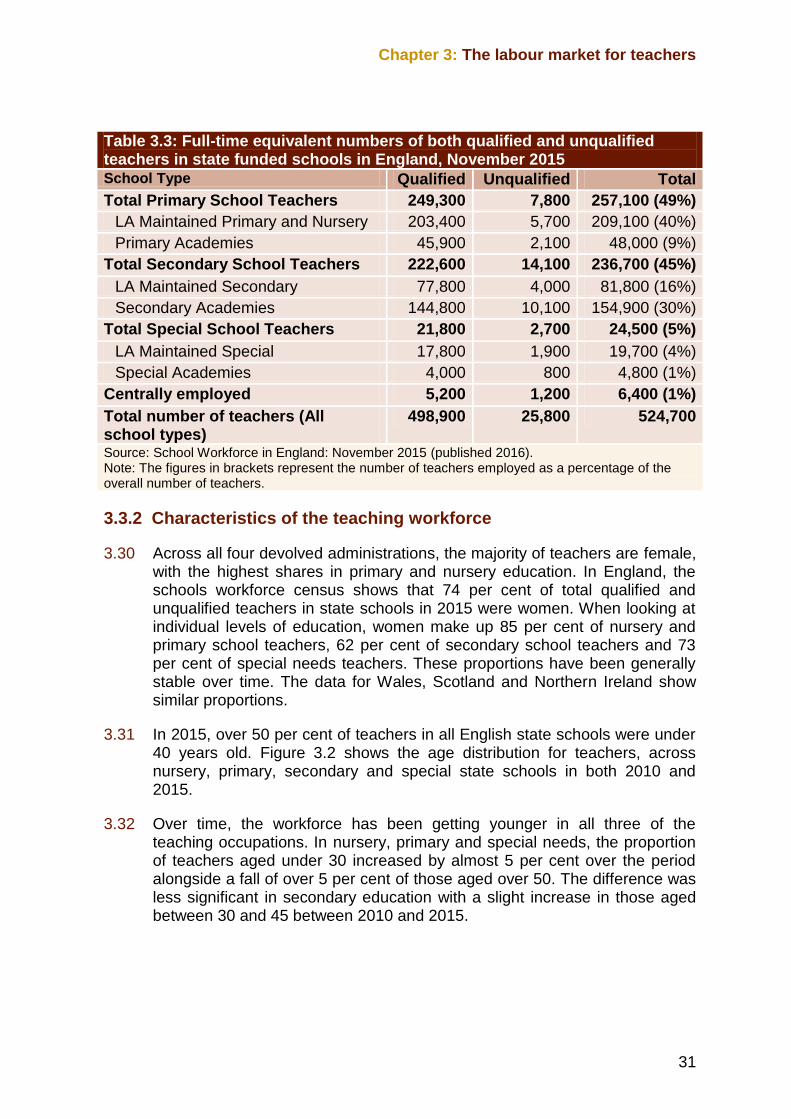
3.29 Table 3.3 shows the distribution of the number of teachers employed in the state sector across England by school type. Local Authority (LA) maintained primary and nursery schools account for the largest share of teachers in England (40 per cent). The second largest share of teachers is found in secondary academies, employing 30 per cent of teachers. The majority of primary and nursery school teachers’ work in LA maintained schools. In contrast, the distribution of teachers in secondary schools shows just under twice as many teachers are employed in academies relative to LA maintained schools. In England, nursery, primary and secondary schools collectively employ 95 per cent of teachers in the state sector, whilst the remaining 5 per cent work in special schools.
90
92
94
96
98
100
102
104
106
108
110
2007 2008 2009 2010 2011 2012 2013 2014 2015
Ind
ex:
2007=
100
England Scotland Wales Northern Ireland
Chapter 3: The labour market for teachers
31
Table 3.3: Full-time equivalent numbers of both qualified and unqualified teachers in state funded schools in England, November 2015
School Type Qualified Unqualified Total
Total Primary School Teachers 249,300 7,800 257,100 (49%)
LA Maintained Primary and Nursery 203,400 5,700 209,100 (40%)
Primary Academies 45,900 2,100 48,000 (9%)
Total Secondary School Teachers 222,600 14,100 236,700 (45%)
LA Maintained Secondary 77,800 4,000 81,800 (16%)
Secondary Academies 144,800 10,100 154,900 (30%)
Total Special School Teachers 21,800 2,700 24,500 (5%)
LA Maintained Special 17,800 1,900 19,700 (4%)
Special Academies 4,000 800 4,800 (1%)
Centrally employed 5,200 1,200 6,400 (1%)
Total number of teachers (All school types)
498,900 25,800 524,700
Source: School Workforce in England: November 2015 (published 2016). Note: The figures in brackets represent the number of teachers employed as a percentage of the overall number of teachers.
3.3.2 Characteristics of the teaching workforce
3.30 Across all four devolved administrations, the majority of teachers are female, with the highest shares in primary and nursery education. In England, the schools workforce census shows that 74 per cent of total qualified and unqualified teachers in state schools in 2015 were women. When looking at individual levels of education, women make up 85 per cent of nursery and primary school teachers, 62 per cent of secondary school teachers and 73 per cent of special needs teachers. These proportions have been generally stable over time. The data for Wales, Scotland and Northern Ireland show similar proportions.
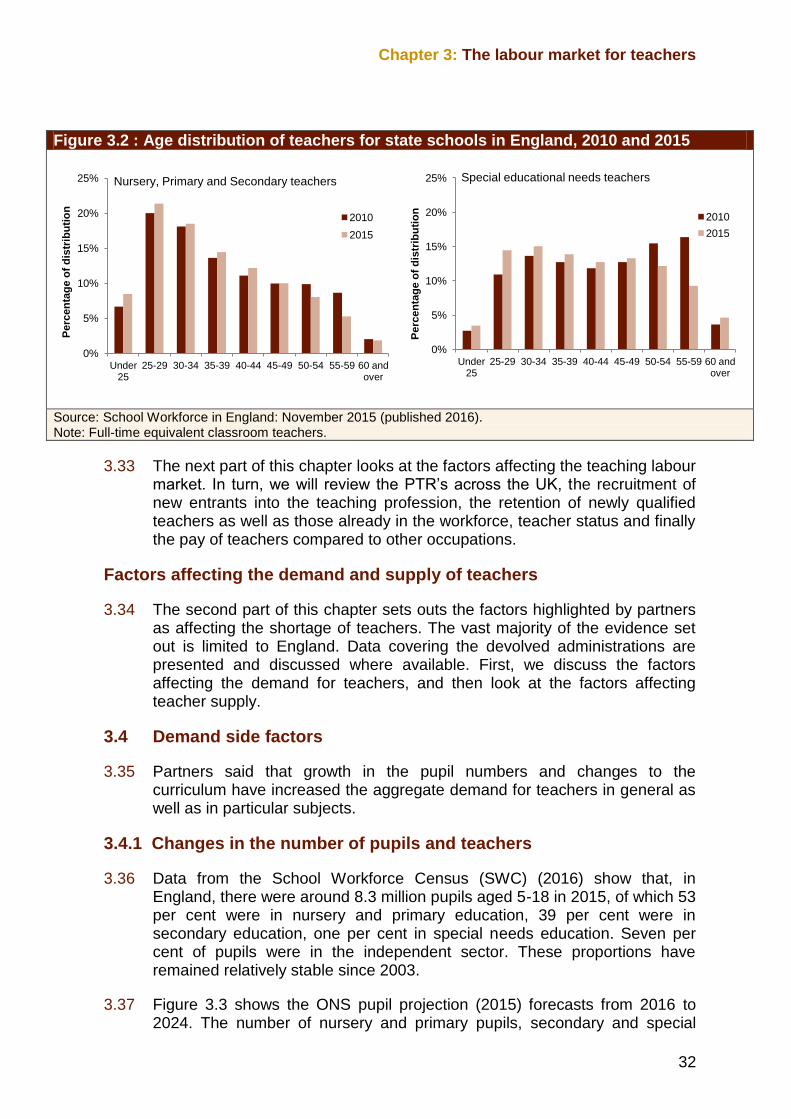
3.31 In 2015, over 50 per cent of teachers in all English state schools were under 40 years old. Figure 3.2 shows the age distribution for teachers, across nursery, primary, secondary and special state schools in both 2010 and 2015.
3.32 Over time, the workforce has been getting younger in all three of the teaching occupations. In nursery, primary and special needs, the proportion of teachers aged under 30 increased by almost 5 per cent over the period alongside a fall of over 5 per cent of those aged over 50. The difference was less significant in secondary education with a slight increase in those aged between 30 and 45 between 2010 and 2015.
Chapter 3: The labour market for teachers
32
Figure 3.2 : Age distribution of teachers for state schools in England, 2010 and 2015
Source: School Workforce in England: November 2015 (published 2016). Note: Full-time equivalent classroom teachers.
3.33 The next part of this chapter looks at the factors affecting the teaching labour market. In turn, we will review the PTR’s across the UK, the recruitment of new entrants into the teaching profession, the retention of newly qualified teachers as well as those already in the workforce, teacher status and finally the pay of teachers compared to other occupations.
Factors affecting the demand and supply of teachers
3.34 The second part of this chapter sets outs the factors highlighted by partners as affecting the shortage of teachers. The vast majority of the evidence set out is limited to England. Data covering the devolved administrations are presented and discussed where available. First, we discuss the factors affecting the demand for teachers, and then look at the factors affecting teacher supply.
3.4 Demand side factors
3.35 Partners said that growth in the pupil numbers and changes to the curriculum have increased the aggregate demand for teachers in general as well as in particular subjects.
3.4.1 Changes in the number of pupils and teachers
3.36 Data from the School Workforce Census (SWC) (2016) show that, in England, there were around 8.3 million pupils aged 5-18 in 2015, of which 53 per cent were in nursery and primary education, 39 per cent were in secondary education, one per cent in special needs education. Seven per cent of pupils were in the independent sector. These proportions have remained relatively stable since 2003.
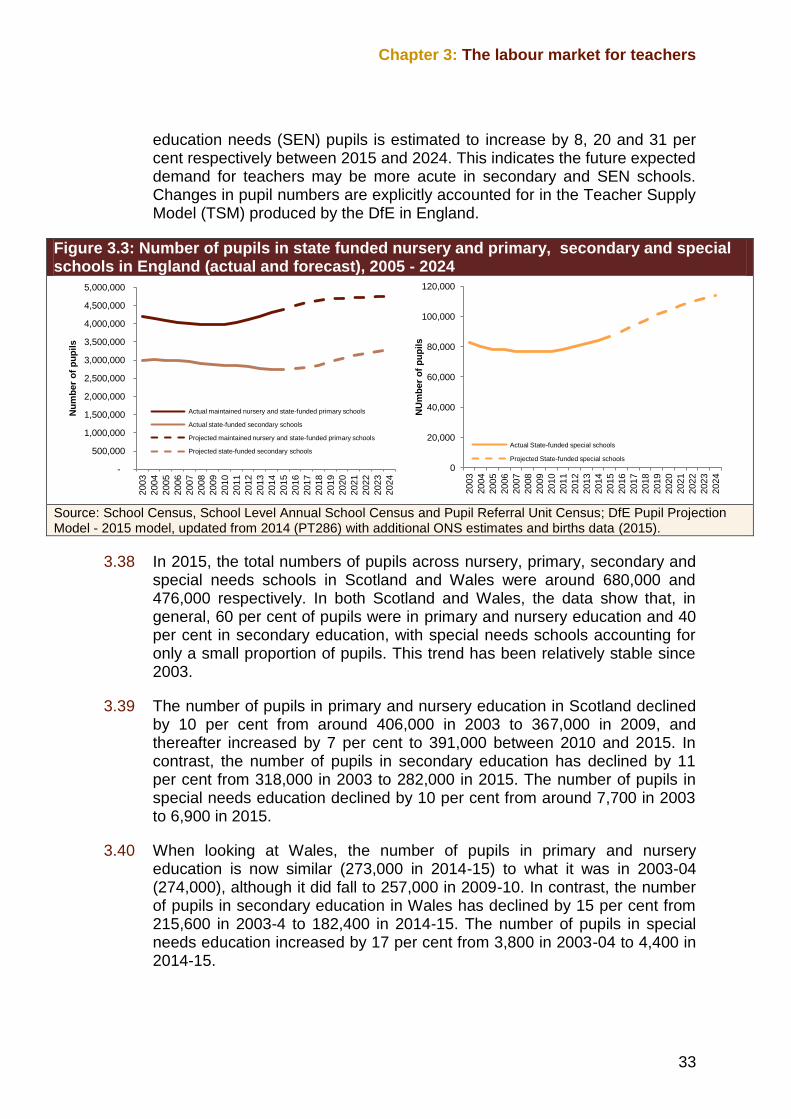
3.37 Figure 3.3 shows the ONS pupil projection (2015) forecasts from 2016 to 2024. The number of nursery and primary pupils, secondary and special
0%
5%
10%
15%
20%
25%
Under 25
25-29 30-34 35-39 40-44 45-49 50-54 55-59 60 and over
Perc
en
tag
e o
f d
istr
ibu
tio
n
Nursery, Primary and Secondary teachers
2010
2015
0%
5%
10%
15%
20%
25%
Under 25
25-29 30-34 35-39 40-44 45-49 50-54 55-59 60 and over
Perc
en
tag
e o
f d
istr
ibu
tio
n
Special educational needs teachers
2010
2015
Chapter 3: The labour market for teachers
33
education needs (SEN) pupils is estimated to increase by 8, 20 and 31 per cent respectively between 2015 and 2024. This indicates the future expected demand for teachers may be more acute in secondary and SEN schools. Changes in pupil numbers are explicitly accounted for in the Teacher Supply Model (TSM) produced by the DfE in England.
Figure 3.3: Number of pupils in state funded nursery and primary, secondary and special schools in England (actual and forecast), 2005 - 2024
Source: School Census, School Level Annual School Census and Pupil Referral Unit Census; DfE Pupil Projection Model - 2015 model, updated from 2014 (PT286) with additional ONS estimates and births data (2015).
3.38 In 2015, the total numbers of pupils across nursery, primary, secondary and special needs schools in Scotland and Wales were around 680,000 and 476,000 respectively. In both Scotland and Wales, the data show that, in general, 60 per cent of pupils were in primary and nursery education and 40 per cent in secondary education, with special needs schools accounting for only a small proportion of pupils. This trend has been relatively stable since 2003.
3.39 The number of pupils in primary and nursery education in Scotland declined by 10 per cent from around 406,000 in 2003 to 367,000 in 2009, and thereafter increased by 7 per cent to 391,000 between 2010 and 2015. In contrast, the number of pupils in secondary education has declined by 11 per cent from 318,000 in 2003 to 282,000 in 2015. The number of pupils in special needs education declined by 10 per cent from around 7,700 in 2003 to 6,900 in 2015.
3.40 When looking at Wales, the number of pupils in primary and nursery education is now similar (273,000 in 2014-15) to what it was in 2003-04 (274,000), although it did fall to 257,000 in 2009-10. In contrast, the number of pupils in secondary education in Wales has declined by 15 per cent from 215,600 in 2003-4 to 182,400 in 2014-15. The number of pupils in special needs education increased by 17 per cent from 3,800 in 2003-04 to 4,400 in 2014-15.
-
500,000
1,000,000
1,500,000
2,000,000
2,500,000
3,000,000
3,500,000
4,000,000
4,500,000
5,000,000
2003
2004
2005
2006
2007
2008
2009
2010
2011
2012
2013
2014
2015
2016
2017
2018
2019
2020
2021
2022
2023
2024
Nu
mb
er
of
pu
pils
Actual maintained nursery and state-funded primary schools
Actual state-funded secondary schools
Projected maintained nursery and state-funded primary schools
Projected state-funded secondary schools
0
20,000
40,000
60,000
80,000
100,000
120,000
2003
2004
2005
2006
2007
2008
2009
2010
2011
2012
2013
2014
2015
2016
2017
2018
2019
2020
2021
2022
2023
2024
NU
mb
er
of
pu
pils
Actual State-funded special schools
Projected State-funded special schools
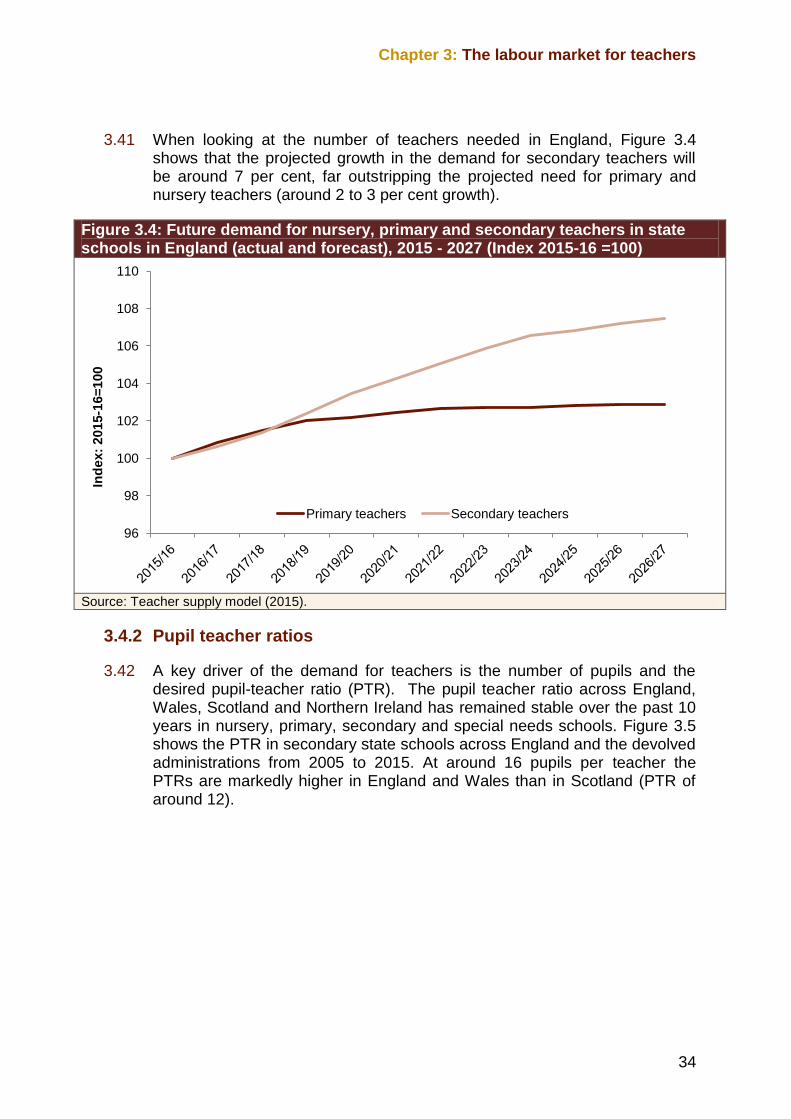
Chapter 3: The labour market for teachers
34
3.41 When looking at the number of teachers needed in England, Figure 3.4 shows that the projected growth in the demand for secondary teachers will be around 7 per cent, far outstripping the projected need for primary and nursery teachers (around 2 to 3 per cent growth).
Figure 3.4: Future demand for nursery, primary and secondary teachers in state schools in England (actual and forecast), 2015 - 2027 (Index 2015-16 =100)
Source: Teacher supply model (2015).
3.4.2 Pupil teacher ratios
3.42 A key driver of the demand for teachers is the number of pupils and the desired pupil-teacher ratio (PTR). The pupil teacher ratio across England, Wales, Scotland and Northern Ireland has remained stable over the past 10 years in nursery, primary, secondary and special needs schools. Figure 3.5 shows the PTR in secondary state schools across England and the devolved administrations from 2005 to 2015. At around 16 pupils per teacher the PTRs are markedly higher in England and Wales than in Scotland (PTR of around 12).
96
98
100
102
104
106
108
110
Ind
ex:
2015
-16=
100
Primary teachers Secondary teachers
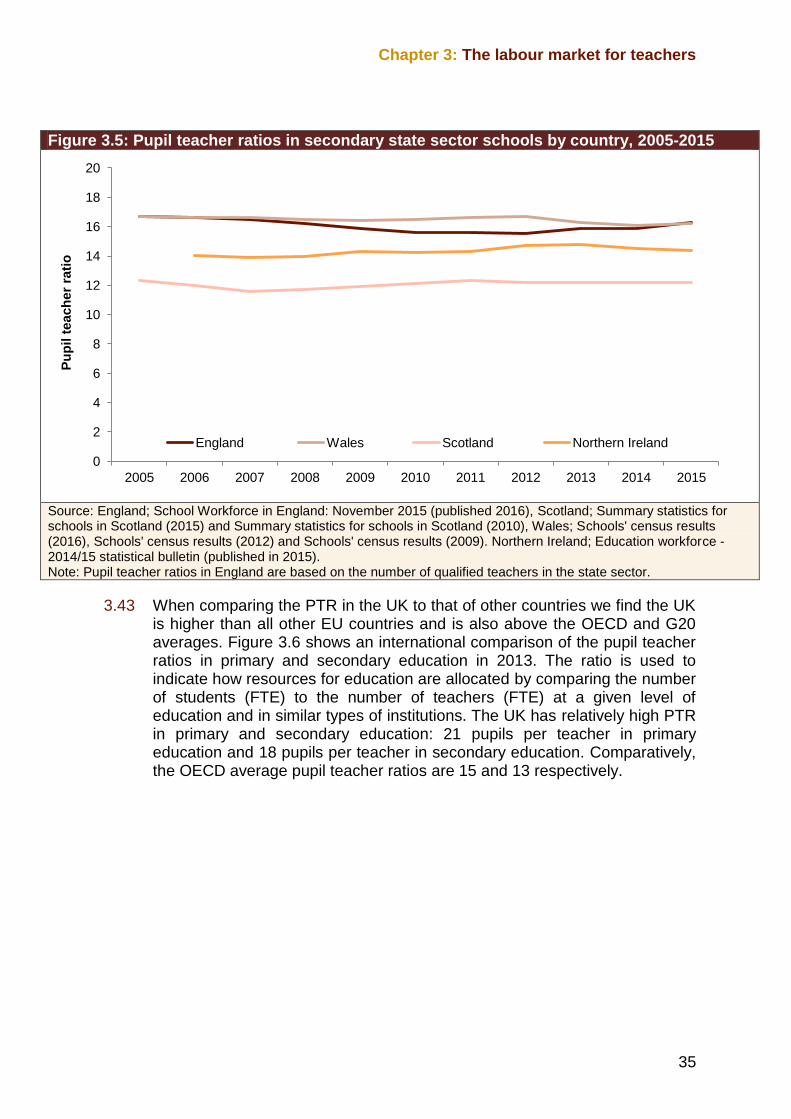
Chapter 3: The labour market for teachers
35
Figure 3.5: Pupil teacher ratios in secondary state sector schools by country, 2005-2015
Source: England; School Workforce in England: November 2015 (published 2016), Scotland; Summary statistics for schools in Scotland (2015) and Summary statistics for schools in Scotland (2010), Wales; Schools' census results (2016), Schools' census results (2012) and Schools' census results (2009). Northern Ireland; Education workforce - 2014/15 statistical bulletin (published in 2015). Note: Pupil teacher ratios in England are based on the number of qualified teachers in the state sector.
3.43 When comparing the PTR in the UK to that of other countries we find the UK is higher than all other EU countries and is also above the OECD and G20 averages. Figure 3.6 shows an international comparison of the pupil teacher ratios in primary and secondary education in 2013. The ratio is used to indicate how resources for education are allocated by comparing the number of students (FTE) to the number of teachers (FTE) at a given level of education and in similar types of institutions. The UK has relatively high PTR in primary and secondary education: 21 pupils per teacher in primary education and 18 pupils per teacher in secondary education. Comparatively, the OECD average pupil teacher ratios are 15 and 13 respectively.
0
2
4
6
8
10
12
14
16
18
20
2005 2006 2007 2008 2009 2010 2011 2012 2013 2014 2015
Pu
pil t
each
er
rati
o
England Wales Scotland Northern Ireland
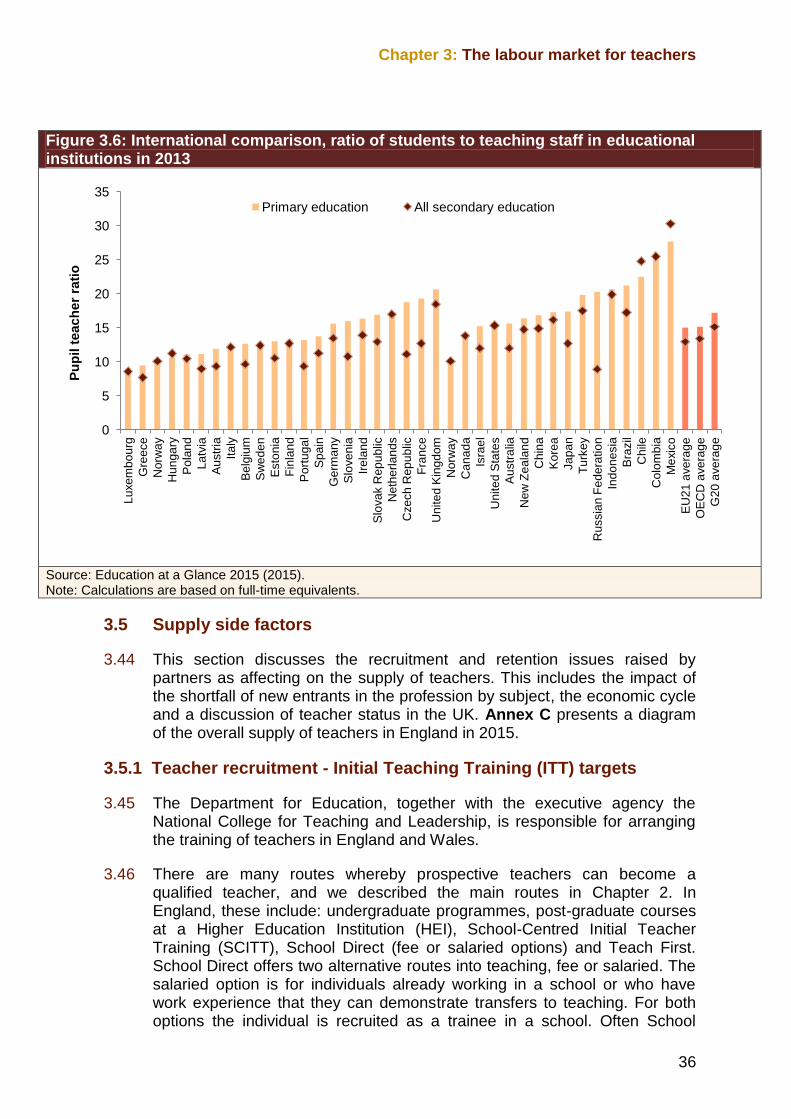
Chapter 3: The labour market for teachers
36
Figure 3.6: International comparison, ratio of students to teaching staff in educational institutions in 2013
Source: Education at a Glance 2015 (2015). Note: Calculations are based on full-time equivalents.
3.5 Supply side factors
3.44 This section discusses the recruitment and retention issues raised by partners as affecting on the supply of teachers. This includes the impact of the shortfall of new entrants in the profession by subject, the economic cycle and a discussion of teacher status in the UK. Annex C presents a diagram of the overall supply of teachers in England in 2015.
3.5.1 Teacher recruitment - Initial Teaching Training (ITT) targets
3.45 The Department for Education, together with the executive agency the National College for Teaching and Leadership, is responsible for arranging the training of teachers in England and Wales.
3.46 There are many routes whereby prospective teachers can become a qualified teacher, and we described the main routes in Chapter 2. In England, these include: undergraduate programmes, post-graduate courses at a Higher Education Institution (HEI), School-Centred Initial Teacher Training (SCITT), School Direct (fee or salaried options) and Teach First. School Direct offers two alternative routes into teaching, fee or salaried. The salaried option is for individuals already working in a school or who have work experience that they can demonstrate transfers to teaching. For both options the individual is recruited as a trainee in a school. Often School
0
5
10
15
20
25
30
35
Lu
xe
mb
ou
rg
Gre
ece
Norw
ay
Hu
ng
ary
Po
lan
d
La
tvia
Au
str
ia
Ita
ly
Be
lgiu
m
Sw
ed
en
Esto
nia
Fin
lan
d
Po
rtu
ga
l
Sp
ain
Ge
rma
ny
Slo
ve
nia
Ire
lan
d
Slo
va
k R
ep
ub
lic
Ne
the
rla
nd
s
Cze
ch
Rep
ub
lic
Fra
nce
Unite
d K
ing
do
m
Norw
ay
Can
ad
a
Isra
el
Unite
d S
tate
s
Au
str
alia
New
Ze
ala
nd
Chin
a
Ko
rea
Ja
pa
n
Tu
rke
y
Russia
n F
ed
era
tio
n
Ind
on
esia
Bra
zil
Ch
ile
Colo
mb
ia
Me
xic
o
EU
21
ave
rag
e
OE
CD
ave
rag
e
G2
0 a
ve
rag
e
Pu
pil t
each
er
rati
o
Primary education All secondary education
Chapter 3: The labour market for teachers
37
Direct participants will continue in the school once their training is complete. Teach First is another salaried option for potential recruits; this is a two year scheme for which participants are trained to be effective teachers and leaders in schools in low-income or otherwise disadvantaged areas.
England
3.47 In England, the post-graduate route is by far the most popular route for trainee secondary teachers and is slightly more popular than the undergraduate route for trainee primary teachers. When broken down by route type, in 2015-16, around 14,000 (49 per cent) of new entrants came through Post Graduate HEIs, with School Direct being the second largest route accounting for around 7,000 (26 per cent). The remaining routes, School-Centre Initial Teacher Training SCITTS, School Direct (salaried) and Teach First, account for the remaining entrants.
3.48 In England, the Government sees School Direct as one of the primary routes for training new teachers. However, 57 per cent of state-funded schools do not participate in School Direct and School Direct provision across the country is patchy. Many rural schools that do not have access to School Direct training routes.
3.49 The DfE run a Teacher Supply Model (TSM) annually to estimate the number of new teacher trainees required. The department uses a range of data about the current teacher workforce (stock of teachers), anticipated changes in pupil numbers, and estimates of future leavers, to forecast how many new entrants are needed each year. The purpose of the model is to calculate the optimum volume of ITT places, which minimises the difference between supply and demand. The model covers state schools, academies and free schools. It does not account for special needs schools.
3.50 The model explicitly accounts for completion and employment rates of trainee teachers. Employment is measured on the basis of those teachers employed in the state sector in England. However, the model assumes that some teachers will also find jobs in the independent sector or outside England. In addition, the model does not directly factor in the migration of teachers but it does partially account for pupil projections due to migration. The outflows or wastage of teachers leaving the profession is directly included in the model and takes account of different demographic patterns. The wastage model considers men and women separately as they respond differently to different economic conditions.
3.51 Furthermore, because not all of those who take up an initial teacher training course will complete the course, and out of those who do, some of them may leave the profession, or choose to work in the private sector the output of the teacher supply model is uplifted by accordingly to reflect leakages.
3.52 There are additional concerns raised around the use of the TSM. Using the targets as informative about shortage presumes that the TSM is a good model for forecasting teacher demand. The National Audit Office (NAO)
Chapter 3: The labour market for teachers
38
highlights that although the TSM is well thought through, there are some issues with the model. First, the model includes projections (high and low estimates) for some inputs but it does not assess the likelihood of each factor causing the projections. Second, the model does not directly factor in the needs of the independent sector. Third, there is no evaluation of the model from previous years.
3.53 There is wide variation in the availability of training places across England, which is not reflected in the modelling, ranging from 294 trainees for every 100,000 pupils in the East of England to 547 in the North West. Where a person trains often affects where they ultimately become teachers. This means that certain areas of the country do not have the shortages that other areas suffer, due to population, demographics, the location of graduates and the desirability of living in certain locations rather than others.
3.54 Many partners told us of specific issues regarding the targets produced by the DfE Teacher Supply Model. One main concern is that each year the model assumes the current stock of teachers is sufficient and only makes predictions about the forecasted changes to the supply and demand of teachers. Therefore the model does not factor in the ‘lost ground’ where previous intakes of trainees have fallen short of targets.
3.55 This is important as, for subjects such as physics where the ITT target has never been met, the loss of ITT places has never been recouped. It is therefore important for the model to account for the shortfall in previous years when determining the targets for future years.
3.56 In Chapter 4 we present data on the number of new teachers recruited against ITT targets set by the DfE’s TSM.
Scotland
3.57 In Scotland, it is a legal requirement for any teacher teaching in a Scottish state school to be registered with the General Teaching Council for Scotland (GTCS). The GTCS provide a wide range of statutory functions and initiatives to promote, support and develop the professional learning of teachers. As of 1 January 2016, there were a number of changes to the registration rules for applicants qualified outside of Scotland.
3.58 Similar to Wales, Scotland’s initial teacher education providers have been set specific targets for student teacher recruitment for subjects in high demand such as chemistry, computing, maths and physics.
3.59 The annual teacher workforce planning exercise sets these student teacher intake targets. The aim is to set intake targets for each individual secondary subject with the goal of replenishing the teaching workforce at an equal rate across all subjects. This is done in partnership with stakeholders including the Scottish Government, teacher education universities, local authorities, teacher unions and the Scottish Funding Council (SFC).

Chapter 3: The labour market for teachers
39
Wales
3.60 The Welsh Government takes a role in managing teacher supply for maintained schools in Wales. By forecasting, along with an annual data update to the Teacher Planning and Supply Model (TPSM), they set the demand for newly qualified teachers through annual intake targets for recruitment to accredited initial teacher education and training (ITET) courses in Wales.
3.61 Evidence submitted by the Welsh Education Workforce Council explained that in 2005 the Welsh Government commissioned a review of Initial Teacher Training in Wales. The subsequent report produced by Professor John Furlong (2006) highlighted a need for a reduction in ITT intakes to match more closely the numbers of newly-qualified teachers required in Wales. 4
3.62 In recent years the TPSM has seen evidence of significant over supply of qualified teachers and between 2004-05 and 2015-16 intake numbers reduced by approximately one third. This aligned with the student population which has almost halved since 2003-04.
3.63 The Welsh Government has made training incentives available to students undertaking postgraduate ITET courses. Students starting postgraduate courses in the subjects of maths, physics, chemistry, and Welsh could be eligible for grants of up to £20,000.
Northern Ireland
3.64 We were told by partners that Northern Ireland has an oversupply of teachers and is trying to incentivise older, more experienced teachers to leave to allow younger teachers the opportunity to enter the profession. The Northern Ireland government launched Investing in the Teaching Workforce Scheme on 5 September 2016, which will enable up to 120 teachers aged 55 years and over on 31 March 2017 to be released from the teaching profession, to provide job opportunities for up to 120 recently qualified teachers.
3.5.2 Initial teacher training and the economic cycle
3.65 Partners have consistently highlighted that there is an inverse relationship between the strength of the economy and their ability to recruit teachers. DfE said it had been criticised by the National Audit Office for not being able to meet their ITT targets for the last 4 years but said that this reflects a period of economic recovery in which teaching becomes a relatively less attractive profession as the graduate labour market becomes stronger.
4 Review of Initial Teacher Training Provision in Wales: A Report to the Welsh Assembly Government, Professor J. Furlong.
Published 2006. Available from: http://www.education.ox.ac.uk/wordpress/wp-content/uploads/2010/07/CE-Report-Annex-A-Review-of-ITT-provision-in-Wales-English.pdf
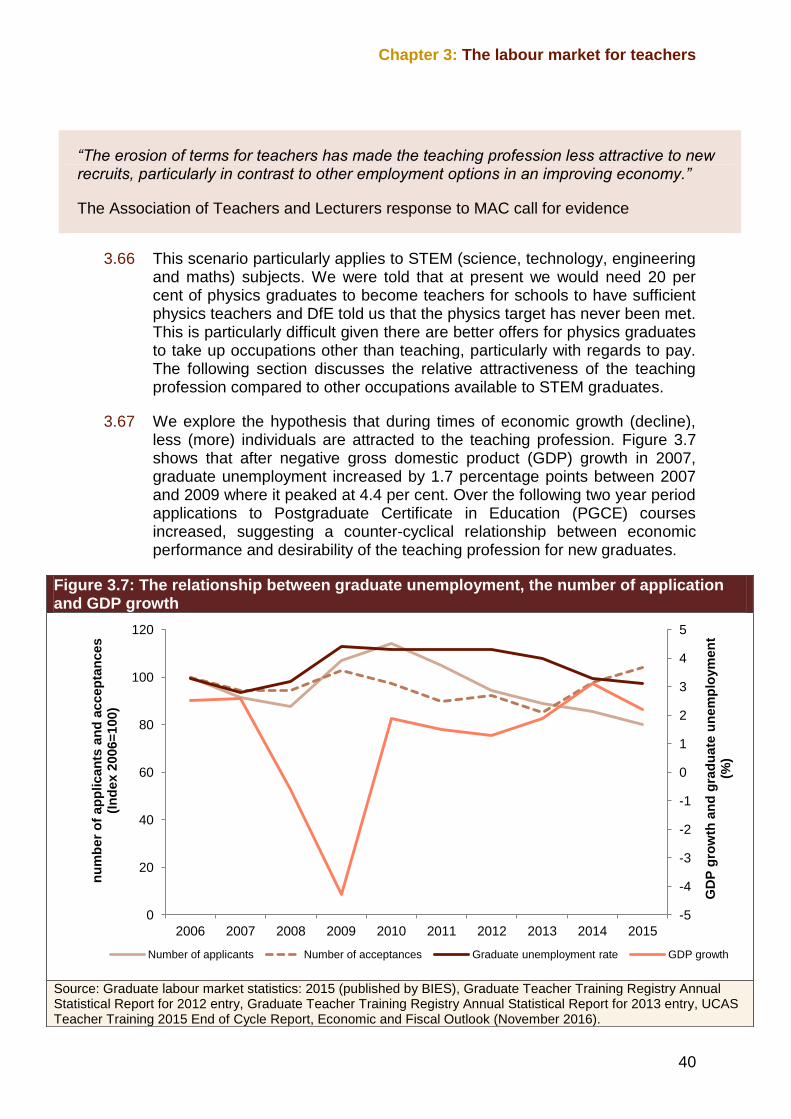
Chapter 3: The labour market for teachers
40
“The erosion of terms for teachers has made the teaching profession less attractive to new recruits, particularly in contrast to other employment options in an improving economy.”
The Association of Teachers and Lecturers response to MAC call for evidence
3.66 This scenario particularly applies to STEM (science, technology, engineering and maths) subjects. We were told that at present we would need 20 per cent of physics graduates to become teachers for schools to have sufficient physics teachers and DfE told us that the physics target has never been met. This is particularly difficult given there are better offers for physics graduates to take up occupations other than teaching, particularly with regards to pay. The following section discusses the relative attractiveness of the teaching profession compared to other occupations available to STEM graduates.
3.67 We explore the hypothesis that during times of economic growth (decline), less (more) individuals are attracted to the teaching profession. Figure 3.7 shows that after negative gross domestic product (GDP) growth in 2007, graduate unemployment increased by 1.7 percentage points between 2007 and 2009 where it peaked at 4.4 per cent. Over the following two year period applications to Postgraduate Certificate in Education (PGCE) courses increased, suggesting a counter-cyclical relationship between economic performance and desirability of the teaching profession for new graduates.
Figure 3.7: The relationship between graduate unemployment, the number of application and GDP growth
Source: Graduate labour market statistics: 2015 (published by BIES), Graduate Teacher Training Registry Annual Statistical Report for 2012 entry, Graduate Teacher Training Registry Annual Statistical Report for 2013 entry, UCAS Teacher Training 2015 End of Cycle Report, Economic and Fiscal Outlook (November 2016).
-5
-4
-3
-2
-1
0
1
2
3
4
5
0
20
40
60
80
100
120
2006 2007 2008 2009 2010 2011 2012 2013 2014 2015
GD
P g
row
th a
nd
gra
du
ate
un
em
plo
ym
en
t
(%)
nu
mb
er
of
ap
plican
ts a
nd
accep
tan
ces
(In
dex 2
006=
100)
Number of applicants Number of acceptances Graduate unemployment rate GDP growth
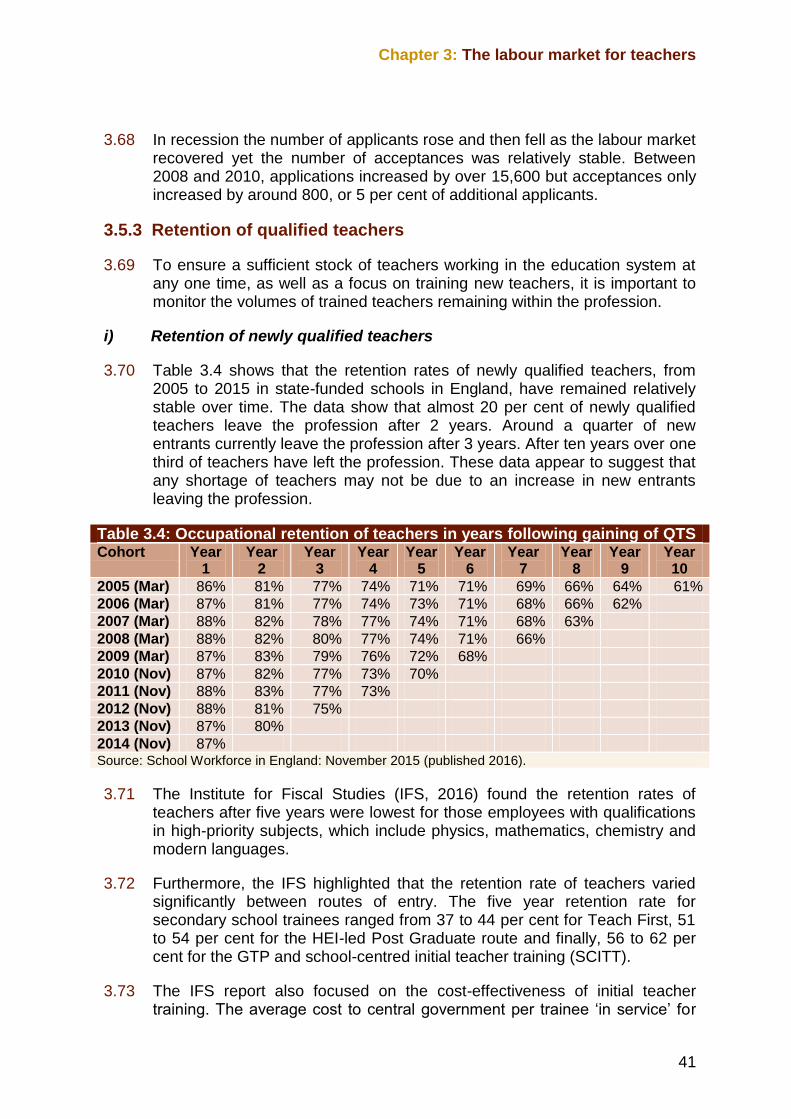
Chapter 3: The labour market for teachers
41
3.68 In recession the number of applicants rose and then fell as the labour market recovered yet the number of acceptances was relatively stable. Between 2008 and 2010, applications increased by over 15,600 but acceptances only increased by around 800, or 5 per cent of additional applicants.
3.5.3 Retention of qualified teachers
3.69 To ensure a sufficient stock of teachers working in the education system at any one time, as well as a focus on training new teachers, it is important to monitor the volumes of trained teachers remaining within the profession.
i) Retention of newly qualified teachers
3.70 Table 3.4 shows that the retention rates of newly qualified teachers, from 2005 to 2015 in state-funded schools in England, have remained relatively stable over time. The data show that almost 20 per cent of newly qualified teachers leave the profession after 2 years. Around a quarter of new entrants currently leave the profession after 3 years. After ten years over one third of teachers have left the profession. These data appear to suggest that any shortage of teachers may not be due to an increase in new entrants leaving the profession.
Table 3.4: Occupational retention of teachers in years following gaining of QTS Cohort Year
1 Year
2 Year
3 Year
4 Year
5 Year
6 Year
7 Year
8 Year
9 Year 10
2005 (Mar) 86% 81% 77% 74% 71% 71% 69% 66% 64% 61%
2006 (Mar) 87% 81% 77% 74% 73% 71% 68% 66% 62%
2007 (Mar) 88% 82% 78% 77% 74% 71% 68% 63%
2008 (Mar) 88% 82% 80% 77% 74% 71% 66%
2009 (Mar) 87% 83% 79% 76% 72% 68%
2010 (Nov) 87% 82% 77% 73% 70%
2011 (Nov) 88% 83% 77% 73%
2012 (Nov) 88% 81% 75%
2013 (Nov) 87% 80%
2014 (Nov) 87% Source: School Workforce in England: November 2015 (published 2016).
3.71 The Institute for Fiscal Studies (IFS, 2016) found the retention rates of teachers after five years were lowest for those employees with qualifications in high-priority subjects, which include physics, mathematics, chemistry and modern languages.
3.72 Furthermore, the IFS highlighted that the retention rate of teachers varied significantly between routes of entry. The five year retention rate for secondary school trainees ranged from 37 to 44 per cent for Teach First, 51 to 54 per cent for the HEI-led Post Graduate route and finally, 56 to 62 per cent for the GTP and school-centred initial teacher training (SCITT).
3.73 The IFS report also focused on the cost-effectiveness of initial teacher training. The average cost to central government per trainee ‘in service’ for
Chapter 3: The labour market for teachers
42
five years after their expected date of qualification is significantly higher for Teach First with a cost of between £59,000 and £70,000. For each trainee Teach First receives net funding of £28,700; this figure includes direct grants from the National College for Teaching and Leadership (NCTL), fees paid by schools and voluntary contributions. In contrast, HEI providers receive £9,000 in tuition fees for HEI-led PG courses. The cost-effectiveness of ITT depends on the retention rate of teachers. As well as higher initial costs the Teach First route also has lower retention rates. Reasons for lower retention amongst Teach First trainees include the responsiveness of trainees to the local labour market. Teach First trainees are most likely to leave the profession if teaching in a high-wage area. Lower retention implies that the average cost of training a teacher who remains (or starts) in teaching increases.
ii) Retention of qualified teachers already in service
3.74 For England, the Schools Workforce Census provides information on entrant and wastage rates. The wastage rate is the rate at which teachers leave the profession in England, for instance to work in the independent sector or work in another devolved administration, move into a different profession or retire.
3.75 Figure 3.8 presents data on entrant and wastage rates in England by type of school for the last 5 years. The number of primary entrants has exceeded the number of primary teachers exiting the profession thus leading to an increase in the number of primary school teachers. When looking at teacher entrant and leaving rates for secondary school teachers, the proportion of teachers leaving is slightly higher than the number of teachers entering, since 2013, the profession suggesting a reduction in the number of teachers in employment.
3.76 The data aligns to what we have seen already in Figure 3.1. Previously, we described how there has been a 10 per cent increase in the number of nursery and primary teachers alongside a 9 per cent increase in the number of pupils between 2011 and 2015. A reduction in the number of secondary teachers (2 per cent) also aligned with a 2 per cent decrease in the number of secondary pupils. For special needs we can see that the number of entrants and leavers are also similar, however exhibits a peak seen in 2013. However, like secondary schools, special needs schools have a higher proportion of teachers leaving as opposed to entering the profession.
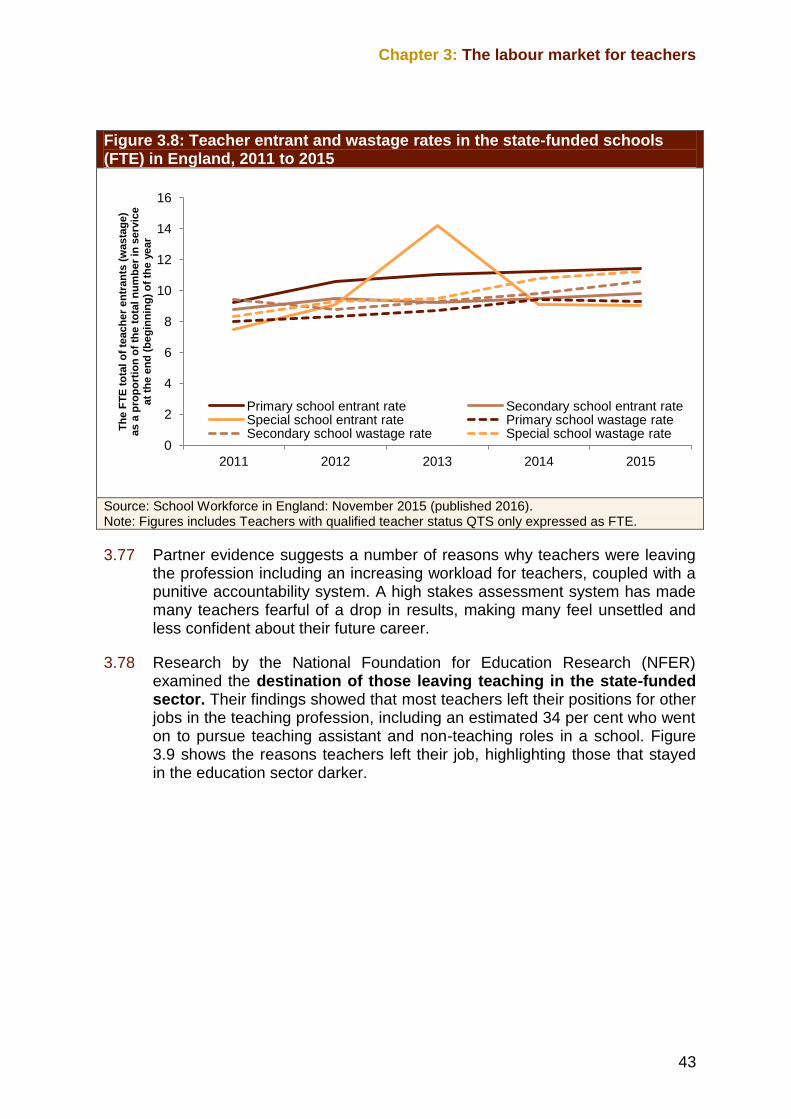
Chapter 3: The labour market for teachers
43
Figure 3.8: Teacher entrant and wastage rates in the state-funded schools (FTE) in England, 2011 to 2015
Source: School Workforce in England: November 2015 (published 2016). Note: Figures includes Teachers with qualified teacher status QTS only expressed as FTE.
3.77 Partner evidence suggests a number of reasons why teachers were leaving the profession including an increasing workload for teachers, coupled with a punitive accountability system. A high stakes assessment system has made many teachers fearful of a drop in results, making many feel unsettled and less confident about their future career.
3.78 Research by the National Foundation for Education Research (NFER) examined the destination of those leaving teaching in the state-funded sector. Their findings showed that most teachers left their positions for other jobs in the teaching profession, including an estimated 34 per cent who went on to pursue teaching assistant and non-teaching roles in a school. Figure 3.9 shows the reasons teachers left their job, highlighting those that stayed in the education sector darker.
0
2
4
6
8
10
12
14
16
2011 2012 2013 2014 2015
Th
e F
TE
to
tal
of
teach
er
en
tran
ts (
wasta
ge
) as a
pro
po
rtio
n o
f th
e t
ota
l n
um
be
r in
serv
ice
at
the
en
d (
be
gin
nin
g)
of
the
year
Primary school entrant rate Secondary school entrant rate Special school entrant rate Primary school wastage rate Secondary school wastage rate Special school wastage rate
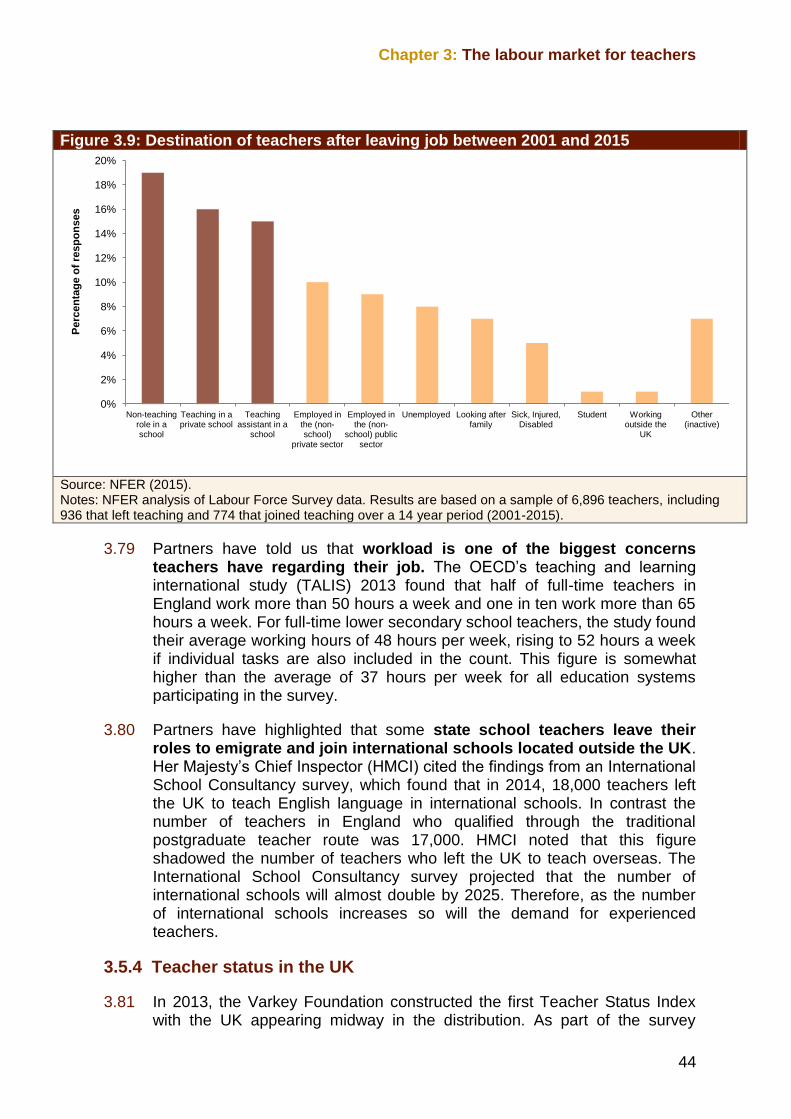
Chapter 3: The labour market for teachers
44
Figure 3.9: Destination of teachers after leaving job between 2001 and 2015
Source: NFER (2015). Notes: NFER analysis of Labour Force Survey data. Results are based on a sample of 6,896 teachers, including 936 that left teaching and 774 that joined teaching over a 14 year period (2001-2015).
3.79 Partners have told us that workload is one of the biggest concerns teachers have regarding their job. The OECD’s teaching and learning international study (TALIS) 2013 found that half of full-time teachers in England work more than 50 hours a week and one in ten work more than 65 hours a week. For full-time lower secondary school teachers, the study found their average working hours of 48 hours per week, rising to 52 hours a week if individual tasks are also included in the count. This figure is somewhat higher than the average of 37 hours per week for all education systems participating in the survey.
3.80 Partners have highlighted that some state school teachers leave their roles to emigrate and join international schools located outside the UK. Her Majesty’s Chief Inspector (HMCI) cited the findings from an International School Consultancy survey, which found that in 2014, 18,000 teachers left the UK to teach English language in international schools. In contrast the number of teachers in England who qualified through the traditional postgraduate teacher route was 17,000. HMCI noted that this figure shadowed the number of teachers who left the UK to teach overseas. The International School Consultancy survey projected that the number of international schools will almost double by 2025. Therefore, as the number of international schools increases so will the demand for experienced teachers.
3.5.4 Teacher status in the UK
3.81 In 2013, the Varkey Foundation constructed the first Teacher Status Index with the UK appearing midway in the distribution. As part of the survey
0%
2%
4%
6%
8%
10%
12%
14%
16%
18%
20%
Non-teaching role in a school
Teaching in a private school
Teaching assistant in a
school
Employed in the (non-school)
private sector
Employed in the (non-
school) public sector
Unemployed Looking after family
Sick, Injured, Disabled
Student Working outside the
UK
Other (inactive)
Perc
en
tag
e o
f re
sp
on
ses
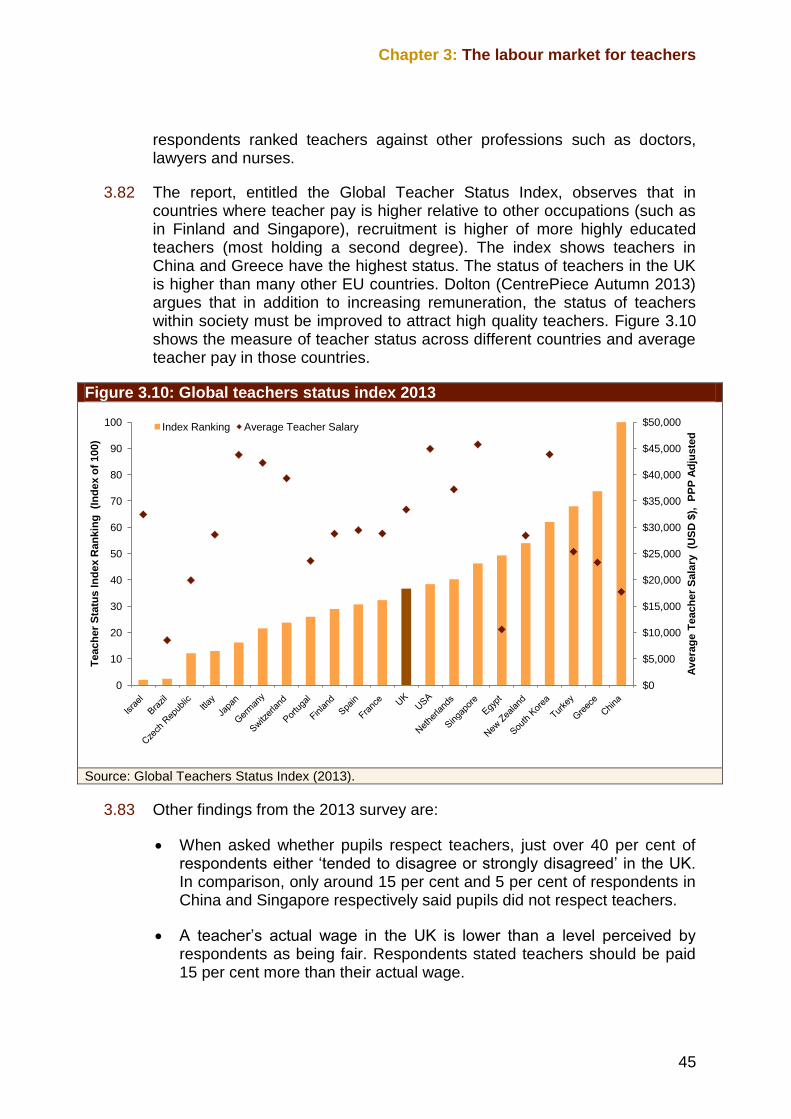
Chapter 3: The labour market for teachers
45
respondents ranked teachers against other professions such as doctors, lawyers and nurses.
3.82 The report, entitled the Global Teacher Status Index, observes that in countries where teacher pay is higher relative to other occupations (such as in Finland and Singapore), recruitment is higher of more highly educated teachers (most holding a second degree). The index shows teachers in China and Greece have the highest status. The status of teachers in the UK is higher than many other EU countries. Dolton (CentrePiece Autumn 2013) argues that in addition to increasing remuneration, the status of teachers within society must be improved to attract high quality teachers. Figure 3.10 shows the measure of teacher status across different countries and average teacher pay in those countries.
Figure 3.10: Global teachers status index 2013
Source: Global Teachers Status Index (2013).
3.83 Other findings from the 2013 survey are:
When asked whether pupils respect teachers, just over 40 per cent of respondents either ‘tended to disagree or strongly disagreed’ in the UK. In comparison, only around 15 per cent and 5 per cent of respondents in China and Singapore respectively said pupils did not respect teachers.
A teacher’s actual wage in the UK is lower than a level perceived by respondents as being fair. Respondents stated teachers should be paid 15 per cent more than their actual wage.
$0
$5,000
$10,000
$15,000
$20,000
$25,000
$30,000
$35,000
$40,000
$45,000
$50,000
0
10
20
30
40
50
60
70
80
90
100
Avera
ge
Teach
er
Sala
ry
(US
D $
), P
PP
Ad
jus
ted
Teach
er
Sta
tus I
nd
ex R
an
kin
g (I
nd
ex o
f 100)
Index Ranking Average Teacher Salary
Chapter 3: The labour market for teachers
46
3.84 Some partners told us that graduates are favouring other occupations over teaching because of the negative perception of teaching as presented in the media. OFSTED and the Association of School and College Leaders told us that the main negative perceptions of teaching were the anticipated workload, the additional hours, the low status of teachers and the classroom environment. The majority of partners emphasised that the reality of workload and pupil behaviour rarely met these negative expectations.
3.85 In the next section we go on to examine how teachers pay has changed over time as well as how competitive teachers pay is compared to other professions.
3.6 Teachers’ pay
3.86 We focus in this section on various aspects of teacher pay: pay in absolute terms, pay growth over time and pay progression compared to other professional occupations. In the second part of this section we explore how teachers pay differs by subject as well as likely earnings on offer in alternative occupations.
3.6.1 Teachers’ historical pay growth
3.87 The School Teachers Review Body (STRB) has been examining and making recommendations on the pay of teachers in England since 1991. They recommend the annual pay increase every year at both the maximum and minimum points in the pay distribution. Under their recommendation, teachers’ pay grew strongly between 1998 and 2004, well above inflation. From 2005 onwards pay grew at a slower rate than inflation, particularly in primary and special needs education.
3.88 Figure 3.11 shows that the growth in median weekly pay of full-time primary and nursery, secondary and special needs teachers has tracked professional pay generally over the last 20 years.
3.89 Between 2010 and 2015, successive pay freezes and wider public-sector pay restraint affected teachers’ pay. The STRB recommendations reflected the Government’s policy on public sector pay awards, limited to an average pay award of 1 per cent. Whereas the data presented in Figure 3.11 shows how over this time period, the pay of professionals, managers and senior officials has in general increased at a faster rate than teachers.
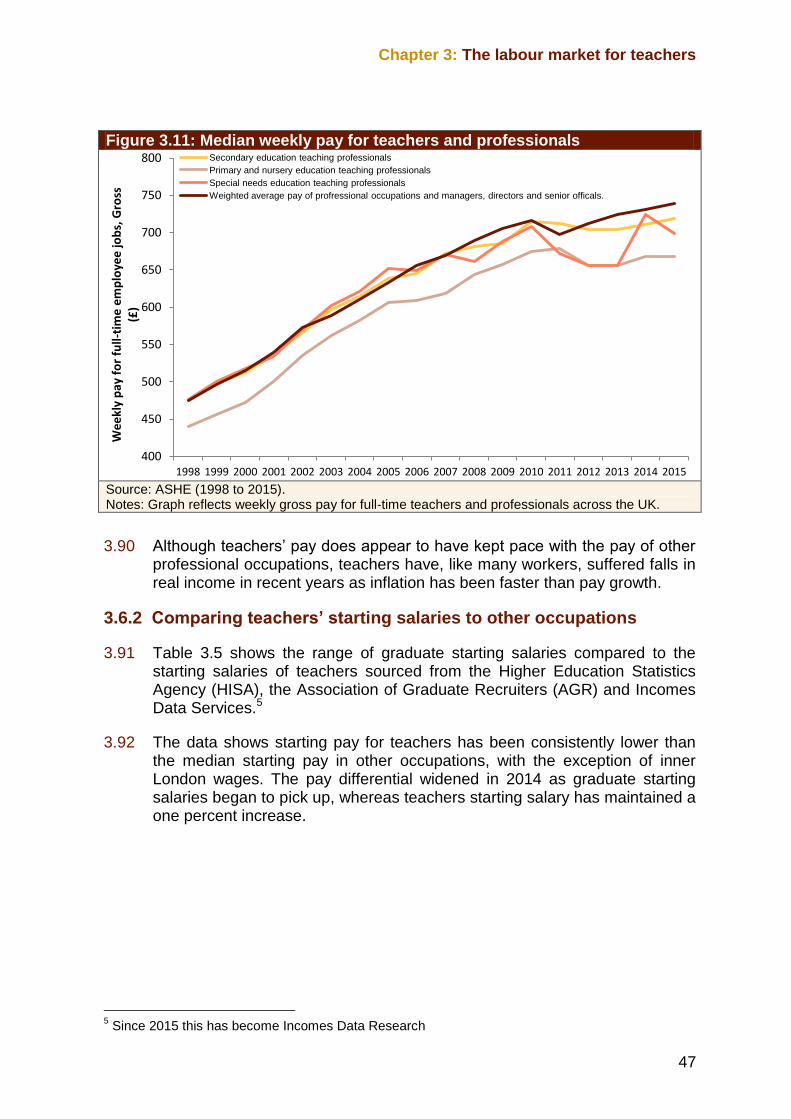
Chapter 3: The labour market for teachers
47
Figure 3.11: Median weekly pay for teachers and professionals
Source: ASHE (1998 to 2015). Notes: Graph reflects weekly gross pay for full-time teachers and professionals across the UK.
3.90 Although teachers’ pay does appear to have kept pace with the pay of other professional occupations, teachers have, like many workers, suffered falls in real income in recent years as inflation has been faster than pay growth.
3.6.2 Comparing teachers’ starting salaries to other occupations
3.91 Table 3.5 shows the range of graduate starting salaries compared to the starting salaries of teachers sourced from the Higher Education Statistics Agency (HISA), the Association of Graduate Recruiters (AGR) and Incomes Data Services.5
3.92 The data shows starting pay for teachers has been consistently lower than the median starting pay in other occupations, with the exception of inner London wages. The pay differential widened in 2014 as graduate starting salaries began to pick up, whereas teachers starting salary has maintained a one percent increase.
5 Since 2015 this has become Incomes Data Research
400
450
500
550
600
650
700
750
800
1998 1999 2000 2001 2002 2003 2004 2005 2006 2007 2008 2009 2010 2011 2012 2013 2014 2015
We
ekl
y p
ay f
or
full-
tim
e e
mp
loye
e jo
bs,
Gro
ss
(£)
Secondary education teaching professionals
Primary and nursery education teaching professionals
Special needs education teaching professionals
Weighted average pay of profressional occupations and managers, directors and senior officals.
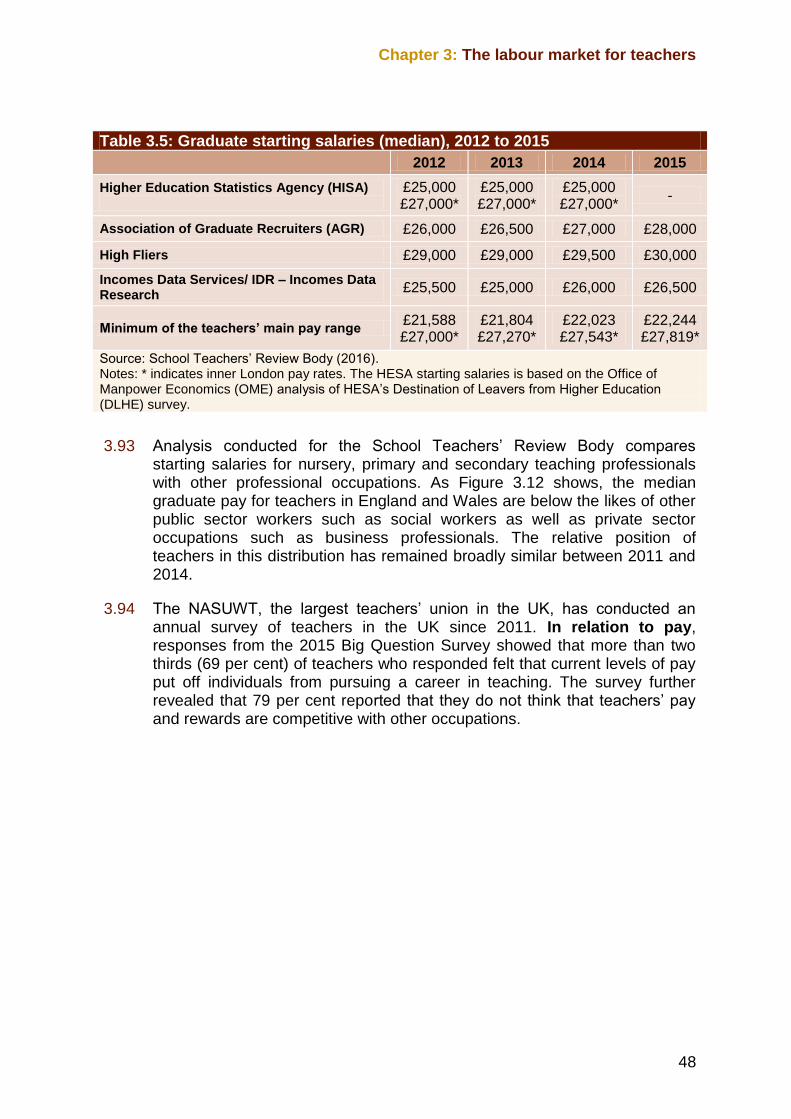
Chapter 3: The labour market for teachers
48
Table 3.5: Graduate starting salaries (median), 2012 to 2015
2012 2013 2014 2015
Higher Education Statistics Agency (HISA)
£25,000 £27,000*
£25,000 £27,000*
£25,000 £27,000*
-
Association of Graduate Recruiters (AGR) £26,000 £26,500 £27,000 £28,000
High Fliers £29,000 £29,000 £29,500 £30,000
Incomes Data Services/ IDR – Incomes Data Research
£25,500 £25,000 £26,000 £26,500
Minimum of the teachers’ main pay range £21,588 £27,000*
£21,804 £27,270*
£22,023 £27,543*
£22,244 £27,819*
Source: School Teachers’ Review Body (2016). Notes: * indicates inner London pay rates. The HESA starting salaries is based on the Office of Manpower Economics (OME) analysis of HESA’s Destination of Leavers from Higher Education (DLHE) survey.
3.93 Analysis conducted for the School Teachers’ Review Body compares starting salaries for nursery, primary and secondary teaching professionals with other professional occupations. As Figure 3.12 shows, the median graduate pay for teachers in England and Wales are below the likes of other public sector workers such as social workers as well as private sector occupations such as business professionals. The relative position of teachers in this distribution has remained broadly similar between 2011 and 2014.
3.94 The NASUWT, the largest teachers’ union in the UK, has conducted an annual survey of teachers in the UK since 2011. In relation to pay, responses from the 2015 Big Question Survey showed that more than two thirds (69 per cent) of teachers who responded felt that current levels of pay put off individuals from pursuing a career in teaching. The survey further revealed that 79 per cent reported that they do not think that teachers’ pay and rewards are competitive with other occupations.
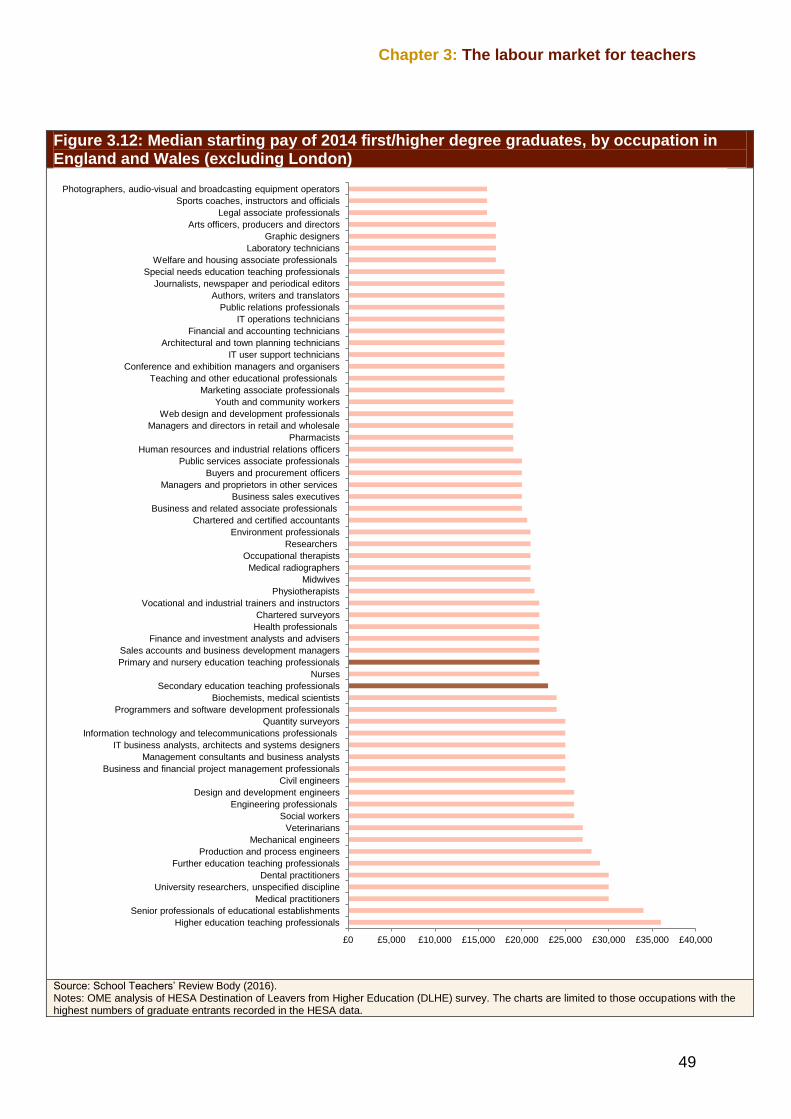
Chapter 3: The labour market for teachers
49
Figure 3.12: Median starting pay of 2014 first/higher degree graduates, by occupation in England and Wales (excluding London)
Source: School Teachers’ Review Body (2016). Notes: OME analysis of HESA Destination of Leavers from Higher Education (DLHE) survey. The charts are limited to those occupations with the highest numbers of graduate entrants recorded in the HESA data.
£0 £5,000 £10,000 £15,000 £20,000 £25,000 £30,000 £35,000 £40,000
Higher education teaching professionals
Senior professionals of educational establishments
Medical practitioners
University researchers, unspecified discipline
Dental practitioners
Further education teaching professionals
Production and process engineers
Mechanical engineers
Veterinarians
Social workers
Engineering professionals
Design and development engineers
Civil engineers
Business and financial project management professionals
Management consultants and business analysts
IT business analysts, architects and systems designers
Information technology and telecommunications professionals
Quantity surveyors
Programmers and software development professionals
Biochemists, medical scientists
Secondary education teaching professionals
Nurses
Primary and nursery education teaching professionals
Sales accounts and business development managers
Finance and investment analysts and advisers
Health professionals
Chartered surveyors
Vocational and industrial trainers and instructors
Physiotherapists
Midwives
Medical radiographers
Occupational therapists
Researchers
Environment professionals
Chartered and certified accountants
Business and related associate professionals
Business sales executives
Managers and proprietors in other services
Buyers and procurement officers
Public services associate professionals
Human resources and industrial relations officers
Pharmacists
Managers and directors in retail and wholesale
Web design and development professionals
Youth and community workers
Marketing associate professionals
Teaching and other educational professionals
Conference and exhibition managers and organisers
IT user support technicians
Architectural and town planning technicians
Financial and accounting technicians
IT operations technicians
Public relations professionals
Authors, writers and translators
Journalists, newspaper and periodical editors
Special needs education teaching professionals
Welfare and housing associate professionals
Laboratory technicians
Graphic designers
Arts officers, producers and directors
Legal associate professionals
Sports coaches, instructors and officials
Photographers, audio-visual and broadcasting equipment operators
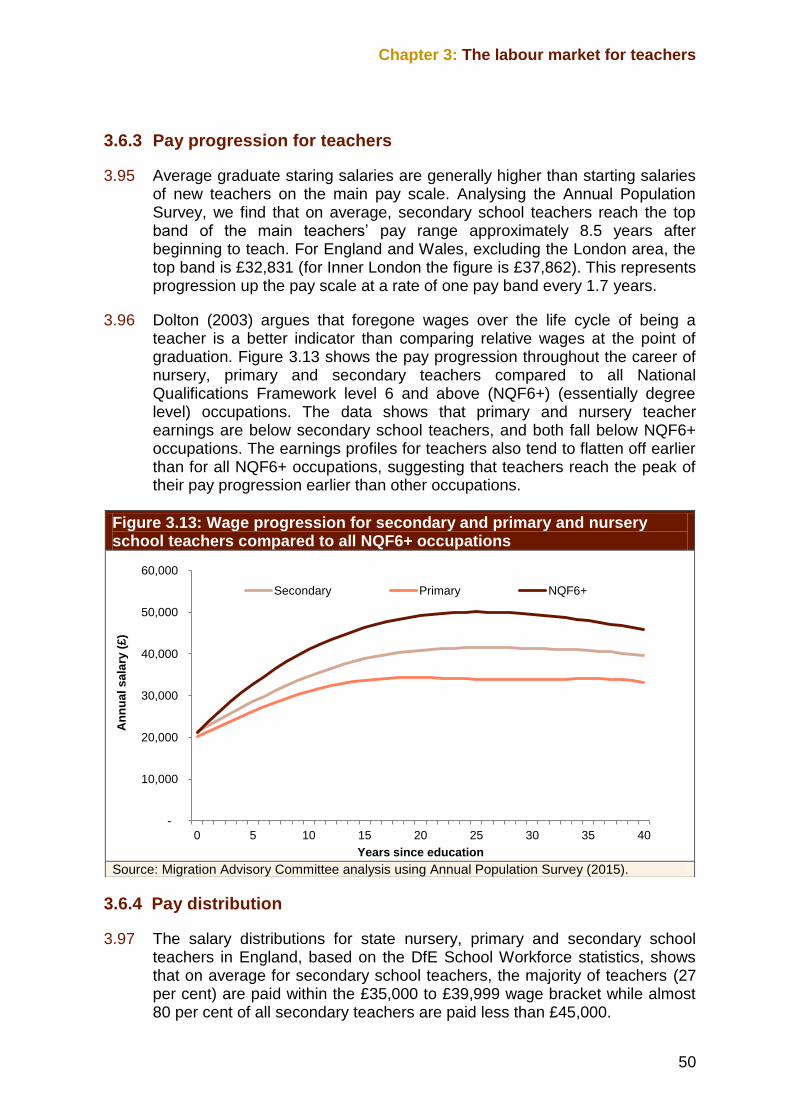
Chapter 3: The labour market for teachers
50
3.6.3 Pay progression for teachers
3.95 Average graduate staring salaries are generally higher than starting salaries of new teachers on the main pay scale. Analysing the Annual Population Survey, we find that on average, secondary school teachers reach the top band of the main teachers’ pay range approximately 8.5 years after beginning to teach. For England and Wales, excluding the London area, the top band is £32,831 (for Inner London the figure is £37,862). This represents progression up the pay scale at a rate of one pay band every 1.7 years.
3.96 Dolton (2003) argues that foregone wages over the life cycle of being a teacher is a better indicator than comparing relative wages at the point of graduation. Figure 3.13 shows the pay progression throughout the career of nursery, primary and secondary teachers compared to all National Qualifications Framework level 6 and above (NQF6+) (essentially degree level) occupations. The data shows that primary and nursery teacher earnings are below secondary school teachers, and both fall below NQF6+ occupations. The earnings profiles for teachers also tend to flatten off earlier than for all NQF6+ occupations, suggesting that teachers reach the peak of their pay progression earlier than other occupations.
3.6.4 Pay distribution
3.97 The salary distributions for state nursery, primary and secondary school teachers in England, based on the DfE School Workforce statistics, shows that on average for secondary school teachers, the majority of teachers (27 per cent) are paid within the £35,000 to £39,999 wage bracket while almost 80 per cent of all secondary teachers are paid less than £45,000.
Figure 3.13: Wage progression for secondary and primary and nursery school teachers compared to all NQF6+ occupations
Source: Migration Advisory Committee analysis using Annual Population Survey (2015).
-
10,000
20,000
30,000
40,000
50,000
60,000
0 5 10 15 20 25 30 35 40
An
nu
al s
ala
ry (
£)
Years since education
Secondary Primary NQF6+
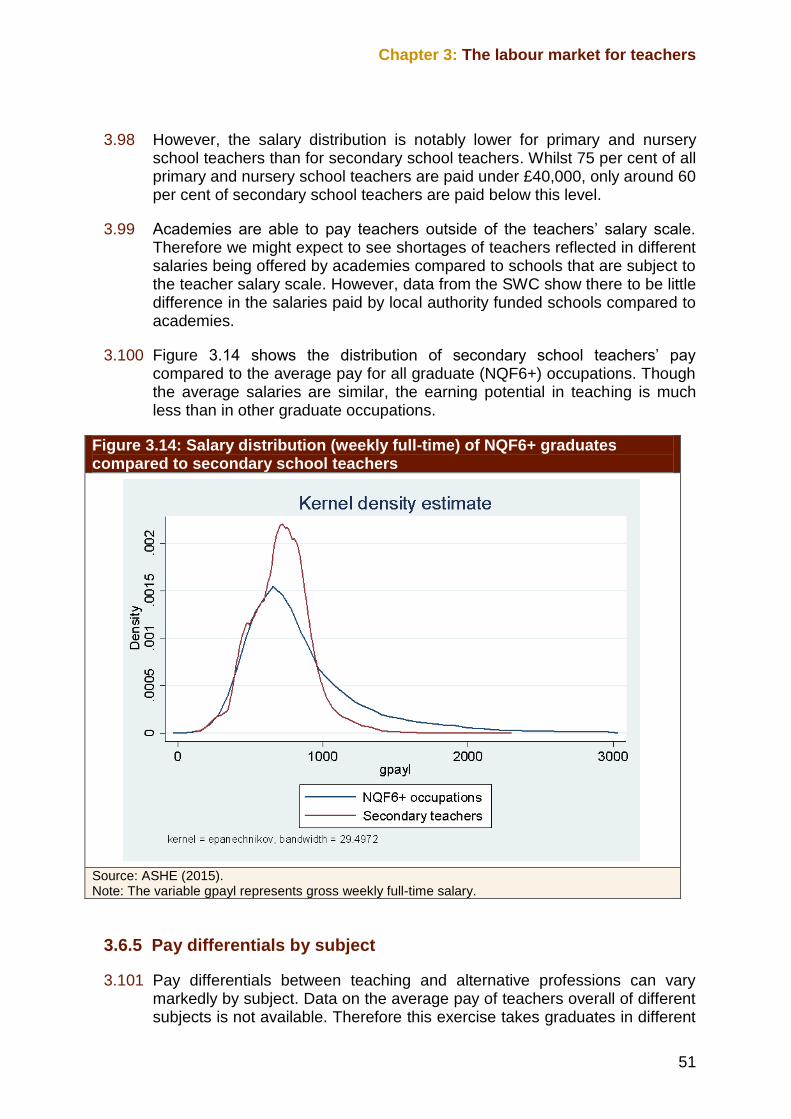
Chapter 3: The labour market for teachers
51
3.98 However, the salary distribution is notably lower for primary and nursery school teachers than for secondary school teachers. Whilst 75 per cent of all primary and nursery school teachers are paid under £40,000, only around 60 per cent of secondary school teachers are paid below this level.
3.99 Academies are able to pay teachers outside of the teachers’ salary scale. Therefore we might expect to see shortages of teachers reflected in different salaries being offered by academies compared to schools that are subject to the teacher salary scale. However, data from the SWC show there to be little difference in the salaries paid by local authority funded schools compared to academies.
3.100 Figure 3.14 shows the distribution of secondary school teachers’ pay compared to the average pay for all graduate (NQF6+) occupations. Though the average salaries are similar, the earning potential in teaching is much less than in other graduate occupations.
Figure 3.14: Salary distribution (weekly full-time) of NQF6+ graduates compared to secondary school teachers
Source: ASHE (2015). Note: The variable gpayl represents gross weekly full-time salary.
3.6.5 Pay differentials by subject
3.101 Pay differentials between teaching and alternative professions can vary markedly by subject. Data on the average pay of teachers overall of different subjects is not available. Therefore this exercise takes graduates in different
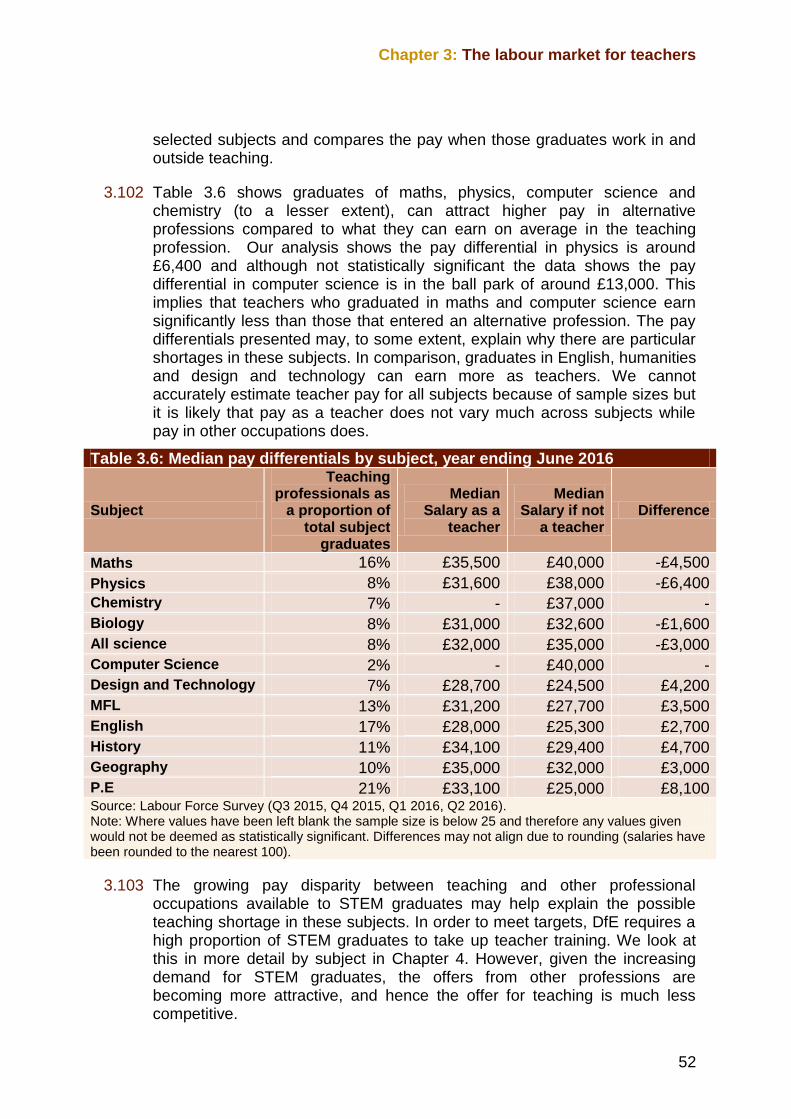
Chapter 3: The labour market for teachers
52
selected subjects and compares the pay when those graduates work in and outside teaching.
3.102 Table 3.6 shows graduates of maths, physics, computer science and chemistry (to a lesser extent), can attract higher pay in alternative professions compared to what they can earn on average in the teaching profession. Our analysis shows the pay differential in physics is around £6,400 and although not statistically significant the data shows the pay differential in computer science is in the ball park of around £13,000. This implies that teachers who graduated in maths and computer science earn significantly less than those that entered an alternative profession. The pay differentials presented may, to some extent, explain why there are particular shortages in these subjects. In comparison, graduates in English, humanities and design and technology can earn more as teachers. We cannot accurately estimate teacher pay for all subjects because of sample sizes but it is likely that pay as a teacher does not vary much across subjects while pay in other occupations does.
Table 3.6: Median pay differentials by subject, year ending June 2016
Subject
Teaching professionals as
a proportion of total subject
graduates
Median Salary as a
teacher
Median Salary if not
a teacher Difference
Maths 16% £35,500 £40,000 -£4,500
Physics 8% £31,600 £38,000 -£6,400
Chemistry 7% - £37,000 -
Biology 8% £31,000 £32,600 -£1,600
All science 8% £32,000 £35,000 -£3,000
Computer Science 2% - £40,000 -
Design and Technology 7% £28,700 £24,500 £4,200
MFL 13% £31,200 £27,700 £3,500
English 17% £28,000 £25,300 £2,700
History 11% £34,100 £29,400 £4,700
Geography 10% £35,000 £32,000 £3,000
P.E 21% £33,100 £25,000 £8,100 Source: Labour Force Survey (Q3 2015, Q4 2015, Q1 2016, Q2 2016). Note: Where values have been left blank the sample size is below 25 and therefore any values given would not be deemed as statistically significant. Differences may not align due to rounding (salaries have been rounded to the nearest 100).
3.103 The growing pay disparity between teaching and other professional occupations available to STEM graduates may help explain the possible teaching shortage in these subjects. In order to meet targets, DfE requires a high proportion of STEM graduates to take up teacher training. We look at this in more detail by subject in Chapter 4. However, given the increasing demand for STEM graduates, the offers from other professions are becoming more attractive, and hence the offer for teaching is much less competitive.
Chapter 3: The labour market for teachers
53
3.104 IFS (2016) found that among secondary teachers, those who teach high-priority subjects are most responsive to wages outside of teaching. They found that a 10 per cent increase in local wages reduced the retention rate of high-priority subject teachers by 2.7 per cent. This might go some way in explaining the low retention rates in these subjects. Although financial incentives are available to train as a teacher, especially in these shortage subjects, there are less explicit financial incentives to remain in teaching in the long run. School leaders do have flexibility in pay awards, particularly after the teacher pay reform introduced in 2013.6 However, decisions to introduce financial incentives for retention have to be made from within a fixed budget.
3.105 A number of respondents said that increasing the pay of teachers is largely impossible, citing government policy to limit pay rises in maintained schools to 1 per cent. It was recognised that most schools are now academies, and able to pay more, but respondents said that most do not do so to any significant extent. Others said that teachers of English, science and maths are often paid above the National Pay scales and that schools are offering incentives and relocation payments. However, respondents were not convinced all schools have fully embraced the performance related pay strategy, citing budgetary pressures. Other respondents said that, in their view, differentiated pay would be divisive in the staff room. But, public sector pay restraint is a choice not an absolute constraint and, as the STPRB pointed out in its last report, it may cause increasing strains if the aggregate labour market continues to strengthen.
3.7 Summary
3.106 This chapter has summarised the key features of the labour market for teachers, considering recruitment via initial teacher training, retention, perceived teacher status and pay.
3.107 When looking at the PTR in secondary schools in England and across the devolved administrations we see that this has remained relatively stable since 2005, meaning at an aggregate level the number of teachers have adjusted well to the changes in the number of pupils. This hold true when looking at nursery and primary education and special needs education.
3.108 With respect to teacher training, each devolved administration has a model which although not perfect, aims to estimate the number of new entrants required to replenish the stock of teachers. When looking at the retention rate, we see that on average around 20 per cent of newly qualified teachers leave the profession after 2 years – this has been consistent since 2005 therefore appears to be the norm and factored into the DfE’s TSM. When looking at teachers already in service, the entrant rate for nursery and primary education has exceed the wastage rate. The entrant rate in secondary education in general has aligned closely with the wastage rate.
6 School teachers’ pay and conditions document 2013.
Chapter 3: The labour market for teachers
54
Interestingly, we find around half of teachers leaving their posts stay within the teaching profession for example, either joining the private education sector or working as a teaching assistant.
3.109 Finally, based on our analysis there is evidence to suggest that STEM graduates can expect to receive higher pay rewards in alternative professions compared to the teaching profession. Most notably, maths, physics and computer science graduates can earn sustainably more outside the teaching profession hence any remuneration for teaching in these subject is not substantive enough to increase the competitiveness of the profession.
3.110 The next chapter considers the available evidence on whether teachers, as a whole or in specific subjects, are in shortage.
55
Chapter 4 Evidence on teacher shortages
4.1 Introduction
4.1 This chapter takes a high-level view of teaching shortage, utilising a number of approaches:
Our standard assessment of top-down indicators of shortage (based on national data to examine pay, vacancies, and employment of teachers).
An examination of detailed teacher vacancy data, distinguishing as far as possible by school type and by region.
An examination of the difficulties in recruiting and retaining teachers using a variety of sources of information, distinguishing as far as possible by school type and region.
Partner evidence on shortage, with a focus on whether any shortage is localised or national and whether any shortages are more acute in certain subjects.
The trend in the number of teachers with subject-relevant post A-level qualifications. Partners told us that this could be a useful indicator of shortage over and above the vacancy rate.
4.2 The chapter is split into two parts. The first part examines whether there is a shortage of teachers at an occupational level followed by the second part which focuses solely on potential shortages within particular subjects.
4.3 Although education is a devolved matter and we examine in this report separate data, where available, relating to England, Scotland, Wales and Northern Ireland, our commission from the government requires us to consider whether there is a UK-wide shortage (along with a separate shortage in Scotland) and so we focus here initially on the national level data.
4.4 In addition, the majority of the published vacancy data relate only to state sector schools, and do not include the vacancy rates in the independent sector. Where possible, we separately include data from the Independent Schools Council to complement the national level data. We also use labour market data on job vacancies advertised on the internet from a company
Chapter 4 Evidence on teacher shortages
Chapter 4: Evidence on teacher shortages
56
called Burning Glass and these data include both the state and independent sectors.
4.2 Are teachers in shortage across the whole occupation?
4.5 This section looks at whether teachers are in shortage across the whole of an occupation using a range of top-down indicators of shortages. Following this we examine vacancy rates at the occupation level using data sourced from the Office for National Statistics (ONS), the Employer Skills Survey (ESS) and the DfE’s Workforce Census. Thereafter, this section discusses whether the recruitment of new teachers meets national targets. Finally, we use data sourced from Burning Glass to evaluate how the number of job postings change throughout the academic year.
4.2.1 Top-down shortage indicators
4.6 Our top-down shortage indicators, as described in our previously published report, Migration Advisory Committee (2008), seek to identify whether there is a shortage across the entirety of an occupation, i.e. across all teachers irrespective of the subjects that they teach. In identifying occupations, we use the Standard Occupational Classification (SOC) system developed by the Office for National Statistics. This is a way of classifying jobs and occupations into similar groupings or levels. The national level data on shortage indicators is only available in relation to four digit SOC level occupations rather than individual jobs, or subjects taught in the case of teachers.
4.7 These occupation level indicators are dovetailed with more granular, ‘bottom-up’ evidence from other data sources and partners to enable us to reach a judgement as to whether occupations, or particular job titles within occupations, are in shortage across the UK.
4.8 This methodology has recently been reviewed and augmented to reflect changes to the available data. As part of the review, a number of the indicators have been modified to provide a better estimate of shortage, and are now compared to a benchmark in 2015 as opposed to 2008. Full details of changes to the MAC shortage methodology can be found in Assessing labour market shortages - A methodology update (Migration Advisory Committee, 2017).
4.9 Using the updated method for assessing shortage, there are 9 indicators of shortage:
three price based indicators,
one employer survey based indicator,
four volume based indicators; and
an indicator of labour market imbalance.
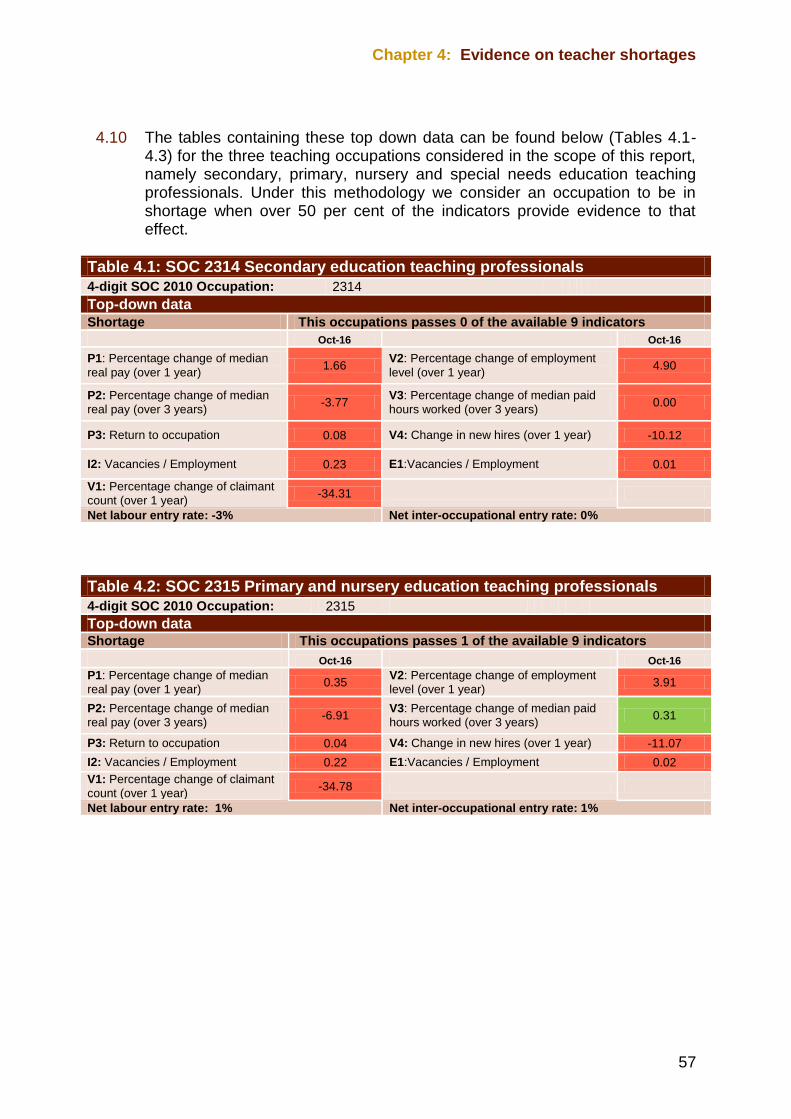
Chapter 4: Evidence on teacher shortages
57
4.10 The tables containing these top down data can be found below (Tables 4.1-4.3) for the three teaching occupations considered in the scope of this report, namely secondary, primary, nursery and special needs education teaching professionals. Under this methodology we consider an occupation to be in shortage when over 50 per cent of the indicators provide evidence to that effect.
Table 4.1: SOC 2314 Secondary education teaching professionals
4-digit SOC 2010 Occupation: 2314
Top-down data
Shortage This occupations passes 0 of the available 9 indicators
Oct-16 Oct-16
P1: Percentage change of median
real pay (over 1 year) 1.66
V2: Percentage change of employment
level (over 1 year) 4.90
P2: Percentage change of median
real pay (over 3 years) -3.77
V3: Percentage change of median paid
hours worked (over 3 years) 0.00
P3: Return to occupation 0.08 V4: Change in new hires (over 1 year) -10.12
I2: Vacancies / Employment 0.23 E1:Vacancies / Employment 0.01
V1: Percentage change of claimant
count (over 1 year) -34.31
Net labour entry rate: -3% Net inter-occupational entry rate: 0%
Table 4.2: SOC 2315 Primary and nursery education teaching professionals
4-digit SOC 2010 Occupation: 2315
Top-down data Shortage This occupations passes 1 of the available 9 indicators
Oct-16 Oct-16
P1: Percentage change of median
real pay (over 1 year) 0.35
V2: Percentage change of employment
level (over 1 year) 3.91
P2: Percentage change of median
real pay (over 3 years) -6.91
V3: Percentage change of median paid
hours worked (over 3 years) 0.31
P3: Return to occupation 0.04 V4: Change in new hires (over 1 year) -11.07
I2: Vacancies / Employment 0.22 E1:Vacancies / Employment 0.02
V1: Percentage change of claimant
count (over 1 year) -34.78
Net labour entry rate: 1% Net inter-occupational entry rate: 1%
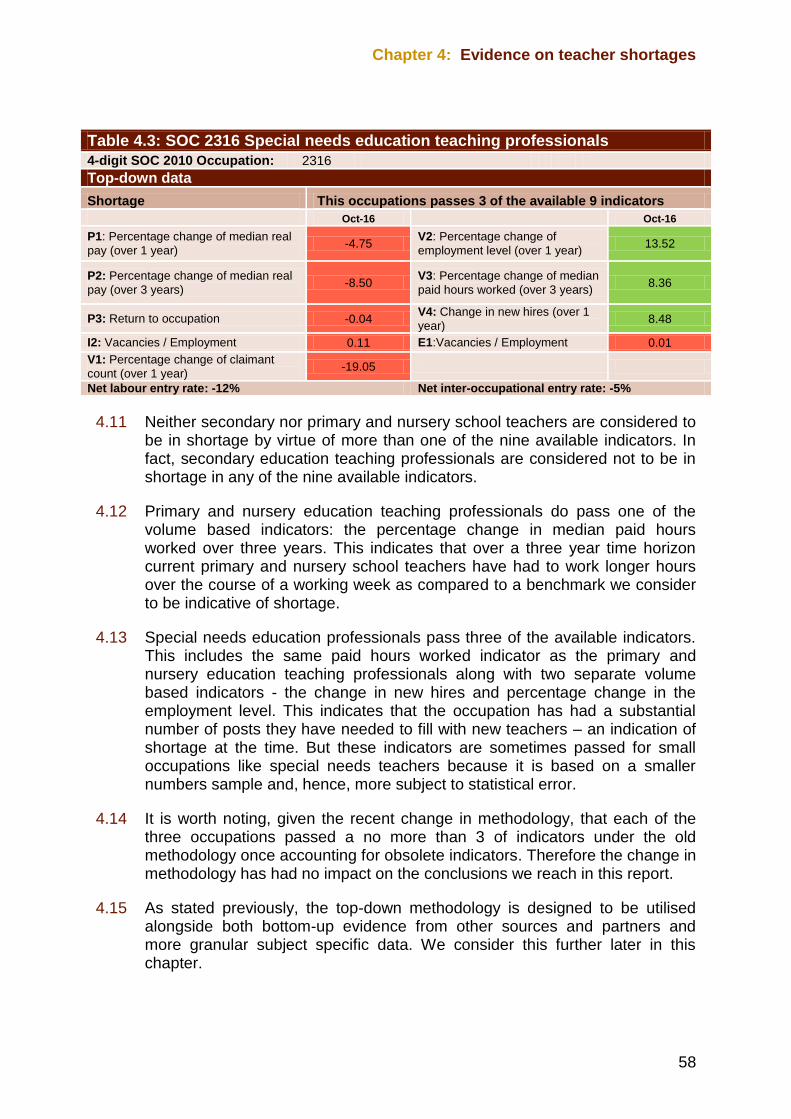
Chapter 4: Evidence on teacher shortages
58
Table 4.3: SOC 2316 Special needs education teaching professionals
4-digit SOC 2010 Occupation: 2316
Top-down data
Shortage This occupations passes 3 of the available 9 indicators
Oct-16 Oct-16
P1: Percentage change of median real
pay (over 1 year) -4.75
V2: Percentage change of
employment level (over 1 year) 13.52
P2: Percentage change of median real
pay (over 3 years) -8.50
V3: Percentage change of median
paid hours worked (over 3 years) 8.36
P3: Return to occupation -0.04 V4: Change in new hires (over 1
year) 8.48
I2: Vacancies / Employment 0.11 E1:Vacancies / Employment 0.01
V1: Percentage change of claimant
count (over 1 year) -19.05
Net labour entry rate: -12% Net inter-occupational entry rate: -5%
4.11 Neither secondary nor primary and nursery school teachers are considered to be in shortage by virtue of more than one of the nine available indicators. In fact, secondary education teaching professionals are considered not to be in shortage in any of the nine available indicators.
4.12 Primary and nursery education teaching professionals do pass one of the volume based indicators: the percentage change in median paid hours worked over three years. This indicates that over a three year time horizon current primary and nursery school teachers have had to work longer hours over the course of a working week as compared to a benchmark we consider to be indicative of shortage.
4.13 Special needs education professionals pass three of the available indicators. This includes the same paid hours worked indicator as the primary and nursery education teaching professionals along with two separate volume based indicators - the change in new hires and percentage change in the employment level. This indicates that the occupation has had a substantial number of posts they have needed to fill with new teachers – an indication of shortage at the time. But these indicators are sometimes passed for small occupations like special needs teachers because it is based on a smaller numbers sample and, hence, more subject to statistical error.
4.14 It is worth noting, given the recent change in methodology, that each of the three occupations passed a no more than 3 of indicators under the old methodology once accounting for obsolete indicators. Therefore the change in methodology has had no impact on the conclusions we reach in this report.
4.15 As stated previously, the top-down methodology is designed to be utilised alongside both bottom-up evidence from other sources and partners and more granular subject specific data. We consider this further later in this chapter.
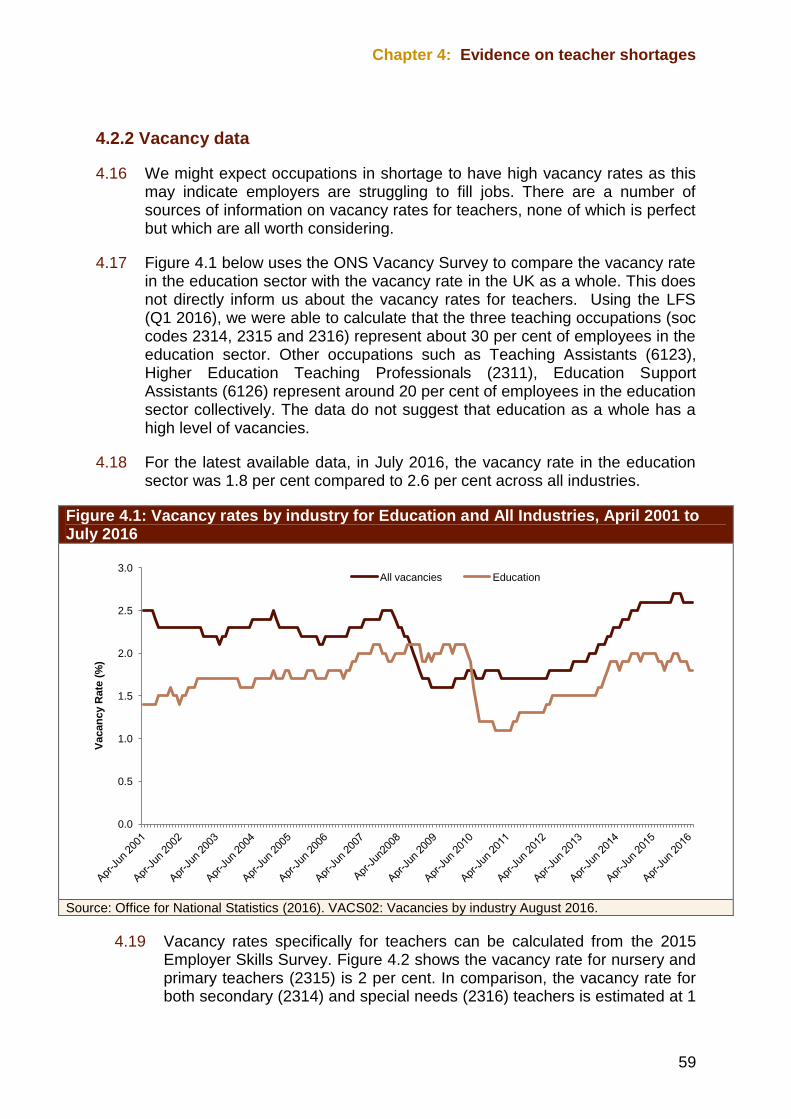
Chapter 4: Evidence on teacher shortages
59
4.2.2 Vacancy data
4.16 We might expect occupations in shortage to have high vacancy rates as this may indicate employers are struggling to fill jobs. There are a number of sources of information on vacancy rates for teachers, none of which is perfect but which are all worth considering.
4.17 Figure 4.1 below uses the ONS Vacancy Survey to compare the vacancy rate in the education sector with the vacancy rate in the UK as a whole. This does not directly inform us about the vacancy rates for teachers. Using the LFS (Q1 2016), we were able to calculate that the three teaching occupations (soc codes 2314, 2315 and 2316) represent about 30 per cent of employees in the education sector. Other occupations such as Teaching Assistants (6123), Higher Education Teaching Professionals (2311), Education Support Assistants (6126) represent around 20 per cent of employees in the education sector collectively. The data do not suggest that education as a whole has a high level of vacancies.
4.18 For the latest available data, in July 2016, the vacancy rate in the education sector was 1.8 per cent compared to 2.6 per cent across all industries.
Figure 4.1: Vacancy rates by industry for Education and All Industries, April 2001 to July 2016
Source: Office for National Statistics (2016). VACS02: Vacancies by industry August 2016.
4.19 Vacancy rates specifically for teachers can be calculated from the 2015 Employer Skills Survey. Figure 4.2 shows the vacancy rate for nursery and primary teachers (2315) is 2 per cent. In comparison, the vacancy rate for both secondary (2314) and special needs (2316) teachers is estimated at 1
0.0
0.5
1.0
1.5
2.0
2.5
3.0
Vacan
cy R
ate
(%
)
All vacancies Education
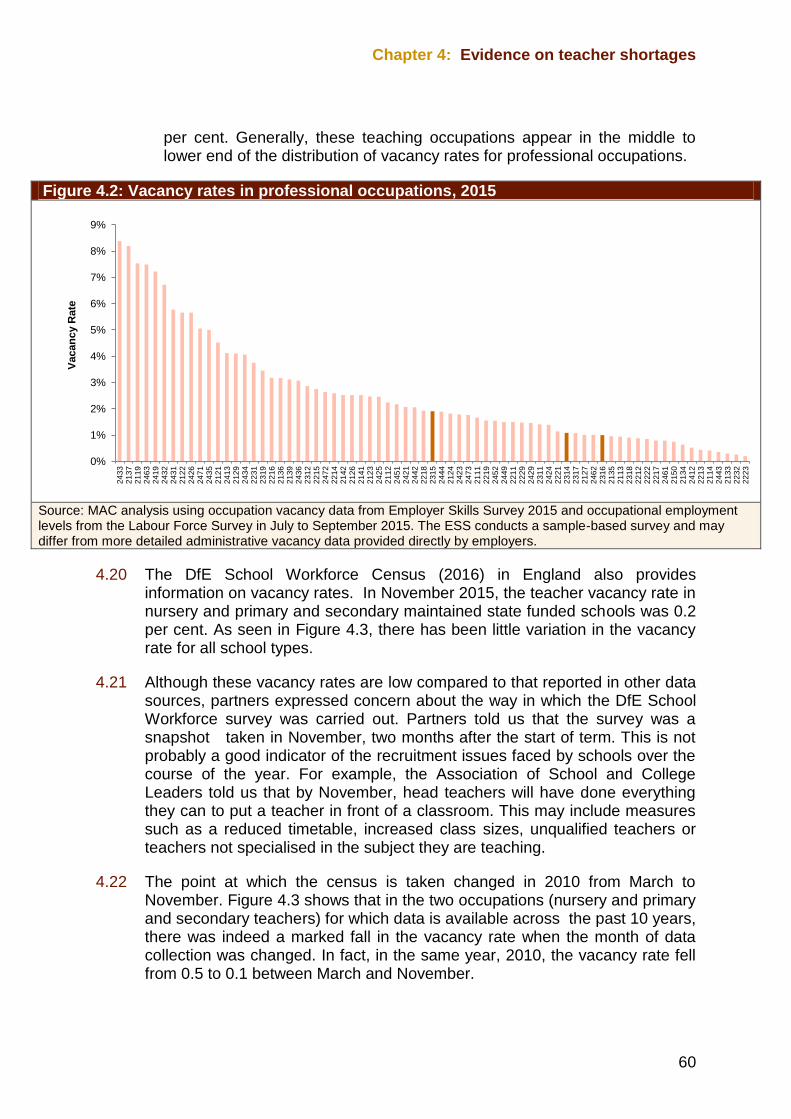
Chapter 4: Evidence on teacher shortages
60
per cent. Generally, these teaching occupations appear in the middle to lower end of the distribution of vacancy rates for professional occupations.
Figure 4.2: Vacancy rates in professional occupations, 2015
Source: MAC analysis using occupation vacancy data from Employer Skills Survey 2015 and occupational employment levels from the Labour Force Survey in July to September 2015. The ESS conducts a sample-based survey and may differ from more detailed administrative vacancy data provided directly by employers.
4.20 The DfE School Workforce Census (2016) in England also provides information on vacancy rates. In November 2015, the teacher vacancy rate in nursery and primary and secondary maintained state funded schools was 0.2 per cent. As seen in Figure 4.3, there has been little variation in the vacancy rate for all school types.
4.21 Although these vacancy rates are low compared to that reported in other data sources, partners expressed concern about the way in which the DfE School Workforce survey was carried out. Partners told us that the survey was a snapshot taken in November, two months after the start of term. This is not probably a good indicator of the recruitment issues faced by schools over the course of the year. For example, the Association of School and College Leaders told us that by November, head teachers will have done everything they can to put a teacher in front of a classroom. This may include measures such as a reduced timetable, increased class sizes, unqualified teachers or teachers not specialised in the subject they are teaching.
4.22 The point at which the census is taken changed in 2010 from March to November. Figure 4.3 shows that in the two occupations (nursery and primary and secondary teachers) for which data is available across the past 10 years, there was indeed a marked fall in the vacancy rate when the month of data collection was changed. In fact, in the same year, 2010, the vacancy rate fell from 0.5 to 0.1 between March and November.
0%
1%
2%
3%
4%
5%
6%
7%
8%
9%
24
33
2
13
7
21
19
2
46
3
24
19
2
43
2
24
31
2
12
2
24
26
2
47
1
24
35
2
12
1
24
13
2
12
9
24
34
2
23
1
23
19
2
21
6
21
36
2
13
9
24
36
2
31
2
22
15
2
47
2
22
14
2
14
2
21
26
2
14
1
21
23
2
42
5
21
12
2
45
1
24
21
2
44
2
22
18
2
31
5
24
44
2
12
4
24
23
2
47
3
21
11
2
21
9
24
52
2
44
9
22
11
2
22
9
24
29
2
31
1
24
24
2
22
1
23
14
2
31
7
21
27
2
46
2
23
16
2
13
5
21
13
2
31
8
22
12
2
22
2
22
17
2
46
1
21
50
2
13
4
24
12
2
21
3
21
14
2
44
3
21
33
2
23
2
22
23
Vacan
cy R
ate
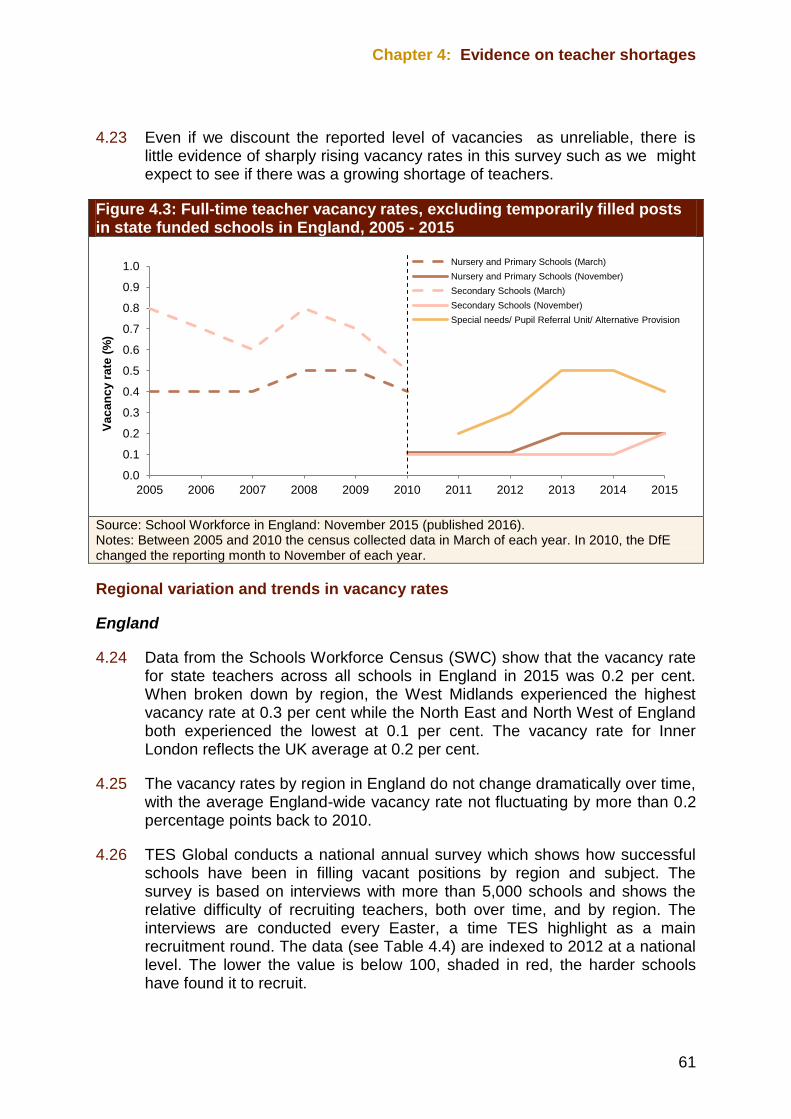
Chapter 4: Evidence on teacher shortages
61
4.23 Even if we discount the reported level of vacancies as unreliable, there is little evidence of sharply rising vacancy rates in this survey such as we might expect to see if there was a growing shortage of teachers.
Figure 4.3: Full-time teacher vacancy rates, excluding temporarily filled posts in state funded schools in England, 2005 - 2015
Source: School Workforce in England: November 2015 (published 2016). Notes: Between 2005 and 2010 the census collected data in March of each year. In 2010, the DfE changed the reporting month to November of each year.
Regional variation and trends in vacancy rates
England
4.24 Data from the Schools Workforce Census (SWC) show that the vacancy rate for state teachers across all schools in England in 2015 was 0.2 per cent. When broken down by region, the West Midlands experienced the highest vacancy rate at 0.3 per cent while the North East and North West of England both experienced the lowest at 0.1 per cent. The vacancy rate for Inner London reflects the UK average at 0.2 per cent.
4.25 The vacancy rates by region in England do not change dramatically over time, with the average England-wide vacancy rate not fluctuating by more than 0.2 percentage points back to 2010.
4.26 TES Global conducts a national annual survey which shows how successful schools have been in filling vacant positions by region and subject. The survey is based on interviews with more than 5,000 schools and shows the relative difficulty of recruiting teachers, both over time, and by region. The interviews are conducted every Easter, a time TES highlight as a main recruitment round. The data (see Table 4.4) are indexed to 2012 at a national level. The lower the value is below 100, shaded in red, the harder schools have found it to recruit.
0.0
0.1
0.2
0.3
0.4
0.5
0.6
0.7
0.8
0.9
1.0
2005 2006 2007 2008 2009 2010 2011 2012 2013 2014 2015
Va
ca
nc
y r
ate
(%
)
Nursery and Primary Schools (March)
Nursery and Primary Schools (November)
Secondary Schools (March)
Secondary Schools (November)
Special needs/ Pupil Referral Unit/ Alternative Provision
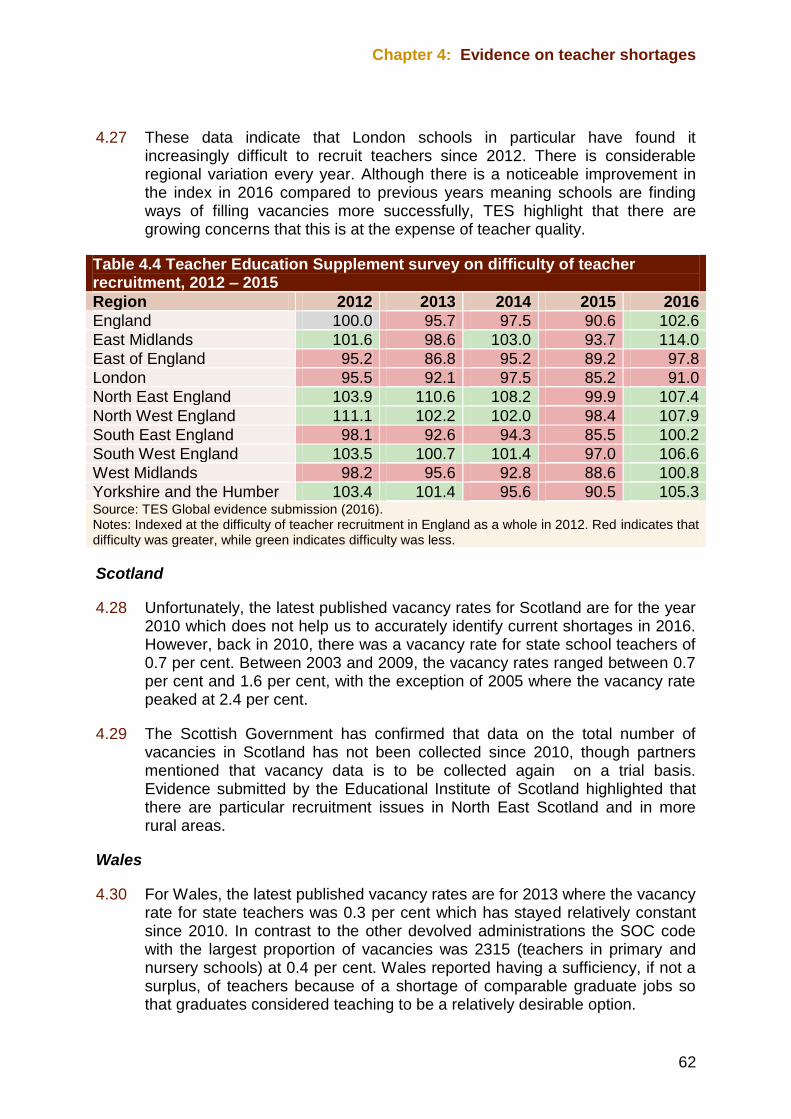
Chapter 4: Evidence on teacher shortages
62
4.27 These data indicate that London schools in particular have found it increasingly difficult to recruit teachers since 2012. There is considerable regional variation every year. Although there is a noticeable improvement in the index in 2016 compared to previous years meaning schools are finding ways of filling vacancies more successfully, TES highlight that there are growing concerns that this is at the expense of teacher quality.
Table 4.4 Teacher Education Supplement survey on difficulty of teacher recruitment, 2012 – 2015
Region 2012 2013 2014 2015 2016
England 100.0 95.7 97.5 90.6 102.6
East Midlands 101.6 98.6 103.0 93.7 114.0
East of England 95.2 86.8 95.2 89.2 97.8
London 95.5 92.1 97.5 85.2 91.0
North East England 103.9 110.6 108.2 99.9 107.4
North West England 111.1 102.2 102.0 98.4 107.9
South East England 98.1 92.6 94.3 85.5 100.2
South West England 103.5 100.7 101.4 97.0 106.6
West Midlands 98.2 95.6 92.8 88.6 100.8
Yorkshire and the Humber 103.4 101.4 95.6 90.5 105.3 Source: TES Global evidence submission (2016). Notes: Indexed at the difficulty of teacher recruitment in England as a whole in 2012. Red indicates that difficulty was greater, while green indicates difficulty was less.
Scotland
4.28 Unfortunately, the latest published vacancy rates for Scotland are for the year 2010 which does not help us to accurately identify current shortages in 2016. However, back in 2010, there was a vacancy rate for state school teachers of 0.7 per cent. Between 2003 and 2009, the vacancy rates ranged between 0.7 per cent and 1.6 per cent, with the exception of 2005 where the vacancy rate peaked at 2.4 per cent.
4.29 The Scottish Government has confirmed that data on the total number of vacancies in Scotland has not been collected since 2010, though partners mentioned that vacancy data is to be collected again on a trial basis. Evidence submitted by the Educational Institute of Scotland highlighted that there are particular recruitment issues in North East Scotland and in more rural areas.
Wales
4.30 For Wales, the latest published vacancy rates are for 2013 where the vacancy rate for state teachers was 0.3 per cent which has stayed relatively constant since 2010. In contrast to the other devolved administrations the SOC code with the largest proportion of vacancies was 2315 (teachers in primary and nursery schools) at 0.4 per cent. Wales reported having a sufficiency, if not a surplus, of teachers because of a shortage of comparable graduate jobs so that graduates considered teaching to be a relatively desirable option.
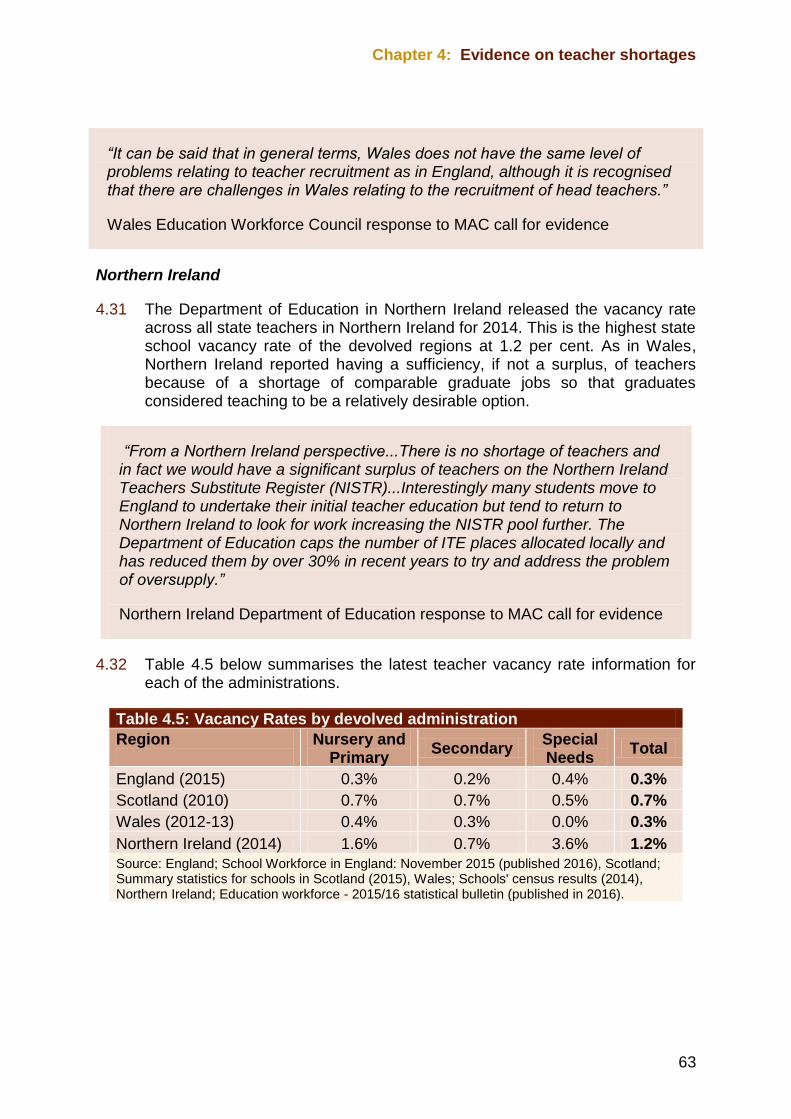
Chapter 4: Evidence on teacher shortages
63
Northern Ireland
4.31 The Department of Education in Northern Ireland released the vacancy rate across all state teachers in Northern Ireland for 2014. This is the highest state school vacancy rate of the devolved regions at 1.2 per cent. As in Wales, Northern Ireland reported having a sufficiency, if not a surplus, of teachers because of a shortage of comparable graduate jobs so that graduates considered teaching to be a relatively desirable option.
“From a Northern Ireland perspective...There is no shortage of teachers and in fact we would have a significant surplus of teachers on the Northern Ireland Teachers Substitute Register (NISTR)...Interestingly many students move to England to undertake their initial teacher education but tend to return to Northern Ireland to look for work increasing the NISTR pool further. The Department of Education caps the number of ITE places allocated locally and has reduced them by over 30% in recent years to try and address the problem of oversupply.”
Northern Ireland Department of Education response to MAC call for evidence
4.32 Table 4.5 below summarises the latest teacher vacancy rate information for each of the administrations.
Table 4.5: Vacancy Rates by devolved administration
Region
Nursery and Primary
Secondary Special Needs
Total
England (2015) 0.3% 0.2% 0.4% 0.3%
Scotland (2010) 0.7% 0.7% 0.5% 0.7%
Wales (2012-13) 0.4% 0.3% 0.0% 0.3%
Northern Ireland (2014) 1.6% 0.7% 3.6% 1.2%
Source: England; School Workforce in England: November 2015 (published 2016), Scotland; Summary statistics for schools in Scotland (2015), Wales; Schools' census results (2014), Northern Ireland; Education workforce - 2015/16 statistical bulletin (published in 2016).
“It can be said that in general terms, Wales does not have the same level of problems relating to teacher recruitment as in England, although it is recognised that there are challenges in Wales relating to the recruitment of head teachers.”
Wales Education Workforce Council response to MAC call for evidence
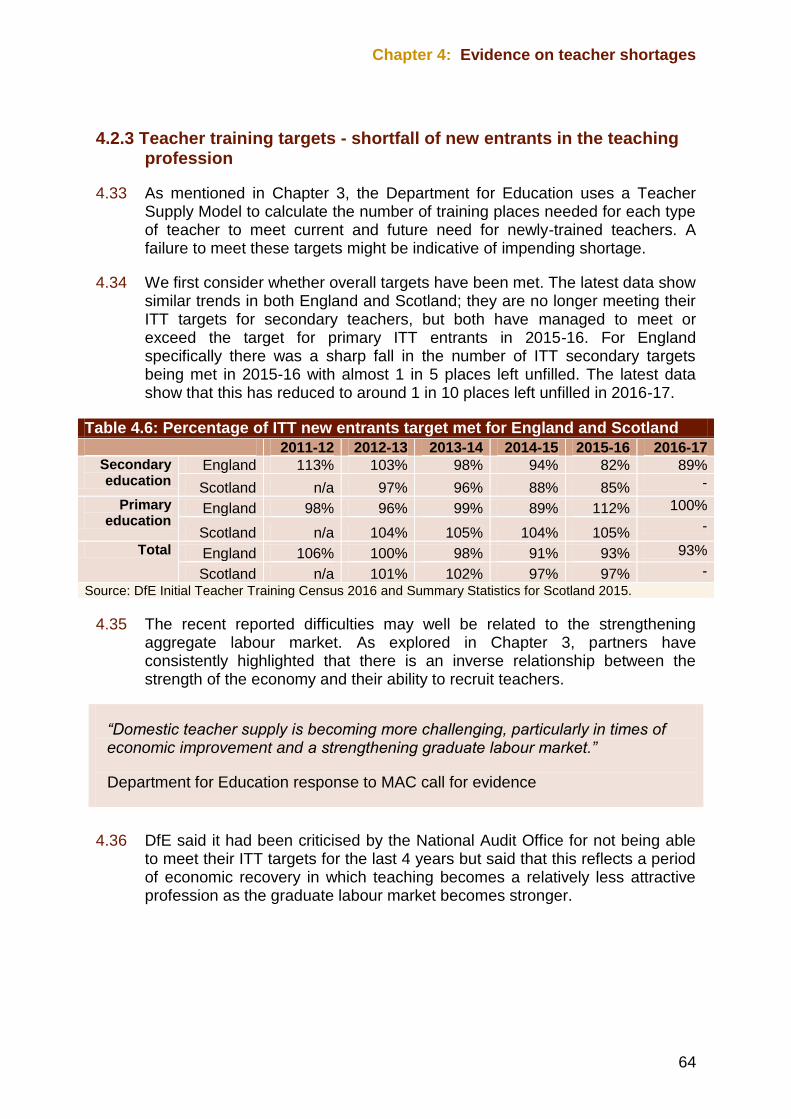
Chapter 4: Evidence on teacher shortages
64
4.2.3 Teacher training targets - shortfall of new entrants in the teaching profession
4.33 As mentioned in Chapter 3, the Department for Education uses a Teacher Supply Model to calculate the number of training places needed for each type of teacher to meet current and future need for newly-trained teachers. A failure to meet these targets might be indicative of impending shortage.
4.34 We first consider whether overall targets have been met. The latest data show similar trends in both England and Scotland; they are no longer meeting their ITT targets for secondary teachers, but both have managed to meet or exceed the target for primary ITT entrants in 2015-16. For England specifically there was a sharp fall in the number of ITT secondary targets being met in 2015-16 with almost 1 in 5 places left unfilled. The latest data show that this has reduced to around 1 in 10 places left unfilled in 2016-17.
Table 4.6: Percentage of ITT new entrants target met for England and Scotland
2011-12 2012-13 2013-14 2014-15 2015-16 2016-17 Secondary education
England 113% 103% 98% 94% 82% 89%
Scotland n/a 97% 96% 88% 85% -
Primary education
England 98% 96% 99% 89% 112% 100%
Scotland n/a 104% 105% 104% 105% -
Total England 106% 100% 98% 91% 93% 93%
Scotland n/a 101% 102% 97% 97% -
Source: DfE Initial Teacher Training Census 2016 and Summary Statistics for Scotland 2015.
4.35 The recent reported difficulties may well be related to the strengthening aggregate labour market. As explored in Chapter 3, partners have consistently highlighted that there is an inverse relationship between the strength of the economy and their ability to recruit teachers.
“Domestic teacher supply is becoming more challenging, particularly in times of economic improvement and a strengthening graduate labour market.”
Department for Education response to MAC call for evidence
4.36 DfE said it had been criticised by the National Audit Office for not being able to meet their ITT targets for the last 4 years but said that this reflects a period of economic recovery in which teaching becomes a relatively less attractive profession as the graduate labour market becomes stronger.

Chapter 4: Evidence on teacher shortages
65
4.2.4 The number of teaching job postings
4.37 We have sought to supplement the official published vacancy data with a new source of web-scraped data provided commercially by Burning Glass. We are using this data source for the first time in this review on an experimental basis to complement other labour market data information.
“The erosion of terms for teachers has made the teaching profession less attractive to new recruits, particularly in contrast to other employment options in an improving economy.”
Association of Teachers and Lecturers response to MAC call for evidence
Box 4.1: Explanation of Burning Glass data
It has recently become possible to produce useful data on vacancies in the labour market using ‘web-scraping’ approaches. This involves scouring websites for job postings and extracting the data contained within these for analysis. The data produced are significantly richer than that currently produced using traditional methods of collecting labour market data.
The Burning Glass data allow us to look at a range of variables gathered from online job postings. Some of these key variables include:
Number of postings
Average salary
Skills required
Top industries
Top employers
Location
Advertised education
The Burning Glass vacancy data date back to 2012. The coverage of the data is UK-wide. We have obtained access to the raw data allowing richer analysis. The Burning Glass Labour Insight Tool also allows us to create visual representations of the data.
Burning Glass data allow a more comprehensive analysis of the UK labour market, enabling us to identify labour market trends in a better and more timely fashion. The data allow us to further analyse job vacancies at the 4-digit SOC code so that we can compare our results to labour market data produced by ONS. Additionally, we are able to analyse data on job postings at a more granular level. For example, during our review of teachers, in addition to looking at the labour market for secondary school teachers at the 4-digit SOC level (2314), we have also been able to use Burning Glass data to examine the job postings for subject-specific teachers.
Burning Glass, as with any data source, exhibits a number of risks and weaknesses. As the
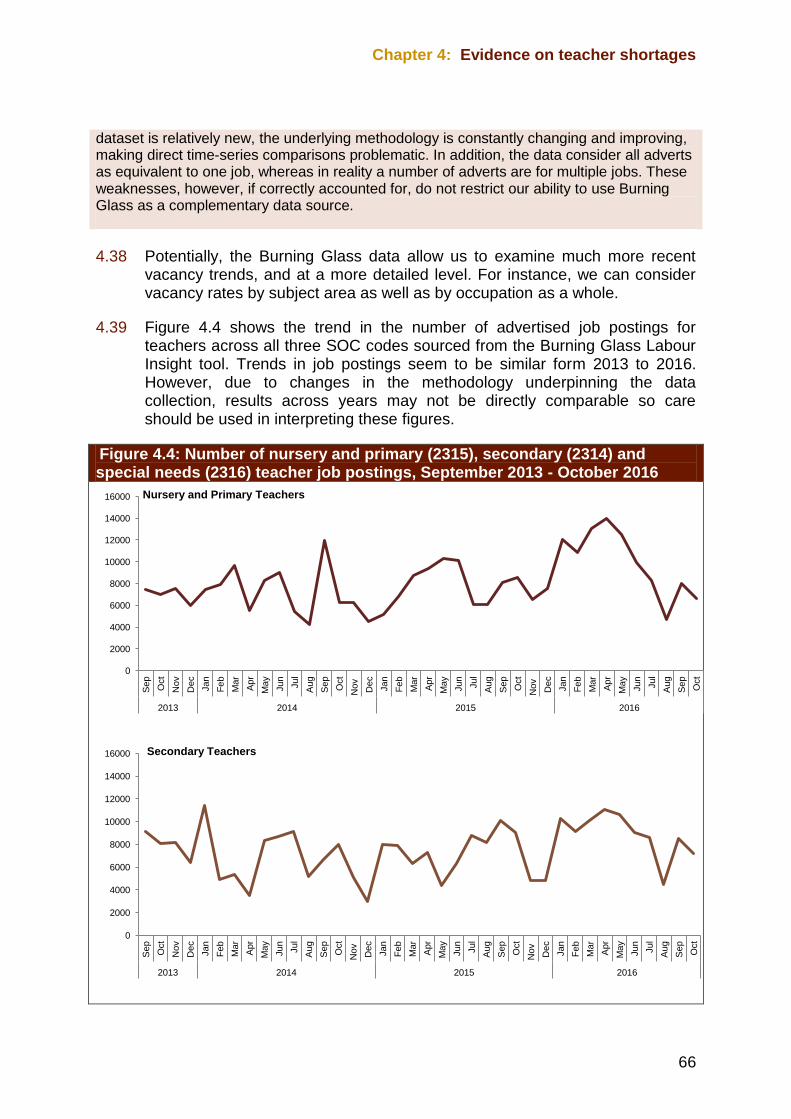
Chapter 4: Evidence on teacher shortages
66
4.38 Potentially, the Burning Glass data allow us to examine much more recent vacancy trends, and at a more detailed level. For instance, we can consider vacancy rates by subject area as well as by occupation as a whole.
4.39 Figure 4.4 shows the trend in the number of advertised job postings for teachers across all three SOC codes sourced from the Burning Glass Labour Insight tool. Trends in job postings seem to be similar form 2013 to 2016. However, due to changes in the methodology underpinning the data collection, results across years may not be directly comparable so care should be used in interpreting these figures.
Figure 4.4: Number of nursery and primary (2315), secondary (2314) and special needs (2316) teacher job postings, September 2013 - October 2016
0
2000
4000
6000
8000
10000
12000
14000
16000
Sep
Oct
Nov
Dec
Jan
Feb
Mar
Apr
May
Jun
Jul
Aug
Sep
Oct
Nov
Dec
Jan
Feb
Mar
Apr
May
Jun
Jul
Aug
Sep
Oct
Nov
Dec
Jan
Feb
Mar
Apr
May
Jun
Jul
Aug
Sep
Oct
2013 2014 2015 2016
Nursery and Primary Teachers
0
2000
4000
6000
8000
10000
12000
14000
16000
Sep
Oct
Nov
Dec
Jan
Feb
Mar
Apr
May
Jun
Jul
Aug
Sep
Oct
Nov
Dec
Jan
Feb
Mar
Apr
May
Jun
Jul
Aug
Sep
Oct
Nov
Dec
Jan
Feb
Mar
Apr
May
Jun
Jul
Aug
Sep
Oct
2013 2014 2015 2016
Secondary Teachers
dataset is relatively new, the underlying methodology is constantly changing and improving, making direct time-series comparisons problematic. In addition, the data consider all adverts as equivalent to one job, whereas in reality a number of adverts are for multiple jobs. These weaknesses, however, if correctly accounted for, do not restrict our ability to use Burning Glass as a complementary data source.
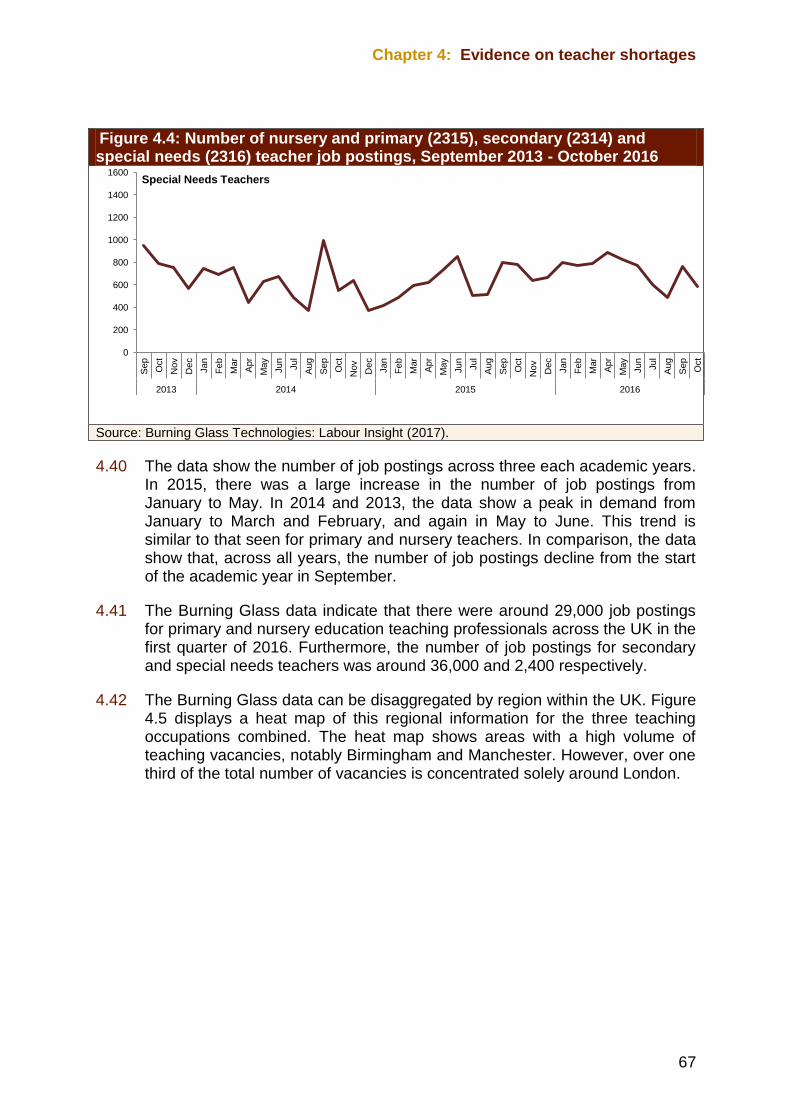
Chapter 4: Evidence on teacher shortages
67
Figure 4.4: Number of nursery and primary (2315), secondary (2314) and special needs (2316) teacher job postings, September 2013 - October 2016
Source: Burning Glass Technologies: Labour Insight (2017).
4.40 The data show the number of job postings across three each academic years. In 2015, there was a large increase in the number of job postings from January to May. In 2014 and 2013, the data show a peak in demand from January to March and February, and again in May to June. This trend is similar to that seen for primary and nursery teachers. In comparison, the data show that, across all years, the number of job postings decline from the start of the academic year in September.
4.41 The Burning Glass data indicate that there were around 29,000 job postings for primary and nursery education teaching professionals across the UK in the first quarter of 2016. Furthermore, the number of job postings for secondary and special needs teachers was around 36,000 and 2,400 respectively.
4.42 The Burning Glass data can be disaggregated by region within the UK. Figure 4.5 displays a heat map of this regional information for the three teaching occupations combined. The heat map shows areas with a high volume of teaching vacancies, notably Birmingham and Manchester. However, over one third of the total number of vacancies is concentrated solely around London.
0
200
400
600
800
1000
1200
1400
1600
Sep
Oct
Nov
Dec
Jan
Feb
Mar
Apr
May
Jun
Jul
Aug
Sep
Oct
Nov
Dec
Jan
Feb
Mar
Apr
May
Jun
Jul
Aug
Sep
Oct
Nov
Dec
Jan
Feb
Mar
Apr
May
Jun
Jul
Aug
Sep
Oct
2013 2014 2015 2016
Special Needs Teachers
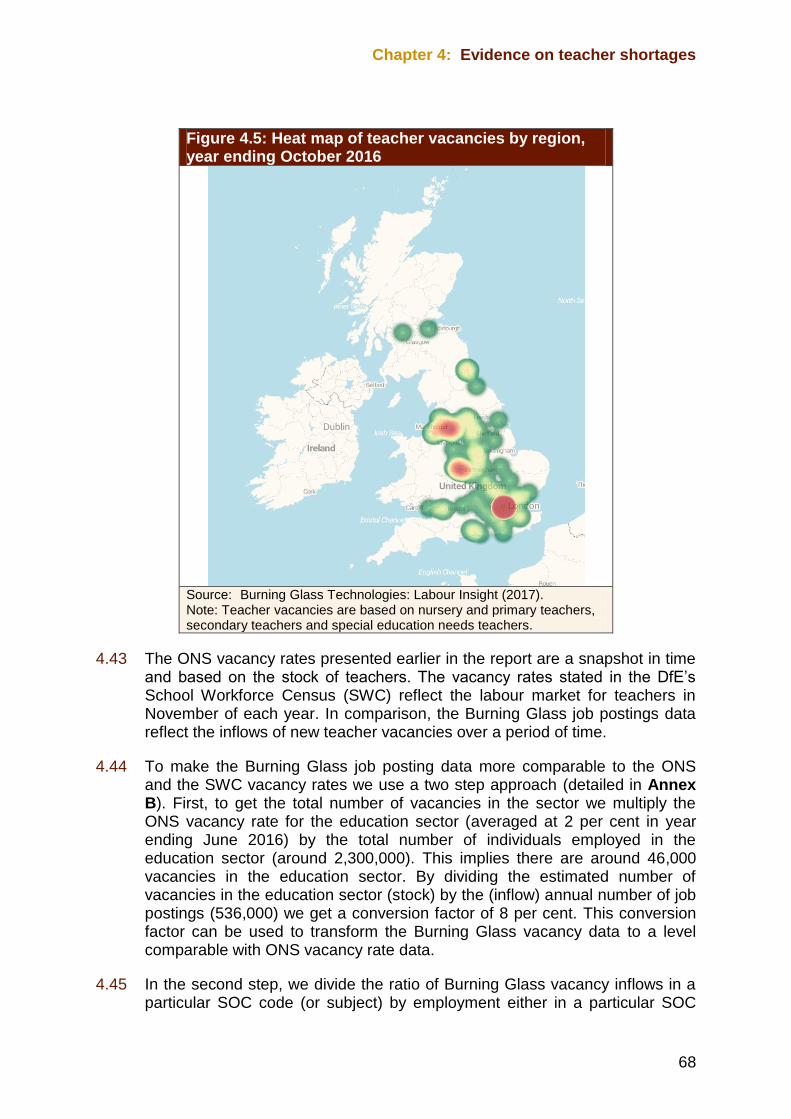
Chapter 4: Evidence on teacher shortages
68
Figure 4.5: Heat map of teacher vacancies by region, year ending October 2016
Source: Burning Glass Technologies: Labour Insight (2017). Note: Teacher vacancies are based on nursery and primary teachers, secondary teachers and special education needs teachers.
4.43 The ONS vacancy rates presented earlier in the report are a snapshot in time and based on the stock of teachers. The vacancy rates stated in the DfE’s School Workforce Census (SWC) reflect the labour market for teachers in November of each year. In comparison, the Burning Glass job postings data reflect the inflows of new teacher vacancies over a period of time.
4.44 To make the Burning Glass job posting data more comparable to the ONS and the SWC vacancy rates we use a two step approach (detailed in Annex B). First, to get the total number of vacancies in the sector we multiply the ONS vacancy rate for the education sector (averaged at 2 per cent in year ending June 2016) by the total number of individuals employed in the education sector (around 2,300,000). This implies there are around 46,000 vacancies in the education sector. By dividing the estimated number of vacancies in the education sector (stock) by the (inflow) annual number of job postings (536,000) we get a conversion factor of 8 per cent. This conversion factor can be used to transform the Burning Glass vacancy data to a level comparable with ONS vacancy rate data.
4.45 In the second step, we divide the ratio of Burning Glass vacancy inflows in a particular SOC code (or subject) by employment either in a particular SOC
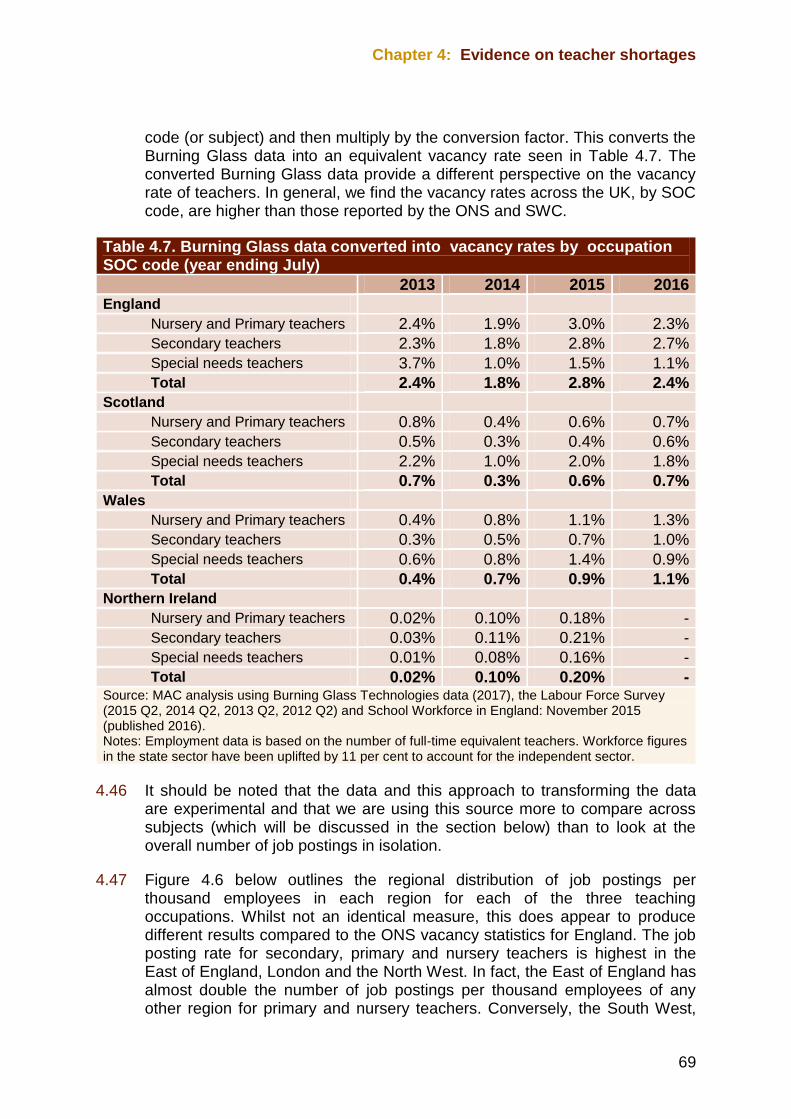
Chapter 4: Evidence on teacher shortages
69
code (or subject) and then multiply by the conversion factor. This converts the Burning Glass data into an equivalent vacancy rate seen in Table 4.7. The converted Burning Glass data provide a different perspective on the vacancy rate of teachers. In general, we find the vacancy rates across the UK, by SOC code, are higher than those reported by the ONS and SWC.
4.46 It should be noted that the data and this approach to transforming the data are experimental and that we are using this source more to compare across subjects (which will be discussed in the section below) than to look at the overall number of job postings in isolation.
4.47 Figure 4.6 below outlines the regional distribution of job postings per thousand employees in each region for each of the three teaching occupations. Whilst not an identical measure, this does appear to produce different results compared to the ONS vacancy statistics for England. The job posting rate for secondary, primary and nursery teachers is highest in the East of England, London and the North West. In fact, the East of England has almost double the number of job postings per thousand employees of any other region for primary and nursery teachers. Conversely, the South West,
Table 4.7. Burning Glass data converted into vacancy rates by occupation SOC code (year ending July)
2013 2014 2015 2016
England
Nursery and Primary teachers 2.4% 1.9% 3.0% 2.3%
Secondary teachers 2.3% 1.8% 2.8% 2.7%
Special needs teachers 3.7% 1.0% 1.5% 1.1%
Total 2.4% 1.8% 2.8% 2.4%
Scotland
Nursery and Primary teachers 0.8% 0.4% 0.6% 0.7%
Secondary teachers 0.5% 0.3% 0.4% 0.6%
Special needs teachers 2.2% 1.0% 2.0% 1.8%
Total 0.7% 0.3% 0.6% 0.7%
Wales
Nursery and Primary teachers 0.4% 0.8% 1.1% 1.3%
Secondary teachers 0.3% 0.5% 0.7% 1.0%
Special needs teachers 0.6% 0.8% 1.4% 0.9%
Total 0.4% 0.7% 0.9% 1.1%
Northern Ireland
Nursery and Primary teachers 0.02% 0.10% 0.18% -
Secondary teachers 0.03% 0.11% 0.21% -
Special needs teachers 0.01% 0.08% 0.16% -
Total 0.02% 0.10% 0.20% - Source: MAC analysis using Burning Glass Technologies data (2017), the Labour Force Survey (2015 Q2, 2014 Q2, 2013 Q2, 2012 Q2) and School Workforce in England: November 2015 (published 2016). Notes: Employment data is based on the number of full-time equivalent teachers. Workforce figures in the state sector have been uplifted by 11 per cent to account for the independent sector.
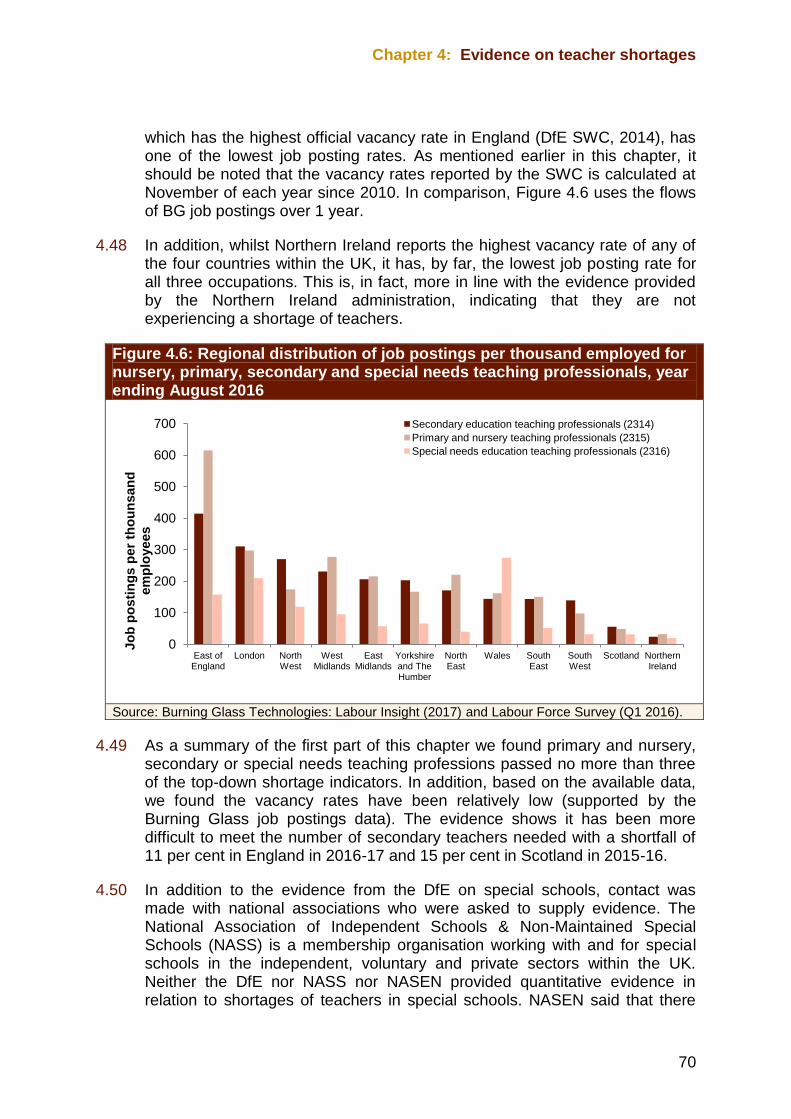
Chapter 4: Evidence on teacher shortages
70
which has the highest official vacancy rate in England (DfE SWC, 2014), has one of the lowest job posting rates. As mentioned earlier in this chapter, it should be noted that the vacancy rates reported by the SWC is calculated at November of each year since 2010. In comparison, Figure 4.6 uses the flows of BG job postings over 1 year.
4.48 In addition, whilst Northern Ireland reports the highest vacancy rate of any of the four countries within the UK, it has, by far, the lowest job posting rate for all three occupations. This is, in fact, more in line with the evidence provided by the Northern Ireland administration, indicating that they are not experiencing a shortage of teachers.
Figure 4.6: Regional distribution of job postings per thousand employed for nursery, primary, secondary and special needs teaching professionals, year ending August 2016
Source: Burning Glass Technologies: Labour Insight (2017) and Labour Force Survey (Q1 2016).
4.49 As a summary of the first part of this chapter we found primary and nursery, secondary or special needs teaching professions passed no more than three of the top-down shortage indicators. In addition, based on the available data, we found the vacancy rates have been relatively low (supported by the Burning Glass job postings data). The evidence shows it has been more difficult to meet the number of secondary teachers needed with a shortfall of 11 per cent in England in 2016-17 and 15 per cent in Scotland in 2015-16.
4.50 In addition to the evidence from the DfE on special schools, contact was made with national associations who were asked to supply evidence. The National Association of Independent Schools & Non-Maintained Special Schools (NASS) is a membership organisation working with and for special schools in the independent, voluntary and private sectors within the UK. Neither the DfE nor NASS nor NASEN provided quantitative evidence in relation to shortages of teachers in special schools. NASEN said that there
0
100
200
300
400
500
600
700
East of England
London North West
West Midlands
East Midlands
Yorkshire and The Humber
North East
Wales South East
South West
Scotland Northern Ireland
Jo
b p
osti
ng
s p
er
tho
un
san
d
em
plo
yees
Secondary education teaching professionals (2314)
Primary and nursery teaching professionals (2315)
Special needs education teaching professionals (2316)
Chapter 4: Evidence on teacher shortages
71
are not enough teachers to meet demand with a massive shortage of teachers in general and universities not producing enough teachers to work in special schools.
4.51 There is not sufficient data or evidence available to make a compelling case that teachers of nursery and primary education, secondary education or special needs education are in national shortage. The next part of the chapter will examine whether this holds true when looking at workforce by subject.
4.3 Is there a shortage of teachers at in particular subjects?
4.52 The evidence presented so far has been about overall shortage across three SOC codes; primary and nursery teachers, secondary school teachers, and special needs teachers.
4.53 Previous MAC reviews into teaching shortages have ended up focusing solely on specific subject areas and not the entire occupation as a whole. In addition, partners have repeatedly pointed to specific subjects for which it has been consistently difficult to recruit teachers. The most widely cited subjects were STEM followed by computing and design & technology (DT).
4.54 This section of Chapter 4 will cover information about:
vacancies by subject sourced from the DfE’s Schools Workforce Census;
data on the number of new trainee teachers against set targets by subject;
data on the number of teachers needed and how policy changes may be increasing the demand for teachers in particular subjects;
the number of teaching job postings by subject sourced from Burning Glass;
the pool of potential STEM subject specialist teachers; and,
the proportion of lessons taught by teachers without subject relevant qualifications.
4.3.1 Subject specific data on vacancies
4.55 In the first part of this section we summarise the available data on vacancies and recruitment difficulties by subject. We do not just consider the subjects mentioned to us as being in possible shortage in order to compare the data, wherever possible, across all subjects.
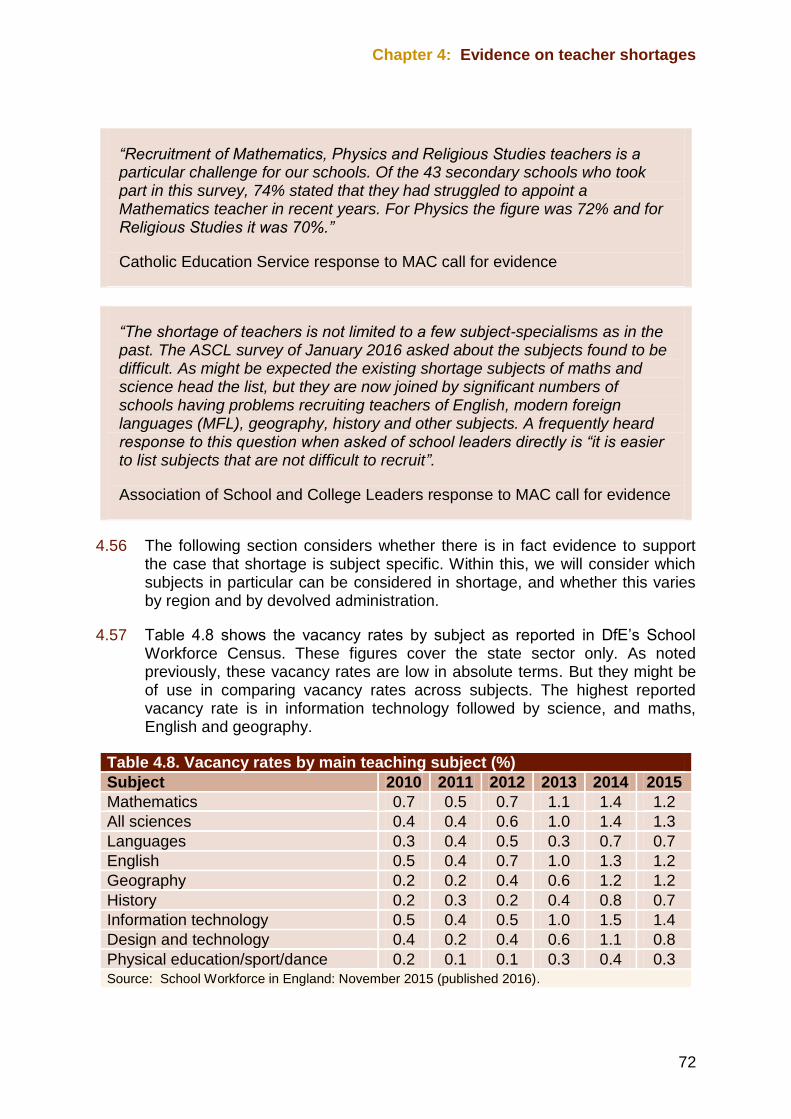
Chapter 4: Evidence on teacher shortages
72
“Recruitment of Mathematics, Physics and Religious Studies teachers is a particular challenge for our schools. Of the 43 secondary schools who took part in this survey, 74% stated that they had struggled to appoint a Mathematics teacher in recent years. For Physics the figure was 72% and for Religious Studies it was 70%.”
Catholic Education Service response to MAC call for evidence
“The shortage of teachers is not limited to a few subject-specialisms as in the past. The ASCL survey of January 2016 asked about the subjects found to be difficult. As might be expected the existing shortage subjects of maths and science head the list, but they are now joined by significant numbers of schools having problems recruiting teachers of English, modern foreign languages (MFL), geography, history and other subjects. A frequently heard response to this question when asked of school leaders directly is “it is easier to list subjects that are not difficult to recruit”.
Association of School and College Leaders response to MAC call for evidence
4.56 The following section considers whether there is in fact evidence to support the case that shortage is subject specific. Within this, we will consider which subjects in particular can be considered in shortage, and whether this varies by region and by devolved administration.
4.57 Table 4.8 shows the vacancy rates by subject as reported in DfE’s School Workforce Census. These figures cover the state sector only. As noted previously, these vacancy rates are low in absolute terms. But they might be of use in comparing vacancy rates across subjects. The highest reported vacancy rate is in information technology followed by science, and maths, English and geography.
Table 4.8. Vacancy rates by main teaching subject (%)
Subject 2010 2011 2012 2013 2014 2015
Mathematics 0.7 0.5 0.7 1.1 1.4 1.2
All sciences 0.4 0.4 0.6 1.0 1.4 1.3
Languages 0.3 0.4 0.5 0.3 0.7 0.7
English 0.5 0.4 0.7 1.0 1.3 1.2
Geography 0.2 0.2 0.4 0.6 1.2 1.2
History 0.2 0.3 0.2 0.4 0.8 0.7
Information technology 0.5 0.4 0.5 1.0 1.5 1.4
Design and technology 0.4 0.2 0.4 0.6 1.1 0.8
Physical education/sport/dance 0.2 0.1 0.1 0.3 0.4 0.3 Source: School Workforce in England: November 2015 (published 2016).
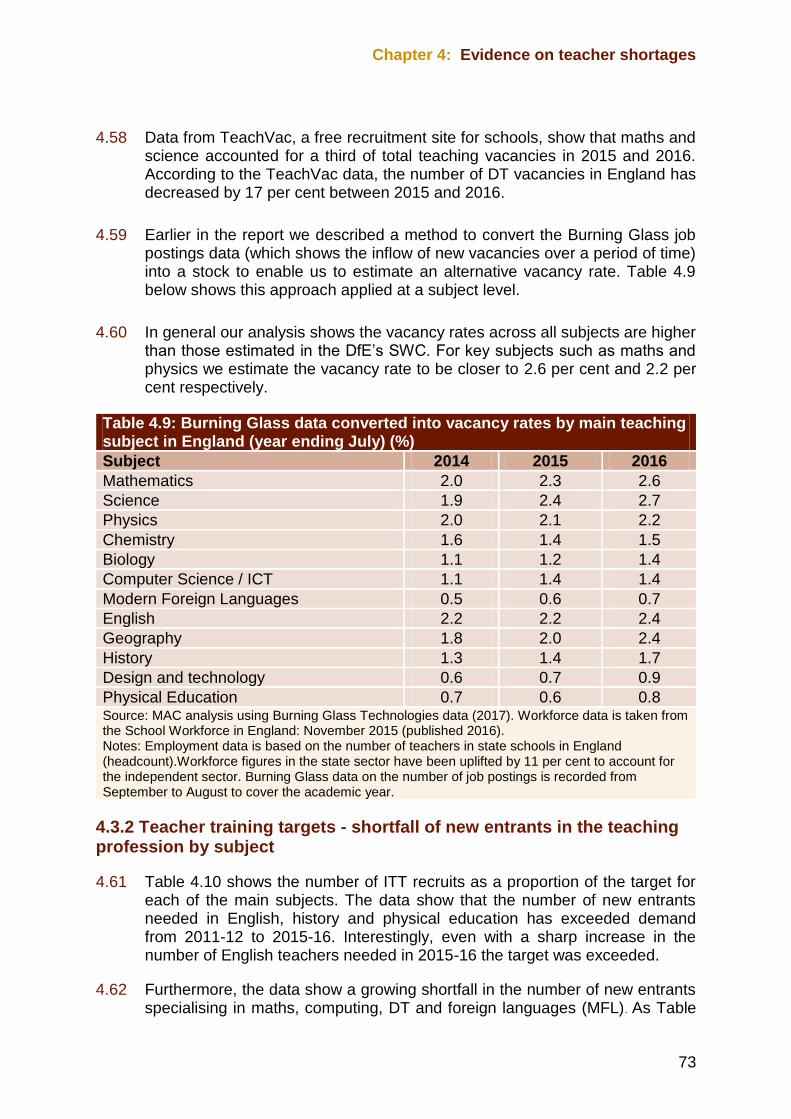
Chapter 4: Evidence on teacher shortages
73
4.58 Data from TeachVac, a free recruitment site for schools, show that maths and science accounted for a third of total teaching vacancies in 2015 and 2016. According to the TeachVac data, the number of DT vacancies in England has decreased by 17 per cent between 2015 and 2016.
4.59 Earlier in the report we described a method to convert the Burning Glass job postings data (which shows the inflow of new vacancies over a period of time) into a stock to enable us to estimate an alternative vacancy rate. Table 4.9 below shows this approach applied at a subject level.
4.60 In general our analysis shows the vacancy rates across all subjects are higher than those estimated in the DfE’s SWC. For key subjects such as maths and physics we estimate the vacancy rate to be closer to 2.6 per cent and 2.2 per cent respectively.
4.3.2 Teacher training targets - shortfall of new entrants in the teaching profession by subject
4.61 Table 4.10 shows the number of ITT recruits as a proportion of the target for each of the main subjects. The data show that the number of new entrants needed in English, history and physical education has exceeded demand from 2011-12 to 2015-16. Interestingly, even with a sharp increase in the number of English teachers needed in 2015-16 the target was exceeded.
4.62 Furthermore, the data show a growing shortfall in the number of new entrants specialising in maths, computing, DT and foreign languages (MFL). As Table
Table 4.9: Burning Glass data converted into vacancy rates by main teaching subject in England (year ending July) (%)
Subject 2014 2015 2016
Mathematics 2.0 2.3 2.6
Science 1.9 2.4 2.7
Physics 2.0 2.1 2.2
Chemistry 1.6 1.4 1.5
Biology 1.1 1.2 1.4
Computer Science / ICT 1.1 1.4 1.4
Modern Foreign Languages 0.5 0.6 0.7
English 2.2 2.2 2.4
Geography 1.8 2.0 2.4
History 1.3 1.4 1.7
Design and technology 0.6 0.7 0.9
Physical Education 0.7 0.6 0.8 Source: MAC analysis using Burning Glass Technologies data (2017). Workforce data is taken from the School Workforce in England: November 2015 (published 2016). Notes: Employment data is based on the number of teachers in state schools in England (headcount).Workforce figures in the state sector have been uplifted by 11 per cent to account for the independent sector. Burning Glass data on the number of job postings is recorded from September to August to cover the academic year.
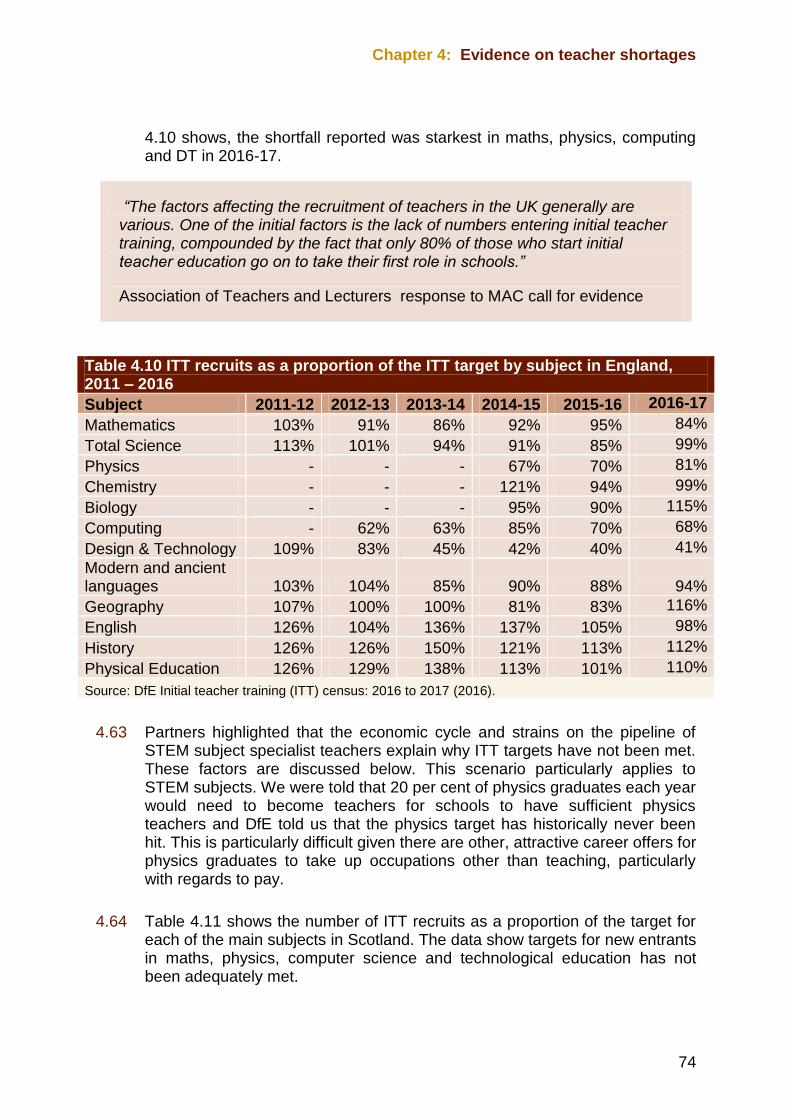
Chapter 4: Evidence on teacher shortages
74
4.10 shows, the shortfall reported was starkest in maths, physics, computing and DT in 2016-17.
“The factors affecting the recruitment of teachers in the UK generally are various. One of the initial factors is the lack of numbers entering initial teacher training, compounded by the fact that only 80% of those who start initial teacher education go on to take their first role in schools.”
Association of Teachers and Lecturers response to MAC call for evidence
Table 4.10 ITT recruits as a proportion of the ITT target by subject in England, 2011 – 2016
Subject 2011-12 2012-13 2013-14 2014-15 2015-16 2016-17
Mathematics 103% 91% 86% 92% 95% 84%
Total Science 113% 101% 94% 91% 85% 99%
Physics - - - 67% 70% 81%
Chemistry - - - 121% 94% 99%
Biology - - - 95% 90% 115%
Computing - 62% 63% 85% 70% 68%
Design & Technology 109% 83% 45% 42% 40% 41%
Modern and ancient languages 103% 104% 85% 90% 88%
94%
Geography 107% 100% 100% 81% 83% 116%
English 126% 104% 136% 137% 105% 98%
History 126% 126% 150% 121% 113% 112%
Physical Education 126% 129% 138% 113% 101% 110%
Source: DfE Initial teacher training (ITT) census: 2016 to 2017 (2016).
4.63 Partners highlighted that the economic cycle and strains on the pipeline of STEM subject specialist teachers explain why ITT targets have not been met. These factors are discussed below. This scenario particularly applies to STEM subjects. We were told that 20 per cent of physics graduates each year would need to become teachers for schools to have sufficient physics teachers and DfE told us that the physics target has historically never been hit. This is particularly difficult given there are other, attractive career offers for physics graduates to take up occupations other than teaching, particularly with regards to pay.
4.64 Table 4.11 shows the number of ITT recruits as a proportion of the target for each of the main subjects in Scotland. The data show targets for new entrants in maths, physics, computer science and technological education has not been adequately met.
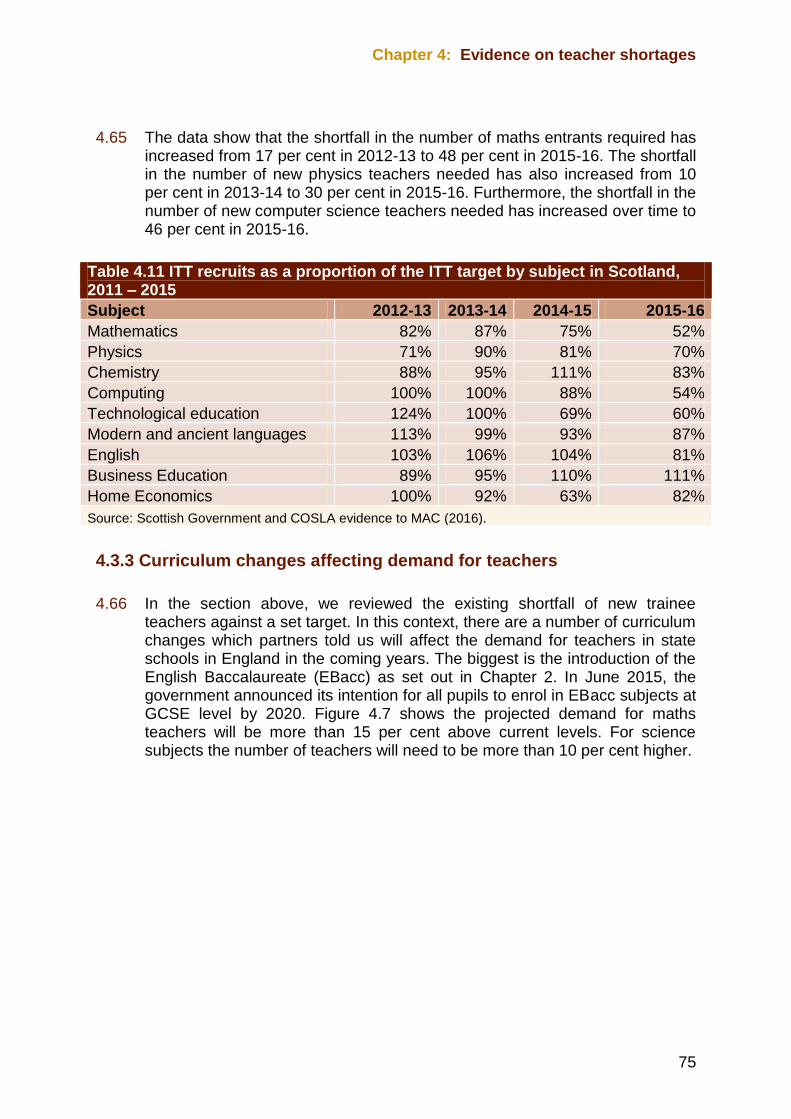
Chapter 4: Evidence on teacher shortages
75
4.65 The data show that the shortfall in the number of maths entrants required has increased from 17 per cent in 2012-13 to 48 per cent in 2015-16. The shortfall in the number of new physics teachers needed has also increased from 10 per cent in 2013-14 to 30 per cent in 2015-16. Furthermore, the shortfall in the number of new computer science teachers needed has increased over time to 46 per cent in 2015-16.
Table 4.11 ITT recruits as a proportion of the ITT target by subject in Scotland, 2011 – 2015
Subject 2012-13 2013-14 2014-15 2015-16
Mathematics 82% 87% 75% 52%
Physics 71% 90% 81% 70%
Chemistry 88% 95% 111% 83%
Computing 100% 100% 88% 54%
Technological education 124% 100% 69% 60%
Modern and ancient languages 113% 99% 93% 87%
English 103% 106% 104% 81%
Business Education 89% 95% 110% 111%
Home Economics 100% 92% 63% 82%
Source: Scottish Government and COSLA evidence to MAC (2016).
4.3.3 Curriculum changes affecting demand for teachers
4.66 In the section above, we reviewed the existing shortfall of new trainee teachers against a set target. In this context, there are a number of curriculum changes which partners told us will affect the demand for teachers in state schools in England in the coming years. The biggest is the introduction of the English Baccalaureate (EBacc) as set out in Chapter 2. In June 2015, the government announced its intention for all pupils to enrol in EBacc subjects at GCSE level by 2020. Figure 4.7 shows the projected demand for maths teachers will be more than 15 per cent above current levels. For science subjects the number of teachers will need to be more than 10 per cent higher.
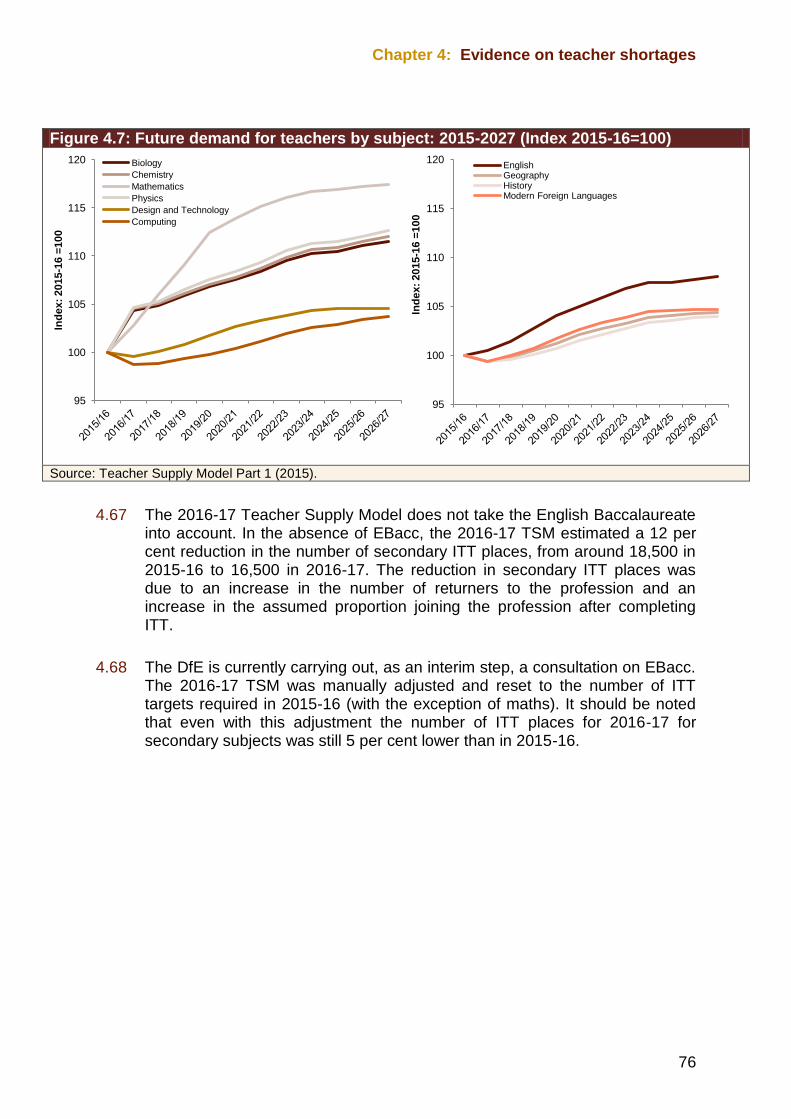
Chapter 4: Evidence on teacher shortages
76
Figure 4.7: Future demand for teachers by subject: 2015-2027 (Index 2015-16=100)
Source: Teacher Supply Model Part 1 (2015).
4.67 The 2016-17 Teacher Supply Model does not take the English Baccalaureate into account. In the absence of EBacc, the 2016-17 TSM estimated a 12 per cent reduction in the number of secondary ITT places, from around 18,500 in 2015-16 to 16,500 in 2016-17. The reduction in secondary ITT places was due to an increase in the number of returners to the profession and an increase in the assumed proportion joining the profession after completing ITT.
4.68 The DfE is currently carrying out, as an interim step, a consultation on EBacc. The 2016-17 TSM was manually adjusted and reset to the number of ITT targets required in 2015-16 (with the exception of maths). It should be noted that even with this adjustment the number of ITT places for 2016-17 for secondary subjects was still 5 per cent lower than in 2015-16.
95
100
105
110
115
120
Ind
ex:
2015
-16 =
100
Biology
Chemistry
Mathematics
Physics
Design and Technology
Computing
95
100
105
110
115
120
Ind
ex:
2015-1
6 =
100
English Geography History Modern Foreign Languages
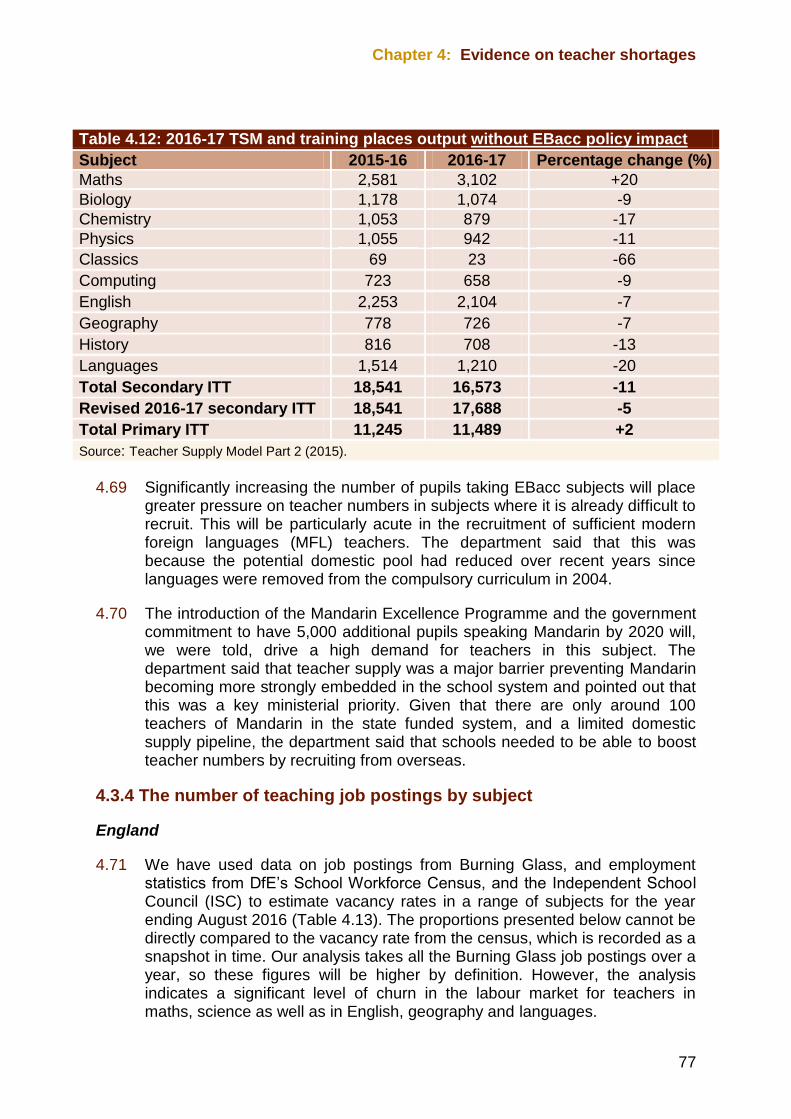
Chapter 4: Evidence on teacher shortages
77
Table 4.12: 2016-17 TSM and training places output without EBacc policy impact
Subject 2015-16 2016-17 Percentage change (%)
Maths 2,581 3,102 +20
Biology 1,178 1,074 -9
Chemistry 1,053 879 -17
Physics 1,055 942 -11
Classics 69 23 -66
Computing 723 658 -9
English 2,253 2,104 -7
Geography 778 726 -7
History 816 708 -13
Languages 1,514 1,210 -20
Total Secondary ITT 18,541 16,573 -11
Revised 2016-17 secondary ITT 18,541 17,688 -5
Total Primary ITT 11,245 11,489 +2
Source: Teacher Supply Model Part 2 (2015).
4.69 Significantly increasing the number of pupils taking EBacc subjects will place greater pressure on teacher numbers in subjects where it is already difficult to recruit. This will be particularly acute in the recruitment of sufficient modern foreign languages (MFL) teachers. The department said that this was because the potential domestic pool had reduced over recent years since languages were removed from the compulsory curriculum in 2004.
4.70 The introduction of the Mandarin Excellence Programme and the government commitment to have 5,000 additional pupils speaking Mandarin by 2020 will, we were told, drive a high demand for teachers in this subject. The department said that teacher supply was a major barrier preventing Mandarin becoming more strongly embedded in the school system and pointed out that this was a key ministerial priority. Given that there are only around 100 teachers of Mandarin in the state funded system, and a limited domestic supply pipeline, the department said that schools needed to be able to boost teacher numbers by recruiting from overseas.
4.3.4 The number of teaching job postings by subject
England
4.71 We have used data on job postings from Burning Glass, and employment statistics from DfE’s School Workforce Census, and the Independent School Council (ISC) to estimate vacancy rates in a range of subjects for the year ending August 2016 (Table 4.13). The proportions presented below cannot be directly compared to the vacancy rate from the census, which is recorded as a snapshot in time. Our analysis takes all the Burning Glass job postings over a year, so these figures will be higher by definition. However, the analysis indicates a significant level of churn in the labour market for teachers in maths, science as well as in English, geography and languages.
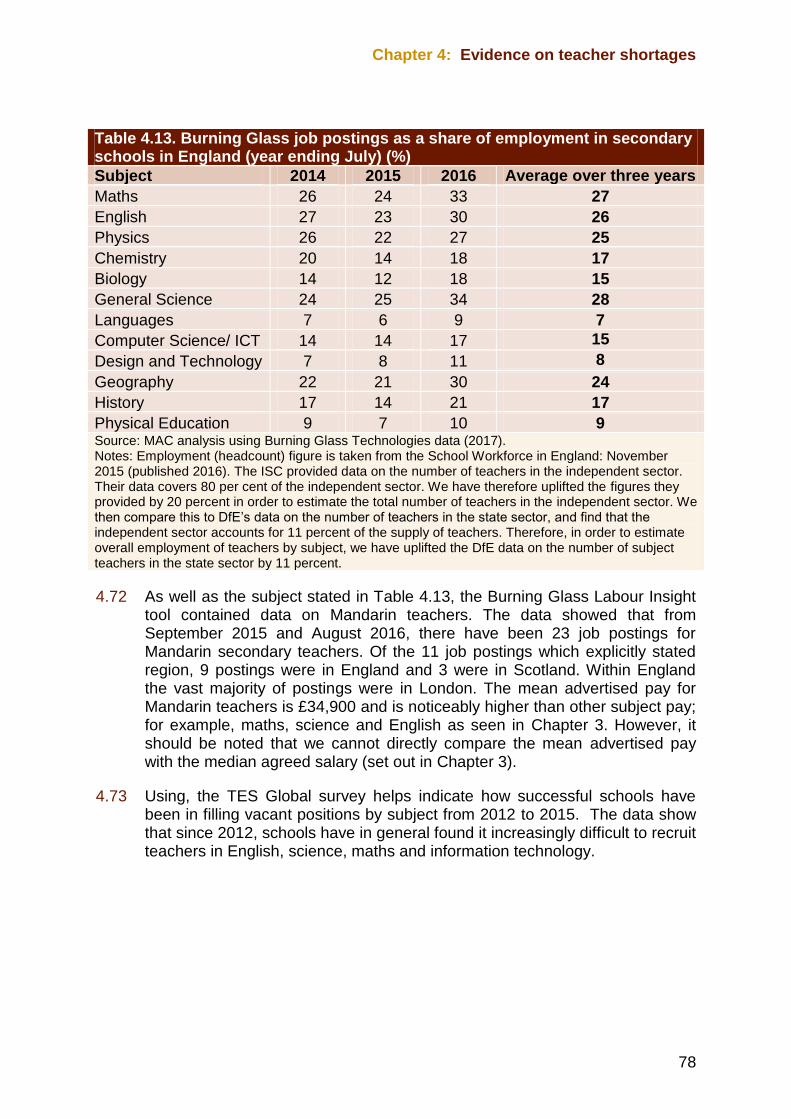
Chapter 4: Evidence on teacher shortages
78
Table 4.13. Burning Glass job postings as a share of employment in secondary schools in England (year ending July) (%)
Subject 2014 2015 2016 Average over three years
Maths 26 24 33 27
English 27 23 30 26
Physics 26 22 27 25
Chemistry 20 14 18 17
Biology 14 12 18 15
General Science 24 25 34 28
Languages 7 6 9 7
Computer Science/ ICT 14 14 17 15
Design and Technology 7 8 11 8
Geography 22 21 30 24
History 17 14 21 17
Physical Education 9 7 10 9 Source: MAC analysis using Burning Glass Technologies data (2017). Notes: Employment (headcount) figure is taken from the School Workforce in England: November 2015 (published 2016). The ISC provided data on the number of teachers in the independent sector. Their data covers 80 per cent of the independent sector. We have therefore uplifted the figures they provided by 20 percent in order to estimate the total number of teachers in the independent sector. We then compare this to DfE’s data on the number of teachers in the state sector, and find that the independent sector accounts for 11 percent of the supply of teachers. Therefore, in order to estimate overall employment of teachers by subject, we have uplifted the DfE data on the number of subject teachers in the state sector by 11 percent.
4.72 As well as the subject stated in Table 4.13, the Burning Glass Labour Insight tool contained data on Mandarin teachers. The data showed that from September 2015 and August 2016, there have been 23 job postings for Mandarin secondary teachers. Of the 11 job postings which explicitly stated region, 9 postings were in England and 3 were in Scotland. Within England the vast majority of postings were in London. The mean advertised pay for Mandarin teachers is £34,900 and is noticeably higher than other subject pay; for example, maths, science and English as seen in Chapter 3. However, it should be noted that we cannot directly compare the mean advertised pay with the median agreed salary (set out in Chapter 3).
4.73 Using, the TES Global survey helps indicate how successful schools have been in filling vacant positions by subject from 2012 to 2015. The data show that since 2012, schools have in general found it increasingly difficult to recruit teachers in English, science, maths and information technology.
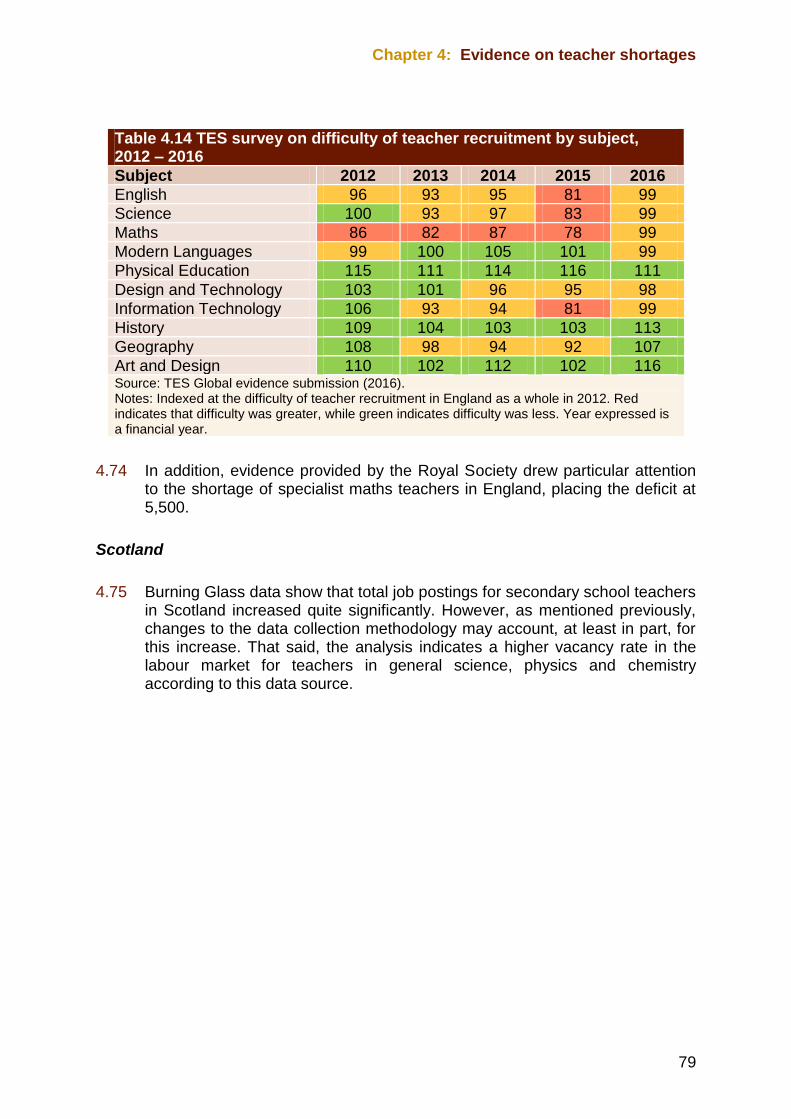
Chapter 4: Evidence on teacher shortages
79
Table 4.14 TES survey on difficulty of teacher recruitment by subject, 2012 – 2016
Subject 2012 2013 2014 2015 2016
English 96 93 95 81 99
Science 100 93 97 83 99
Maths 86 82 87 78 99
Modern Languages 99 100 105 101 99
Physical Education 115 111 114 116 111
Design and Technology 103 101 96 95 98
Information Technology 106 93 94 81 99
History 109 104 103 103 113
Geography 108 98 94 92 107
Art and Design 110 102 112 102 116 Source: TES Global evidence submission (2016). Notes: Indexed at the difficulty of teacher recruitment in England as a whole in 2012. Red indicates that difficulty was greater, while green indicates difficulty was less. Year expressed is a financial year.
4.74 In addition, evidence provided by the Royal Society drew particular attention to the shortage of specialist maths teachers in England, placing the deficit at 5,500.
Scotland
4.75 Burning Glass data show that total job postings for secondary school teachers in Scotland increased quite significantly. However, as mentioned previously, changes to the data collection methodology may account, at least in part, for this increase. That said, the analysis indicates a higher vacancy rate in the labour market for teachers in general science, physics and chemistry according to this data source.
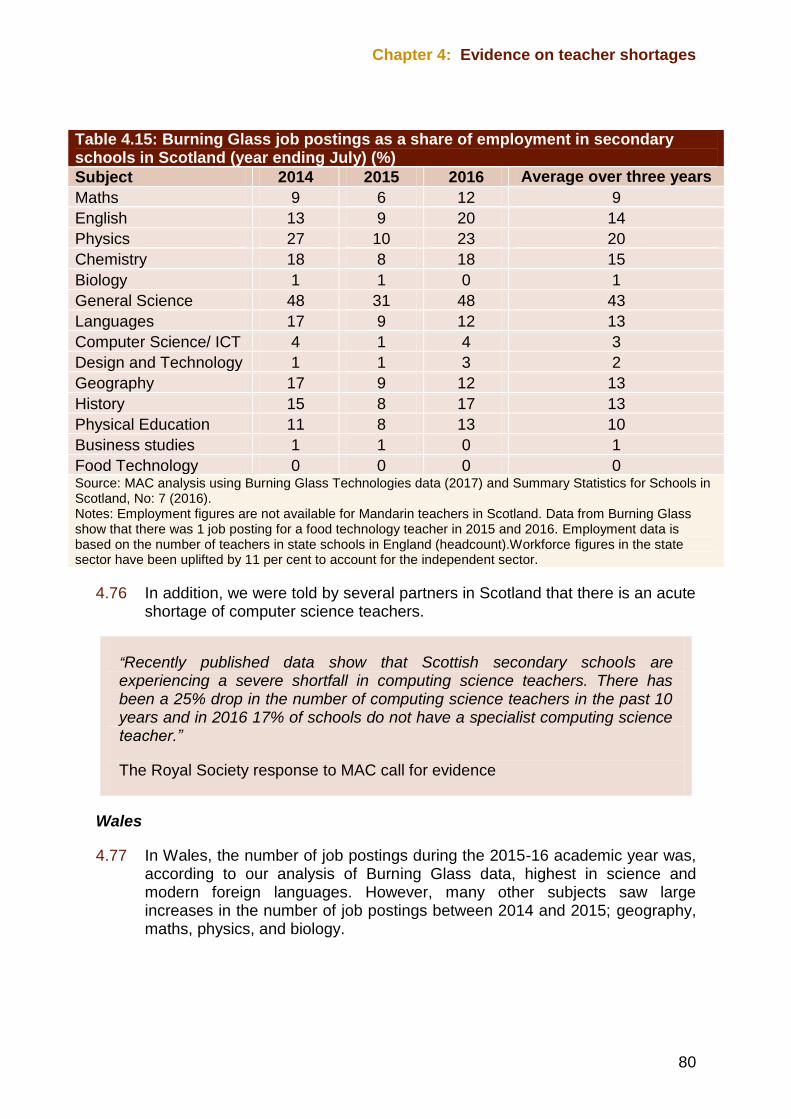
Chapter 4: Evidence on teacher shortages
80
4.76 In addition, we were told by several partners in Scotland that there is an acute shortage of computer science teachers.
“Recently published data show that Scottish secondary schools are experiencing a severe shortfall in computing science teachers. There has been a 25% drop in the number of computing science teachers in the past 10 years and in 2016 17% of schools do not have a specialist computing science teacher.”
The Royal Society response to MAC call for evidence
Wales
4.77 In Wales, the number of job postings during the 2015-16 academic year was, according to our analysis of Burning Glass data, highest in science and modern foreign languages. However, many other subjects saw large increases in the number of job postings between 2014 and 2015; geography, maths, physics, and biology.
Table 4.15: Burning Glass job postings as a share of employment in secondary schools in Scotland (year ending July) (%)
Subject 2014 2015 2016 Average over three years
Maths 9 6 12 9
English 13 9 20 14
Physics 27 10 23 20
Chemistry 18 8 18 15
Biology 1 1 0 1
General Science 48 31 48 43
Languages 17 9 12 13
Computer Science/ ICT 4 1 4 3
Design and Technology 1 1 3 2
Geography 17 9 12 13
History 15 8 17 13
Physical Education 11 8 13 10
Business studies 1 1 0 1
Food Technology 0 0 0 0 Source: MAC analysis using Burning Glass Technologies data (2017) and Summary Statistics for Schools in Scotland, No: 7 (2016). Notes: Employment figures are not available for Mandarin teachers in Scotland. Data from Burning Glass show that there was 1 job posting for a food technology teacher in 2015 and 2016. Employment data is based on the number of teachers in state schools in England (headcount).Workforce figures in the state sector have been uplifted by 11 per cent to account for the independent sector.
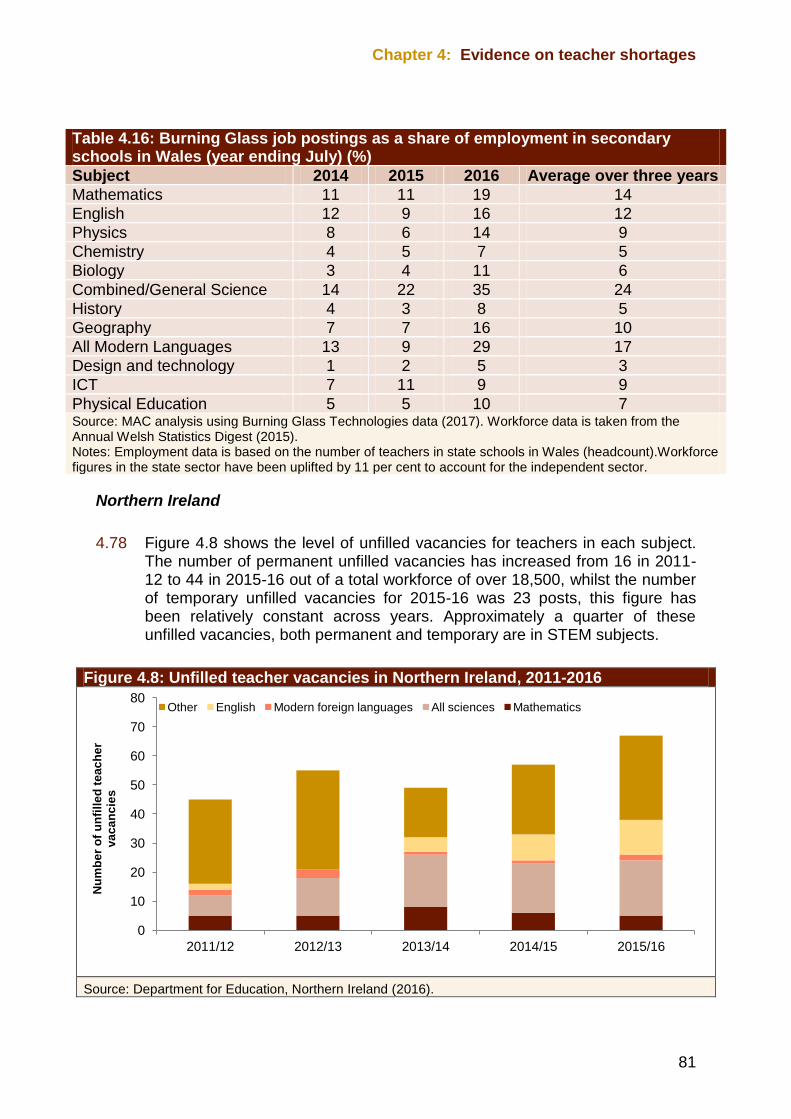
Chapter 4: Evidence on teacher shortages
81
Table 4.16: Burning Glass job postings as a share of employment in secondary schools in Wales (year ending July) (%)
Subject 2014 2015 2016 Average over three years
Mathematics 11 11 19 14
English 12 9 16 12
Physics 8 6 14 9
Chemistry 4 5 7 5
Biology 3 4 11 6
Combined/General Science 14 22 35 24
History 4 3 8 5
Geography 7 7 16 10
All Modern Languages 13 9 29 17
Design and technology 1 2 5 3
ICT 7 11 9 9
Physical Education 5 5 10 7 Source: MAC analysis using Burning Glass Technologies data (2017). Workforce data is taken from the Annual Welsh Statistics Digest (2015). Notes: Employment data is based on the number of teachers in state schools in Wales (headcount).Workforce figures in the state sector have been uplifted by 11 per cent to account for the independent sector.
Northern Ireland
4.78 Figure 4.8 shows the level of unfilled vacancies for teachers in each subject. The number of permanent unfilled vacancies has increased from 16 in 2011-12 to 44 in 2015-16 out of a total workforce of over 18,500, whilst the number of temporary unfilled vacancies for 2015-16 was 23 posts, this figure has been relatively constant across years. Approximately a quarter of these unfilled vacancies, both permanent and temporary are in STEM subjects.
Figure 4.8: Unfilled teacher vacancies in Northern Ireland, 2011-2016
Source: Department for Education, Northern Ireland (2016).
0
10
20
30
40
50
60
70
80
2011/12 2012/13 2013/14 2014/15 2015/16
Nu
mb
er
of
un
fill
ed
te
ac
he
r va
ca
nc
ies
Other English Modern foreign languages All sciences Mathematics
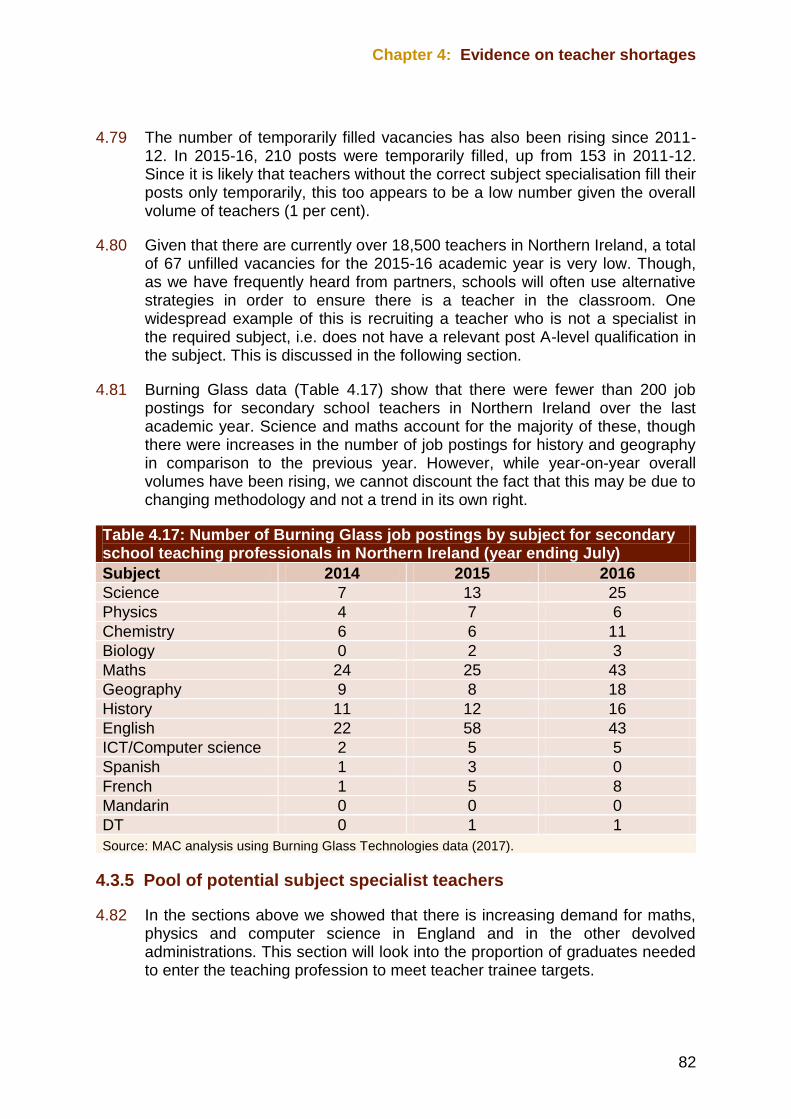
Chapter 4: Evidence on teacher shortages
82
4.79 The number of temporarily filled vacancies has also been rising since 2011-12. In 2015-16, 210 posts were temporarily filled, up from 153 in 2011-12. Since it is likely that teachers without the correct subject specialisation fill their posts only temporarily, this too appears to be a low number given the overall volume of teachers (1 per cent).
4.80 Given that there are currently over 18,500 teachers in Northern Ireland, a total of 67 unfilled vacancies for the 2015-16 academic year is very low. Though, as we have frequently heard from partners, schools will often use alternative strategies in order to ensure there is a teacher in the classroom. One widespread example of this is recruiting a teacher who is not a specialist in the required subject, i.e. does not have a relevant post A-level qualification in the subject. This is discussed in the following section.
4.81 Burning Glass data (Table 4.17) show that there were fewer than 200 job postings for secondary school teachers in Northern Ireland over the last academic year. Science and maths account for the majority of these, though there were increases in the number of job postings for history and geography in comparison to the previous year. However, while year-on-year overall volumes have been rising, we cannot discount the fact that this may be due to changing methodology and not a trend in its own right.
Table 4.17: Number of Burning Glass job postings by subject for secondary school teaching professionals in Northern Ireland (year ending July)
Subject 2014 2015 2016
Science 7 13 25
Physics 4 7 6
Chemistry 6 6 11
Biology 0 2 3
Maths 24 25 43
Geography 9 8 18
History 11 12 16
English 22 58 43
ICT/Computer science 2 5 5
Spanish 1 3 0
French 1 5 8
Mandarin 0 0 0
DT 0 1 1
Source: MAC analysis using Burning Glass Technologies data (2017).
4.3.5 Pool of potential subject specialist teachers
4.82 In the sections above we showed that there is increasing demand for maths, physics and computer science in England and in the other devolved administrations. This section will look into the proportion of graduates needed to enter the teaching profession to meet teacher trainee targets.
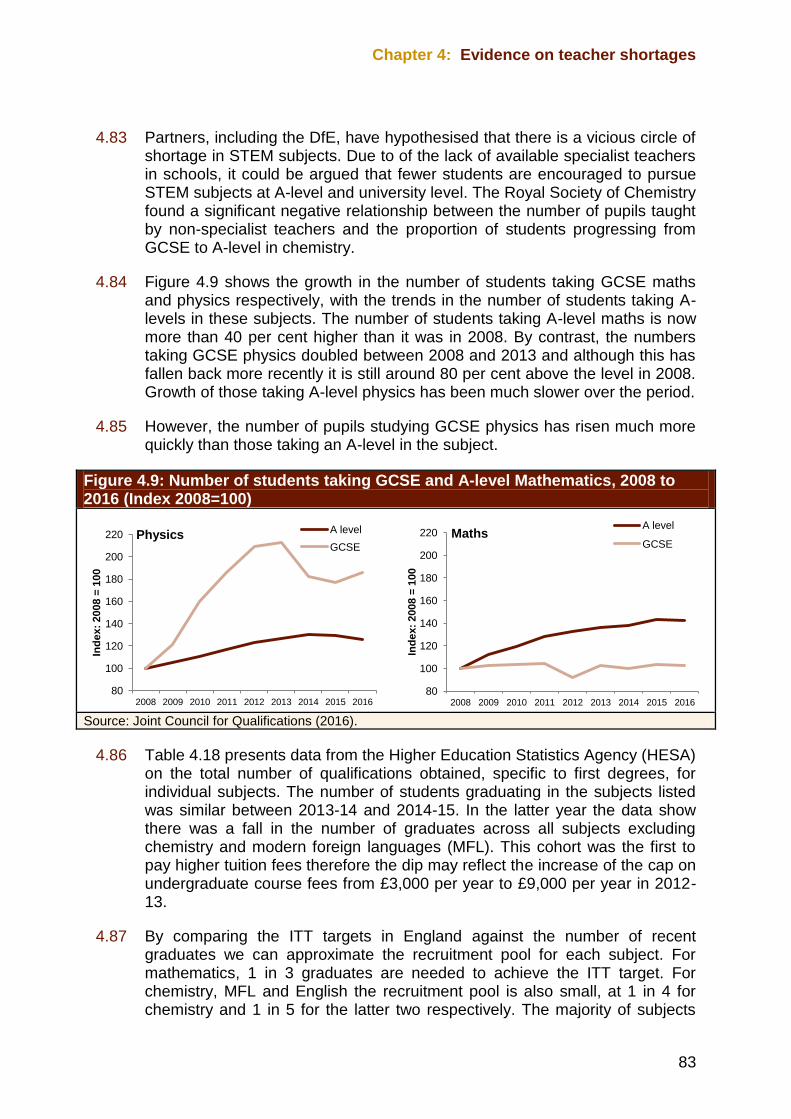
Chapter 4: Evidence on teacher shortages
83
4.83 Partners, including the DfE, have hypothesised that there is a vicious circle of shortage in STEM subjects. Due to of the lack of available specialist teachers in schools, it could be argued that fewer students are encouraged to pursue STEM subjects at A-level and university level. The Royal Society of Chemistry found a significant negative relationship between the number of pupils taught by non-specialist teachers and the proportion of students progressing from GCSE to A-level in chemistry.
4.84 Figure 4.9 shows the growth in the number of students taking GCSE maths and physics respectively, with the trends in the number of students taking A-levels in these subjects. The number of students taking A-level maths is now more than 40 per cent higher than it was in 2008. By contrast, the numbers taking GCSE physics doubled between 2008 and 2013 and although this has fallen back more recently it is still around 80 per cent above the level in 2008. Growth of those taking A-level physics has been much slower over the period.
4.85 However, the number of pupils studying GCSE physics has risen much more quickly than those taking an A-level in the subject.
Figure 4.9: Number of students taking GCSE and A-level Mathematics, 2008 to 2016 (Index 2008=100)
Source: Joint Council for Qualifications (2016).
4.86 Table 4.18 presents data from the Higher Education Statistics Agency (HESA) on the total number of qualifications obtained, specific to first degrees, for individual subjects. The number of students graduating in the subjects listed was similar between 2013-14 and 2014-15. In the latter year the data show there was a fall in the number of graduates across all subjects excluding chemistry and modern foreign languages (MFL). This cohort was the first to pay higher tuition fees therefore the dip may reflect the increase of the cap on undergraduate course fees from £3,000 per year to £9,000 per year in 2012-13.
4.87 By comparing the ITT targets in England against the number of recent graduates we can approximate the recruitment pool for each subject. For mathematics, 1 in 3 graduates are needed to achieve the ITT target. For chemistry, MFL and English the recruitment pool is also small, at 1 in 4 for chemistry and 1 in 5 for the latter two respectively. The majority of subjects
80
100
120
140
160
180
200
220
2008 2009 2010 2011 2012 2013 2014 2015 2016
Ind
ex:
2008 =
100
Physics A level
GCSE
80
100
120
140
160
180
200
220
2008 2009 2010 2011 2012 2013 2014 2015 2016
Ind
ex:
2008 =
100
Maths
A level
GCSE
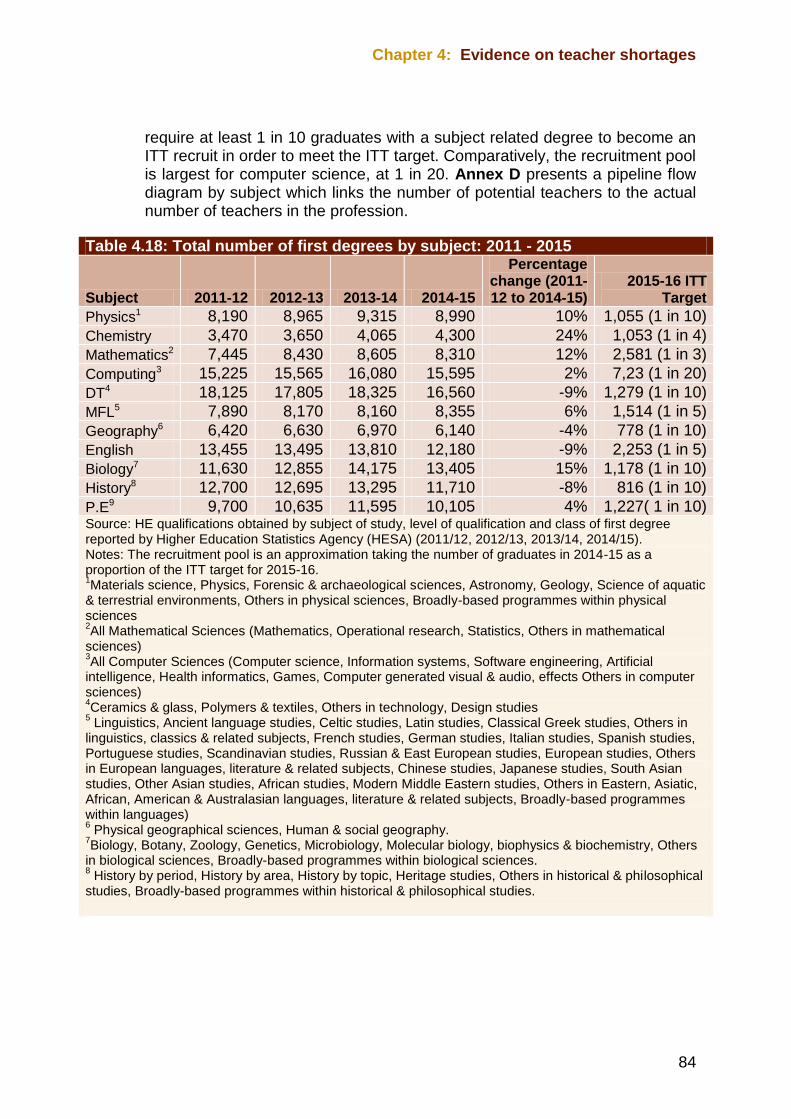
Chapter 4: Evidence on teacher shortages
84
require at least 1 in 10 graduates with a subject related degree to become an ITT recruit in order to meet the ITT target. Comparatively, the recruitment pool is largest for computer science, at 1 in 20. Annex D presents a pipeline flow diagram by subject which links the number of potential teachers to the actual number of teachers in the profession.
Table 4.18: Total number of first degrees by subject: 2011 - 2015
Subject 2011-12 2012-13 2013-14 2014-15
Percentage change (2011-12 to 2014-15)
2015-16 ITT Target
Physics1 8,190 8,965 9,315 8,990 10% 1,055 (1 in 10)
Chemistry 3,470 3,650 4,065 4,300 24% 1,053 (1 in 4)
Mathematics2 7,445 8,430 8,605 8,310 12% 2,581 (1 in 3)
Computing3 15,225 15,565 16,080 15,595 2% 7,23 (1 in 20)
DT4 18,125 17,805 18,325 16,560 -9% 1,279 (1 in 10)
MFL5 7,890 8,170 8,160 8,355 6% 1,514 (1 in 5)
Geography6 6,420 6,630 6,970 6,140 -4% 778 (1 in 10)
English 13,455 13,495 13,810 12,180 -9% 2,253 (1 in 5)
Biology7 11,630 12,855 14,175 13,405 15% 1,178 (1 in 10)
History8 12,700 12,695 13,295 11,710 -8% 816 (1 in 10)
P.E9 9,700 10,635 11,595 10,105 4% 1,227( 1 in 10) Source: HE qualifications obtained by subject of study, level of qualification and class of first degree reported by Higher Education Statistics Agency (HESA) (2011/12, 2012/13, 2013/14, 2014/15). Notes: The recruitment pool is an approximation taking the number of graduates in 2014-15 as a proportion of the ITT target for 2015-16. 1Materials science, Physics, Forensic & archaeological sciences, Astronomy, Geology, Science of aquatic
& terrestrial environments, Others in physical sciences, Broadly-based programmes within physical sciences 2All Mathematical Sciences (Mathematics, Operational research, Statistics, Others in mathematical
sciences) 3All Computer Sciences (Computer science, Information systems, Software engineering, Artificial
intelligence, Health informatics, Games, Computer generated visual & audio, effects Others in computer sciences) 4Ceramics & glass, Polymers & textiles, Others in technology, Design studies
5 Linguistics, Ancient language studies, Celtic studies, Latin studies, Classical Greek studies, Others in
linguistics, classics & related subjects, French studies, German studies, Italian studies, Spanish studies, Portuguese studies, Scandinavian studies, Russian & East European studies, European studies, Others in European languages, literature & related subjects, Chinese studies, Japanese studies, South Asian studies, Other Asian studies, African studies, Modern Middle Eastern studies, Others in Eastern, Asiatic, African, American & Australasian languages, literature & related subjects, Broadly-based programmes within languages) 6 Physical geographical sciences, Human & social geography.
7Biology, Botany, Zoology, Genetics, Microbiology, Molecular biology, biophysics & biochemistry, Others
in biological sciences, Broadly-based programmes within biological sciences. 8 History by period, History by area, History by topic, Heritage studies, Others in historical & philosophical
studies, Broadly-based programmes within historical & philosophical studies.
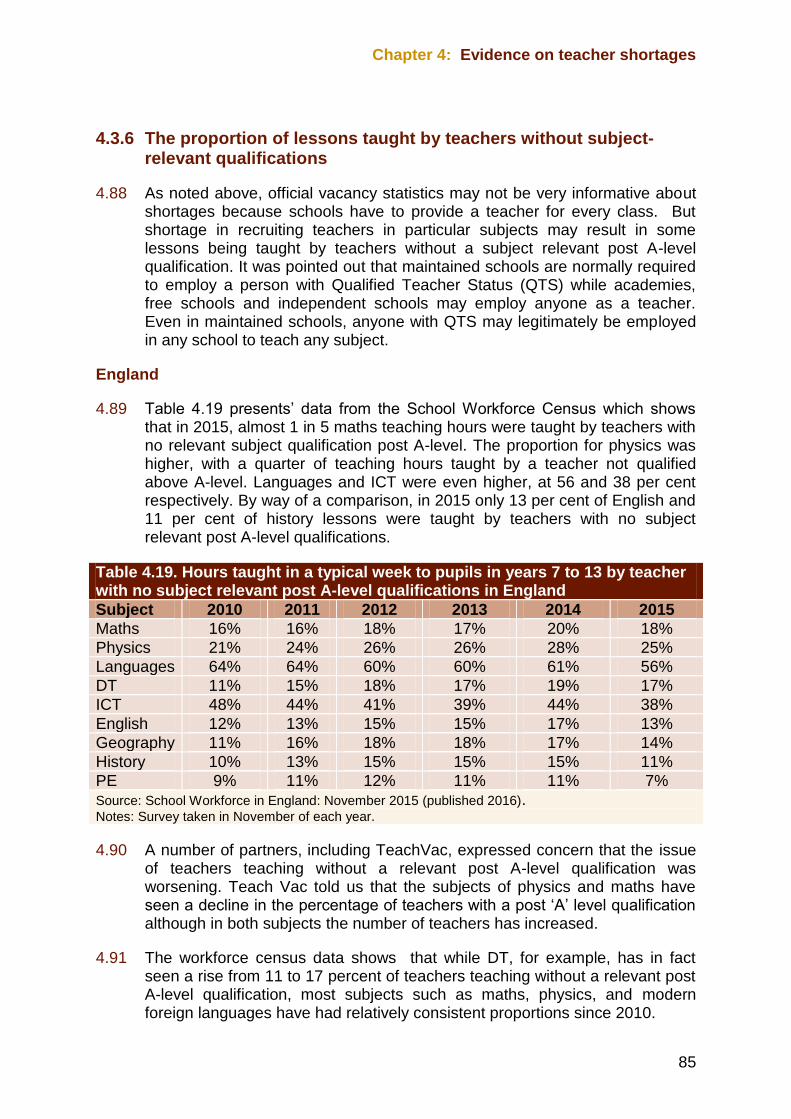
Chapter 4: Evidence on teacher shortages
85
4.3.6 The proportion of lessons taught by teachers without subject-relevant qualifications
4.88 As noted above, official vacancy statistics may not be very informative about shortages because schools have to provide a teacher for every class. But shortage in recruiting teachers in particular subjects may result in some lessons being taught by teachers without a subject relevant post A-level qualification. It was pointed out that maintained schools are normally required to employ a person with Qualified Teacher Status (QTS) while academies, free schools and independent schools may employ anyone as a teacher. Even in maintained schools, anyone with QTS may legitimately be employed in any school to teach any subject.
England
4.89 Table 4.19 presents’ data from the School Workforce Census which shows that in 2015, almost 1 in 5 maths teaching hours were taught by teachers with no relevant subject qualification post A-level. The proportion for physics was higher, with a quarter of teaching hours taught by a teacher not qualified above A-level. Languages and ICT were even higher, at 56 and 38 per cent respectively. By way of a comparison, in 2015 only 13 per cent of English and 11 per cent of history lessons were taught by teachers with no subject relevant post A-level qualifications.
Table 4.19. Hours taught in a typical week to pupils in years 7 to 13 by teacher with no subject relevant post A-level qualifications in England
Subject 2010 2011 2012 2013 2014 2015
Maths 16% 16% 18% 17% 20% 18%
Physics 21% 24% 26% 26% 28% 25%
Languages 64% 64% 60% 60% 61% 56%
DT 11% 15% 18% 17% 19% 17%
ICT 48% 44% 41% 39% 44% 38%
English 12% 13% 15% 15% 17% 13%
Geography 11% 16% 18% 18% 17% 14%
History 10% 13% 15% 15% 15% 11%
PE 9% 11% 12% 11% 11% 7%
Source: School Workforce in England: November 2015 (published 2016). Notes: Survey taken in November of each year.
4.90 A number of partners, including TeachVac, expressed concern that the issue of teachers teaching without a relevant post A-level qualification was worsening. Teach Vac told us that the subjects of physics and maths have seen a decline in the percentage of teachers with a post ‘A’ level qualification although in both subjects the number of teachers has increased.
4.91 The workforce census data shows that while DT, for example, has in fact seen a rise from 11 to 17 percent of teachers teaching without a relevant post A-level qualification, most subjects such as maths, physics, and modern foreign languages have had relatively consistent proportions since 2010.
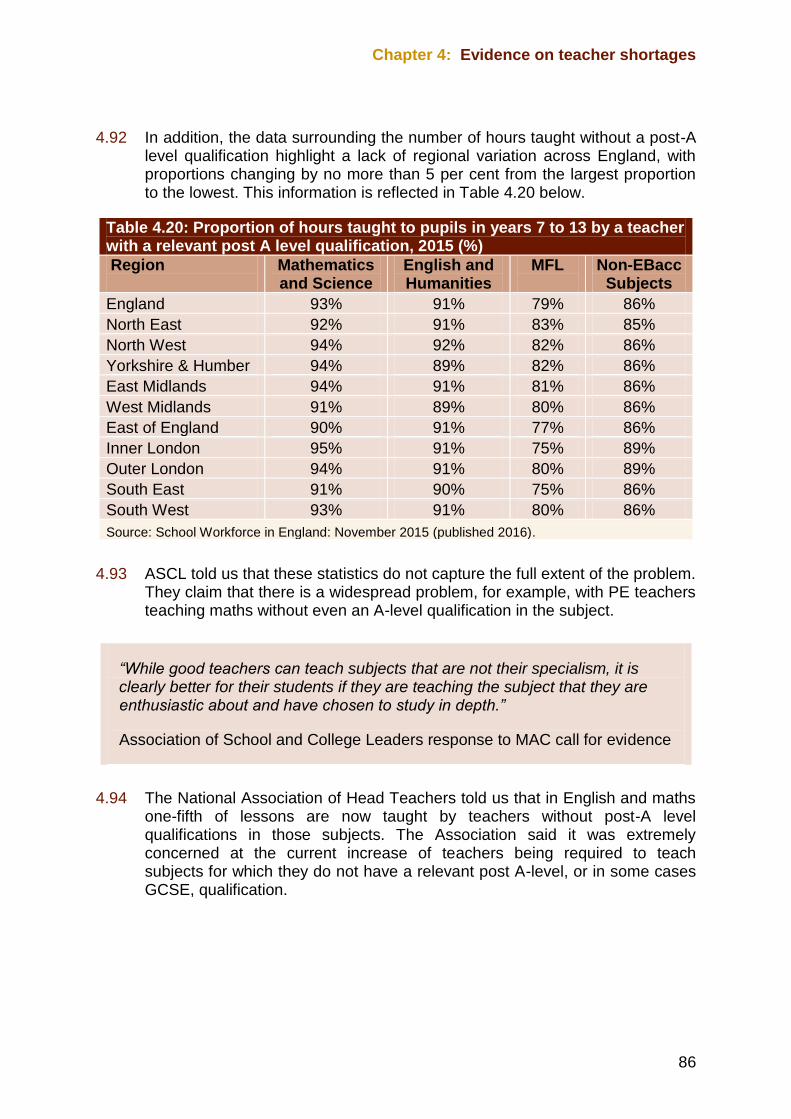
Chapter 4: Evidence on teacher shortages
86
4.92 In addition, the data surrounding the number of hours taught without a post-A level qualification highlight a lack of regional variation across England, with proportions changing by no more than 5 per cent from the largest proportion to the lowest. This information is reflected in Table 4.20 below.
Table 4.20: Proportion of hours taught to pupils in years 7 to 13 by a teacher with a relevant post A level qualification, 2015 (%)
Region
Mathematics and Science
English and Humanities
MFL
Non-EBacc Subjects
England 93% 91% 79% 86%
North East 92% 91% 83% 85%
North West 94% 92% 82% 86%
Yorkshire & Humber 94% 89% 82% 86%
East Midlands 94% 91% 81% 86%
West Midlands 91% 89% 80% 86%
East of England 90% 91% 77% 86%
Inner London 95% 91% 75% 89%
Outer London 94% 91% 80% 89%
South East 91% 90% 75% 86%
South West 93% 91% 80% 86%
Source: School Workforce in England: November 2015 (published 2016).
4.93 ASCL told us that these statistics do not capture the full extent of the problem. They claim that there is a widespread problem, for example, with PE teachers teaching maths without even an A-level qualification in the subject.
“While good teachers can teach subjects that are not their specialism, it is clearly better for their students if they are teaching the subject that they are enthusiastic about and have chosen to study in depth.”
Association of School and College Leaders response to MAC call for evidence
4.94 The National Association of Head Teachers told us that in English and maths one-fifth of lessons are now taught by teachers without post-A level qualifications in those subjects. The Association said it was extremely concerned at the current increase of teachers being required to teach subjects for which they do not have a relevant post A-level, or in some cases GCSE, qualification.
Chapter 4: Evidence on teacher shortages
87
“In particular, we are concerned that students at key stage 4 could be taught by a teacher without the level of subject knowledge to allow them to respond to probing questions from students, or to meet the needs of the most able students. A world class education system relies on high quality teachers with sufficient depth of subject expertise.”
National Association of Head Teachers response to MAC call for evidence
4.95 The Recruitment and Employment Confederation said that their members emphasised that the number of teachers alone is not the issue but a lack of good teachers which schools feel comfortable using.
“Further research is needed to determine if a lack of fully suitable teachers, those who do not hold degrees in the subject they are teaching, could have a detrimental impact on a child’s education and if this will ultimately negatively impact attainment.”
Recruitment and Employment Confederation response to MAC call for evidence
4.96 It may be that subjects with a higher proportion of hours taught by someone with no post A level qualification in the subject are those subjects that are experiencing a shortage of qualified teachers. Though, this may not always be the case as for certain subjects, such as languages, a formal qualification may not be indicative of ability in the subject area – a native speaker could be as qualified as somebody with a degree in that language. In addition, similar logic applies to computer science where self-taught routes into the occupation are comparatively common due to the fact the subject is relatively new.
“In STEM subjects, changes in the number of teachers holding subject-specialist qualifications over time is a much clearer indicator of subject-specific teacher shortages than teacher pay.”
The Royal Society response to MAC call for evidence
Wales
4.97 Table 4.21 shows us that in the past three years the proportion of lessons taught by teachers qualified in those subjects remained mostly stable. For some subjects, such as maths, physics, chemistry and English, the proportion has increased slightly.
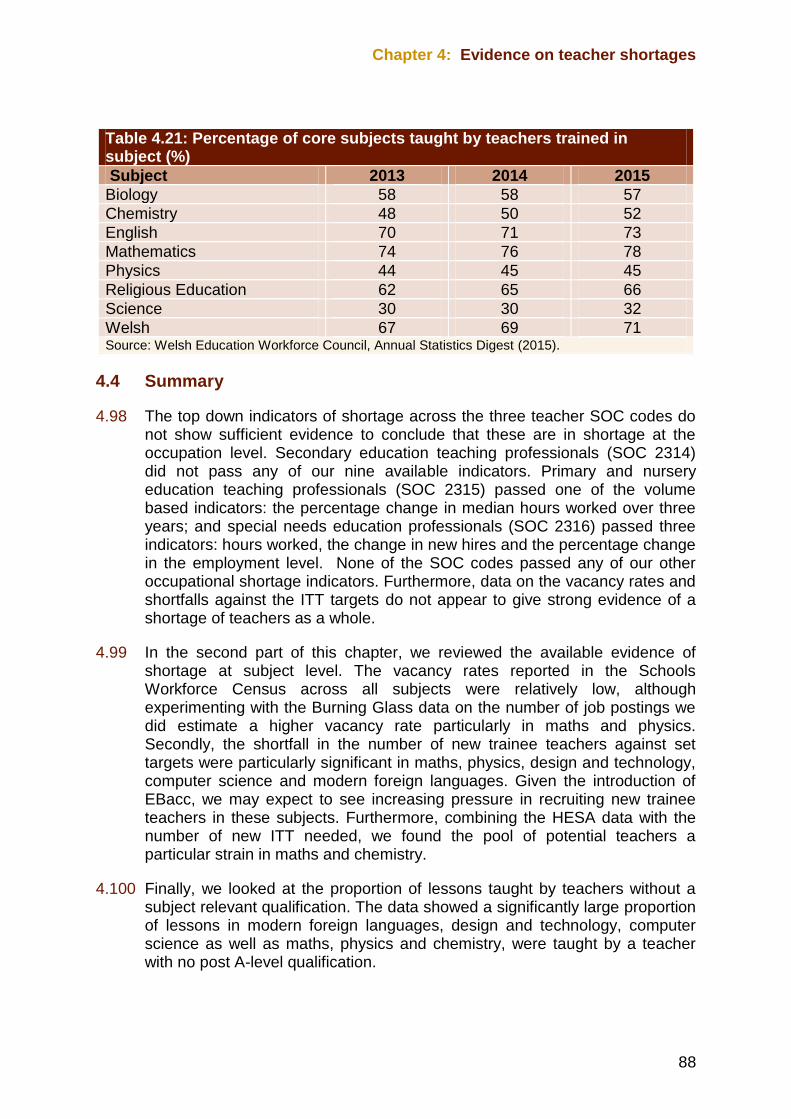
Chapter 4: Evidence on teacher shortages
88
Table 4.21: Percentage of core subjects taught by teachers trained in subject (%)
Subject 2013 2014 2015
Biology 58 58 57
Chemistry 48 50 52
English 70 71 73
Mathematics 74 76 78
Physics 44 45 45
Religious Education 62 65 66
Science 30 30 32
Welsh 67 69 71 Source: Welsh Education Workforce Council, Annual Statistics Digest (2015).
4.4 Summary
4.98 The top down indicators of shortage across the three teacher SOC codes do not show sufficient evidence to conclude that these are in shortage at the occupation level. Secondary education teaching professionals (SOC 2314) did not pass any of our nine available indicators. Primary and nursery education teaching professionals (SOC 2315) passed one of the volume based indicators: the percentage change in median hours worked over three years; and special needs education professionals (SOC 2316) passed three indicators: hours worked, the change in new hires and the percentage change in the employment level. None of the SOC codes passed any of our other occupational shortage indicators. Furthermore, data on the vacancy rates and shortfalls against the ITT targets do not appear to give strong evidence of a shortage of teachers as a whole.
4.99 In the second part of this chapter, we reviewed the available evidence of shortage at subject level. The vacancy rates reported in the Schools Workforce Census across all subjects were relatively low, although experimenting with the Burning Glass data on the number of job postings we did estimate a higher vacancy rate particularly in maths and physics. Secondly, the shortfall in the number of new trainee teachers against set targets were particularly significant in maths, physics, design and technology, computer science and modern foreign languages. Given the introduction of EBacc, we may expect to see increasing pressure in recruiting new trainee teachers in these subjects. Furthermore, combining the HESA data with the number of new ITT needed, we found the pool of potential teachers a particular strain in maths and chemistry.
4.100 Finally, we looked at the proportion of lessons taught by teachers without a subject relevant qualification. The data showed a significantly large proportion of lessons in modern foreign languages, design and technology, computer science as well as maths, physics and chemistry, were taught by a teacher with no post A-level qualification.
Chapter 4: Evidence on teacher shortages
89
4.101 In the next chapter we present evidence on the use of migrant teachers across the UK.

91
4.102
Chapter 5 The use of migrant teachers
5.1 Introduction
5.1 This chapter sets out the evidence on the number of migrants in the UK that are employed as teachers (both in terms of stocks and flows) and explores, in detail, specific regional and compositional effects. We consider both the numbers that make an initial application to come to the UK (out-of-country applications) along with the number of visa applications made to extend stay in the UK or to switch from other categories (in-country applications).
5.2 We focus on the Tier 2 (General) route as outlined in Chapter 2, as this is the route for non-European Economic Area (EEA) skilled workers to come and work in the UK.
5.3 However, during the course of this review it has become apparent that employers are also making extensive use of the Tier 5 (Youth Mobility Scheme) as an alternative route to bring in migrant teachers. Therefore in this chapter we consider what data is available on use of this route and compare this with what partners told us.
5.2 Foreign born teachers currently working in the UK
5.4 Table 5.1 shows the total volume – i.e. stock - of state nursery, primary and secondary teachers working in the UK in 2014 using data drawn from the Annual Population Survey. The APS data has a different estimate of the total number of teachers compared to the workforce census data we have used in previous chapters, because of differences in methodology.
5.5 According to the APS data, 2 per cent of nursery and primary school teachers and 4 per cent of secondary school teachers were born outside the UK but in the EEA, while a larger proportion, 5 per cent, were born outside of the EEA for both nursery, primary and secondary school teachers. These proportions have been relatively constant over the past 3 years and highlight the fact that the occupation employs a low proportion of migrants compared to occupations such as nursing which relies on up to a 14 per cent migrant contribution to the workforce (OECD 2015).
5.6 The focus of this report is mostly on non-EEA migrants, although recruitment of teachers from within the EEA also forms an important consideration in assessing shortage and may be important in future years if there is any
Chapter 5 The use of migrant teachers
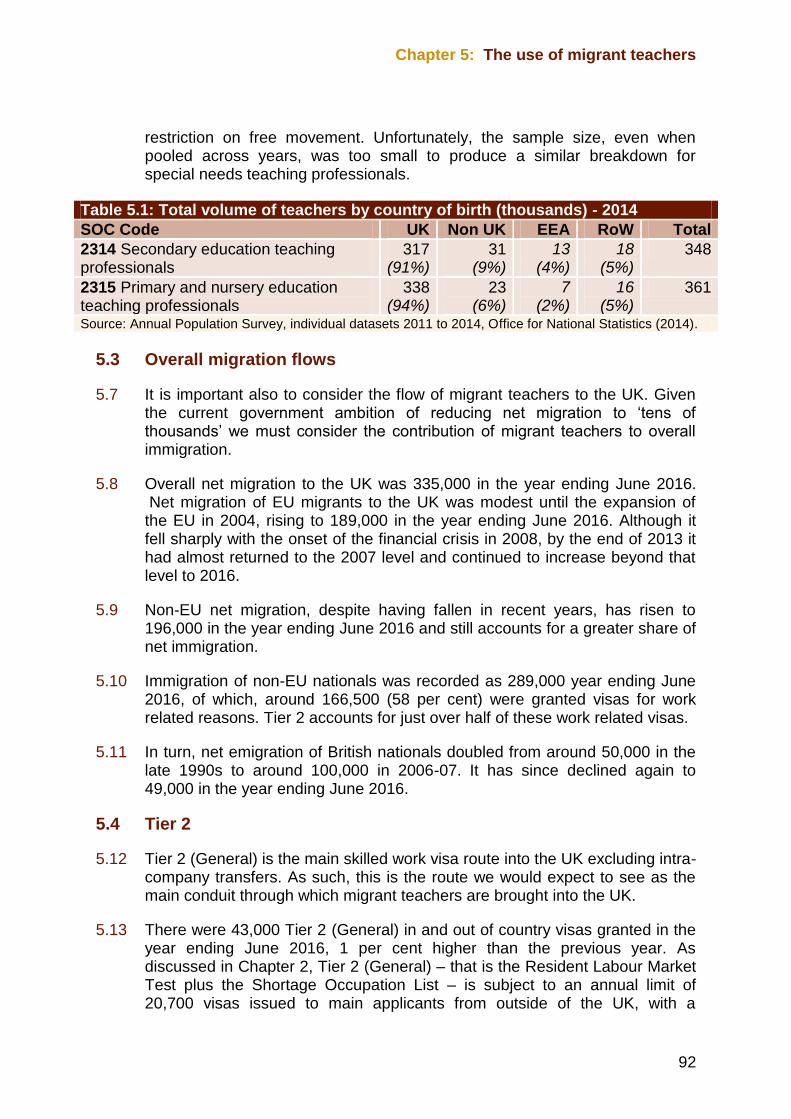
Chapter 5: The use of migrant teachers
92
restriction on free movement. Unfortunately, the sample size, even when pooled across years, was too small to produce a similar breakdown for special needs teaching professionals.
Table 5.1: Total volume of teachers by country of birth (thousands) - 2014
SOC Code UK Non UK EEA RoW Total
2314 Secondary education teaching professionals
317 (91%)
31 (9%)
13 (4%)
18 (5%)
348
2315 Primary and nursery education teaching professionals
338 (94%)
23 (6%)
7 (2%)
16 (5%)
361
Source: Annual Population Survey, individual datasets 2011 to 2014, Office for National Statistics (2014).
5.3 Overall migration flows
5.7 It is important also to consider the flow of migrant teachers to the UK. Given the current government ambition of reducing net migration to ‘tens of thousands’ we must consider the contribution of migrant teachers to overall immigration.
5.8 Overall net migration to the UK was 335,000 in the year ending June 2016. Net migration of EU migrants to the UK was modest until the expansion of the EU in 2004, rising to 189,000 in the year ending June 2016. Although it fell sharply with the onset of the financial crisis in 2008, by the end of 2013 it had almost returned to the 2007 level and continued to increase beyond that level to 2016.
5.9 Non-EU net migration, despite having fallen in recent years, has risen to 196,000 in the year ending June 2016 and still accounts for a greater share of net immigration.
5.10 Immigration of non-EU nationals was recorded as 289,000 year ending June 2016, of which, around 166,500 (58 per cent) were granted visas for work related reasons. Tier 2 accounts for just over half of these work related visas.
5.11 In turn, net emigration of British nationals doubled from around 50,000 in the late 1990s to around 100,000 in 2006-07. It has since declined again to 49,000 in the year ending June 2016.
5.4 Tier 2
5.12 Tier 2 (General) is the main skilled work visa route into the UK excluding intra-company transfers. As such, this is the route we would expect to see as the main conduit through which migrant teachers are brought into the UK.
5.13 There were 43,000 Tier 2 (General) in and out of country visas granted in the year ending June 2016, 1 per cent higher than the previous year. As discussed in Chapter 2, Tier 2 (General) – that is the Resident Labour Market Test plus the Shortage Occupation List – is subject to an annual limit of 20,700 visas issued to main applicants from outside of the UK, with a
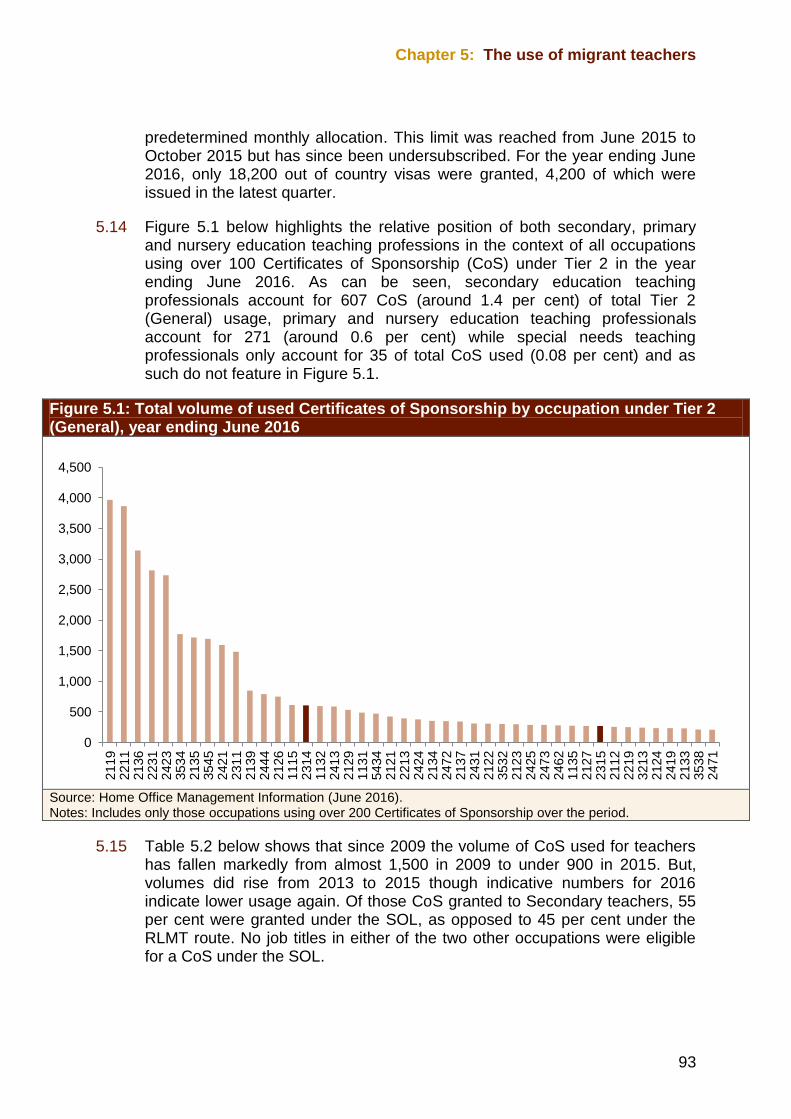
Chapter 5: The use of migrant teachers
93
predetermined monthly allocation. This limit was reached from June 2015 to October 2015 but has since been undersubscribed. For the year ending June 2016, only 18,200 out of country visas were granted, 4,200 of which were issued in the latest quarter.
5.14 Figure 5.1 below highlights the relative position of both secondary, primary and nursery education teaching professions in the context of all occupations using over 100 Certificates of Sponsorship (CoS) under Tier 2 in the year ending June 2016. As can be seen, secondary education teaching professionals account for 607 CoS (around 1.4 per cent) of total Tier 2 (General) usage, primary and nursery education teaching professionals account for 271 (around 0.6 per cent) while special needs teaching professionals only account for 35 of total CoS used (0.08 per cent) and as such do not feature in Figure 5.1.
Figure 5.1: Total volume of used Certificates of Sponsorship by occupation under Tier 2 (General), year ending June 2016
Source: Home Office Management Information (June 2016). Notes: Includes only those occupations using over 200 Certificates of Sponsorship over the period.
5.15 Table 5.2 below shows that since 2009 the volume of CoS used for teachers has fallen markedly from almost 1,500 in 2009 to under 900 in 2015. But, volumes did rise from 2013 to 2015 though indicative numbers for 2016 indicate lower usage again. Of those CoS granted to Secondary teachers, 55 per cent were granted under the SOL, as opposed to 45 per cent under the RLMT route. No job titles in either of the two other occupations were eligible for a CoS under the SOL.
0
500
1,000
1,500
2,000
2,500
3,000
3,500
4,000
4,500
2119
2211
2136
2231
2423
3534
2135
3545
2421
2311
2139
2444
2126
1115
2314
1132
2413
2129
1131
5434
2121
2213
2424
2134
2472
2137
2431
2122
3532
2123
2425
2473
2462
1135
2127
2315
2112
2219
3213
2124
2419
2133
3538
2471
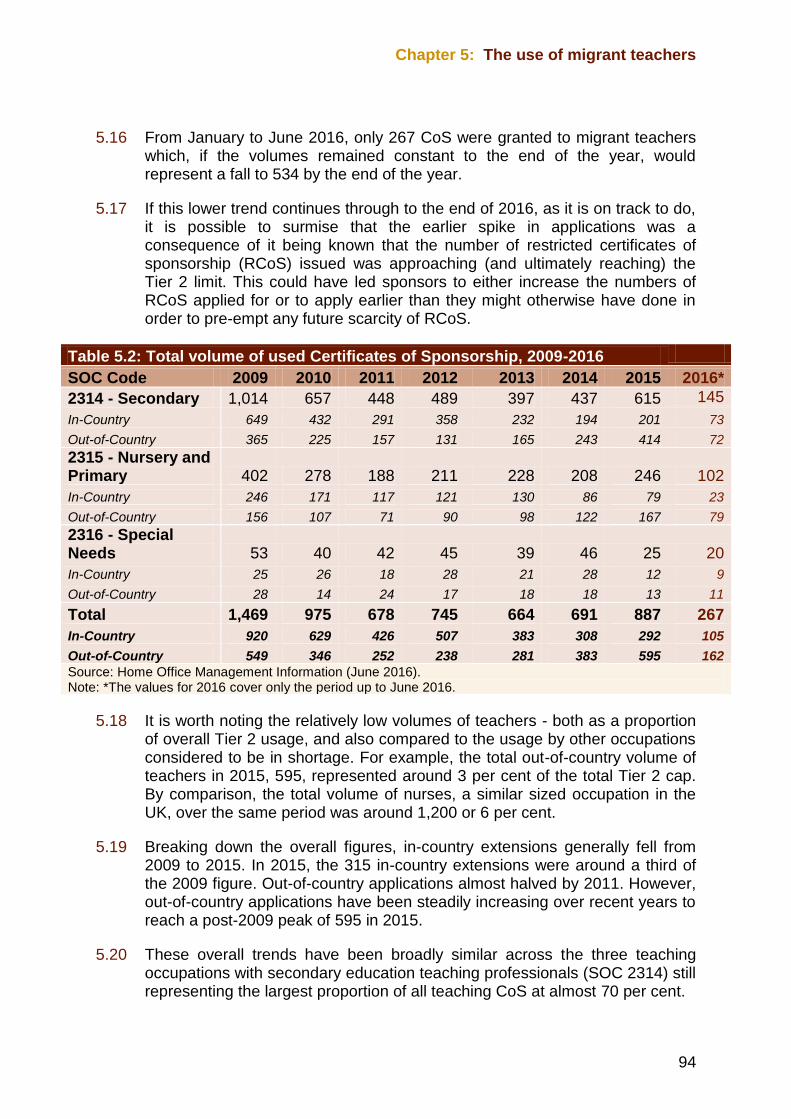
Chapter 5: The use of migrant teachers
94
5.16 From January to June 2016, only 267 CoS were granted to migrant teachers which, if the volumes remained constant to the end of the year, would represent a fall to 534 by the end of the year.
5.17 If this lower trend continues through to the end of 2016, as it is on track to do, it is possible to surmise that the earlier spike in applications was a consequence of it being known that the number of restricted certificates of sponsorship (RCoS) issued was approaching (and ultimately reaching) the Tier 2 limit. This could have led sponsors to either increase the numbers of RCoS applied for or to apply earlier than they might otherwise have done in order to pre-empt any future scarcity of RCoS.
Table 5.2: Total volume of used Certificates of Sponsorship, 2009-2016
SOC Code 2009 2010 2011 2012 2013 2014 2015 2016*
2314 - Secondary 1,014 657 448 489 397 437 615 145
In-Country 649 432 291 358 232 194 201 73
Out-of-Country 365 225 157 131 165 243 414 72
2315 - Nursery and Primary 402 278 188 211 228 208 246 102
In-Country 246 171 117 121 130 86 79 23
Out-of-Country 156 107 71 90 98 122 167 79
2316 - Special Needs 53 40 42 45 39 46 25 20
In-Country 25 26 18 28 21 28 12 9
Out-of-Country 28 14 24 17 18 18 13 11
Total 1,469 975 678 745 664 691 887 267
In-Country 920 629 426 507 383 308 292 105
Out-of-Country 549 346 252 238 281 383 595 162
Source: Home Office Management Information (June 2016). Note: *The values for 2016 cover only the period up to June 2016.
5.18 It is worth noting the relatively low volumes of teachers - both as a proportion of overall Tier 2 usage, and also compared to the usage by other occupations considered to be in shortage. For example, the total out-of-country volume of teachers in 2015, 595, represented around 3 per cent of the total Tier 2 cap. By comparison, the total volume of nurses, a similar sized occupation in the UK, over the same period was around 1,200 or 6 per cent.
5.19 Breaking down the overall figures, in-country extensions generally fell from 2009 to 2015. In 2015, the 315 in-country extensions were around a third of the 2009 figure. Out-of-country applications almost halved by 2011. However, out-of-country applications have been steadily increasing over recent years to reach a post-2009 peak of 595 in 2015.
5.20 These overall trends have been broadly similar across the three teaching occupations with secondary education teaching professionals (SOC 2314) still representing the largest proportion of all teaching CoS at almost 70 per cent.
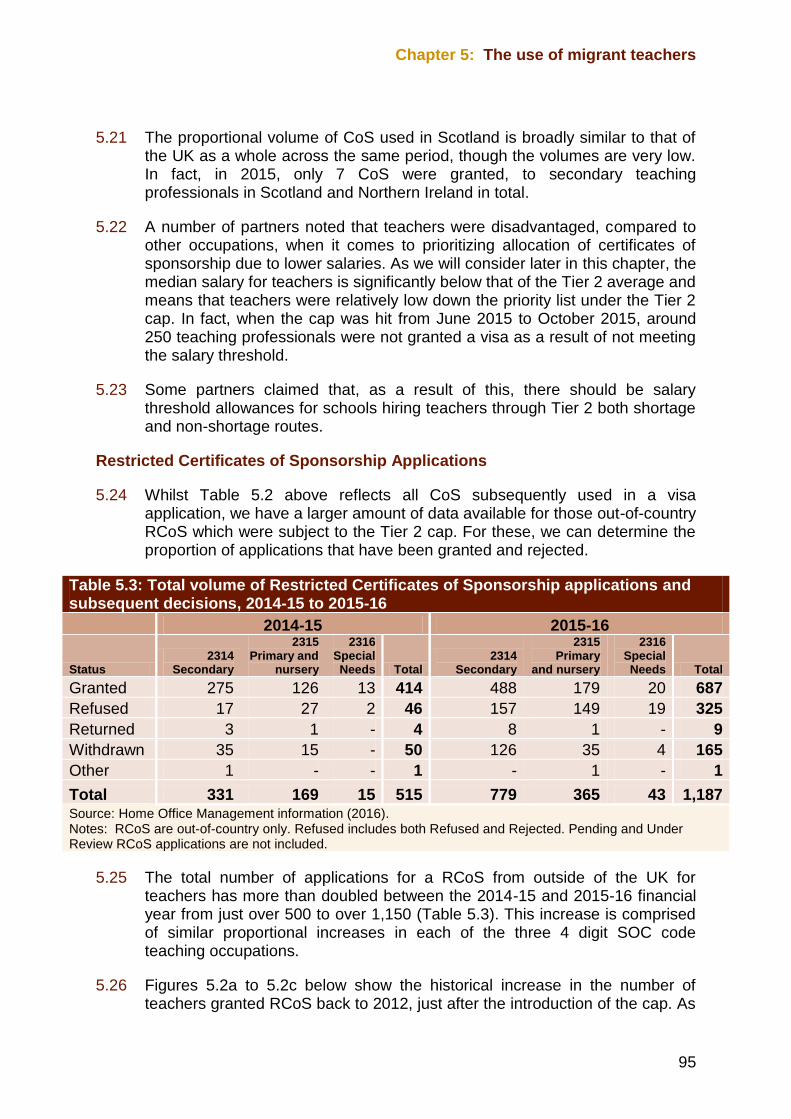
Chapter 5: The use of migrant teachers
95
5.21 The proportional volume of CoS used in Scotland is broadly similar to that of the UK as a whole across the same period, though the volumes are very low. In fact, in 2015, only 7 CoS were granted, to secondary teaching professionals in Scotland and Northern Ireland in total.
5.22 A number of partners noted that teachers were disadvantaged, compared to other occupations, when it comes to prioritizing allocation of certificates of sponsorship due to lower salaries. As we will consider later in this chapter, the median salary for teachers is significantly below that of the Tier 2 average and means that teachers were relatively low down the priority list under the Tier 2 cap. In fact, when the cap was hit from June 2015 to October 2015, around 250 teaching professionals were not granted a visa as a result of not meeting the salary threshold.
5.23 Some partners claimed that, as a result of this, there should be salary threshold allowances for schools hiring teachers through Tier 2 both shortage and non-shortage routes.
Restricted Certificates of Sponsorship Applications
5.24 Whilst Table 5.2 above reflects all CoS subsequently used in a visa application, we have a larger amount of data available for those out-of-country RCoS which were subject to the Tier 2 cap. For these, we can determine the proportion of applications that have been granted and rejected.
Table 5.3: Total volume of Restricted Certificates of Sponsorship applications and subsequent decisions, 2014-15 to 2015-16
2014-15 2015-16
Status 2314
Secondary
2315 Primary and
nursery
2316 Special Needs Total
2314 Secondary
2315 Primary
and nursery
2316 Special Needs Total
Granted 275 126 13 414 488 179 20 687
Refused 17 27 2 46 157 149 19 325
Returned 3 1 - 4 8 1 - 9
Withdrawn 35 15 - 50 126 35 4 165
Other 1 - - 1 - 1 - 1
Total 331 169 15 515 779 365 43 1,187 Source: Home Office Management information (2016). Notes: RCoS are out-of-country only. Refused includes both Refused and Rejected. Pending and Under Review RCoS applications are not included.
5.25 The total number of applications for a RCoS from outside of the UK for teachers has more than doubled between the 2014-15 and 2015-16 financial year from just over 500 to over 1,150 (Table 5.3). This increase is comprised of similar proportional increases in each of the three 4 digit SOC code teaching occupations.
5.26 Figures 5.2a to 5.2c below show the historical increase in the number of teachers granted RCoS back to 2012, just after the introduction of the cap. As
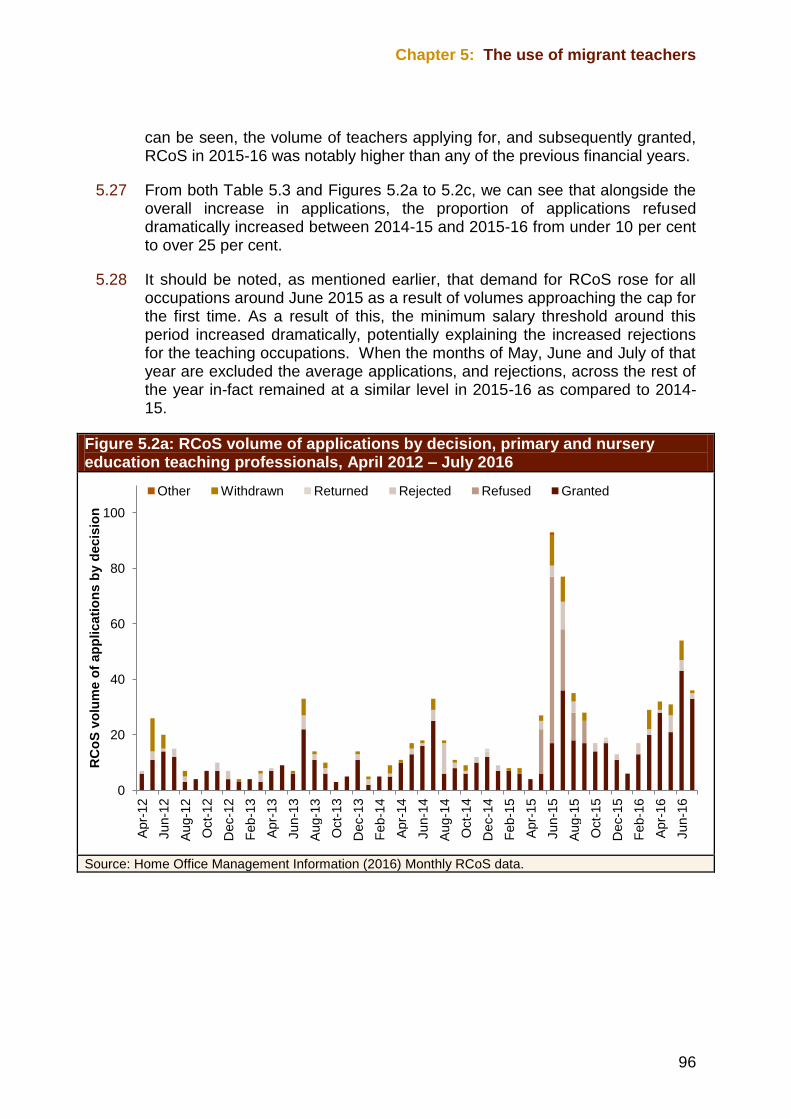
Chapter 5: The use of migrant teachers
96
can be seen, the volume of teachers applying for, and subsequently granted, RCoS in 2015-16 was notably higher than any of the previous financial years.
5.27 From both Table 5.3 and Figures 5.2a to 5.2c, we can see that alongside the overall increase in applications, the proportion of applications refused dramatically increased between 2014-15 and 2015-16 from under 10 per cent to over 25 per cent.
5.28 It should be noted, as mentioned earlier, that demand for RCoS rose for all occupations around June 2015 as a result of volumes approaching the cap for the first time. As a result of this, the minimum salary threshold around this period increased dramatically, potentially explaining the increased rejections for the teaching occupations. When the months of May, June and July of that year are excluded the average applications, and rejections, across the rest of the year in-fact remained at a similar level in 2015-16 as compared to 2014-15.
Figure 5.2a: RCoS volume of applications by decision, primary and nursery education teaching professionals, April 2012 – July 2016
Source: Home Office Management Information (2016) Monthly RCoS data.
0
20
40
60
80
100
Apr-
12
Jun-1
2
Aug-1
2
Oct-
12
Dec-1
2
Feb-1
3
Apr-
13
Jun-1
3
Aug-1
3
Oct-
13
Dec-1
3
Feb-1
4
Apr-
14
Jun-1
4
Aug-1
4
Oct-
14
Dec-1
4
Feb-1
5
Apr-
15
Jun-1
5
Aug-1
5
Oct-
15
Dec-1
5
Feb-1
6
Apr-
16
Jun-1
6
RC
oS
vo
lum
e o
f ap
plicati
on
s b
y d
ecis
ion
Other Withdrawn Returned Rejected Refused Granted
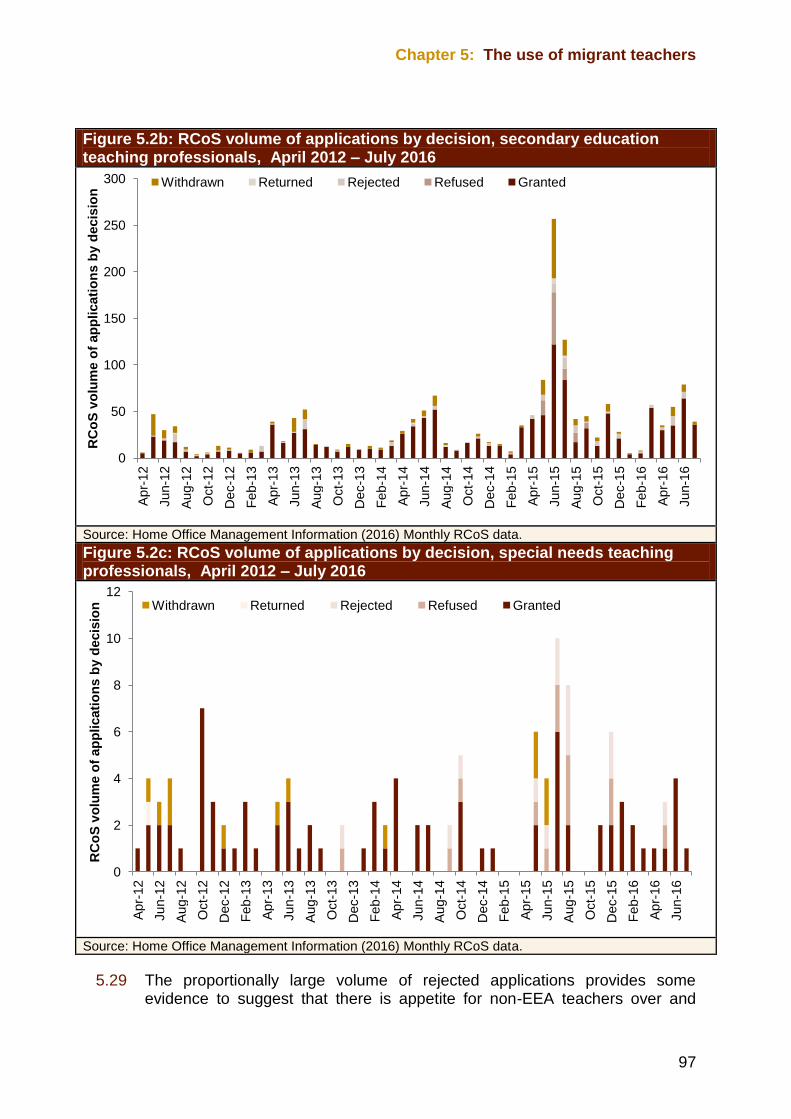
Chapter 5: The use of migrant teachers
97
Figure 5.2b: RCoS volume of applications by decision, secondary education teaching professionals, April 2012 – July 2016
Source: Home Office Management Information (2016) Monthly RCoS data.
Figure 5.2c: RCoS volume of applications by decision, special needs teaching professionals, April 2012 – July 2016
Source: Home Office Management Information (2016) Monthly RCoS data.
5.29 The proportionally large volume of rejected applications provides some evidence to suggest that there is appetite for non-EEA teachers over and
0
50
100
150
200
250
300
Apr-
12
Jun-1
2
Aug-1
2
Oct-
12
Dec-1
2
Fe
b-1
3
Apr-
13
Jun-1
3
Aug-1
3
Oct-
13
Dec-1
3
Feb-1
4
Apr-
14
Jun-1
4
Aug-1
4
Oct-
14
Dec-1
4
Feb-1
5
Apr-
15
Jun-1
5
Aug-1
5
Oct-
15
Dec-1
5
Feb-1
6
Apr-
16
Jun-1
6
RC
oS
vo
lum
e o
f ap
plicati
on
s b
y d
ecis
ion
Withdrawn Returned Rejected Refused Granted
0
2
4
6
8
10
12
Apr-
12
Jun-1
2
Aug-1
2
Oct-
12
Dec-1
2
Feb-1
3
Apr-
13
Jun-1
3
Aug-1
3
Oct-
13
Dec-1
3
Feb-1
4
Apr-
14
Jun-1
4
Aug-1
4
Oct-
14
Dec-1
4
Fe
b-1
5
Apr-
15
Jun-1
5
Aug-1
5
Oct-
15
Dec-1
5
Feb-1
6
Apr-
16
Jun-1
6
RC
oS
vo
lum
e o
f ap
plicati
on
s b
y d
ecis
ion
Withdrawn Returned Rejected Refused Granted

Chapter 5: The use of migrant teachers
98
above the total final flows shown below. However, given the fact that maths, physics and chemistry teachers are already present on the SOL and should receive priority over other applications, it is unlikely these rejected applications were for these subjects on the basis of pay. It is, however, possible that applications will have also been refused on the basis of irregularities in the applications or other factors.
5.5 Tier 5
In the course of our commission we found evidence that migrant teachers are being recruited not only through Tier 2, but also under the Tier 5 (Youth Mobility Scheme) route. Eligibility is restricted to a selection of countries including Canada, New Zealand and Australia and is limited to two years stay with no possibility of extension or settlement. Data from the ONS shows that 42,000 Tier 5 entry-clearance visas were granted in total in the year ending September 2016, down 7 per cent on the previous year.
5.30 Unlike Tier 2, visa applicants looking to undertake work under Tier 5 are not required to obtain sponsorship from prospective employers. Consequently the Home Office does not collect detailed Management Information on the breakdown of Tier 5 visas (for instance by job title or by employer name). Partners told us that teachers are brought to work in the UK under the Tier 5 route but, in the absence of any Home Office Management Information breaking down applications under this route, we are reliant upon information from partners in trying to establish a reasonable estimate of the usage of this route to bring teachers to work in the UK.
5.31 We therefore sought to get as much information as we could from partners about their usage of the Tier 5 route in order to form a view as to the actual likely scale of the number of teachers being brought to work in the UK in this way.
“The vast majority of schools will hire non-EEA teachers, from Australia, New Zealand and Canada due to the ability to gain Tier 5. Tier 2 will be the next option for these countries if the teacher does not qualify for Tier 5.”
Teacher recruitment agency response to MAC Call for Evidence
5.32 One teacher recruitment agency provided us with their internal data on the number of migrant teachers (EEA and non-EEA) registered between 2000-01 and 2015-16 who entered under different visa routes.
5.33 Data provided by this recruitment agency showed approximately 30 per cent came into the UK under an EU entitlement, 10 per cent via Tier 2 and 46 per cent via Tier 5 or the previous Working Holiday visa (WHV), in total between 2000 and July 2016.
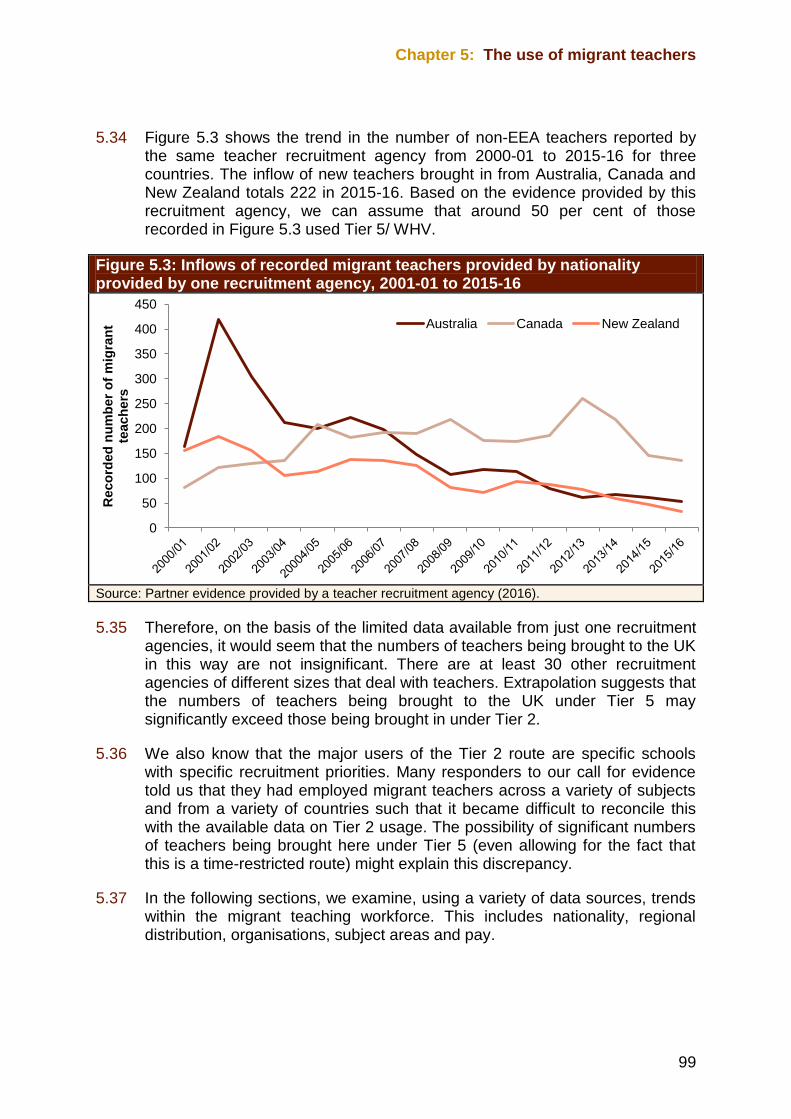
Chapter 5: The use of migrant teachers
99
5.34 Figure 5.3 shows the trend in the number of non-EEA teachers reported by the same teacher recruitment agency from 2000-01 to 2015-16 for three countries. The inflow of new teachers brought in from Australia, Canada and New Zealand totals 222 in 2015-16. Based on the evidence provided by this recruitment agency, we can assume that around 50 per cent of those recorded in Figure 5.3 used Tier 5/ WHV.
Figure 5.3: Inflows of recorded migrant teachers provided by nationality provided by one recruitment agency, 2001-01 to 2015-16
Source: Partner evidence provided by a teacher recruitment agency (2016).
5.35 Therefore, on the basis of the limited data available from just one recruitment agencies, it would seem that the numbers of teachers being brought to the UK in this way are not insignificant. There are at least 30 other recruitment agencies of different sizes that deal with teachers. Extrapolation suggests that the numbers of teachers being brought to the UK under Tier 5 may significantly exceed those being brought in under Tier 2.
5.36 We also know that the major users of the Tier 2 route are specific schools with specific recruitment priorities. Many responders to our call for evidence told us that they had employed migrant teachers across a variety of subjects and from a variety of countries such that it became difficult to reconcile this with the available data on Tier 2 usage. The possibility of significant numbers of teachers being brought here under Tier 5 (even allowing for the fact that this is a time-restricted route) might explain this discrepancy.
5.37 In the following sections, we examine, using a variety of data sources, trends within the migrant teaching workforce. This includes nationality, regional distribution, organisations, subject areas and pay.
0
50
100
150
200
250
300
350
400
450
Reco
rded
nu
mb
er
of
mig
ran
t te
ach
ers
Australia Canada New Zealand
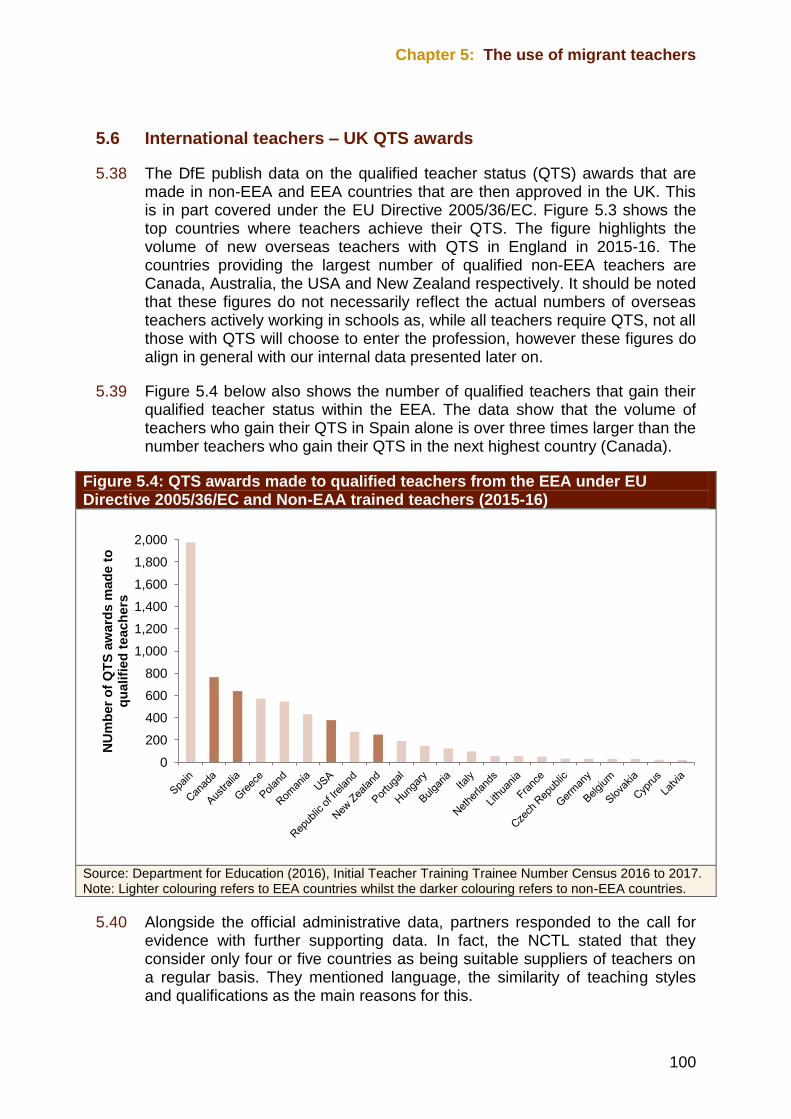
Chapter 5: The use of migrant teachers
100
5.6 International teachers – UK QTS awards
5.38 The DfE publish data on the qualified teacher status (QTS) awards that are made in non-EEA and EEA countries that are then approved in the UK. This is in part covered under the EU Directive 2005/36/EC. Figure 5.3 shows the top countries where teachers achieve their QTS. The figure highlights the volume of new overseas teachers with QTS in England in 2015-16. The countries providing the largest number of qualified non-EEA teachers are Canada, Australia, the USA and New Zealand respectively. It should be noted that these figures do not necessarily reflect the actual numbers of overseas teachers actively working in schools as, while all teachers require QTS, not all those with QTS will choose to enter the profession, however these figures do align in general with our internal data presented later on.
5.39 Figure 5.4 below also shows the number of qualified teachers that gain their qualified teacher status within the EEA. The data show that the volume of teachers who gain their QTS in Spain alone is over three times larger than the number teachers who gain their QTS in the next highest country (Canada).
Figure 5.4: QTS awards made to qualified teachers from the EEA under EU Directive 2005/36/EC and Non-EAA trained teachers (2015-16)
Source: Department for Education (2016), Initial Teacher Training Trainee Number Census 2016 to 2017. Note: Lighter colouring refers to EEA countries whilst the darker colouring refers to non-EEA countries.
5.40 Alongside the official administrative data, partners responded to the call for evidence with further supporting data. In fact, the NCTL stated that they consider only four or five countries as being suitable suppliers of teachers on a regular basis. They mentioned language, the similarity of teaching styles and qualifications as the main reasons for this.
0
200
400
600
800
1,000
1,200
1,400
1,600
1,800
2,000
NU
mb
er
of
QT
S a
ward
s m
ad
e t
o
qu
alifi
ed
teach
ers
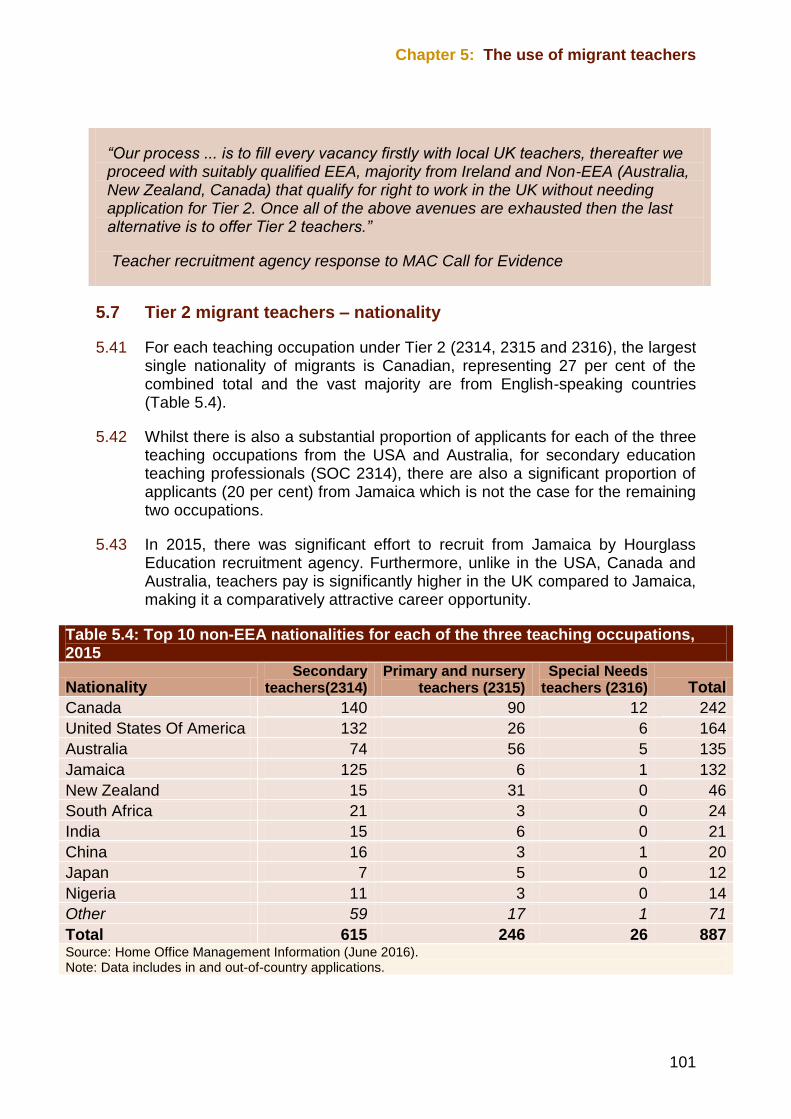
Chapter 5: The use of migrant teachers
101
“Our process ... is to fill every vacancy firstly with local UK teachers, thereafter we proceed with suitably qualified EEA, majority from Ireland and Non-EEA (Australia, New Zealand, Canada) that qualify for right to work in the UK without needing application for Tier 2. Once all of the above avenues are exhausted then the last alternative is to offer Tier 2 teachers.”
Teacher recruitment agency response to MAC Call for Evidence
5.7 Tier 2 migrant teachers – nationality
5.41 For each teaching occupation under Tier 2 (2314, 2315 and 2316), the largest single nationality of migrants is Canadian, representing 27 per cent of the combined total and the vast majority are from English-speaking countries (Table 5.4).
5.42 Whilst there is also a substantial proportion of applicants for each of the three teaching occupations from the USA and Australia, for secondary education teaching professionals (SOC 2314), there are also a significant proportion of applicants (20 per cent) from Jamaica which is not the case for the remaining two occupations.
5.43 In 2015, there was significant effort to recruit from Jamaica by Hourglass Education recruitment agency. Furthermore, unlike in the USA, Canada and Australia, teachers pay is significantly higher in the UK compared to Jamaica, making it a comparatively attractive career opportunity.
Table 5.4: Top 10 non-EEA nationalities for each of the three teaching occupations, 2015
Nationality Secondary
teachers(2314) Primary and nursery
teachers (2315) Special Needs
teachers (2316) Total
Canada 140 90 12 242
United States Of America 132 26 6 164
Australia 74 56 5 135
Jamaica 125 6 1 132
New Zealand 15 31 0 46
South Africa 21 3 0 24
India 15 6 0 21
China 16 3 1 20
Japan 7 5 0 12
Nigeria 11 3 0 14
Other 59 17 1 71
Total 615 246 26 887 Source: Home Office Management Information (June 2016). Note: Data includes in and out-of-country applications.
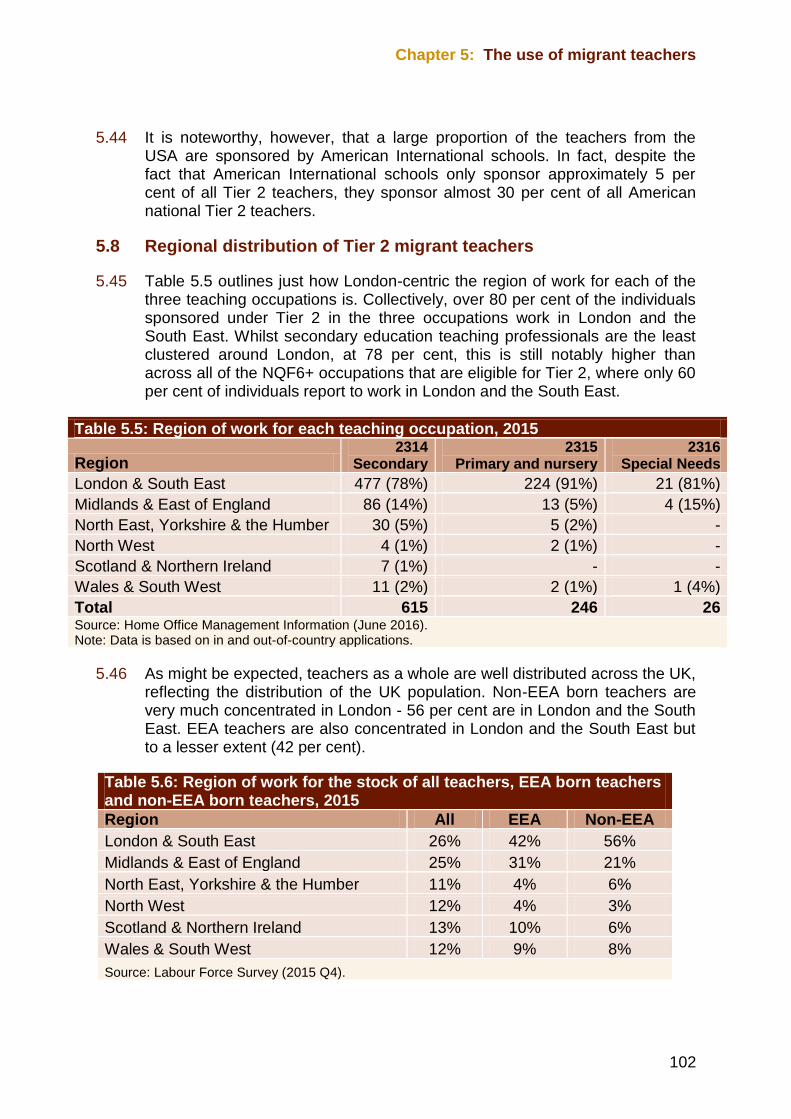
Chapter 5: The use of migrant teachers
102
5.44 It is noteworthy, however, that a large proportion of the teachers from the USA are sponsored by American International schools. In fact, despite the fact that American International schools only sponsor approximately 5 per cent of all Tier 2 teachers, they sponsor almost 30 per cent of all American national Tier 2 teachers.
5.8 Regional distribution of Tier 2 migrant teachers
5.45 Table 5.5 outlines just how London-centric the region of work for each of the three teaching occupations is. Collectively, over 80 per cent of the individuals sponsored under Tier 2 in the three occupations work in London and the South East. Whilst secondary education teaching professionals are the least clustered around London, at 78 per cent, this is still notably higher than across all of the NQF6+ occupations that are eligible for Tier 2, where only 60 per cent of individuals report to work in London and the South East.
Table 5.5: Region of work for each teaching occupation, 2015
Region 2314
Secondary 2315
Primary and nursery 2316
Special Needs
London & South East 477 (78%) 224 (91%) 21 (81%)
Midlands & East of England 86 (14%) 13 (5%) 4 (15%)
North East, Yorkshire & the Humber 30 (5%) 5 (2%) -
North West 4 (1%) 2 (1%) -
Scotland & Northern Ireland 7 (1%) - -
Wales & South West 11 (2%) 2 (1%) 1 (4%)
Total 615 246 26 Source: Home Office Management Information (June 2016). Note: Data is based on in and out-of-country applications.
5.46 As might be expected, teachers as a whole are well distributed across the UK, reflecting the distribution of the UK population. Non-EEA born teachers are very much concentrated in London - 56 per cent are in London and the South East. EEA teachers are also concentrated in London and the South East but to a lesser extent (42 per cent).
Table 5.6: Region of work for the stock of all teachers, EEA born teachers and non-EEA born teachers, 2015
Region All EEA Non-EEA
London & South East 26% 42% 56%
Midlands & East of England 25% 31% 21%
North East, Yorkshire & the Humber 11% 4% 6%
North West 12% 4% 3%
Scotland & Northern Ireland 13% 10% 6%
Wales & South West 12% 9% 8%
Source: Labour Force Survey (2015 Q4).
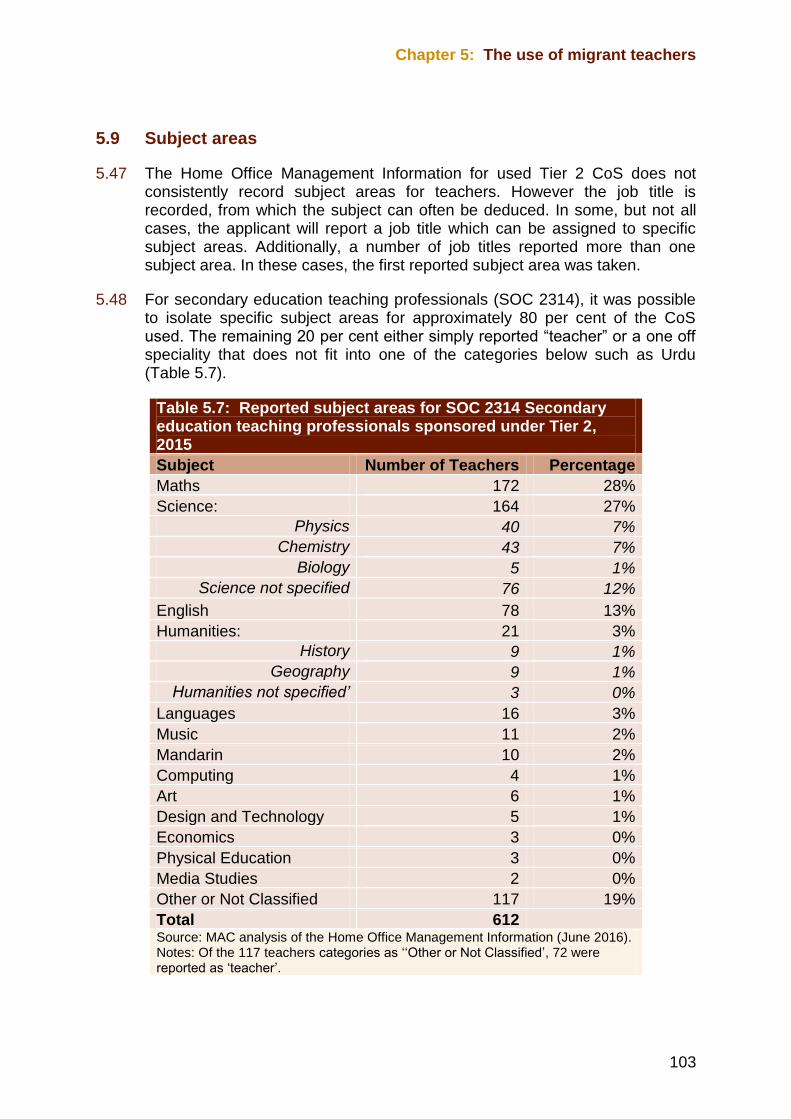
Chapter 5: The use of migrant teachers
103
5.9 Subject areas
5.47 The Home Office Management Information for used Tier 2 CoS does not consistently record subject areas for teachers. However the job title is recorded, from which the subject can often be deduced. In some, but not all cases, the applicant will report a job title which can be assigned to specific subject areas. Additionally, a number of job titles reported more than one subject area. In these cases, the first reported subject area was taken.
5.48 For secondary education teaching professionals (SOC 2314), it was possible to isolate specific subject areas for approximately 80 per cent of the CoS used. The remaining 20 per cent either simply reported “teacher” or a one off speciality that does not fit into one of the categories below such as Urdu (Table 5.7).
Table 5.7: Reported subject areas for SOC 2314 Secondary education teaching professionals sponsored under Tier 2, 2015
Subject Number of Teachers Percentage
Maths 172 28%
Science: 164 27%
Physics 40 7%
Chemistry 43 7%
Biology 5 1%
Science not specified 76 12%
English 78 13%
Humanities: 21 3%
History 9 1%
Geography 9 1%
Humanities not specified’ 3 0%
Languages 16 3%
Music 11 2%
Mandarin 10 2%
Computing 4 1%
Art 6 1%
Design and Technology 5 1%
Economics 3 0%
Physical Education 3 0%
Media Studies 2 0%
Other or Not Classified 117 19%
Total 612 Source: MAC analysis of the Home Office Management Information (June 2016).
Notes: Of the 117 teachers categories as ‘‘Other or Not Classified’, 72 were reported as ‘teacher’.
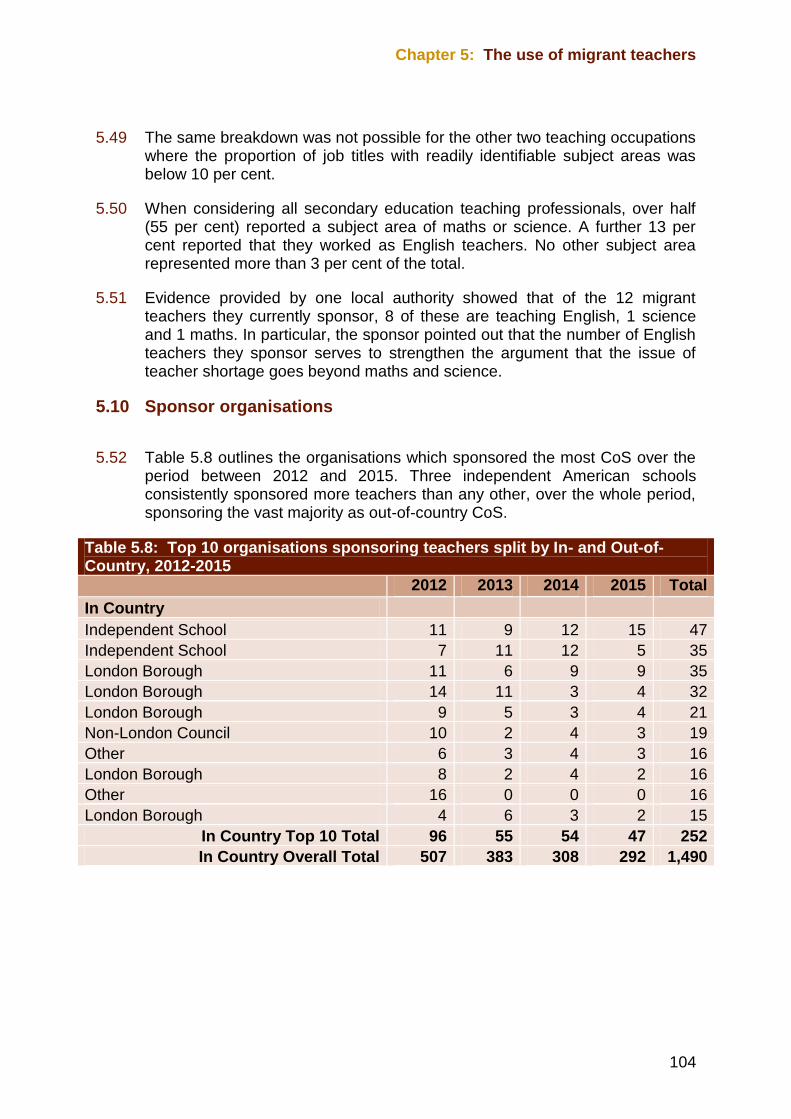
Chapter 5: The use of migrant teachers
104
5.49 The same breakdown was not possible for the other two teaching occupations where the proportion of job titles with readily identifiable subject areas was below 10 per cent.
5.50 When considering all secondary education teaching professionals, over half (55 per cent) reported a subject area of maths or science. A further 13 per cent reported that they worked as English teachers. No other subject area represented more than 3 per cent of the total.
5.51 Evidence provided by one local authority showed that of the 12 migrant teachers they currently sponsor, 8 of these are teaching English, 1 science and 1 maths. In particular, the sponsor pointed out that the number of English teachers they sponsor serves to strengthen the argument that the issue of teacher shortage goes beyond maths and science.
5.10 Sponsor organisations
5.52 Table 5.8 outlines the organisations which sponsored the most CoS over the period between 2012 and 2015. Three independent American schools consistently sponsored more teachers than any other, over the whole period, sponsoring the vast majority as out-of-country CoS.
Table 5.8: Top 10 organisations sponsoring teachers split by In- and Out-of-Country, 2012-2015
2012 2013 2014 2015 Total
In Country Independent School 11 9 12 15 47
Independent School 7 11 12 5 35
London Borough 11 6 9 9 35
London Borough 14 11 3 4 32
London Borough 9 5 3 4 21
Non-London Council 10 2 4 3 19
Other 6 3 4 3 16
London Borough 8 2 4 2 16
Other 16 0 0 0 16
London Borough 4 6 3 2 15
In Country Top 10 Total 96 55 54 47 252
In Country Overall Total 507 383 308 292 1,490
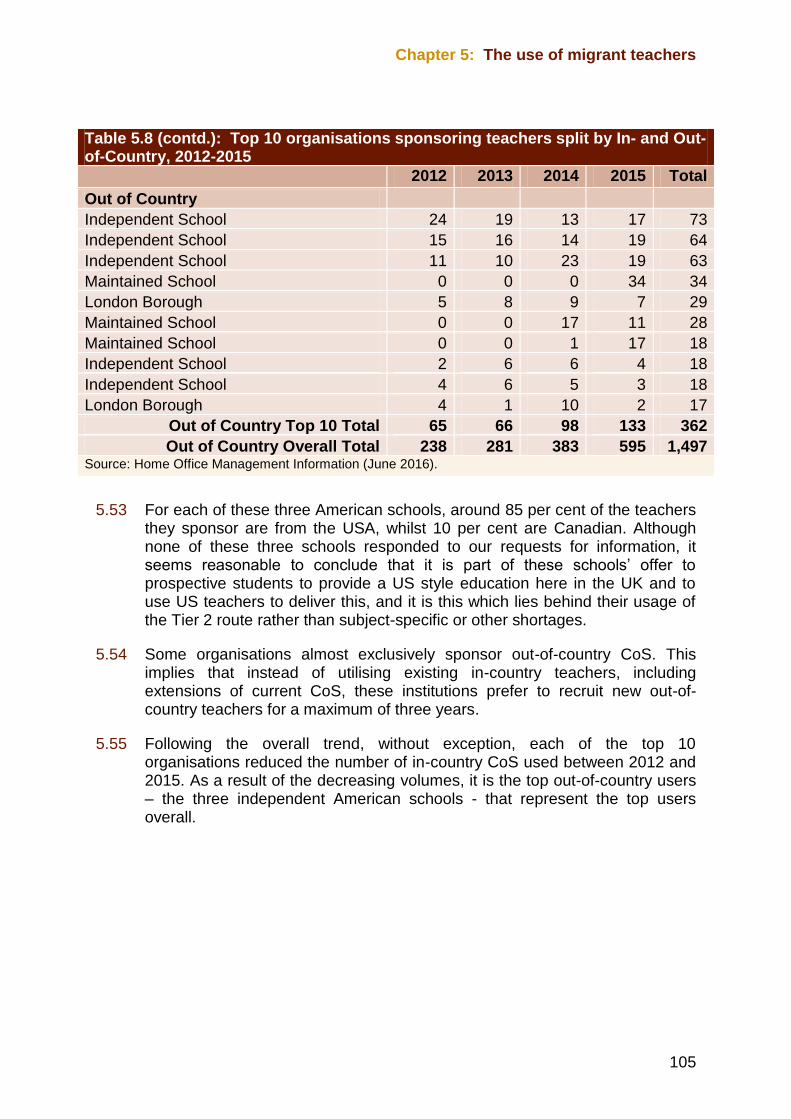
Chapter 5: The use of migrant teachers
105
Table 5.8 (contd.): Top 10 organisations sponsoring teachers split by In- and Out-of-Country, 2012-2015
2012 2013 2014 2015 Total
Out of Country Independent School 24 19 13 17 73
Independent School 15 16 14 19 64
Independent School 11 10 23 19 63
Maintained School 0 0 0 34 34
London Borough 5 8 9 7 29
Maintained School 0 0 17 11 28
Maintained School 0 0 1 17 18
Independent School 2 6 6 4 18
Independent School 4 6 5 3 18
London Borough 4 1 10 2 17
Out of Country Top 10 Total 65 66 98 133 362
Out of Country Overall Total 238 281 383 595 1,497 Source: Home Office Management Information (June 2016).
5.53 For each of these three American schools, around 85 per cent of the teachers they sponsor are from the USA, whilst 10 per cent are Canadian. Although none of these three schools responded to our requests for information, it seems reasonable to conclude that it is part of these schools’ offer to prospective students to provide a US style education here in the UK and to use US teachers to deliver this, and it is this which lies behind their usage of the Tier 2 route rather than subject-specific or other shortages.
5.54 Some organisations almost exclusively sponsor out-of-country CoS. This implies that instead of utilising existing in-country teachers, including extensions of current CoS, these institutions prefer to recruit new out-of-country teachers for a maximum of three years.
5.55 Following the overall trend, without exception, each of the top 10 organisations reduced the number of in-country CoS used between 2012 and 2015. As a result of the decreasing volumes, it is the top out-of-country users – the three independent American schools - that represent the top users overall.
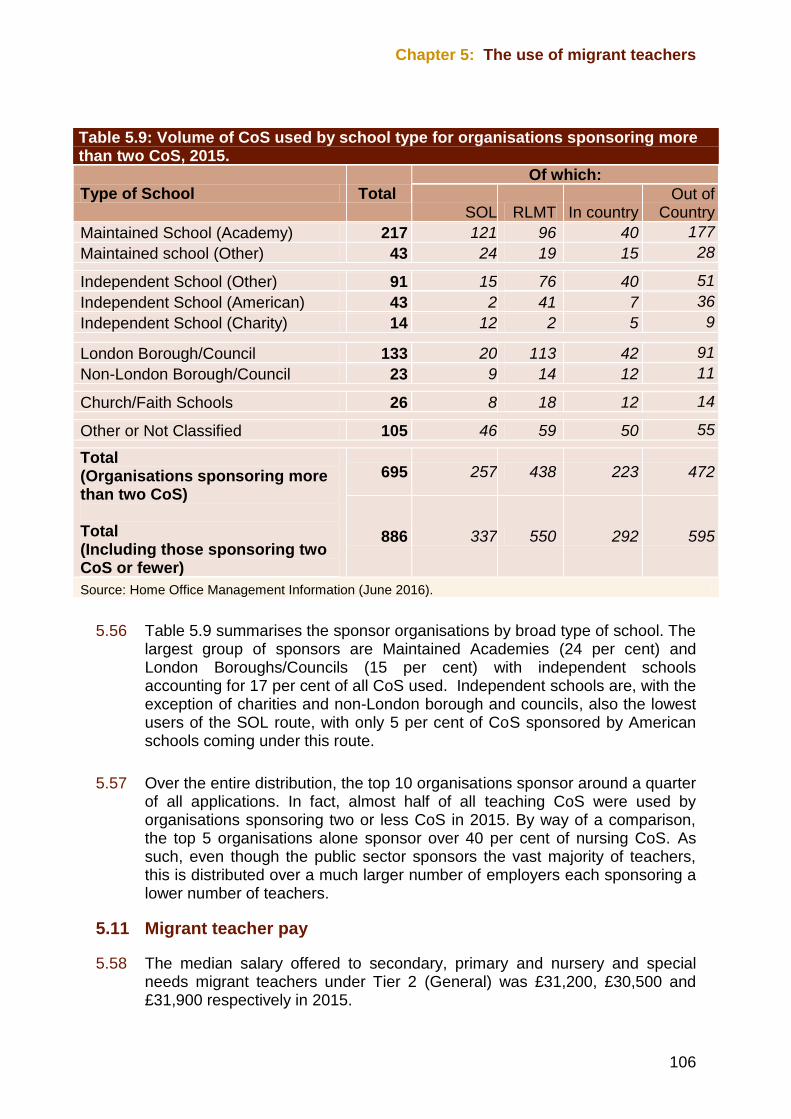
Chapter 5: The use of migrant teachers
106
Table 5.9: Volume of CoS used by school type for organisations sponsoring more than two CoS, 2015.
Type of School Total
Of which:
SOL RLMT
In country Out of
Country
Maintained School (Academy) 217 121 96 40 177
Maintained school (Other) 43 24 19 15 28
Independent School (Other) 91 15 76 40 51
Independent School (American) 43 2 41 7 36
Independent School (Charity) 14 12 2 5 9
London Borough/Council 133 20 113 42 91
Non-London Borough/Council 23 9 14 12 11
Church/Faith Schools 26 8 18 12 14
Other or Not Classified 105 46 59 50 55
Total (Organisations sponsoring more than two CoS) Total (Including those sponsoring two CoS or fewer)
695 257 438 223 472
886 337 550 292 595
Source: Home Office Management Information (June 2016).
5.56 Table 5.9 summarises the sponsor organisations by broad type of school. The largest group of sponsors are Maintained Academies (24 per cent) and London Boroughs/Councils (15 per cent) with independent schools accounting for 17 per cent of all CoS used. Independent schools are, with the exception of charities and non-London borough and councils, also the lowest users of the SOL route, with only 5 per cent of CoS sponsored by American schools coming under this route.
5.57 Over the entire distribution, the top 10 organisations sponsor around a quarter of all applications. In fact, almost half of all teaching CoS were used by organisations sponsoring two or less CoS in 2015. By way of a comparison, the top 5 organisations alone sponsor over 40 per cent of nursing CoS. As such, even though the public sector sponsors the vast majority of teachers, this is distributed over a much larger number of employers each sponsoring a lower number of teachers.
5.11 Migrant teacher pay
5.58 The median salary offered to secondary, primary and nursery and special needs migrant teachers under Tier 2 (General) was £31,200, £30,500 and £31,900 respectively in 2015.
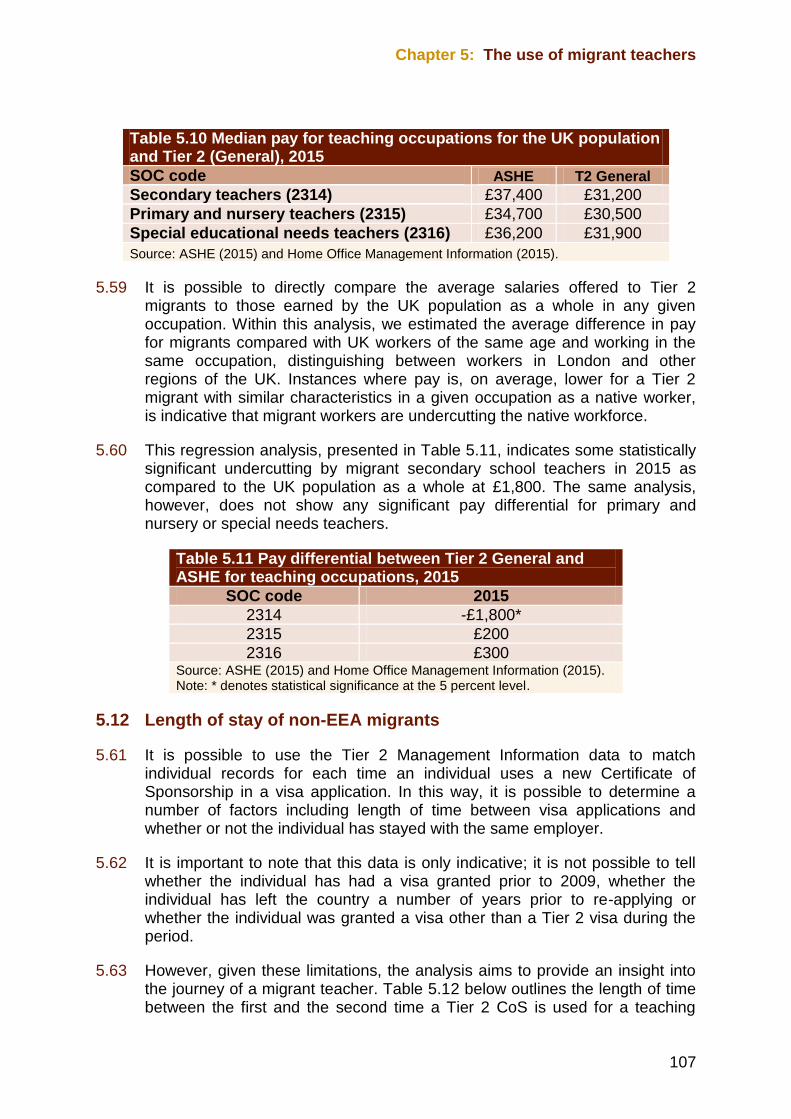
Chapter 5: The use of migrant teachers
107
Table 5.10 Median pay for teaching occupations for the UK population and Tier 2 (General), 2015
SOC code ASHE T2 General
Secondary teachers (2314) £37,400 £31,200
Primary and nursery teachers (2315) £34,700 £30,500
Special educational needs teachers (2316) £36,200 £31,900
Source: ASHE (2015) and Home Office Management Information (2015).
5.59 It is possible to directly compare the average salaries offered to Tier 2 migrants to those earned by the UK population as a whole in any given occupation. Within this analysis, we estimated the average difference in pay for migrants compared with UK workers of the same age and working in the same occupation, distinguishing between workers in London and other regions of the UK. Instances where pay is, on average, lower for a Tier 2 migrant with similar characteristics in a given occupation as a native worker, is indicative that migrant workers are undercutting the native workforce.
5.60 This regression analysis, presented in Table 5.11, indicates some statistically significant undercutting by migrant secondary school teachers in 2015 as compared to the UK population as a whole at £1,800. The same analysis, however, does not show any significant pay differential for primary and nursery or special needs teachers.
Table 5.11 Pay differential between Tier 2 General and ASHE for teaching occupations, 2015
SOC code 2015
2314 -£1,800*
2315 £200
2316 £300 Source: ASHE (2015) and Home Office Management Information (2015). Note: * denotes statistical significance at the 5 percent level.
5.12 Length of stay of non-EEA migrants
5.61 It is possible to use the Tier 2 Management Information data to match individual records for each time an individual uses a new Certificate of Sponsorship in a visa application. In this way, it is possible to determine a number of factors including length of time between visa applications and whether or not the individual has stayed with the same employer.
5.62 It is important to note that this data is only indicative; it is not possible to tell whether the individual has had a visa granted prior to 2009, whether the individual has left the country a number of years prior to re-applying or whether the individual was granted a visa other than a Tier 2 visa during the period.
5.63 However, given these limitations, the analysis aims to provide an insight into the journey of a migrant teacher. Table 5.12 below outlines the length of time between the first and the second time a Tier 2 CoS is used for a teaching
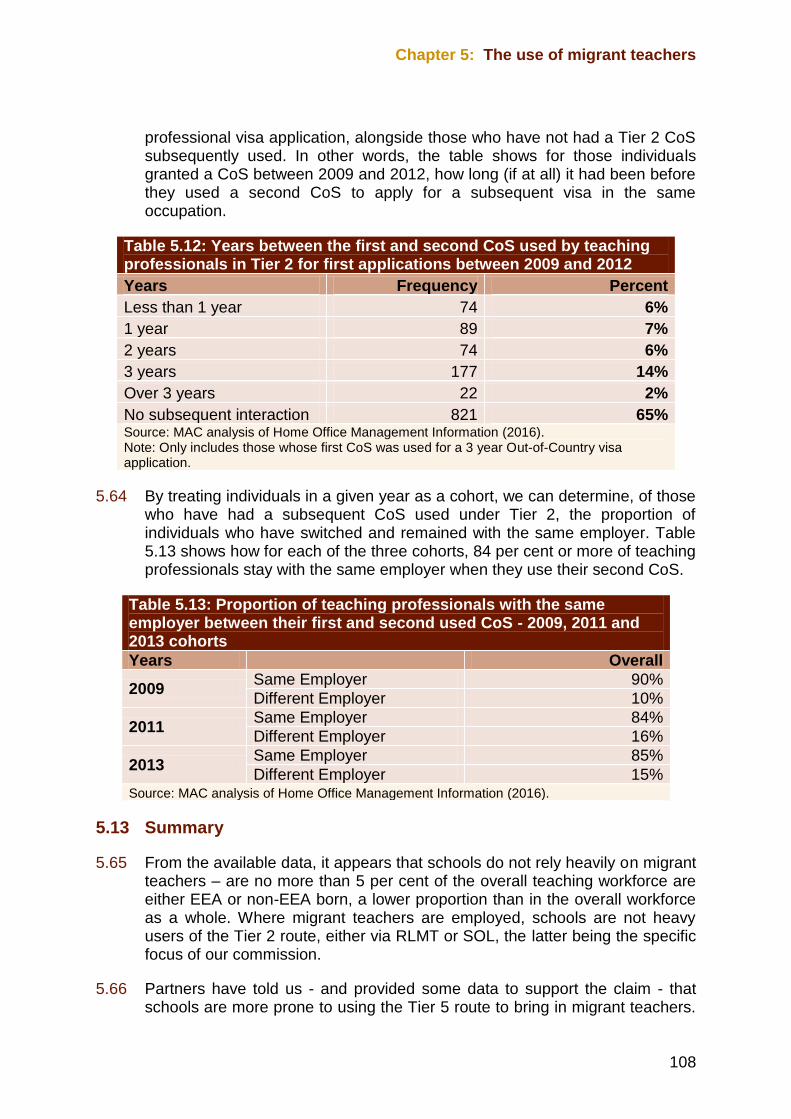
Chapter 5: The use of migrant teachers
108
professional visa application, alongside those who have not had a Tier 2 CoS subsequently used. In other words, the table shows for those individuals granted a CoS between 2009 and 2012, how long (if at all) it had been before they used a second CoS to apply for a subsequent visa in the same occupation.
Table 5.12: Years between the first and second CoS used by teaching professionals in Tier 2 for first applications between 2009 and 2012
Years Frequency Percent
Less than 1 year 74 6%
1 year 89 7%
2 years 74 6%
3 years 177 14%
Over 3 years 22 2%
No subsequent interaction 821 65% Source: MAC analysis of Home Office Management Information (2016). Note: Only includes those whose first CoS was used for a 3 year Out-of-Country visa application.
5.64 By treating individuals in a given year as a cohort, we can determine, of those who have had a subsequent CoS used under Tier 2, the proportion of individuals who have switched and remained with the same employer. Table 5.13 shows how for each of the three cohorts, 84 per cent or more of teaching professionals stay with the same employer when they use their second CoS.
Table 5.13: Proportion of teaching professionals with the same employer between their first and second used CoS - 2009, 2011 and 2013 cohorts
Years
Overall
2009 Same Employer 90%
Different Employer 10%
2011 Same Employer 84%
Different Employer 16%
2013 Same Employer 85%
Different Employer 15% Source: MAC analysis of Home Office Management Information (2016).
5.13 Summary
5.65 From the available data, it appears that schools do not rely heavily on migrant teachers – are no more than 5 per cent of the overall teaching workforce are either EEA or non-EEA born, a lower proportion than in the overall workforce as a whole. Where migrant teachers are employed, schools are not heavy users of the Tier 2 route, either via RLMT or SOL, the latter being the specific focus of our commission.
5.66 Partners have told us - and provided some data to support the claim - that schools are more prone to using the Tier 5 route to bring in migrant teachers.
Chapter 5: The use of migrant teachers
109
Unfortunately the Home Office data on this route does not provide the occupational breakdown for us to fully quantify this. It is worth considering later in this report how any proposed changes to the Shortage Occupation List within Tier 2 could interact with the current usage within Tier 5.
5.67 Of those that are brought in, migrant teachers are more likely to work in London and the South East and tend to be from Canada, the USA, Australia and New Zealand. Although the main individual users are all Independent Schools, as a whole, academies and London local authorities sponsor the largest volume of migrant teachers.
5.68 In addition, whilst we can use job titles to estimate the fact that maths, science and English teachers are the three most used subject areas within Tier 2 for secondary school teachers, it may be helpful to record this in more detail within the Home Office MI should only specific subjects be added to the SOL.

111
Chapter 6 Is there a shortage of teachers?
6.1 Introduction
6.1 Chapter 6 summarises our findings on whether teachers are in shortage by setting out the available data presented in Chapters 4 and 5. We set out the data on shortage that enables different pieces of evidence to be assessed against each other. This is then used to indicate those areas where teachers may be most demonstrably said to be in shortage. We first discuss teacher shortages at an occupation level follow by teachers by subject.
6.2 Teacher shortages at an occupational level
6.2 The top down indicators of shortage across the three teacher SOC codes do not show sufficient evidence to conclude that these are in shortage at the occupation level. Secondary education teaching professionals (SOC 2314) did not pass any of our nine available indicators. Primary and nursery education teaching professionals (SOC 2315) passed one of the volume based indicators: the percentage change in median paid hours worked over three years; and special needs education professionals (SOC 2316) passed three indicators: the percentage change in median paid hours worked over three years, the percentage change in the employment level and the change in new hires. None of the SOC codes passed any of our other occupational shortage indicators.
6.3 As stated in Chapter 4, the vacancy rate in the education sector was 1.8 per cent compared to an average of 2.6 per cent across all sectors in July 2016. The data from the Employer Skill Survey (2015) show that the vacancy rate for nursery and primary teachers was 2 per cent and for secondary teachers and teachers in special schools it was estimated at 1 per cent. This places these teaching occupations in the middle and towards the end of the distribution of vacancy rates for professional occupations. These rates are not, of themselves, indicative of shortage.
6.3 Teacher shortages by subject
6.4 Our approach to assess teacher shortage by subject is displayed in Table 6.1 below. This is followed by a section which takes each subject in turn and critically assesses the extent to which the available evidence is indicative of
Chapter 6 Is there a shortage of teachers?

Chapter 6: Is there a shortage of teachers?
112
subject specific shortage of teachers. The key areas focussed on for each subject are:
The average vacancy rate and the percentage point change from 2012 to 2015.
The number of advertised job postings as a proportion of the number of teachers by subject.
The average difficulty in recruiting a teacher estimated by TES.
The number of teachers recruited measured against Department for Education (DfE) and Scottish Government initial teacher training (ITT) targets.
The proportion of teachers without a relevant post A-level subject qualification.
Home Office management information on the numbers of certificates of sponsorship (CoS) issued in regard of teachers from outside of the European Economic Area (EEA).
The proportion of graduates required to meet ITT targets – referred to as the recruitment rate from the degree pool.
The average pay for professionals who entered teaching in comparison with that of professionals who graduated in the same subject but entered a different occupation.
6.5 If we conclude that a subject is in shortage then we consider in the following chapter whether it is sensible to recruit migrants from outside the EEA to fill these shortages. If a subject is not in shortage, then we do not consider it further.
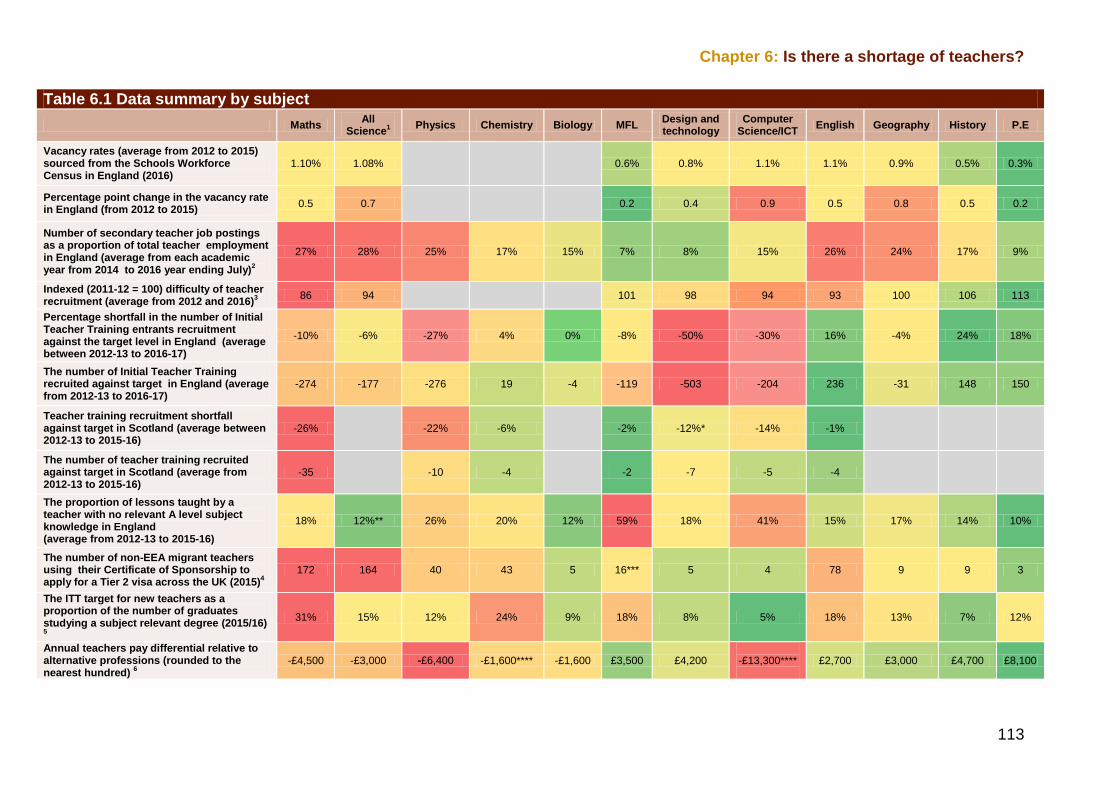
Chapter 6: Is there a shortage of teachers?
113
Table 6.1 Data summary by subject
Maths All
Science1
Physics Chemistry Biology MFL Design and technology
Computer Science/ICT
English Geography History P.E
Vacancy rates (average from 2012 to 2015) sourced from the Schools Workforce Census in England (2016)
1.10% 1.08%
0.6% 0.8% 1.1% 1.1% 0.9% 0.5% 0.3%
Percentage point change in the vacancy rate in England (from 2012 to 2015)
0.5 0.7
0.2 0.4 0.9 0.5 0.8 0.5 0.2
Number of secondary teacher job postings as a proportion of total teacher employment in England (average from each academic year from 2014 to 2016 year ending July)
2
27% 28% 25% 17% 15% 7% 8% 15% 26% 24% 17% 9%
Indexed (2011-12 = 100) difficulty of teacher recruitment (average from 2012 and 2016)
3
86 94
101 98 94 93 100 106 113
Percentage shortfall in the number of Initial Teacher Training entrants recruitment against the target level in England (average between 2012-13 to 2016-17)
-10% -6% -27% 4% 0% -8% -50% -30% 16% -4% 24% 18%
The number of Initial Teacher Training recruited against target in England (average from 2012-13 to 2016-17)
-274 -177 -276 19 -4 -119 -503 -204 236 -31 148 150
Teacher training recruitment shortfall against target in Scotland (average between 2012-13 to 2015-16)
-26%
-22% -6%
-2% -12%* -14% -1%
The number of teacher training recruited against target in Scotland (average from 2012-13 to 2015-16)
-35
-10 -4
-2 -7 -5 -4
The proportion of lessons taught by a teacher with no relevant A level subject knowledge in England (average from 2012-13 to 2015-16)
18% 12%** 26% 20% 12% 59% 18% 41% 15% 17% 14% 10%
The number of non-EEA migrant teachers using their Certificate of Sponsorship to apply for a Tier 2 visa across the UK (2015)
4
172 164 40 43 5 16*** 5 4 78 9 9 3
The ITT target for new teachers as a proportion of the number of graduates studying a subject relevant degree (2015/16) 5
31% 15% 12% 24% 9% 18% 8% 5% 18% 13% 7% 12%
Annual teachers pay differential relative to alternative professions (rounded to the nearest hundred)
6
-£4,500 -£3,000 -£6,400 -£1,600**** -£1,600 £3,500 £4,200
-£13,300****
£2,700 £3,000 £4,700 £8,100
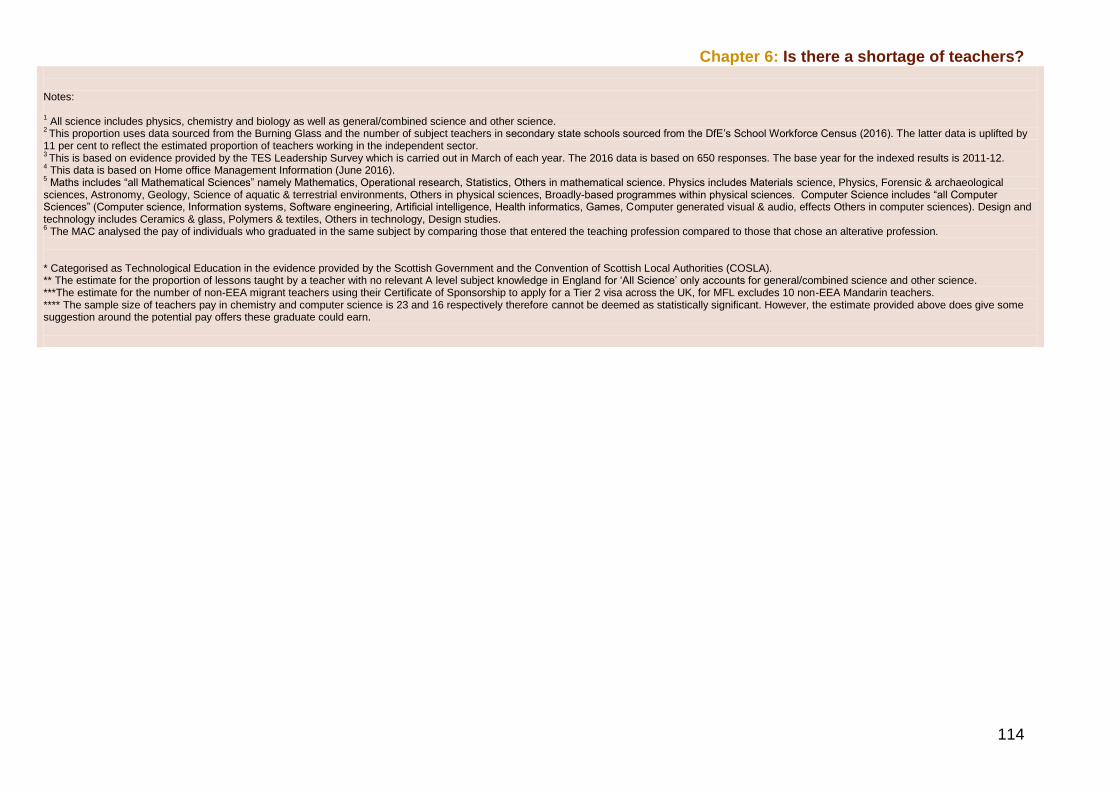
Chapter 6: Is there a shortage of teachers?
114
Notes: 1 All science includes physics, chemistry and biology as well as general/combined science and other science.
2 This proportion uses data sourced from the Burning Glass and the number of subject teachers in secondary state schools sourced from the DfE’s School Workforce Census (2016). The latter data is uplifted by
11 per cent to reflect the estimated proportion of teachers working in the independent sector. 3 This is based on evidence provided by the TES Leadership Survey which is carried out in March of each year. The 2016 data is based on 650 responses. The base year for the indexed results is 2011-12.
4 This data is based on Home office Management Information (June 2016).
5 Maths includes “all Mathematical Sciences” namely Mathematics, Operational research, Statistics, Others in mathematical science. Physics includes Materials science, Physics, Forensic & archaeological
sciences, Astronomy, Geology, Science of aquatic & terrestrial environments, Others in physical sciences, Broadly-based programmes within physical sciences. Computer Science includes “all Computer Sciences” (Computer science, Information systems, Software engineering, Artificial intelligence, Health informatics, Games, Computer generated visual & audio, effects Others in computer sciences). Design and technology includes Ceramics & glass, Polymers & textiles, Others in technology, Design studies. 6 The MAC analysed the pay of individuals who graduated in the same subject by comparing those that entered the teaching profession compared to those that chose an alterative profession.
* Categorised as Technological Education in the evidence provided by the Scottish Government and the Convention of Scottish Local Authorities (COSLA). ** The estimate for the proportion of lessons taught by a teacher with no relevant A level subject knowledge in England for ‘All Science’ only accounts for general/combined science and other science. ***The estimate for the number of non-EEA migrant teachers using their Certificate of Sponsorship to apply for a Tier 2 visa across the UK, for MFL excludes 10 non-EEA Mandarin teachers. **** The sample size of teachers pay in chemistry and computer science is 23 and 16 respectively therefore cannot be deemed as statistically significant. However, the estimate provided above does give some suggestion around the potential pay offers these graduate could earn.
Chapter 6: Is there a shortage of teachers?
115
Summary of the results by subject
Maths
6.6 Data from the Schools Workforce Census (SWC) show the average vacancy rate for maths teachers from 2012 to 2015 is 1.1 per cent. The Burning Glass data show that the number of job postings for maths teachers account for a significant share (27 per cent) of the number of maths teachers in the workforce in secondary schools in England. Furthermore, the vacancy rate reported in state schools in England has nearly doubled by 0.5 per cent from 0.7 per cent in 2012 to 1.2 per cent in 2015.
6.7 Using the Labour Force Survey (LFS), the pay of teachers with a maths degree was compared with maths graduates in other professions. The data shows that teachers with a maths degree tend to earn around £4,500 less per year than those maths graduates who choose an alternative profession. This indicates that maths graduates may be more inclined to choose an alternative career to seek higher pay rewards.
6.8 For each of the past four years, the DfE’s ITT targets for maths teachers have been missed. The shortfall in recruiting new maths teachers into the profession averaged at 10 per cent between 2012-13 and 2016-17. In absolute terms this amounts to a shortfall of 274 maths teachers per year, on average.
6.9 Many partners reported a struggle in recruiting maths teachers with a higher than A-level qualification in the subject. Data from the SWC show that, between 2012-13 and 2015-16, the number of hours per week taught by teachers with no subject relevant post A-level qualification averaged at 18 per cent.
6.10 The Home Office management information on the number of CoS used in 2015 shows that 172 non-EEA maths teachers are working in the UK, around 60 per cent of the average shortfall of new entrants in maths.
6.11 The available data, therefore, indicate that the vacancy rates for maths teachers are relatively high compared with teachers in other subjects and may have almost doubled over the past three years. It appears that a significant proportion of maths teaching is being undertaken by teachers without a post A-level qualification in that subject. The data also indicate a significant shortfall in the number of new maths teachers being recruited and that this shortfall is being partially addressed by immigration from outside the EEA. Most importantly, it is apparent that maths graduates can earn more in occupations other than teaching. Therefore, there appears to be both evidence of and a rationale for a shortage of maths teachers.
Chapter 6: Is there a shortage of teachers?
116
Science – Physics, Chemistry and Biology
6.12 Similar to maths, the vacancy rate for science teachers averaged over the past four years is 1.08 per cent. The SWC does not break this down by physics, chemistry or biology. Since 2012, the vacancy rate has increased from 0.6 per cent to 1.3 per cent. Incorporating the Burning Glass data, the number of job postings for physics accounts for a relatively high proportion of the total number of physics teachers in England (25 per cent).
6.13 Indicative pay data from the LFS show there is an opportunity cost for physics graduates who become physics teachers with pay for physics teachers being around £6,400 less than that for physics graduates in alternative professions. The median salary for both chemistry and biology graduates in teaching was around £1,600 lower than those who chose an alternative career – although it should be noted that the pay differential for chemistry teachers pay is deemed as not statistically significant due to small sample size. Therefore the estimated pay differential for chemistry teachers should be treated as illustrative.
6.14 The indicative relative pay differential of physics teachers may go some way in explaining the significant shortfall (27 per cent) in the number of physics trainee teachers needed. On average, data from 2012 and 2016 show that the ITT target for biology teachers has been met, with the absolute shortfall being reported as 4 trainees – far lower than that in physics (276). In contrast, there has been an over-recruitment of trainee teachers in chemistry, on average attracting 4 per cent more than the target (19 trainee teachers).
6.15 Data from the SWC show that, on average, 26 per cent of physics lessons were taught by a teacher with no relevant post A-level subject qualification. In chemistry, this figure was slightly lower, at 20 per cent. In comparison, on average, only 12 per cent of biology lessons were taught by a teacher with no relevant post A-level subject qualification. The total shortfall in all new science teachers needed (177) could be partially offset by the 164 non-EEA science teachers using the Tier 2 visa route.
6.16 The data indicate that there is a sufficient supply of chemistry teachers to meet current demand. The pay on offer to chemistry and biology graduates who go into teaching is relatively comparable to that on offer for those graduates in other occupations. Overall, the evidence in relation to a shortage of biology and chemistry teachers is not compelling.
6.17 The 276 average shortfall in new physics teachers combined with the higher pay available to physics graduates in occupations other than teaching provides stronger evidence and rationale for a shortage of teachers in this subject.
6.18 The section above assessed the data available for the separate strands of science. Partners have, however, raised concerns around the ability to recruit general science teachers – i.e. teachers who have the skills and
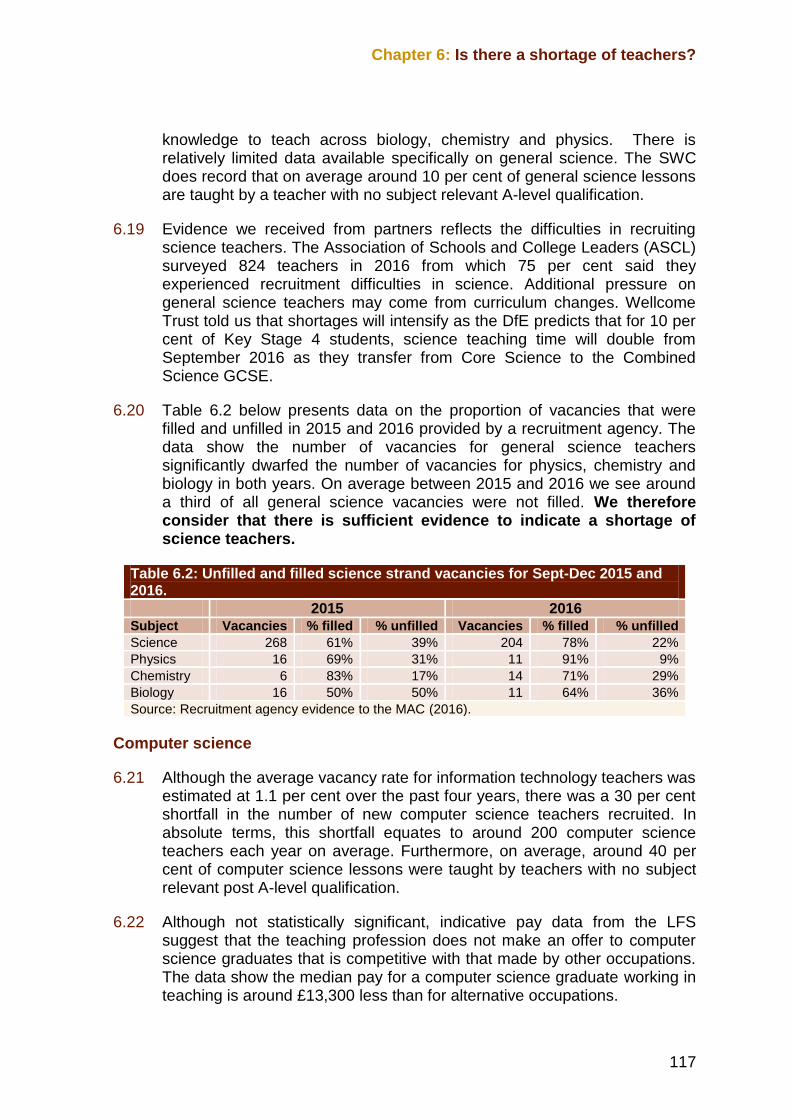
Chapter 6: Is there a shortage of teachers?
117
knowledge to teach across biology, chemistry and physics. There is relatively limited data available specifically on general science. The SWC does record that on average around 10 per cent of general science lessons are taught by a teacher with no subject relevant A-level qualification.
6.19 Evidence we received from partners reflects the difficulties in recruiting science teachers. The Association of Schools and College Leaders (ASCL) surveyed 824 teachers in 2016 from which 75 per cent said they experienced recruitment difficulties in science. Additional pressure on general science teachers may come from curriculum changes. Wellcome Trust told us that shortages will intensify as the DfE predicts that for 10 per cent of Key Stage 4 students, science teaching time will double from September 2016 as they transfer from Core Science to the Combined Science GCSE.
6.20 Table 6.2 below presents data on the proportion of vacancies that were filled and unfilled in 2015 and 2016 provided by a recruitment agency. The data show the number of vacancies for general science teachers significantly dwarfed the number of vacancies for physics, chemistry and biology in both years. On average between 2015 and 2016 we see around a third of all general science vacancies were not filled. We therefore consider that there is sufficient evidence to indicate a shortage of science teachers.
Table 6.2: Unfilled and filled science strand vacancies for Sept-Dec 2015 and 2016.
2015 2016 Subject Vacancies % filled % unfilled Vacancies % filled % unfilled
Science 268 61% 39% 204 78% 22%
Physics 16 69% 31% 11 91% 9%
Chemistry 6 83% 17% 14 71% 29%
Biology 16 50% 50% 11 64% 36%
Source: Recruitment agency evidence to the MAC (2016).
Computer science
6.21 Although the average vacancy rate for information technology teachers was estimated at 1.1 per cent over the past four years, there was a 30 per cent shortfall in the number of new computer science teachers recruited. In absolute terms, this shortfall equates to around 200 computer science teachers each year on average. Furthermore, on average, around 40 per cent of computer science lessons were taught by teachers with no subject relevant post A-level qualification.
6.22 Although not statistically significant, indicative pay data from the LFS suggest that the teaching profession does not make an offer to computer science graduates that is competitive with that made by other occupations. The data show the median pay for a computer science graduate working in teaching is around £13,300 less than for alternative occupations.
Chapter 6: Is there a shortage of teachers?
118
6.23 There is evidence of a shortfall of around 200 computer science teachers and nearly half of all lessons are taught by a teacher with no relevant post A-level qualification. The data indicate that there is a reducing number likely to study the subject. Those that do graduate in this subject can earn more in occupations other than teaching. The evidence does indicate a shortage of teachers in this subject. Against this, CoS data indicate that only 4 computer science teachers were recruited from outside the EEA which is hardly a dent in the 200 needed. This disparity is considered further in the sensible section.
Design and technology (DT)
6.24 Over the past four years, the number of recruited DT trainee teachers has consistently been below the target needed. The average shortfall against the target is 50 per cent and in absolute terms equates to around 500 teachers – the largest shortfall across all subjects. When looking at the quality of teaching, the SWC shows on average 18 per cent of all DT lessons were taught by a teacher with no relevant post A-level subject qualification. DT graduates who choose to become a teacher earn around £4,200 more than those who chose an alternative career therefore pay does not appear to be a factor in explaining this shortfall.
6.25 Based on the available data, DT is the subject with the biggest shortfall in teachers. However, these data cover inflows into ITT only and do not include retention rates. This extensive shortfall not being matched by a similarly extensive proportion of lessons taught by a teacher without a degree relevant to DT may possibly be due to extensive recruitment of DT teachers under the Tier 5 route or addressed by schools no longer offering DT as a subject on their curriculum. There is no available evidence to determine which of these is the case or whether something else is happening. The Home Office Tier 2 management data show that 5 non-EEA DT teachers were recruited in 2015. Additionally, DT graduates who go into teaching earn more than DT graduates working in other occupations. On balance, we do not consider that there is compelling evidence of a shortage of DT teachers.
Languages – Mandarin and modern foreign languages
6.26 There is little published evidence on the issues underpinning the supply of Mandarin teachers. In 2015, 10 Mandarin teachers entered the workforce under Tier 2 along with 16 language teachers. The overall numbers of Mandarin teachers in the UK are so small as to not lend themselves to the sort of analysis carried out in relation to other subjects presented in Table 6.1. Partners provided evidence of a drive to encourage more pupils to study this subject and that the pool of Mandarin teachers presently available was insufficient to meet this drive. We consider this issue in the sensible chapter.
Chapter 6: Is there a shortage of teachers?
119
6.27 Using data from the SWC, the average vacancy rate for language teachers is 0.6 per cent which has changed little over the past four years. The Burning Glass data show that the number of job postings for modern foreign languages account for 7 per cent of the total number of modern languages’ teachers in England – to some extent this may just be indicative of churn within the profession.
6.28 The average shortfall against the number of modern foreign language teachers required is 8 per cent which equates to 119 teachers. Data from the SWC show that around 60 per cent of modern foreign language lessons were taught by a teacher with no relevant post A-level subject qualification.
6.29 Data from the LFS indicate that language graduates earn around £3,500 more when working in teaching compared to those who choose an alternative profession. Other things equal, pay therefore should make language teaching a more attractive career option. The fact that there is a shortfall of new entrants, in spite of higher earning potential, may reflect the unattractiveness of teaching compared with other occupations or may reflect a shortfall in the overall number of language graduates.
6.30 The vacancy rates for modern foreign language teachers have remained relatively constant but there is a shortfall of new teachers. Additionally, over half of all language lessons are taught by teachers without a degree level qualification in the subject. It appears, therefore, that the shortage of language teachers does not reflect differentials in pay but may be due to a wider shortage of graduates in these subjects, as suggested by partner evidence. CoS data do not indicate extensive use of Tier 2 to recruit language teachers but this may be due to a more ready-made supply of teachers in these subjects being available within the EEA. This point is considered again in Chapter 7.
English
6.31 There appears to be sufficient evidence to suggest that there is a strong supply of English teachers available to meet demand. On average, over the past four years there has been an over-recruitment (16 per cent) of English teachers into ITT against set targets. In absolute terms, this equates to around 236 on average more English teachers than otherwise needed. This may to some extent be explained by the positive pay differential between graduates who choose a career in teaching compared to other professions. English graduates in teaching earn around £2,700 more than those who choose an alternative career.
6.32 Even though there is extensive over-recruitment of new English teachers, employers still found it necessary to recruit 78 non-EEA English teachers via Tier 2. Additionally, 15 per cent of English lessons were taught by a teacher with no relevant post A-level qualification. Notwithstanding these apparent anomalies, there is not sufficient evidence to indicate a shortage of English teachers.
Chapter 6: Is there a shortage of teachers?
120
Geography and history
6.33 The vacancy rates for geography and history have increased by 0.8 and 0.5 per cent points respectively from 2012 to 2015. The average shortfall against the ITT for geography teachers is 4 per cent (which equates to around 31 teachers). On average, there has been an over-recruitment of new history teachers (24 per cent) which has resulted in an around additional 148 history teachers above those needed.
6.34 Data from the SWC show that around 17 per cent and 14 per cent of all geography and history lessons respectively are taught by a teacher with no relevant post A-level qualification. The median pay differentials for geography and history graduates who teach are around £3,000 and £4,700 higher than geography and history graduates who choose an alternative profession. CoS data show 21 non-EEA teachers were recruited to teach humanities, including history (9) and geography (9), in 2015.
6.35 The proportionate shortfall in geography teachers is on a par with that in other subjects but the actual numbers are less (31 in geography as against 119 language teachers and 177 science teachers, for instance). The proportion of geography lessons taught by teachers without a relevant post A-level qualification are also lower than in other subjects (17 per cent in the case of geography as against 59 per cent in the case of languages, for instance). History teachers, meanwhile, appear to have been over-recruited and the pay offer for both geography and history teachers is better than that available for graduates in those subjects working in other occupations. The evidence does not compel us to a conclusion that teachers in either of these subjects are in shortage.
Physical Education (PE)
6.36 The average vacancy rate for PE teachers is 0.3 per cent and has varied little over the available data time series. There is credible evidence to suggest that schools currently have access to a healthy supply of PE teachers. First, on average there has been an over recruitment (18 per cent) of teachers against the ITT targets. This means, on average, there are around 150 more PE teachers than currently needed. Second, the SWC data show that only 10 per cent of all lessons were taught by a teacher with no relevant post A-level subject qualification. Third, physical sport science graduates earn around £8,100 more in a teaching career compared to alternative occupations. The evidence strongly indicates no shortage of PE teachers.
Scotland
6.37 The Scottish Government and the Convention of Scottish Local Authorities surveyed all Scottish local authorities and asked whether there were any subjects experiencing recruitment difficulties. The authorities identified maths, physics and chemistry as being in shortage as well as computer
Chapter 6: Is there a shortage of teachers?
121
science and DT. A number of respondents also cited business education, English and home economics as being in shortage.
6.38 Maths, physics, computer science and science are identified above as being in shortage in England and therefore as being candidates for the UK SOL. If they are placed onto the UK SOL then there is no need for a separate consideration in regard to Scotland.
6.39 Available data were used to assess teacher shortages in Scotland. These data focused on shortfall against ITT targets and the change in the number of job postings sourced from the Burning Glass labour insights tool. Scotland has not published or recorded any teacher vacancy data since 2010 and does not track the subject knowledge of the teachers taking lessons in each subject. Therefore, there is very limited data to draw on to assess the shortage of teachers by subject in Scotland.
6.40 Table 6.1 presents data on the shortfall in the number of new entrants by subject in Scotland where we see particular strains in maths and physics. However, the numbers coming through the Tier 2 visa route are minimal. In total, Home Office management data show only around 40 migrant teachers reported work in the region of Scotland and Northern Ireland collectively from 2012 to 2015. Of this, 7 migrant teachers were reported in 2015 and spread evenly across subjects including biology (1), English (1), physics (1), science (1) and Mandarin (2). Due to the extremely low values for this indicator it has not been used to draw any conclusions on shortage. It does show, however, that the Tier 2 route is not being used in Scotland to address teacher shortages in all subjects to any great extent.
6.41 In relation to teachers in Scotland in DT, chemistry, business education, English and home economics, there was not sufficient evidence to conclude that these teachers are in shortage. Data in Table 6.1 shows that although the shortfall in DT teachers has averaged at 12 per cent from 2012-13 to 2015-16 this only equated to around 7 DT teachers on average (out of a workforce of 1,237). The shortfall in chemistry teachers has averaged 4 teachers (6 per cent shortfall) since 2012. Similarly the shortfall in English teachers has averaged at 4 teachers. Although the teacher training target for home economics teachers has not been met since 2012, the shortfall averaged at 9 teachers out of a workforce of 826 in 2015.
6.42 Further evidence in relation to teacher shortages in Scotland was limited to the experience of local authorities finding it difficult to recruit teachers in these subjects and there was no additional data available on areas such as pay differentials compared with other occupations in Scotland. These subjects therefore do not pass the shortage test.
6.43 Additionally, the data in relation to England shows an over-supply of chemistry and English teachers while home economics has been dropped from the curriculum in a significant number of schools as some exam boards in England are no longer offering a GCSE in this subject. It might be
Chapter 6: Is there a shortage of teachers?
122
more sensible for Scottish local authorities to recruit teachers in chemistry, English and home economics from amongst the surplus in England than from outside the EEA.
6.4 Conclusions
6.44 The evidence and available data indicates that teachers in the following subjects could be considered as being in shortage:
maths
physics
computer science
Mandarin
modern foreign languages
science
6.45 The next chapter considers whether it is sensible to address shortages in the subjects identified above by immigration from outside the EEA.
123
Chapter 7 Sensible
X`
7.1 Introduction
7.1 This chapter considers the sensible part of the MAC methodology. The MAC considers four indicators of whether it is sensible to recommend retaining or adding teachers to the shortage occupation list (SOL). The questions are:
What alternatives are there to employing migrants?
How recruiting skilled migrant workers affects incentives for UK employers to invest in training the UK workforce?
How employing skilled migrants affects investment, innovation and productivity growth in the wider UK economy?
Whether adding occupations and job titles to the SOL will affect the wider UK labour market and economy.
7.2 In relation to teachers, our call for evidence identified a number of specific questions, the answers to which would help inform our consideration of the sensible indicators. The questions were:
To what extent can existing teachers be retrained to teach the subjects of other teachers who have left? How would this affect the quality of education delivered?
To what extent are migrant teachers (whether from within the European Economic Area (EEA) or outside of the EEA) adequate substitutes for experienced teachers (whether from within the UK or outside of it)?
To what extent could shortages of teachers be addressed by the numbers of teachers who could re-enter the profession if they were incentivised to do so? What changes would have most impact on incentivising re-entry of teachers?
What proportion of newly qualified teachers do not go on to enter teaching as a profession? What is being done to reduce this number? Are there issues with the training offered to new teachers? What are these? Are there sufficient, strong links between training establishments and schools?
Chapter 7 Sensible
Chapter 7: Sensible
124
What is being done to improve workforce planning to reduce a reliance on migrant teachers?
What is being done to reduce reliance on migrant teachers as a safety valve at times of peak demand/maximum shortage?
7.3 In this chapter, we consider the evidence we received in response to these questions plus any other relevant material and confirm whether teachers meet the sensible criteria.
To what extent can existing teachers be retrained to teach the subjects of other teachers who have left? How would this affect the quality of education delivered?
7.4 There was conflicting evidence from partners in relation to this question. Some said that it was not feasible to retrain teachers whereas others said that this was in fact happening in practice. Some partners said that schools liked employing teachers from countries such as Australia, Canada and New Zealand as these teachers were more willing and more able to teach a wider variety of subjects thus negating the need to retrain existing teachers.
“One of the advantages of using non-EEA teachers, particularly from Canada and Australia is that they have a wider scope of qualified subjects they can teach. In addition they are willing to teach in other non qualified areas without any extra incentives.”
Recruitment agency response to MAC call for evidence
“Members also reported that schools often had to skill teachers up in areas which were not their specialist areas to accommodate the need for staff, and to respond effectively to the changes in the new curriculum and exam specifications for GCSEs and A-level.”
National Association of School Based Teacher Trainers response to MAC call for evidence
7.5 For example, the Educational Institute of Scotland told us that, in principle, they would not object to retraining of teachers to address shortages. They pointed out that, in Scotland, the quality of education is assured by the requirement for teachers to meet the standards for registration in their new subject with the General Teaching Council for Scotland.
7.6 The National Association of School Based Teacher Trainers told us that schools were currently looking into methods to develop second subject specialisms for staff and considering using resources such as Subject
Chapter 7: Sensible
125
Knowledge Enhancement Courses to fill needs and gaps in subjects such as science, maths, modern foreign languages, humanities and English. The Department for Education said that Teacher Subject Specialism Training sought to upskill existing non-specialist teachers currently teaching maths and physics. The department said that while this strand of activity had proven very popular with schools it was too early to quantify the impact this scheme has had on the number of vacant subject specialist posts.
7.7 Other partners told us that if schools wanted to utilise UK teachers and retrain them in subjects in which they were not formally qualified to teach there would need to be substantial incentives offered. They said that asking a teacher to teach outside their subject area and enter into further training with no incentive was a hard ask especially when they can remain teaching in their qualified subjects.
7.8 As to whether this would affect the quality of education, again there was conflicting evidence. Some partners said that detailed subject knowledge was not a necessary indicator of a teacher’s teaching skills whereas others said the opposite. For instance, the Association of Teachers and Lecturers told us that a growing nationwide teacher supply crisis was impacting on the level of subject expertise in schools, with increasing numbers of non-specialist teachers.
7.9 We looked at the proportion of teachers that had an A-level qualification in a subject they were teaching to see whether these numbers were significant. The Association of Teachers and Lecturers told us that more classes than ever in secondary schools are being taught by teachers without a relevant post A-level qualification in that subject. They cited a report from the National Audit Office which stated that in the English Baccalaureate subjects (English, maths, science, modern foreign languages, history and geography), the proportion of such non-specialist teachers rose from 14 per cent in 2010, the first year for which data are available, to 18 per cent in 2014. In some subjects, teaching by non-specialists is prevalent: computer science (44 per cent), Spanish (43 per cent), religious education (30 per cent), physics (28 per cent) and German (25 per cent) in 2014. In English and maths, one-fifth of lessons were said to be taught by teachers without a relevant post-A-level qualification. The primary source is data taken from the Department for Education’s schools workforce census and was analysed in more detail in Chapter 4.
7.10 Teach Vac told us that the subjects of physics and maths have seen a decline in the percentage of teachers with a relevant post A-level qualification although in both subjects the number of teachers has increased. Meanwhile, the overall decline in teachers with a relevant post A-level qualification teaching design and technology during the same period was 6 per cent, greater than for either maths or physics.
Chapter 7: Sensible
126
“While good teachers can teach subjects that are not their specialism, it is clearly better for their students if they are teaching the subject that they are enthusiastic about and have chosen to study in depth.”
Association of School and College Leaders response to MAC call for evidence
7.11 The National Association of Head Teachers told us that in English and maths one-fifth of lessons are now taught by teachers without post-A level qualifications in those subjects. The Association said it was extremely concerned at the current increase of teachers being required to teach subjects for which they do not have a relevant post A-level, or in some cases GCSE, qualification.
“In particular, we are concerned that students at key stage 4 could be taught by a teacher without the level of subject knowledge to allow them to respond to probing questions from students, or to meet the needs of the most able students. A world class education system relies on high quality teachers with sufficient depth of subject expertise.”
National Association of Head Teachers response to MAC call for evidence
7.12 The Recruitment and Employment Confederation said that their members emphasised that the number of teachers alone is not the issue but a lack of good teachers which schools feel comfortable using.
“Further research is needed to determine if a lack of fully suitable teachers, those who do not hold degrees in the subject they are teaching, could have a detrimental impact on a child’s education and if this will ultimately negatively impact attainment.”
Recruitment and Employment Confederation response to MAC call for evidence
To what extent are migrant teachers (whether from within the EEA or outside of the EEA) adequate substitutes for experienced teachers (whether from within the UK or outside of it)?
7.13 The Educational Institute for Scotland cautioned against any implication that migrant teachers may be less skilled and capable than other experienced teachers. They pointed out that the General Teaching Council in Scotland (GTCS) has responsibility for determining whether teachers from outside Scotland satisfy the requirements to teach in Scotland and whether such teachers can be fully, provisionally or conditionally registered with the GTCS. The Institute said that they welcomed the GTCS decision to

Chapter 7: Sensible
127
introduce a new conditional registration category, which provided added flexibility to attract a wider range of teachers to teach in Scotland.
7.14 A recruitment agency explained to us that their process with schools is to fill every vacancy firstly with local UK teachers, thereafter they proceed with suitably qualified European Economic Area (EEA) nationals, the majority of these coming from Ireland, and Non-EEA nationals (principally from Australia, Canada and New Zealand) that are able to work in the UK without going through Tier 2 (i.e. Tier 5). Once all of the above avenues are exhausted the agency then try and recruit teachers through the Tier 2 route.
7.15 The National Association of Head Teachers told us that, because of budget constraints, the traditional view of schools aiming to achieve a mix of experienced and less experienced staff was being challenged. Schools looked to recruit newly qualified staff, not just because they added to the mix of current staff members, but because they cost the school less to employ. Similarly, the Recruitment and Employment Confederation said that their members reported a greater demand from schools for newly qualified teachers, with some members saying that newly qualified teachers seemed to be at the forefront for school recruitment. Members gave several reasons for this, including that many schools preferred a good pool of newly qualified teachers to choose from due to budgetary constraints, but also because they could be more easily moulded and integrated into the school’s way of working. We were told that it was also the case that the demand for experienced teachers differed greatly depending on the subject taught and the budgetary pressures the schools and local authority was under.
7.16 Some evidence from the independent schools sector said that some independent schools reported recruiting newly qualified teachers when they could as they cost less.
To what extent could shortages of teachers be addressed by the numbers of teachers who could re-enter the profession if they were incentivised to do so? What changes would have most impact on incentivising re-entry of teachers?
7.17 The Educational Institute for Scotland told us that around 20 per cent of teachers who are registered with the General Teaching Council of Scotland (GTCS) were not teaching and that many of these were on planned career breaks. They told us that a number of universities in Scotland, supported by local authorities, offer courses for those seeking to return to the profession to refresh their skills and update their curricular knowledge.
7.18 Some respondents identified barriers to former teachers re-entering the profession as including:
Workload and pressure created by OFSTED requirements;
Chapter 7: Sensible
128
Pay; and
Lack of support and resources available to help former teachers.
7.19 The Department for Education pointed to figures showing that the number of inactive teachers coming back to the classroom had increased from 11,710 in 2011 to 14,060 in 2015 (according to the Schools Workforce Census). The department said that this increase had occurred without central government driving any incentive but they accept that increasing this number could have some benefits. However, the department said that it was unclear as to how significant an increase could be achieved with government intervention. The department was testing out approaches via two pilot schemes to attract inactive teachers back into the workforce. One is targeted at attracting former maths and physics teachers, working with subject associations such as the Institute of Physics. Prospective returners are given individual support to prepare them for a return to the workforce. The other scheme is run in partnership with 60 schools to support the return of teachers of Ebacc subjects. Schools involved in the pilot, aside from offering bespoke training and classroom experience, also seek to identify job opportunities across partnership schools. The department was awaiting the evaluation of these pilots to inform the best course of action to attract first class former teachers back into the classroom.
7.20 The department also referenced research stating that financial motivation was not necessarily a reason why teachers left the profession and which suggested that to attract even more teachers back into the workforce “there are a mixture of things most of which, as the direct employers, fall upon individual heads rather than government”. This research was contained in a publication from the Policy Exchange (Policy Exchange, 2016). The department said that this research pointed to the need to shift to a culture that embraced flexible working. The department says it is aware of this and has signalled its intention to promote this within schools in its White Paper with its commitment to help schools to build a diverse workforce, with more opportunities for teachers to work flexibly including through part-time work and job sharing. As part of this work, the department is, again, collecting case studies from schools who are making effective use of part-time teachers.
7.21 The Association of Teachers and Lecturers told us that factors such as workload, the expense of training, falling salaries and the demotivating effect of a punitive accountability system impacted not only on recruitment and retention but also the ability of the system to offer incentives to potential returners to the teaching profession.
Chapter 7: Sensible
129
What proportion of newly qualified teachers do not go on to enter teaching as a profession? What is being done to reduce this number? Are there issues with the training offered to new teachers? What are these? Are there sufficient, strong links between training establishments and schools?
7.22 The National Association of Head Teachers told us that there is wide variation in the availability of training places across England, ranging from 294 trainees for every 100,000 pupils in the East of England to 547 in the North West. The Association said that where a person trains often feeds into where they go on to work within teaching.
“There is...a lack of understanding the geographical distribution of candidates and the relationships between where teachers are looking for work versus vacancies.”
Recruitment agency response to MAC call for evidence
7.23 The Association of Graduate Careers Advisory Services told us that students who completed initial teacher training but did not seek employment as teachers commonly cited the following as reasons:
their experience during training made them aware of the stress experienced by teachers and the long hours of work required;
they received alternative job offers which offered greater financial reward, better working conditions and job satisfaction (particularly for those teaching STEM subjects);
lack of opportunities in the location where they wanted to work;
inadequate pay in London and the South East;
the constraints on what and how they were required to teach were greater than they realised;
heavier workload than anticipated, especially in the areas of administration and record-keeping; and
lack of support from the school(s) where they were placed.
7.24 The Department for Education told us that 95 per cent of postgraduate newly qualified teachers (NQT) were in a teaching post six months after being awarded NQT status, with 3 per cent of postgraduates not seeking a teaching post six months after being awarded NQT status. The department did not have any data on those NQTs who did not take up a post immediately but said that some of these do go into teaching at some point in the future as they are picked up by the Schools Workforce Census. The department surveys NQTs six months into their first teaching year and told
Chapter 7: Sensible
130
us that, overall, the perceived quality of ITT in England had been very stable over the past ten years.
7.25 In terms of the quality of training available to prospective teachers, the Department for Education told us that the vast majority of training is rated Good by Ofsted, with Ofsted inspections of accredited initial teacher training (ITT) providers between September 2014 and August 2015 finding that 82 per cent of trainees being trained by Good or Outstanding ITT partnerships. The department said it had significantly increased the roles played by schools in recruiting and training new teachers. This had resulted in an increase in the number of ITT providers including 174 School Centred Initial Teacher Training (SCITT) providers, as well as the School Direct programme. The department said that 51 per cent of teacher trainees were now on a school-led route into teaching (School Direct, SCITT or Teach First) and expected this to grow in the future. This growth in school-led routes into teaching had seen ITT being available in parts of England that had previously had little access to training. However, the department did not provide data or further evidence indicating how effective these measures were.
“Further work is in train to look at how effectively the current ITT provider landscape is meeting the needs of schools in areas with lower than average standards of achievement, and how we can incentivise growth in those areas.”
Department for Education response to MAC call for evidence
7.26 The DfE Teacher Supply Model makes explicit assumptions on the postgraduate ITT completion rate and the postgraduate post-ITT employment rate. It assumes around 90 per cent of postgraduates who enrol on the ITT course complete the course and around 80 per cent are successfully employed in the teaching sector within 6 months.
What is being done to improve workforce planning to reduce a reliance on migrant teachers?
7.27 The Department for Education told us that the government was taking steps to address teacher recruitment problems through:
Investing over £1.3 billion up to 2020 to attract new teachers into the profession through a range of measures including: bursaries, scholarships, subject knowledge enhancement courses and School Direct grant funding.
Raising the status of teaching (to make it an attractive career option) through a new system of teacher accreditation, improved quality of ITT content, specific marketing campaigns and support for the establishment of a new, independent College of Teaching.
Chapter 7: Sensible
131
A marketing campaign promoting teaching through a range of media including targeted subject specific advertising. A presence at 130 events, including graduate recruitment fairs.
7.28 Specific domestic initiatives aimed at increasing teacher supply in subjects facing particular recruitment challenges which we have detailed below.
7.29 The National Association of Head Teachers said that they had been critical of the government’s modelling not taking into account that where teachers train often feeds into where those teachers go on to work.
7.30 In relation to the government’s White Paper proposals, the National Association of Head Teachers said that the some of the proposals could help to improve the quality of initial teacher training preparation, or help to target those teachers already in the system to the areas with the biggest shortages but the proposals were much weaker in the area of increasing the quantity of graduates training to be teachers to address the current shortages.
What is being done to reduce reliance on migrant teachers as a safety valve at times of peak demand/maximum shortage?
7.31 The Educational Institute of Scotland told us of their recent support for a scheme to assist oil and gas workers wanting to retrain as teachers in science, technology, engineering and maths (STEM) subjects, which was supported by an investment of £12 million by the Scottish Government Transition Training fund.
7.2 The Department for Education evidence
7.32 This commission originated from the Department for Education. The evidence we received from it focussed on persuading us to include teachers in certain subjects on the shortage occupation list, namely:
secondary teachers of mathematics, chemistry and physics to remain on the shortage list;
secondary teachers of computer science, modern foreign languages (MFL), including teachers of Mandarin; and,
special educational needs teachers in special schools be added to the SOL.
7.33 The department told us that numbers and qualification levels of teachers are at an all-time high. There are now more than 456,000 full-time equivalent teachers in state funded schools in England. One in six trainees (16 per cent) in 2014-15 hold a first class degree and over two thirds (73 per cent) hold a 2:1 or better.

Chapter 7: Sensible
132
7.34 Demand for high quality teachers continued to grow with a key driver being the increase in pupil numbers as a result of population growth. The department said that the secondary school population has been falling but is expected to rise over the next decade by 20 per cent while the supply of qualified teachers is required to grow by 4.1 per cent between 2014-15 and 2020-21. We discussed the pupil/teacher ratio in Chapter 3 of this report.
Recruitment challenges
7.35 The department said that their targets for recruitment to postgraduate ITT had not been met in certain subjects for a number of years, as discussed in Chapter 4.
7.36 Significantly increasing the number of pupils entered for the EBacc will place greater pressure on teacher numbers in subjects where there are already recruitment struggles. This will be particularly acute in the recruitment of sufficient modern foreign languages (MFL) teachers. The department said that this was because the potential domestic pool had reduced over recent years since languages were removed from the compulsory Key Stage Four (KS4) curriculum in 2004.
7.37 The introduction of the Mandarin Excellence Programme and the government commitment to have 5,000 additional pupils speaking Mandarin by 2020 will, we were told, drive a high demand for teachers. The department said that teacher supply was a major barrier preventing Mandarin becoming more strongly embedded in the school system and pointed out that this was a key ministerial priority. Given that there are around 100 teachers of Mandarin in the state funded system, and a limited domestic supply pipeline, the department said that schools needed to be able to boost teacher numbers by recruiting from overseas.
7.38 The department set out the steps it was taking to address recruitment problems through:
Investing over £1.3 billion up to 2020 to attract new teachers through bursaries, scholarships, subject knowledge enhancement courses and School Direct grant funding.
Raising the status of teaching to make it an attractive career option in a competitive market, through a new system of teacher accreditation, improved quality of ITT content, specific marketing campaigns and support for the establishment of a new, independent College of Teaching.
A marketing campaign promoting teaching.
Specific domestic initiatives aimed at increasing teacher supply in subjects facing particular recruitment challenges.
Chapter 7: Sensible
133
7.3 Department for Education evidence on specific subjects
Domestic initiatives to increase supply in maths and physics
7.39 Discussion of the department’s evidence in relation to shortages in maths, physics, chemistry, computer science and other modern foreign languages is set out earlier in this report. The department outlined its initiatives to increase the supply of maths and physics teachers as follows:
Trainees with a first class degree training to teach physics in 2016-17 will receive a £30,000 tax-free bursary, an increase from £25,000 in 2015-16. Trainees in physics with a 2:1 will continue to receive a £25,000 bursary, and trainees with a 2:2 will also receive £25,000 up from £15,000 last year.
Trainees with a first, 2:1 or 2:2 training to teach maths will receive £25,000; this represents a £5,000 increase for those with a 2:1 and £10,000 increase for those with a 2:2.
Trainees with a first training to teach chemistry will continue to receive £25,000 and those with a 2:1 will continue to receive £20,000. Bursaries for those with a 2:2 have been increased by £5,000 to £20,000.
Mandarin
7.40 The department estimated that there are around 100 teachers of Mandarin currently in the state-funded system, compared to 13,200 French, 4,500 German and 7,500 Spanish teachers. The department said that it did not intend to rely on temporary teachers from China to achieve its commitment on the expansion of Mandarin teachers, but in the short term it said it will need to boost current teacher numbers by opening up opportunities to overseas Mandarin speakers who wish to teach and/or train as Mandarin teachers in the UK. The government has announced £10m funding for an additional 5,000 students to be learning Mandarin by 2020, requiring an additional 80 Mandarin teachers.
Other
7.41 The department said it was looking at ways of recruiting modern foreign language teachers from European countries, for example extending the visiting teacher programme that Spain already runs with America and Canada. However, it said the uncertainty generated by Brexit is likely to impact on the confidence of teachers in Europe interested in teaching in the UK, and UK schools in recruiting them.
Shortages in special schools
7.42 The department told us of the steps it is taking to address shortages in special schools, in the form of:
Chapter 7: Sensible
134
Improving the coverage of Special Educational Needs and Disabilities training in ITT.
Offering special schools the opportunity to take control of the recruitment and training of special school teachers.
Designating and funding Teaching Schools (85 of 760 are special schools) to identify and develop potential special school teachers and support local succession planning.
7.43 The department said that it will take time to build this capacity and fully realise the numbers of additional special school teachers that the sector requires. Therefore, there remained a need for overseas teachers, despite investment and attention to this area.
7.4 Evidence from other partners
7.44 We discussed earlier in this report the evidence from other partners in relation to shortage. The reasons why teachers were leaving the profession were cited as including an increasing workload for teachers, coupled with a punitive accountability system. A high stakes assessment system has made many teachers fearful of a drop in results, making many feel unsettled and less confident about their future career. Teachers also had increased options to go and work outside of the UK.
7.45 A number of respondents said that increasing the pay of teachers is largely impossible, citing government policy to limit pay-rises in maintained schools to 1 per cent. It was recognised that most schools are now academies, and able to pay more, but respondents said that most do not do so to any significant extent. Others said that teachers of English, science and maths are often paid above the National Pay scales and that schools are offering incentives and relocation payments. However, respondents were not convinced all schools have fully embraced the performance related pay strategy, citing budgetary pressures. Other respondents said that, in their view, differentiated pay would be divisive in the staff room.
7.46 It was said that teachers were disadvantaged, compared to other occupations, when it comes to prioritizing allocation of certificates of sponsorship due to lower salaries. This means that teachers were way down the priority list under the Tier 2 cap. Some partners perceived the new salary thresholds and the immigration charge as an impediment to recruiting teachers through the non-shortage route. Partners said that the salary threshold allowances and immigration charge should be reduced for schools hiring teachers through Tier 2 both shortage and non-shortage routes.
Chapter 7: Sensible
135
7.5 Other issues
7.47 Anyone can teach: It was pointed out that maintained schools are normally required to employ a person with Qualified Teacher Status (QTS) while academies, free schools and independent schools may employ anyone as a teacher. Even in maintained schools, anyone with QTS may legitimately be employed in any school to teach any subject.
7.48 Flawed modelling: A number of responses highlighted perceived problems with the Department for Education’s teacher supply model (TSM). The TSM was described as fundamentally flawed and depended on uncertain and lagged data, is highly aggregated, is based on questionable assumptions, and is rebased each year.
7.49 Regional and sector variation: There is wide variation in the availability of training places across England, which is not reflected in the modelling. This meant that certain areas of the country do not have the shortages that other areas suffer, due to population, demographics, the location of graduates and the desirability of living in certain locations rather than others. Additionally:
Independent schools in the main have better funding and greater visibility of projected pupil numbers well in advance as well as the tools to be more proactive in their recruitment process so recruit early and are able to attract staff at a time when there are lots of options available.
Independent schools are considered a highly desirable option for teachers, so often will be at the top of teachers’ priority list for a new job.
The state sector have varied success in recruiting teachers due to a number of factors as follows:
o OFSTED rating of the school influencing teachers’ decisions. Lower rated schools are disadvantaged when hiring.
o Location of the school, if it is remote or in an undesirable area.
o Budget can limit the timing and frequency of recruitment.
o Lack or resources, time and knowledge to recruit effectively.
o Inability to make official decisions until an in-post teacher resigns.
7.50 Saving money: Some respondents said that, in their view, schools were now looking to recruit newly qualified teachers rather than more experienced ones as a way of saving costs. The traditional view of schools aiming to achieve a mix of experienced and less experienced staff was being challenged and schools will look to newly qualified staff, not just
Chapter 7: Sensible
136
because they add to the mix of current staff members, but because they will cost the school less to employ.
Steps to address shortages
7.51 Some respondents said that although there have been more university places made available to train teachers of maths and science, this had not translated into more of these teachers entering the profession. Many of the schools that offer school-centred initial teacher training have struggled to fill their places, with many not having enough to start a course.
Devolved administrations
Scotland
7.52 The evidence from the Scottish Government and COSLA identified a number of factors that they felt exacerbated difficulties in recruiting teachers in Scotland. Rurality and perceived geographical isolation were said to cause significant challenges for some local authorities. Out of the 22 local authority case studies that the evidence reflected, Aberdeenshire, Argyll & Bute, Eilean Siar (Outer Hebrides), Dumfries & Galloway, Highland, Perth & Kinross, Stirling, and South Lanarkshire all identified rural locations as a major challenge to teacher recruitment.
7.53 The cost of living in some areas of Scotland was also highlighted as causing difficulties. Specifically, in Aberdeen and parts of the north east, the higher cost of living created issues with teacher recruitment. The cost of housing was an important factor in the overall cost of living and in some parts of the north east in particular, a lack of affordable housing to buy or rent deters people from moving there if they know that their salary would go further in other parts of the country.
7.54 Many areas in Scotland said that they suffered from the demographic challenges of an increasing ageing population and a decreasing working age population. Local authorities, such as Dumfries and Galloway, also highlighted the polarised make up of their teacher workforce where a significantly high proportion of teachers are at either end of the working age.
7.55 In order to tackle some of these issues, local authorities were engaging in work to make graduates aware of the potential employment opportunities in their areas. The Scottish Government had allocated more funded student places to the University of Aberdeen as that area has the greatest need for more teachers. However, in both 2014-15 and 2015-16, the University of Aberdeen fell short of their recruitment target for their PGDE Secondary programme.
7.56 The Scottish Government told us that local authorities in Scotland only recruited teachers from outside the EEA in small numbers. Eilean Siar had engaged the services of a recruitment agency for teachers and employed 3
Chapter 7: Sensible
137
teachers through this agency on one year contracts. Dumfries and Galloway Council had linked up with St Francis Xavier University in Nova Scotia to provide placements in spring 2016 while Aberdeen City Council had sent staff to Canada and Ireland to try to recruit teachers.
7.57 Local authorities in Scotland cited some key barriers in the recruitment of non-EEA teachers. The length of the visa application process impacted on their ability to fill positions in time for the start of term. Certificate of Sponsorship applications were being rejected as applications were not scoring enough points, and authorities felt that other higher salaried/qualified jobs were being prioritised instead.
7.58 The Scottish Government and COSLA set out a number of initiatives being pursued in Scotland to alleviate teacher shortages. One issue they said they had to contend with was a shortage of supply teachers. Thirteen local authorities raised this issue, one gave the example that whereas normally their supply register would list over 200 available teachers, currently the number for primary schools is 59, but from this pool 27 either have full-time or part-time contracts, leaving 32 teachers on their available list.
7.59 The Scottish Negotiating Committee for Teachers (SNCT) Handbook on teachers’ pay enables local authorities to increase the salary of a particular post where they are finding it hard to fill as well as offering relocation and other financial incentives. Local authorities in Scotland reported that they have had some success with offering this flexibility. For example, many rural local authorities are offering Probationer Waver Payments whereby £8000 is offered to secondary teachers (£5000 on appointment and £3000 after 3 years satisfactory service) and £6000 offered to primary teachers (£4000 on appointment and £2000 after 3 years satisfactory service). This can be applied to posts which have been identified as hard to fill following two unsuccessful recruitment exercises.
7.60 Many local authorities said that they were offering permanent contracts for vacancies that would normally only be fixed term in order to attract applications. However, authorities said that offering permanent contracts and preference waiver payments did not ensure provision. For example, Highland Council were allocated a large number of secondary school probationers who were paid the preference waiver payment. The Council offered permanent posts at an early stage but most probationers wished to return to the central belt at the end of their probationary period.
7.61 Continuous advertising is being used to maintain the supply pool. For example, Falkirk’s recruitment process is ongoing throughout the year. Although vacancies may be temporary, teachers are recruited on a permanent basis, cover the temporary assignment and then reallocated to another post.
7.62 Local authorities in Scotland also gave evidence of schemes they were running to attract graduates into teaching. Distance learning was being

Chapter 7: Sensible
138
used to encourage one Council’s own employees to think about a teaching career. Other councils were working in conjunction with local universities to develop programmes to encourage workers in other industries into teaching.
7.63 Authorities are looking at how they can effectively engage with retired staff. For example, one council approaches retiring staff to ask whether they would wish to be engaged in temporary or supply roles and then subsequently support them with maintaining their teacher registration and professional updates.
Wales and Northern Ireland
7.64 Broadly speaking, although there was good quality data provided by analyst sources in Wales and Northern Ireland, there was very little partner evidence. The devolved administrations themselves said that neither administration was experiencing a shortage of teachers.
“It can be said that in general terms, Wales does not have the same level of problems relating teacher recruitment as in England, although it is recognised that there are challenges in Wales relating to the recruitment of head teachers.”
Wales Education Workforce council response to MAC call for evidence
“From a Northern Ireland perspective...There is no shortage of teachers and in fact we would have a significant surplus of teachers on the Northern Ireland Teachers Substitute Register (NISTR)...Interestingly many students move to England to undertake their initial teacher education but tend to return to Northern Ireland to look for work increasing the NISTR pool further. The Department of Education caps the number of number of ITE places allocated locally and has reduced them by over 30% in recent years to try and address the problem of oversupply.”
Northern Ireland Department of Education response to MAC call for evidence
7.6 Summary and conclusions
7.65 This section summarises our consideration of the sensible part of our skilled, shortage, sensible methodology and sets out our conclusions. The first issue to be dealt with is how to reconcile the low numbers of teachers using the Tier 2 route with a consideration that teachers in some subjects are in shortage.
7.66 Only teachers in maths and physics can be brought to the UK from outside the EEA through the Tier 2 SOL route and we consider the implications of
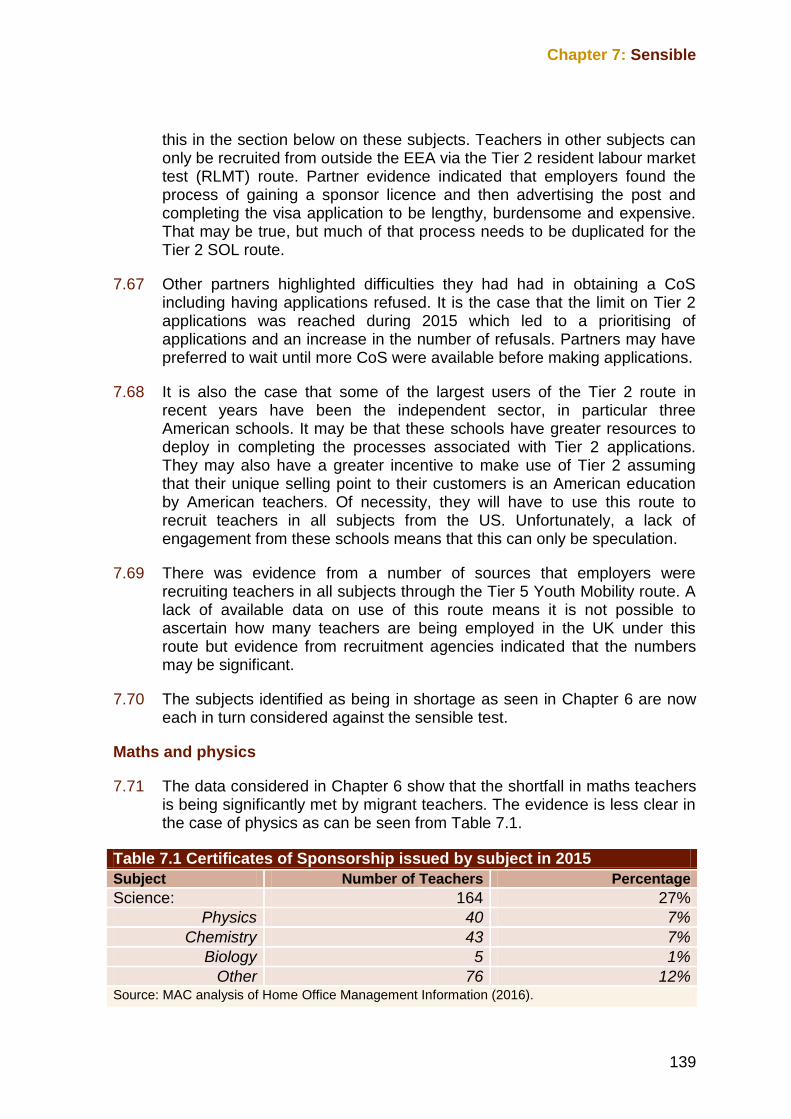
Chapter 7: Sensible
139
this in the section below on these subjects. Teachers in other subjects can only be recruited from outside the EEA via the Tier 2 resident labour market test (RLMT) route. Partner evidence indicated that employers found the process of gaining a sponsor licence and then advertising the post and completing the visa application to be lengthy, burdensome and expensive. That may be true, but much of that process needs to be duplicated for the Tier 2 SOL route.
7.67 Other partners highlighted difficulties they had had in obtaining a CoS including having applications refused. It is the case that the limit on Tier 2 applications was reached during 2015 which led to a prioritising of applications and an increase in the number of refusals. Partners may have preferred to wait until more CoS were available before making applications.
7.68 It is also the case that some of the largest users of the Tier 2 route in recent years have been the independent sector, in particular three American schools. It may be that these schools have greater resources to deploy in completing the processes associated with Tier 2 applications. They may also have a greater incentive to make use of Tier 2 assuming that their unique selling point to their customers is an American education by American teachers. Of necessity, they will have to use this route to recruit teachers in all subjects from the US. Unfortunately, a lack of engagement from these schools means that this can only be speculation.
7.69 There was evidence from a number of sources that employers were recruiting teachers in all subjects through the Tier 5 Youth Mobility route. A lack of available data on use of this route means it is not possible to ascertain how many teachers are being employed in the UK under this route but evidence from recruitment agencies indicated that the numbers may be significant.
7.70 The subjects identified as being in shortage as seen in Chapter 6 are now each in turn considered against the sensible test.
Maths and physics
7.71 The data considered in Chapter 6 show that the shortfall in maths teachers is being significantly met by migrant teachers. The evidence is less clear in the case of physics as can be seen from Table 7.1.
Table 7.1 Certificates of Sponsorship issued by subject in 2015
Subject Number of Teachers Percentage
Science: 164 27%
Physics 40 7%
Chemistry 43 7%
Biology 5 1%
Other 76 12% Source: MAC analysis of Home Office Management Information (2016).
Chapter 7: Sensible
140
7.72 It is open to employers to fill all their vacancies in these subjects by non-EEA recruitment but there are a number of factors which may prevent them from doing this. For a short period in 2015, the Tier 2 limit on CoS was reached and a number of employers may have had applications for maths and physics teachers refused or may have delayed making applications until more CoS became available. Additionally, there could be a worldwide shortage of maths and physics teachers. The UK data showed that graduates in maths and physics could earn considerably more in occupations other than teaching. If this is replicated worldwide, it is easier to posit that maths and physics graduates have much better offers open to them than teaching.
7.73 This rationale also applies to the fact that maths and physics teachers have been on the SOL for the past 8 years. Although it would normally be expected that employers take action to address shortages without the need to remain on the SOL as a long term option, the pay differentials for maths and physics teachers compared to other occupations offer an indication of how difficult it might be to persuade graduates in these subjects to enter teaching. The significant bursaries on offer in these subjects indicate that employers are very aware of this issue. It would also help to evaluate how effective such bursaries have been in attracting and retaining teaching staff in these subjects. There is more that employers could do to improve pay for graduates in these subjects but it is not certain that even a significant increase in pay would be sufficient to address the shortages in these subjects. We therefore conclude that maths and physics teachers pass the sensible test.
7.74 We were also asked to consider adding a broader category of science teachers to the SOL in addition to teachers specialising in individual science fields. We gave careful consideration to this. Our analysis indicates that although physics teachers are in shortage the same cannot be said for chemistry and biology teachers. However, we understand that general science teachers teach across the three individual disciplines and that this will include teaching physics in addition to chemistry and biology.
“It is interesting to note that there are more general science vacancies than any particular strand of science. There are many schools that need scientists to teach a combination of sciences to fill all the gaps within a school timetable. The fact that chemistry and physics are considered shortage and that science and biology are not doesn’t make sense. Shortage will only be awarded if the title is physics or chemistry teacher and is often more relative to sixth form colleges and schools with a sixth form. The majority of science departments within schools require teachers to teach general science and a strand, whether that be physics, chemistry, biology or a combination.”
Recruitment agency response to MAC call for evidence
Chapter 7: Sensible
141
“A qualified teacher in England is, in theory, qualified to teach any subject...Therefore, in science subjects, other science teachers or supply teachers may be used to fill gaps outside their own specialism...”
Royal Society response to MAC call for evidence
7.75 Taking account of all the available evidence, we concluded that it is sensible to allow schools to recruit science teachers from outside the EEA on the basis that such teachers will have to teach a shortage subject (namely, physics) and that it is not being used as a back door route to enable schools to bring in chemistry and biology teachers who are not in shortage. We recommend that science teachers be added to the SOL.
Computer science
7.76 Only a very small number of computer science teachers were recruited from outside the UK using the Tier 2 resident labour market test route. It may be that employers are meeting this shortfall through the Tier 5 Youth Mobility route identified above. More likely, given the high proportion of lessons taught by teachers without a relevant post A-level qualification, the shortage is being met by teachers qualified in other subjects.
7.77 Pay for computer science graduates who become teachers is less than in other occupations. Previous MAC consideration of the digital technology and finance sectors have indicated the high level of demand for staff with computing skills, a fact reflected in the inclusion of some of these jobs on the SOL. Schools may find it increasingly difficult to attract computer science graduates into teaching given the demand for these graduates in occupations that can make them a better offer. We therefore conclude that computer science teachers pass the sensible test.
Mandarin
7.78 Mandarin teachers may be considered outliers of the available data. The numbers of such teacher are small and that there is an even smaller potential supply of such teachers in the UK. In order to grow this supply, it seems necessary to bring in teachers from outside of the EEA. The DfE has identified a need for 80 Mandarin teachers to be recruited by 2020 and we consider this to be reasonable. We therefore consider that Mandarin teachers meet the sensible test.
Modern foreign languages
7.79 Notwithstanding the evidence indicating a shortage in teachers of these subjects, there was no evidence indicating that any modern foreign language teachers were recruited from outside the EEA. Indeed, in the absence of any data suggesting otherwise, it is very difficult to conclude that it is more sensible to recruit teachers of French, German and Spanish
Chapter 7: Sensible
142
from outside the EEA than from within it. We therefore conclude that modern foreign language teachers fail the sensible test.
7.80 The obvious answer to teacher shortages is to recruit more UK graduates into teaching and note has been taken of the efforts that have been made to do this. There is a shortfall in teachers in some subjects and the MAC analysis shows that some of this may be due to pay differentials when compared with other occupations. A number of partners said that it was not possible to increase teachers’ pay owing to the government imposed pay restraint. It was recognised that most schools are now academies, and so have greater flexibility over pay, but partners said that most do not do so to any significant extent. Public sector pay restraint is a choice not an absolute constraint and, as the School Teacher Review Body pointed out in its last report, pay restraint may cause increasing strains if the aggregate labour market continues to strengthen. Evidence was also received about the limited use made of recruitment and retention payments and on the fear of causing staff room disharmony through differentiated pay arrangements. Both differentiated pay and targeted recruitment and retention payments are reasonable options that employers would normally want to make use of to address recruitment difficulties and it was not apparent why the teaching profession should be an exception to this.
7.81 However, some other subjects are experiencing shortage even when the pay offer in teaching is competitive with or better than that in other occupations. Therefore, other factors than lower pay may be generating shortages. Some of these shortages may reflect lower numbers of graduates choosing to study these subjects and/or an international shortage of graduates in these subjects. It is the case that numerical skills are increasingly in demand as evidenced by the fact that the MAC have recommended STEM based occupations in engineering, medicine and IT for inclusion on the SOL. Shortages in subjects such as maths, physics and computer science may be reflective of this.
7.82 We have set out in this report the evidence and data we have looked at in reaching our recommendations. Our analysis shows that there are some shortages in some subjects for which it would be sensible to fill through migrants from outside the EEA. For those subjects that we do not recommend for inclusion on the SOL and, in the case of chemistry, that we recommend for removal, we consider that should employers genuinely be unable to fill vacancies in this subjects they will still have recourse to the resident labour market test route to recruit teachers from outside the EEA.
7.83 As we have pointed out elsewhere in this report, we suspect that employers are making relatively wide use of the Tier 5 (Youth Mobility) route to recruit migrant teachers. The advantage to these subjects of being on the SOL, if they are also subject to a resident labour market test, is therefore limited to some prioritisation should the Tier 2 limit be reached and an exemption to the £35,000 salary threshold should migrants wish to apply for settlement.
Chapter 7: Sensible
143
7.84 We recognise that the minimum salary threshold for Tier 2 migrants will increase to £30,000 by April 2017 while the minimum threshold for new entrants will remain at £20,800. This may have an impact on employer decisions about employing migrants, for instance they may prefer to recruit newly qualified migrant teachers over more experienced ones. This may have an impact on pupil outcomes. But these are decisions for employers.
7.85 It is the case that secondary school teachers in maths, physics, chemistry, computer science and Mandarin are exempt from the new salary threshold and, where these subjects are not included on the SOL, they shall be given extra weighting in the monthly allocation of Tier 2 CoS. Both of these measures were announced in a written ministerial statement on 24 March 2016 and will apply until July 2019. Therefore, the impact of the removal of chemistry teachers from the SOL will be ameliorated by this subject having the same benefits as those on the SOL on a mark-time basis.
7.86 We recommend that secondary school teachers in the following subjects be retained on the SOL:
maths
physics
7.87 We recommend that secondary school teachers in the following subjects be added to the SOL:
computer science
Mandarin
science
7.88 We recommend that secondary school teachers in the following subjects be removed from the SOL:
chemistry

145
Chapter 8 Summary of recommendations
8.1 Introduction
8.1 We are grateful to all the partners that contributed to the evidence base and that supplied data for this partial review of the shortage occupation list (SOL). Like our review of nurses from March 2016 (Migration Advisory Committee, 2016b), this report has focussed on just one occupation (teachers), albeit one separated into three different standard occupational classification (SOC) system codes.
8.2 Our report takes into account evidence and data from both the state and independent schools sectors and also looks at the UK as a whole as well as England, Northern Ireland, Scotland and Wales where the evidence was different for each of those countries. The following section summarises our recommendations for the SOL for the UK as a whole. We looked carefully at the evidence relating to teachers in Scotland but did not find that there was sufficient evidence to conclude that we should make separate, different recommendations in relation to the Scotland only SOL.
8.3 The three SOC codes that we looked at were:
SOC 2314 Secondary education teaching professionals
SOC 2315 Primary and nursery education teaching professionals
SOC 2315 Special needs education teaching professionals
8.4 The evidence and data did not lead us to conclude that there was an occupation-wide shortage of teachers across all or any of these three SOC codes. So we looked to see whether any shortages were congregated around specific teaching subjects.
8.2 Teachers presently on the SOL
8.5 Secondary school teachers in maths, physics and chemistry are presently included on the SOL. We found that teachers in maths and physics met our shortage and sensible methodological test but that there was not sufficient evidence of a shortage of chemistry teachers.
Chapter 8 Summary of recommendations
Chapter 8: Summary of recommendations
146
8.3 Other teaching subjects
8.6 Of the other teaching subjects that we looked at in detail, we found that teachers in computer science, Mandarin and general science met our shortage and sensible test. Teachers in modern foreign languages were found to be in shortage but we concluded that it was not sensible to seek to fill shortages in teachers of European languages from outside of Europe.
8.7 We did not find sufficient evidence of a shortage of primary and nursery teachers, nor of teachers in special schools.
8.4 Migration routes
8.8 The evidence and data that we looked at did not indicate significant numbers of migrant teachers coming to the UK from outside the EEA via the Tier 2 route, whether using the SOL or the RLMT. We did receive evidence suggesting that more teachers were arriving via the Tier 5 (Youth Mobility Scheme) route than through Tier 2. Users of the Tier 5 route are entitled to work as teachers should they wish but data is not centrally captured on the extent to which this happens. The government might like to think about ways in which it could work collectively to better understand the role that the Tier 5 route plays in filling teacher vacancies.
8.5 Recommendations
8.9 We recommend that the following jobs be retained on the SOL:
2314 Secondary education teaching professionals ONLY the following jobs in this occupation code: secondary education teachers in the subjects of maths and physics.
8.10 We recommend that the following jobs be added to the SOL:
2314 Secondary education teaching professionals ONLY the following jobs in this occupation code: secondary education teachers in the subjects of computer science, Mandarin and science.
8.11 We recommend that the following jobs be removed from the SOL:
2314 Secondary education teaching professionals ONLY the following jobs in this occupation code: secondary education teachers in the subject of chemistry.
Annex A: Consultation
147
Annex A Consultation
A.1 List of organisations that responded to the call for evidence who did not request anonymity
Association of Graduate Careers Advisory Services
Association of School and College Leaders
ATL, The Education Union
Catholic Education Service
Department for Education
Department of Education Northern Ireland
Downside School
Dulwich College
Educational Institute of Scotland
Hampshire County Council
Independent Schools Council
K Kelleher
London Borough of Redbridge
National Association of Schoolmasters Union of Women Teachers (NASUWT)
National Association Head Teachers
National Association School-Based Teacher Trainers
National Foundation for Educational Research
National Union Teachers (NUT)
Oxford Teacher Services
Annex A Consultation
Annex A: Consultation
148
Ponteland Middle School
Recruitment and Employment Confederation
Scottish Council of Independent Schools
Scottish Government / COSLA
St George's School Harpenden
Stop35K.org
TES Global
The Gatsby Charitable Foundation
The Royal Society
Trades Union Congress (TUC)
Wales Education Workforce Council
Wellcome Trust
Welsh Local Government Association
Wokingham Borough Council
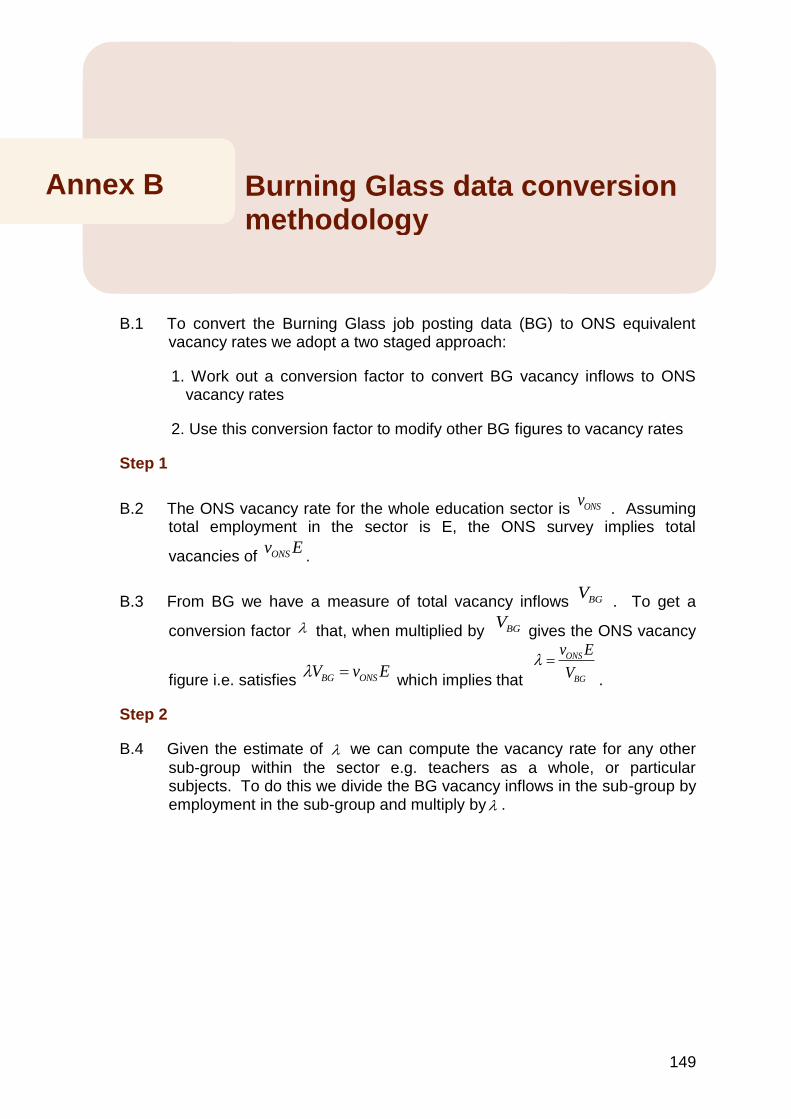
Annex A: Consultation
149
Annex B Burning Glass data conversion methodology
B.1 To convert the Burning Glass job posting data (BG) to ONS equivalent vacancy rates we adopt a two staged approach:
1. Work out a conversion factor to convert BG vacancy inflows to ONS vacancy rates
2. Use this conversion factor to modify other BG figures to vacancy rates
Step 1
B.2 The ONS vacancy rate for the whole education sector is ONSv . Assuming
total employment in the sector is E, the ONS survey implies total
vacancies of ONSv E.
B.3 From BG we have a measure of total vacancy inflows BGV . To get a
conversion factor that, when multiplied by BGV gives the ONS vacancy
figure i.e. satisfies BG ONSV v E which implies that
ONS
BG
v E
V
.
Step 2
B.4 Given the estimate of we can compute the vacancy rate for any other
sub-group within the sector e.g. teachers as a whole, or particular subjects. To do this we divide the BG vacancy inflows in the sub-group by employment in the sub-group and multiply by .
Annex B Burning Glass data conversion methodology
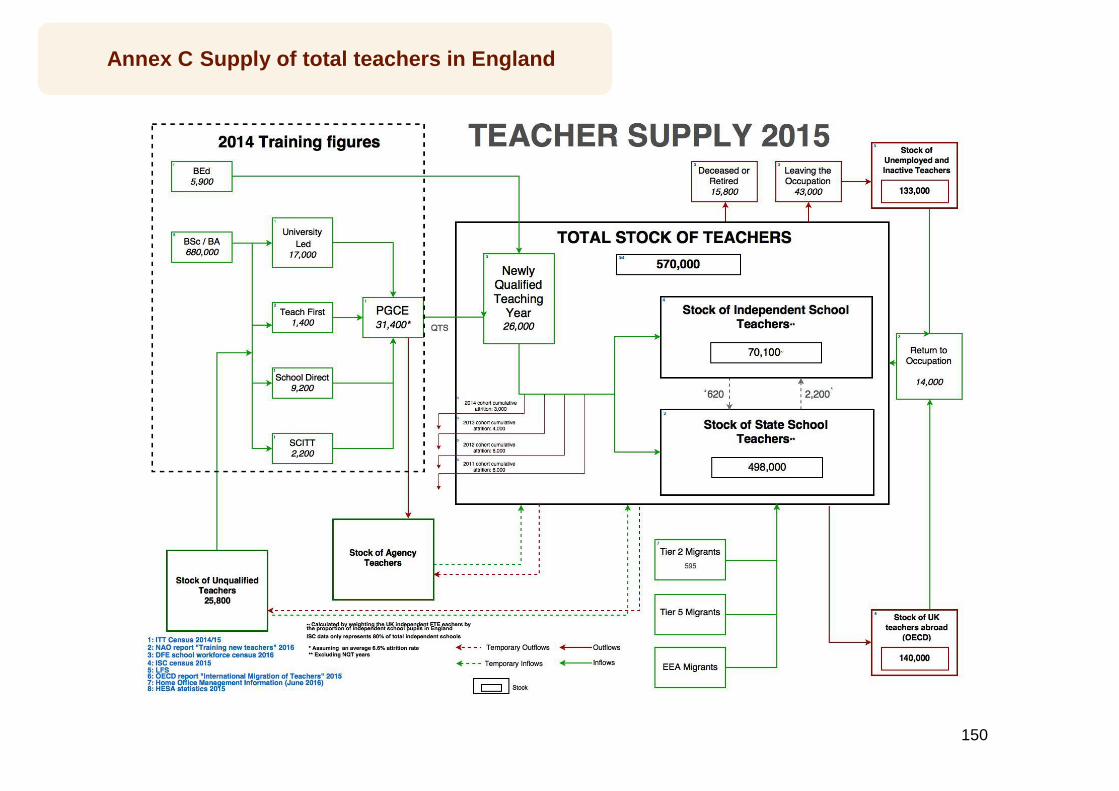
150
Annex C Supply of total teachers in England
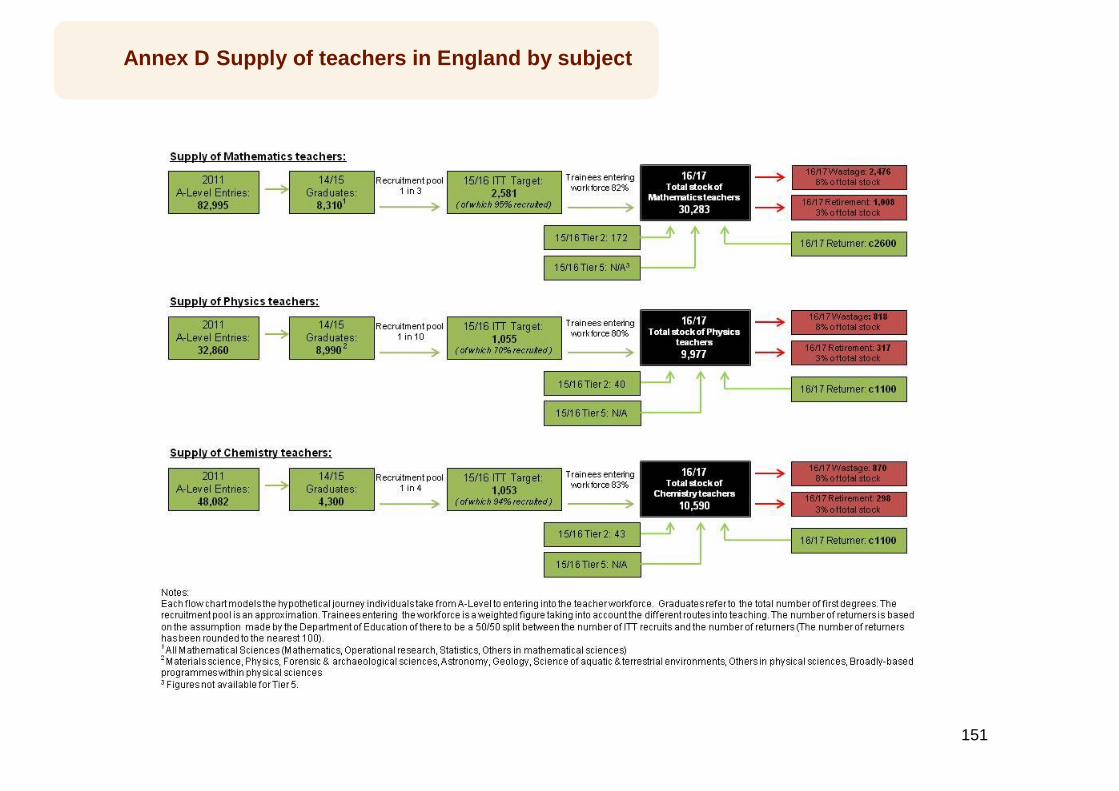
151
Annex D Supply of teachers in England by subject
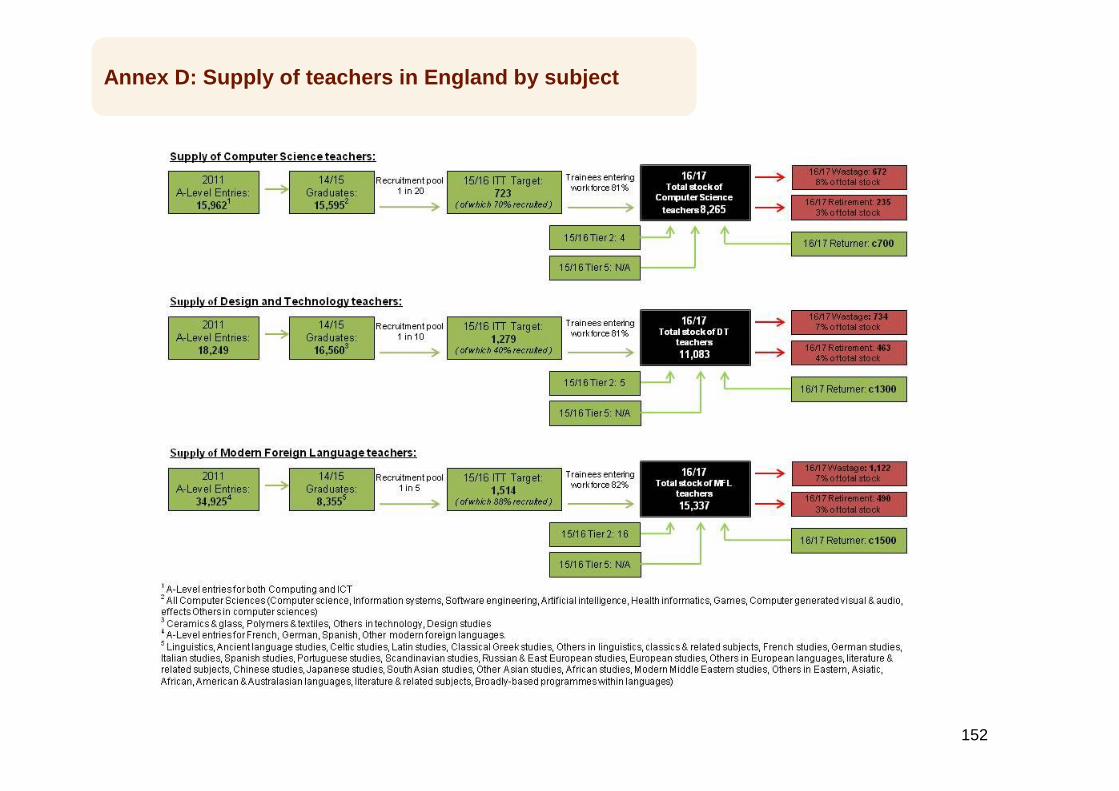
152
Annex D: Supply of teachers in England by subject
153
Abbreviations
AGCAS Association of Graduate Careers Advisory Services ASCL Association of School and College Leaders ATL Association of Teachers and Lecturers CES Catholic Education Service CoS Certificate of Sponsorship DfE Department for Education EA Education Authority EBACC English Baccalaureate EIS Educational Institute of Scotland EEA European Economic Area HCC Hampshire County Council HEI Higher Education Institution ISC Independent School Council ITET Initial Teacher Education Training ITT Initial Teacher Training LA Local Authority LEA Local Education Authority LBR London Borough of Redbridge MAC Migration Advisory Committee NASBTT National Association for School Based Teacher Training NAHT National Association of Head Teachers NASUWT National Association of Schoolmasters Union of Women NFER National Foundation for Educational Research NQF6+ National Qualifications Framework Level 6 NUT National Union of Teachers NQT Newly Qualified Teacher NDPB Non Departmental Public Body ONS Office for National Statistics PBS Points Based System PGCE Postgraduate Certificate in Education PTR Pupil Teacher Ratio QTS Qualified Teacher Status REC Recruitment and Employment Confederation RLMT Resident Labour Market Test RCoS Restricted Certificate of Sponsorship SCITT School-Centred Initial Teacher Training SCIS Scottish School of Independent School
Abbreviations
Abbreviations
154
SOL Shortage Occupation List SOC Standard Occupation Code STEM Science, technology, engineering and maths SWC School Workforce Census TES Global Teacher Education Supplement TPSM Teacher Planning and Supply Model TSM Teacher Supply Model TQ Teaching Qualification TUC Trade Union Congress WEWC Wales Education Women Council WLGA Welsh Local Government Association
References
155
References
ASHE (2015), “Annual Survey of Hours and Earnings, 2015, “Annual Survey of Hours and Earnings: 2015 Provisional Results. Table 14 - Occupation (4 digit SOC 2010)”, available at http://www.ons.gov.uk/employmentandlabourmarket/peopleinwork/earningsandworkinghours/datasets/occupation4digitsoc2010ashetable14
Burning Glass Technologies (2017), “Labour Insight Real-Time Labour Market
Information Tool,” available at http://www.burning-glass.com
Department for Business, Innovation & Skills (2016), “Graduate labour market
statistics: 2015”, available at https://www.gov.uk/government/statistics/graduate-
labour-market-statistics-2015, April 2016
Department for Education (2013), “School Teachers’ Pay and Conditions Document 2013 and Guidance on School Teachers’ Pay and Conditions”, available at https://media.education.gov.uk/assets/files/pdf/s/130806%202013%20stpcd%20master%20final.pdf, September 2013 Department for Education (2013), “Education and training statistics for the UK: 2013”, available at https://www.gov.uk/government/statistics/education-and-training-statistics-for-the-uk-2013, November 2013 Department for Education (2015), “2010 to 2015 government policy: academies and free schools”, available at https://www.gov.uk/government/publications/2010-to-2015-government-policy-academies-and-free-schools/2010-to-2015-government-policy-academies-and-free-schools, May 2015 Department for Education (2015), “National pupil projections: July 2015”, available at https://www.gov.uk/government/collections/statistics-pupil-projections, July 2015 Department for Education (2015), “Consultation on implementing the English Baccalaureate”, available at https://www.gov.uk/government/consultations/implementing-the-english-baccalaureate, November 2015
References
References
156
Department for Education (2016), “Bursaries and funding”, available at https://getintoteaching.education.gov.uk/funding-and-salary/overview Department for Education (2016), “Education excellence everywhere”, available at https://www.gov.uk/government/publications/educational-excellence-everywhere, March 2016 Department for Education (2016), “School workforce in England: November 2015”, available at https://www.gov.uk/government/statistics/school-workforce-in-england-november-2015, July 2016 Department for Education (2016), “Pupils across England start intensive lessons in Mandarin”, available at https://www.gov.uk/government/news/pupils-across-england-start-intensive-lessons-in-Mandarin, September 2016 Department for Education (2016), “School workforce in England 2010 to 2015: trends and geographical comparisons. 1.5b. Regional trends in the proportion of hours taught to pupils in years 7 to 13 by a teacher with a relevant post A level qualification – English and humanities (2010 to 2015)”, available at https://www.gov.uk/government/statistics/local-analysis-of-teacher-workforce-2010-to-2015, September 2016 Department for Education and National College for Teaching and Leadership (2015), “Teacher Supply Model 2016/17 Part 1and Part 2 publication version”, available at https://www.gov.uk/government/publications/teacher-supply-model, October 2015 Department for Education and National College for Teaching and Leadership (2015), “Initial teacher training: trainee number census - 2015 to 2016”, available at: https://www.gov.uk/government/statistics/initial-teacher-training-trainee-number-census-2015-to-2016, November 2015 Department for Education and National College for Teaching and Leadership (2016), “Initial teacher training: trainee number census - 2016 to 2017”, available at https://www.gov.uk/government/collections/statistics-teacher-training, November 2016 Dolton. P. (2013), CentrePiece, “The status of teachers”, available at http://cep.lse.ac.uk/pubs/download/cp402.pdf, October 2013 Dolton, P., Tremayne, A., Chung, T. (2003). “The Economic Cycle and Teacher Supply”, available at https://www.oecd.org/edu/school/2506610.pdf, March 2003 Furlong, J., Hagger, H., Butcher, C. (2006), “Review of Initial Teacher Training Provision in Wales”, available at http://www.education.ox.ac.uk/wordpress/wp-content/uploads/2010/07/CE-Report-Annex-A-Review-of-ITT-provision-in-Wales-English.pdf, January 2006 Higher Education Statistical Authority (2013), “2011/12 HE qualifications obtained by subject of study, level of qualification and class of first degree (Table 16)”,
https://www.gov.uk/government/statistics/initial-teacher-training-trainee-number-census-2015-to-2016
References
157
available at https://www.hesa.ac.uk/data-and-analysis/students/overviews?keyword=586&breakdown%5B%5D=578&year=10 Higher Education Statistical Authority (2014), “2012/13 HE qualifications obtained by subject of study, level of qualification and class of first degree (Table 16)”, available at https://www.hesa.ac.uk/data-and-analysis/students/overviews?keyword=586&breakdown%5B%5D=578&year=9 Higher Education Statistical Authority (2015), “2013/14 HE qualifications obtained by subject of study, level of qualification and class of first degree (Table 16)”, available at https://www.hesa.ac.uk/data-and-analysis/students/overviews?keyword=586&breakdown%5B%5D=578&year=3 Higher Education Statistical Authority (2016), “2014/15 HE qualifications obtained by subject of study, level of qualification and class of first degree (Table 16)”, available at https://www.hesa.ac.uk/data-and-analysis/students/overviews?keyword=586&breakdown%5B%5D=578&year=2 Home Office (2016), “Immigration Rules Appendix J: codes of practice for skilled work”, available at www.gov.uk/government/uploads/system/uploads/attachment_data/file/302699/20140410_Immigration_Rules_-_Appendix_J_MASTER.pdf. Home Office (2016), “Work Immigration Statistics”, available at https://www.gov.uk/government/publications/immigration-statistics-april-to-june-2016/work, August 2016 House of Commons (2016), “Teachers: supply, retention and workload”, available at http://researchbriefings.parliament.uk/ResearchBriefing/Summary/CBP-7222#fullreport, February 2016 House of Commons (2016), “Training new teachers”, available at http://www.publications.parliament.uk/pa/cm201617/cmselect/cmpubacc/73/7306.htm, June 2016 House of Commons Education Committee (2012), “Great teachers: attracting, training and retraining the best”, available at http://www.publications.parliament.uk/pa/cm201012/cmselect/cmeduc/1515/1515.pdf, April 2012 Independent Schools Council (2016), “ISC Census and annual report”, available at: http://www.isc.co.uk/media/3179/isc_census_2016_final.pdf, April 2016 Institute for Fiscal Studies (2016), “The Longer-Term Costs and Benefits of Different Initial Teacher Training Routes”, available at https://www.ifs.org.uk/uploads/publications/comms/R118.pdf, July 2016 Joint Council for Qualifications CIC (2016), “Appendix - GCSE Appendix - GCSE, Project and Entry Level Trends 2015”, available at http://www.jcq.org.uk/examination-results
References
158
Joint Council for Qualifications CIC (2016), “GCE Trends 2016”, available at http://www.jcq.org.uk/examination-results Migration Advisory Committee (2008), “Skilled, Shortage, Sensible: The recommended shortage occupation lists for the UK and Scotland”, available at https://www.gov.uk/government/publications/recommended-shortage-occupation-lists-for-the-uk-and-scotland-sep-2008, London, September 2008 Migration Advisory Committee (2009), “Skilled, Shortage, Sensible: Second review of the recommended shortage occupation lists for the UK and Scotland”, available at https://www.gov.uk/government/publications/recommended-shortage-occupation-lists-for-the-uk-and-scotland-second-review-oct-2009, London, October 2009 Migration Advisory Committee (2011a), “Skilled, Shortage, Sensible: Full review of the recommended shortage occupation lists for the UK and Scotland”, available at https://www.gov.uk/government/publications/recommended-shortage-occupation-lists-for-the-uk-and-scotland-full-review-sep-2011, London, September 2011 Migration Advisory Committee (2011b), “Settlement rights of migrants in Tier 1 and Tier 2”, available at https://www.gov.uk/government/publications/settlement-rights-of-migrants-tier-1-and-2, London, November 2011 Migration Advisory Committee (2013), “Skilled, Shortage, Sensible: Full review of the recommended shortage occupation lists for the UK and Scotland, a sunset clause and the creative occupations”, available at https://www.gov.uk/government/publications/recommended-shortage-occupation-lists-for-the-uk-and-scotland-full-review-with-sunset-clause-feb-2013, London, February 2013 Migration Advisory Committee (2015a), “Migrants in low-skilled work”, available at https://www.gov.uk/government/publications/migration-advisory-committee-mac-review-tier-2-migration, London, July 2015 Migration Advisory Committee (2015b), “Tier 1 Entrepreneur and Graduate Entrepreneur routes”, available at https://www.gov.uk/government/publications/migration-advisory-committee-mac-review-tier-2-migration, London, October 2015 Migration Advisory Committee (2016a), “Review of Tier 2: Balancing migrant selectivity, investment in skills and impacts on UK productivity and competitiveness”, available at https://www.gov.uk/government/publications/migration-advisory-committee-mac-review-tier-2-migration, London, January 2016 Migration Advisory Committee (2016b), “Partial review of the shortage occupation list: Review of nursing”, available at
References
159
https://www.gov.uk/government/publications/migration-advisory-committee-mac-partial-review-shortage-occupation-list-and-nursing, London, March 2016 Migration Advisory Committee (2017), “Assessing labour market shortages – A methodology update”, London, January 2017 National Audit Office (2016), “Training new teachers”, available at https://www.nao.org.uk/report/training-new-teachers/, February 2016 National Foundation for Educational Research (2015), “Should I Stay or Should I Go? NFER Analysis of Teachers Joining and Leaving the Profession”, available at https://www.nfer.ac.uk/publications/LFSA01/LFSA01.pdf, November 2015 Northern Ireland Department of Education (2015), “Education workforce - 2014/15”, available at https://www.education-ni.gov.uk/articles/education-workforce, June 2015 Northern Ireland Department for Education (2016), “Teacher vacancies, sickness absence and substitution statistics”, available at https://www.education-ni.gov.uk/publications/education-workforce-201516, June 2016 Northern Ireland Department of Education (2016), “Education workforce - 2015/16”, available at https://www.education-ni.gov.uk/articles/education-workforce, November 2016 Office for Budget Responsibility (2016), “Economic and fiscal outlook – November 2016”, available at http://budgetresponsibility.org.uk/efo/economic-and-fiscal-outlook-november-2016/, November 2016 Office for National Statistics (2010), “Standard Occupational Classification 2010: Volume 2 The Coding Index”, available at http://www.ons.gov.uk/methodology/classificationsandstandards/standardoccupationalclassificationsoc/soc2010/soc2010volume2thestructureandcodingindex Office for National Statistics (2016), “VACS02: Vacancies by industry”, available at https://www.ons.gov.uk/employmentandlabourmarket/peoplenotinwork/unemployment/datasets/vacanciesbyindustryvacs02/current, August 2016 Office for National Statistics (2016), “uksummaryteachersinchildcare”, available at https://www.ons.gov.uk/file?uri=/employmentandlabourmarket/peopleinwork/employmentandemployeetypes/adhocs/005734estimatesofpublicsectorteachingprofessionalsandthoseinchildcareoccupationsworkingintheukbycountryofbirthforyears2011to2014/uksummaryteachersincchildcare.xls Office for National Statistics (2016), “Annual Population Survey, individual datasets 2011 to 2014 - Public Sector workers within SIC 85.1-85.3 Pre-Primary, Primary and Secondary Education and SOC 231 Teaching and Education Professionals and 612 Childcare and Related Personal Services. By Country of Birth 2011-2014. Residents of UK”, available at
References
160
https://www.ons.gov.uk/employmentandlabourmarket/peopleinwork/employmentandemployeetypes/adhocs/005734estimatesofpublicsectorteachingprofessionalsandthoseinchildcareoccupationsworkingintheukbycountryofbirthforyears2011to2014 Office for National Statistics (2016), “Migration Statistics Quarterly Report: Dec 2016”, available at https://www.ons.gov.uk/peoplepopulationandcommunity/populationandmigration/internationalmigration/bulletins/migrationstatisticsquarterlyreport/dec2016, December 2016 Organisation for Economic Co-operation and Development (OECD) (2013), “TALIS - Publications and documents”, available at https://www.oecd.org/edu/school/talis-publications-and-documents.htm Organisation for Economic Co-Operation and Development (OECD) (2015), “International Migration Outlook 2015”, available at http://dx.doi.org/10.1787/migr_outlook-2015-en, September 2016 Organisation for Economic Co-operation and Development (OECD) (2015), “Education at a glance”, available at http://www.oecd-ilibrary.org/education/education-at-a-glance-2015/ratio-of-students-to-teaching-staff-in-educational-institutions-2013_eag-2015-table251-en, November 2015 Parliament written questions and answer statements, (2016), Question asked on the 7th October 2016 by Gloria De Piero (MP of Ashfield) and answered by Nick Gibb (MP of Bognor Regis and Littlehampton) on the 20th October 2016, available at http://www.parliament.uk/business/publications/written-questions-answers-statements/written-questions-answers/?answered-from=2016-10-03&answered-to=2016-10-20&house=commons%2clords&keywords=education&max=20&page=12&questiontype=AllQuestions&use-dates=True Policy Exchange (2016), “The Importance of teachers: A collection of essays on teacher recruitment and retention”, available at https://policyexchange.org.uk/publication/the-importance-of-teachers-a-collection-of-essays-on-teacher-recruitment-and-retention/, March 2016 Rochester Diocese Education Board (2014). “What's the difference between VA & VC schools”, available at http://www.rdbe.org.uk/schools/information-for-schools-3/information-for-schools-2/voluntary-aided-voluntary-controlled-schools/frequently-asked-questions-2 School Teachers’ Review Body (2016), “School Teachers’ Review Body: Twenty-Sixth Report – 2016”, available at https://www.gov.uk/government/uploads/system/uploads/attachment_data/file/535038/55621_Schoolteachers_Pay_PRINT.pdf, July 2016
References
161
The general teaching council for Scotland (2016), “Professional registration”, available at http://www.gtcs.org.uk/registration/apply-for-registration/additional-registration/professional-registration.aspx The Scottish Government (2011), “Teacher Vacancies”, available at http://www.gov.scot/Topics/Statistics/Browse/School-Education/TrendTeacherVacancies, September 2011 The Scottish Government (2010), “Summary statistics for schools in Scotland”, available at http://www.gov.scot/Topics/Statistics/Browse/School-Education/Summarystatsforschools, December 2010 The Scottish Government (2015), “Summary statistics for schools in Scotland”, available at http://www.gov.scot/Topics/Statistics/Browse/School-Education/Summarystatsforschools, December 2015 UCAS (2013), “Graduate Teacher Training Registry (GTTR) Annual Statistical Report for 2012 entry”, available at https://www.ucas.com/corporate/data-and-analysis/ucas-teacher-training-releases UCAS (2014), “Graduate Teacher Training Registry (GTTR) Annual Statistical Report for 2013 entry”, available at https://www.ucas.com/corporate/data-and-analysis/ucas-teacher-training-releases UCAS (2015), “UCAS Teacher Training 2015 End of Cycle Report”, available at https://www.ucas.com/corporate/data-and-analysis/ucas-teacher-training-releases/ucas-teacher-training-2015-end-cycle UK Commission for Employment and Skills (2016), “UK Employer Skills Survey 2015: UK results”, available at https://www.gov.uk/government/uploads/system/uploads/attachment_data/file/498890/UKCESS_2015_Report_-_v4_for_web.pdf, February 2016 UK Visas and Immigration (2015), “Codes of Practice for Skilled Workers”, available at https://www.gov.uk/government/uploads/system/uploads/attachment_data/file/423732/codes_of_practice_april_2015.pdf, April 2015 Varkey Gems Foundation (2013), “2013 Global Teacher Status Index”, available at https://www.varkeyfoundation.org/teacherindex, October 2013 Welsh Education Workforce Council (2015), “Annual Statistics Digest”, available at http://www.ewc.wales/site/index.php/en/research-statistics/education-workforce-statistics/archived-annual-statistics-digest, March 2015 Welsh Government (2009), “Schools' census results”, available at http://gov.wales/statistics-and-research/schools-census/?tab=previous&lang=en, July 2009
References
162
Welsh Government (2012), “Schools' census results”, available at http://gov.wales/statistics-and-research/schools-census/?tab=previous&lang=en, July 2012 Welsh Government (2013), “Teachers in service, vacancies and sickness absence”, available at http://gov.wales/statistics-and-research/teachers-service-vacancies-sickness-absence/?lang=en, January 2013 Welsh Government (2015), “Schools' census results”, available at http://gov.wales/statistics-and-research/schools-census/?tab=previous&lang=en, July 2015 Welsh Government (2016), “Schools' census results”, available at http://gov.wales/statistics-and-research/schools-census/?lang=en, July 2016 Wilshaw, M. (2015), Her Majesty’s Chief Inspector (HMCI), “HMCI's monthly commentary: February 2016”, available at https://www.gov.uk/government/speeches/hmcis-monthly-commentary-february-2016, February 2016.


Migration Advisory Committee Report ww.gov.uk/government/organisations/migration-advisory-committee © Crown copyright. ISBN: 978-1-78655-326-3