PARTIAL FACILITIES PLAN UPDATE - Springfield · 2.6 Sanitary Sewer Overflows (SSOs)/CMOM.....38 2.7...
124
METROPOLITAN WASTEWATER MANAGEMENT COMMISSION PARTIAL FACILITIES PLAN UPDATE JUNE 2014
-
Upload
vuongxuyen -
Category
Documents
-
view
222 -
download
1
Transcript of PARTIAL FACILITIES PLAN UPDATE - Springfield · 2.6 Sanitary Sewer Overflows (SSOs)/CMOM.....38 2.7...

METROPOLITAN WASTEWATER MANAGEMENT COMMISSION
PARTIAL FACILITIES PLAN UPDATE
JUNE 2014


CONTENTS
Contents ........................................................................................................................................... i
Executive Summary ......................................................................................................................... 1
1. Introduction ....................................................................................................................... 10
1.1 Purpose Goals and Objectives ........................................................................................ 10
1.2 Background ..................................................................................................................... 13
1.3 Previous Planning Efforts ............................................................................................... 17
1.4 Ongoing MWMC Planning Efforts .................................................................................. 21
1.5 CIP Projects Completed Since the 2004 MWMC Facilities Plan ..................................... 27
2. Water Quality Regulatory Assessment .............................................................................. 30
2.1 Temperature .................................................................................................................. 30
2.2 CBOD/TSS Mass Limitations ........................................................................................... 31
2.3 Mixing Zone/RPA ............................................................................................................ 32
2.4 Toxics .............................................................................................................................. 33
2.5 Turbidity ......................................................................................................................... 38
2.6 Sanitary Sewer Overflows (SSOs)/CMOM ...................................................................... 38
2.7 Blending .......................................................................................................................... 39
2.8 Microconstituents .......................................................................................................... 41
2.9 Future Nutrient Limits .................................................................................................... 43
3. Flow and Load Projections ................................................................................................. 58
3.1 Methodology .................................................................................................................. 58
3.2 Results and Interpretation ............................................................................................. 59
3.3 Conclusions..................................................................................................................... 68
4. Process Unit Capacity Assessment .................................................................................... 69
4.1 Secondary Treatment ..................................................................................................... 70
4.2 Tertiary Filtration ........................................................................................................... 72
4.3 Anaerobic Digestion ....................................................................................................... 75
4.4 Glenwood Pump Station ................................................................................................ 81
4.5 Waste Activated Sludge (WAS) Thickening .................................................................... 92
4.6 Conclusions..................................................................................................................... 95
5. Thermal Load Mitigation Strategy ..................................................................................... 97
5.1 Pre-TMDL Planning, 2004-2006 ..................................................................................... 97
5.2 2006 TMDL Planning and Legal Settlement Agreement, 2006 – 2011 ........................ 100
5.3 Post-TMDL Planning, 2011 – 2014 ............................................................................... 107
5.4 Conclusion .................................................................................................................... 110
6. Recommendations ........................................................................................................... 112
6.1 Aeration Basin Improvements – Phase 2 ..................................................................... 113
6.2 Tertiary Filtration – Phase 2 ......................................................................................... 114
6.3 Increase Digestion Capacity ......................................................................................... 115
6.4 WAS Thickening ............................................................................................................ 115
6.5 Glenwood Pump Station .............................................................................................. 115
6.6 Thermal Load Mitigation Planning and Implementation ............................................. 116

i
Acknowledgements
Many thanks to the MWMC Commissioners and the staff who were involved in the development of this project or who assisted with the adoption process.
MWMC Commissioners CH2M HILL George Brown Alan Chang Bill Inge Dan Garbely Doug Keeler Mark Johnson Hillary Loud Tom Johnson Walt Meyer Matt Noesen Faye Stewart Reggie Rowe Marilee Woodrow David Wilson City of Eugene Retired Staff Todd Anderson Bill Bennett Dave Breitenstein Ron Bittler Michelle Cahill Peter Ruffier Randy Gray Teri Higgins John Huberd Tom Mendes Sharon Olson Robert Sprick Greg Watkins City of Springfield Katherine Bishop Judy Castleman Amber Fossen Tonja Kling Troy McAllister Todd Miller Mathew Stouder Mark Van Eeckhout

i
Acronyms, Abbreviations, & Terms
ACWA Oregon Association of Clean Water Agencies ADB Air Drying Bed ASIWPCA Association of State and Interstate Water Pollution Control
Administrators BMF Biosolids Management Facility BRS Beneficial Reuse Site BTU British Thermal Unit CAC Citizens Advisory Committee CBOD Carbonaceous Biochemical Oxygen Demand CEPT Chemically Enhanced Primary Treatment CFPU Comprehensive Facilities Plan Update CHP Combined Heat and Power CIP Capital Improvement Program CMOM Capacity Management Operations and Maintenance DEQ Oregon Department of Environmental Quality EDC Endocrine Disrupting Compound EPA U.S. Environmental Protection Agency EQC Oregon Environmental Quality Commission ESA Endangered Species Act FOG Fats, Oils, and Grease FSE Food Service Establishment FSL Facultative Sludge Lagoon Ft3/day cubic feet per day FY Fiscal year GBT Gravity Belt Thickener gpad gallons per acre per day gpcd gallons per capita per day gpd gallons per day gpm gallons per minute IGA Intergovernmental Agreement IMD Internal Management Directive lbs Pounds LADAR Laboratory Analytical Storage and Retrieval (DEQ’s database) Lbs/ft3-day Pounds per cubic foot per day LCSD Lane County Wastewater Service District MeHg Methyl Mercury Mg/L Milligrams per liter mgd Million Gallons per Day MKcal/day million kilocalories per day MMP Mercury Minimization Plan MWMC Metropolitan Wastewater Management Commission

ii
NACWA National Association of Clean Water Agencies NCC Natural Conditions Criteria NH3 Ammonia NPDES National Pollutant Discharge Elimination System NRDC Natural Resources Defense Council NTU Nephelometric Turbidity Unit NWEA Northwest Environmental Advocates PCB Polychlorinated Biphenyls PFPU Partial Facilities Plan Update PhAC Pharmaceutically Active Compounds POTW Publicly Owned Treatment Works ppcd pounds per capita per day ppm parts per million R-CNG Renewable Compressed Natural Gas RDII Rainfall Derived Inflow and Infiltration RM River Mile RMZ Regulatory Mixing Zone RPA Reasonable Potential Analysis RWP Regional Wastewater Program scf standard cubic feet SNC Statewide Narrative Criteria SRT Solids Retention Time SSO Sanitary Sewer Overflow TFT The Freshwater Trust TKN Total kjeldahl nitrogen TMDL Total Maximum Daily Load TROrC Trace Organic Compounds TSS Total Suspended Solids TWAS Thickened Waste Activated Sludge USGS United States Geological Survey µg/L micrograms per liter VSLR Volatile Solids Loading Rate VOC Volatile Organic Compounds w/o without WAS Waste Activated Sludge WET Whole Effluent Testing WLA Waste Load Allocation WPCF Water Pollution Control Facility WQBELs Water Quality Based Effluent Limits WWFMP Wet Weather Flow Management Plan WWTP Wastewater Treatment Plant ZID Zone of Initial Dilution

1
EXECUTIVE SUMMARY
Introduction
This Partial Facilities Plan Update (PFPU) has been prepared for the Metropolitan Wastewater Management Commission (MWMC) to provide an analysis of the critical wastewater treatment process capacities relative to current estimates of influent flows and loads as well as current, recent, and anticipated regulatory changes. While not a comprehensive planning document, the information developed in this PFPU is intended to provide a technical basis for interim-term planning decisions as the MWMC approaches renewal of the Eugene-Springfield Regional Water Pollution Control Facility’s (WPCF’s) National Pollutant Discharge Elimination System (NPDES) permit, which is anticipated to occur in 2017.
Purpose, goals, and objectives
The PFPU presented herein builds upon the planning elements developed under the 2004 MWMC Facilities Plan. A key product of the 2004 MWMC Facilities Plan was the 20-year Capital Improvement Program (CIP) project list and schedule. The purpose of this PFPU is to provide an interim assessment of wastewater treatment capacity requirements to assist Regional Wastewater Program (RWP) staff in intermediate-term decision-making and prioritization of the CIP projects to balance “just-in-time” project delivery with the need to manage and plan expenditures to minimize potential future spikes in user rates. Accordingly, the planning horizon for this PFPU is approximately 2020. A comprehensive facilities plan was completed in 2004. The 2004, 20-year CIP project list and schedule has served as a roadmap guiding the regional CIP since that time. Another similar Comprehensive Facilities Plan Update (CFPU) is scheduled for implementation in FY 16-17 and will likely be completed by FY 19-20. Like the 2004 MWMC Facilities Plan, the CFPU will use a 20-year planning horizon and provide a comprehensive evaluation of all MWMC regional facilities to identify needed facility improvements to serve the community through the year 2040 This PFPU serves as a bridge document between the 2004 MWMC Facilities Plan and the next CFPU and will be used to make needed interim course-corrections to the 2004 MWMC CIP over that interim period. RWP staff has developed this PFPU in accordance with the following goals and objectives:
Goals:
1. Describe the regulatory landscape to develop an interim-term strategy. 2. Identify needs requiring action within the next 5 years.

2
3. Recommend incremental changes to the 2004, 20-year CIP schedule that balances “just-in-time1” project delivery with the anticipated timing when improved regulatory information becomes available.
Objectives:
1. Assess flow and load projections given latest population growth forecasting. 2. Assess the regulatory landscape and provide basis for regulatory strategy. 3. Assess unit process capacity and capability of the near-term CIP scheduled projects to
determine timing needs.
These objectives will inform decision making to update the 2004, 20-year CIP to deliver projects in a manner that balances “just-in-time” project delivery with the need to optimize rate of capital outlay over time, judicious use of capital reserves, timing of revenue bonds, and avoidance of sudden user rate increases.
Background
The MWMC was formed by Eugene, Springfield, and Lane County through an intergovernmental agreement (IGA) in 1977 to construct, operate, and maintain regional sewerage facilities to service the Eugene-Springfield metropolitan area. The seven-member Commission is composed of members appointed by the City Councils of Eugene (3 representatives), Springfield (2 representatives) and the Lane County Board of Commissioners (2 representatives). Since 1983, the Commission has contracted with the Cities of Springfield and Eugene for all staffing and services necessary to operate, maintain and support the RWP. Lane County’s partnership has involved participation on the Commission and support to the Lane County Metropolitan Wastewater Service District (LCSD), which managed the proceeds and repayment of general obligation bonds issued to construct RWP facilities.
The MWMC owns and operates a regional WPCF located at 410 River Avenue in Eugene, Oregon. Starting in 2004, the WPCF began implementation of a 20-year CIP that expanded the hydraulic and treatment capacity of the WPCF in order to meet new regulatory requirements including, notably, the Oregon bacteria rule (OAR 340-041-0009). The rule required domestic wastewater treatment facilities in the Willamette River Basin to meet hydraulic capacity
1 For the purpose of this planning effort, just-in-time generally means when process capacity reaches a trigger point when capacity to reliably meet permit requirements is close to being surpassed within a few years.

3
requirements associated with the 10-year and 5-year, 24-hour storm events for the summer and winter seasons, respectively. Following the 20-year CIP, the MWMC expanded the wet weather capacity of the WPCF from 175 million gallons per day (mgd) to 277 mgd. Dry weather capability was enhanced as part of these improvements but the rated permitted average dry weather flow design capacity remained at 49 mgd. In addition to the WPCF, regional facilities overseen by the Commission include four pump stations, the East Bank Interceptor, the Biosolids Management Facility (BMF), the Biocycle Farm, and the Beneficial Reuse Site (BRS), which was formerly known as the Seasonal Industrial Waste Facility.
Previous Planning Efforts
Prior to 1997, no comprehensive evaluation of the regional wastewater treatment facilities had been performed since its startup in 1984. In the period that followed, several pivotal facilities planning studies were implemented to assess needs and plan for regulatory compliance. These included:
• 1997 MWMC Wastewater Master Plan • Biosolids Management Plans (1989, 1996, 2001, 2006) • 2001 Wet Weather Flow Management Plan • 2004 MWMC Facilities Plan
These planning efforts responded to evolving regulatory drivers in a timely manner, and evaluated cost effective strategies to best manage the MWMC’s regulatory obligations. These documents provided the foundation for the evaluations presented herein.
Water Quality Regulatory Assessment
RWP staff performed a comprehensive assessment of water quality regulatory issues, which is explained in detail in Section 2. Key recommendations from that assessment are summarized below.
Recommended Permit Renewal Strategy
• The Oregon Department of Environmental Quality (DEQ) has indicated the MWMC can expect permit renewal in 2017. Given the regulatory uncertainty associated with Oregon’s temperature standard (discussed in the report below), staff does not recommend pursuing a permit renewal sooner than DEQs identified schedule. If no process towards more regulatory certainty has been made, then further postponement of permit renewal will need to be considered.

4
Status of Ammonia
• MWMC staff conducted a reasonable potential analysis (RPA) utilizing the outfall dilution factors from the recently updated mixing zone study and 2013 U.S. Environmental Protection Agency (EPA) Ambient Water Quality Criteria. This analysis indicated that there would be no reasonable potential for the E-S WPCF to exceed these new water quality criteria.
Temperature Compliance Strategy
• Continue to investigate and develop a comprehensive portfolio of thermal load mitigation strategies including, but not limited to, effluent diversion through recycled water, effluent storage, indirect subsurface discharge, and water quality trading and credit development.
• Continue to analyze compliance scenarios using available thermal load compliance evaluation tools.
• Continue to monitor the temperature standard conversation at the state and national level and Oregon Department of Environmental Quality’s (DEQ’s) progress in standard development.
• Monitor DEQ’s discussion/negotiation with EPA regarding revisions to DEQ’s Indirect Discharge Internal Management Directive.
• Take advantage of public rule review opportunities to proactively engage with DEQ and other clean water agencies to best ensure outcomes that are implementable and feasible for the MWMC’s rate payers.
CBOD/TSS Mass Limits Compliance Strategy
• Continue the strategy of phased addition of tertiary filtration taking into account any changes in effluent mass limitations as this information becomes available through the permit renewal process.
• Other forms of Total Suspended Solids (TSS) and Carbonaceous Biochemical Oxygen Demand (CBOD) removal technology including Chemically Enhanced Primary Treatment (CEPT) and High Rate Clarification could be considered should DEQ change the MWMC’s effluent mass limits in the upcoming permit cycle.
• Consider development recycled water beneficial uses that would also divert mass away from MWMC’s Willamette River outfall. This alternative may serve multiple long-term regulatory compliance needs including the MWMC’s thermal load mitigation strategy.

5
Toxics - Human Health and Aquatic Life Water Quality Criteria Compliance Strategy
• Continue to monitor the toxics standard conversation at the state level and DEQ’s progress in standard development. Take advantage of public rule review opportunities to proactively engage with DEQ and other clean water agencies to best ensure criteria are being developed properly.
• Continue to run reasonable potential analysis (RPA) using new Human Health Water Quality Criteria and newly established mixing zone dilutions and evaluate results.
• Continue to plan for increased public outreach and education effort in order to effectively communicate with elected officials, industry, and the public in conjunction with toxics minimization plans.
• Support the DEQ’s rapid adoption of the 2013 EPA Ambient Water Quality Criteria for Ammonia.
Proposed Turbidity Rule Strategy
• Monitor ambient turbidity in Nephelometric Turbidity Units (NTUs) upstream and downstream of the WPCF outfall.
• Participate in Oregon’s rulemaking public review process to ensure the scientific basis of the proposed turbidity rule is valid, that the rule will result in cost effective and meaningful improvements to water quality, and outcomes are implementable and feasible for the MWMC.
• Continue to assess the need for additional tertiary filtration capacity taking into account any potential new turbidity requirements as more information becomes available through DEQ’s standards development process and the MWMC’s permit renewal.
• Summer season effluent diversion (e.g., recycled water beneficial uses), could compliment a portfolio of options to reduce WPCF turbidity impacts to the Willamette River during dry-season periods of high ambient turbidity.
SSO Compliance Strategy
• MWMC’s best defense against lawsuits and permit violations associated with Sanitary Sewer Overflow (SSOs) is to continue working with local agency partners to implement a regional Capacity Management Operations and Maintenance (CMOM) framework approach which could be acknowledged with a new permit renewal and would serve to help mitigate a DEQ enforcement action in the event of any SSOs.
• Leading up to and during permit renewal, work with DEQ to remove the SSO prohibition language from general conditions section of the NPDES permit.

6
303(d) List Strategy
The MWMC should continue to leverage the public review process and ensure DEQ is following the correct processes and procedures in developing the 303(d) listings.
Blending Planning and Permit Renewal Strategy
• During the next permit renewal, the MWMC should request that the Peak Flow Management strategy implemented at the WPCF be recognized in the permit and the current requirement for DEQ notification under the General Conditions section removed.
• The MWMC should continue to track wet weather flow management/blending discussions at the national level to keep apprised of any changes on this issue and incorporate industries understanding into long term compliance planning.
Microconstituents Planning Strategy
• Continue to monitor national, state, and local discussions about and research on microconstituents. Integrate this understanding into communication and outreach planning.
Nutrient Limits Planning Strategy
• Continue to monitor third party requests related to nutrient limits, EPA announcements, and Federal Register notifications on EPA’s regional nutrient criteria program.
• Continue to monitor the success and legal status of water quality trading programs to assess future viability for the MWMC.
• Continue to monitor the status of side-stream treatment, nutrient recovery technology and other strategies that serve multiple regulatory and community goals such as natural treatment systems.
Flow and Load Projections
Lane County is the coordinating body under ORS 195.025(1) regarding regional coordination of planning activities. Since the 2004 MWMC Facilities Plan was completed, Lane County adopted a revised population forecast that was developed by Portland State University and finalized in May 2009.
Figure ES.1 provides a comparison between the revised estimated population projection and the 2004 MWMC Facilities Plan population projections for the MWMC service area.

7
Figure ES.1: MWMC Service Area Population Trend
The last decade of historical plant flows and loads were analyzed, peaking factors developed, and new flow and load projections were estimated. The new flow and loads projection estimates developed herein were generally lower than those estimated in the 2004 MWMC Facilities Plan.
Treatment Unit Capacity and Capability Analysis
The purpose of the capacity assessment was to evaluate recent performance, define (or redefine) the total capacity need through 2035, and based on those two findings determine if expansion/modification is required within the next 5 years for the following:
• Secondary Treatment (focused on Aeration Basins) • Filters • Anaerobic Digestion
The analysis was based on process modeling using CH2M HILL’s propriety Pro2D software package (which was the same model used for the 2004 MWMC Facilities Plan and resulting capital projects such as the Aeration Basin Modifications Phase 1 Project). The assessment considered current discharge limitations under the existing administratively extended NPDES permit. Therefore, the planning recommendations presented herein also consider the changing regulatory landscape as summarized above as well as this process unit capacity assessment.

8
The Unit Capacity Assessment results indicated that overall, only the digesters are in need of a capacity expansion (addition of a fourth mesophilic digester) in the near future (by 2015–2020 depending on discretionary operational considerations) to meet the projected flows and loadings. The addition of fats, oils, and grease (FOG) would make the digester upgrade more imperative and trigger the need for additional digestion capacity even earlier.
The aeration basins will need to be upgraded next as they reach their solids loading limitation by 2025. Finally the filtration system will need to be expanded between 2030 and 2035 as the maximum daily allowable solids discharge limitation is reached. It should be noted that September 2013 (dry weather) was one of the wettest on record which saw the facility nearly exceed its permitted Total Suspended Solids (TSS) discharge capacity. Therefore, it could be prudent to expand the filtration capacity earlier.
In addition to the major treatment processes modeled by CH2M HILL, regional wastewater staff has evaluated the following 2004, 20-year CIP projects:
• Waste Activated Sludge Thickening • Glenwood Pump Station
These were originally scheduled early in the CIP but were delayed based on staff’s best professional opinion and available information.
Finally, an update to the MWMC’s Thermal Load Mitigation Plan is included in this PFPU.
Recommendations
RWP staff has developed interim term planning recommendations that consider the following:
• Status of the MWMC’s NPDES permit renewal schedule • The potential upcoming water quality regulatory requirements • Project timing to balance “just-in-time” project delivery with the anticipated timing
when improved regulatory information becomes available
Based on results from the PFPU evaluations staff recommends revising the 5-year CIP as shown in Table ES.1. It should be noted that two projects (Tertiary Filtration - Phase 2, and Aeration Basin Upgrades – Phase 2) were moved out in the schedule, but not quite as far out as the technical analyses would suggest. For these critical large projects, staff recommends making moderate schedule changes and revisiting after the next NPDES permit renewal and a CFPU (scheduled for implementation in FY 16-17) are performed.

9
Table ES.1 – Summary of CIP Project Timing Recommendations
CIP Project Recommended
initial budget year (1)
Project schedule per 2004 FP
Estimated Project Cost (2)
Anaerobic Digester FY 14/15 FY 10/11 $9,170,000 Thermal Load Mitigation Pre-Implementation FY 14/15 N/A (3) $472,000
Thermal Load Mitigation Implementation Phase 1 (4), (5) FY 14/15 N/A (3) $13,816,000
Comprehensive Facilities Plan Update FY 16/17 FY 14/15 $1,488,000 Aeration Basin Upgrades – Phase 2 FY 18/19 FY 15/16 $14,300,000 Glenwood Pump Station FY 18/19 FY 10/11 $926,000 Thermal Load Mitigation Implementation Phase 2 (6) FY 18/19 N/A (3) $17,000,000
Tertiary Filtration – Phase 2 FY 19/20 FY 13/14 $11,400,000 Waste Activated Sludge Thickening FY 21/22 FY 05/06 $5,418,000
(1) The initial budget year is the first year of the multi-year project. (2) Project cost is the total escalated project cost. The value shown represents the sum of escalated budget
years for multi-year projects. (3) The Thermal Load Implementation Program budget was adapted from the earlier Reuse Phases 1 through
4 budgets and so the recycled water project schedule identified in the 2004 Facilities Plan did not directly apply to the adapted program.
(4) Thermal Load Mitigation Implementation Phase 1 includes the two riparian shade projects at the Springfield Millrace and Cedar Creek for WQ trading with FWT.
(5) Thermal Load Mitigation Implementation Phase 1 represents a series of multi-year projects implemented over approximately six to eight years.
(6) Thermal Load Mitigation Implementation Phase 2 represents a series of multi-year projects implemented over approximately six to eight years overlapping with Thermal Load Mitigation Implementation Phase 1.
(7) Estimated cost does not include aspects such as Class A capability, resource recovery, or FOG receiving station.

10
1. INTRODUCTION
The MWMC governs the RWP that provides wastewater treatment services to the greater Eugene-Springfield metropolitan area. This PFPU has been prepared for the MWMC to provide an analysis of the critical wastewater treatment process capacities relative to current estimates of influent flows and loads as well as current and anticipated recent regulatory changes. While not a comprehensive planning document, the information developed in this Partial Facilities Plan Update is intended to provide a technical basis for interim-term planning decisions as the MWMC approaches renewal of the Eugene-Springfield Regional WPCF’s National Pollutant Discharge Elimination System (NPDES) permit.
1.1 Purpose Goals and Objectives
The PFPU presented herein builds upon the planning elements developed under the 2004 MWMC Facilities Plan. A key product of the 2004 MWMC Facilities Plan was the 20-year CIP project list and schedule. The purpose of this PFPU is to provide an interim assessment of wastewater treatment capacity requirements to assist RWP staff in intermediate-term decision-making and prioritization of the CIP projects to balance “just-in-time” project delivery with the need to manage and plan expenditures to minimize potential future spikes in user rates. Accordingly, the planning horizon for this PFPU is approximately 2020. The 2004, 20-year CIP project list and schedule has served as a roadmap guiding the regional CIP since that time. Another similar CFPU is scheduled for implementation in FY 16-17 and will likely be completed by FY 19-20. Like the 2004 MWMC Facilities Plan, the CFPU will use a 20-year planning horizon and provide a comprehensive evaluation of all MWMC regional facilities to identify needed facility improvements to serve the community through the year 2035. This PFPU serves as a bridge document between the 2004 MWMC Facilities Plan and the next CFPU and will be used to make needed interim course-corrections to the 2004 MWMC CIP over that interim period.
1.1.1 Goals and Objectives
RWP staff has developed this PFPU in accordance with the following goals and objectives:
Goals:
• Describe the regulatory landscape to develop an interim-term regulatory strategy. • Identify needs requiring immediate (within 5 years) action.

11
• Recommend incremental changes to the 2004, 20-year CIP schedule that balances “just-in-time” project delivery with the anticipated timing when improved regulatory information becomes available.
Objectives:
• Assess flow and load projections given latest population growth forecasting. • Assess the regulatory landscape and provide basis for regulatory strategy. • Assess unit process capacity and capability of the near-term CIP scheduled projects to
determine timing needs.
These objectives will inform decision making to update the 2004, 20-year CIP to deliver projects in a manner that balances “just-in-time” project delivery with the anticipated timing when improved regulatory information becomes available. Figure 1.1 below illustrates these objectives and the desired outcome.
Figure 1.1: PFPU Objectives and Outcome
Updated 2004
20-Year CIP
Water Quality Regulatory Assessment
Revised Flow and Load Projection
Process Capacity
Assessment

12
1.1.2 Planning Context
The 2004 MWMC Facilities Plan recommended CIP included two types of facilities plan updates: partial and comprehensive. These alternate every five years in the 2004, 20-year CIP. Both types evaluate regulatory challenges, wastewater flow and load characteristics, and existing facilities capacities and assess the need for planning course-corrections. However, as the names suggest, the partial facilities plan update is right-sized to address targeted high priority, intermediate-term issues, while the CFPU provides a substantially more detailed 20-year comprehensive analysis similar to the level of effort performed for the 2004 MWMC Facilities Plan. Accordingly, the comprehensive facilities plans conform to the DEQ’s guidelines for preparation of wastewater planning documents2 whereas this level of detail is not necessary or appropriate for the partial facilities plan updates. Table 1 shows the planning schedule envisioned in the 2004 MWMC Facilities Plan 20-year CIP.
Table 1.1 – Planning Schedule Envisioned in the 2004 MWMC Facilities Plan
Facilities Plan Effort Proposed Implementation Year Partial Facilities Plan Update FY 10-11 Comprehensive Facilities Plan Update FY 15-16 Partial Facilities Plan Update FY 20-21 Comprehensive Facilities Plan Update FY 25-26
The planning schedule presented in Table 1.1 would allow the MWMC to navigate a course of action synchronized with a 5-year NPDES permit renewal schedule. But because the DEQ’s permit renewal timetable has fallen substantially behind schedule (i.e., the MWMC’s permit has been administratively extended since 2006), RWP staff modified the MWMC’s planning schedule as needed to better coordinate with the actual anticipated NPDES permit renewal cycle as determined using the best available information. Work on this first PFPU began midway through FY 11-12.
2 These guidelines are available at the DEQ’s website and described in the document entitled “Reports for Public Utilities Financed by Infrastructure Finance Authority, Oregon Department of Environmental Quality, Rural Community Assistance Corporation, United Stated Department of Agriculture” Following the DEQ guidelines helps the MWMC maintain eligibility for Clean Water State Revolving Fund (CWSRF) loan program financing, among other things.

13
1.2 Background
The MWMC was formed by Eugene, Springfield, and Lane County through an IGA in 1977 to construct, operate, and maintain regional sewerage facilities to service the Eugene-Springfield metropolitan area. The seven-member Commission is composed of members appointed by the City Councils of Eugene (three representatives), Springfield (two representatives) and the Lane County Board of Commissioners (two representatives). Since its inception, the Commission, in accordance with the IGA, has been responsible for oversight of the RWP including:
• Construction, maintenance, and operation of the regional sewerage facilities • Adoption of financing plans, budgets, user fees and connection fees • Adoption of minimum standards for industrial pretreatment and local sewage collection
systems • Recommendations for the expansion of regional facilities to meet future community
growth.
Since 1983, the Commission has contracted with the Cities of Eugene and Springfield for all staffing and services necessary to maintain and support the RWP. Lane County’s partnership has involved participation on the Commission and support to the LCSD, which managed the proceeds and repayment of general obligation bonds issued to construct RWP facilities.
The MWMC owns and operates regional wastewater facilities including the Eugene-Springfield WPCF, four pump stations and interceptors, the BMF, the Biocycle Farm, and the BRS. These facilities are discussed below.
1.2.1 Collection System
Eugene and Springfield own separate sewer systems that come together into a regional system of lines. Over 1,000 miles of sewer lines and 48 pump stations transport wastewater to the plant. Conveyance pipelines, force mains, and pump stations carrying combined Eugene-Springfield flow to the regional facility are considered part of the regional conveyance system.
1.2.2 Eugene-Springfield Water Pollution Control Facility
The WPCF, located at 410 River Avenue in Eugene, officially began operation in April 1984 and was constructed as part of a $105 million regional wastewater treatment system program. Approximately 94% of the flow delivered to the WPCF for treatment is from domestic sources,

14
approximately 5% are from industrial/commercial sources and less than 1% is from septage and other sources.
The regional facility replaced the two separate plants previously owned and operated by Eugene and Springfield because studies concluded that neither city’s treatment plants could meet water quality standards or capacity. Planning, design, and construction for the regional facility occurred between 1979 and 1984 at the site of the original Eugene wastewater treatment facility. Existing facilities were either expanded and made a part of the new regional facility, or demolished. The Springfield sewage treatment plant was demolished. Since startup in 1984, the WPCF has been operating successfully, meeting all regional demands for increased sewerage service and complying with the facility’s NPDES permit issued by the State of Oregon DEQ. At the time of construction the capacity of the plant was projected to serve the growing metropolitan area for 20 years.
The WPCF houses headworks, primary treatment, secondary treatment, tertiary treatment, final treatment, and anaerobic digestion facilities. The headworks consist of two automated pump stations (the older pump station with four screw pumps, and a new pump station with two submersible pumps added in 2010), six bar screens, four aerated grit removal chambers, two stacked-plate vortex grit chambers, and four pre-aeration basins for odor control.
The headworks are followed by four circular 1.5 MG primary clarifiers. Secondary treatment facilities consist of eight 2.2 MG activated sludge aeration basins equipped with both coarse and fine air bubble diffusers. Four of the aeration basins were upgraded with fine bubble diffusers, mechanical mixers, and internal baffle walls to add anoxic selectors and convert to a step-feed system. Currently, the WPCF can meet dry-weather period secondary treatment requirements with these recently upgraded basins, which operate in a plug flow/step feed mode. However, the secondary treatment system is also able to operate under complete mix, step feed, or contact stabilization methods. Ten circular 1.4 MG clarifiers plus the return activated sludge pump station complete the secondary process. Downstream of the secondary treatment process is the tertiary filtration facilities that can provide up to 11 mgd of tertiary treated water which can be returned to the plant effluent or, in the future potentially used for Class A recycled water beneficial uses. The main components of the tertiary filtration facilities are the filter influent pump station with three submersible pumps, the five compressible media tertiary filters, two aeration blowers and two backwash pumps.
The final treatment process adds sodium hypochlorite for disinfection and sodium bisulfite to remove residual chlorine. Treated effluent is discharged to the Willamette River at River Mile (RM) 178. Sludge collected from the primary and secondary treatment processes are first thickened (primary sludge in a gravity thickener, and waste activated sludge from secondary

15
treatment by gravity belt thickeners) and then transferred to one of three 1.17 MG mesophilic anaerobic digesters for stabilization. Digested biosolids are conveyed to the BMF through an 8-inch force main for further processing, as explained below. Federal pathogen removal requirements are met through the anaerobic digestion process and vector attraction requirements are met through the combined anaerobic digestion/facultative sludge lagoon process described below.
1.2.3 Biosolids Management Facility (BMF)
The regional BMF is located at 29689 Awbrey Lane and was constructed in 1985 to provide storage, further stabilization, and drying of digested biosolids received from the WPCF. The solids processing and biosolids reuse system for Eugene-Springfield consists of anaerobic digestion facilities (located at the WPCF and described above), facultative sludge lagoons (FSLs), belt filter presses, and air drying beds (ADBs) located at the BMF. Anaerobically digested biosolids are pumped from sludge holding tanks at the WPCF through a 5.5-mile pipeline to the FSLs at the BMF. Approximately 58 million gallons of approximately 2% digested biosolids, or approximately 4,800 dry tons, are produced annually at the Eugene-Springfield WPCF. Supernatant from the FSLs is returned to the WPCF treatment process. Beginning in the spring, biosolids are removed from the FSLs with a dredge and pumped through screens and belt presses and transported by truck to the ADBs. Biosolids remain in the ADBs from 6 to 10 weeks (depending on weather conditions and crop land availability) where it is turned and windrowed periodically using a Brown Bear windrow machine. If the weather has been conducive to drying, near the end of July, the resulting dewatered biosolids are removed from the beds, transported by truck to farms where a cooperative land application agreement has been reached, and spread on the farm land using end push-out (“manure”) spreaders. A second drying cycle is begun in July or August with land application occurring in September. With development of the Biocycle Farm (described below), liquid biosolids can be diverted from the FSLs directly to the Biocycle Farm land application system.
As scheduled in the CIP developed under the 2004 MWMC Facilities Plan, the clay liners of each of the four FSL’s were replaced with high-density-polyethylene liners. In addition, a rail-and-trolley sludge dredging system was installed to increase the efficiency of the lagoon dredging operations.

16
1.2.4 Biocycle Farm
Following the development of a feasibility study and development plan, MWMC purchased 596 acres of land near the BMF site in July 2000 to develop a Biocycle Farm. The site is located along Highway 99 between Awbrey Lane and Meadowview Road. The Biocycle Farm provides MWMC with a dedicated land application site for biosolids utilization. It enables cost-effective land application directly adjacent to the BMF, saving trucking and other costs associated with maintaining distribution of biosolids to cooperative farm sites. It also provides MWMC with long-term certainty as an available and permitted biosolids land application site. The Biocycle Farm was constructed in three phases which were completed in 2009.
The three phases of farm land occupy 595 acres, of which 398 acres contains poplar trees and the remainder is farmed buffer land maintained by a tenant farmer. Phase 1 consisted of 160 acres of poplar trees and was put into operation in summer 2004. Phase 2 consisted of 122 acres and was put into operation in 2007. Phase 3 consisted of 116 acres and was put into service in 2009. Stabilized dewatered biosolids from the BMF lagoon are applied to the Biocycle Farm to provide the necessary nutrients for the poplar trees. The Biocycle Farm complements the practice of hauling biosolids to cooperative farms. In addition, the Biocycle Farm provides the flexibility to pump stabilized liquid biosolids directly from the BMF FSLs to the Biocycle Farm for land application.
In August 2013, the MWMC entered into a contract with Lane Forest Products of Eugene, Oregon, to strategically harvest and market Phase 1 poplar trees. A test plot of 52 acres within Phase 1 was selected to explore harvest efficiencies and test the market basis for poplar wood products. It is anticipated that the remaining 108 acres of Phase 1 will be harvested in spring of 2014.
1.2.5 Beneficial Reuse Site
The BRS (formerly known as the Seasonal Industrial Waste Facility) is located at 9199 Prairie Road. The BRS was originally constructed in 1984 to provide lagoon storage, and disposal of industrial cannery waste by irrigation. Seneca Foods (previously Agripac and then Chiquita) was the sole food processor to use the facility. Cannery waste from the industrial facility was piped directly to the lagoon for storage. Irrigation was delivered to the grass crop at the site through a center pivot irrigation system. The cannery facility has permanently closed its operation and the facility is not currently receiving any form of industrial waste. This PFPU does not evaluate the BRS. However, an evaluation of the BRS facilities for beneficial reuse of recycled water to address the MWMC’s thermal load discharge limitations is being implemented under the

17
Thermal Load Mitigation – Pre-Implementation planning effort, which is discussed in Section 1.4.1.
1.3 Previous Planning Efforts
Prior to 1997, no comprehensive evaluation of the regional wastewater treatment facilities had been performed since its startup in 1984. In the mid-1990s MWMC initiated a study to prepare a Master Plan in order to determine how the treatment processes and facilities were performing relative to the original capacity and performance expectations. The Master Plan (CH2M HILL, 1997) recommended further evaluations to assess the facilities’ capacity to treat peak wet weather flows and to adequately process biosolids. In late 1997, MWMC initiated a project to develop a comprehensive Wet Weather Flow Management Plan (WWFMP), which was adopted by the MWMC and the two cities in 2001 (CH2M HILL, 2000). The 2004 MWMC Facilities Plan followed from the recommendations of the WWFMP to provide a comprehensive set of evaluations to develop a CIP list of specific projects along with refined planning-level cost estimates. In addition, the MWMC’s Biosolids Plan was first approved by Oregon DEQ in 1989 and revised as required in subsequent years. These studies are discussed below.
1.3.1 1997 Master Plan
The 1997 Master Plan provided an evaluation of the regional WPCF based on historical flow, loads, and monitoring report data. Other selected facilities of the regional wastewater system were also evaluated. The purpose of the plan was intended to be twofold: 1) Identify low cost capital improvements that could be implemented in the short term (3 to 5 years) to improve facility operations, and 2) Identify facility expansion improvements that would need to be implemented over a longer term to meet increasing regional demands for service and more stringent regulatory requirements, and to specific priority issues affecting the WPCF. This plan did not include development of a comprehensive hydraulic and treatment process model. However, key evaluations included a limited flow and load analysis, general strategies to manage peak flows, an assessment of rainfall derived inflow and infiltration (RDII) programs, a preliminary peak flow assessment, a disinfection alternatives evaluation, a U.S. Environmental Protection Agency (EPA) risk management program evaluation, a preliminary biosolids management evaluation (which led into the 1997 Biosolids Management Plan), and a plant effluent regulatory assessment.
18
1.3.2 Biosolids Management Plans
The MWMC's Biosolids Management Plan is required by the NPDES permit. The Biosolids Management Plan outlines the liquids and solids processes at the facility, how biosolids are managed to meet federal and state requirements, and how the biosolids land application program is operated. The Biosolids Management Plan was originally approved by the Oregon DEQ in 1989, revised in 1996, 2001, and 2006. The 2006 revision updated the plan to address changes in biosolids management practices and in anticipation of the NPDES permit. It should be noted that the DEQ’s schedule for MWMC’s permit renewal has since been delayed until 2017.
The 1997 Biosolids Management Plan included an evaluation of available options for long-term, cost-effective management of biosolids, and called for the construction of belt filter presses for mechanical dewatering at the BMF, a further study of alternatives for producing Class A biosolids, and the development of a dedicated biosolids land application site using poplar trees. The Class A Biosolids/Compost Evaluation was completed by Brown and Caldwell Engineers in January 1999; however, the MWMC determined that implementing the capital improvements to achieve a Class A product were not cost-effective at that time. In 1999 and 2000, the MWMC undertook a feasibility study and a reconnaissance study to determine whether to proceed with the purchase of land and development of a dedicated biosolids land application site. These preliminary studies indicated that the site met the requirements for land application of biosolids as outlined in state and federal guidelines (OAR 340-50 and 40 CFR Part 503) and that it was a favorable site to be purchased for the dedicated land application site.
The 2003 Management Plan for a Dedicated Biosolids Land Application Site was developed after the MWMC purchased the 596 acres on Awbrey Lane. This plan included a conceptual plan and preliminary designs for the development, construction, and operation of a dedicated farm for biosolids land application. The plan outlined a facility that could provide an economically viable agricultural operation that would potentially accommodate a significant portion of the MWMC Class B liquid biosolids production. The plan also stressed that the remainder of the biosolids recycling would be through continued use of cooperating agricultural producers, and that new cooperating producers would likely be required to meet future demands. The MWMC approved the plan to provide a dedicated Biocycle Farm to give the MWMC dramatically increased flexibility in solids handling options, and to provide for economically and environmentally advantageous recycling of a significant portion of the biosolids produced at the WPCF.
19
1.3.3 2001 WWFMP
The 2001 WWFMP was developed from recommendations in the 1997 Master Plan and results of preliminary analysis using a hydraulic model developed for the regional wastewater collection system. Developing the plan consisted of evaluating four general technologies for managing excess wet weather flow relative to performance, frequency of SSOs, cost, and political and community acceptance. The four technologies evaluated were:
• System rehabilitation to control RDII – both public conveyance systems and private service laterals
• In-line and off-line storage of peak flows • Additional conveyance (including greater pipe conveyance and pump station capacity) • Additional capacity to treat peak flows at the WPCF
The overall objective of the plan was to determine the most cost-effective and politically feasible set of solutions for managing excessive wet-weather wastewater flow rates both in the collection system and at the WPCF. The WWFMP was guided by a steering committee of approximately 20 Eugene and Springfield public works staff, and involved an extensive public involvement process. Staff from the cities forged a partnership to guide the project and to gather, review, analyze and interpret data as well as perform hydraulic modeling. A data subcommittee to the steering committee performed much of the technical analysis, which included:
• Performing flow monitoring to characterize wet weather flows in basins • Estimating peak flows for the 5-year, 24-hour storm • Identifying pipeline and pump station deficiencies for existing and buildout land use
conditions • Identifying pipe and pump station upgrades necessary to convey peak flows to the
WPCF • Developing and analyzing wet weather flow management options for producing the
most cost-effective flow management in all basins • Analyzing the potential effectiveness of reducing peak flows through reduction of RDII in
basins with high RDII
A Citizens Advisory Committee (CAC) was charged with reflecting community values and concerns, assisting in evaluating desirability and priority of alternatives, providing recommendations on policy issues, and assisting in communication and public awareness. Collectively, the groups’ charge was to bring forward a plan to the MWMC for its adoption to
20
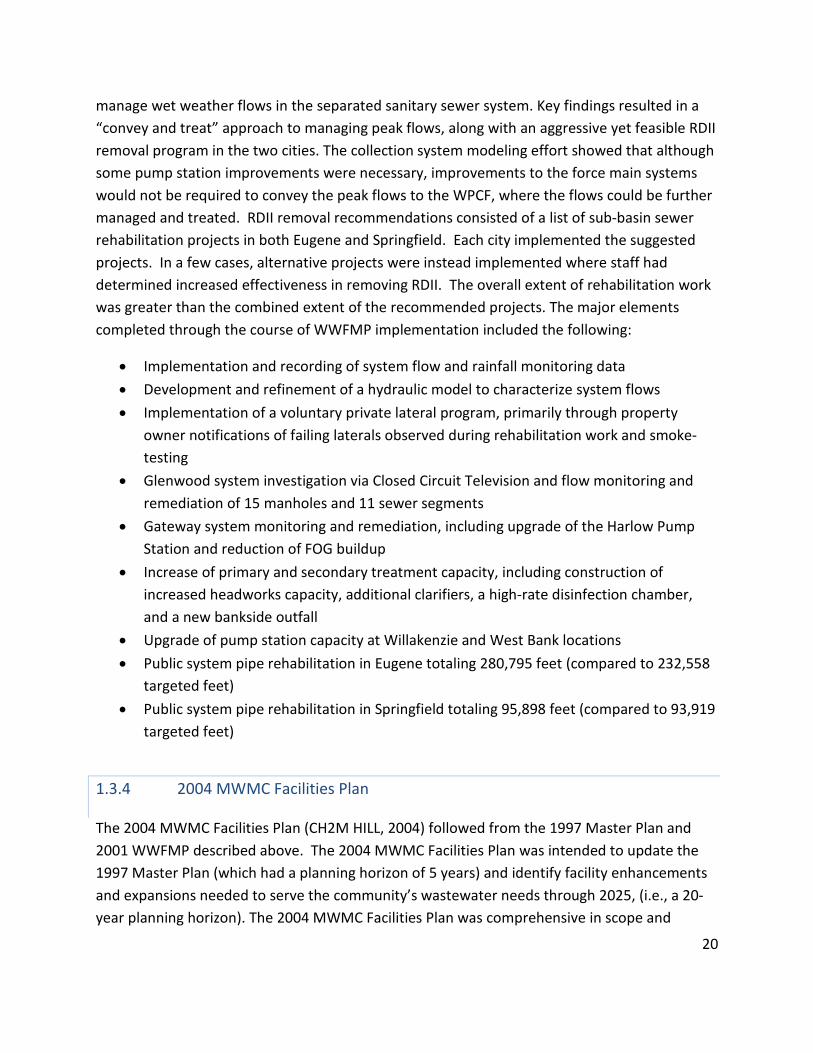
manage wet weather flows in the separated sanitary sewer system. Key findings resulted in a “convey and treat” approach to managing peak flows, along with an aggressive yet feasible RDII removal program in the two cities. The collection system modeling effort showed that although some pump station improvements were necessary, improvements to the force main systems would not be required to convey the peak flows to the WPCF, where the flows could be further managed and treated. RDII removal recommendations consisted of a list of sub-basin sewer rehabilitation projects in both Eugene and Springfield. Each city implemented the suggested projects. In a few cases, alternative projects were instead implemented where staff had determined increased effectiveness in removing RDII. The overall extent of rehabilitation work was greater than the combined extent of the recommended projects. The major elements completed through the course of WWFMP implementation included the following:
• Implementation and recording of system flow and rainfall monitoring data • Development and refinement of a hydraulic model to characterize system flows • Implementation of a voluntary private lateral program, primarily through property
owner notifications of failing laterals observed during rehabilitation work and smoke-testing
• Glenwood system investigation via Closed Circuit Television and flow monitoring and remediation of 15 manholes and 11 sewer segments
• Gateway system monitoring and remediation, including upgrade of the Harlow Pump Station and reduction of FOG buildup
• Increase of primary and secondary treatment capacity, including construction of increased headworks capacity, additional clarifiers, a high-rate disinfection chamber, and a new bankside outfall
• Upgrade of pump station capacity at Willakenzie and West Bank locations • Public system pipe rehabilitation in Eugene totaling 280,795 feet (compared to 232,558
targeted feet) • Public system pipe rehabilitation in Springfield totaling 95,898 feet (compared to 93,919
targeted feet)
1.3.4 2004 MWMC Facilities Plan
The 2004 MWMC Facilities Plan (CH2M HILL, 2004) followed from the 1997 Master Plan and 2001 WWFMP described above. The 2004 MWMC Facilities Plan was intended to update the 1997 Master Plan (which had a planning horizon of 5 years) and identify facility enhancements and expansions needed to serve the community’s wastewater needs through 2025, (i.e., a 20-year planning horizon). The 2004 MWMC Facilities Plan was comprehensive in scope and

21
rigorous in terms of level of detail. The assessments provided under the 2004 MWMC Facilities Plan evaluated all of the regional wastewater treatment facilities serving the Eugene-Springfield metropolitan area including the WPCF, major pump stations and interceptors, the BMF, the Biocycle Farm, and the BRS.
The assessments included hydraulic and process modeling of the liquid and solid steam unit processes, identified capacity constraints, identified new regulatory requirements and anticipated changes to these requirements, projected future capacity and performance requirements, reviewed and evaluated new treatment technologies available to cost-effectively improve the capacity and performance of existing assets, and explored existing WPCF operational issues to provide the basis for evaluating and planning for the future of the regional wastewater treatment facilities. The resulting plan accounted for the most probable outcomes in the years ahead. The 2004 Facilities Plan built on interim planning efforts that were conducted from 1996 through 2001 to address specifically identified performance, capacity, and operational deficiencies. For example, the models and analyses developed for the WWFMP (CH2M HILL, 2001) were leveraged in order to develop solutions to both dry and wet weather treatment issues. For each key process train, the plan developed conceptual design alternatives, compared alternatives and selected those that provided the best value for the MWMC. The design basis for each alternative was developed to address the full range of dry and wet weather liquids treatment and biosolids issues, and operational concerns. The Facilities Plan also provided detailed descriptions for recommended project implementation culminating in the development of the MWMC’s 20-year CIP project list containing 38 projects. The end product was a comprehensive strategic road map for implementing the most cost-effective solutions to address a full range of regional wastewater needs over the following 20 years. The resulting 20-year CIP schedule and budget plan from the 2004 MWMC Facilities Plan is provided in Appendix A.
1.4 Ongoing MWMC Planning Efforts
In addition to this Partial Facilities Plan Update, staff is also working on the following ongoing MWMC planning studies:
• Thermal Load Mitigation Program: Pre-Implementation • Biogas Utilization Study • Regional CMOM Program Approach • Outfall Mixing Zone Study

22
These ongoing studies are described below.
1.4.1 Thermal Load Mitigation Program: Pre-Implementation
The MWMC is preparing for thermal load restrictions in future NPDES permits. The current NPDES permit was issued in 2002 with a thermal load limitation that was based on the dry weather design average flow. The NPDES permit specifies that the WPCF’s weekly average excess thermal load must not exceed 3.1 billion British Thermal Units (BTUs) per day during the May 1 - October 31 (summer) season. However, under the upcoming revised permit (expected in 2017) a more restrictive thermal load requirement is anticipated and the critical compliance period may extend into other times of the year. The actual scope of these restrictions will not be known until the DEQ determines a legally-acceptable course forward to calculating and allocating waste head load limits on the Willamette River. Given current understanding, the MWMC may need to either periodically or routinely reduce total thermal discharge (by reducing discharge volume), reduce actual effluent temperature during brief or extended periods of time, or some combination of the two.
The Thermal Load Mitigation – Pre-Implementation Planning effort is evaluating options for thermal load reduction that would provide the best flexibility, adaptability, and cost-benefit to the MWMC. A portfolio of options is currently being strategized, ranging from expanded recycled water use, indirect discharge, and watershed-based riparian shading projects. Additional strategies may be considered, such as heat recovery methods to reduce effluent temperature. RWP staff is currently working on the Recycled Water Program Implementation Planning effort, which is a sub-set of activities under the broader Thermal Load Mitigation – Pre-Implementation planning effort. The RWP Implementation Planning effort is made up of three phases of planning work that includes the following elements:
• Phase 1: Conceptual Alternatives Assessment (completed in March 2012). Phase 1 recommended studying the feasibility of two alternatives consisting of a pair of external users (industrial aggregate use) and a pair of internal site applications (MWMC Facilities use).
• Phase 2: Alternatives Evaluation (scheduled for completion in spring 2014). Phase 2 studied the recommended Phase 1 alternatives in more detail through feasibility studies and triple bottom line assessment. It should be noted that the triple bottom line assessment compares among recommended Phase 1 alternatives and riparian shade thermal credit development. The resulting study documents the overall effectiveness

23
and benefits of MWMC Facility recycled water use, industrial aggregate facility recycled water use, and riparian shade contracting for thermal load credit.
• Phase 3: Further project implementation planning as recommended under Phase 2.
The current Phase 2 planning study is assessing near-term conceptual recycled water use options at (1) Delta Sand & Gravel’s and Knife River’s industrial aggregate operations, and (2) at the MWMC’s BRS and Biocycle Farm agricultural irrigation and lagoon storage operations.
1.4.2 Biogas Utilization Study
Since 1983 when the MWMC began using biogas to generate electricity at the regional WPCF, the technical and financial opportunities and risks as well as public attitudes have all changed. These changes include emerging technology, changing energy markets, emerging funding and incentive opportunities, and greater public awareness and concern about climate change and resource recovery. Accordingly, the MWMC is conducting a Biogas Utilization Study to determine the best and highest use of its biogas given the current landscape. The study is divided into two phases. Phase 1 of the Biogas Utilization Study was completed in February 2013 and focused on identification and screening of potential biogas utilization alternatives. From an initial list of approximately 30 conceptual biogas utilization alternatives, the screening process reduced the list to five alternatives for which a triple bottom line comparison and ranking was performed. Three of the alternatives were scaled assuming that the MWMC would implement a FOG program and included dedicated FOG receiving facilities within the alternative descriptions and cost estimates. The Phase 1 short listed alternatives are:
• Alternative 1: Flare Raw Biogas (No FOG)
• Alternative 2: Retain Existing Combined Heat and Power (CHP) (No FOG)
• Alternative 3: Expand CHP Capacity (With FOG)
• Alternative 4: Sell Biogas to Nearby Third Party (With FOG)
• Alternative 5: Convert to Fuel for Vehicles (With FOG)
The Phase 1 study found that selling the raw biogas to potential industrial users (Alternative 4) and filtering the biogas to convert into a transportation fuel (Alternative 5) were both promising concepts to consider for long-term implementation. However further investigation, planning, and stakeholder engagement over many years would likely be needed for these alternatives to be implementation ready. Based on the outcome of the Phase 1 analysis, the
24
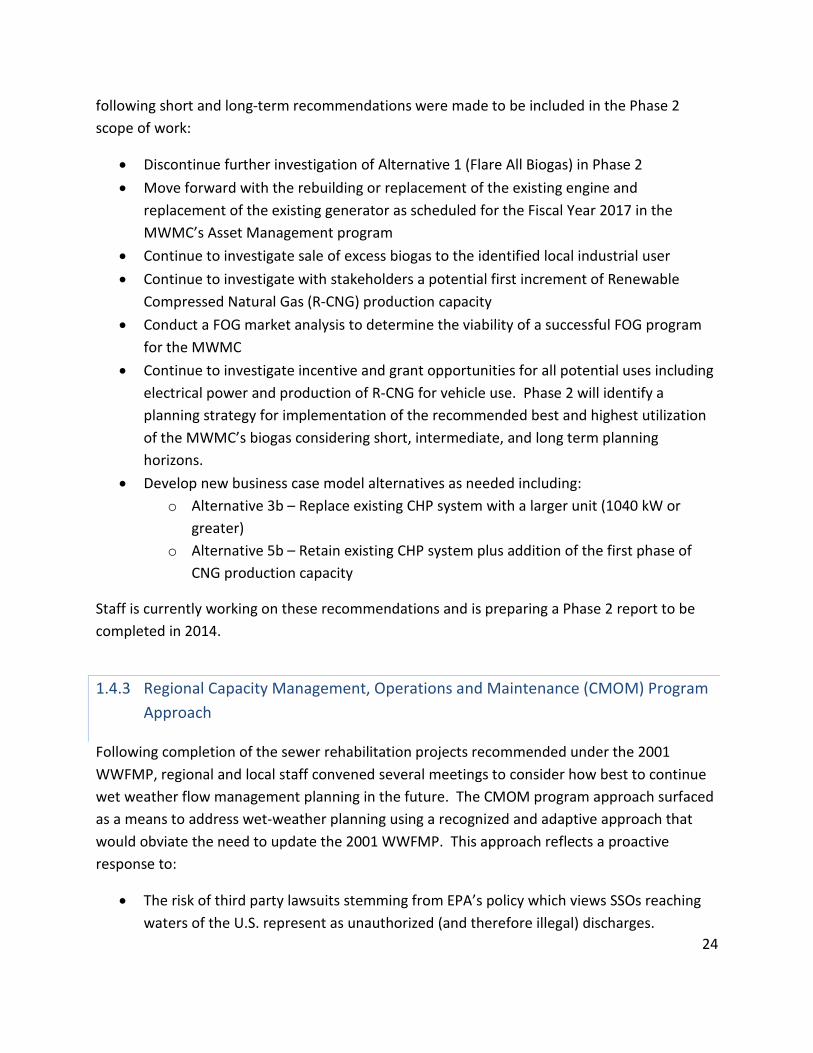
following short and long-term recommendations were made to be included in the Phase 2 scope of work:
• Discontinue further investigation of Alternative 1 (Flare All Biogas) in Phase 2 • Move forward with the rebuilding or replacement of the existing engine and
replacement of the existing generator as scheduled for the Fiscal Year 2017 in the MWMC’s Asset Management program
• Continue to investigate sale of excess biogas to the identified local industrial user • Continue to investigate with stakeholders a potential first increment of Renewable
Compressed Natural Gas (R-CNG) production capacity • Conduct a FOG market analysis to determine the viability of a successful FOG program
for the MWMC • Continue to investigate incentive and grant opportunities for all potential uses including
electrical power and production of R-CNG for vehicle use. Phase 2 will identify a planning strategy for implementation of the recommended best and highest utilization of the MWMC’s biogas considering short, intermediate, and long term planning horizons.
• Develop new business case model alternatives as needed including: o Alternative 3b – Replace existing CHP system with a larger unit (1040 kW or
greater) o Alternative 5b – Retain existing CHP system plus addition of the first phase of
CNG production capacity
Staff is currently working on these recommendations and is preparing a Phase 2 report to be completed in 2014.
1.4.3 Regional Capacity Management, Operations and Maintenance (CMOM) Program Approach
Following completion of the sewer rehabilitation projects recommended under the 2001 WWFMP, regional and local staff convened several meetings to consider how best to continue wet weather flow management planning in the future. The CMOM program approach surfaced as a means to address wet-weather planning using a recognized and adaptive approach that would obviate the need to update the 2001 WWFMP. This approach reflects a proactive response to:
• The risk of third party lawsuits stemming from EPA’s policy which views SSOs reaching waters of the U.S. represent as unauthorized (and therefore illegal) discharges.

25
• DEQ’s recent changes to the SSO language used in the general condition portion of the NPDES permits issued to Oregon wastewater treatment agencies.
• DEQ’s 2010 Sanitary Sewer Overflow Enforcement Internal Management Directive (SSO IMD), which references the presence of a CMOM program as an integral consideration for determination of an SSO permit violation and the severity of the penalty associated with the violation.
Working through the Regional Wastewater Policy Team (a team of division and department managers from both Eugene and Springfield) and engineering consultant CH2M HILL, RWP staff drafted a CMOM guidance document and CMOM framework document. The guidance document contains detailed descriptions of essential CMOM program elements for consistent development of CMOM programs. The guidance document also contains an assessment of peak wet weather RDII contribution from both Eugene and Springfield collection systems, which is intended only as a baseline estimate against which the effectiveness of future RDII removal efforts could be judged. The peak flow RDII assessment (carried out by CH2M HILL) found that both collection systems would take on approximately the same amounts of RDII on a gallons-per-day-per-acre basis. This peak flow RDII assessment Technical Memorandum is provided in Appendix B.
The CMOM Framework document outlines the major CMOM program elements in executive summary format for ease of Commission adoption. Staff will bring the finalized CMOM Framework Document to the Commission for adoption in 2014. In the meantime, both Eugene and Springfield collection system operations and management workgroups are conducting CMOM gap analyses as the first step in development of local CMOM programs. The first iteration of CMOM gap analyses are undergoing a consultant review process to ensure CMOM program elements are adequately addressed. Staff anticipates preliminary local CMOM Program reports to be completed by 2015.
1.4.4 Outfall Mixing Zone Study
A mixing zone is an allocated impact zone at the effluent outfall where water quality criteria can be exceeded as long as acutely toxic conditions are prevented. It is defined as the area where the effluent undergoes initial dilution (called the zone of initial dilution) and is then extended to cover a secondary mixing area (called the regulatory mixing zone [RMZ]), within the ambient water-body. For an outfall, such as the MWMC’s outfall in the Willamette River—a mixing zone can be established by conducting a mixing zone analysis per DEQ approved methodology. The
26
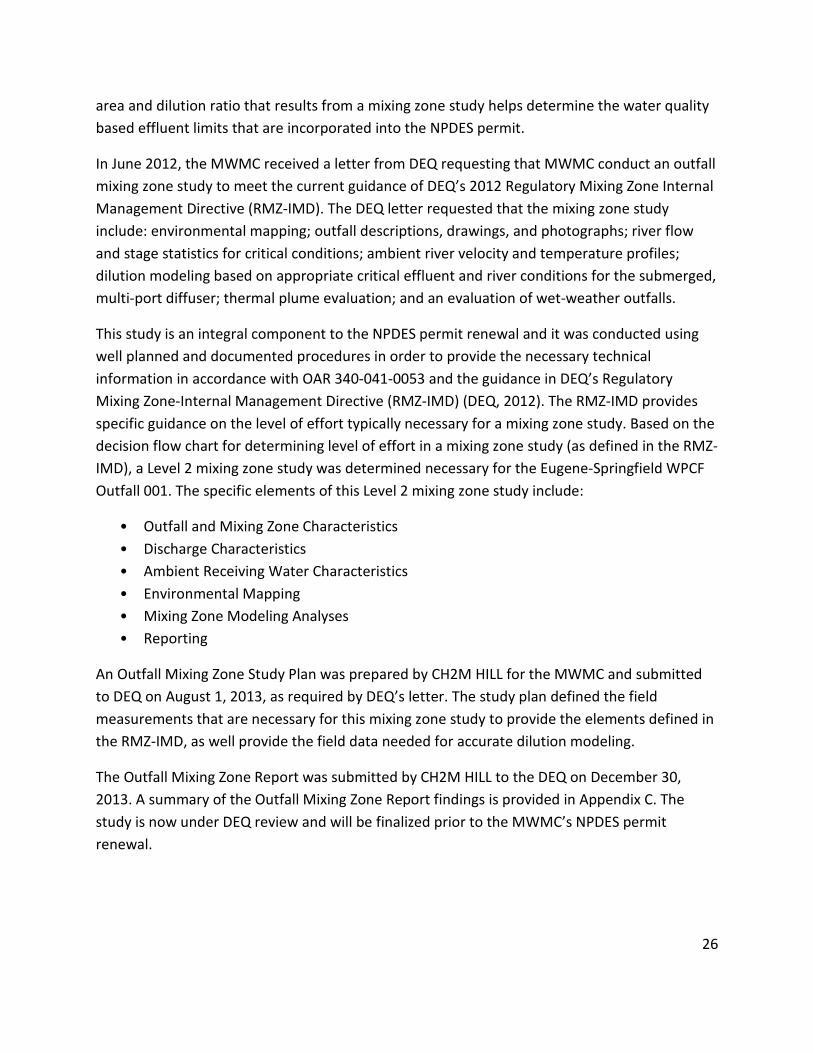
area and dilution ratio that results from a mixing zone study helps determine the water quality based effluent limits that are incorporated into the NPDES permit.
In June 2012, the MWMC received a letter from DEQ requesting that MWMC conduct an outfall mixing zone study to meet the current guidance of DEQ’s 2012 Regulatory Mixing Zone Internal Management Directive (RMZ-IMD). The DEQ letter requested that the mixing zone study include: environmental mapping; outfall descriptions, drawings, and photographs; river flow and stage statistics for critical conditions; ambient river velocity and temperature profiles; dilution modeling based on appropriate critical effluent and river conditions for the submerged, multi-port diffuser; thermal plume evaluation; and an evaluation of wet-weather outfalls.
This study is an integral component to the NPDES permit renewal and it was conducted using well planned and documented procedures in order to provide the necessary technical information in accordance with OAR 340-041-0053 and the guidance in DEQ’s Regulatory Mixing Zone-Internal Management Directive (RMZ-IMD) (DEQ, 2012). The RMZ-IMD provides specific guidance on the level of effort typically necessary for a mixing zone study. Based on the decision flow chart for determining level of effort in a mixing zone study (as defined in the RMZ-IMD), a Level 2 mixing zone study was determined necessary for the Eugene-Springfield WPCF Outfall 001. The specific elements of this Level 2 mixing zone study include:
• Outfall and Mixing Zone Characteristics • Discharge Characteristics • Ambient Receiving Water Characteristics • Environmental Mapping • Mixing Zone Modeling Analyses • Reporting
An Outfall Mixing Zone Study Plan was prepared by CH2M HILL for the MWMC and submitted to DEQ on August 1, 2013, as required by DEQ’s letter. The study plan defined the field measurements that are necessary for this mixing zone study to provide the elements defined in the RMZ-IMD, as well provide the field data needed for accurate dilution modeling.
The Outfall Mixing Zone Report was submitted by CH2M HILL to the DEQ on December 30, 2013. A summary of the Outfall Mixing Zone Report findings is provided in Appendix C. The study is now under DEQ review and will be finalized prior to the MWMC’s NPDES permit renewal.
27
1.5 CIP Projects Completed Since the 2004 MWMC Facilities Plan
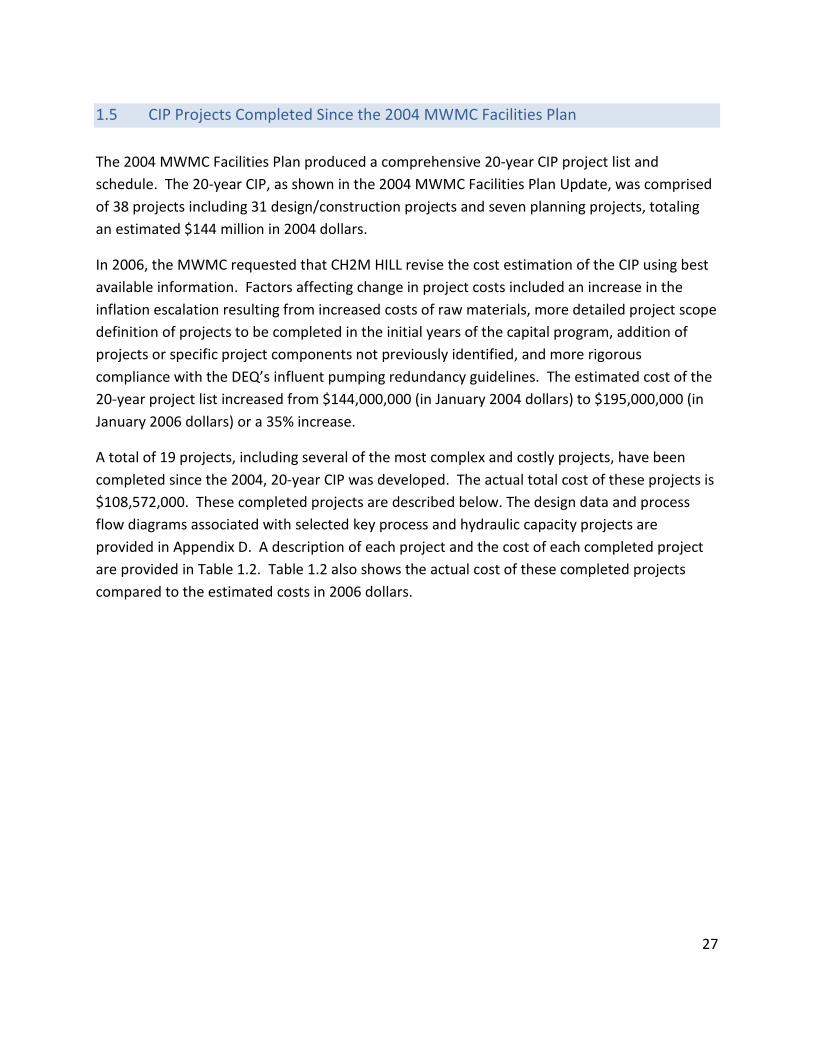
The 2004 MWMC Facilities Plan produced a comprehensive 20-year CIP project list and schedule. The 20-year CIP, as shown in the 2004 MWMC Facilities Plan Update, was comprised of 38 projects including 31 design/construction projects and seven planning projects, totaling an estimated $144 million in 2004 dollars.
In 2006, the MWMC requested that CH2M HILL revise the cost estimation of the CIP using best available information. Factors affecting change in project costs included an increase in the inflation escalation resulting from increased costs of raw materials, more detailed project scope definition of projects to be completed in the initial years of the capital program, addition of projects or specific project components not previously identified, and more rigorous compliance with the DEQ’s influent pumping redundancy guidelines. The estimated cost of the 20-year project list increased from $144,000,000 (in January 2004 dollars) to $195,000,000 (in January 2006 dollars) or a 35% increase.
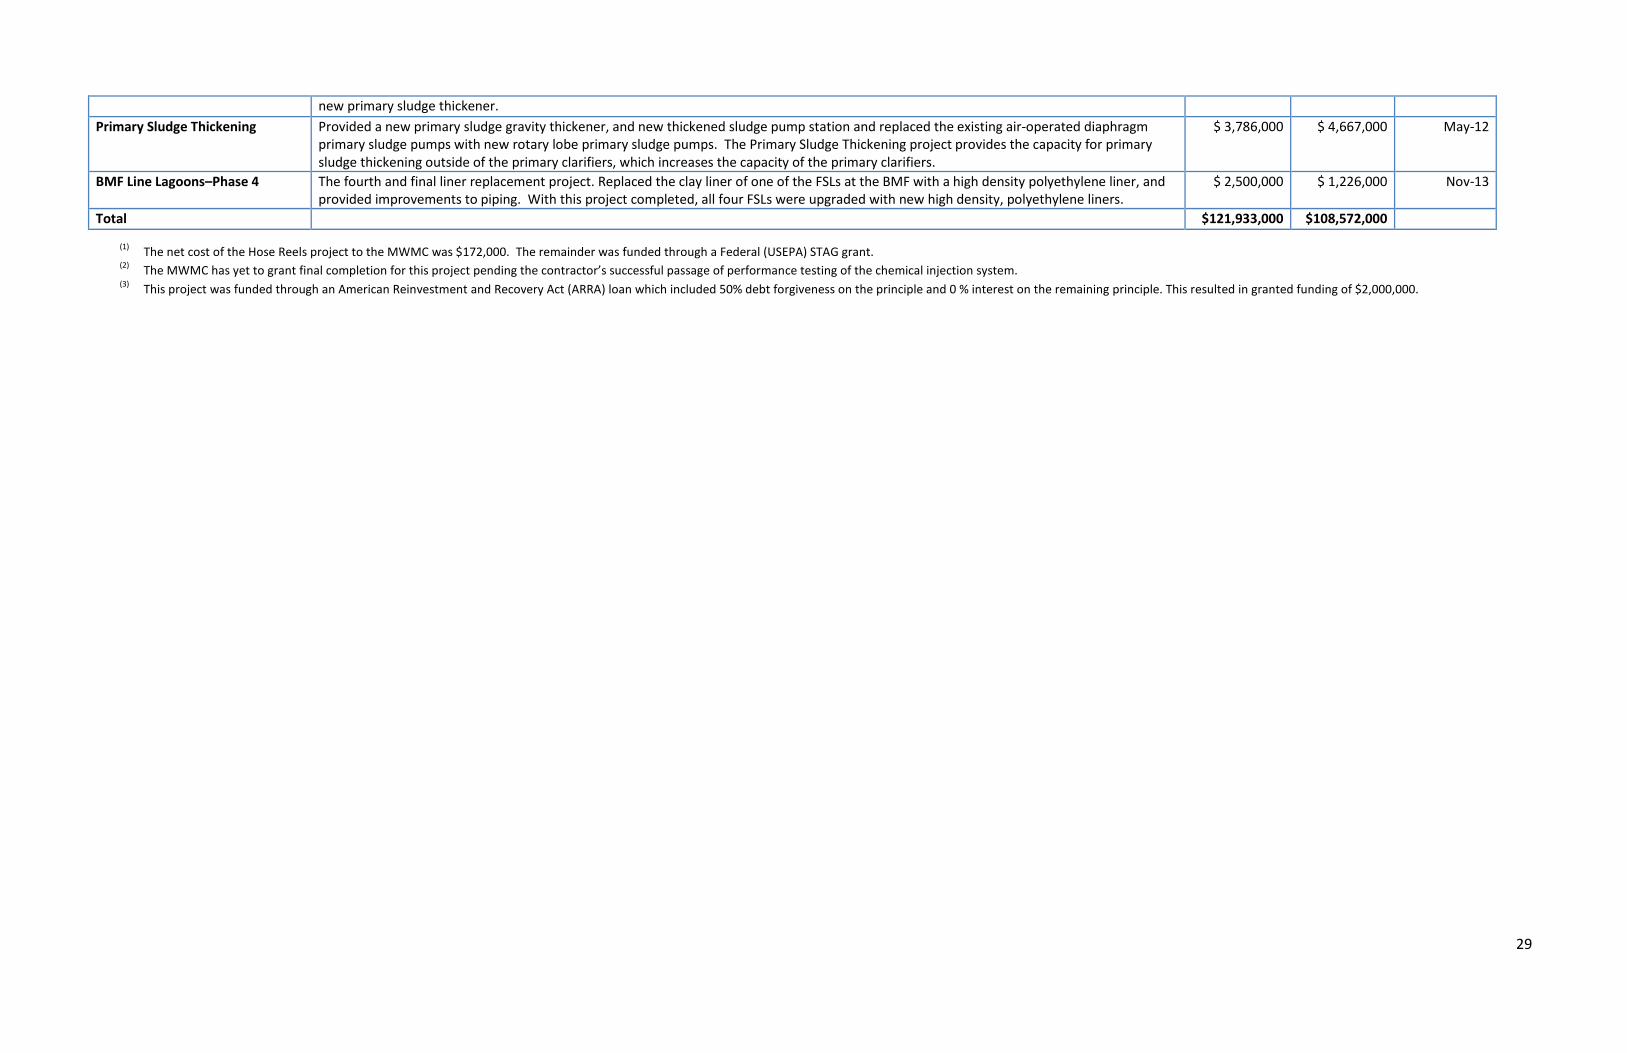
A total of 19 projects, including several of the most complex and costly projects, have been completed since the 2004, 20-year CIP was developed. The actual total cost of these projects is $108,572,000. These completed projects are described below. The design data and process flow diagrams associated with selected key process and hydraulic capacity projects are provided in Appendix D. A description of each project and the cost of each completed project are provided in Table 1.2. Table 1.2 also shows the actual cost of these completed projects compared to the estimated costs in 2006 dollars.

28
Table 1.2 –2004 MWMC CIP, Completed Projects
Project
Description
Estimated Cost in 2006 Dollars
Actual Project Cost
Substantial Completion
Date Temporary Construction Trailer Provided a modular building at the WPCF for MWMC capital program staff to use as a site office for management of the MWMC construction
program. $ 100,000 $ 100,000 May-06
Biocycle Farm Hose Reels (1) Provided six additional irrigation hose reels (in addition to the four already in use at the Biocycle Farm) for the Biocycle Farm to apply a slurry of liquid biosolids and Class D recycled water to the poplar plantation. $210,000 for this equipment was funded through a Federal (USEPA) STAG grant. The net cost to the MWMC was $172,000.
$ 420,000 $ 381,000 Oct-06
Biocycle Farm Soil Preparation and Planting–Phase 2
Provided soil preparation and planting services for Management Unit 2 (MU2) at the Biocycle Farm. $ 319,000 $ 268,000 Oct-07
River Avenue Improvements Provided road improvements to River Avenue adjacent to the WPCF. $ 500,000 $ 457,000 Nov-07 Digestion Mixing Improvements Replaced the gas lance mixing systems with draft tube mixers on three anaerobic digesters to increase the effective volume of the digesters. $ 2,920,000 $ 2,839,000 Apr-08 BMF Line Lagoons–Phase 1 The first of four liner projects. Replaced the clay liner of one of the FSLs at the BMF with a high density polyethylene liner, provided
improvements to piping and electrical systems, and provided an automated rail dredge system for lagoon dredging. $ 3,000,000 $ 3,235,000 Jul-08
Clarifier Improvements Combined Primary Clarifier Enhancements, Secondary Clarifier Enhancements, and Clarifier Nos. 9 and 10 projects. Added new sludge collection mechanisms to primary and secondary clarifiers, added new baffling and energy dissipating inlets, resurfaced clarifier floors, and added two new secondary clarifiers.
$ 17,213,000 $ 15,228,000 Sep-08
Conversion to Sodium Hypochlorite Disinfection (2)
Provided chemical receiving, storage, metering, injection, and static mixing systems needed to convert disinfection at the WPCF from gaseous chlorine to sodium hypochlorite. Also converted dechlorination from sulfur dioxide to sodium bisulfite.
$ 6,658,000 $ 4,858,000 Sep-09
Biocycle Farm–Phase 3 Provided soil preparation and planting services for MU3 at the Biocycle Farm. $ 334,000 $ 308,000 Sep-09 Aeration Basin–Phase 1 Modified the east aeration basins to add step-feed, anoxic selectors, and fine bubble diffusers. The project also removed hydraulic restrictions
and added primary effluent flow control gates. $ 9,212,000 $ 8,913,000 Nov-09
BMF Line Lagoons–Phase 2 The second of four liner projects. Replaced the clay liner of one of the FSLs at the BMF with a high density polyethylene liner, and provided improvements to piping and electrical systems.
$ 2,500,000 $ 1,226,000 May-10
Influent Pumping Imp. and Headworks Expansion
This project combined the Influent Pumping Improvements, Willakenzie Pump Station Expansion, and Dry Weather Headworks projects. This project added a new raw sewage submersible pump station at the WPCF; upgraded the Willakenzie Pump Station by refurbishing existing pumps, replacing variable speed drives, wet-well modifications, new discharge manifold, replaced leaky knife gate valves; and replaced one of the pumps with a new smaller jockey pump for low flow conditions; added a new headworks structure with two new screening channels, two new screens and two new vortex-type stacked plate grit chambers. In addition this project added yard piping improvements to allow greater operational flexibility and flow routing. Finally, this project included lining of the under-river force main from the Willakenzie Pump Station to the WPCF.
$ 24,975,000 $ 27,996,000 Jun-10
Odorous Air–Phase 1 (3) Provided the first phase of new odorous air treatment systems including redesign of existing biofilters with new engineered media and air distribution systems, new ducts and dampers and a new fan farm. In addition this project provided covers on two of the existing primary clarifiers.
$ 9,128,000 $ 8,261,000 Jun-10
Peak flow Management This project combined the Parallel Primary/Secondary Treatment and Bankside Outfall projects with the Outfall Mixing Zone Study and the High Rate Disinfection Basins project, which was formerly part of the Sodium Hypochlorite Conversion project. This project provided all of the diversion large diameter piping, valves, flow measurement, diversion structures and high rate disinfection basins needed to implement the MWMC’s peak flow management strategy.
$ 21,788,000 $ 17,754,000 Jun-10
Tertiary Filtration–Phase 1 This project added the first phase (10 mgd) of Tertiary Filtration capacity. The project added five compressible media filter units, a backwash pump station, a filter influent pump station and instrumentation and controls.
$ 12,667,000 $ 9,441,000 Nov-11
BMF Line Lagoons–Phase 3 The third of four liner projects. Replaced the clay liner of one of the FSLs at the BMF with a high density polyethylene liner, and provided improvements to piping and electrical systems.
$ 2,500,000 $ 1,055,000 Dec-11
Odorous Air–Phase 2 This project was implemented with the Primary Sludge Thickening project and provided the odorous air ductwork and tank cover system for the $ 1,413,000 $ 359,000 May-12
29
new primary sludge thickener. Primary Sludge Thickening Provided a new primary sludge gravity thickener, and new thickened sludge pump station and replaced the existing air-operated diaphragm
primary sludge pumps with new rotary lobe primary sludge pumps. The Primary Sludge Thickening project provides the capacity for primary sludge thickening outside of the primary clarifiers, which increases the capacity of the primary clarifiers.
$ 3,786,000 $ 4,667,000 May-12
BMF Line Lagoons–Phase 4 The fourth and final liner replacement project. Replaced the clay liner of one of the FSLs at the BMF with a high density polyethylene liner, and provided improvements to piping. With this project completed, all four FSLs were upgraded with new high density, polyethylene liners.
$ 2,500,000 $ 1,226,000 Nov-13
Total $121,933,000 $108,572,000
(1) The net cost of the Hose Reels project to the MWMC was $172,000. The remainder was funded through a Federal (USEPA) STAG grant. (2) The MWMC has yet to grant final completion for this project pending the contractor’s successful passage of performance testing of the chemical injection system. (3) This project was funded through an American Reinvestment and Recovery Act (ARRA) loan which included 50% debt forgiveness on the principle and 0 % interest on the remaining principle. This resulted in granted funding of $2,000,000.
30
2. WATER QUALITY REGULATORY ASSESSMENT
The DEQ is in the process of determining how to move forward issuing NPDES permit issuance and renewal program in the wake of the EPA’s recent disapproval of Oregon’s natural-conditions criteria for temperature (NCC) and statewide narrative “natural conditions” criteria (SNC). Recently, DEQ verbally indicated that due to the EPA’s actions, the MWMC’s permit renewal is now on hold until the year 2017. The following text summarizes the regulatory issues that the MWMC will likely face upon permit renewal.
2.1 Temperature
The MWMC is preparing for thermal load restrictions in future NPDES permits. The current NPDES permit was issued in 2002 with a thermal load limitation that was based on the dry weather design average flow. The NPDES permit specifies that the WPCF’s weekly average excess thermal load must not exceed 3.1 billion BTUs per day during the May 1 - October 31 (summer) season.
In June 2003, DEQ published guidance that specified that the maximum weekly design flow was to be used in this calculation instead of the weekly average. Based on this method, CH2M HILL estimated that the WPCF’s excess thermal load could be as high as 18.5 billion BTUs per day by the year 2025 (2004 MWMC Facilities Plan, Volume 2, Technical Memorandum No. 12). In anticipation of an impending permit renewal, regional staff developed a Temperature Management Plan for the WPCF which was subsequently submitted to and approved by Oregon DEQ.
In March 2004 EPA approved Oregon’s new temperature standard. In addition to biologically based numeric temperature criteria, the standard contained an NCC and a SNC. Over the next two years, DEQ developed a temperature total maximum daily load (TMDL) for the Willamette River system based on the new standard.
In 2005 Northwest Environmental Advocates (NWEA) filed suit challenging the EPA’s approval of the NCC and SNC, among other complaints. In February 2012, the court ruled in favor of NWEA stating the EPA’s approval of the NCC and SNC were arbitrary and capricious. The subsequent agreement between NWEA and EPA resulted in two court orders in 2013 – one in January and the second in April – in which the court vacated the NCC and the Endangered Species Act (ESA) consultation. EPA agreed to take action on the NCC and to review Oregon’s

31
antidegradation guidance. The U.S. Fish and Wildlife, and the National Marine Fisheries (hereafter the Services) agreed with EPA to redo their ESA consultation. On April 10, 2013, the court issued an order, vacating and remanding to the EPA its previous approvals of the NCC and SNC requiring the EPA to take action within 120 days. The EPA met that obligation with the issuance of its August 8, 2013, letter to the DEQ disapproving the standard.
With the EPA’s disapproval of the Oregon temperature standard the NCC no longer applies. DEQ is now considering temperature standard development options to find a way forward that would be acceptable to the federal courts, EPA, the Services, the environmental community and associated stakeholders. This process will not proceed until the Services complete their review/assessment of the 2003 Biological Opinions and issue revised Biological Opinions, which are due in late 2014. Until a new temperature standard is developed and EPA approved, dischargers renewing their NPDES permits would be required to meet Oregon’s numeric biological criteria.
It is unclear at this time what the thermal discharge criteria will be for the Eugene-Springfield WPCF. Accordingly, the MWMC cannot be sure what temperature or thermal mass limitations will be included under a renewed NPDES permit. However, given the disapproval of the NCC it is highly likely that the standard and resulting limits will be more restrictive than the WPCF’s current administratively extended permit excess thermal load limit and the waste load allocation (WLA) provided the MWMC under the now dismantled 2006 temperature TMDL upon which previous planning efforts were based. As the DEQ moves forward with the NPDES permit renewal process in the coming months and years, staff anticipates that the process should shed some light on how DEQ will approach interim temperature criteria in permits to better inform the MWMC’s thermal load mitigation planning efforts.
MWMC continues to pursue temperature management plan strategies including water recycling in a proactive effort to position itself to meet future regulatory obligations including water recycling and water quality (shade) credit trading. Accordingly, staff continues to evaluate recycled water opportunities as well as temperature credit development through continued discussion with The Fresh Water Trust and other stakeholders.
2.2 CBOD/TSS Mass Limitations
CBOD and TSS mass limits may be addressed during the next permit renewal process with DEQ. Mass limitations in the current permit are based on average dry weather design flow (49 mgd) and average wet weather design flow (75 mgd). Additionally, the daily mass limitation is waived when daily flow exceeds twice average dry weather design flow (98 mgd). The basis for

32
establishment of these permit limitations are described in OAR 340-041-0061(9). Permit changes to the CBOD/TSS mass limit requirements could result in the need for additional treatment. Any increase to the average dry or wet weather or design flow ratings could lead to permit limit changes as well as provide justification for requesting an increased CBOD and TSS mass limits. However, any such a request would require Environmental Quality Commission (EQC) approval according to OAR 340-41-0120. EQC approval of a mass load increase may not be granted – it is EQC’s policy to not allow increases in mass loads except under specific circumstances. Additionally, an increase in the average dry weather design flow would increase the flow threshold at which the daily mass limitations are waived.
2.3 Mixing Zone/RPA
The MWMC recently completed an outfall mixing zone study to meet new DEQ requirements. DEQ is currently reviewing the MWMC’s mixing zone study report. The previous mixing zone study was performed in 1993, and approved by Oregon DEQ in 1995. The existing outfall diffuser has been approved, and the current mixing zone defined in the MWMC’s existing NPDES permit. In May 2012, DEQ published their Regulatory Mixing Zone (RMZ) Internal Management Directive (IMD) to provide guidance to permit writers in support of the EPA approved Oregon MZ rule OAR-340-041-0053. Additionally, OAR-340-041-0053(2)(d)(D) states:
Unless the ambient temperature is 21.0 degrees of greater, migration blockage is prevented or minimized by limiting potential fish exposure to temperatures of 21.0 degrees Celsius (69.8 degrees Fahrenheit) or more to less than 25 percent of the cross section of 100 percent of the 7Q10 low flow of the water body.
Fortunately, the MWMC Mixing Zone Study concluded that river temperature near the diffuser ports is never greater than 21 degrees Celsius and the diffuser length is less than 25% of the river width under the 7Q10 condition. Prior to the IMD, a flux-average method was commonly used to model the zone of initial dilution (ZID). However, the IMD requires a center-line dilution method for ZID dilution modeling. The center-line dilution method typically lowers the resulting ZID dilution value as

33
compared to the average flux method3. This could have an impact on the MWMC’s “reasonable potential” to exceed ambient water quality criteria. The MWMC’s revised RMZ Study report was submitted to the DEQ on December 30, 2013, and is currently under DEQ’s review. The field analysis and dilution modeling were performed in accordance with the DEQ’s 2011 RMZ-IMD. Staff anticipates that the approved analysis will include moderate changes to dilution factor values. These are used in the Reasonable Potential Analysis (RPA) to establish permit monitoring requirements and water quality based effluent pollutant limits. These would be incorporated into the renewed NPDES permit, which is not expected to occur until 2017.
2.4 Toxics
2.4.1 General
Oregon’s Toxics Standards Rule (OAR 340-041-0033) contains toxics water quality criteria for the protection of human health and aquatic life. New toxics water quality criteria have been recently approved and others are under development. With the approval of new water toxics quality criteria comes the requirement for effluent toxics characterization monitoring in Schedule B in the next NPDES permit. This will require extensive toxicity tests on plant effluent aimed at determining whether the effluent contains toxic concentrations of specific substances (metals, cyanide, phenols, Volatile Organic Compounds [VOCs], acid extractables and base
3 In accordance with the RMZ-IMD guidance dilution modeling results are presented as centerline dilutions at the ZID and flux-average dilutions at the RMZ. The model-predicted dilutions reported by CORMIX1 and CORMIX2 change between centerline and flux-average dilution predictions depending on the model module applied at distances from the discharge port. Based on guidance in the CORMIX user’s manual, a peak-to-mean ratio is used to translate model predicted flux-average dilutions to centerline dilutions or centerline dilutions to flux-average dilutions for submerged discharge jet or plume regions. The peak-to-mean ratio is dependent on the type of discharge (single round versus multiport), distance from the discharge port (i.e. plume entrainment increases with distance from the port), merging of adjacent port plumes, and other factors (i.e. water depth, port angle, current velocity). The CORMIX user’s manual recommends using a peak-to-mean ratio of 1.7 for single round ports and 1.3 for multiport plane discharges. Because Outfall 001 is a multiport diffuser and the ZID distance is 50 feet from the ports, a 1.3 peak/mean ratio was applied to translate average dilutions to centerline dilution factors at the ZID.

34
neutrals). This also includes a determination as whether the effluent as a whole has any toxic effects on aquatic life; so called whole effluent toxicity (WET) testing.
These monitoring and effluent characterization results will be evaluated by DEQ and depending on the conclusions the MWMC may be required to perform additional sampling. If this is necessary the MWMC would submit a sampling plan within 3 months of receiving a DEQ Monitoring Action Letter.
In addition to monitoring and testing, new criteria may eventually lead to toxics reductions plan requirements. For the MWMC, reduction plans could make necessary new local limits for industrial users of the wastewater collection and regional treatment systems. Local limits reflect the specific needs and capabilities at individual Publicly Owned Treatment Works (POTWs) and are designed to protect the POTW, its receiving waters, and its sludge disposal practices. Regulations at 40 CFR 403.8(f)(4) state that POTW Pretreatment Programs must develop Local Limits or demonstrate that they are unnecessary; 40 CFR 403.5(c) states that Local Limits are needed when pollutants are received that could result in pass through or interference at the POTW. Essentially, Local Limits translate the General Prohibited Discharge Standards of 40 CFR 403.5 to site-specific needs. Should establishment of new limits become necessary, there could be increased pretreatment requirements for industrial users that could add to their operational costs.
2.4.2 Human Health Water Quality Criteria:
In 2011, the EQC adopted new human health water quality criteria for toxics that went into effect on October 11, 2011. The new human health water quality criteria are based on a fish consumption rate of 175 grams per day (unless otherwise noted in the rule). The change dramatically tightens Oregon's human health criteria for a host of pollutants, including mercury, flame retardants, polychlorinated biphenyls (PCBs), dioxins, plasticizers and pesticides. The concentration limitations for these and many other toxic substances are anticipated to be substantially reduced from their current values (i.e., more stringent requirements) as a result of the new criteria.
2.4.2.1 Mercury
Mercury occurs naturally in the environment, particularly in regions where volcanism and geothermal activity have occurred; however, substantial amounts of mercury are introduced to the environment through anthropogenic activities. Inorganic or elemental chemical forms of

35
mercury are converted by bacteria to methyl mercury which bio-accumulates in organism tissues, and when consumed by humans is a neurotoxin (mercury, and methyl mercury, are not carcinogens). The Willamette River was listed on Oregon’s 2002 303(d) list of impaired water bodies for exceeding Oregon’s mercury human health water quality criteria. In 2006, DEQ issued the Willamette River TMDL, which includes a TMDL for mercury. The 2006 Willamette Basin Mercury TMDL and associated Water Quality Management Plan requires point sources to develop mercury minimization plans and to monitor their effluent to better characterize their contribution of mercury and the effectiveness of management measures. The TMDL does not require point sources to meet sector specific allocations described in the TMDL. The mercury human health water quality criterion adopted in 2011 is described in units of methyl-mercury (MeHg) per kilogram of fish tissue based on the consumption rate of 175 grams per day. However, there are no analytical translators available to convert total mercury in wastewater plant effluent to MeHg in fish tissue. To help states and authorized tribes in the implementation of the fish tissue-based criterion, in April of 2010 EPA published their Guidance for Implementing the January 2001 Methyl-Mercury Water Quality Criterion (EPA Guidance). The EPA guidance describes the use of the new fish tissue-based criterion and presents a number of pathways to incorporate it into NPDES permits and TMDLs. In 2013, DEQ issued an IMD for Implementation of Methyl-Mercury Criterion in NPDES Permits. Under this IMD, DEQ opted to use the EPA guidance pathway that:
• Describes a process to determine if there is a reasonable potential to cause or
contribute to the exceedance of the methyl-mercury water quality criterion using total mercury as an indicator, and
• Establish appropriate (non-numeric) Water Quality Based Effluent Limits (WQBELs) comprised of a Mercury Minimization Plan (MMP), continuing effluent monitoring and antidegradation provisions.
Under the IMD, all major domestic point source dischargers (including the MWMC) will be required to monitor their effluent for total mercury and run a reasonable potential analysis. However, because there are no analytical translators available to convert total mercury in wastewater plant effluent to MeHg in fish tissue, the analytical monitoring method for MeHg is still unclear to the point-source community and is a continuing topic of discussion between DEQ and the regulated community.

36
In accordance with the 2006 Willamette River TMDL, Pretreatment Program staff working in both Eugene and Springfield has sampled significant industrial users for mercury, and have requested voluntary reductions when mercury was found. All discharges were below current local limits. Best Management Practices for dental offices have been developed. However, the TMDL, revised MeHg human health criteria adopted in 2011, and 2013 MeHg IMD may eventually result in the requirement for local limits development as described above.
2.4.2.2 Arsenic
The Willamette River was listed in the 2002 303(d) list for exceedance of the arsenic human health criterion for “water and fish ingestion.” However, the water quality standard for arsenic has changed since the 2002 303(d) listing. DEQ is currently reviewing and, where appropriate, revising water bodies that were previously listed based on the old criteria Aquatic Life Standards.
2.4.3 Aquatic Life Water Quality Criteria
On January 31, 2013, EPA took action on Oregon’s revised aquatic life toxics criteria submitted in 2004. EPA approved 38 criteria associated with 14 toxic pollutants and disapproved 45 criteria values associated with 16 toxic pollutants (11 pesticides, ammonia, cadmium, copper, selenium, and aluminum). EPA disapproved the freshwater acute criterion for cadmium based on findings in the National Marine Fisheries Service’s August 2012 Biological Opinion. EPA disapproved the ammonia criteria because new toxicity data showed that the criteria were not protective of mollusks. EPA also disapproved criteria associated with 14 other pollutants, including 11 pesticides, copper, selenium and aluminum, due to inconsistencies associated with EPA’s nationally recommended criteria.
DEQ has taken a two-phased approach to address the disapproved standards. The first phase focuses on corrections and clarifications and includes action on the pesticide standards. DEQ has indicated it will address revisions to the aluminum, ammonia, cadmium, copper and selenium standards in 2014. New water quality standards will be applied to the MWMC’s future NPDES permit renewal and may require enhanced industrial pretreatment/waste minimization efforts or even additional treatment processes to meet effluent limitations.

37
2.4.3.1 Ammonia
Ammonia is among the toxic pollutants listed above for which DEQ is revising its aquatic life ambient water quality criteria. Schedule A, Note 7, of the MWMC’s current permit states that the permit may be re-opened and the ammonia limits modified if Oregon adopts a new standard for ammonia. In April 2013, EPA updated the federal Aquatic Life Ambient Water Quality Criteria for Ammonia. Oregon may elect to adopt the new federal criteria for ammonia. The current Oregon ammonia aquatic life ambient water quality criteria are based on the EPA’s 1985 criteria. Key differences between the EPA’s new criteria and Oregon’s current standard include:
• EPA’s new standard takes into account fresh water mollusks in addition to salmonids • The EPA’s new chronic numeric criterion is less stringent than Oregon’s current chronic
numeric criterion4 • EPA’s new acute numeric criterion is slightly more stringent than Oregon’s current acute
numeric criterion5 Staff performed an RPA for ammonia using EPA’s new criteria with the dilutions that resulted from the recent draft regulatory mixing zone analysis. The RPA resulted in no reasonable potential for exceedance of the new ammonia chronic or acute aquatic life ambient water quality criteria. The Oregon Association of Clean Water Agencies (ACWA) is involved in an effort to convince DEQ to break out ammonia separately from the other 15 EPA disapproved pollutants and move forward quickly to adopt EPA’s 2013 Aquatic Life Ambient Water Quality Criteria for Ammonia. MWMC staff continues to actively support this effort. It should be noted that for the MWMC, the current ammonia standard applies May 1 through October 31 but the new permit may change the applicable dates based on periods for salmonid rearing (May 16 through October 14) and spawning (October 15 through May 15) , although these periods may also change depending on the outcome of the Services review of issues
4 The EPA’s new chronic numeric criterion increased from 1.2 to 1.9 milligrams of Total Ammonia Nitrogen per Liter (TAN mg/L) and is based on a 30-day average as opposed to Oregon’s current 4-day rolling average. However, the new standard also stipulates that ammonia concentration cannot exceed 2.5 times the CCC (or 4.8 mg TAN/L), at pH 7, 20°C, as a 4-day average within the 30-days, more than once in three years on average.
5 The new acute numeric criterion decreased from 19 to 17 mg TAN/L, at pH 7, 20°C, on a one-hour average basis.

38
related to the Temperature TMDL. While the RPA indicates we would not exceed the acute or chronic limits, the facility does approach the chronic limit during the rearing period at the RMZ. Historical data indicate the facility has an ammonia concentration of 1.0 mg/L at the RMZ (using the new Mixing Zone Study dilution factors) with a limit of 1.37 mg/L under EPA water quality criterion proposed for adoption.
2.5 Turbidity
The Oregon Turbidity Water Quality Rule is described in OAR 340-041-0036. Under the current rule, no more than a 10% cumulative increase in natural stream turbidities may be allowed, as measured relative to a control point immediately upstream of the turbidity causing activity. However, the rule includes exceptions for limited duration activities necessary to address an emergency.
The Oregon Turbidity Water Quality Rule is undergoing revisions and is currently under technical advisory group review. The DEQ’s most recent proposed turbidity rule language (Section 2(a) of the proposed rule) would require that the median turbidity for the summer season would not exceed 3 NTUs more than one year out of every three years on average. Moreover, Section 2(e) of proposed rule states that in waters that are at or exceed the applicable criterion, and for which no turbidity TMDL has been completed, no single NPDES point source may cause the turbidity of a water body during the summer season to increase more than 0.4 NTU after mixing with either 25% of the stream flow or the turbidity mixing zone developed in accordance with OAR 340-041-0053, whichever is more restrictive.
At certain times, according to the United States Geological Survey (USGS) monitoring, the Willamette River in the vicinity of the MWMC’s outfall may be close to or exceed the 3 NTU standard set in the proposed rule, which would likely trigger the proposed Section 2(e) requirement described above.
2.6 Sanitary Sewer Overflows (SSOs)/CMOM
Oregon’s current design storm rules are embedded in the bacteria water quality standard (OAR 340-041-0009), which prohibits overflows from less than a 5-year, 24-hour winter storm, and from a less than 10-year 24 hour summer storm. However, starting in 2007, the EPA rejected Oregon NPDES permits containing the DEQ’s authorized exceptions for storm related SSOs. In the years 2007 through 2009, ACWA proposed that the DEQ implement a pilot strategy whereby CMOM programs could be referenced directly in NPDES permits as a means of
39
eliminating avoidable SSOs while providing permit shield for agencies who agreed to implement CMOM. However, in spite of this effort in 2009, DEQ began issuing permits with language prohibiting all SSO’s with no exceptions for excessive storm events. Under this strategy, any SSO would potentially become a permit violation but DEQ could exercise enforcement discretion in determining the severity of the violation taking into account specific impacts and circumstances. In November of 2010, DEQ published an SSO Enforcement IMD that described the process the DEQ staff must use to establish the appropriate level of enforcement when a permittee experiences an SSO. The IMD references a CMOM program as a means of preventing SSOs and encourages permittees to adopt a CMOM program. It also references EPA CMOM guidance as a tool for distinguishing avoidable from unavoidable SSOs. Accordingly, adopting a CMOM program would not only help permittees prevent SSOs from occurring, but would also function to mitigate the level of enforcement action by the DEQ contingent upon the permittee’s compliance with its adopted CMOM program.
Recently with ACWA’s prompting, DEQ has revised the NPDES permit template to include new General Conditions (Schedule F) language addressing SSO’s. In the new template, DEQ removed the SSO prohibition language. While this is an improvement from the previous prohibition language, the new Schedule F language neither prohibits nor authorizes SSOs. This leaves uncertain what action the DEQ would take in the event of an SSO. Inasmuch as the EPA still considers SSOs that reach waters of the United States to be point source discharges which, like other point source discharges, are generally prohibited unless specifically authorized by an NPDES permit, the new general conditions language leaves permittees potentially exposed to federal violation and third party legal action in the event of an SSO.
To best manage these uncertainties and risks, an MWMC regional CMOM framework is under development, which could ultimately be acknowledged with a new permit renewal and would serve to inform DEQ in the event of an SSO enforcement action as they determine the appropriate enforcement action.
2.7 Blending
Also known as “split flow” “select treatment” etc., blending refers to the practice of diverting flow around a treatment component (usually secondary treatment) during high flows. The WPCF was designed to operate using blending when flow exceeds the secondary system capacity. The practice is not acknowledged in the NPDES permit. In late 2001, EPA issued draft

40
guidance on wet weather permitting issues, including blending. In 2002, two regional POTW groups and one city challenged in court EPA Headquarters’ and Regions 3, 4, and 6’s inconsistent positions on blending. Following issuance of a proposed policy on blending in late 2003 from EPA, this case was dismissed. EPA received significant public comment on the proposed policy, including over 98,000 comments opposing the policy due to concerns about human health risks. On May 19, 2005, EPA indicated that after consideration of the comments, the Agency had no intention of finalizing the 2003 proposal.
In 2005, EPA proposed a draft Peak Flows Policy (70 FR 76013) that followed the joint recommendations of the Natural Resources Defense Council (NRDC) and the National Association of Clean Water Agencies (NACWA). The 2005 proposed policy attempted to clarify EPA's interpretation that the existing “bypass” provision of the NPDES regulations (40 CFR 122.41) applies to peak wet weather diversions at POTWs that are recombined with the flows from the secondary treatment units prior to discharge. The policy would allow NPDES authorities to approve peak wet weather flow diversions around secondary treatment units if the criteria of 40 CFR 122.41(m)(4)(i)(A)-(C) are met. The policy also interprets the term “no feasible alternatives” in 40 CFR 122.41(m)(4)(i)(B) as it applies to such peak wet weather flow diversions. But the policy was never formally adopted in part because of opposition from POTWs that had been required to install additional treatment technologies to prevent bypasses. Although EPA never finalized the 2005 policy, some regional offices sought to implement it by requiring facilities to complete "no feasible alternatives" analyses to prove that they have no way to avoid occasional blending during extreme storm events.
Following the 2005 proposed policy, EPA’s effort on blending temporarily died down. Then in 2010 EPA announced in the Federal Register (75 FR 30395) plans to hold several “listening sessions.'' The reason for the listening sessions was for EPA to obtain information from the public on whether EPA should adopt the 2005 policy or a revised policy and/or address questions about peak flow as part of an SSO rulemaking. The SSO rulemaking approach was considered to allow for a holistic and integrated approach to reducing SSOs while at the same time addressing peak flows at the POTW treatment plant which included SSOs and blending proposed policies. Input was provided through both written comments and during four public listening sessions in late June and early July 2010. In July of 2011, EPA conducted a follow up workshop on the listening session information. Major themes discussed in the listening sessions and follow up workshop included:
• Reporting, recordkeeping, public notice CMOM • Municipal satellite collection systems • Prohibition on SSOs/exceptional circumstances
41
• Peak flows (blending and side stream treatment) In a recent unanimous judicial panel decision (League of Iowa Cities vs. EPA), the U.S. Court of Appeals for the Eighth Circuit renounced the EPA’s attempts to revise, by using guidance letters instead of formal rulemaking procedures, NPDES rules to limit wet weather treatment options. Specifically, the judicial panel found that “…The EPA may regulate the pollutant levels in a waste stream that is discharged directly into the navigable waters of the United States through a ‘point source’; it is not authorized to regulate the pollutant levels in a facility’s internal waste stream…” The ruling implies that the EPA cannot prohibit blending and can only regulate the pollutant levels in the effluent at the point of discharge to the receiving water body. This Eighth Circuit ruling, if upheld, would indicate for MWMC that the Peak Flow Management approach that was implemented at the Eugene-Springfield WPCF could continue to be utilized and that eventually when the administratively extended permit is renewed the practice of blending would be acknowledged in the NPDES permit.
Third party groups have inquired with the EPA whether or not flows diverted around unit processes contain a higher concentration of pathogens and hence even after subsequent disinfection is there a high net concentration of pathogen being discharged to receiving waters. Ongoing national research in this area is being conducted and these efforts could have implications for municipal point sources practicing peak wet-weather flow management approaches similar to the MWMC’s.
2.8 Microconstituents
Microconstituents are chemicals and chemical compounds found in the environment in trace amounts (i.e., measuring in concentrations of parts per billion or parts per trillion.) As equipment and laboratory procedures to detect microconstituents have increased, so have media attention and public concern. Microconstituents are also referred to as emerging constituents, endocrine disrupting compounds (EDCs), trace organic compounds (TOrCs), pharmaceutically active compounds (PhACs), pharmaceuticals and personal care products.
Many microconstituents enter municipal wastewater through bathing, cleaning, laundry, and the disposal of human waste and unused pharmaceuticals. Others (e.g., pesticides) enter the aquatic environment through runoff from urban and rural lands and streets. Microconstituents may become an issue in the Willamette River and in relation to domestic wastewater effluent, recycled water programs, and application of biosolids for beneficial uses.

42
EDCs, synthetic compounds that may interfere with the endocrine system of organisms, are of specific concern for the aquatic environment including the Willamette River. EDCs have the potential to:
• Mimic the action of naturally occurring hormones.
• Block cell receptors, preventing action of naturally occurring hormones.
• Affect synthesis, transport, metabolism, and excretion of hormones.
Many types of compounds can be considered EDCs: pesticides, surfactants, heavy metals, and PhACs. For some of these, such as heavy metals, EDCs will only occur at dosages greater than any established water quality standards. However, many other compounds that act as EDCs have been found in the environment in trace amounts. Natural hormones are found in humans and animals. Soybeans and alfalfa contain phytoestrogens. PhACs are synthetically produced hormones, such as those used for oral contraceptives, hormone replacement treatment, and animal feed additives. PhACs are used for diagnosis, treatment, alteration, or prevention of disease or health condition. PhACs are also used for similar veterinary purposes. Industrial chemicals, such as cleaning agents, pesticides, and plastics, contain synthetically produced hormones. Although some potent pesticides and herbicides have been banned, many other sources of EDCs see continued use.
The concern surrounding EDCs centers on the potential effects on wildlife, the environment, and humans. Although recent studies suggest minimal human health risk associated with PhACs in surface and drinking water, several studies have identified effects or potential effects of EDCs on aquatic life. Many concerns surround PhACs in particular. PhACs are able to pass through conventional wastewater treatment facilities. PhACs are typically designed to be resistant to biological degradation, and therefore resistant to biological treatment, but some treatment processes are available to remove the PhAC compounds.
Because of the concerns identified above, the Water Environment Research Foundation has been conducting and is continuing to conduct extensive research on the following:
• Wastewater treatment plant removal of TOrCs. One finding is that WWTPs that employ longer solids retention times (SRTs)—such as plants removing nutrients—have greater TOrC removal efficiencies than plants with short SRTs.
• Fate of estrogenic compounds during municipal sludge stabilization.
• Presence of TOrCs in biosolids and whether that should be of concern.
• Aquatic ecosystem and human health effects.

43
There is some potential for a requirement to begin monitoring for microconstituents but it is unlikely that these constituents will be regulated in upcoming permit. It is uncertain whether microcontaminants will be regulated in the form of discharge limitations at some point in the future. However, if microcontaminants are proven to adversely impact water quality, increase human health risk, or increase risk to aquatic life, it is reasonable to assume some regulation will occur. Such regulation may take the form of source control, discharge limitations, or some combination of the two. Prescription drug take back programs provide a secure, safe, free, and convenient drop-off site for pharmaceuticals that could otherwise end up in the WPCF influent. These highly successful anti-drug programs have substantial and obvious pollution prevention and public health and safety benefits and should be encouraged. MWMC should continue to track this important issue.
2.9 Future Nutrient Limits
Over the last decade, one of the EPA’s key focuses has been the development of federal nutrient water quality standards. In 1998, EPA announced a National Strategy for the Development of Regional Nutrient Criteria with a notice in the Federal Register. In 2001, EPA again published a notice in the Federal Register that numeric criteria have been developed for specific ecoregions throughout the U.S. and included reference conditions for two causal variables (total nitrogen and total phosphorus) and two response variables (chlorophyll a representing algal biomass and turbidity to provide a measure of water clarity) for each ecoregion and sub-ecoregion. EPA’s initial expectation was that states would develop a plan to adopt these criteria within 3 years of the Federal Register notice, formally including these criteria in their water quality standards by 2004. In 2007, EPA sent a memorandum to the states that re-emphasized EPA’s intent for all states to move forward expeditiously to adopt numeric nutrient criteria.
While state development of nutrient standards has been slower than EPA anticipated, many states, (including Oregon) have developed nutrient standards for certain water bodies, and some have developed standards for one or more of the four water types (i.e., estuarine and coastal waters, lakes and reservoirs, rivers and streams, and wetlands). Moreover, both Florida and Vermont have developed a complete set of Nitrogen and Phosphorus criteria for all four water types while several states are actually adopting numeric criteria. In the case of Florida, a 2008 lawsuit compelled EPA to take action on nutrient water quality standards. On January 14, 2009, EPA determined under CWA Section 303(c)(4)(B) that new or revised water quality standards in the form of numeric water quality criteria for nitrogen and phosphorus pollution are necessary to meet the requirements of the CWA in the State of Florida. Subsequently, EPA
44
entered into a Consent Decree with the plaintiffs of the 2008 suit which established a schedule for EPA to propose and promulgate numeric nutrient criteria for Florida’s lakes, springs, flowing waters, estuaries, and coastal waters.
In parallel with EPA’s national nutrient standard development efforts, a movement toward technology-based effluent limitations for nutrients has also gained momentum. State regulators have sent a letter requesting that EPA implement effluent nitrogen and phosphorus limitations for POTWs based on the availability of the technology (ASWPCA, 2007). The letter did not identify what the nutrient limits should be. In addition, on November 27, 2007, the Natural Resources Defense Council filed a petition to EPA to establish nutrient limits within the definition of secondary treatment for POTWs. The petition identified limits of 3.0 milligrams per liter (mg/L) for total nitrogen and 0.3 mg/L for total phosphorus. Although EPA has not taken action on these requests to date, it is taking them seriously and considering appropriate options.
A summary of regulatory issues and associated recommended planning strategies is provided in Table 2.1

Table 2.1 – Summary of Regulatory Issues and Recommended Strategies
45
Regulatory Issue Potential Impacts Recommended Planning Strategies
Temperature Following the recent federal Ninth Circuit Court Order and subsequent EPA disapproval of the NCC(1), elements of the 2006 Willamette Temperature TMDL have been vacated by the court, including those referencing the NCC and SNC. It remains to be seen whether DEQ and EPA will withdraw the entire Temperature TMDL, or modify it to address the court ruling.
DEQ must now develop temperature standards that are acceptable to the federal courts, EPA, the Federal Fish and Wildlife and NOAA Fisheries Services (hereafter Services), the environmental community and associated stakeholders. This process will not proceed until the Services complete their review of the 2003 Biological Opinions and issue revised Biological Opinions, which are due in late 2014. Such a process could take years to produce an EPA approvable standard.
Upon permit renewal in 2017, restrictive temperature limits are anticipated; however it is uncertain what the exact effluent limitations will be for the WPCF. Oregon’s biological temperature criteria may serve as the lone basis for effluent temperature or thermal waste load limits. In addition to effluent limitations, a re-developed standard or temperature TMDL may change the season(s) of critical compliance for the WPCF discharge.
• Continue to investigate and develop a comprehensive portfolio of thermal load mitigation strategies including, but not limited to, effluent diversion through recycled water, effluent storage, indirect subsurface discharge, and water quality trading and credit development.
• Continue to analyze compliance scenarios using available thermal load compliance evaluation tools.
• Continue to monitor the temperature standard conversation at the State level and DEQ’s progress in standard development.
• Take advantage of public rule review opportunities to proactively engage with DEQ and other clean water agencies to best ensure outcomes that are implementable and feasible for the MWMC’s rate payers.
CBOD/TSS mass limits CBOD and TSS mass limits may be addressed during the next permit renewal process with DEQ. The basis for establishment of the current permit limitations are described in OAR 340-041-0061(9)(a). For the current WPCF permit,
• Continue the strategy of phased addition of tertiary filtration taking into account any changes in effluent mass limitations as this

Table 2.1 – Summary of Regulatory Issues and Recommended Strategies
46
Regulatory Issue Potential Impacts Recommended Planning Strategies
these are based on average dry weather design flow (49 mgd) and average wet weather design flow (75 mgd).
Permit changes to the CBOD/TSS mass limit requirements could result in the need for additional treatment.
information becomes available through the permit renewal process.
• Other forms of TSS and CBOD removal technology could be considered should DEQ change the MWMCs effluent mass limits for these parameters including CEPT and High Rate Clarification.
• Consider development of recycled water beneficial uses that would also divert mass away from MWMC’s Willamette River outfall. This alternative may serve multiple long-term regulatory compliance needs including the MWMC’s thermal load mitigation strategy.
Toxics Human health water quality criteria, general
Oregon’s 2011 human health water quality criteria are based on a fish consumption rate of 175 grams per day (unless otherwise noted in OAR 340-041-0033). The change dramatically tightens Oregon's human health criteria for a host of pollutants, including mercury, flame retardants, PCBs, dioxins, plasticizers and pesticides. The concentration limitations for these and many other toxic substances are anticipated to be substantially reduced from their current values (i.e., more stringent requirements) as a result of the new criteria.
In the upcoming permit cycle, the new limits will require additional monitoring and potentially lead to toxics reduction plans which could include local limits development and
• Continue to monitor the toxics standard conversation at the State level and DEQ’s progress in standard development. Take advantage of public rule review opportunities to proactively engage with DEQ and other clean water agencies to best ensure criteria are being developed properly
• Run reasonable potential analysis using new Human Health Water Quality Criteria and mixing zone dilutions and evaluate results

Table 2.1 – Summary of Regulatory Issues and Recommended Strategies
47
Regulatory Issue Potential Impacts Recommended Planning Strategies
implementation. More stringent local limits would have monetary impacts on industries. Another component of toxic minimization plans may be increased public outreach and education requirements.
• Continue to plan for increased public outreach and education effort (including community advisory committees) in order to effectively communicate with industry and the public in conjunction with toxics minimization plans.
Mercury The 2013 IMD for Implementation of methyl mercury Criterion opted to use the EPA guidance pathway that:
• Describes a process to determine if there is a reasonable potential to cause or contribute to the exceedance of the methyl mercury water quality criterion using total mercury as an indicator,
• Establish appropriate (non-numeric) WQBELs comprised of a Mercury Minimization Plan (MMP), continuing effluent monitoring and anti-degradation provisions.
Both the 2013 MeHg IMD and the 2006 TMDL require monitoring of total mercury and MMPs. The effectiveness of the sampling and minimization plans approach is to be evaluated over time as part of an adaptive management framework. This approach could require development of local limits for mercury and/or mitigation of methylization in the POTW.
Aquatic life water quality criteria, general
EPA took action on Oregon’s revised aquatic life toxics criteria in 2013, approving 38 criteria associated with 14 toxic pollutants and disapproving 45 criteria values associated with 16 toxic pollutants (11 pesticides, ammonia, cadmium, copper, selenium, and aluminum), many due to

Table 2.1 – Summary of Regulatory Issues and Recommended Strategies
48
Regulatory Issue Potential Impacts Recommended Planning Strategies
inconsistencies associated with EPA’s nationally recommended criteria.
DEQ has taken a two-phased approach to address the disapproved standards. The first phase focuses on corrections and clarifications and includes action on the pesticide standards. For the second phase, DEQ has indicated it will begin to address revisions to the aluminum, ammonia, cadmium, copper and selenium standards in 2014.
New water quality standards will be applied to the MWMC’s future NPDES permit renewal and may require enhanced industrial pretreatment/waste minimization efforts and could require local limits development for industries.
Ammonia In 2013, EPA published an updated federal Aquatic Life Ambient Water Quality Criteria for Ammonia. The current permit references Oregon’s current ammonia criteria, which is based on the 1985 EPA standard. EPA disapproved Oregon’s revised ammonia criteria because new national toxicity data showed that the criteria were not protective of mollusks.
If DEQ adopts the 2013 EPA Ambient Water Quality Criteria for Ammonia, the criteria applicable to the WPCF would be less restrictive than the current 1985 criteria.
• Encourage DEQ’s rapid adoption of the 2013 EPA Ambient Water Quality Criteria for Ammonia.
Turbidity Oregon’s Turbidity water quality standard is currently under technical advisory group review. The DEQ’s most recent proposed turbidity rule language would limit the median dry season effluent turbidity as follows in Section 2 of the
• Monitor ambient turbidity in NTU upstream and downstream of the WPCF outfall.
• Participate in Oregon’s rulemaking

Table 2.1 – Summary of Regulatory Issues and Recommended Strategies
49
Regulatory Issue Potential Impacts Recommended Planning Strategies
proposed rule:
(a) Summer Criterion for Protection of Aquatic Life Uses Except for Salmon and Steelhead Migration Corridors and Cool Water Species. Median turbidity for the summer season may not exceed 3 NTU more than one year out of every three years on average.
(b) Summer Criterion for Protection of Salmon and Steelhead Migration Corridors and Cool Water Species. Median turbidity for the summer season may not exceed 5 NTU more than one year out of every three years on average.
In the Upper Willamette River, the 3 NTU limit would govern. The rule also contains a provision for waters that exceed the applicable limit in the absence of a TMDL. Here the proposed rule limits point source impact on the receiving water to an increase of no more than 0.4 NTU over the ambient condition after mixing with either twenty five (25) percent of the stream flow or the turbidity mixing zone developed in accordance with OAR 340-041-0053, whichever is more restrictive.
USGS monitoring of the Willamette River in the vicinity of the MWMC’s outfall suggests a likelihood the Upper Willamette River in many instances exceeds the 3 NTU criterions and would, therefore, trigger the 0.4 NTU impact limit provision described above. The adoption of the proposed rule could require additional treatment process improvements at the WPCF.
public review process to ensure the scientific basis of the proposed turbidity rule is valid, that the rule will result in cost effective and meaningful improvements to water quality, and outcomes are implementable and feasible for the MWMC.
• Continue moving forward with tertiary filtration capacity expansion taking into account any potential new turbidity requirements as more information becomes available through DEQ’s standards development process and the MWMC’s permit renewal.
• Summer season effluent diversion (e.g., recycled water beneficial uses), along with other process and operational strategies could compliment a portfolio of options to reduce WPCF turbidity impacts to the Willamette River during dry-season periods of high ambient turbidity.

Table 2.1 – Summary of Regulatory Issues and Recommended Strategies
50
Regulatory Issue Potential Impacts Recommended Planning Strategies
Sanitary Sewer Overflows (SSOs) In the last several years, DEQ’s general conditions language has gone from outright prohibition of SSOs to most recently the language is silent how SSO’s are to be treated under the permit. In the latter case, while the language is less restrictive than the former prohibition, it leaves permittees potentially exposed to legal action in the event of an SSO supported by EPA’s stated stance that SSOs reaching waters of the United States are point source discharges which, like other point source discharges, are generally prohibited unless authorized by an NPDES permit. The lack of “prohibition” language in Oregon’s permits does not eliminate the regulatory risk to permittees.
• MWMC’s best apparent defense against both lawsuit and permit violations associated with SSOs is to continue working with local agencies partners to implement a regional CMOM framework approach which could be acknowledged with a new permit renewal and would serve to help mitigate a DEQ enforcement action in the event of an SSO.
• During permit renewal, work with DEQ to remove the SSO prohibition language from general conditions section of the NPDES permit.
Proposed 303(d) category 5 listings
General DEQ is in the process of completing the 2012 Integrated Report and 303(d) list. The draft list of water quality limited waters was open for public review and comment January 2, 2014, through February 24, 2014. Dissolved oxygen, iron, and lead are revised as Category 5 (water quality limited, 303(d) list, TMDL needed) in the proposed list. Also, the listing for arsenic is unchanged from the 2002 303(d) even though the Table 33 water quality criterion for arsenic has since been revised.

Table 2.1 – Summary of Regulatory Issues and Recommended Strategies
51
Regulatory Issue Potential Impacts Recommended Planning Strategies
Dissolved Oxygen
The proposed list contains two Category 5 listings for dissolved oxygen.
The first listing is based on salmon and steelhead spawning criteria which is a concentration not less than 11.0 mg/L or 95% of saturation The associated fish use period is October 15 – May 15.
During the public review process, RWP staff has challenged this listing based on the inclusion of data values outside of specific seasonal periods defined for the listing and recommended that the DEQ reassess using only the seasonally specified data.
The second dissolved oxygen listing is based on year-round non-spawning, cool water fish use criteria which is a concentration not less than 6.5 mg/L. Here, staff point out that DEQ has combined multiple discrete reaches even though there is data available to assess each reach separately. Moreover, the data from River Mile (RM) 118.4 to 184.7 meet the cool water dissolved oxygen criterion during non-spawning periods yet the entire water body from RM 50.6 to 186.5 is listed as Category 5. Staff recommends that DEQ revisit the listing as defined over spatially discrete river segments and revise accordingly.
If the Category 5 listings are upheld, the EPA/DEQ standards development process would eventually lead to development of a TMDL or other form of water quality effluent limit. Should that occur, additional monitoring and potentially treatment at the WPCF could be required. However, the
• Continue to engage in standards review process to challenge DEQ’s inclusion of out-of-season data and combining of two discrete reaches in the establishment of their listings.
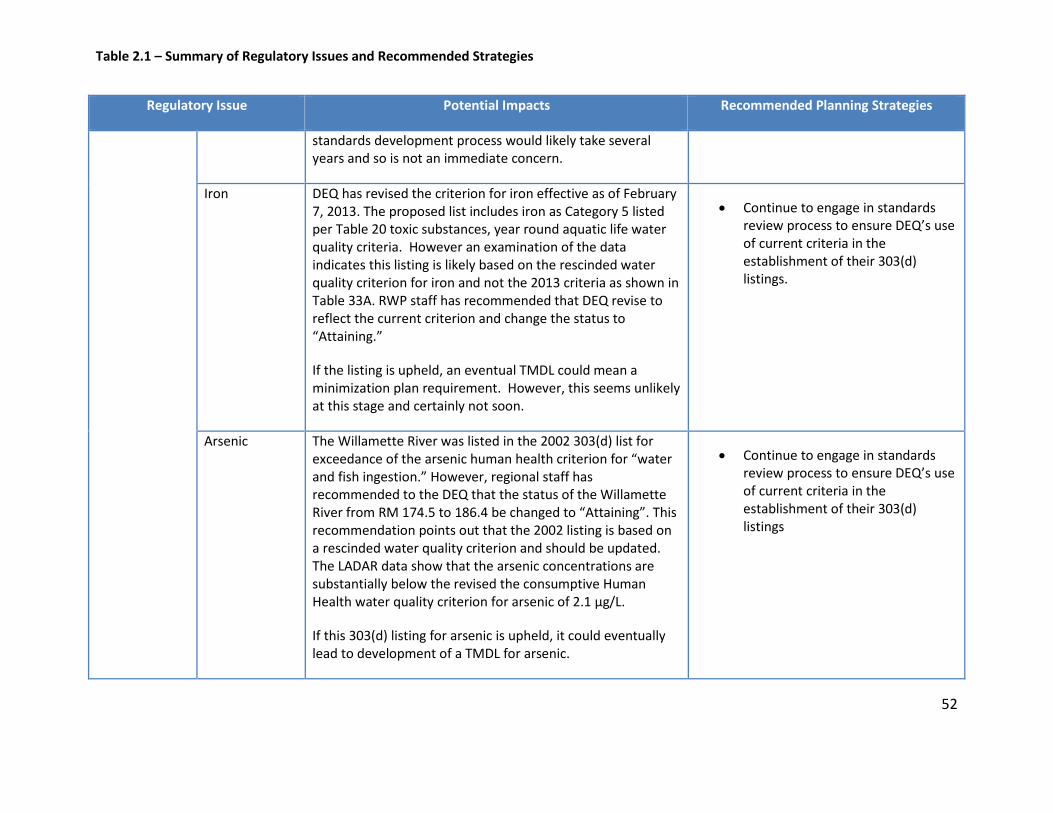
Table 2.1 – Summary of Regulatory Issues and Recommended Strategies
52
Regulatory Issue Potential Impacts Recommended Planning Strategies
standards development process would likely take several years and so is not an immediate concern.
Iron DEQ has revised the criterion for iron effective as of February 7, 2013. The proposed list includes iron as Category 5 listed per Table 20 toxic substances, year round aquatic life water quality criteria. However an examination of the data indicates this listing is likely based on the rescinded water quality criterion for iron and not the 2013 criteria as shown in Table 33A. RWP staff has recommended that DEQ revise to reflect the current criterion and change the status to “Attaining.”
If the listing is upheld, an eventual TMDL could mean a minimization plan requirement. However, this seems unlikely at this stage and certainly not soon.
• Continue to engage in standards review process to ensure DEQ’s use of current criteria in the establishment of their 303(d) listings.
Arsenic The Willamette River was listed in the 2002 303(d) list for exceedance of the arsenic human health criterion for “water and fish ingestion.” However, regional staff has recommended to the DEQ that the status of the Willamette River from RM 174.5 to 186.4 be changed to “Attaining”. This recommendation points out that the 2002 listing is based on a rescinded water quality criterion and should be updated. The LADAR data show that the arsenic concentrations are substantially below the revised the consumptive Human Health water quality criterion for arsenic of 2.1 µg/L.
If this 303(d) listing for arsenic is upheld, it could eventually lead to development of a TMDL for arsenic.
• Continue to engage in standards review process to ensure DEQ’s use of current criteria in the establishment of their 303(d) listings

Table 2.1 – Summary of Regulatory Issues and Recommended Strategies
53
Regulatory Issue Potential Impacts Recommended Planning Strategies
Lead Lead is listed as a Table 20 Toxic Substance, Category 5 Water Quality Limited, Year-Round (Aquatic Life).
The current water quality standard for lead was adopted by the EQC in December 2013, is specified in Table 33B, and is expressed in terms of the dissolved concentration. After reviewing the data, regional wastewater staff has asserted that DEQ has likely instead used the total lead concentration in its assessment. Staff has recommended that DEQ revise the listing to reflect the current criterion and change the status to “Attaining.”
If the listing is upheld, an eventual TMDL could mean a minimization plan requirement. This is not an immediate concern.
• Continue to engage in standards review process to ensure DEQ’s use of current criteria in the establishment of their 303(d) listings.
Blending The recent Eighth Circuit Court of Appeals renouncement of the EPA’s use of guidance letters instead of formal rulemaking procedures, NPDES rules to limit wet weather treatment options has put blending on the back-burner for now. The judicial panel found that the EPA is not authorized to regulate the pollutant levels in a facility’s internal waste stream, implying that the EPA cannot prohibit blending and can only regulate the pollutant levels in the effluent at the point of discharge to the receiving water body.
This ruling, if upheld, would indicate that MWMC’s Peak Flow Management approach as implemented at the Eugene-Springfield WPCF could continue to be utilized and eventually, when the administratively extended permit is renewed, the practice of blending would be acknowledged in
• During the next permit renewal, the MWMC should request that the Peak Flow Management strategy implemented at the WPCF be recognized in the permit and the current requirement for DEQ notification under the General Conditions section removed.
• The MWMC should also continue to track wet weather flow management/blending discussion at the national level to keep apprised of the any changes in status on this issue and incorporate
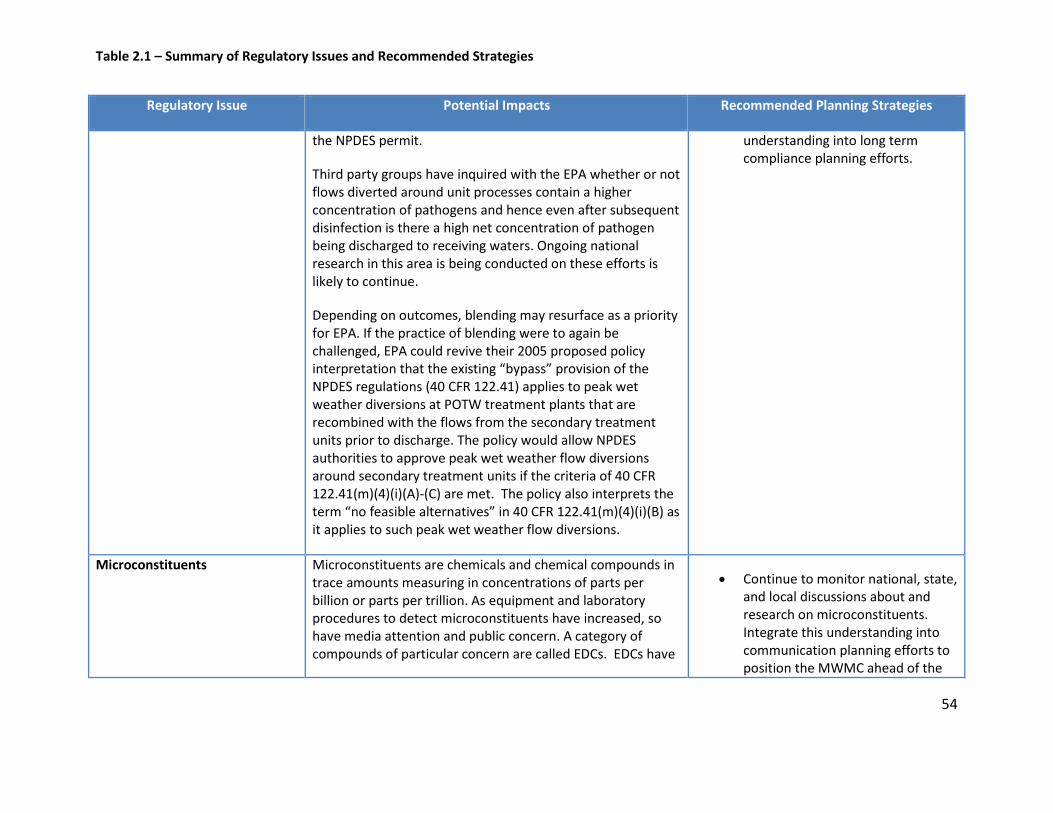
Table 2.1 – Summary of Regulatory Issues and Recommended Strategies
54
Regulatory Issue Potential Impacts Recommended Planning Strategies
the NPDES permit.
Third party groups have inquired with the EPA whether or not flows diverted around unit processes contain a higher concentration of pathogens and hence even after subsequent disinfection is there a high net concentration of pathogen being discharged to receiving waters. Ongoing national research in this area is being conducted on these efforts is likely to continue.
Depending on outcomes, blending may resurface as a priority for EPA. If the practice of blending were to again be challenged, EPA could revive their 2005 proposed policy interpretation that the existing “bypass” provision of the NPDES regulations (40 CFR 122.41) applies to peak wet weather diversions at POTW treatment plants that are recombined with the flows from the secondary treatment units prior to discharge. The policy would allow NPDES authorities to approve peak wet weather flow diversions around secondary treatment units if the criteria of 40 CFR 122.41(m)(4)(i)(A)-(C) are met. The policy also interprets the term “no feasible alternatives” in 40 CFR 122.41(m)(4)(i)(B) as it applies to such peak wet weather flow diversions.
understanding into long term compliance planning efforts.
Microconstituents Microconstituents are chemicals and chemical compounds in trace amounts measuring in concentrations of parts per billion or parts per trillion. As equipment and laboratory procedures to detect microconstituents have increased, so have media attention and public concern. A category of compounds of particular concern are called EDCs. EDCs have
• Continue to monitor national, state, and local discussions about and research on microconstituents. Integrate this understanding into communication planning efforts to position the MWMC ahead of the

Table 2.1 – Summary of Regulatory Issues and Recommended Strategies
55
Regulatory Issue Potential Impacts Recommended Planning Strategies
the potential to:
• Mimic the action of naturally occurring hormones • Block cell receptors, preventing action of naturally
occurring hormones • Affect synthesis, transport, metabolism, and
excretion of hormone
There are a wide range of compounds that fall into this category including pesticides, heavy metals, and pharmaceuticals. Studies indicate the impacts of very low concentrations of EDCs can impact aquatic species.
As public awareness increases and more is learned about microconstituents and EDCs, there is likely going to be increased need for wastewater utilities to engage the public in dialogue about how best to manage the impacts of these compounds. There is some potential for a requirement to begin monitoring for microconstituents but it is unlikely that these constituents will be regulated in the upcoming permit. It is unclear whether microconstituents will be regulated in the form of discharge limitations at some point in the future. However, if microconstituents are proven to adversely impact water quality, increase human health risk, or increase risk to aquatic life, it is reasonable to assume some regulation will occur. Such regulation may take the form of source control, discharge limitations, or some combination of the two. In addition, because of the public awareness and concern, the conversation about microconstituents is something that wastewater agencies should be getting ahead of as they expand biosolids applications beyond their fence lines and
knowledge curve in discussion with stakeholders, the press, and the public.

Table 2.1 – Summary of Regulatory Issues and Recommended Strategies
56
Regulatory Issue Potential Impacts Recommended Planning Strategies
develop recycled water programs.
Federal Nutrient Limits Over the last decade, one of the EPA’s key focuses has been the development of federal nutrient water quality criteria. In a series of Federal Register notifications that began in 1998, EPA has developed a National Strategy for the Development of Regional Nutrient Criteria and, until recently, has steadily signified their intent that states develop statewide numeric nutrient criteria.
While state development of nutrient standards has been slower than EPA anticipated, many states, (including Oregon) have developed nutrient standards for certain water bodies. Both Florida and Vermont have developed a complete set of Nitrogen and Phosphorus criteria for all four water types. In the case of Florida, a 2008 lawsuit compelled EPA to take action on nutrient water quality standards.
In parallel with EPA’s national nutrient standard development efforts, a movement toward technology-based effluent limitations for nutrients has also gained momentum. Both the ASWPCA and the NRDC have made requests of EPA to establish technology-based nutrient limits for POTWs. The NRDC petition identified limits of 3.0 mg/L for total nitrogen and 0.3 mg/L for total phosphorus. Although EPA has not taken action on these requests to date, it is taking them seriously and considering appropriate options.
• Continue to monitor third party requests related to nutrient limits, EPA announcements, and Federal Register notifications on EPA’s regional nutrient criteria program.
• Continue to monitor the success and legal status of water quality trading programs to assess future viability for the MWMC.
• Continue to monitor the status of side-stream treatment, nutrient recovery technology and other strategies that serve multiple regulatory and community goals such as natural treatment systems.
(1) On Aug. 8, 2013, EPA disapproved a key provision of Oregon’s temperature standard, the “natural conditions criterion” (NCC). EPA’s action was ordered by the Oregon Federal District Court on April 10, 2013 based on an earlier ruling in February 2012. Oregon DEQ can no longer use the natural

Table 2.1 – Summary of Regulatory Issues and Recommended Strategies
57
conditions criterion to account for warmer temperatures in Oregon’s rivers, lakes and streams. The court similarly sent back to EPA a general natural conditions narrative criterion, which EPA also disapproved on Aug. 8.

58
3. FLOW AND LOAD PROJECTIONS
The flow and load projections presented herein are intended to update to the 2004 projected MWMC population, wastewater flows, and wastewater loads contributing to the WPCF. The 2004 flow and load projections were completed as Technical Memorandum No. 3 under the 2004 MWMC Facilities Plan. This update reviewed historical flow and load observations from year 2003 to year 2012 and compared these with the planning values developed in the 2004 MWMC Facilities Plan. From this analysis, planning flow and load numbers from 2004 will be updated and the basis of determining plant capabilities from the present to the build out date of 2050 reassessed.
3.1 Methodology
The projections from the 2004 Facilities Plan were based on Eugene-Springfield WPCF data from May 1990 to May 2003. The 2004 analysis was performed by the MWMC’s engineering consultant, CH2M HILL using a spreadsheet model. This analysis reapplies the CH2M HILL’s spreadsheet model using currently available flow, concentration, and population data.
The applied model uses historical flow, concentration, and population data to develop flow and load statistics for both wet and dry weather conditions. It then calculates wet weather and dry weather peaking factors, and then applies these to projected population growth estimates to project future wastewater flow and loading to future years.
In March of 2013, RWP staff requested the daily influent data for the period June 2003 to December 2012 from the Eugene Wastewater Division Operations group. This data included daily average flow in units of mgd; and CBOD, TSS, and ammonia concentrations in units of mg/L. The data were further classified by season with dry season data spanning the period May 1st through October 31st, and wet season spanning the period November 1st through April 30th.
In addition to the request for the daily influent data from the plant, a request was also placed to both the Eugene and Springfield Pre-Treatment groups asking for the industrial contributor data including flow, CBOD, TSS, and ammonia. The data set for industrial contained both metered and unmetered flows and concentrations. Where measured flows or concentrations were unavailable, values were instead based on the specific industries waste strength category for flow, CBOD and TSS. Because there is no waste strength category for ammonia, the value used in place of measured data was 25 mg/L.

59
A detailed description of the methodology is provided in Appendix E.
3.2 Results and Interpretation
3.2.1 Evaluation of the Historical Data for Anomalies
Suspected anomalies in the data were identified through an initial manual screening process. These anomalies were then discussed with City of Eugene Wastewater Division staff. The following changes to the data were made based on these discussions. This discussion is documented in an email from Don Stahl dated April 3, 2013, and attached as Appendix F. The changes include:
• The reported flow of 0 mgd on 4/13/2005 was a bad data point. This data point was removed from the raw data.
• The flow of 5.19 mgd on 7/11/2007 appeared to be an error in the database. The paper record showed an average flow of 28.4 mgd which was used for this date.
• The flow of 6.8 mgd on 2/8/2010 appeared to be very low given the maximum plant flow for this day was 44.5 mgd. This value was very similar to the previous and following days. Accordingly, the flow for this day was modified to 34.67 mgd, which was the average of the previous and following days.
• The ammonia value of 222 parts per million (ppm) on 4/26/2005 appeared to be an order of magnitude above most other values. This was verified by checking the laboratory database, which showed a value of 22 ppm. The value for this date was updated to the 22 ppm value.
After these data anomalies were resolved, the raw data was plotted to see if there were additional points that should be reviewed further. Further discussions with plant operations staff indicated that several high values of TSS and CBOD concentrations appeared to be outside of the expected range. There was concern that some of these data points might not be indicative of normal operating conditions, and might have stemmed from the cleaning of the sludge lagoons and other infrastructure upgrades. The 2004 Facility Plan had used a 99.9% confidence interval in their loading calculations, and a 100% confidence interval for their flow calculations. Since these loading values were in the extreme tails of the data, and the fact that the previous facilities plan had used a confidence interval to cull the data, a decision was made after consulting with CH2M HILL and Eugene plant staff to narrow the loading data for CBOD, TSS, and ammonia to three standard deviations on either side of the mean. This represented a confidence interval of 99.7%.

60
3.2.2 Resulting Historical Flow and Load Ranges
Within the ten years of history (June 2003 to December 2012) reviewed for this update the following ranges were found. The complete data set is provided in Appendix G.
Flow:
• Average Daily Flows (Dry Season) 23.4 mgd to 29.5 mgd • Max Average Daily Flows (Dry Season) 30.3 mgd to 103 mgd • Average Daily Flows (Wet Season) 36.3 mgd to 60.1 mgd • Max Average Daily Flows (Wet Season) 91.1 mgd to 191 mgd
CBOD:
• Average Daily CBOD (Dry Season) 35,300 lbs to 54,800 lbs • Max Average Daily CBOD (Dry Season) 52,300 lbs to 95,500 lbs • Average Daily CBOD (Wet Season) 40,600 lbs to 67,500 lbs • Max Average Daily CBOD (Wet Season) 63,700 lbs to 192,100 lbs
TSS:
• Average Daily TSS (Dry Season) 40,900 lbs to 60,800 lbs • Max Average Daily TSS (Dry Season) 76,200 lbs to 181,200 lbs • Average Daily TSS (Wet Season) 44,200 lbs to 109,200 lbs • Max Average Daily TSS (Wet Season) 111,600 lbs to 501,300 lbs
Ammonia:
• Average Daily NH3 (Dry Season) 4,800 lbs to 5,600 lbs • Max Average Daily NH3 (Dry Season) 5,600 lbs to 8,800 lbs • Average Daily NH3 (Wet Season) 5,700 lbs to 6,400 lbs • Max Average Daily NH3 (Wet Season) 6,900 lbs to 9,100 lbs
3.2.3 Population
An analysis of historical population data indicate lower population growth in the MWMC service area than was predicted by the 2004 analysis performed in the 2004 Facilities Plan. This likely reflects the downturn in the economy during the time that followed 2004. The Facilities Plan had estimated that the population served would be 229,100 by 2005 and 246,300 by 2010.

61
The actual population for these two periods was 223,420 and 236,988 respectively as shown in Table 3.1.
For the population projections estimated in this PFPU, 2012 was used as the base year and an average annual growth rate of .98% was applied to that population. The .98% average annual growth rate was determined from the Population Forecasts for Lane County, its Cities and Unincorporated Area 2008-2035, May 20096. Projections for population were made at five year increments starting in 2015 and continuing in 2020, 2025, 2030, and 2035 as well as the build out date of 2050. These projected population values are shown below in Table 3.2. The revised estimate of MWMC served population at buildout year 2050 is 328,800, which is lower than the 2004 Facility Plan estimate of 383,100. The difference between the current population projection and the population projection estimated in the 2004 Facilities Plan is illustrated in Figure 3.1.
6 This value (0.98%) for average annual population growth in the Eugene-Springfield UGB is explained on page 35 of Population Forecasts for Lane County, its Cities and Unincorporated Area 2008-2035, Population Research Center, College of Urban Affairs, Portland State University, May 2009

62
Table 3.1 : Annual Population within the MWMC Service Area (1990 – 2012) Year Eugene-Springfield
Population Santa
Clara/River Road Population
Total Population Served
1990 157,352 0 157,352 1996 176,465 19,260 195,725 1997 179,970 21,400 201,370 1998 185,160 21,400 206,560 1999 189,435 21,400 210,835 2000 190,919 21,400 212,319 2001 194,054 21,400 215,454 2002 196,337 21,400 217,737 2003 198,630 21,400 220,030 2004 199,990 21,400 221,390 2005 202,020 21,400 223,420 2006 205,660 21,400 227,060 2007 211,010 21,400 232,410 2008 212,625 21,400 234,025 2009 215,185 21,400 236,585 2010 215,588 21,400 236,988 2011 216,705 21,400 238,105 2012 218,175 21,400 239,575
Table 3.2 : Projected Population within the MWMC Service Area (2015 – 2050)
Year Eugene-Springfield Population Projections
Santa Clara/River Road Population
Estimated MWMC Service Area Population
Projections
2015 225,200 21,400 246,600 2020 237,000 21,400 258,400 2025 248,700 21,400 270,100 2030 260,400 21,400 281,800 2035 272,200 21,400 293,600 2050 307,400 21,400 328,800

63
Figure 3.1: Eugene Springfield Population Trend
3.2.3.1 Per Capita Evaluation
Per capita values for Flow, CBOD, TSS, and ammonia for Dry and Wet Seasons were calculated based on the historical data. These are presented in Table 3.3.
Table 3.3 - Per Capita Values for Flow and Loads
Parameter Dry Weather Value Wet Weather Value Flow (gpcd) 105 198 CBOD (ppcd) 0.16 0.20 TSS (ppcd) 0.18 0.27 Ammonia (ppcd) 0.022 0.025
It is important to note that the average annual per capita flow for the base flow condition of the dry season has continued to decrease as population has increased. The 2004 Facilities Plan estimate of per capita dry weather flow was 129 gallons per capita per day (gpcd), which has been revised to 105 gpcd via the current analysis. This trend is clearly shown in Figure 2, which compares population growth and per capita flow trends. This decrease in per capita flow over the last two decades is likely attributable to water conservation practices motivated possibly by
y = 2351.8x - 4E+06
y = 3424.5x - 7E+06
0
50,000
100,000
150,000
200,000
250,000
300,000
350,000
400,000
450,000
1990 1995 2000 2005 2010 2015 2020 2025 2030 2035 2040 2045 2050 2055
Popu
latio
n
Year
Revised Estimate
2004 Fac. Plan Estimate

64
economic and resource conservation considerations. The wet weather flow averages, although reduced from 229 gpcd to 198 gpcd, continue to be variable and dependent on storm frequency and intensity as well as sewer rehabilitation efforts rather than water use patterns.
Compared to the 2004 analysis, the per capita values for CBOD and TSS loads in the dry weather season dropped slightly with CBOD dropping from 0.185 pounds per capita per day (ppcd) to 0.16 ppcd, and TSS 0.205 ppcd to 0.18 ppcd. The per capita value for ammonia is slightly higher compared to the 2004 analysis and increased from a 2004 value of 0.020 ppcd to 0.022 ppcd. The wet weather per capita values for all the load parameters increased compared to the 2004 analysis. CBOD went from 0.185 ppcd to 0.20 ppcd, TSS went from 0.26 ppcd to 0.27 ppcd, and ammonia went from 0.022 ppcd to 0.025 ppcd. There does not appear to be a clear trend and the changes were relatively small.
Figure 3.2: Annual Average Flow Per Capita

65
3.2.4 Peaking Factors
Loading values for TSS, CBOD, and ammonia in units of pound per day were calculated. Average, 30-day rolling average, 7-day rolling average, and maximum day values were determined by year and season.
The peaking factors (the ratio of the selected statistical value [e.g., maximum 30-day value] to the average value) were calculated for maximum 30 day (wet/dry), maximum 7 day (wet/dry), and maximum average daily (wet/dry) flows and loads. Peaking factors were calculated for each year and season. These peaking factors were then used to calculate maximum, minimum, and average peaking factors for dry and wet weather seasons. Characteristic peaking factors were then selected for projection purposes. These are shown below in Table 3.4.
Table 3.4 – Flow and Load Peaking Factors
Season Statistic Flow (1) TSS loading CBOD loading NH3 loading
Dry (2) Average 1 1 1 1 Max 30-Day Avg. 1.45 – 1.71 1.35 1.27 1.2 Max 7-Day Avg. 1.66 – 2.12 1.56 1.46 1.36 Max Day 2.18 – 3.48 2.17 1.68 1.34 Wet (3) Average 1 1 1 1 Max 30-Day Avg. 1.63 – 2.29 1.51 1.4 1.18 Max 7-Day Avg. 2.17 – 3.27 2.09 1.75 1.31 Max Day 3.13 – 5.09 4.19 2.21 1.31
(1) Flow peaking factors present a range of average to upper limit results (2) Dry Season (May 1 – October 31) peaking factors are relative to average dry weather (3) Wet Season (November 1 – April 30) peaking factors are relative to average wet weather
For pollutant loading peaking factor values, only the average peaking factor values are shown. This methodology closely approximates the methodology that was applied in the 2004 MWMC Facilities Plan. Accordingly, this update does not seek to modify or improve the methods used in the 2004 Facilities Plan and thus presents both the average peaking factor and the upper limit peaking factor as presented in Table 3.4, and explained in note 1. However, in relation to the selection of peaking factors for loads, only average peaking factors were used for projection purposes, whereas the 2004 Facilities Plan applied load peaking factors selected from the historical load data using best professional judgment. Details showing the individual peaking values by year are included in Appendix G.

66
3.2.5 Projections
This analysis provides revised 20-year and buildout flow and load projections for the existing MWMC service area. Table 5 shows these projections through 2035 in 5-year increments and build out (year 2050) for flow, CBOD, TSS, and ammonia. Note the 2004 Facilities Plan projected out to 2025 and to build out.
In comparison to the 2004 projections for 2005 and 2010, the actual values (see Appendix G) trended downward with a few exceptions. This is likely due to a decrease in the population growth of the community. The few exceptions to this trend include:
• Average wet weather CBOD 2010 value higher than projected (65,800 lbs vs. 45,600 lbs)
• Max month wet weather CBOD 2005 value higher than projected (63,900 lbs vs. 57,500
lbs)
• Max month wet weather CBOD 2010 value higher than projected (95,400 lbs vs. 61,600
lbs)
• Average wet weather TSS 2010 value higher than projected (109,200 lbs vs. 64,000 lbs)
• Max month wet weather TSS 2010 value higher than projected (201,600 lbs vs. 85,500
lbs)
• Max month dry weather ammonia 2010 value higher than projected (7,200 lbs vs. 6,900
lbs)
• Average wet weather ammonia 2010 value higher than projected (6,100 lbs vs. 5,300
lbs)
The projected values are as follows in Tables 3.5 through 3.9.

67
Table 3.5 – Estimated MWMC Population Projection, 2015 - 2050
Year Estimated MWMC Service Area Population 2015 246,600 2020 258,400 2025 270,000 2030 281,800 2035 293,600
2050 (assumed buildout) 328,800
Table 3.6 – Projected Flow and Load Projections
Statistic 2015 2020 2025 2030 2035 2050 Average Dry Weather 27.2 28.5 29.7 30.9 32.2 35.8 Max. Month Dry Weather (Average)
38.8 40.6 42.4 44.2 46.0 51.3
Max. Month Dry Weather (Upper Limit)
45.7 47.8 49.9 52.0 54.2 60.5
Average Wet Weather 50.2 52.5 54.8 57.1 59.5 66.4 Max. Month Wet Weather (Average)
80.7 84.5 88.3 92.1 95.9 107
Max. Month Wet Weather (Upper Limit)
113 118 124 129 134 150
Max. Day Wet Weather (Average) 154 161 169 176 183 205 Max. Day Wet Weather (Upper Limit)
250 262 274 286 297 333
Table 3.7 – Projected TSS Loading (lbs/day)
Statistic 2015 2020 2025 2030 2035 2050
Average Dry Weather 44,400 46,500 48,600 50,700 52,800 59,200
Max. Month Dry Weather 58,600 61,500 64,300 67,200 70,100 78,600
Average Wet Weather 66,600 69,800 72,900 76,100 79,300 88,800
Max. Month Wet Weather 98,700 103,500 108,300 113,100 117,900 132,300

68
Table 3.8 – Projected CBOD Loading (lbs/day)
Statistic 2015 2020 2025 2030 2035 2050
Average Dry Weather 39,500 41,300 43,200 45,100 47,000 52,600
Max. Month Dry Weather 48,500 50,900 53,300 55,700 58,100 65,300
Average Wet Weather 49,300 51,700 54,000 56,400 58,700 65,800
Max. Month Wet Weather 66,600 69,900 73,200 76,500 79,800 89,700
Table 3.9 – Projected Ammonia Loading (lbs/day)
Statistic 2015 2020 2025 2030 2035 2050
Average Dry Weather 5,400 5,700 5,900 6,200 6,500 7,200
Max. Month Dry Weather 6,500 6,800 7,100 7,400 7,700 8,600
Average Wet Weather 6,200 6,500 6,800 7,000 7,300 8,200
Max. Month Wet Weather 7,200 7,500 7,900 8,200 8,600 9,600
3.3 Conclusions
The purpose and scope of this evaluation was to provide an update to the 2004 projected MWMC service area population, wastewater flows, and wastewater loads contributing to the Eugene-Springfield WPCF.
The analysis considered influent flow and pollutant load data from 2003 to 2012, and projected service area population growth. The findings show that current flow and load projections are generally lower than those determined under the 2004 MWMC Facilities Plan with some exceptions. The exceptions were the Maximum Month Wet Weather loadings for both TSS and CBOD and the Average Dry and Wet Weather Ammonia loadings. However, the magnitude of the differences between the current and 2004 projected loadings for these parameters were relatively minor.

69
4. PROCESS UNIT CAPACITY ASSESSMENT
The 2004 MWMC Facilities Plan developed a 20-year project list (see Appendix A). Phasing for implementing the projects on this list was based on a series of regulatory, community growth, and performance of existing facilities assumptions. MWMC is undertaking this PFPU project to review and update the 2004 Plan as needed with a specific focus on projects that are currently scheduled to be implemented / initiated within the next 5 years. A CFPU is currently scheduled to start in FY 2016-17 and will likely be completed by 2019, depending on the actual NPDES permit renewal timing.
Since 2004 when the last comprehensive Facilities Plan was undertaken, 19 of the capital projects identified in the 20-year CIP have been completed (see Table 1.2). These initial projects were primarily aimed at increasing the hydraulic capacity of the plant and managing peak flows, improving primary and secondary treatment capacity and effectiveness, improving digester mixing and effective volume, and adding the first increment of tertiary filtration capacity. The purpose of this capacity assessment is to evaluate recent performance, define (or redefine) the total capacity need through 2035, and based on those two findings determine if expansion/modification is required within the next 5 years for the following:
• Secondary Treatment (focused on Aeration Basins) • Tertiary Filtration • Anaerobic Digestion
The capacity assessment was conducted for the above listed processes using the CH2M HILL’s Pro2D process model. The process model assumptions, permit conditions, and evaluation criteria, were presented in the Unit Process Capacity Assessment: Evaluation Criteria TM (Appendix H). Selected model run input and output data for each of these three analyses are provided in Appendix I. The results of this Capacity Assessment are described below for each process.
In addition to the three processes above that were evaluated by CH2M HILL using the Pro2D process model, staff performed evaluations of the following listed CIP projects:
• Waste Activated Sludge Thickening • Glenwood Pump Station
These analyses are discussed in detail below.

70
4.1 Secondary Treatment
The 2004 Facilities Plan identified the need for modifications to the aeration basins (anoxic selectors and step feed capability), upgrades to the existing secondary clarifiers, and construction of two new secondary clarifiers. These improvements (only first phase of the aeration basins modifications) have been constructed, brought online in 2008, and operating data now exists. The Phase 1 aeration basin modifications involved modifying the four eastern cells. Phase 2, which was originally scheduled to be needed in 2016, involves upgrading the remaining western four cells. The purpose of this evaluation is to assess the performance of the Phase 1 improvements and reassess the timing of the need for Phase 2 modifications.
The activated sludge process evaluated the timing at which the next phase of aeration basin construction would occur. Tables 4.1 through 4.4 provide the results of the evaluation. Overall, the offline aeration basins are not expected to need to be upgraded until approximately 2025. At that point, the model simulated results indicated the secondary clarifiers would be solids loading limited during the wet weather max week event. A common approach to alleviate this bottleneck would be to modify the remaining four aeration basins so that the mixed liquor concentration routed to the secondary clarifiers could be reduced.
Table 4.1: Activated Sludge Capacity Assessment Simulated Results - 2025 Dry Weather Max Month
Parameter Units Value Reference/Comment
Estimated Last Pass MLSS mg/L 1,854
Secondary Clarifier Solids Loading Rate
Lbs/ft2-day 13.6 5 clarifiers online
Peak Secondary Clarifier Solids Loading Rate
Lbs/ft2-day 19.2
Secondary Clarifier Limiting Solids Flux
Lbs/ft2-day 51 Peak SLR is 37% of the limiting flux
Max. Month Average Secondary Clarifier Hydraulic Loading Rate
gpd/ft2 <600
Max. Day Secondary Clarifier Hydraulic Loading Rate
gpd/ft2 <1,000

71
Table 4.2: Activated Sludge Capacity Assessment Simulated Results - 2025 Wet Weather Max Month
Parameter Units Value Reference/Comment
Estimated Last Pass MLSS mg/L 2,304
Secondary Clarifier Solids Loading Rate
Lbs/ft2-day 19.5 9 clarifiers online
Peak Secondary Clarifier Solids Loading Rate
Lbs/ft2-day 27.4
Secondary Clarifier Limiting Solids Flux
Lbs/ft2-day 49 Peak SLR is 56% of the limiting flux
Max. Month Average Secondary Clarifier Hydraulic Loading Rate
gpd/ft2 <600
Max. Day Secondary Clarifier Hydraulic Loading Rate
gpd/ft2 <1,000
Table 4.3: Activated Sludge Capacity Assessment Simulated Results - 2025 Dry Weather Max Week
Parameter Units Value Reference/Comment
Estimated Last Pass MLSS mg/L 2,566
Secondary Clarifier Solids Loading Rate
Lbs/ft2-day 21.5 5 clarifiers online
Peak Secondary Clarifier Solids Loading Rate
Lbs/ft2-day 30.2
Secondary Clarifier Limiting Solids Flux
Lbs/ft2-day 51 Peak SLR is 59% of the limiting flux
Max. Month Average Secondary Clarifier Hydraulic Loading Rate
gpd/ft2 <600
Max. Day Secondary Clarifier Hydraulic Loading Rate
gpd/ft2 <1,000

72
Table 4.4: Activated Sludge Capacity Assessment Simulated Results - 2025 Wet Weather Max Week
Parameter Units Value Reference/Comment
Estimated Last Pass MLSS mg/L 2,947
Secondary Clarifier Solids Loading Rate
Lbs/ft2-day 29.7 10 clarifiers online
Peak Secondary Clarifier Solids Loading Rate
Lbs/ft2-day 41.5
Secondary Clarifier Limiting Solids Flux
Lbs/ft2-day 49 Peak SLR is 85% of the limiting flux. Clarifier capacity has been reached.
Max. Month Average Secondary Clarifier Hydraulic Loading Rate
gpd/ft2 <600
Max. Day Secondary Clarifier Hydraulic Loading Rate
gpd/ft2 <1,000
4.2 Tertiary Filtration
The 2004 Facilities Plan identified the need for tertiary filtration. In 2007, CH2M HILL conducted an evaluation to assist MWMC with determining how much filtration to build in the first phase. Subsequently, MWMC hired Kennedy/Jenks Engineering Consultants to conduct pilot testing of various filtration technologies. MWMC selected the Schreiber Fuzzy Filter™ (compressible media). A Fuzzy Filter™ system was designed and constructed with a rated nominal capacity of 10 mgd. The design criteria for the installed filter system were as follows:
• Sustained capacity: 11 mgd • Peak flow capacity: 14 mgd
Footprint was reserved to expand the system to:
• Sustained capacity: 33 mgd • Peak flow capacity: 42 mgd
The system was placed online in 2011. The purpose of this analysis is to assess the capacity of the installed system, re-assess filtration capacity based on current discharge permit assumptions, and determine how much additional filtration capacity (if any) needs to be installed and when it needs to be placed on line.

73
The filtration system is currently designed to only treat a fraction (11 mgd) of the secondary effluent flow. Thus, only a small portion of the flow gets additional treatment during peak flow days which is subject to the maximum day 8,200 lbs/day (dry weather) or 38,000 lbs/day (wet weather) discharge permit requirement. Tables 4.5 and 4.6 provide the results of the evaluation.
On a dry weather basis, the filters would need to be expanded sometime between 2030 and 2035. During this time, the facility would potentially violate the max day effluent TSS requirement unless the filtration system is upgraded.
During wet weather flows above 165 mgd, primary effluent flow is diverted around secondary treatment to the high rate disinfection facility and then re-blended with disinfected secondary effluent before being discharged. This flow would have a higher TSS content (est. 81 mg/L) than the secondary effluent flow (est. 10 mg/L) which, therefore, would contribute significantly to the daily effluent TSS discharge. Based on the evaluation, at flows above 192 mgd (165 mgd through secondary treatment, 11 mgd through filters and 27 mgd diverted around secondary treatment) more filtration capacity would be required to meet the daily maximum TSS limit. However, upgrading the filtration capacity has its limitations due to the primary effluent being diverted around secondary treatment during these infrequent peak flow events. Filtering 100% of the secondary effluent flow would only allow flows to reach 206 mgd before the maximum daily TSS limit is again reached. Even if all of the secondary effluent TSS is removed (i.e. 0 mg/L in the filtered final effluent), the facility would only treat up to approximately 220 mgd where the TSS from the diverted primary effluent is enough to violate the maximum daily limit. It should be noted that the upper limit maximum day (flow beyond the 99.9% confidence interval) is 250 mgd. This implies that there is a risk that the wet weather limitation may already be exceeded regardless of filtration capacity. However, it is also important to note that under the current NPDES permit, the daily mass limit requirement is waived when plant flow exceeds twice the average dry weather design flow of 49 mgd (or 98 mgd). Accordingly, this provision of the current permit removes the high-flow related risk associated with potential violation of the daily mass limit.

74
Table 4.5: Filtration Capacity Assessment Simulated Results - 2035 Dry Weather Maximum Day
Parameter Units Value Reference/Comment
Total Plant Influent Flow mgd 75.4
Secondary Effluent Flow mgd 75.4
Secondary Effluent TSS mg/L 15 9,436 lbs/day of TSS
Flow to Filtration mgd 11.0
Filtered Effluent TSS mg/L 5 551 lbs/day of TSS
Flow bypassed by Filters mgd 64.4
Bypassed Effluent TSS mg/L 15 8,059 lbs/day of TSS
Estimated Final Effluent TSS mg/L 10 8,609 lbs/day of TSS (Limit = 8,200 lbs/day)
Table 4.6: Filtration Capacity Assessment Simulated Results - 2035 Wet Weather Maximum Day
Parameter Units Value Reference/Comment
Total Plant Influent Flow mgd 192
Secondary Effluent Flow mgd 165
Secondary Effluent TSS mg/L 15 20,642 lbs/day of TSS
Bypassed Primary Effluent Flow
mgd 27
Bypassed Primary Effluent TSS
mg/L 81 18,240 lbs/day of TSS
Flow to Filtration mgd 11.0
Filtered Effluent TSS mg/L 5 688 lbs/day of TSS
Flow bypassed by Filters mgd 154
Bypassed Effluent TSS mg/L 15 19,837 lbs/day of TSS
Estimated Final Effluent TSS mg/L 23 36,726 lbs/day of TSS (Limit = 38,000 lbs/day)

75
4.3 Anaerobic Digestion
The 2004 MWMC Facilities Plan recommended that the following upgrades be implemented during the 20-year planning cycle (through the year 2025):
• Digester mixing: Replace the existing digester gas mixing system with a new digester mixing system as a near-term (0–5 years) project. The new mixing system needs to consider the existing struvite problem and should be designed accordingly.
• Primary sludge thickening: Increase the primary clarifier treatment capacity by installing baffling improvements, new primary sludge pumps, new gravity thickening equipment, and a primary sludge pump station.
• Anaerobic digester capacity would be exceeded within 10 years (2014-15).
The gas mixing in the existing three digesters has been replaced with external draft tubes. The gravity thickener for external primary sludge thickening was recently brought online.
A follow-up evaluation of digester capacity in 2007 concluded that a fourth digester would not be needed on-line until 2024 if all units are in service during peak solids production, which can be potentially managed by scheduling of digester cleaning during low solids production periods. If firm capacity is required on a year-round basis, then a fourth tank is already needed (required to be on-line by 2005). Several actions, however, could be undertaken to extend this timeframe. The 2007 analysis (Draft Technical Memorandum prepared by CH2M HILL in 2007) also concluded that more accurate solids stream flows and percent solids concentrations would be needed to confirm these conclusions. The 2007 analysis is provided in Appendix J.
The purpose of this analysis is to determine the capacity of existing digesters and determine when additional digestion capacity needs to be placed on line considering the improvements to digester mixing and primary sludge thickening. Two digester influent loading scenarios were considered:
• Without supplemental FOG receiving
• With supplemental FOG receiving
This evaluation of digester capacity considered the following issues:
• For the redundancy condition (when one of the three digesters if off line due to equipment failure and/or due to schedule maintenance cleaning), utilization of volatile solids reduction treatment provided by the FSLs will be evaluated
• The digester solids balance will be updated (if applicable) accounting for:

76
o Updated information primary sludge flow measurement
o Updated waste activated sludge (WAS) sludge yield after aeration basin modifications were brought on-line
A FOG market study was conducted by the MWMC to gauge the amount of FOG that could potentially be collected and injected directly into the anaerobic digesters. The quantities and characteristics for the FOG loading are shown in Tables 4.7 through 4.9.
Table 4.7: Theoretical FOG Total Solids Production in MWMC Service Area
Statistic FOG Total Solids Loading (lb. TS/day) Springfield (1) Eugene (2) Total
Minimum 908 4,542 5,450 Maximum 1,847 8,835 10,682 Median 1,269 9,454 10,723 Average 1,334 9,367 10,701
(1) Per Springfield pretreatment staff, 100% of the listed Food Service Establishments (FSEs) in Springfield have grease removal devices
(2) Eugene staff estimate that 75% of the listed FSEs in Eugene have grease removal devices. For this analysis, it is assumed that Eugene achieves grease removal devices on 100% of FSE in the future as part FOG program goal
Table 4.8: Theoretical FOG Total Volatile Solids Production in MWMC Service Area
Statistic FOG VS Loading (lb. VS/day) (1)
Springfield Eugene Total Minimum 881 4,406 5,286 Maximum 1,791 10,008 11,799 Median 1,231 6,345 7,576 Average 1,294 6,762 8,056
(1) Assumes VS at 97% of TSS per Clean Water Services Brown Grease Supply Study Table 4.9: Theoretical FOG Volume in MWMC Service Area
Statistic FOG Volume (gpd) (1) Springfield (2) Eugene (3) Total
Minimum 2,178 10,892 13,069 Maximum 4,428 24,741 29,170 Median 3,043 15,688 18,731 Average 3,199 16,718 19,917
(1) Assumes delivered grease/water mixture TSS content = 5%.

77
Based on the information in Tables 4.7 through 4.9, the following FOG characteristics shown in Table 4.10 were used in the process modeling. Values for Total Kjeldahl Nitrogen (TKN), NH3, and Phosphorus were estimated from literature and previous experience.
Table 4.10: FOG Evaluation Characteristics
Parameter Units Value Reference/Comment
Flow gpd 19,917
Total Suspended Solids %TSS 5%
Total Volatile Solids % of TSS 97%
COD mg/L 150,000 Estimated to achieve 24 standard cubic feet (scf) gas production/lb. VS destroyed for FOG as estimated in the Gresham FOG Feasibility Study (CH2MHILL, 2009)
TKN mg/L 5,400 Typical a
NH3 mg/L 340 Assumed 6.3% NH3:TKN ratio based on previous experience (Green Bay MSD)
TP mg/L 670 Typical a
Alkalinity mg/L 250 Assumed.
Notes: a INTRODUCING FOG TO SLUDGE - A STICKY PROPOSITION (Johnson et al, WEFTEC 2010)
The anaerobic digestion system was evaluated based on either maintaining an SRT greater than 15 days or loading the digesters less than a volatile solids loading rate (VSLR) of 0.15 lbs/ft3-day. For redundancy considerations, a digester was considered offline during dry weather maximum month conditions. During wet weather or (dry/wet) peak solids production, all digesters were considered online. Results from the capacity evaluation without the addition of FOG are presented in Tables 4.11 and 4.12 while Tables 4.13 and 4.14 include FOG addition.

78
Table 4.11: Anaerobic Digestion Capacity Simulated Results (w/o FOG) - 2015 Dry Weather Maximum Month
Parameter Units Value Reference/Comment
TPS Generation mgd lbs/day
0.089 33,404
4.5% TS
TWAS Generation mgd lbs/day
0.053 15,731
3.58% TS
Total Sludge to Digestion mgd lbs/day
0.142 49,134
4.16% TS
Digester SRT Days 15.66
Digester VSLR lbs/ft3-day 0.132
Estimated Volatile Solids Reduction
% 53%
Estimated Biogas production ft3/day 244,766
Table 4.12: Anaerobic Digestion Capacity Simulated Results (w/o FOG) - 2015 Wet Weather Maximum Month
Parameter Units Value Reference/Comment
TPS Generation mgd lbs/day
0.136 50,939
4.5% TS
TWAS Generation mgd lbs/day
0.086 25,957
3.58% TS
Total Sludge to Digestion mgd lbs/day
0.222 76,896
4.14% TS
Digester SRT Days 14.9 Limiting (<15 days)
Digester VSLR lbs/ft3-day 0.133
Estimated Volatile Solis Reduction
% 55%
Estimated Biogas production ft3/day 351,414

79
The anaerobic digestion system will need to be upgraded by 2015, based on the 15-day SRT limitation during wet weather with all digesters online. If the facultative lagoons are included in the SRT, then the upgrade could be delayed until 2020 when the digesters reach the volatile solids loading limit of 0.15 lbs/ft3-day. Alternatively, if the thickened waste activated sludge (TWAS) was thickened to 5%TS, then the upgrade could be delayed until 2020 hitting the same VSLR limitation as shown in Figure 4.1.
Figure 4.1 – TWAS Thickness and Digester Upgrade Requirement
The addition of FOG significantly reduces the capacity of the digesters as shown in Table 9. The fourth digester is required by 2015 regardless of the season due to the VSLR. Increasing the TWAS concentration to 5% TSS aids in SRT, but not the VSLR.
2010
2015
2020
2025
2030
2035
3 3.5 4 4.5 5 5.5 6
Year
whe
n Di
gest
er #
4 is
Nee
ded
TWAS Thickness (%TS)
Affect of TWAS Thickness(1 Digester Offline)
dry weather wet weather

80
Table 4.13: Anaerobic Digestion Capacity Simulated Results (w/FOG) - 2015 Dry Weather Maximum Month
Parameter Units Value Reference/Comment
TPS Generation mgd lbs/day
0.089 33,475
4.5% TS
TWAS Generation mgd lbs/day
0.052 15,536
3.58% TS
FOG Addition mgd lbs/day
0.020 8,306
5.0% TS
Total Sludge to Digestion mgd lbs/day
0.161 57,317
4.26% TS
Digester SRT Days 13.77 Limiting (<15 days)
Digester VSLR lbs/ft3-day 0.160 Limiting (0.15 lbs/ft3-day)
Estimated Volatile Solis Reduction
% 47%
Estimated Biogas production ft3/day 418,276
Table 4.14: Anaerobic Digestion Capacity Simulated Results (w/FOG) - 2015 Wet Weather Maximum Month
Parameter Units Value Reference/Comment
TPS Generation mgd lbs/day
0.136 51,012
4.5% TS
TWAS Generation mgd lbs/day
0.086 25,625
3.58% TS
FOG Addition mgd lbs/day
0.020 8,306
5.0% TS
Total Sludge to Digestion mgd lbs/day
0.241 84,942
4.21% TS
Digester SRT Days 13.8 Limiting (<15 days)
Digester VSLR lbs/ft3-day 0.151 Limiting (0.15 lbs/ft3-day)
Estimated Volatile Solis Reduction % 51%
Estimated Biogas production ft3/day 525,084

81
Alternatively, the FOG addition could be reduced until the fourth digester comes online. This would significantly aid the dry weather condition loadings, but has very little benefit during wet weather conditions as illustrated in Figure 4.2.
Figure 4.2 – FOG Addition and Digester Upgrade Requirement
4.4 Glenwood Pump Station
Upgrades to the Glenwood Pump Station were included on the 2004 20-year capital project list. Therefore, an assessment was performed to estimate the timing of the project given the most recent available planning information. The analysis of Glenwood Pump Station presented herein follows the following methodology:
1. Review of the pump station background to determine trigger flow for next pump installation
2. Estimation of the current peak wet weather flows
a. Use available dry-month weekly pump station run time data to estimate current average daily base flows
b. Apply locally derived empirical equation for estimation of daily peak design flow
c. Estimate rainfall derived inflow and infiltration (RDII) flows using:
2010
2015
2020
2025
2030
2035
0 2,500 5,000 7,500 10,000 12,500 15,000 17,500 20,000
Year
whe
n Di
gest
er #
4 is
Nee
ded
FOG Quantity Accepted (GPD)
Affect of FOG Addition(TWAS @ 5% TS, 1 digester offline - dry)
dry weather wet weather

82
i. current developed area estimates, and
ii. Estimated RDII flow-per-acre values developed in Appendix B using the SSOAP Toolbox model for existing City of Springfield and Laurel Hill development
3. Estimation of the 20-year planning horizon (20327) peak wet weather flows
a. Determine appropriate development designations and associated planning wastewater flow values
b. Calculate projected buildout wastewater base flows
c. Apply locally derived empirical equation for estimation of daily peak design flow
d. Apply RDII flow-per-acre value for new development to buildout condition to estimate peak wet weather RDII flow
e. Estimate 20-year development as percent of buildout, adjust buildout-based flow projection accordingly
4. Given trigger flow for next pump installation, current flow, and projected 20-year future flow, use linear interpolation to estimate the year that next pump will need to be added
4.4.2 Review of Pump Station Background
The Glenwood Pump Station was constructed in 1995 with the expectation that it would receive the flows shown in Table 4.15. Of the sub-basins listed in Table 4.15, the largest flow was estimated to come from the Lane Community College (LLC) sub-basin. However, since the LLC sub-basin flow is outside of the current Urban Growth Boundary (UGB) it is not expected to materialize under the current plan.
7 Because a substantial amount of planning information for the analysis presented in this section was obtained from the 2012 Glenwood Refinement Plan, the 20-year planning horizon for this analysis was pegged to the year 2012 with the 20-year horizon being 2032.

83
Table 4.15 – 1995 Sub-basin Design Flows
Sub-basin Estimated Peak Daily Flow (mgd)
Lane Community College 4.08
East Glenwood Area 1.4
South Glenwood Area 1.42
West Glenwood Area 3.45
Laurel Hill Area 2.45
Total 12.8 (1) Source: City of Eugene, Glenwood Pump Station and Sanitary Sewer Predesign Report, Kramer, Chin &
Mayo, Inc., March 1993
The pump station was designed with bays for four vertical centrifugal non-clog pumps. At the time of construction in 1995, two of the four pumps were installed with the expectation that the remaining two bays would allow for later expandability. The two Ingersoll-Dresser pumps installed are variable frequency drive pumps with 40 horsepower motors. Each pump has a design capacity of 3500 gallons per minute (gpm) at 30 feet of head operating at a maximum pump speed of 705 rpm.
At the same time the pump station was constructed, two force mains were installed under the Willamette River to convey pumped wastewater from the Glenwood Pump Station to the East Bank Interceptor located on the opposite side of the river. The smaller of the two force mains has an ID of 12.14-inches and the larger force main an ID of 20.81-inches. The design planned to utilize the smaller of the two force mains in a fill and draw scheme until average influent rate reaches approximately 700 gpm (about 1 MGD). This scheme would allow each of the two pumps to work in an alternating lead/backup operation at low speed (400 rpm). When the influent rate exceeds 700 gpm, the design planned for the pumps to operate as variable speed pumps to keep pace with the incoming flow and minimize wear and starts per hour.
The pump station designer anticipated addition of the third and fourth pumps once the pump station peak wet weather influent flow reached 4.5 mgd. Therefore, this analysis assumes 4.5 mgd as a trigger peak wet weather flow for expansion of the Glenwood Pump Station. Per state and local pump station design standards, sewage pump stations must be designed with a firm capacity (pump station capacity with the largest pump out of service) to pump the peak hourly and peak instantaneous flows associated with the 5-year, 24-hour storm intensity of its tributary area, without overflows from the station or its collection system.

84
4.4.3 Estimation of Current Peak Wet Weather Flows
Estimation of the current peak wet weather flows involves the following steps:
1. Estimation of the current peak base flows 2. Estimation of the current peak RDII flows 3. Calculation of the current peak wet weather flows
4.4.3.1 Estimate of Current Peak Base Flows
RWP staff received weekly pump run time data for the years 2005 through 2010 from Eugene Wastewater Division maintenance staff. RWP staff performed an estimation of current base flow by analyzing the summer (July through September) run times when it is expected that I&I contributions are minimal and can be ignored. The weekly run times were converted to approximate weekly flows by assuming one pump operating at full capacity (3,500 gpm @ 30 feet of total dynamic head) when the pump was running. These weekly values were then converted to daily values by dividing by seven. The average across the five years of data was then taken to arrive at an average daily base flow of 168,000 gpd. The base flow was peaked using the formula found in City of Springfield Sanitary Sewers and Pump Section8. The result, 507,000 gpd, represents the estimated current combined peak base flows conveyed to the Glenwood Pump station from both the Glenwood and Laurel Hills areas.
4.4.3.2 Estimate of Current Peak Wet Weather RDII
To estimate peak RDII flows for Glenwood and Laurel Hills at their current level of development, RWP staff referred to the Peak 5-Yr Flow Analysis, Distribution and I/I Reduction Guidelines, Technical Memorandum developed by CH2M HILL (see Appendix B). This analysis applied the 5-year design storm—defined through prior analyses—to the RTK wet weather flow response parameters developed using the Sanitary Sewer Overflow Analysis and Planning (SSOAP) Toolbox software9. For the Laurel Hills area, flow meter data were available and,
8 The method for estimation of peak flow factors is discussed in Section 2.02.2.B of City of Springfield Sanitary Sewers and Pump Stations design standards. The formula for calculation of peaking factors is shown on page 2-5 as: Peaking Factor = 25-20.2(base flow in 1000 gal/day)0.0165
9 The RTK method is based on representing unit hydrographs by a set of triangular hydrographs, which can described by three parameters R, T and K. R is the fraction of runoff that show up as precipitation, T is the time
85
therefore, a sub-basin specific estimate of RDII flow based on the modeled 5-year, 24 hour wet weather storm event is available. The resulting value from the analysis for the Laurel Hill area is 4,900 gallons per acre per day (gpad). For the Glenwood area, a City of Springfield averaged value of 11,750 gallons per acre day (gpad) was applied. For the purpose of estimating current RDII, each contributing area (Glenwood and Laurel Hill) is discussed separately below.
Glenwood
Contributing developed areas in Glenwood were obtained from the City of Springfield Geographic Information System. The resulting active connected Glenwood areas are shown in Figure 4.3. Figure 4.3 shows a total of 75.3 acres of land with connections to the City’s wastewater collection system. From Appendix B, a Springfield-wide average RDII contribution of 11,750 gpad is obtained which, when multiplied by 75.3 acres, yields a Glenwood peak RDII contribution of 885,000 gpd.
to peak of the hydrograph and K is the ratio of the recession time to time to peak. The SSOAP toolbox is a suite of computer software tools used for the quantification of RDII and help capacity analysis and condition assessment of sanitary sewer systems. This toolbox includes EPA’s Storm Water Management Model Version 5 (SWMM5) for performing dynamic routing of flows through the sanitary sewer systems.

86
Figure 4.3 – Mapped areas associated with Glenwood Active Wastewater Connections

87
Laurel Hill
Contributing developed areas in the Laurel Hill basin were estimated by City of Eugene Planning Division staff. These estimates of existing developed land areas in the Laurel Hill area are listed in Table 4.16.
Table 4.16 – Estimated existing developed area in the Laurel Hill Basin
Zoning Designation Area (acres)
Commercial 15
Medium Density Residential 0
Low Density Residential 326
Total 341
Table 4.16 shows a total of 341 acres of land that are currently provided wastewater service. From Appendix B (meter # 5267), the RDII contribution of Laurel Hill is 4,900 gpad is obtained which, when multiplied by 341 acres, yields a Laurel Hill peak RDII contribution of 1,671,000 gpd.
4.4.3.3 Calculation of Current Peak Wet Weather Flow
The peak wet weather flow is the sum of the peak base flow and the peak RDII flow. The estimated current peak base flow is 507,000 gpd, as described above. The calculated combined peak RDII flow is the sum of the Glenwood and Laurel Hill peak RDII flows, which is 885,000 gpd + 1,671,000 gpd = 2,556,000. Therefore the calculated current peak wet weather flow is 507,000 gpd + 2,556,000 gpd = 3,063,000 gpd.
4.4.4 Estimation of the 2032 Peak Wet Weather Flows
Estimation of the 2032 peak wet weather flows involves the following steps:
1. Determination of planned development in both Glenwood and Laurel Hill basins 2. Estimation of buildout peak base flows

88
3. Estimation of 2032 RDII and peak wet weather flows
4.4.4.1 Planned Development and Peak Buildout Flow Estimation
The City of Springfield has revised development planning for the Glenwood area. Accordingly, City planners have produced a Refinement Plan and proposed revised zoning designations. At the time of the PFPU this refinement plan is in the process of being adopted. The redevelopment of the Glenwood Area and associated wastewater services will be supported through the Glenwood Pump Station.
The redevelopment of Glenwood is broken into two different development areas: Franklin Riverfront and McVay Riverfront. These development areas are further subdivided per proposed zoning designations. Figure 4.4 shows the proposed zoning for the Glenwood area.
Figure 4.4 – Glenwood Area Proposed Zoning
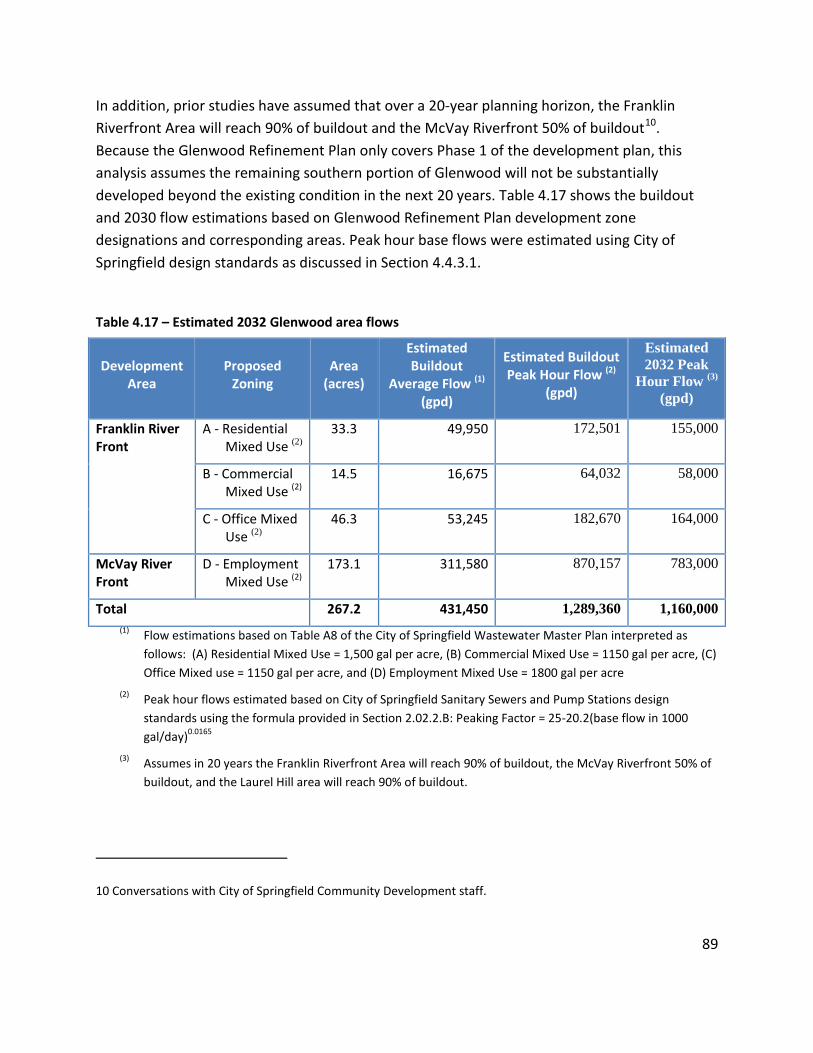
89
In addition, prior studies have assumed that over a 20-year planning horizon, the Franklin Riverfront Area will reach 90% of buildout and the McVay Riverfront 50% of buildout10. Because the Glenwood Refinement Plan only covers Phase 1 of the development plan, this analysis assumes the remaining southern portion of Glenwood will not be substantially developed beyond the existing condition in the next 20 years. Table 4.17 shows the buildout and 2030 flow estimations based on Glenwood Refinement Plan development zone designations and corresponding areas. Peak hour base flows were estimated using City of Springfield design standards as discussed in Section 4.4.3.1.
Table 4.17 – Estimated 2032 Glenwood area flows
Development Area
Proposed Zoning
Area (acres)
Estimated Buildout
Average Flow (1) (gpd)
Estimated Buildout Peak Hour Flow (2)
(gpd)
Estimated 2032 Peak
Hour Flow (3) (gpd)
Franklin River Front
A - Residential Mixed Use (2)
33.3 49,950 172,501 155,000
B - Commercial Mixed Use (2)
14.5 16,675 64,032 58,000
C - Office Mixed Use (2)
46.3 53,245 182,670 164,000
McVay River Front
D - Employment Mixed Use (2)
173.1 311,580 870,157 783,000
Total 267.2 431,450 1,289,360 1,160,000 (1) Flow estimations based on Table A8 of the City of Springfield Wastewater Master Plan interpreted as
follows: (A) Residential Mixed Use = 1,500 gal per acre, (B) Commercial Mixed Use = 1150 gal per acre, (C) Office Mixed use = 1150 gal per acre, and (D) Employment Mixed Use = 1800 gal per acre
(2) Peak hour flows estimated based on City of Springfield Sanitary Sewers and Pump Stations design standards using the formula provided in Section 2.02.2.B: Peaking Factor = 25-20.2(base flow in 1000 gal/day)0.0165
(3) Assumes in 20 years the Franklin Riverfront Area will reach 90% of buildout, the McVay Riverfront 50% of buildout, and the Laurel Hill area will reach 90% of buildout.
10 Conversations with City of Springfield Community Development staff.

90
In addition to the river front Glenwood area flows, the Glenwood Pump station receives flows from non-river-front area of Glenwood and the Laurel Hill area of Eugene. The non-river-front area flows are dominated by a handful of industrial/commercial dischargers. Development in this area will be considered in Phase 2 of the Glenwood Refinement Plan. However, the timing for that area is considered beyond the 20-year planning horizon of this study.
The City of Eugene is working on updating development plans for the Laurel Hill area. For the purpose of this study, City of Eugene Panning and Engineering staff has provided the current development planning information for buildout flow estimation purposes. Table 4.18 shows the Laurel Hill area development zone designations, corresponding acreages, and corresponding estimated buildout base and peak flows. Peak hour base flows were estimated using the same equation applied to the Glenwood base flows and described in Section 4.4.3.1. For the purposes of this analysis, it is assumed that the Laurel Hills area would reach 90% of buildout over the next 20 years.
Table 4.18 – Laurel Hill Development Zone Designations
Zoning Area (acres)
Estimated Buildout
Average Flow 1 (gpd)
Estimated Buildout
Peak Hour Flow 2 (gpd)
Estimated 2032 Peak Hour Flow
(gpd)
Commercial 30 60,000 203,292 183,000
Low Density Residential
652 619,400 1,572,983 1,416,000
Medium Density Residential
7 14,184 55,267 50,000
Parks 104 0 0 0
Total 793 693,584 1,831,542 1,649,000
4.4.4.2 Estimated Buildout RDII Flow
To estimate peak wet weather flows for the two areas (Glenwood and Laurel Hills) RWP staff applied different unit values for existing and future development. For existing development, the RDII values for existing development provided in Section 4.4.3.2 (11,750 gpad and 4,900 gpad for Glenwood and Laurel Hill, respectively) were used. However, for future new

91
development in both Laurel Hill and Glenwood areas, an RDII value of 2,000 gpad11 was used. This lower value better represents new construction. The resulting estimated 2032 RDII flows are presented in Table 4.19.
Table 4.19 - 2032 Projected RDII Flow Contributions
Sub-basin Estimated Developed Acres Estimated 2032 RDII Current (2012) 20-Year (2032)
Glenwood River Front 6.23 84.69 243,000 McVay River Front 5.13 86.55 233,000 Glenwood Southern (1) 63.31 63.31 871,000 Laurel Hill Commercial 15 27 128,000 Laurel Hill LDR 326 586.8 2,771,000 Laurel Hill MDR 0 6.3 13,000 Total 416 1020 4,259,000
4.4.4.3 Projected 20-year Peak Flows
The projected 20-year planning wet weather peak flow is calculated by adding the 20-year peak hour flows (presented in Tables 4.17 and 4.18) to the estimated 2032 RDII flows presented in Table 4.19. The resulting estimated wet weather peak 20-year flow is 1,160,000 gpd + 1,649,000 gpd + 4,259,000 gpd = 7,068,000 gpd.
4.4.4.4 Estimated Timing for Addition of Third Pump at the Glenwood Pump Station
Given the trigger design peak flow of 4,500,000 gpd, linear interpolation between the estimated current, and projected 20-year peak wet weather flows was used to estimate the time when the third pump would need to be installed and operational. Figure 4.5 illustrates the resulting linear interpolation.
11 An RDII estimate of 2,000 gpad for future development was used in the MWMC Wet Weather Flow Management Plan and is referenced in Appendix B, page 1.

92
Figure 4.5 – Linear interpolation of trigger flow value for timing of Glenwood Pump Station expansion
As shown in Figure 4.5, the linear interpolation method yields the year 2019 as the time when the third pump would be needed to be operational.
4.5 Waste Activated Sludge (WAS) Thickening
The existing WAS Thickening facility at the WPCF consists of two 3-meter gravity belt thickeners (GBTs), chemical addition equipment, WAS feed pumps, Thickened WAS (TWAS) pumps, filtration rinse water supply and drain piping, and building structure. The 2004 MWMC Facilities Plan recommended addition of a third GBT and associated equipment. Table 4.18 shows the design criteria for the GBTs along with the upgrades recommended in 2004.The timing for this project was estimated in 2004 for implementation in FY 2005-06. However, since 2004 RWP each year staff have opted to delay the project based on annual CIP needs assessment and resource prioritization decision making.
Table 4.18 – Existing and 2004 Proposed WAS Thickening Design Criteria

93
Unit Process Criteria/Existing Condition 2004 Planned Upgrade GBTs
Number of Units 2 3 Size 3 meters 3 meters Solids Loading Rate each/total
2010 lbs per hour / 4020 lbs per hour
2010 lbs per hour / 6030 lbs per hour
Hydraulic Loading Rate, each/total
720 gpm / 1440 gpm 720 gpm / 2160 gpm
Thickened WAS Concentration
4% dry solids 4% dry solids
Capture Efficiency 95% 95% WAS Pumps
Number of Units 2 3 Capacity, each/total 800 gpm / 1600 gpm 800 gpm / 2400 gpm Type Screw Centrifugal Screw Centrifugal Drive AFD AFD Horsepower, each 15 15
TWAS Pumps Number of Units 2 3 Capacity, each/total 120 gpm / 240 gpm 120 gpm / 360 gpm Type Progressing Cavity Progressing Cavity Drive AFD AFD Horsepower, each 20 20
Factors considered by staff include historical analysis of secondary treatment sludge yield and design standards need. Design standards for WAS facilities do not include redundancy requirements. The existing GBTs are sized such that only one GBT is needed to thicken all of the WAS produced in the secondary treatment process at the WPCF. This is demonstrated in Figures 4.6 and 4.7 which show time series plots of GBT hydraulic loading and solids loading from 1998 to 2014. The hydraulic loading rate is well below the capacity of one GBT and the solids loading rate is sufficiently below the solids loading capacity of one GBT. Moreover, sludge yield does not appear to be increasing over time. A possible explanation why net WAS production does not appear to correlate with population growth is that industrial organic loading, in particular as resulting from food processing methods and source control efforts, could be decreasing over time. Additionally, the home composting movement may also contribute to the flat trend of secondary sludge yield over time.

94
Figure 4.6 – Time Series of Hydraulic Loading Rate to the GBTs (1998 – 2014)
Figure 4.7 – Time Series of Solids Loading Rate to the GBTs (1998 – 2014)

95
4.6 Conclusions
Of the wastewater treatment unit processes modeled by CH2M HILL, only the digesters are in need of an upgrade in the next several years to meet the projected flows and loadings assuming a TWAS concentration of 3.58 %. Increasing the TWAS thickness to 5% allows for the upgrade to be pushed back several more years. The addition of FOG (100% of the average potential) would make the digester upgrade more imperative as even with a thicker WAS; the digesters would be limited in capacity for 2015 dry and wet weather scenarios. If only 35% of the theoretical FOG in the service area is received, then the addition of the fourth digester can be delayed by roughly a year to 2016 in wet weather or 2021 in dry weather conditions. However, since the MWMC is not contemplating the immediate implementation of a comprehensive FOG program with construction of a dedicated FOG receiving system, FOG is evaluated here only to provide a preliminary basis for planning in the event that the MWMC decides to pursue such a FOG program in the coming years.
The process model analysis of the secondary treatment process suggests that the aeration basins will need to be upgraded next as mixed liquor solids’ loading onto the secondary clarifiers is reached by 2025. However, considering this analysis was based on the current permit limits which could change in the upcoming renewed permit and that the MWMC plans to implement a Comprehensive Facilities Plan Update in FY 16-17, RWP staff recommends a moderate extension of the project implementation schedule to FY 18-19. At that time or when new information becomes available, the need and timing of the project can be revisited.
The process model analysis suggests that the filtration system will need to be expanded before the 2030 to 2035 timeframe as the maximum daily allowable solids discharge limitation for wet weather conditions is reached. However, it should be noted that September 2013 (dry weather) was one of the wettest on record which saw the facility nearly exceed its permitted dry weather TSS mass limit. Therefore, it could be prudent to expand the filtration capacity earlier. Also similar to the aeration basins, the same considerations apply. For these reasons RWP staff recommends a moderate extension of the project implementation schedule to FY 19-20. At that time or when new information becomes available, the need and timing of the project can be revisited.
The analysis of the Glenwood Pump Station presented in this section indicates that the third pump will be needed by the year 2019 to meet the potential peak wet weather capacity requirement of 4.5 mgd. Per Eugene Wastewater Division staff, the existing variable frequency drives are slated to be replaced in 2015. They also report that the existing pumps are oversized for the current typical flows to the pump station and for this reason; the pumps are currently

96
set to operate at close to constant speed to avoid low speed plugging. Accordingly, it has been suggested that when the time comes to add the third and fourth pump, or potentially sooner, a smaller jockey pump be added for to more effectively operate during the typical and low flow conditions experienced at the pump station.
Analysis of the WAS Thickening facilities indicates that the capacity of the existing facilities is adequate to meet loading requirements into the foreseeable future. The analysis found no discernable increase in WAS yield over the period 1998 to 2014. The data indicate, and operations staff verify, that only one GBT is needed to manage thickening of the WAS produced in the secondary treatment system so the current facility has 100% redundancy even though this is not required under design standards.

97
5. THERMAL LOAD MITIGATION STRATEGY
Since the implementation of the 2004 Facilities Plan, the MWMC’s efforts to reduce thermal load on the Willamette River contributed from effluent discharge have largely involved planning for future, projected compliance requirements. As of 2014, the MWMC continues to be regulated under the same administratively-extended NPDES permit that was in place at the time of the 2004 Facilities Plan (2002 permit; refer to Section 2 for regulatory discussion). Since 2004, the MWMC has anticipated more restrictive thermal load limits under the next NPDES permit. This section outlines the evolving thermal load mitigation strategies from 2004 to 2014 which are explained below in terms of the following planning phases:
• Pre-TMDL Planning (2004-2006) • 2006 TMDL Planning and Legal Settlement Agreement (2006 – 2011) • Post TMDL Planning (2011 – 2014)
5.1 Pre-TMDL Planning, 2004-2006
The 2004 Facilities Plan recommended phased implementation of recycled water uses, which would total approximately 10 mgd of reuse. Effluent reduction of nearly 10 mgd in year 2005 was calculated and projected to increase to 25 mgd by year 2025 (2004 MWMC Facilities Plan, Volume 2, Technical Memorandum No. 12). The 2004 Facilities Plan analysis was based on the methods specified in the 1996 temperature standard as later modified as described in 2004 MWMC Facilities Plan, Volume 2, Technical Memorandum No. 12, which indicated that the maximum weekly design flow (rather than the average dry weather design flow) should be used to calculate excess temperature load as a worse case consideration. The 10 mgd of reuse was acknowledged as a partial mitigation for the full 2025 estimated excess thermal load and that other strategies would be necessary. Buildout conditions were based on estimates of population growth and increased wastewater flows of 17% by 2025 (the actual population growth and rate of water use has not increased as projected in 2004). The recommended reuse strategy was:
• Biocycle Farm irrigation (1.5 mgd) • BRS irrigation (1 mgd) • Class A greenspace irrigation (7.5 mgd)

98
The 2004 MWMC Facilities Plan presented a screening of thermal load mitigation strategies (2004 MWMC Facilities Plan, Volume 2, Technical Memorandum No. 14) and noted other strategies could potentially be viable pending ongoing study and verification.
Potential thermal load mitigation strategies needing further study were:
• Effluent trading (shared load among dischargers) • Riparian shading (watershed-based water quality trading) • Indirect discharge (effluent cooling via the hyporheic zone)
The 2004 MWMC Facilities Plan also noted the concurrent adoption of the 2004 Oregon temperature standards, which superseded the 1996 standards, would be used in development of a Willamette Basin TMDL for temperature. In developing the 2004 temperature standard, DEQ incorporated elements of EPA’s Final Water Temperature Guidance issued in April 2003. Given the guidance, the 2004 MWMC Facilities Plan anticipated stricter temperature requirements than those of the 1996 standard. The compliance strategy envisioned in the 2004 MWMC Facilities Plan was comprised of a series of recycled water projects that were listed and scheduled in the 2004 20-year CIP. In the 2004 MWMC Facilities Plan, the project list is broken up into implementation phases (Phases 1 through 13). Table 5.1 lists these recycled water projects from the 2004 20-year CIP and associated phasing and budget cost estimates.

Table 5.1 – Summary of Recycled Water Project’s Envisioned in the 2004 MWMC Facilities Plan
99
Project Description (1) 2004 CIP Phase (2)
Budget Year
Estimated Budget Cost 2004 Est. (3) (2004 dollars)
2006 Est. (4) (2006 dollars)
Level II Reuse at Seasonal Industrial Waste site (later renamed the Beneficial Reuse Site or BRS):
• Provide 1.25 mgd of Level II reuse water at the BRS
3 2006/07 400,000 460,000
Level IV Reuse Demonstration Project: • Provide 0.5-1.0 mgd of Level IV reuse, • Install movable filter, coagulation system, UV, piping and distribution system • Site TBD
3 2006/07 2,100,000 2,412,000
Level II Reuse at the Biocycle Farm: • Provide 1.5 mgd of Level II reuse. • Install dedicated reuse irrigation pipeline and microspray system. • Total reuse of 3.75 mgd for July-August irrigation
6 2009/10 3,600,000 4,135,000
Permanent Level IV Reuse: • Provide 2.5 mgd for permanent Level IV reuse to local greenspaces and
community areas • Modify/install UV system capable of 3 mgd and modify/install piping system
installed in demonstration project • Total reuse of 5.25 mgd
9 2012/13 4,100,000 4,709,000
Full Scale Level IV Reuse: • Provide 2.5-5 mgd for permanent Level IV reuse • Increase pumping capacity, reuse pipeline, and UV system • Total reuse of 7.75-10.25 mgd
11 2015/16 9,800,000 11,257,000
(1) The 2004 MWMC Facilities Plan referenced recycled water use designations identified in OAR 340, Division 55. However, these rules were revised in 2009. Under the 2009 revision (i.e., the current rule), Level II recycled water was reclassified as Class C recycled water, and Level IV recycled water was reclassified as Class A recycled water.
(2) The 2004 MWMC Facilities Plan identified 13 phases of CIP projects for “just in time” project delivery. These phases are described in Volume 1, Chapter 7 of the 2004 MWMC Facilities Plan.
(3) The 2004 MWMC Facilities Plan provided project concepts and budget level cost estimates in 2004 dollars. (4) CH2M HILL refined the Facilities Plan project cost estimates in 2006. The refined cost estimates were escalated to 2006 dollars..

100
5.2 2006 TMDL Planning and Legal Settlement Agreement, 2006 – 2011
5.2.1 2006 Willamette Temperature TMDL
DEQ issued the Willamette Basin TMDL in September 2006; the TMDL was subsequently approved by the EPA that same month. The TMDL allocated maximum waste loads to point and non-point sources throughout the basin, based on points of maximum impact (maximum cumulative thermal effects) in the Willamette River. For the MWMC and other upper Willamette sources, the point of maximum impact is near Albany upstream of the Santiam River confluence, which provides significant flows of cooler water to reduce the mainstem Willamette temperature downstream. The 2006 TMDL presented the MWMC with a risk period in late October during the onset of cooler water salmon spawning criteria of 13C (as opposed to the previously identified summertime risk period based on maximum dry weather condition and effluent temperature). Based on historical data, the MWMC would be required to mitigate for 93 MKcal/day (approximately equivalent to 3.11 mgd of reuse in late October). Based on Facilities Plan buildout conditions, the estimated need in 2025 was calculated to approach 10 mgd. These calculations were based on modeled scaling factors to estimate the thermal load impacts of the MWMC on the river.
To accommodate the implementation of the Facilities Plan’s recycled water strategy for thermal load mitigation, the MWMC adopted a CIP budget including four phases of effluent reuse. With the adoption of Oregon’s updated recycled water rules in 2008, effluent reuse was subsequently re-characterized as “recycled water use.“ The revised rules adopted the term “recycled water” in place of “reclaimed water” as preferred terminology. Subsequent to the rules revision, the DEQ issued the Implementing Oregon’s Recycled Water Use Rules IMD in June 2009.
The MWMC’s programmed CIP phases for recycled water were renamed as follows:
• Recycled Water Program Implementation – Phase 1
Phase 1 budget based on combining of the Level II Reuse at BRS and Level IV Reuse Demonstration projects
• Recycled Water Program Implementation – Phase 2
Phase 2 budget based on the Level II Reuse at the Biocycle Farm project
101
• Recycled Water Program Implementation – Phase 3
Phase 3 Budget based on the Permanent Level IV Reuse project
• Recycled Water Program Implementation – Phase 4
Phase 4 Budget based on the Full Scale Level IV Reuse project
In response to the 2006 TMDL’s October compliance need (which ruled out summer time recycled water irrigation as a standalone strategy) RWP staff evaluated a full complement of thermal load mitigation strategies for potential effectiveness. In 2008, after screening for cost-effectiveness, community benefit, and implementation timeline, staff determined three premier strategies remained most feasible for further planning and development. These strategies were recycled water use (including industrial uses and irrigation with off-season storage), riparian shade restoration, and indirect discharge. Figure 5.1 below depicts the range of thermal load mitigation alternatives considered for high-level assessment of practicality, and the resulting development of the three-phase recycled water planning study. Note the three phases of planning discussed here were all contained and funded within the Recycled Water Program Implementation – Phase 1 project.

102
Figure 5.1 – 2008 Post-TMDL Thermal Load Mitigation Alternatives
5.2.2 2009 Settlement Agreement
The MWMC filed a lawsuit against the DEQ challenging the TMDL based on the scaling factor used in the waste load calculation and other elements of the TMDL. The lawsuit was filed in March 2007 as a petition for judicial review of DEQ’s order approving the Willamette River temperature TMDL. From March through June 2007, three other entities also filed petitions for review: Northwest Pulp & Paper, City of Albany, and Weyerhaeuser Company (which transferred to International Paper Company).
In discussions leading up to the 2009 Settlement agreement, the MWMC proposed implementing 10 mgd of recycled water use as the primary strategy of thermal load mitigation. In October 2009, the MWMC entered into a Settlement Agreement with the DEQ. Pursuant to the Settlement Agreement, the DEQ issued an Implementation Order in December 2009. The Order governed how the TMDL’s waste load allocations would be implemented with the MWMC under a renewed NPDES discharge permit. In essence, the Settlement Agreement provided the MWMC “deemed compliance” for regulatory certainty during a period of thermal
Thermal Load Mitigation
Alternatives Screening (2008)
Influent Reduction
Process Reductions
Indirect Discharge
Effluent Diversion
Physical Cooling
Watershed Restoration
Stream Flow Augmentation
Water Quality Trading
Phase 1 screening
Phase 2 feasibility
Phase 3 strategy
Recycled Water
Riparian Shade
Indirect Discharge

103
load mitigation implementation from 2012-2017 so long as the MWMC implemented it’s recycled water program over the same time period, i.e., by the year 2017. The settlement agreement also stipulated that the DEQ would revise the TMDL by 2012 and prior to issuing the MWMC’s renewed permit. Interim compliance was to be accomplished through allocation of reserve thermal capacity within the TMDL to the MWMC. While the settlement agreement pointed toward a recycled water program, discussions with the DEQ, consultant experts, and various statewide stakeholders underscored that planning for a diverse portfolio of thermal load mitigation strategies as illustrated in Figure 5.1 would be the best way for the MWMC to ensure compliance under the new Temperature TMDL.
5.2.3 Thermal Load Mitigation Strategy Development
This section covers key thermal mitigation strategies the MWMC and RWP staff studied and planned in the 2006-2010 timeframe. The key strategies were:
• Recycled water program implementation planning • Riparian shade sponsorship projects • Indirect discharge at Confluence Island • Bubble permitting (shared waste load allocation)
5.2.3.1 Recycled Water Program Implementation Planning
Recycled Water Implementation Scoping, 2009-2010
Starting in 2009, the MWMC performed a scoping assessment of what strategies would be necessary to implement a successful and meaningful recycled water program. The study evaluated community outreach, site selection, and regulatory benefit issues. The study considered the following beneficial recycled water uses:
• Irrigation at the MWMC’s Biocycle Farm and BRS facilities • Greenway park irrigation • Industrial use at the Delta Sand & Gravel operation
The study intentionally did not evaluate other public and community uses due to the need for proper community outreach planning prior to exploring recycled water uses. The assessment resulted in the Recycled Water Program Planning Scoping Document in 2010, which was comprised of a series of technical memos produced by consultant Kennedy/Jenks.

104
The key recommendations of the scoping document were:
• Address Multiple Drivers. Consider social and environmental needs not directly affiliated with the primary regulatory drivers
• Engage the Public. Incorporate outreach and education in development of technical evaluations
• Address Near-Term and Future Regulatory Issues. Carefully monitor future evolving regulatory issues to adapt planning efforts while focusing on near-term regulatory needs
• Utilize the Networking Capacity of Regional Wastewater Staff. Ongoing staff discussions with local partners will address technical data gaps necessary for making informed decisions during alternatives selection
West Bank Trail Extension Recycled Water Pipelines
In 2010, the MWMC partnered with the City of Eugene to take advantage of cost and permitting efficiencies to install three, 16-inch-diameter recycled water pipelines beneath an extension of the West Bank Trail system. This project provided the MWMC with implementation-ready pipelines from the WPCF property, beneath the Beltline Highway, and to the Delta Sand & Gravel property. Installed tees allow the pipes to be extending across the Beltline bridge to the opposite side of the Willamette River as well. This infrastructure provides the MWMC program flexibility in future recycled water or indirect discharge opportunities downriver from the WPCF.
5.2.3.2 Riparian Shade Sponsorship Projects
CWSRF Sponsorship Option
Following the precedent set by Clean Water Services for riparian shade projects as an eligible part of its NPDES permit for thermal load compliance, the MWMC began exploring local partnership opportunities to partner in shade projects for water quality credit. Through the City of Eugene’s partnership, the Long Tom Watershed Council evaluated shade potential opportunities along the Long Tom River downstream from Fern Ridge Reservoir. RWP staff also explored the funding model under OWEB and CREP used by Clean Water Services.
In 2008, the MWMC initiated riparian project development through the CWSRF loan program’s Sponsorship Option. The loan option allows construction loan recipients to fund watershed restoration projects as part of the loan and lower the overall interest rate, effectively compensating for the funding of watershed projects. The MWMC directed staff to utilize the Sponsorship Option to the extent that investments would solely be directed at project activities

105
producing water quality trading credits for the MWMC. In 2009, the DEQ issued the Water Quality Trading in NPDES Permits IMD, providing guidance on riparian shade restoration for temperature mitigation.
After screening out available local projects for eligibility and potential feasibility, two projects were identified for shade implementation: the Springfield Mill Race (on reaches not being restored under the Army Corps of Engineers project under Section 206 of the Water Resources Development Act of 1986) and lower Cedar Creek (a side channel off the McKenzie River on the east side of Springfield that was the focus of the regional Metro Waterways Planning Study, also led by the Army Corps of Engineers). As a requirement of the CWSRF Sponsorship Option, the MWMC entered into Sponsorship Authorization Agreements with the City of Springfield (direct oversight of the Mill Race project) and the McKenzie Watershed Council (the local restoration organization working with landowners on Cedar Creek).
Riparian Sponsorship Contract with The Freshwater Trust
In 2011, the MWMC secured the services of The Freshwater Trust (TFT) through a request-for-proposal (RFP) process. The RFP identified the need for a project team to implement shade projects on the Springfield Mill Race and lower Cedar Creek to secure thermal credits for the MWMC, including long-term landowner agreements and project maintenance and monitoring. The contract required the production of a minimum of 2 MKcal/day of total credits registered for the MWMC; TFT is required to fully oversee the site selection, tree establishment, and long-term viability of the projects, including the verification of shade credits.
In 2013, TFT completed planting of the “Swanson Reach” section of the Mill Race, producing over 2 MKcal/day of credits. TFT calculated that work with private landowners along Cedar Creek would produce over an additional 12 MKcal/day of credits. The contract allows the MWMC to expand shade credit services beyond the initial project areas specified for CWSRF Sponsorship Option authorization.
5.2.3.3 Indirect Discharge – Confluence Island
In collaboration with property owner Delta Sand & Gravel, the MWMC studied the potential for indirect discharge of effluent at Confluence Island. The island is located approximately 1 mile downriver from the WPCF just upstream of the confluence of the McKenzie River with the Willamette River. Delta Sand & Gravel uses Confluence Island as a gravel source. Gravel pits on the island are limited to no deeper than 25 feet (in parallel with the thalweg of the river – i.e. the deepest part of the river channel) and no less than 100 feet setback from the river channels. Delta currently discharges gravel rinse water to onsite ponds to filter out sediment

106
and infiltrate the hyporheic zone. This mechanism was considered for potential thermal load mitigation.
In 2007, the DEQ released the Disposal of Municipal Wastewater Treatment Plant Effluent by Indirect Discharge to Surface Water via Groundwater or Hyporheic Water IMD, providing guidance on developing a projects involving off-river discharge of effluent into hyporheic zones. Additionally, the MWMC collaborated with the McKenzie Confluence Committee, a steering group convened by the McKenzie Watershed Council for potential restoration actions and planning for the confluence area.
A series of studies performed by local partners in collaboration with the MWMC helped generate funding interest for restoration that would include reclamation of gravel pits, creation of cold water alcoves, and indirect discharge of wastewater effluent. Reports produced included:
• Confluence Island Hyporheic Cooling, July 2008 (project progress report prepared by John Runyon from ICF Jones & Stokes).
• Confluence Island: an assessment of current and future opportunities for ecological restoration at the confluence of the McKenzie and Willamette Rivers, October 2008 (prepared by Stanley Gregory and Randy Wildman from Oregon State University’s Department of Fisheries and Wildlife, and David Hulse, Chris Enright, and Allan Branscomb from University of Oregon’s Institute for a Sustainable Environment).
• Recycled Water Program Implementation Planning – Indirect (Hyporheic Discharge Investigation Considerations), January 2009 (preliminary technical memorandum prepared by Mark Cullington, Kennedy/Jenks Consultants).
• A Flexible Future? - Three scenarios for the future of Confluence island, their effects and their adaptability, March 2011 (prepared by Sara Robertson, master’s degree candidate from University of Oregon’s Department of Landscape Architecture).
These studies indicated high potential for Confluence Island to serve as key floodplain habitat, off-channel ponds, cold water alcove, and water cooling site development. However, critical hydrogeologic studies for the MWMC’s participation in project design were needed to better understand the flow paths, flow rates, hyporheic mixing, and temperature regimes of water flowing through the site. Initial interest from the EPA and OSU’s Institute of Water and Watersheds to help perform the studies did not materialize, both from lack of funding and uncertainty of ability to complete the necessary studies without interfering with active gravel mining processes. Potential restoration funding from OWEB and the Meyer Memorial Trust could not be secured without the proper assessment and confirmation of a project trajectory.

107
However, future opportunity at the Confluence Island site and elsewhere on Delta Sand & Gravel property could yield benefits to the MWMC.
5.2.3.4 Bubble Permit
The MWMC explored bubble permit options with the City of Albany as part of the settlement agreement and ongoing thermal load mitigation strategies. A bubble permit allows point sources contributing to the same thermal load to share waste load allocations. Shared waste loads allow two or more point sources to be regulated on the aggregate thermal load of all sources against the maximum allowable combined waste loads for the sources. Such an arrangement could be particularly advantageous if the bubble permittees face different compliance risk periods.
The settlement agreement specified the possibility of a bubble permit (shared waste load allocation) with the City of Albany. However, the City of Albany has invested in its own compliance strategy and indicated it would not seek a bubble permit with its NDPES permit renewal. The MWMC petitioned the DEQ to expand the language of the settlement agreement to allow the MWMC to enter into a bubble permit with other upper Willamette point sources, but no modifications to the settlement agreement were granted.
5.3 Post-TMDL Planning, 2011 – 2014
As discussed in Section 2.1, NWEA legally challenged the EPA’s approval of Oregon’s revised 2004 water quality in 2005. The 2005 challenge targeted, among other things, the NCC. In February 2012, the court ruled that EPA’s approval of the NCC was arbitrary and capricious because (a) it supplanted lawfully derived numeric criteria, and (b) the NCC was based on a premise of natural conditions supportive of historic wildlife, where the DEQ’s NCC was based on unnatural stream conditions heavily impacted from anthropogenic changes.
In effect, EPA’s disapproval of the NCC dismantled the 2006 TMDL negating its applicability as regulatory tool and leaving the MWMC and other Willamette Basin NPDES permit holders with regulatory uncertainty. DEQ is now considering temperature standard development options to find a way forward that would be acceptable to the federal courts, EPA, the Services, the environmental community and associated stakeholders. Until a new temperature standard is developed and EPA approved, dischargers renewing their NPDES permits would be required to meet Oregon’s numeric biological criteria. A preliminary analysis of the MWMC’s ability to comply with the strict biologic temperature criteria indicates such a measure would place the

108
MWMC immediately at risk of noncompliance. Even if the TMDL were recalculated without the NCC, the temperature limits faced by the MWMC would be greater than imposed by the 2006 TMDL. Another projected consequence of the EPA’s disapproval of the NCC is that the MWMC would likely see temperature risks in summer as well as late October.
As mentioned previously, the court decision further delayed the MWMC’s permit renewal. At the time of the settlement agreement, the DEQ anticipated a 2012 permit renewal. As of fall of 2013, the DEQ expects that the MWMC’s permit will be renewed in 2017, anticipating that temperature regulatory requirements will by then be clarified for the MWMC. As a result of the delayed regulatory status and precedent DEQ has set with other permittees, the MWMC anticipates a compliance schedule potentially spanning two permit cycles (e.g., 10-years as was allowed for the City of Medford, OR) starting in 2017. Accordingly, the thermal load mitigation planning contemplated in this PFPU is based on a 2017-2027 project implementation period.
In 2013, the MWMC reconfigured the recycled water implementation planning budgets in light of the evolving regulatory uncertainty and emerging complementary thermal load mitigation alternatives. The CIP budget for temperature compliance was repositioned to capture the increased need for planning and exploring community benefits of recycled water, riparian shading, and other potentially effective strategies. The revised budgeted programs are:
• Thermal Load Mitigation – Pre-Implementation • Thermal Load Mitigation – Implementation Phase 1 • Thermal Load Mitigation – Implementation Phase 2
The overall Thermal Load Mitigation program budget plan combines the previous Recycled Water Program Phase 1 through 4 budgets and reallocates the budget dollars in accordance with the three bullet points above, which include an initial strategic planning phase followed by two implementation phases. The two implementation phases would be allocated to fund selected projects over two 5-year compliance periods as described above. Table 5.2 presents the first five years (i.e., the 5-year plan) for the revised Thermal Load Mitigation Program as currently envisioned. As with the MWMC’s CIP in general, the Thermal Load Mitigation Program budget plan shown in Table 5.2 will be revisited each fiscal year and updated using the best available information.

109
Table 5.2 – Thermal Load Mitigation Proposed 5-year Capital Plan
Program Phase FY 2014-15 FY 2015-16 FY 2016-17 FY 2017-18 FY 2018-19 Pre-Implementation $ 275,000 $ 200,000 Implementation Phase 1 $ 434,000 $ 100,000 $ 484,000 $ 4,600,000 $ 4,580,000 Implementation Phase 2(1) $ 2,000,000
(1) Implementation Phase 2 would continue with approximately $ 15,000,000 budgeted over FY 2019-20 to FY 2024-25
5.3.1 Phased Recycled Water Program Implementation Planning
The three-phased recycled water planning strategy described in Section 5.2.1 and illustrated in Figure 5.1 continued after EPA disapproved Oregon’s NCC, which rendered the 2006 Temperature TMDL in its current form inapplicable as a regulatory tool. As RWP staff reallocated the previous Recycled Water Program budget into the current Thermal Load Mitigation Program, the three recycled water planning phases were wrapped into the Thermal Load Mitigation – Pre-Implementation project budget. The phased planning approach allows the MWMC to gather select information, engage community stakeholders in an intentional way, and assess opportunities and cost-effectiveness in a stepwise manner. The three phases of recycled water program implementation planning are:
• Phase 1: Conceptual Alternatives Assessment (opportunity screening) • Phase 2: Alternatives Evaluation (feasibility study) • Phase 3: Implementation Plan (project definition)
Phase 1: Conceptual Alternatives Assessment
Phase 1 studies were conducted from 2011 through 2012. The first phase of recycled water planning studies sought to broaden previous evaluations by asking (1) Where in the Eugene-Springfield community could recycled water be used effectively, (2) Where is there potential demand and support for recycled water use, and (3) How would identified recycled water uses provide regulatory benefit to the MWMC? Based on geography, volume of use, and water quality need, a short list of potential applications were developed. Upon evaluation of overall likelihood for project success and regulatory benefit, two primary locations were identified for further study:
• MWMC Facilities (“inside the fence” – Biocycle Farm and BRS)

110
• Industrial Aggregate Facilities (“outside the fence” – Delta Sand & Gravel and Knife River)
Phase 2: Alternatives Evaluation
Phase 2 studies were conducted from 2012 through 2014. Phase 2 entailed feasibility studies of the leading alternatives identified for further study as a result of Phase 1 assessments. Phase 2 provided more detailed conceptual project design work, cost estimation, interest group and stakeholder engagement, and triple bottom line assessment.
5.3.2 Riparian Shade Contracting
In addition to the shade credit contract for the Springfield Millrace and Cedar Creek restoration projects, the MWMC again contracted with TFT in 2014 to assess efficiencies of piggy-backing onto EWEB’s proposed Voluntary Incentives Program (VIP). The VIP is a landowner incentives program to recruit McKenzie watershed riparian property owners to retain high-functioning riparian corridors to protect EWEB’s water supply. TFT is performing the study for EWEB and would be involved in its implementation. The MWMC may be able to benefit from the efficiency of landowner outreach being conducted and recruit riparian restoration participants along with EWEB VIP enrollees. This partnership could also serve as a model of full-circle community water resource stewardship.
Ongoing collaboration with TFT and the McKenzie Watershed Council may also illuminate effective shade partnerships in the Mohawk River Valley. The Mohawk is a tributary of the McKenzie downstream of EWEB’s water intake, so therefore not a part of EWEB’s watershed protection area. Given the Trust’s cost-performance on shade credit delivery under the Sponsorship Option contract, riparian shade restoration may be the most cost-effective tool the MWMC has for thermal load mitigation.
5.4 Conclusion
The MWMC’s thermal load mitigation strategy has evolved considerably beyond the 2004 MWMC Facilities Plan recycled water project recommendations to address anticipated changes in the Oregon’s temperature standards and to leverage new mitigation frameworks such as riparian shade and indirect discharge. RWP staff bundled and reallocated planned CIP recycled water project budget to better align with the new strategies and timelines in accordance with the best available information. Table 5.2 shows the current Thermal Load Mitigation Program

111
budget plan, which emphasizes planning for a diverse portfolio of potential of mitigation alternatives that can be adapted as more information becomes available.

112
6. RECOMMENDATIONS
The 2004 MWMC Facilities Plan provided a road map for the MWMC to address regulatory challenges known at the time to be imminent and position the MWMC with an adaptive strategy to manage change in regulatory understanding. By implementing the first 10 years of CIP projects, the MWMC has successfully increased and upgraded the hydraulic and treatment capacities needed for those challenges know at the time. This PFPU provides an analysis to support the MWMC’s interim adaptive planning needs. As noted in Section 1, a goal of this PFPU is to recommend changes to the 2004, 20-year CIP schedule that balance “just-in-time” project delivery with the anticipated timing when improved regulatory information becomes available.
Since the 2004 MWMC Facilities Plan was developed and the 2004, 20-year CIP schedule of projects established, new population and flow and load data suggest lower projected influent flows and loads than the analysis performed in 2004 (Section 3). The regulatory challenges that the MWMC now faces include some of those faced in 2004 (e.g., wet weather flow management) but new concerns such as temperature, toxics, and turbidity are now equally as critical (Section 2) for the MWMC moving forward. Of particular complexity is the high degree of uncertainty regarding upcoming thermal load permit limits (Sections 2 and 5).
The MWMC’s recently upgraded facilities were evaluated to understand capacity and capability of the major treatment process units (Section 4). These results suggest that scheduled improvements of aeration basins and tertiary filtration can be substantially delayed. But, staff also considered that moderate incremental delays would allow the MWMC to leverage new information on regulatory requirements arising from the upcoming NPDES permit renewal process and associated revisions to capacity assessments that would be performed under the next Comprehensive Facilitates Plan Update, currently scheduled for FY 2016/17.
The recommendation for each project evaluated in this PFPU is described in greater detail below. In addition, staff will revisit these recommendations and CIP project timing as part of annual budget planning. A summary of the CIP project timing changes recommended in this PFPU is presented in Table 6.1.

113
Table 6.1 – Summary of CIP Project Timing Recommendations
CIP Project Recommended
initial budget year (1)
Project schedule per 2004 FP
Estimated Project Cost (2)
Anaerobic Digester (3) FY 14-15 FY 10-11 $9,170,000 Thermal Load Mitigation Pre-Implementation FY 14-15 N/A (4) $472,000
Thermal Load Mitigation Implementation Phase 1 (5), (6) FY 14-15 N/A (4) $13,816,000
Comprehensive Facilities Plan Update FY 16-17 FY 14-15 $1,488,000 Aeration Basin Upgrades – Phase 2 FY 18-19 FY 15-16 $14,300,000 Glenwood Pump Station FY 18-19 FY 10-11 $926,000 Thermal Load Mitigation Implementation Phase 2 (7) FY 18-19 N/A (4) $17,000,000
Tertiary Filtration – Phase 2 FY 19-20 FY 13-14 $11,400,000 Waste Activated Sludge Thickening FY 21-22 FY 05-06 $5,418,000
(1) The initial budget year is the first year of the multi-year project. (2) Project cost is the total escalated project cost. The value shown represents the sum of escalated budget
years for multi-year projects. (3) The Thermal Load Implementation Program budget was adapted from the earlier Reuse Phases 1 through
4 budgets and so the recycled water project schedule identified in the 2004 Facilities Plan did not directly apply to the adapted program.
(4) Thermal Load Mitigation Implementation Phase 1 includes the two riparian shade projects at the Springfield Millrace and Cedar Creek.
(5) Thermal Load Mitigation Implementation Phase 1 represents a series of multi-year projects implemented over approximately six to eight years.
(6) Thermal Load Mitigation Implementation Phase 2 represents a series of multi-year projects implemented over approximately six to eight years overlapping with Thermal Load Mitigation Implementation Phase 1.
(7) Estimated cost does not include aspects such as Class A capability, resource recovery, or FOG receiving station.
6.1 Aeration Basin Improvements – Phase 2
Under the 2004, 20-year CIP, implementation of the Aeration Basins – Phase 2 project was planned for FY 14-15. However, CH2M HILL’s updated evaluation of the MWMC’s secondary treatment process indicated that under wet weather conditions, the secondary clarifier solids loading limit is reached in approximately 2025. The second phase of aeration basin modifications should therefore implemented before 2025 to mitigate the loading constraint on the clarifiers.
However, as discussed in Section 4.6, RWP staff also considered it prudent to make an incremental change to the project schedule taking into account that new regulatory

114
information would be available in conjunction with the upcoming permit renewal and with implementation of a Comprehensive Facilities Plan Update scheduled for FY 16-17. With this in mind, RWP staff recommends a moderate extension of the project implementation schedule to FY 18-19. At that time or when new information becomes available, the need and timing of the project can be revisited.
6.2 Tertiary Filtration – Phase 2
Under the 2004 20-year CIP, implementation of the Tertiary Filtration – Phase 2 project was planned for FY 13-14. However, the findings of CH2M HILL’s recent analysis presented in Section 4 suggests that the Tertiary Filtration – Phase 2 project could be delayed until approximately 2030 with the current permit TSS mass limitations and no turbidity limitations. The analysis also found that upgrading the filtration capacity has its limitations under peak wet weather flow management conditions due to the primary clarifier diversion. Filtering 100% of the secondary effluent flow would only allow flows to reach 206 mgd before the maximum daily TSS limit is again reached under the assumptions of the analysis. Fortunately, the daily mass limit is waived at flows greater than twice the Average Dry Weather Design Flow of 49 mgd (i.e., 98 mgd) under the current administratively extended NPDES permit.
Additionally, while the dry weather capacity analysis shows ample capacity, considering that September 2013 (dry weather) was one of the wettest on record which saw the facility nearly exceed its permitted TSS discharge capacity, taking a conservative approach is likely justified. Therefore, it could be prudent to expand the filtration capacity earlier, especially if the wet weather season begins creeping into the ‘normal’ dry weather permit range. In addition, the potential for a change in TSS/CBOD mass limits and/or a new limit on turbidity within the next permit cycle warrants consideration.
As discussed in Section 4.6, and similar to the recommendation above for the Aeration Basin Improvements, RWP staff considers it prudent to make an incremental change to the project schedule taking into account that new regulatory information would be available in conjunction with the upcoming permit renewal and with implementation of a Comprehensive Facilities Plan Update scheduled for FY 16-17. With this in mind, RWP staff recommends a moderate extension of the project implementation schedule to FY 19-20. At that time or when new information becomes available, the need and timing of the project can be revisited.
Additionally, it is recommended that MWMC continue to investigate CEPT and/or other advanced primary treatment methods such as high rate clarification in anticipation of potential tightening CBOD/TSS mass limitation and turbidity water quality criteria in the future.

115
6.3 Increase Digestion Capacity
Under the 2004, 20-year CIP, implementation of the Increase Digestion Capacity project (then referred to as Digester Expansion/Class A Capability project) was planned for implementation in FY 10-11. Since that time RWP staff has delayed that project based on interim assessments and to evaluate how the functioning of the mixing improvements installed in 2007 would extend the digester cleaning frequency requirements. The findings of CH2M HILL’s analysis presented in Section 4 suggests that additional digestion capacity is needed in the near-term to meet the pathogen reduction requirements of the 40-CFR-503 and preserve operational flexibility regarding digester cleaning operations and provide redundancy to lower risks associated with potential unplanned equipment outages. RWP staff therefore recommends implementation of the Increase Digestion Capacity project in FY 14-15.
6.4 WAS Thickening
Under the 2004, 20-year CIP, implementation of the WAS Thickening project was planned for FY 05-06. As discussed in Section 4.5, there are two existing GBTs that are each adequately sized to thicken all of the WAS produced in the secondary treatment process at the WPCF. An analysis of historical WAS loading to the GBTs shows that both the hydraulic and solids loading rates are well below the capacity of one GBT. Moreover, sludge yield does not appear to be increasing over time. Finally, there is no regulatory equipment redundancy requirement for these units yet the existing facilities provide 100 % redundancy. Finally, an analysis of the WAS Thickening project timing performed by CH2M HILL in 2007 (Appendix J) indicated that the WAS Thickening project could be delayed until 2022. For these reasons, RWP staff concludes that the addition of a third GBTs is not needed in the near future and recommends delaying the project until FY 22-23.
6.5 Glenwood Pump Station
Under the 2004, 20-year CIP, implementation of the Glenwood Pump Station Expansion was planned for FY 10-11. The analysis provided in Section 4.4 identifies a trigger peak hour wet weather flow of 4.5 mgd and estimates that that trigger flow would be reached in approximately 2019. The analysis was based on timing of development, among other things, presented in the City of Springfield Glenwood Refinement Plan. Based on these results, staff recommends planning for the implementation of the Glenwood Pump Station Expansion project should be implemented in FY 18-19. However, it is recommended that field testing of

116
pump station capacity and current peak wet weather inflow conditions is performed within the next several years to verify the assumptions and results of this analysis.
In addition, the following items should also be considered for incorporation into the project scope:
• Add a smaller “jockey” pump to be used during most of the year when flows are below the threshold of the low-speed capacity of the existing pumps. This could be done as the next pump addition in FY 18-19 or before depending on operational need. The jockey pump should be operated as a variable speed pump using a variable frequency drive to match incoming flows.
• Replace all VFDs when the smaller pump is installed. VFDs are getting to the end of their dependability.
• Add flow meters on each of the force mains that would allow for more precise tracking of flows into the station. It would also enable us to have a better idea on the amount of I&I and also do better long range planning. Staff has indicated a preference for strap-on type meters.
6.6 Thermal Load Mitigation Planning and Implementation
As explained in Section 5, the MWMC’s thermal load mitigation approach as conceived in the 2004 MWMC Facilities Plan was comprised of a series of recycled water projects with implementation dates ranging from FY 06-07 to FY 17-18. These projects, as envisioned in the 2004 MWMC Facilities Plan, are described in Table 5.1. However, given uncertainties associated with Oregon’s temperature water quality standard as well as emerging compliance opportunities in areas such as shade credit and indirect discharge, the MWMC has reallocated its thermal load mitigation budget plan to more cost effectively respond to these uncertainties and potential opportunities. As discussed in Section 5, this PFPU recommends the following three phases of Thermal Load Mitigation Program elements and associated initial budget years:
• Thermal Load Pre-Implementation (FY 14-15) This project includes the phased recycled water planning effort and feasibility studies, study and planning of associated thermal load mitigation measures such as riparian shading and water quality trading credit activities, and permit negotiation and legal strategy related to the temperature TMDL and NPDES permit renewal.
• Thermal Load Mitigation Implementation Phase 1 (FY 14-15)
117
This project implements thermal load mitigation projects strategized for regulatory compliance and additional environmental and community benefits. The projects may include recycled water use expansion at MWMC and/or community partner facilities, riparian shade projects (initially being implemented on Cedar Creek and Springfield Mill Race), and potentially water quality trading credit strategies through shade credit investments and collaborative partnerships for permit compliance.
• Thermal Load Mitigation Implementation Phase 2 (FY 18-19) This project anticipates future expansion of recycled water uses, riparian restoration, and/or other thermal load and watershed management strategies for regulatory compliance and environmental and community benefits. These projects are subject to the outcomes of the regulatory scenarios and goals associated with changing conditions of TMDL implementation, community and climatic factors, and emerging water quality/quantity needs.