Part_2 as Planned S Curves
15
Project Control: Developing the As-Planned S-Curves Part #2 November 28, 2010 Hide/Unhide Exercises
-
Upload
sekson-lapcharoensin -
Category
Documents
-
view
224 -
download
0
Transcript of Part_2 as Planned S Curves
8/8/2019 Part_2 as Planned S Curves
http://slidepdf.com/reader/full/part2-as-planned-s-curves 1/15
Project Control: Developingthe As-Planned S-Curves
Part #2November 28, 2010
Hide/Unhide Exercises
8/8/2019 Part_2 as Planned S Curves
http://slidepdf.com/reader/full/part2-as-planned-s-curves 2/15
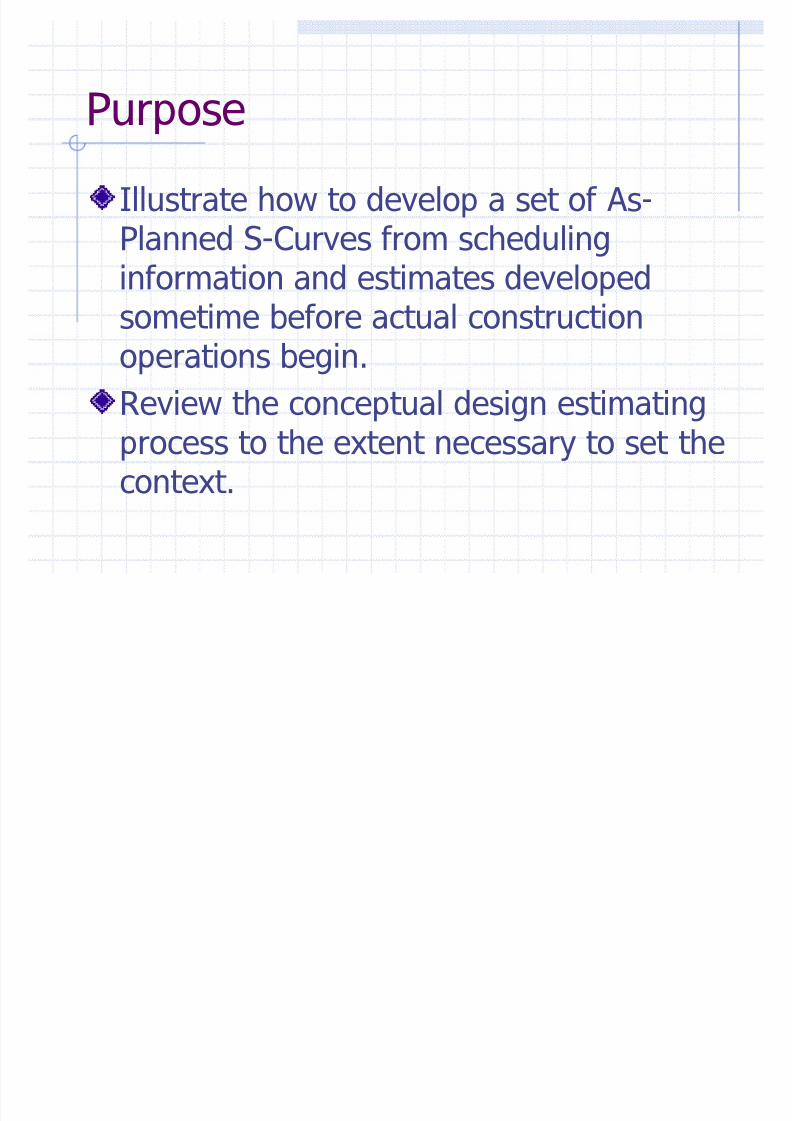
Purpose
Illustrate how to develop a set of As-Planned S-Curves from schedulinginformation and estimates developedsometime before actual constructionoperations begin.
Review the conceptual design estimatingprocess to the extent necessary to set thecontext.
8/8/2019 Part_2 as Planned S Curves
http://slidepdf.com/reader/full/part2-as-planned-s-curves 3/15
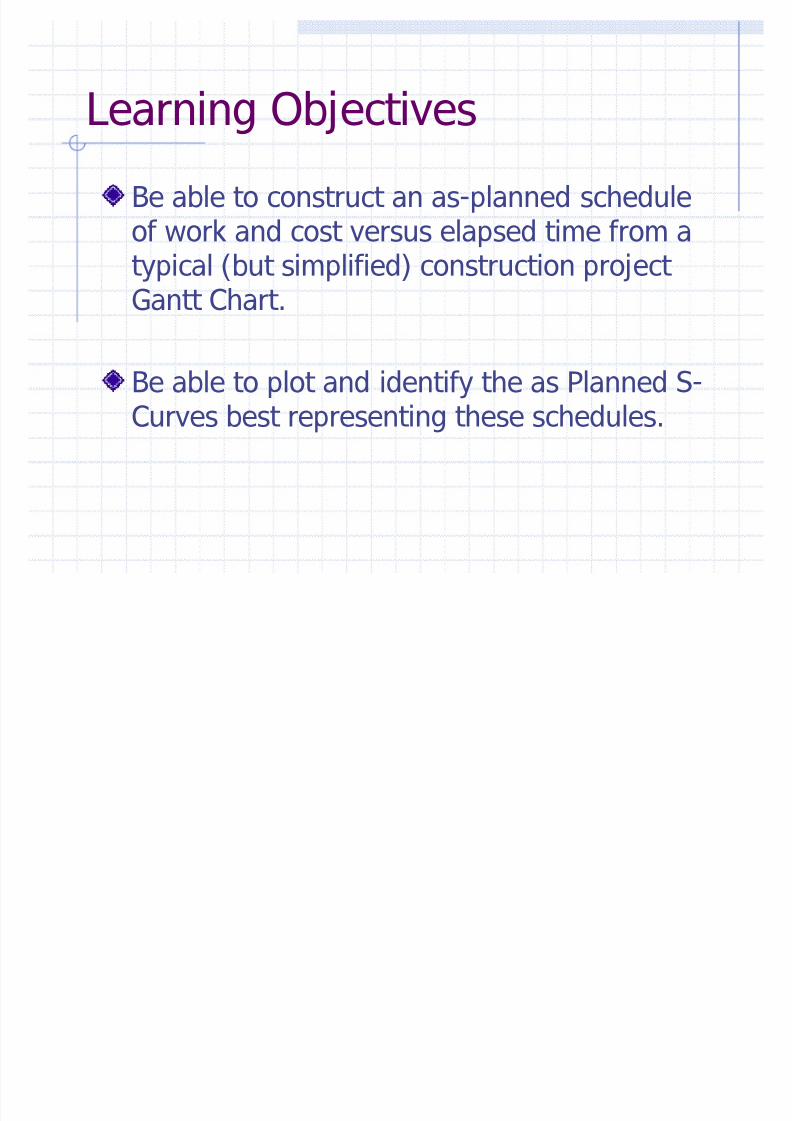
Learning Objectives
Be able to construct an as-planned scheduleof work and cost versus elapsed time from a
typical (but simplified) construction project Gantt Chart.
Be able to plot and identify the as Planned S-Curves best representing these schedules.
8/8/2019 Part_2 as Planned S Curves
http://slidepdf.com/reader/full/part2-as-planned-s-curves 4/15
W ho Develops the As PlannedGantt Chart? And W hen?
It depends upon what part of the process isin question.
W e are going to assume that the Gantt Chart is developed by the Contractor to planconstruction operations.W e are going to assume that the scheduledata are generated sometime before theonset of actual field operations.
8/8/2019 Part_2 as Planned S Curves
http://slidepdf.com/reader/full/part2-as-planned-s-curves 5/15
Example Construction Project
The project is to reconstruct 2-miles of parkaccess road conforming to Texas FM-Road
standards. This involves the following tasks:1. Mobilization Equipment, office set up, etc.2. Sub-base preparation hauling, grading and
compaction, redo of some culverts, etc.3. Base course construction hauling, grading and
compaction.4. W earing Course construction shoot and chip5. Demobilization Clean up, equipment, office,
etc.

8/8/2019 Part_2 as Planned S Curves
http://slidepdf.com/reader/full/part2-as-planned-s-curves 6/15
Class Discussion Exercise #2.1on Construction Methods.
Ask Selected Individuals or Pairs to answer thefollowing:
W hat is Base Material and what is its purposein the design of the road?How is the Base built?W hat is shoot and chip?W hat is Pea Gravel?W hat is the design profile of a FM Road?
8/8/2019 Part_2 as Planned S Curves
http://slidepdf.com/reader/full/part2-as-planned-s-curves 7/15
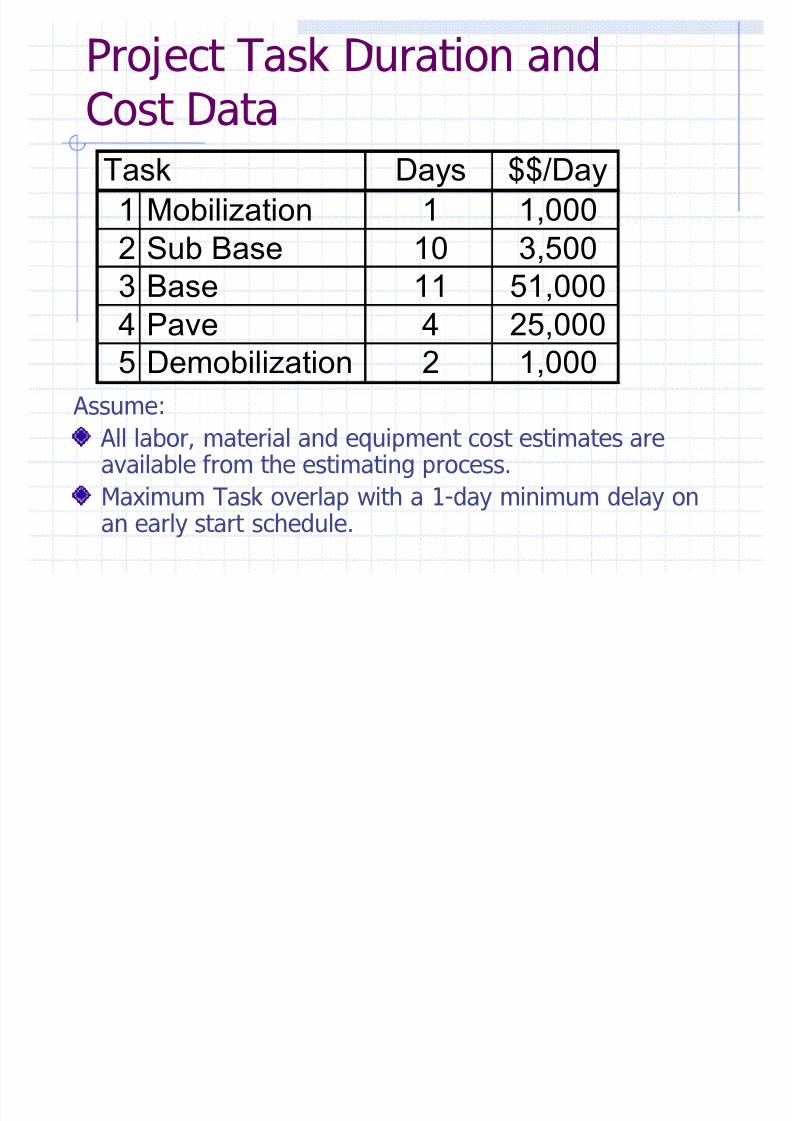
Project Task Duration andCost Data
Assume: All labor, material and equipment cost estimates areavailable from the estimating process.Maximum Task overlap with a 1-day minimum delay onan early start schedule.
Days $$/Day1 Mobilization 1 1,0002 Sub Base 10 3,5003 Base 11 51,0004 Pave 4 25,0005 Demobilization 2 1,000
Task
8/8/2019 Part_2 as Planned S Curves
http://slidepdf.com/reader/full/part2-as-planned-s-curves 8/15
Assumed Estimating Process
The entire project is broken into W ork Packages (workbreakdown structure): build base, shoot and chip, etc.Estimated unit quantities for each work package are calculated
from the plans and specifications at an appropriate level of detail.The corresponding unit prices and productivity rates areobtained from historical data W e will use the R. S. Meansmanual in this class.
W ork Package (or Task or Activity) durations and costs arederived from the historical data as applied to the estimates.These data serve as inputs to the scheduling process whichresult in Bar-Charts similar to the one on the next slide.
8/8/2019 Part_2 as Planned S Curves
http://slidepdf.com/reader/full/part2-as-planned-s-curves 9/15
Class Exercise 2.2
As individuals describe the crew(equipment and personnel) configurationnecessary to construct the base course.
As Pairs agree upon the configuration. As a Team, estimate the hourly cost rate.
8/8/2019 Part_2 as Planned S Curves
http://slidepdf.com/reader/full/part2-as-planned-s-curves 10/15
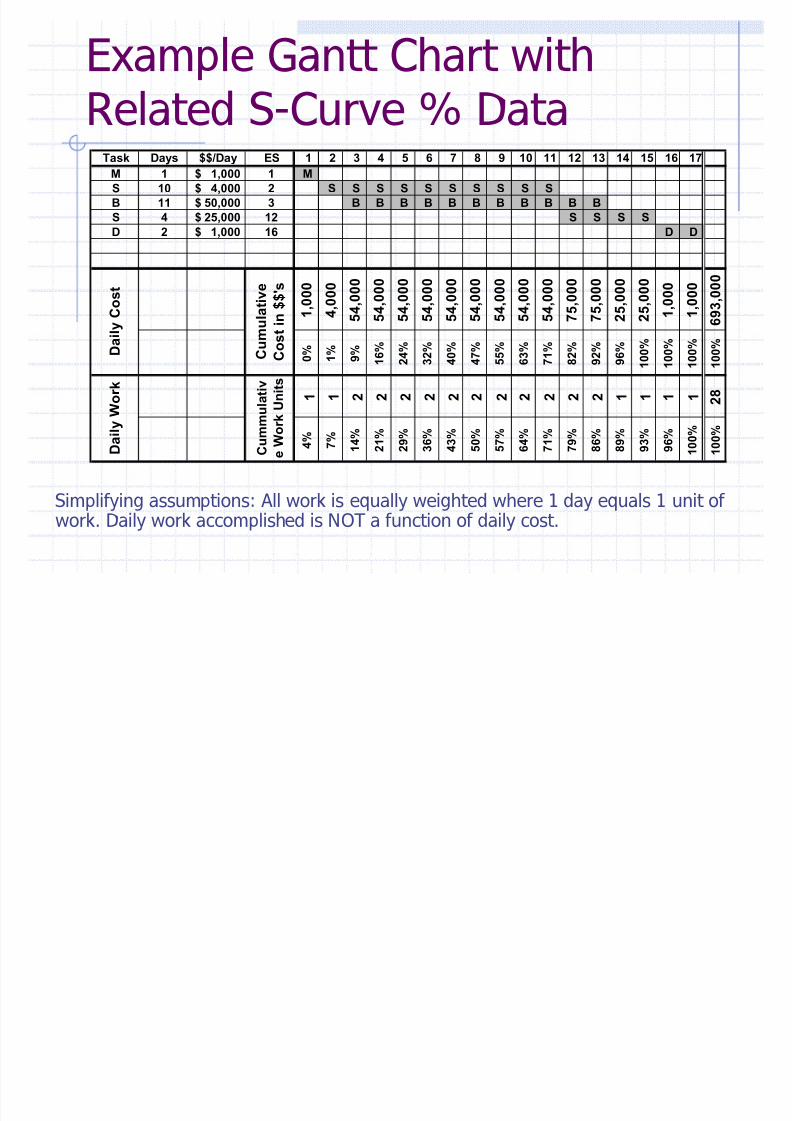
Example Gantt Chart withRelated S-Curve % Data
Simplifying assumptions: All work is equally weighted where 1 day equals 1 unit of work. Daily work accomplished is NOT a function of daily cost.
Task Days $$/Day ES 1 2 3 4 5 6 7 8 9 10 11 12 13 14 15 16 17M 1 1,000$ 1 MS 10 4,000$ 2 S S S S S S S S S SB 11 50,000$ 3 B B B B B B B B B B BS 4 25,000$ 12 S S S SD 2 1,000$ 16 D D
1 , 0 0 0
4 , 0 0 0
5 4 , 0 0 0
5 4 , 0 0 0
5 4 , 0 0 0
5 4 , 0 0 0
5 4 , 0 0 0
5 4 , 0 0 0
5 4 , 0 0 0
5 4 , 0 0 0
5 4 , 0 0 0
7 5 , 0 0 0
7 5 , 0 0 0
2 5 , 0 0 0
2 5 , 0 0 0
1 , 0 0 0
1 , 0 0 0
6 9 3 , 0 0 0
0 % 1 % 9 % 1 6 %
2 4 % 3 2 %
4 0 % 4 7 %
5 5 % 6 3 %
7 1 % 8 2 %
9 2 % 9 6 %
1 0 0 %
1 0 0 %
1 0 0 %
1 0 0 %
1 1 2 2 2 2 2 2 2 2 2 2 2 1 1 1 1 2 8
4 % 7 % 1 4 %
2 1 % 2 9 %
3 6 % 4 3 %
5 0 % 5 7 %
6 4 % 7 1 %
7 9 % 8 6 %
8 9 % 9 3 %
9 6 % 1 0 0 %
1 0 0 %
D a i l y
C o s t
D a i l y
W o r k
C u m u
l a t i v e
C o s t
i n $ $ ' s
C u m m u l a t i v
e W o r k U n i t s
8/8/2019 Part_2 as Planned S Curves
http://slidepdf.com/reader/full/part2-as-planned-s-curves 11/15
Class Exercise #2.3
As Individuals, compute the number of cubic yards of base material required tobuild 2-miles of FM Road base, 24-feet wide, and 1-foot thick?
As Pairs, compare answers and then
compute the linear feet of dailyprogress, if you can build 2,700 sq-ydsof base per day?
8/8/2019 Part_2 as Planned S Curves
http://slidepdf.com/reader/full/part2-as-planned-s-curves 12/15
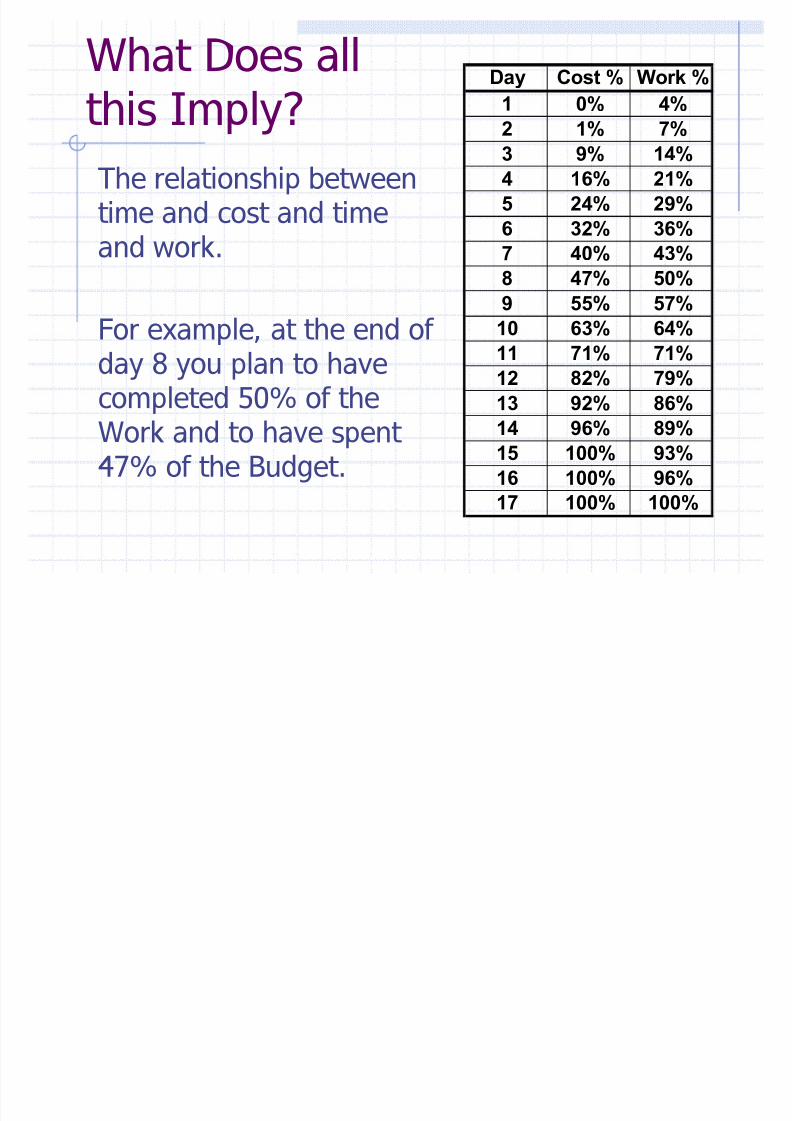
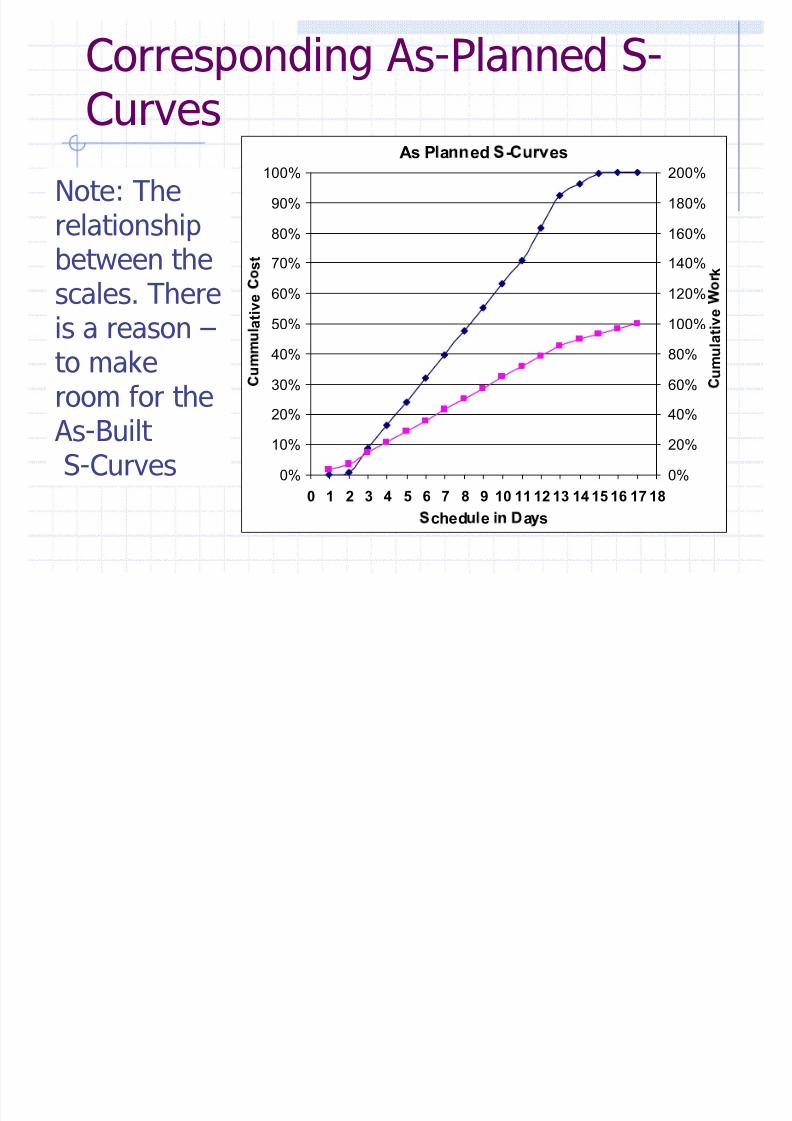
W hat Does allthis Imply?The relationship betweentime and cost and timeand work.
For example, at the end of day 8 you plan to have
completed 50% of theW ork and to have spent 47% of the Budget.
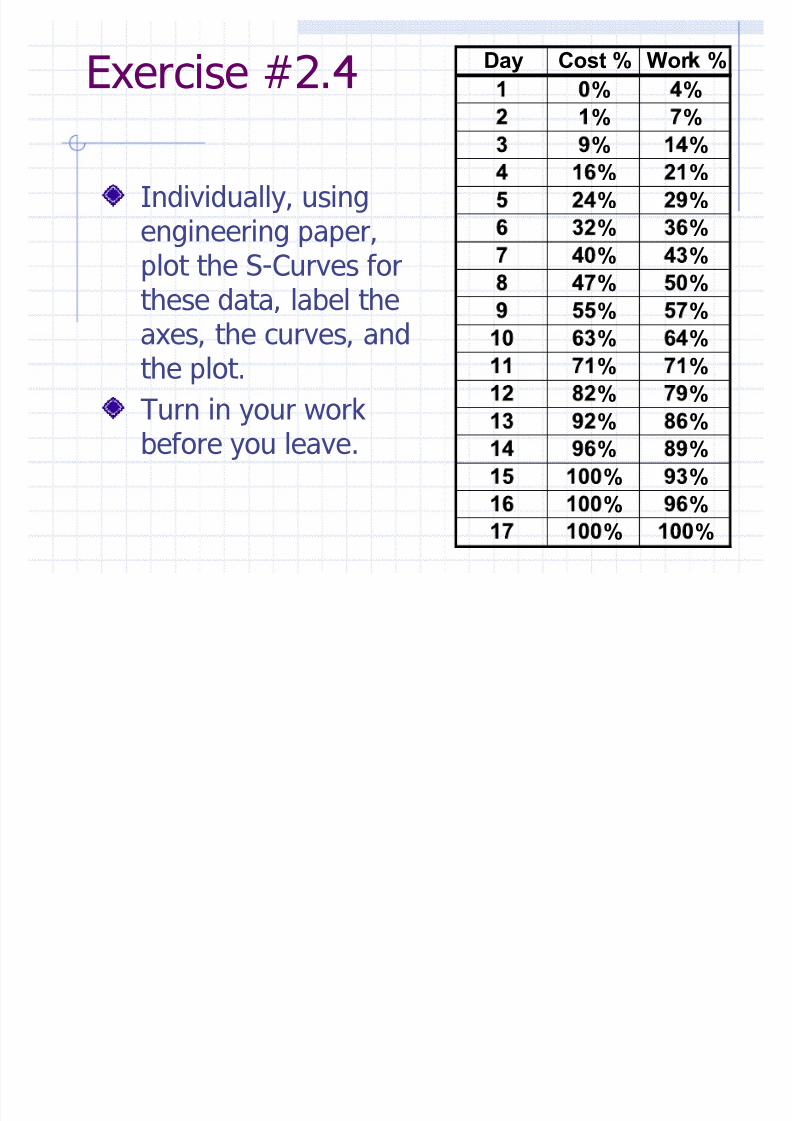
Day Cost % Work %1 0% 4%
2 1% 7%3 9% 14%4 16% 21%5 24% 29%6 32% 36%7 40% 43%8 47% 50%9 55% 57%
10 63% 64%11 71% 71%12 82% 79%
13 92% 86%14 96% 89%15 100% 93%16 100% 96%17 100% 100%
8/8/2019 Part_2 as Planned S Curves
http://slidepdf.com/reader/full/part2-as-planned-s-curves 13/15
Corresponding As-Planned S-Curves
As P a ed - es
0%
10%
20%
30%
40%
50%
60%
70%
80%
90%
100%
0 1 2 3 4 5 6 7 8 9 10 11 12 13 14 15 16 17 18ched e a s
a t i v e
s t
0%
20%
40%
60%
80%
100%
120%
140%
160%
180%
200%
u m u l a t i v e
k
Note: Therelationship
between thescales. Thereis a reason to make
room for the As-Built S-Curves
8/8/2019 Part_2 as Planned S Curves
http://slidepdf.com/reader/full/part2-as-planned-s-curves 14/15
Exercise #2.4
Individually, usingengineering paper,
plot the S-Curves forthese data, label theaxes, the curves, andthe plot.
Turn in your workbefore you leave.
Day Cost % W o r %% %% %% %% %% %% %% %% %% %% %% %% %% %% %% %% %
% %

8/8/2019 Part_2 as Planned S Curves
http://slidepdf.com/reader/full/part2-as-planned-s-curves 15/15
Module Assessment Question
If you had to ask a question about thistopic, what would it be?