Part II Fundamentals of Interest Rates Chapter Three Understanding Interest Rates.
29
-
Upload
molly-martin -
Category
Documents
-
view
222 -
download
0
Transcript of Part II Fundamentals of Interest Rates Chapter Three Understanding Interest Rates.

Part II
Fundamentals of Interest Rates

Chapter Three
Understanding Interest Rates

Slide 3–4
Simple loan of $1
Year 1 2 3 n
$1.10 $1.21 $1.33 1(1+i)n
PV of future $1 =$1
1+ i n
Present Value
• Four Types of Credit Instruments1. Simple Loan2. Fixed Payment Loan3. Coupon Bond4. Discount Bond
• Concept of Present Value

Slide 3–5
Yield to Maturity: Loans
• Yield to maturity = interest rate that equates today's value with present value of all future payments
1. Simple Loan (i = 10%)
$100 $110 1 i
i $110 $100
$100
$10
$100.10 10%

Slide 3–6
Yield to Maturity: Loans
2. Fixed Payment Loan (i = 12%)
$1000 $126
1 i
$126
1 i 2 $126
1 i 3 ... $126
1 i 25
LV FP
1 i
FP
1 i 2 FP
1 i 3 ... FP
1 i n

Slide 3–7
Figure 3-1: A Mortgage Payment Table

Slide 3–8
Figure 3-2: A Bond Table

Slide 3–9
Yield to Maturity: Bonds
3. Coupon Bond (Coupon rate = 10% = C/F)
P $100
1 i
$100
1 i 2 $100
1 i 3 ... $100
1 i 10 $1000
1 i 10
P C
1 i
C
1 i 2 C
1 i 3 ... C
1 i n F
1 i n
– Consol: Fixed coupon payments of $C forever
P C
ii
C
P

Slide 3–10
Yield to Maturity: Bonds
4. One-Year Discount Bond (P = $900, F = $1000)
$900 $1000
1 i
i $1000 $900
$900.111 11.1%
i F P
P

Slide 3–11
Relationship Between Price and Yield to Maturity
• Three interesting facts in Table 3-1
1. When bond is at par, yield equals coupon rate
2. Price and yield are negatively related
3. Yield greater than coupon rate when bond price is below par value

Slide 3–12
Current Yield
• Two Characteristics1. Is better approximation to yield to maturity, nearer price
is to par and longer is maturity of bond
2. Change in current yield always signals change in same direction as yield to maturity
ic C
P

Slide 3–13
idb (F - P)
F
360
(number of days to maturity)
idb $1000 - $900
$1000
360
365.099 9.9%
• Two Characteristics1. Understates yield to maturity; longer the maturity,
greater is understatement
2. Change in discount yield always signals change in same direction as yield to maturity
Yield on a Discount Basis
• One-Year Bill (P = $900, F = $1000)

Bond Page of the Newspaper

Slide 3–15
Distinction Between Real and Nominal Interest Rates
• Real interest rate1. Interest rate that is adjusted for expected changes in the
price level
ir i e
2. Real interest rate more accurately reflects true cost of borrowing
3. When real rate is low, greater incentives to borrow and less to lend

Slide 3–16
Distinction Between Real and Nominal Interest Rates (cont.)
• If i = 5% and πe = 0% then
ir 5% 0% 5%
ir 10% 20% 10%
• If i = 10% and πe = 20% then

Slide 3–17
U.S. Real and Nominal Interest Rates
Figure 3-3: Real and Nominal Interest Rates (Three-Month Treasury Bill), 1953–2001
Sample of current rates and indexeshttp://www.martincapital.com/charts.htm

Slide 3–18
RET C Pt1 Pt
Pt
ic g
where ic C
Pt
current yield
g pt1 Pt
Pt
capital gain
Distinction Between Interest Rates and Returns
• Rate of Return

Slide 3–19
Key Facts about the Relationship Between Rates and Returns
Sample of current coupon rates and yields on government bondshttp://www.bloomberg.com/markets/iyc.html

Slide 3–20
Maturity and the Volatility of Bond Returns
• Key findings from Table 3-21. Only bond whose return = yield is one with maturity = holding
period
2. For bonds with maturity > holding period, i P implying capital loss
3. Longer is maturity, greater is price change associated with interest rate change
4. Longer is maturity, more return changes with change in interest rate
5. Bond with high initial interest rate can still have negative return if i

Slide 3–21
Maturity and the Volatility of Bond Returns
• Conclusion from Table 3-2 analysis1. Prices and returns more volatile for long-term bonds
because have higher interest-rate risk
2. No interest-rate risk for any bond whose maturity equals holding period

Slide 3–22
Reinvestment Risk
1. Occurs if hold series of short bonds over long holding period
2. i at which reinvest uncertain
3. Gain from i , lose when i

Slide 3–23
Calculating Durationi =10%, 10-Year 10% Coupon Bond

Calculating Durationi = 20%, 10-Year 10% Coupon Bond

Slide 3–25
DUR tCPt
1 i tt 1
n
CPt
1 i tt 1
n
Formula for Duration
• Key facts about duration1. All else equal, when the maturity of a bond lengthens,
the duration rises as well
2. All else equal, when interest rates rise, the duration of a coupon bond fall

Slide 3–26
Formula for Duration
1. The higher is the coupon rate on the bond, the shorter is the duration of the bond
2. Duration is additive: the duration of a portfolio of securities is the weighted-average of the durations of the individual securities, with the weights equaling the proportion of the portfolio invested in each

Slide 3–27
Duration and Interest-Rate Risk
• i 10% to 11%:– Table 3-4, 10% coupon bond
%P DURi
1 i
%P 6.76 0.01
1 0.10
%P 0.0615 6.15%
Slide 3–28
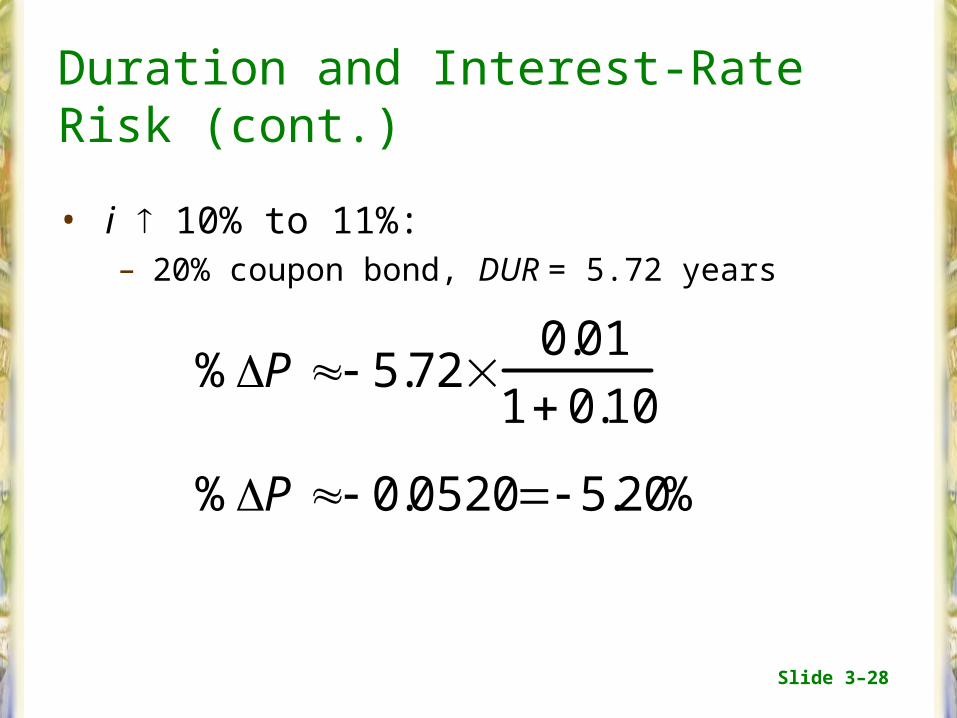
Duration and Interest-Rate Risk (cont.)
• i 10% to 11%:– 20% coupon bond, DUR = 5.72 years
%P 5.72 0.01
1 0.10
%P 0.0520 5.20%

Slide 3–29
Duration and Interest-Rate Risk
• The greater is the duration of a security, the greater is the percentage change in the market value of the security for a given change in interest rates
• Therefore, the greater is the duration of a security, the greater is its interest-rate risk