Part 6 - Aggregates (PDF, 1.05 MB)
123
Materials Testing Manual Part 6: Aggregates
Transcript of Part 6 - Aggregates (PDF, 1.05 MB)
Materials Testing Manual Part 6: Aggregates
Materials Testing Manual – Part 6, Transport and Main Roads, September 2017 1 of 4
Test Method Q201: Flakiness index of aggregate
1 Source
This method applies the principles of AS 1141.15: Flakiness index. It differs from this standard by:
a) not permitting the use of slotted sieves
b) including the use of a 16.0 mm sieve when required (for example, for larger sized cover aggregate)
c) including 19.0-16.0 mm, 16.0-13.2 mm and 6.70-4.75 mm slots in the thickness gauge when required, and
d) allowing a test fraction to be reduced to produce a test portion.
2 Scope
This method describes a procedure for determining the flakiness index of a general aggregate or cover aggregate. The method applies to aggregates having a nominal size not greater than 63.0 mm.
3 Definitions
3.1 Mean dimension - the mean of the smallest sieve aperture through which the particle passes and the largest sieve aperture on which the particle is retained.
3.2 Flaky particle - a particle with a least dimension (thickness) less than 0.6 of its mean dimension.
3.3 Flakiness index - the percentage by mass of flaky particles.
4 Apparatus
The following apparatus is required:
4.1 Balance of suitable capacity, having a resolution of at least 1 g and with a limit of performance not exceeding ± 5 g.
4.2 Drying oven of suitable capacity, having a temperature of 105-110ºC and complying with AS 1141.2.
4.3 Thickness (flakiness) gauge with apertures conforming to the dimensions shown in Table 1.
4.4 Sieves, 37.5 mm, 26.5 mm, 19.0 mm, 16.0 mm, 13.2 mm, 9.50 mm, 6.70 mm and 4.75 mm as required, complying with AS 1152.
4.5 Sample dividers.
4.6 Sieve brushes.
4.7 Container of suitable size, for drying the test portion.
4.8 Dishes and trays.

Test Method Q201: Flakiness index of aggregate
Materials Testing Manual - Part 6, Transport and Main Roads, September 2017 2 of 4
5 Procedure
The procedure shall be as follows:
5.1 Particle size distribution
5.1.1 Prepare the bulk sample as detailed in Section 5 of Test Method Q101 to obtain a test portion which, when dry, will comply with the minimum mass requirement of Test Method Q103B Table 1.
5.1.2 Place the test portion in the container and dry in the oven to a constant mass (Note 8.1).
5.1.3 In order to determine the sieves required, it is necessary to consult any applicable specification for the material under test.
5.1.4 Determine the particle size distribution of the sample as detailed in Test Method Q103A, Q103B or AS 1141.11.1 (Note 8.2) using the sieves required in Step 5.1.3.
5.2 Test fractions from Q103A
5.2.1 Combine the size fractions retained on the sieves as necessary, into the fractions shown in Table 1.
5.2.2 Include all fractions which constitute five or more percent of the sample mass and are larger than 4.75 mm.
5.2.3 Obtain the mass of each test fraction as follows:
a) For fractions larger than 19.0 mm (that is, obtained from Test Method Q103A Subsection 6.1), determine the mass of each test fraction ( 1m ) between 19.0 and
63.0 mm.
b) Where the sample has not been coarse sieved or the passing 19.0 mm material has not been subsampled (that is, obtained from Test Method Q103A Step 7.2.3), determine the mass of each test fraction ( 1m ) between 4.75 and 19.0 mm.
c) Otherwise:
i. Determine the subsampled mass of each test fraction ( 2m ).
ii. Calculate the mass of each test fraction ( 1m ) between 19.0 and 4.75 mm as follows:
T c1 2
4 3
M Mm mm m
−=
−
where 1m = mass of each test fraction (g)
2m = subsampled mass of each test fraction (g)
TM = mass of sample from particle size distribution (g)
cM = cumulative mass retained on the 19.0 mm sieve (g), obtained from
Q103A.
3m = mass of container (g), obtained from Q103A.
4m = mass of container and test portion subsample (g), obtained from
Q103A.
Test Method Q201: Flakiness index of aggregate
Materials Testing Manual - Part 6, Transport and Main Roads, September 2017 3 of 4
5.3 Test fractions from Q103B or AS 1141.11.1
5.3.1 Combine the size fractions retained on the sieves as necessary, into the fractions shown in Table 1.
5.3.2 Include all fractions which constitute five or more percent of the sample mass and are larger than 4.75 mm.
5.3.3 Determine the mass of each test fraction ( 1m ).
5.4 Flakiness index
5.4.1 Using either a sample divider or by cone and quartering, obtain a test portion from each fraction to be tested:
a) of at least 200 pieces of the predominant fraction, and
b) of at least 100 pieces or the complete fraction for each of the remaining fractions, whichever provides the fewer pieces for testing.
5.4.2 Determine the mass of each test portion ( 5m ).
5.4.3 Test each portion by attempting to pass each piece of aggregate through the appropriate gauge slot using the size of the slot shown in Table 1.
5.4.4 Retain the aggregate passing through the slot and determine the mass of the aggregate passing the appropriate gauge slot ( 6m ).
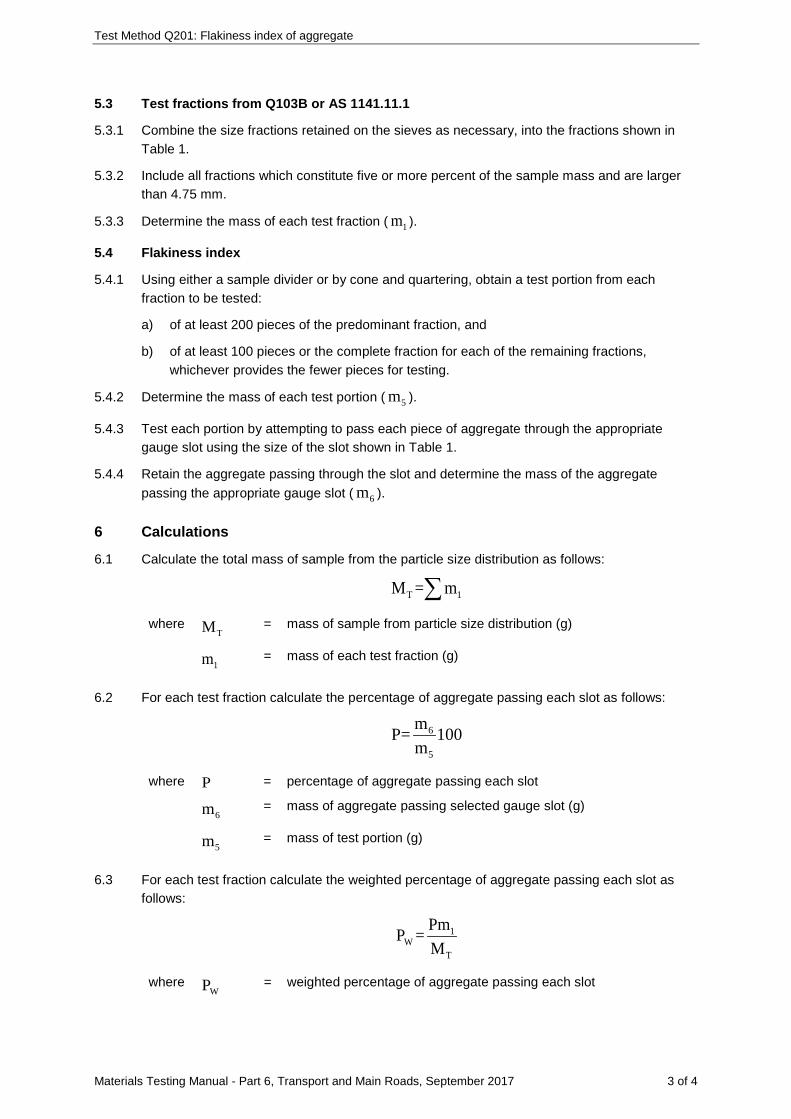
6 Calculations
6.1 Calculate the total mass of sample from the particle size distribution as follows:
T 1M = m∑
where TM = mass of sample from particle size distribution (g)
1m = mass of each test fraction (g)
6.2 For each test fraction calculate the percentage of aggregate passing each slot as follows:
6
5
mP= 100m
where P = percentage of aggregate passing each slot
6m = mass of aggregate passing selected gauge slot (g)
5m = mass of test portion (g)
6.3 For each test fraction calculate the weighted percentage of aggregate passing each slot as follows:
1W
T
PmP =M
where WP = weighted percentage of aggregate passing each slot

Test Method Q201: Flakiness index of aggregate
Materials Testing Manual - Part 6, Transport and Main Roads, September 2017 4 of 4
P = percentage of aggregate passing each slot
1m = mass of each test fraction (g)
TM = mass of sample from particle size distribution (g)
6.4 Calculate the flakiness index as follows:
WFI= P∑
where FI = flakiness index (%)
WP = weighted percentage of aggregate passing each slot
7 Reporting
Report the flakiness index to the nearest 1%.
8 Notes on method
8.1 The material is considered to have reached a constant mass when the difference between successive weighings, after a further 1 hour drying at 105-110°C, is not more than 1 percent of the total of the previous moisture losses.
8.2 For ease in determining the flakiness index, it is advisable to keep the fractions retained on each sieve separated during the performance of Test Method Q103A, Q103B or AS 1141.11.1.
Table 1 - Thickness gauge
Size fractions (mm) Dimensions of rectangular slots
Passing Retained Minimum length (mm)
Width *
63.0 53.0 90 34.8 ± 0.30
53.0 37.5 80 27.15 ± 0.30
37.5 26.5 70 19.20 ± 0.20
26.5 19.0 50 13.65 ± 0.20
19.0# 16.0 40 10.50 ± 0.20
16.0# 13.2 40 8.76 ± 0.10
19.0 13.2 40 9.66 ± 0.20
13.2 9.50 30 6.81 ± 0.10
9.50 6.70 20 4.86 ± 0.10
6.70 4.75 15 3.44 ± 0.10
* These widths are 0.6 times the mean of the limiting sieve sizes used to define the size fraction. # Fractions required for sprayed surfacing aggregates to replace 19.0 to 13.2 mm fraction.
Materials Testing Manual - Part 6, Transport and Main Roads, November 2014 1 of 2
Test Method Q202: Average least dimension of cover aggregate
1 Source
This method applies the principles of AS 1141.20.3: Average least dimension - Calculation (nomograph). It differs from this standard by directly calculating the average least dimension rather than utilising the nomograph. This method uses the term 'average least dimension' that is first attributed to F.M. Hanson, in the paper Bituminous Surface Treatment of Rural Highways published by the New Zealand Society of Civil Engineers.
2 Scope
This method describes the procedure for calculating the median size and average least dimension (ALD) of a sprayed sealing cover aggregate using the calculation method. The method is applicable to aggregates for bituminous surfacing having a nominal size 7 mm and greater.
3 Definitions
3.1 Average least dimension - the average of the thickness of all individual particles weighted in proportion to the surface areas covered when the particles lie with their least dimension upwards.
3.2 Median Size - the theoretical sieve size through which 50 percent of the aggregate will pass.
4 Procedure
The procedure shall be as follows:
4.1 Determine the particle size distribution of the aggregate as detailed in Test Method Q103B.
4.2 Determine the flakiness index of the aggregate as detailed in Test Method Q201.
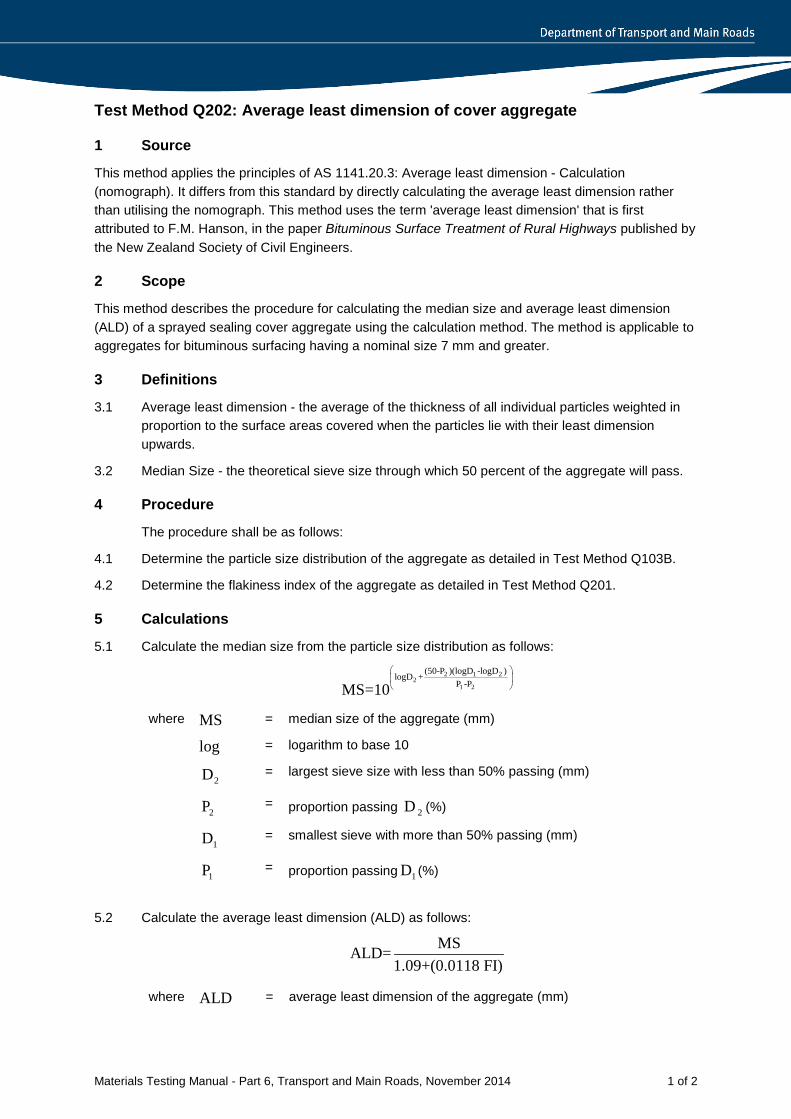
5 Calculations
5.1 Calculate the median size from the particle size distribution as follows:
2 1 22
1 2
(50-P )(logD -logD )logD +P -PMS=10
where MS = median size of the aggregate (mm)
log = logarithm to base 10
2D = largest sieve size with less than 50% passing (mm)
2P = proportion passing 2D (%)
1D = smallest sieve with more than 50% passing (mm)
1P = proportion passing 1D (%)
5.2 Calculate the average least dimension (ALD) as follows:
MSALD=1.09+(0.0118 FI)
where ALD = average least dimension of the aggregate (mm)

Test Method Q202: Average least dimension of cover aggregate
Materials Testing Manual - Part 6, Transport and Main Roads, November 2014 2 of 2
MS = median size of the aggregate (mm)
FI = flakiness index as determined in Test Method Q201
6 Reporting
Report the average least dimension (ALD) to the nearest 0.1 mm.

Materials Testing Manual - Part 6, Transport and Main Roads, November 2014 1 of 16
Test Method Q203: Polished aggregate friction value
1 Source
This method is based on AS 1141.40: Polished aggregate friction value - Vertical road wheel machine, and AS 1141.42: Pendulum friction test.
This method differs from AS 1141.40 in the specification of the polishing materials, the procedure used to select aggregate particles for the test and the aperture size of the slotted sieve.
This method differs from AS 1141.42 in the conditions for using rubber sliders where the requirements are based on EN1097 - Tests for mechanical and physical properties of aggregates – Part 8: Determination of polished stone value. The method also allows the use of the UK reference aggregate with assigned friction values as detailed in Austroads, “Establishing a reference aggregate for aggregate polishing tests”, AP-T212-12, August 2012.
2 Scope
This method describes the procedure for determining the polished aggregate friction value (PAFV) of a naturally occurring or artificially produced aggregate which is intended for use as a pavement surfacing material. It involves friction testing of prepared specimens of the aggregate following laboratory polishing.
3 Apparatus
Where appropriate, the working tolerances of particular apparatus are contained in Tables 1 and 2. Examples of the apparatus are shown in AS 1141.40 Figure 1 and AS 1141.42 Figure 2.
The following apparatus is required:
3.1 Accelerated polishing machine, vertical road wheel type rigidly mounted on a firm level base and comprised and constructed as follows:
3.1.1 Road wheel accommodating 14 specimens clamped on its periphery to form a surface of exposed aggregate particles of 45 mm in width and 406 mm in diameter. It is rotated at 320 revolutions/min.
3.1.2 Solid rubber-tyred wheel having, in the unused condition, a diameter of 225 mm, a width of 35 mm and a Shore A hardness of 60. It is brought to bear on the surface of the aggregate specimens mounted on the road wheel with a total force of 390 N. The force of 390 N is normally achieved by a weight having a mass of approximately 11.0 kg attached to the end of the arm.
Two rubber tyres are required, one for coarse polishing with silicon carbide grit and the other for fine polishing with optical emery. When in use, the rubber tyre shall sit flat on the specimens and shall have minimum sideways movement and eccentricity. The tyre shall be discarded when it shows signs of irregular wear or its Shore A hardness falls outside the specified range or its diameter falls below 210 mm.
3.1.3 Both the road wheel and the solid rubber-tyred wheel must be mounted vertically, aligned accurately to each other and be free to rotate without play in the bearings. The following limits apply:
a) The axes of rotation of the two wheels in both the horizontal and vertical planes shall not be more than 20 minutes of arc out of parallel (1 mm in 200 mm).
Test Method Q203: Polished aggregate friction value
Materials Testing Manual - Part 6, Transport and Main Roads, November 2014 2 of 16
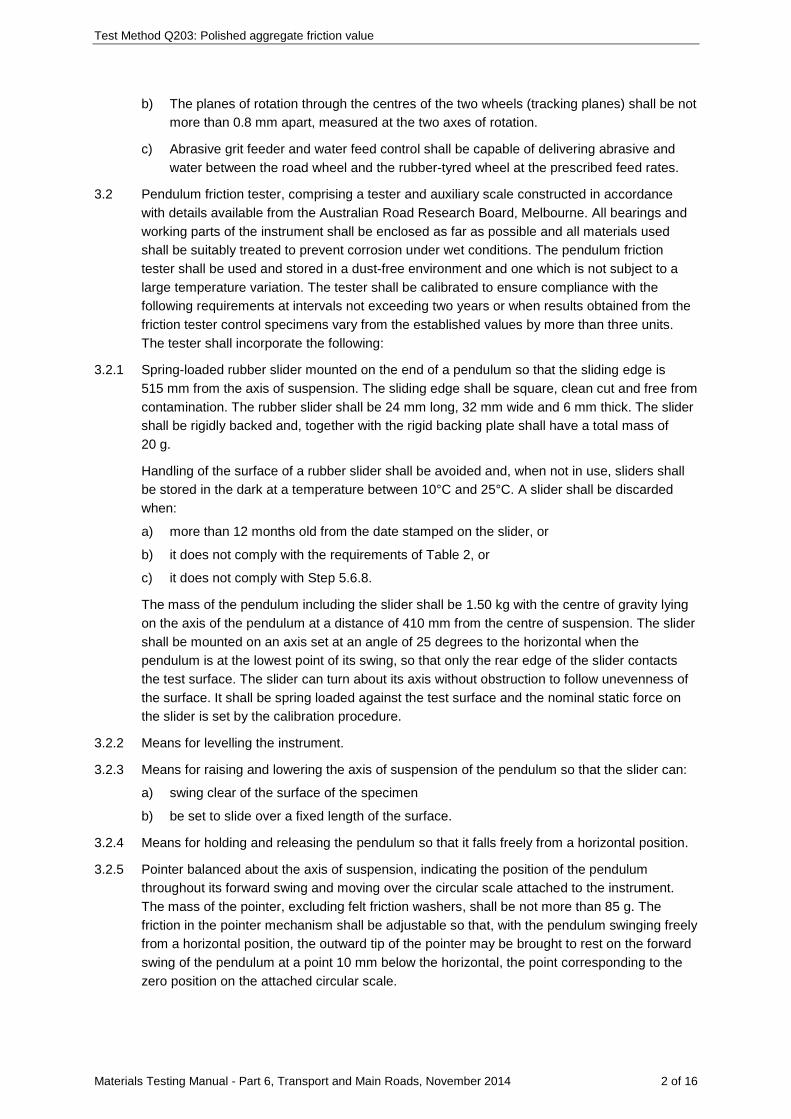
b) The planes of rotation through the centres of the two wheels (tracking planes) shall be not more than 0.8 mm apart, measured at the two axes of rotation.
c) Abrasive grit feeder and water feed control shall be capable of delivering abrasive and water between the road wheel and the rubber-tyred wheel at the prescribed feed rates.
3.2 Pendulum friction tester, comprising a tester and auxiliary scale constructed in accordance with details available from the Australian Road Research Board, Melbourne. All bearings and working parts of the instrument shall be enclosed as far as possible and all materials used shall be suitably treated to prevent corrosion under wet conditions. The pendulum friction tester shall be used and stored in a dust-free environment and one which is not subject to a large temperature variation. The tester shall be calibrated to ensure compliance with the following requirements at intervals not exceeding two years or when results obtained from the friction tester control specimens vary from the established values by more than three units. The tester shall incorporate the following:
3.2.1 Spring-loaded rubber slider mounted on the end of a pendulum so that the sliding edge is 515 mm from the axis of suspension. The sliding edge shall be square, clean cut and free from contamination. The rubber slider shall be 24 mm long, 32 mm wide and 6 mm thick. The slider shall be rigidly backed and, together with the rigid backing plate shall have a total mass of 20 g.
Handling of the surface of a rubber slider shall be avoided and, when not in use, sliders shall be stored in the dark at a temperature between 10°C and 25°C. A slider shall be discarded when:
a) more than 12 months old from the date stamped on the slider, or
b) it does not comply with the requirements of Table 2, or
c) it does not comply with Step 5.6.8.
The mass of the pendulum including the slider shall be 1.50 kg with the centre of gravity lying on the axis of the pendulum at a distance of 410 mm from the centre of suspension. The slider shall be mounted on an axis set at an angle of 25 degrees to the horizontal when the pendulum is at the lowest point of its swing, so that only the rear edge of the slider contacts the test surface. The slider can turn about its axis without obstruction to follow unevenness of the surface. It shall be spring loaded against the test surface and the nominal static force on the slider is set by the calibration procedure.
3.2.2 Means for levelling the instrument.
3.2.3 Means for raising and lowering the axis of suspension of the pendulum so that the slider can:
a) swing clear of the surface of the specimen
b) be set to slide over a fixed length of the surface.
3.2.4 Means for holding and releasing the pendulum so that it falls freely from a horizontal position.
3.2.5 Pointer balanced about the axis of suspension, indicating the position of the pendulum throughout its forward swing and moving over the circular scale attached to the instrument. The mass of the pointer, excluding felt friction washers, shall be not more than 85 g. The friction in the pointer mechanism shall be adjustable so that, with the pendulum swinging freely from a horizontal position, the outward tip of the pointer may be brought to rest on the forward swing of the pendulum at a point 10 mm below the horizontal, the point corresponding to the zero position on the attached circular scale.
Test Method Q203: Polished aggregate friction value
Materials Testing Manual - Part 6, Transport and Main Roads, November 2014 3 of 16
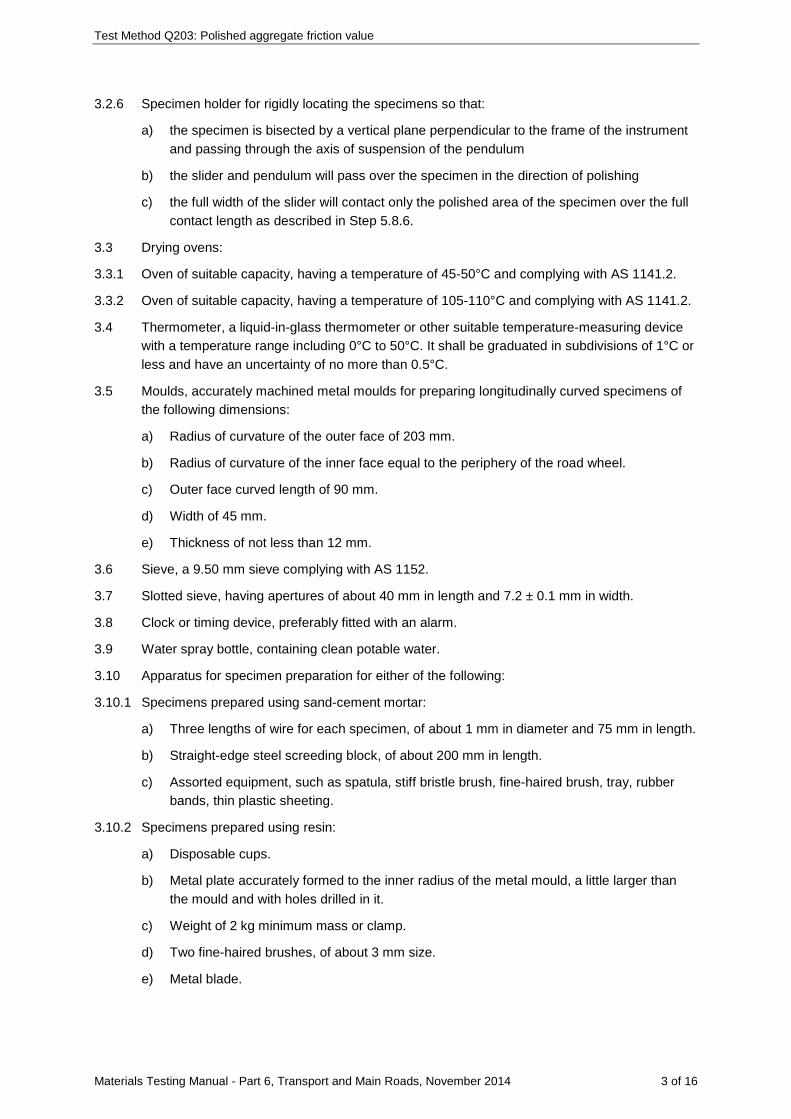
3.2.6 Specimen holder for rigidly locating the specimens so that:
a) the specimen is bisected by a vertical plane perpendicular to the frame of the instrument and passing through the axis of suspension of the pendulum
b) the slider and pendulum will pass over the specimen in the direction of polishing
c) the full width of the slider will contact only the polished area of the specimen over the full contact length as described in Step 5.8.6.
3.3 Drying ovens:
3.3.1 Oven of suitable capacity, having a temperature of 45-50°C and complying with AS 1141.2.
3.3.2 Oven of suitable capacity, having a temperature of 105-110°C and complying with AS 1141.2.
3.4 Thermometer, a liquid-in-glass thermometer or other suitable temperature-measuring device with a temperature range including 0°C to 50°C. It shall be graduated in subdivisions of 1°C or less and have an uncertainty of no more than 0.5°C.
3.5 Moulds, accurately machined metal moulds for preparing longitudinally curved specimens of the following dimensions:
a) Radius of curvature of the outer face of 203 mm.
b) Radius of curvature of the inner face equal to the periphery of the road wheel.
c) Outer face curved length of 90 mm.
d) Width of 45 mm.
e) Thickness of not less than 12 mm.
3.6 Sieve, a 9.50 mm sieve complying with AS 1152.
3.7 Slotted sieve, having apertures of about 40 mm in length and 7.2 ± 0.1 mm in width.
3.8 Clock or timing device, preferably fitted with an alarm.
3.9 Water spray bottle, containing clean potable water.
3.10 Apparatus for specimen preparation for either of the following:
3.10.1 Specimens prepared using sand-cement mortar:
a) Three lengths of wire for each specimen, of about 1 mm in diameter and 75 mm in length.
b) Straight-edge steel screeding block, of about 200 mm in length.
c) Assorted equipment, such as spatula, stiff bristle brush, fine-haired brush, tray, rubber bands, thin plastic sheeting.
3.10.2 Specimens prepared using resin:
a) Disposable cups.
b) Metal plate accurately formed to the inner radius of the metal mould, a little larger than the mould and with holes drilled in it.
c) Weight of 2 kg minimum mass or clamp.
d) Two fine-haired brushes, of about 3 mm size.
e) Metal blade.

Test Method Q203: Polished aggregate friction value
Materials Testing Manual - Part 6, Transport and Main Roads, November 2014 4 of 16
4 Materials
The following materials are required:
4.1 Reference aggregate, aggregate from a specified source for which the polished aggregate friction value is known to be within the range 48 to 54 or 43 to 49 (Note 8.1).
4.2 Black silicon carbide F320, oven dried at a minimum temperature of 105°C to a free flowing condition and complying with AS 4518.2 (Note 8.2).
4.3 Optical emery F600, oven dried at a minimum temperature of 105°C to a free flowing condition and complying with AS 4518.2 (Note 8.2).
4.4 Fine sand passing a 0.300 mm sieve.
4.5 Light oil (Note 8.2).
4.6 Materials for specimen preparation for either of the following:
4.6.1 Specimens prepared using sand-cement mortar:
a) Fresh high alumina cement (Note 8.2).
4.6.2 Specimens prepared using resin:
a) Polyester or epoxy resin and hardener (Note 8.2).
b) Solvent, such as a mixture of 90 per cent acetone and 10 per cent kerosene (by volume) to clean apparatus (Note 8.2).
5 Procedure
The procedure shall be as follows:
5.1 Test material preparation
5.1.1 Obtain a representative sample of the test material containing about 5 kg of material passing the 9.50 mm sieve.
5.1.2 Sieve the sample over the 9.50 mm sieve and discard the particles retained.
5.1.3 Sieve the material passing the 9.50 mm sieve over the slotted sieve and discard the material passing.
5.1.4 Wash the particles retained on the slotted sieve to remove surface dust and dry the particles at a temperature not exceeding 50°C.
5.2 Specimen preparation
5.2.1 Select the aggregate particles to be used in specimen preparation carefully so that the surface texture of the particles which are to be exposed to the polishing action of the tyre is typical of the average surface texture of the material under test. This shall be achieved as follows:
a) Sort sufficient of the aggregate particles prepared in Steps 5.1.1 to 5.1.4 to remove all particles having:
i. a very rough or very smooth surface texture, that is, texture exhibited by less than 5 per cent of the aggregate particles.
ii. a length greater than 20 mm.
iii. an inability to rest securely on their flattest face, that is, particles which rock when touched.

Test Method Q203: Polished aggregate friction value
Materials Testing Manual - Part 6, Transport and Main Roads, November 2014 5 of 16
b) Remove additional aggregate particles if necessary to ensure that, within the total number of particles rejected, there are equal numbers of roughly and smoothly textured particles.
c) Where the aggregate particles are derived from a non-homogeneous material, remove further particles if necessary to ensure that the proportional representation of the different materials in the selected and rejected particles is the same.
5.2.2 Place selected particles in the bottom of the mould with their flattest face downwards. Place the particles close together (almost touching) to form a stone mosaic but avoid regularity of pattern. About 35 to 50 particles will usually be required. For non-homogeneous materials, the proportional representation of the different materials within the specimen shall be the same as that determined in Step 5.2.1c).
5.2.3 Fill all interstices between the particles to roughly half of their depth with fine sand.
5.2.4 Complete specimen preparation using either sand-cement mortar or resin as follows:
a) Sand-cement mortar:
i. Spray the assembly with a fine spray of water until the sand is thoroughly wet.
ii. Lightly oil the internal surfaces of the mould to the level of the sand.
iii. Using equal portions by mass of fine sand and high alumina cement, prepare a sand-cement mortar, mixed with sufficient water to provide a free-flowing consistency so that the mortar is able to penetrate easily between the particles.
iv. Partially fill the mould with mortar, lay three pieces of wire longitudinally and evenly spaced in the mould as reinforcement and fill the mould to overflowing.
v. After the mortar has set sufficiently to be worked without tearing but firm enough to retain its shape when not under pressure (between 3 hours and 6 hours), use the steel block to screed the mortar so that the surface becomes smooth and level with the curved sides of the mould.
vi. Cover the surface of the mortar in the mould with a water saturated cloth and allow it to cure for at least 24 hours.
vii. Mark the sample number on the specimen and remove the specimen from the mould. Use a stiff bristle brush and running water to remove sand from the interstices between the particles. If mortar has penetrated through to the surface of the specimen, the mortar shall be completely removed or the specimen shall be discarded.
viii. Cure the specimen under water for about 4 days with the particle surface downwards.
b) Resin:
i. Level the sand in the mould with a fine-haired brush.
ii. Lightly oil the metal plate and top edges and all exposed internal surfaces of the mould.
iii. Mix the hardener and resin in a disposable cup in the proportions recommended by the manufacturer. The consistency of the mixture shall permit it to flow freely around the particles and, if necessary, the mixture may be thinned with the solvent.

Test Method Q203: Polished aggregate friction value
Materials Testing Manual - Part 6, Transport and Main Roads, November 2014 6 of 16
iv. Fill the mould to overflowing with the mixed resin. Immediately press the metal plate against the mould, squeezing the surplus resin out through the holes in the plate. Remove surplus resin using the metal blade.
v. To prevent distortion of the resin during setting, press the metal plate against the mould using the weight or clamp. Allow the resin to set and cool (about 30 minutes after mixing).
vi. Mark the sample number on the specimen and remove the specimen from the mould. Use a stiff bristle brush and running water to remove sand from the interstices between the particles. If resin has penetrated through to the surface of the specimen, the resin shall be completely removed or the specimen shall be discarded.
vii. Cure the specimen in air for at least 30 minutes.
5.2.5 Repeat Steps 5.2.2 to 5.2.4 to prepare four specimens for each sample and at least two reference specimens.
5.2.6 Clean the specimens thoroughly, soak them under water for 30 minutes and then test each specimen as follows:
a) Install a conditioned rubber slider on the friction tester, ensuring the correct positioning of the two washers and spring.
b) Raise the axis of the suspension of the pendulum so that it swings freely. Adjust the friction rings in the pointer mechanism so that, when the pendulum and pointer are released from the right hand horizontal position, the pointer will zero repeatedly.
c) Position the specimen in the specimen holder.
d) Check that the trailing edge of the slider is parallel to the minor axis of the polished area of the specimen when the pendulum hangs freely at the bottom of its swing.
e) Adjust the height of the axis of suspension of the pendulum so that the entire trailing edge of the slider is in contact with the polished area of the specimen while traversing the specimen surface. The trailing edge of the slider shall be in contact with the specimen over an arc length of 75 ± 1 mm while traversing the curved surface.
f) Return the pendulum to its horizontal position and move the pointer against its stop.
g) Wet the surface of the specimen using the water spray bottle.
h) Release the pendulum from its horizontal position and allow the pendulum and pointer to swing over the specimen. To avoid damage to the slider, catch the pendulum on its return swing, lift the slider and return the pendulum to the horizontal position.
i) Multiply the reading on the auxiliary scale by 100 and record the value. Move the pointer against its stop.
j) Repeat Steps 5.2.6 g) to 5.2.6 j) to obtain values from five successive swings. Successive swings of the pendulum should always show the same or a lower friction value. If the second, third, fourth or fifth swing shows a higher value than any of the preceding values, a fault is indicated and must be rectified before proceeding. Usually, the fault is an increased contact length between slider and specimen. Check the contact length and reset if necessary.
k) Calculate the average of the last three values recorded for each specimen and record this average as the specimen mean value.
Test Method Q203: Polished aggregate friction value
Materials Testing Manual - Part 6, Transport and Main Roads, November 2014 7 of 16
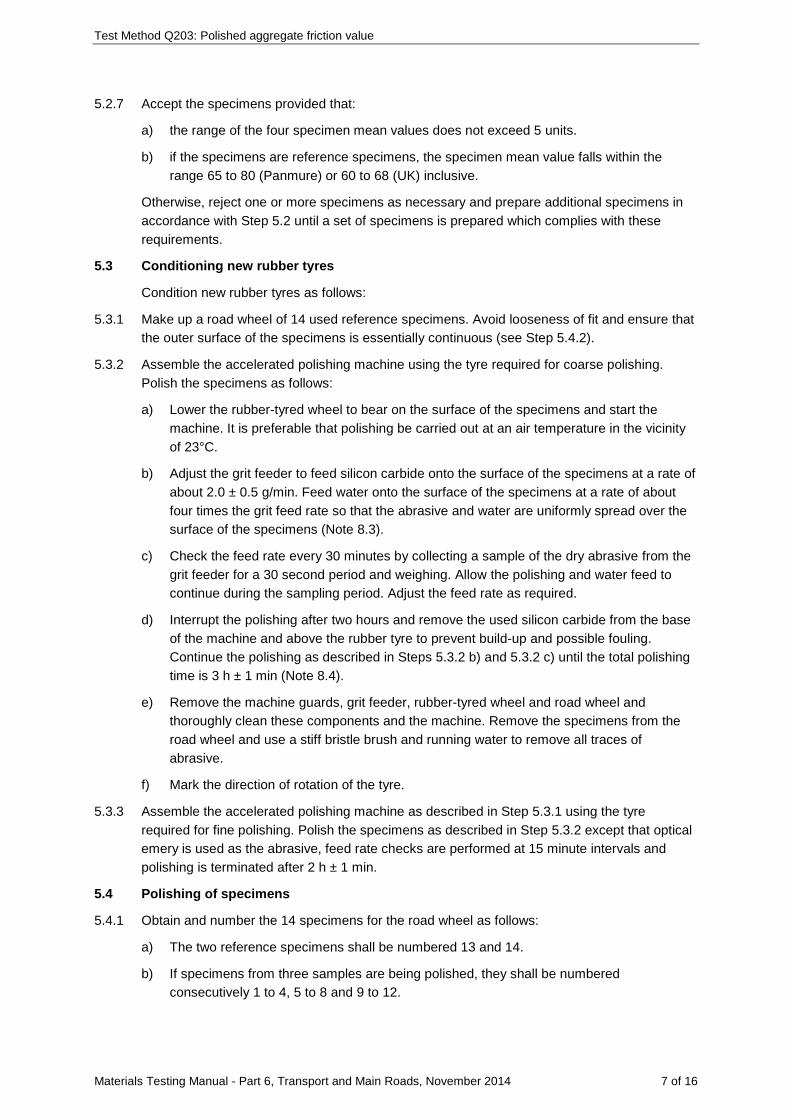
5.2.7 Accept the specimens provided that:
a) the range of the four specimen mean values does not exceed 5 units.
b) if the specimens are reference specimens, the specimen mean value falls within the range 65 to 80 (Panmure) or 60 to 68 (UK) inclusive.
Otherwise, reject one or more specimens as necessary and prepare additional specimens in accordance with Step 5.2 until a set of specimens is prepared which complies with these requirements.
5.3 Conditioning new rubber tyres
Condition new rubber tyres as follows:
5.3.1 Make up a road wheel of 14 used reference specimens. Avoid looseness of fit and ensure that the outer surface of the specimens is essentially continuous (see Step 5.4.2).
5.3.2 Assemble the accelerated polishing machine using the tyre required for coarse polishing. Polish the specimens as follows:
a) Lower the rubber-tyred wheel to bear on the surface of the specimens and start the machine. It is preferable that polishing be carried out at an air temperature in the vicinity of 23°C.
b) Adjust the grit feeder to feed silicon carbide onto the surface of the specimens at a rate of about 2.0 ± 0.5 g/min. Feed water onto the surface of the specimens at a rate of about four times the grit feed rate so that the abrasive and water are uniformly spread over the surface of the specimens (Note 8.3).
c) Check the feed rate every 30 minutes by collecting a sample of the dry abrasive from the grit feeder for a 30 second period and weighing. Allow the polishing and water feed to continue during the sampling period. Adjust the feed rate as required.
d) Interrupt the polishing after two hours and remove the used silicon carbide from the base of the machine and above the rubber tyre to prevent build-up and possible fouling. Continue the polishing as described in Steps 5.3.2 b) and 5.3.2 c) until the total polishing time is 3 h ± 1 min (Note 8.4).
e) Remove the machine guards, grit feeder, rubber-tyred wheel and road wheel and thoroughly clean these components and the machine. Remove the specimens from the road wheel and use a stiff bristle brush and running water to remove all traces of abrasive.
f) Mark the direction of rotation of the tyre.
5.3.3 Assemble the accelerated polishing machine as described in Step 5.3.1 using the tyre required for fine polishing. Polish the specimens as described in Step 5.3.2 except that optical emery is used as the abrasive, feed rate checks are performed at 15 minute intervals and polishing is terminated after 2 h ± 1 min.
5.4 Polishing of specimens
5.4.1 Obtain and number the 14 specimens for the road wheel as follows:
a) The two reference specimens shall be numbered 13 and 14.
b) If specimens from three samples are being polished, they shall be numbered consecutively 1 to 4, 5 to 8 and 9 to 12.

Test Method Q203: Polished aggregate friction value
Materials Testing Manual - Part 6, Transport and Main Roads, November 2014 8 of 16
c) If specimens from two samples are being polished, they shall be numbered consecutively 1 to 4 and 5 to 8.
d) If specimens from one sample are being polished, they shall be numbered consecutively 1 to 4.
e) If fewer than three samples are to be polished, an appropriate number of dummy specimens shall be used to make up the number (Note 8.5). When these are used, number them 9 to 12 or 5 to 12 depending on whether four or eight dummy specimens are required.
f) Mark each specimen on the underside surface with an arrow in the longitudinal direction of rotation of the tyre.
5.4.2 Clamp the 14 specimens around the periphery of the road wheel in the following order and with the arrows pointing in the direction of road wheel rotation:
13, 4, 5, 8, 7, 1, 10, 14, 3, 11, 12, 2, 6, 9.
If there is any looseness of fit, insert strips of thin plastic sheeting or similar material between adjacent specimens and between the underside of the specimens and the periphery of the road wheel as required. The outer surface of the specimens must form an essentially continuous strip of particles with a periphery of 406 mm diameter, upon which the rubber-tyred wheel shall ride freely without any bumping or slipping.
5.4.3 Assemble the accelerated polishing machine with the tyre conditioned with coarse abrasive, ensuring that the tyre rotates in the direction marked on its side during conditioning.
5.4.4 Lower the rubber-tyred wheel to bear on the surface of the specimens and start the machine. It is preferable that polishing be carried out at an air temperature in the vicinity of 23ºC.
5.4.5 Adjust the grit feeder to feed silicon carbide onto the surface of the specimens at a rate of about 2.0 ± 0.5 g/min. Feed water onto the surface of the specimens at a rate of about four times the grit feed rate so that the abrasive and water are uniformly spread over the surface of the specimens (Note 8.3).
5.4.6 Check the feed rate every 30 minutes by collecting a sample of the dry abrasive from the grit feeder for a 30 second period and weighing. Allow the polishing and water feed to continue during the sampling period. Adjust the feed rate as required.
5.4.7 Interrupt the polishing after two hours and remove the used silicon carbide from the base of the machine and above the rubber tyre to prevent build-up and possible fouling. Continue the polishing as described in Steps 5.4.5 and 5.4.6 until the total polishing time is 3 h ± 1 min (Note 8.4).
5.4.8 Remove the machine guards, grit feeder, rubber-tyred wheel and road wheel and thoroughly clean these components and the machine. Remove the specimens from the road wheel and use a stiff bristle brush and running water to remove all traces of abrasive.
5.4.9 Repeat Steps 5.4.2 to 5.4.8 except that optical emery is used as the abrasive, feed rate checks are performed at 15 minute intervals and polishing is terminated after 2 h ± 1 min (Note 8.6).
5.4.10 Soak all specimens face downwards under water at a temperature of 23 ± 2ºC for at least 30 minutes. At no time prior to friction testing shall test specimens or reference specimens be allowed to dry out.

Test Method Q203: Polished aggregate friction value
Materials Testing Manual - Part 6, Transport and Main Roads, November 2014 9 of 16
5.5 Adjusting the friction tester equipment
5.5.1 Bring the pendulum apparatus, the contents of the water spray bottle and the temperature of the room in which friction testing is to be carried out to 23 ± 2ºC at least two hours before friction testing and maintain at this temperature until testing is completed. Record the room temperature at the time of testing. It is desirable that this temperature requirement is met. If for any reason this cannot be achieved, the results may be corrected in accordance with Step 6.2.3.
5.5.2 Mount the friction tester on its base and adjust the levelling screws so that the levelling bubble is centred and the tester is appropriately aligned with the specimen.
5.6 Conditioning rubber sliders
Sliders are dry conditioned before their first use and may be reused provided they are wet conditioned and checked as detailed in Steps 5.6.6 to 5.6.8 (Note 8.7 and 8.8). Dry condition two new rubber sliders on the day of the test as follows:
5.6.1 Select a conditioning specimen (Note 8.9).
5.6.2 Install the first rubber slider on the friction tester, ensuring the correct positioning of the two washers and spring.
5.6.3 Perform dry conditioning of the first rubber slider as follows:
a) Raise the axis of the suspension of the pendulum so that it swings freely. Adjust the friction rings in the pointer mechanism so that, when the pendulum and pointer are released from the right hand horizontal position, the pointer will zero repeatedly.
b) Position the specimen in the specimen holder so that the slider traverses the specimen against the direction of the arrow.
c) Check that the trailing edge of the slider is parallel to the minor axis of the polished area of the specimen when the pendulum hangs freely at the bottom of its swing.
d) Adjust the height of the axis of suspension of the pendulum so that the entire trailing edge of the slider is in contact with the polished area of the specimen while traversing the specimen surface. The trailing edge of the slider shall be in contact with the specimen over an arc length of 75 ± 1 mm while traversing the curved surface.
e) Return the pendulum to its horizontal position and move the pointer against its stop.
f) Release the pendulum from its horizontal position and allow the pendulum and pointer to swing over the specimen. To avoid damage to the slider, catch the pendulum on its return swing, lift the slider and return the pendulum to the horizontal position.
g) Perform Step 5.6.3 f) a further four times.
5.6.4 Repeat Steps 5.6.2 to 5.6.3 using the second rubber slider.
5.6.5 Install the first rubber slider on the friction tester, ensuring the correct positioning of the two washers and spring.
5.6.6 Perform wet conditioning of the first rubber slider as follows:
a) Raise the axis of the suspension of the pendulum so that it swings freely. Adjust the friction rings in the pointer mechanism so that, when the pendulum and pointer are released from the right hand horizontal position, the pointer will zero repeatedly.

Test Method Q203: Polished aggregate friction value
Materials Testing Manual - Part 6, Transport and Main Roads, November 2014 10 of 16
b) Position the specimen in the specimen holder so that the slider traverses the specimen against the direction of the arrow.
c) Check that the trailing edge of the slider is parallel to the minor axis of the polished area of the specimen when the pendulum hangs freely at the bottom of its swing.
d) Adjust the height of the axis of suspension of the pendulum so that the entire trailing edge of the slider is in contact with the polished area of the specimen while traversing the specimen surface. The trailing edge of the slider shall be in contact with the specimen over an arc length of 75 ± 1 mm while traversing the curved surface.
e) Return the pendulum to its horizontal position and move the pointer against its stop.
f) Wet the surface of the specimen using the water spray bottle.
g) Release the pendulum from its horizontal position and allow the pendulum and pointer to swing over the specimen. To avoid damage to the slider, catch the pendulum on its return swing, lift the slider and return the pendulum to the horizontal position.
h) Repeat Step 5.6.6 g) until the slider has moved 20 times across the wet conditioning specimen.
i) Note the readings from the last five swings, multiply each reading by 100 and record these values. Calculate the average of the last three values and record this average as the slider mean value.
5.6.7 Repeat Steps 5.6.5 to 5.6.6 for the second rubber slider.
5.6.8 Compare the slider mean values with the minimum acceptable value of 48 (Panmure) or 43 (UK) and proceed as follows:
a) If the slider mean values for both sliders are not less than 48 (Panmure) or 43 (UK) and the two slider values differ by no more than two units, these sliders may be used in friction testing. If the slider values differ by more that two units, additional sliders shall be conditioned until a pair of sliders complying with these requirements is available.
b) If the slider mean value for one of the sliders is less than 48 (Panmure) or 43 (UK), the fault is assumed to be in the slider. Reject this slider and condition a replacement slider.
c) If the slider mean values for both sliders are less than 48 (Panmure) or 43 (UK), the fault may lie with either the conditioning specimen or the friction tester. Reject the conditioning specimen and substitute a recently prepared conditioning specimen. Condition either the other edge of the sliders or new sliders if the other edge has previously been used, paying particular attention to the setting of the contact length of the slider with the specimen.
d) If after a second conditioning run, both sliders have mean values less than 48 (Panmure) or 43 (UK), the fault is assumed to be in the friction tester or polishing procedures. Both slider edges shall not be used and testing shall not proceed until the fault is identified and remedied.
5.7 Friction tester checking
5.7.1 Soak the set of friction tester control specimens in water at a temperature of 23 ± 2°C for a period of at least 30 minutes (Note 8.10).

Test Method Q203: Polished aggregate friction value
Materials Testing Manual - Part 6, Transport and Main Roads, November 2014 11 of 16
5.7.2 Perform the checking of the friction tester using the first of the conditioned rubber sliders as follows:
a) Install a conditioned rubber slider on the friction tester, ensuring the correct positioning of the two washers and spring.
b) Raise the axis of the suspension of the pendulum so that it swings freely. Adjust the friction rings in the pointer mechanism so that, when the pendulum and pointer are released from the right hand horizontal position, the pointer will zero repeatedly.
c) Select a control specimen.
d) Position the specimen in the specimen holder so that the slider traverses the specimen against the direction of the arrow.
e) Check that the trailing edge of the slider is parallel to the minor axis of the polished area of the specimen when the pendulum hangs freely at the bottom of its swing.
f) Adjust the height of the axis of suspension of the pendulum so that the entire trailing edge of the slider is in contact with the polished area of the specimen while traversing the specimen surface. The trailing edge of the slider shall be in contact with the specimen over an arc length of 75 ± 1 mm while traversing the curved surface.
g) Return the pendulum to its horizontal position and move the pointer against its stop.
h) Wet the surface of the specimen using the water spray bottle.
i) Release the pendulum from its horizontal position and allow the pendulum and pointer to swing over the specimen. To avoid damage to the slider, catch the pendulum on its return swing, lift the slider and return the pendulum to the horizontal position.
j) Multiply the reading on the auxiliary scale by 100 and record the value. Move the pointer against its stop.
5.7.3 Repeat Steps 5.7.2 h) to 5.7.2 j) to obtain values from five successive swings. Successive swings of the pendulum should always show the same or a lower friction value. If the second, third, fourth or fifth swing shows a higher value than any of the preceding values, a fault is indicated and must be rectified before proceeding. Usually, the fault is an increased contact length between slider and specimen. Check the contact length and reset if necessary.
5.7.4 Repeat Step 5.7.2 c) to 5.7.3 for the remaining control specimens.
5.7.5 Repeat Steps 5.7.2 to 5.7.4 for the second of the newly conditioned rubber sliders.
5.7.6 Record the air temperature to the nearest 1ºC ( 1T ).
5.7.7 Calculate and correct the specimen mean value as detailed in Step 6.1 for each control specimen.
5.7.8 If any one of the friction tester control specimens has a corrected specimen mean value which is more than two units lower or one unit higher that its known value, discontinue testing until the cause of the discrepancy has been traced.
5.8 Friction testing
Perform friction testing of each specimen at a temperature of 23 ± 2ºC as follows:
5.8.1 Install a conditioned rubber slider on the friction tester, ensuring the correct positioning of the two washers and spring.
Test Method Q203: Polished aggregate friction value
Materials Testing Manual - Part 6, Transport and Main Roads, November 2014 12 of 16
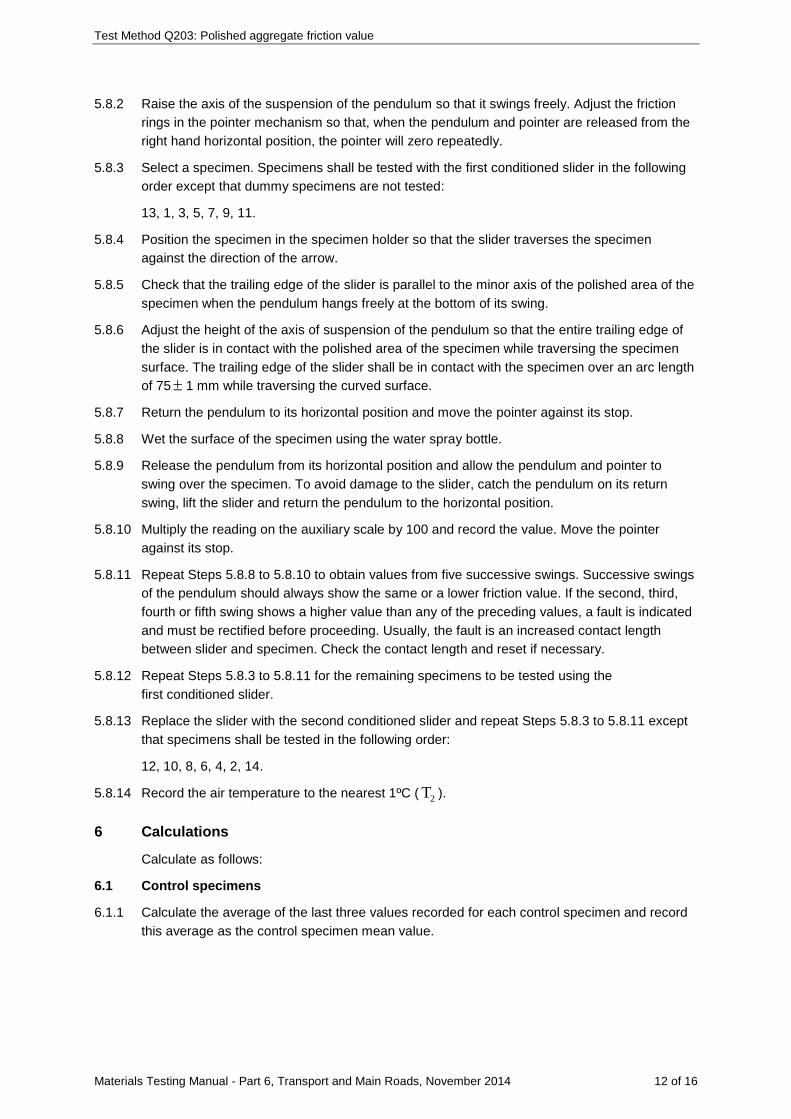
5.8.2 Raise the axis of the suspension of the pendulum so that it swings freely. Adjust the friction rings in the pointer mechanism so that, when the pendulum and pointer are released from the right hand horizontal position, the pointer will zero repeatedly.
5.8.3 Select a specimen. Specimens shall be tested with the first conditioned slider in the following order except that dummy specimens are not tested:
13, 1, 3, 5, 7, 9, 11.
5.8.4 Position the specimen in the specimen holder so that the slider traverses the specimen against the direction of the arrow.
5.8.5 Check that the trailing edge of the slider is parallel to the minor axis of the polished area of the specimen when the pendulum hangs freely at the bottom of its swing.
5.8.6 Adjust the height of the axis of suspension of the pendulum so that the entire trailing edge of the slider is in contact with the polished area of the specimen while traversing the specimen surface. The trailing edge of the slider shall be in contact with the specimen over an arc length of 75± 1 mm while traversing the curved surface.
5.8.7 Return the pendulum to its horizontal position and move the pointer against its stop.
5.8.8 Wet the surface of the specimen using the water spray bottle.
5.8.9 Release the pendulum from its horizontal position and allow the pendulum and pointer to swing over the specimen. To avoid damage to the slider, catch the pendulum on its return swing, lift the slider and return the pendulum to the horizontal position.
5.8.10 Multiply the reading on the auxiliary scale by 100 and record the value. Move the pointer against its stop.
5.8.11 Repeat Steps 5.8.8 to 5.8.10 to obtain values from five successive swings. Successive swings of the pendulum should always show the same or a lower friction value. If the second, third, fourth or fifth swing shows a higher value than any of the preceding values, a fault is indicated and must be rectified before proceeding. Usually, the fault is an increased contact length between slider and specimen. Check the contact length and reset if necessary.
5.8.12 Repeat Steps 5.8.3 to 5.8.11 for the remaining specimens to be tested using the first conditioned slider.
5.8.13 Replace the slider with the second conditioned slider and repeat Steps 5.8.3 to 5.8.11 except that specimens shall be tested in the following order:
12, 10, 8, 6, 4, 2, 14.
5.8.14 Record the air temperature to the nearest 1ºC ( 2T ).
6 Calculations
Calculate as follows:
6.1 Control specimens
6.1.1 Calculate the average of the last three values recorded for each control specimen and record this average as the control specimen mean value.

Test Method Q203: Polished aggregate friction value
Materials Testing Manual - Part 6, Transport and Main Roads, November 2014 13 of 16
6.1.2 Correct each control specimen mean value to 23ºC:
1C T
T +100CSM =CSM123
where CCSM = control specimen mean value corrected to 23ºC
TCSM = control specimen mean value at the test temperature
1T = recorded air temperature (ºC)
6.2 Friction testing
6.2.1 Calculate the average of the last three values recorded for each specimen and record this average as the specimen mean value.
6.2.2 Calculate the average of the specimen mean values for each sample and record this value as the sample mean value to the nearest whole number. Reject any sample mean value for which the range of the specimen mean values exceeds five.
6.2.3 Correct each sample mean value to 23ºC:
2C T
T +100SMV =SMV123
where CSMV = sample mean value corrected to 23ºC
TSMV = sample mean value at the test temperature
2T = recorded air temperature (ºC)
6.2.4 Reject all sample mean values from the test if the value of SMVC for the reference aggregate falls outside the range of 48 to 54 (Panmure) or 43 to 49 (UK). New specimens shall then be prepared, polished and tested (Note 8.11).
6.2.5 Calculate the PAFV for each sample as follows:
C R RPAFV=SMV +PFV -SMV
where PAFV = polished aggregate friction value
RPFV = polished friction value of reference aggregate, Panmure = 51 and UK
= 46
CSMV = sample mean value of the test aggregate corrected to 23ºC
RSMV = sample mean value of the reference aggregate corrected to 23ºC
7 Reporting
Report the following values and general information:
7.1 The PAFV for the test sample to the nearest whole unit, for example PAFV=39.
7.2 The sample mean value corrected to a temperature of 23ºC for the test sample prior to polishing.
7.3 Source of reference aggregate (Panmure or UK).

Test Method Q203: Polished aggregate friction value
Materials Testing Manual - Part 6, Transport and Main Roads, November 2014 14 of 16
7.4 The PAFV and the initial sample mean value for the reference aggregate (Panmure or UK).
7.5 The air temperature at the time when the friction test was performed.
8 Notes on method
8.1 Reference specimens incorporating reference aggregate are used in the conditioning of a new tyre and as reference specimens in each test. It is convenient to prepare a number of reference specimens at the one time, storing those not immediately required. The reference aggregate may be either:
8.1.1 Australian Standard Reference Aggregate, known as Panmure basalt, which is available from either Australian Road Research Board, Melbourne or the Department of Transport and Main Roads, Herston, Queensland.
8.1.2 UK Reference Aggregate which is available from Wessex Engineering, United Kingdom.
8.2 Before handling silicon carbide, optical emery, oil, high alumina cement, polyester resin, epoxy resin, acetone or kerosene, the operator must consult the relevant Safety Data Sheet (SDS). Specimen moulds should only be prepared in a well ventilated room.
8.3 Silicon carbide or optical emery as appropriate is fed into a chute via a suitable feed mechanism and water is fed by gravity flow at an adjustable rate into the same chute. The feed rates and the positioning of the chute shall be such that there shall be no clogging of the chute and the mixture of abrasive and water is continuously fed directly onto the road wheel near, and ahead of, the point of contact with the rubber -tyred wheel in such a way that the abrasive and water are uniformly spread over the surface of the specimens when contact is made with the tyre.
8.4 If it is not possible for all the procedures involving polishing, soaking and testing to be carried out in a single working day, the preferred point to interrupt the procedure is after polishing with silicon carbide. Place the specimens under water overnight and commence the following day by polishing with optical emery and continue with soaking and testing without further interruptions.
8.5 Dummy specimens are specimens which have been polished and tested and would otherwise be discarded. They are used to make up the number of specimens to fourteen when fewer than twelve test specimens are to be polished.
8.6 Thorough cleaning of the specimens is often more difficult after polishing with optical emery than after polishing with silicon carbide, but it is even more important because the slightest trace of optical emery on or between the particles will cause a lowering of the polished aggregate friction value.
8.7 Two sliders are used in a test run to even out the effects of wear on a slider during a run and to facilitate differentiation between a faulty slider and a defective instrument. Each slider is reversible and has two edges which can be conditioned for use. Both edges may be used but not for the same test run and each edge is used on only one test run.
8.8 To commission new sliders, it is desirable to have access to reference specimens already tested and validated. In the absence of these, on the very first run, one of the specimens incorporating reference aggregate will be required to act as a conditioning specimen and this must not be soaked after polishing. Also in this case, if the specimen mean value of the conditioning specimen is below 48 (Panmure) or 43 (UK) or the sample mean value for the reference specimens is not within the range 48 to 54 (Panmure) or 43 to 49 (UK), it is necessary to discard the two sliders and all specimens from the run.

Test Method Q203: Polished aggregate friction value
Materials Testing Manual - Part 6, Transport and Main Roads, November 2014 15 of 16
8.9 Conditioning specimens are specimens incorporating the reference aggregate which are prepared and polished in the same manner but not necessarily at the same time as test specimens. They are used to condition new rubber sliders for use in the friction tester. Reference specimens from a previous test run may be used provided that their PAFV is not less than 48 (Panmure) or 43 (UK).
8.10 Friction tester control specimens are a set of at least three previously used specimens of known values within the range of PAFV from 40 to 70.
8.11 In the event that the sample mean value of the reference specimens consistently falls outside the range of 48 to 54 (Panmure) or 43 to 49 (UK), attention should be paid to the air temperature at which the polishing is carried out (preferably 23ºC) in the vicinity of the polishing machine.
Table 1 – Dimensions and tolerances for PAFV apparatus
Apparatus Dimension Tolerance
Road wheel
Speed (revolutions / min) 320 ± 5
Solid rubber-tyred wheel
Diameter (mm) 225 ± 2
Width (mm) 35 +2, -0
Hardness (Shore A) 60 ± 5
Bearing force (N) 390 ± 5
Pendulum friction tester
Distance of sliding edge from axis of suspension (mm) 515 ± 2
Length of rubber slider (mm) 24 ± 1
Width of rubber slider (mm) 32 ± 1
Thickness of rubber slider (mm) 6 ± 1
Mass of rubber slider and backing plate (g) 20 ± 5
Mass of slider and pendulum (kg) 1.50 ± 0.03
Distance from centre of gravity of pendulum to the centre of suspension (mm)
410 ± 5
Angle of slider to horizontal at lowest point of swing (°) 25 ± 1
Mass of pointer (g) 85 maximum
Moulds
Thickness of specimen produced (mm) 12 minimum
Slotted sieve
Width of apertures (mm) 7.2 ± 0.1
Test Method Q203: Polished aggregate friction value
Materials Testing Manual - Part 6, Transport and Main Roads, November 2014 16 of 16
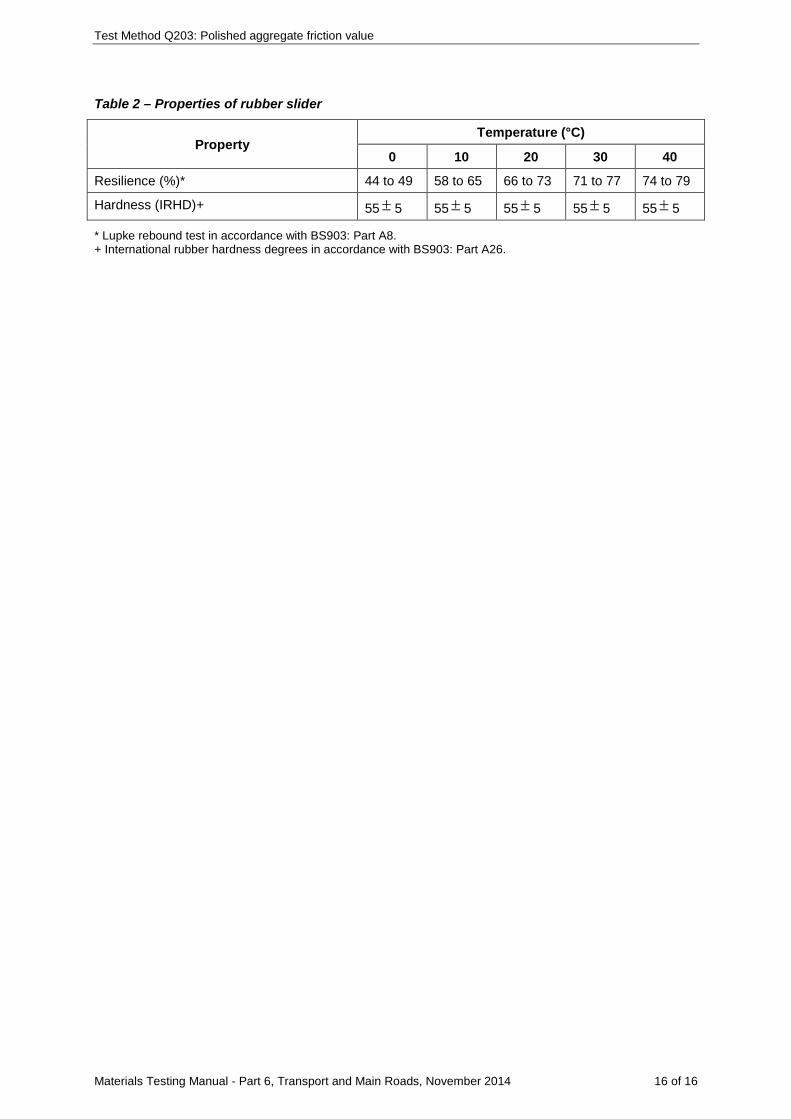
Table 2 – Properties of rubber slider
Property Temperature (°C)
0 10 20 30 40
Resilience (%)* 44 to 49 58 to 65 66 to 73 71 to 77 74 to 79
Hardness (IRHD)+ 55 ± 5 55± 5 55± 5 55± 5 55± 5
* Lupke rebound test in accordance with BS903: Part A8. + International rubber hardness degrees in accordance with BS903: Part A26.

Materials Testing Manual - Part 6, Transport and Main Roads, November 2014 1 of 6
Test Method Q205A: Ten per cent fines value of aggregate - dry
1 Source
This method is based on AS 1141.22: Wet/dry strength variation. There are some minor procedural differences and the option for duplicate testing has been removed.
2 Scope
This method describes the procedure for the determination of the crushing force which, when applied to a known mass of dry coarse aggregate, will produce fines amounting to 10 per cent of the original mass.
The test is normally performed on aggregate passing a 13.20 mm sieve and retained on a 9.50 mm sieve but may be carried out on other size fractions. However, it is not intended that the test be performed on material retained on a 26.5 mm sieve.
3 Apparatus
Where appropriate, the working tolerances of particular apparatus are contained in Table 1 and AS 1141.22 Figure 1.
The following apparatus is required:
3.1 For aggregate of test size fraction requiring a 150 mm diameter test cylinder (Table 2):
3.1.1 Test cylinder, open-ended steel cylinder, 150 mm diameter, internal depth of 135 mm and wall thickness of 15 mm.
3.1.2 Plunger, steel plunger with a tapered piston having a bottom diameter of 148 mm, top diameter of 146 mm and depth of 30 mm. The piston is mounted on a stem 130 mm diameter with a combined length of the piston and stem of 115 mm. The stem should include a 20 mm diameter hole for lifting of the plunger from within the cylinder.
3.1.3 Baseplate, steel baseplate, 220 mm diameter and thickness of 7.5 mm.
3.1.4 Measuring cylinder, steel cylindrical measure of internal diameter of 115 mm and internal depth of 180 mm.
3.2 For aggregate of test size fraction requiring a 75 mm diameter test cylinder (Table 2):
3.2.1 Test cylinder, open-ended steel cylinder, 75 mm diameter, internal depth of 77.5 mm and wall thickness of 8 mm.
3.2.2 Plunger, steel plunger with a tapered piston having a bottom diameter of 74 mm, top diameter of 72 mm and depth of 20 mm. The piston is mounted on a stem 55 mm diameter with a combined length of the piston and stem of 72.5 mm. The stem should include a 10 mm diameter hole for lifting of the plunger from within the cylinder.
3.2.3 Baseplate, steel baseplate, 115 mm diameter and thickness of 7.5 mm.
3.2.4 Measuring cylinder, steel measure, internal diameter of 60 mm and internal depth of 90 mm.
3.3 Drying oven of suitable capacity, having a temperature of 105-110ºC and complying with AS 1289.0.
3.4 Sieves:
3.4.1 Perforated plate, 26.5 mm, 19.0 mm, 13.20 mm, 9.50 mm, 6.70 mm and 4.75 mm complying with AS 1152.

Test Method Q205A: Ten per cent fines value of aggregate - dry
Materials Testing Manual - Part 6, Transport and Main Roads, November 2014 2 of 6
3.4.2 Woven wire, 3.35 mm, 2.36 mm, 1.70 mm, 1.18 mm, 0.850 mm and 0.600 mm, as required, complying with AS 1152.
3.5 Mallet - rubber mallet with face about 75 mm diameter, mass 1100 g and handle length about 300 mm.
3.6 Compression machine, a Class A compression machine of at least 500 kN capacity and able to apply the required load at a uniform rate of application.
3.7 Balance of suitable capacity, with a resolution of at least 0.1 g and with a limit of performance within the range of ± 0.5 g.
3.8 Steel straightedge, about 300 mm long.
4 Procedure
The procedure shall be as follows:
4.1 Preparation
4.1.1 Prepare the bulk sample as detailed in Section 5 of Test Method Q101 to produce a representative sample of appropriate size.
4.1.2 Further prepare the sample to produce sufficient washed materials of the size and quantity specified in Table 2 as detailed in Test Method Q101, Subsection 6.5 for specified fraction subsamples.
4.1.3 Place the washed sample in the drying oven, dry to a constant mass (Note 7.1) and allow to cool to room temperature.
4.2 Mass of test portion
4.2.1 Select the appropriate measuring cylinder (measure) for the test size fraction from Table 2.
4.2.2 Obtain one representative test portion from the specified fraction subsample.
4.2.3 Slowly fill the measure to about one-third of its capacity by pouring the aggregate from approximately 100 mm above the measure.
4.2.4 Compact the aggregate in the measure by tapping the measure with 25 blows of the rubber mallet evenly distributed around the circumference at the level of the aggregate.
4.2.5 Repeat Steps 4.2.3 and 4.2.4 for two further layers of aggregate.
4.2.6 Top up the measure if necessary and level the surface with a straightedge.
4.2.7 Determine the mass of aggregate in the measure ( 1m ).
4.2.8 Obtain at least three representative test portions of mass 1m from the specified fraction
subsample (Note 7.2).
4.3 Testing
4.3.1 Position the test cylinder on the baseplate and place one of the test portions in the cylinder using the method detailed in Steps 4.2.3 to 4.2.5.
4.3.2 Level the surface of the aggregate and insert the plunger so that it rests horizontally on the surface of the aggregate, taking care to ensure the plunger does not jam in the cylinder.
4.3.3 Place the assembled cylinder, test portion and plunger in position between the platens of the compression testing machine.

Test Method Q205A: Ten per cent fines value of aggregate - dry
Materials Testing Manual - Part 6, Transport and Main Roads, November 2014 3 of 6
4.3.4 Estimate the approximate force to produce 10 per cent fines for the particular aggregate type from previous experience with the material type. Use Table 3 as a guide to strengths typically expected (Note 7.3). Where the test portion size fraction requires the use of the smaller 75 mm test mould, then the expected force should be divided by four.
4.3.5 Apply the force at a uniform rate such that the required force is applied in 10 minutes. Record the maximum force applied to the nearest kilonewton ( 1 2f ,f ). If the smaller 75 mm mould has
been used for the test, then multiply the maximum force applied by four and record to the nearest kilonewton.
4.3.6 Release the force and remove the cylinder assembly from the compression machine.
4.3.7 Remove the plunger from the cylinder and the whole of the test portion, without deliberate breaking of the particles, and place in a suitable container avoiding loss of fines.
4.3.8 Separate the fines in the test portion using the appropriate separating sieve listed in Table 2 for the size fraction tested.
4.3.9 Determine the mass of the material retained by the separating sieve ( 2m ).
4.3.10 Calculate the percentage of fines ( 1 2P , P ) produced during the test as detailed in Step 5.1.
4.3.11 The percentage of fines should normally fall within the range 7.5 per cent to 12.5 per cent. If it does not, take a new test portion and perform a further test as detailed in Steps 4.3.2 to 4.3.10 adjusting the force applied in 10 minutes as required to bring the percentage of fines within the range of 7.5 per cent to 12.5 per cent (Notes 7.3, 7.4 and 7.5).
4.3.12 Repeat Steps 4.3.2 to 4.3.12 with another test portion at a different applied force to produce a percentage fines value ( 1 2P , P ) within the range of 7.5 per cent to 12.5 per cent, but above
10 per cent if the result on the previous portion was less than 10 per cent or vice versa (Notes 7.3, 7.4 and 7.5).
5 Calculations
Calculate as follows:
5.1 The percentage of fines produced during the test as follows:
1 2i
1
m -mP = 100m
where iP = percentage of fines (%)
1m = mass of test portion (g)
2m = mass of material retained on separating sieve (g)
5.2 The dry ten per cent fines value as follows:
1 2 11
2 1
(10-P )(f -f )D = f +P -P
where D = dry ten per cent fines value (%)
1f = applied force to produce a percentage of fines within the range of 7.5
to 10.0 per cent (kN)
Test Method Q205A: Ten per cent fines value of aggregate - dry
Materials Testing Manual - Part 6, Transport and Main Roads, November 2014 4 of 6
1P = percentage of fines produced by applied force 1f
2f = applied force to produce a percentage of fines within the range of 10.0
to 12.5 per cent (kN)
2P = percentage of fines produced by applied force 2f
6 Report
Report the following values and general information:
6.1 The nature of the bulk sample (crushed rock, spalls, drill core) tested.
6.2 The nominal size of the bulk sample (mm).
6.3 The size fraction tested (mm).
6.4 The dry ten per cent fines value to the nearest 1 kN.
7 Notes on method
7.1 The fraction is considered to have reached a constant mass when the difference between successive weighings, after a further 1 hour drying at 105-110°C, is not more than 1 percent of the total of the previous moisture losses.
7.2 The aggregate used in Subsection 4.2 to determine the mass of test portion may be used as a test portion if no significant breakdown has occurred during tapping. If the material is suspect the amount of breakdown can be checked by separating the aggregate on the nominated separating sieve (Table 2). If more than 0.2 per cent passes the sieve then the material from the measuring cylinder should be discarded.
7.3 An indication of the force required to produce ten per cent fines can be estimated from:
14xF = P + 4
where F = force required to produce 10 per cent fines
x = maximum force of test (kN)
P = percentage fines produced from a force of x kN
7.4 If a result of 10.0 per cent is obtained, take a new test portion and perform a further test as detailed in Steps 4.3.2 to 4.3.10 adjusting the force applied in 10 minutes as required to bring the percentage of fines within the range of 7.5 per cent to less than 10.0 per cent or within the range of 12.5 to greater than 10.0 per cent as appropriate.
7.5 When calculating the ten per cent fines value in accordance with the procedures described, the value of 1f should be less than the value of 2f . If not, then the test be repeated using fresh
test portions and the procedure checked to ensure all requirements have been complied with, such as the plunger moves freely in the cylinder.
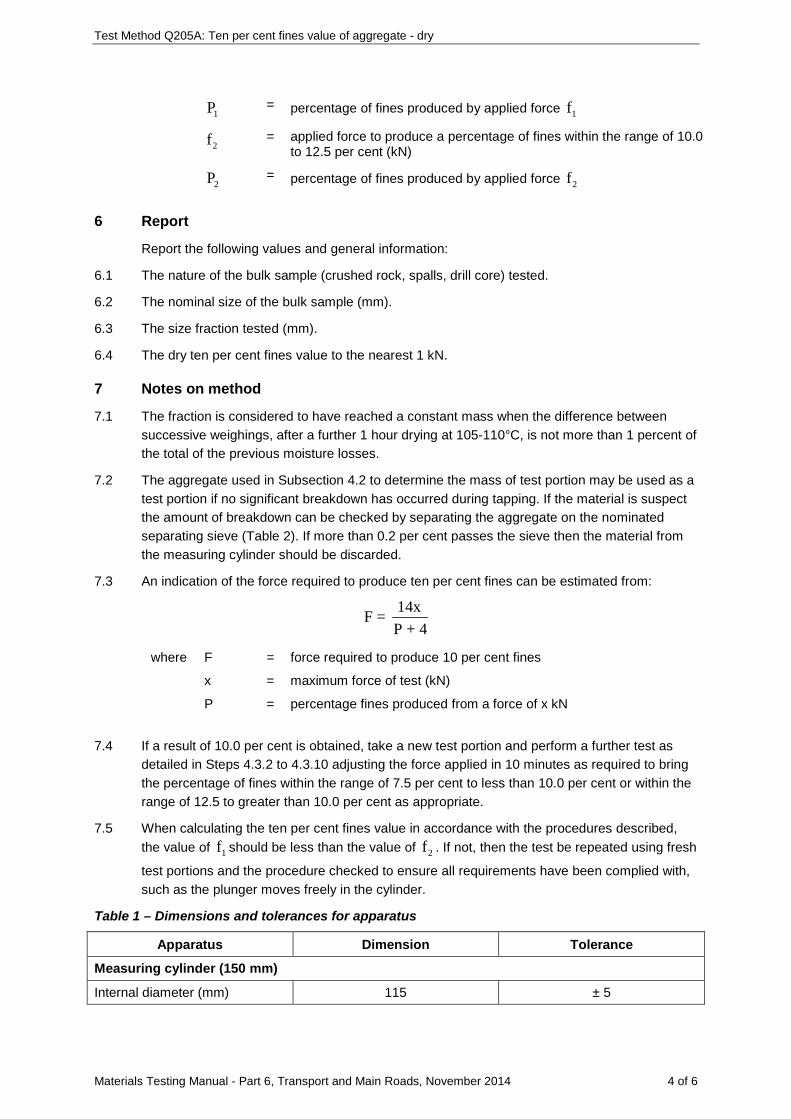
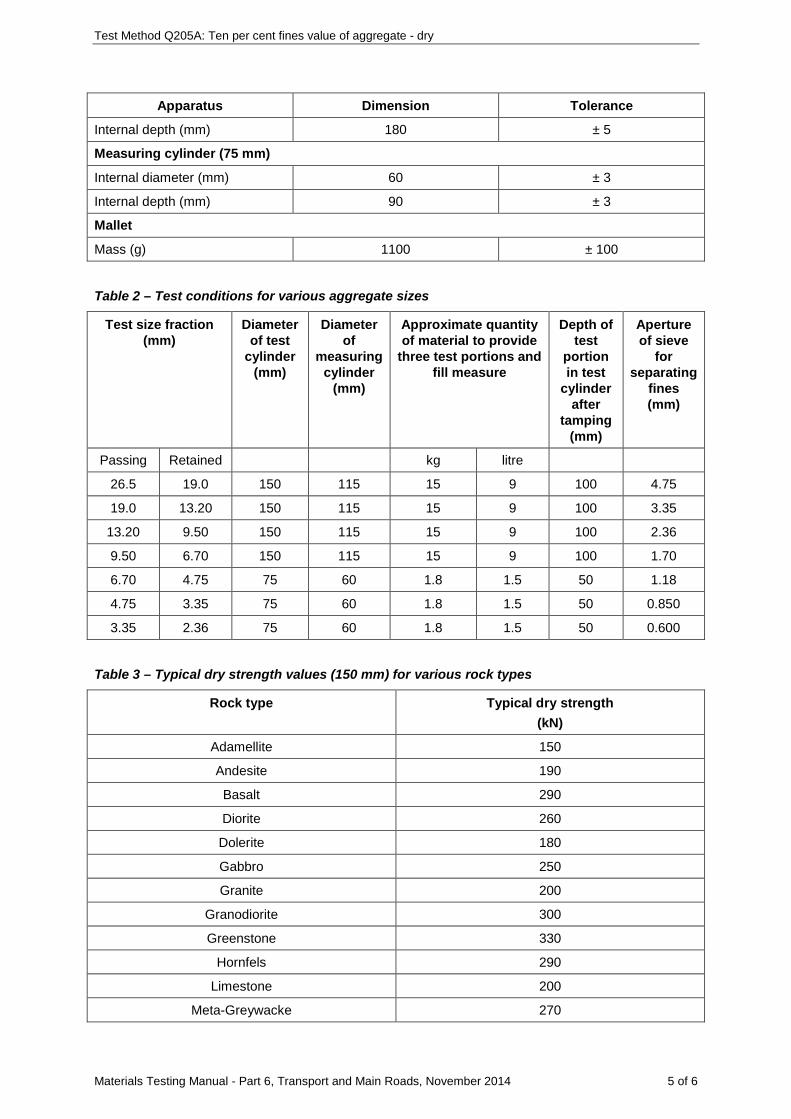
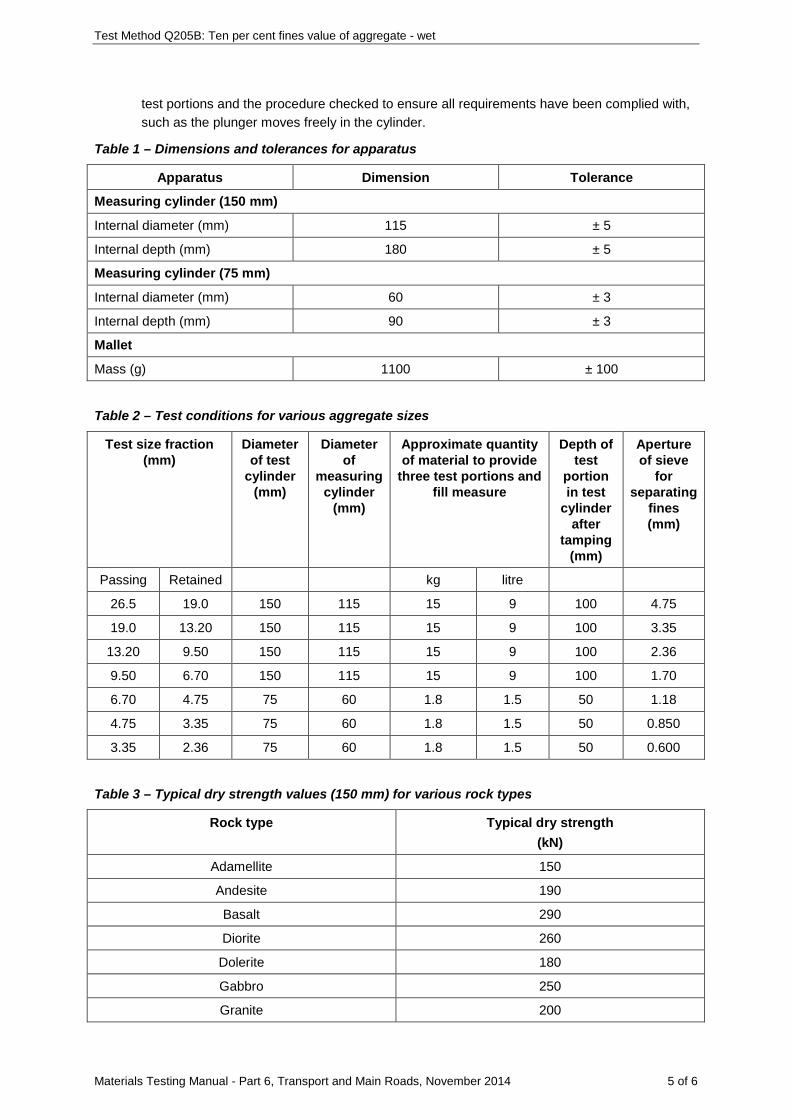
Table 1 – Dimensions and tolerances for apparatus
Apparatus Dimension Tolerance
Measuring cylinder (150 mm)
Internal diameter (mm) 115 ± 5
Test Method Q205A: Ten per cent fines value of aggregate - dry
Materials Testing Manual - Part 6, Transport and Main Roads, November 2014 5 of 6
Apparatus Dimension Tolerance
Internal depth (mm) 180 ± 5
Measuring cylinder (75 mm)
Internal diameter (mm) 60 ± 3
Internal depth (mm) 90 ± 3
Mallet
Mass (g) 1100 ± 100
Table 2 – Test conditions for various aggregate sizes
Test size fraction (mm)
Diameter of test
cylinder (mm)
Diameter of
measuring cylinder
(mm)
Approximate quantity of material to provide
three test portions and fill measure
Depth of test
portion in test
cylinder after
tamping (mm)
Aperture of sieve
for separating
fines (mm)
Passing Retained kg litre
26.5 19.0 150 115 15 9 100 4.75
19.0 13.20 150 115 15 9 100 3.35
13.20 9.50 150 115 15 9 100 2.36
9.50 6.70 150 115 15 9 100 1.70
6.70 4.75 75 60 1.8 1.5 50 1.18
4.75 3.35 75 60 1.8 1.5 50 0.850
3.35 2.36 75 60 1.8 1.5 50 0.600
Table 3 – Typical dry strength values (150 mm) for various rock types
Rock type Typical dry strength (kN)
Adamellite 150
Andesite 190
Basalt 290
Diorite 260
Dolerite 180
Gabbro 250
Granite 200
Granodiorite 300
Greenstone 330
Hornfels 290
Limestone 200
Meta-Greywacke 270

Test Method Q205A: Ten per cent fines value of aggregate - dry
Materials Testing Manual - Part 6, Transport and Main Roads, November 2014 6 of 6
Rock type Typical dry strength (kN)
Mudstone 180
Quartzite 220
Rhyolite 230
Slate 190
Trachyte 220
Tuff 250

Materials Testing Manual - Part 6, Transport and Main Roads, November 2014 1 of 6
Test Method Q205B: Ten per cent fines value of aggregate - wet
1 Source
This method is based on AS 1141.22: Wet/dry strength variation. There are some minor procedural differences and the option for duplicate testing has been removed.
2 Scope
This method describes the procedure for the determination of the crushing force which, when applied to a known mass of saturated surface dry coarse aggregate, will produce fines amounting to 10 per cent of the original mass.
The test is normally performed on aggregate passing a 13.20 mm sieve and retained on a 9.50 mm sieve but may be carried out on other size fractions. However, it is not intended that the test be performed on material retained on a 26.5 mm sieve.
3 Apparatus
Where appropriate, the working tolerances of particular apparatus are contained in Table 1 and AS 1141.22 Figure 1.
The following apparatus is required:
3.1 For aggregate of test size fraction requiring a 150 mm diameter test cylinder (Table 2):
3.1.1 Test cylinder, open-ended steel cylinder, 150 mm diameter, internal depth of 135 mm and wall thickness of 15 mm.
3.1.2 Plunger, steel plunger with a tapered piston having a bottom diameter of 148 mm, top diameter of 146 mm and depth of 30 mm. The piston is mounted on a stem 130 mm diameter with a combined length of the piston and stem of 115 mm. The stem should include a 20 mm diameter hole for lifting of the plunger from within the cylinder.
3.1.3 Baseplate, steel baseplate, 220 mm diameter and thickness of 7.5 mm.
3.1.4 Measuring cylinder, steel cylindrical measure of internal diameter of 115 mm and internal depth of 180 mm.
3.2 For aggregate of test size fraction requiring a 75 mm diameter test cylinder (Table 2):
3.2.1 Test cylinder, open-ended steel cylinder, 75 mm diameter, internal depth of 77.5 mm and wall thickness of 8 mm.
3.2.2 Plunger, steel plunger with a tapered piston having a bottom diameter of 74 mm, top diameter of 72 mm and depth of 20 mm. The piston is mounted on a stem 55 mm diameter with a combined length of the piston and stem of 72.5 mm. The stem should include a 10 mm diameter hole for lifting of the plunger from within the cylinder.
3.2.3 Baseplate, steel baseplate, 115 mm diameter and thickness of 7.5 mm.
3.2.4 Measuring cylinder, steel measure, internal diameter of 60 mm and internal depth of 90 mm.
3.3 Drying oven of suitable capacity, having a temperature of 105-110ºC and complying with AS 1289.0.
3.4 Sieves:
3.4.1 Perforated plate, 26.5 mm, 19.0 mm, 13.20 mm, 9.50 mm, 6.70 mm and 4.75 mm complying with AS 1152.
Test Method Q205B: Ten per cent fines value of aggregate - wet
Materials Testing Manual - Part 6, Transport and Main Roads, November 2014 2 of 6
3.4.2 Woven wire, 3.35 mm, 2.36 mm, 1.70 mm, 1.18 mm, 0.850 mm and 0.600 mm, as required, complying with AS 1152.
3.5 Mallet - rubber mallet with face about 75 mm diameter, mass 1100 g and handle length about 300 mm.
3.6 Compression machine, a Class A compression machine of at least 500 kN capacity and able to apply the required load at a uniform rate of application.
3.7 Balance of suitable capacity, with a resolution of at least 0.1 g and with a limit of performance within the range of ± 0.5 g.
3.8 Steel straightedge, about 300 mm long.
3.9 Absorbent cloth or towel.
4 Procedure
The procedure shall be as follows:
4.1 Preparation
4.1.1 Prepare the bulk sample as detailed in Section 5 of Test Method Q101 to produce a representative sample of appropriate size.
4.1.2 Further prepare the sample to produce sufficient washed materials of the size and quantity specified in Table 2 as detailed in Test Method Q101, Subsection 6.5 for specified fraction subsamples.
4.1.3 Place the washed sample in the drying oven, dry to a constant mass (Note 7.1) and allow to cool to room temperature.
4.2 Mass of test portion
4.2.1 Select the appropriate measuring cylinder (measure) for the test size fraction from Table 2.
4.2.2 Obtain one representative test portion from the specified fraction subsample.
4.2.3 Slowly fill the measure to about one-third of its capacity by pouring the aggregate from approximately 100 mm above the measure.
4.2.4 Compact the aggregate in the measure by tapping the measure with 25 blows of the rubber mallet evenly distributed around the circumference at the level of the aggregate.
4.2.5 Repeat Steps 4.2.3 and 4.2.4 for two further layers of aggregate.
4.2.6 Top up the measure if necessary and level the surface with a straightedge.
4.2.7 Determine the mass of aggregate in the measure ( 1m ).
4.2.8 Obtain at least three representative test portions of mass 1m from the specified fraction
subsample (Note 7.2).
4.3 Testing
4.3.1 Immerse the test portions in water overnight but for not longer than 24 hours.
4.3.2 After soaking, remove one portion from the water and allow it to drain.
4.3.3 After draining, place the aggregate one particle deep on a dry cloth and roll and wipe the particles until all visible films of water have been removed but the surfaces of the aggregate still appear damp.

Test Method Q205B: Ten per cent fines value of aggregate - wet
Materials Testing Manual - Part 6, Transport and Main Roads, November 2014 3 of 6
4.3.4 Position the test cylinder on the baseplate and place the test portion in the cylinder using the method detailed in Steps 4.2.3 to 4.2.5.
4.3.5 Level the surface of the aggregate and insert the plunger so that it rests horizontally on the surface of the aggregate, taking care to ensure the plunger does not jam in the cylinder.
4.3.6 Place the assembled cylinder, test portion and plunger in position between the platens of the compression testing machine.
4.3.7 Estimate the approximate force to produce ten per cent fines for the particular aggregate type from previous experience with the material type. Use Table 3 as a guide to strengths typically expected (Note 7.3). Where the test portion size fraction requires the use of the smaller 75 mm test mould, then the expected force should be divided by four.
4.3.8 Apply the force at a uniform rate such that the required force is applied in 10 minutes. Record the maximum force applied to the nearest kilonewton ( 1 2f ,f ). If the smaller 75 mm mould has
been used for the test, then multiply the maximum force applied by four and record to the nearest kilonewton.
4.3.9 Release the force and remove the cylinder assembly from the compression machine.
4.3.10 Remove the plunger from the cylinder and the whole of the test portion, without deliberate breaking of the particles, and place in a suitable container avoiding loss of fines.
4.3.11 Place the crushed portion in an oven and dry to a constant mass (Note 7.1).
4.3.12 Separate the fines in the test portion using the appropriate separating sieve listed in Table 2 for the size fraction tested.
4.3.13 Determine the mass of the material retained by the separating sieve ( 2m ).
4.3.14 Calculate the percentage of fines ( 1 2P , P ) produced during the test as detailed in Step 5.1.
4.3.15 The percentage of fines should normally fall within the range 7.5 per cent to 12.5 per cent. If it does not, take a new test portion and perform a further test as detailed in Steps 4.3.2 to 4.3.14 adjusting the force applied in 10 minutes as required to bring the percentage of fines within the range of 7.5 per cent to 12.5 per cent (Notes 7.3, 7.4 and 7.5).
4.3.16 Repeat Steps 4.3.1 to 4.3.15 with another test portion at a different applied force to produce a percentage fines value ( 1 2P , P ) within the range of 7.5 per cent to 12.5 per cent, but above
10 per cent if the result on the previous portion was less than 10 per cent or vice versa (Notes 7.3, 7.4 and 7.5).
5 Calculations
Calculate as follows:
5.1 The percentage of fines produced during the test as follows:
1 2i
1
m -mP = 100m
where iP = percentage of fines (%)
1m = mass of test portion (g)
2m = mass of material retained on separating sieve (g)

Test Method Q205B: Ten per cent fines value of aggregate - wet
Materials Testing Manual - Part 6, Transport and Main Roads, November 2014 4 of 6
5.2 The wet ten per cent fines value as follows:
1 2 11
2 1
(10-P )(f -f )W = f +P -P
where W = wet ten per cent fines value (%)
1f = applied force to produce a percentage of fines within the range of 7.5
to 10.0 per cent (kN)
1P = percentage of fines produced by applied force 1f
2f = applied force to produce a percentage of fines within the range of 10.0
to 12.5 per cent (kN)
2P = percentage of fines produced by applied force 2f
6 Report
Report the following values and general information:
6.1 The nature of the bulk sample (crushed rock, spalls, drill core) tested.
6.2 The nominal size of the bulk sample (mm).
6.3 The size fraction tested (mm).
6.4 The wet ten per cent fines value to the nearest 1 kN.
7 Notes on method
7.1 The fraction is considered to have reached a constant mass when the difference between successive weighings, after a further 1 hour drying at 105-110°C, is not more than 1 percent of the total of the previous moisture losses.
7.2 The aggregate used in Subsection 4.2 to determine the mass of test portion may be used as a test portion if no significant breakdown has occurred during tapping. If the material is suspect the amount of breakdown can be checked by separating the aggregate on the nominated separating sieve (Table 2). If more than 0.2 per cent passes the sieve then the material from the measuring cylinder should be discarded.
7.3 An indication of the force required to produce ten per cent fines can be estimated from:
14xF = P + 4
where F = force required to produce 10 per cent fines
x = maximum force of test (kN)
P = percentage fines produced from a force of x kN
7.4 If a result of 10.0 per cent is obtained, take a new test portion and perform a further test as detailed in Steps 4.3.2 to 4.3.14 adjusting the force applied in 10 minutes as required to bring the percentage of fines within the range of 7.5 per cent to less than 10.0 per cent or within the range of 12.5 to greater than 10.0 per cent as appropriate.
7.5 When calculating the ten per cent fines value in accordance with the procedures described, the value of 1f should be less than the value of 2f . If not, then the test be repeated using fresh
Test Method Q205B: Ten per cent fines value of aggregate - wet
Materials Testing Manual - Part 6, Transport and Main Roads, November 2014 5 of 6
test portions and the procedure checked to ensure all requirements have been complied with, such as the plunger moves freely in the cylinder.
Table 1 – Dimensions and tolerances for apparatus
Apparatus Dimension Tolerance
Measuring cylinder (150 mm)
Internal diameter (mm) 115 ± 5
Internal depth (mm) 180 ± 5
Measuring cylinder (75 mm)
Internal diameter (mm) 60 ± 3
Internal depth (mm) 90 ± 3
Mallet
Mass (g) 1100 ± 100
Table 2 – Test conditions for various aggregate sizes
Test size fraction (mm)
Diameter of test
cylinder (mm)
Diameter of
measuring cylinder
(mm)
Approximate quantity of material to provide
three test portions and fill measure
Depth of test
portion in test
cylinder after
tamping (mm)
Aperture of sieve
for separating
fines (mm)
Passing Retained kg litre
26.5 19.0 150 115 15 9 100 4.75
19.0 13.20 150 115 15 9 100 3.35
13.20 9.50 150 115 15 9 100 2.36
9.50 6.70 150 115 15 9 100 1.70
6.70 4.75 75 60 1.8 1.5 50 1.18
4.75 3.35 75 60 1.8 1.5 50 0.850
3.35 2.36 75 60 1.8 1.5 50 0.600
Table 3 – Typical dry strength values (150 mm) for various rock types
Rock type Typical dry strength (kN)
Adamellite 150
Andesite 190
Basalt 290
Diorite 260
Dolerite 180
Gabbro 250
Granite 200

Test Method Q205B: Ten per cent fines value of aggregate - wet
Materials Testing Manual - Part 6, Transport and Main Roads, November 2014 6 of 6
Rock type Typical dry strength (kN)
Granodiorite 300
Greenstone 330
Hornfels 290
Limestone 200
Meta-Greywacke 270
Mudstone 180
Quartzite 220
Rhyolite 230
Slate 190
Trachyte 220
Tuff 250

Materials Testing Manual - Part 6, Transport and Main Roads, November 2014 1 of 1
Test Method Q205C: Wet/dry strength variation of aggregate
1 Source
This method is based on AS 1141.22: Wet/dry strength variation. There are some minor procedural differences and the option for duplicate testing has been removed.
2 Scope
This method describes the procedure for the determination of the strength variation of aggregate when tested in both the oven dry (dry) and saturated surface dry (wet) conditions.
The standard test is carried out on aggregate passing a 13.20 mm sieve and retained on a 9.50 mm sieve but can be performed on other size fractions. However the same size fraction must be used for both the wet and dry tests.
3 Procedure
The procedure shall be as follows:
3.1 Determine the dry ten per cent fines value ( D ) as detailed in Test Method Q205A.
3.2 Determine the wet ten per cent fines value ( W ) as detailed in Test Method Q205B.
4 Calculations
Calculate the wet/dry strength variation as follows:
100(D - W)WDVD
=
where WDV = wet/dry strength variation (%).
D = dry ten per cent fines value, obtained from Test Method Q205A (kN)
W = wet ten per cent fines value, obtained from Test Method Q205B (kN)
5 Reporting
Report the following values and general information:
5.1 The nature of the bulk sample (crushed rock, spalls, drill core) tested.
5.2 The nominal size of the bulk sample.
5.3 The size fraction tested (mm).
5.4 The wet ten per cent fines value and the dry ten per cent fines value to the nearest 1 kN.
5.5 The wet/dry strength variation to the nearest 1%.

Materials Testing Manual - Part 6, Transport and Main Roads, November 2014 1 of 6
Test Method Q208A: Degradation factor of source rock
1 Source
This method applies the principles of AS 1141.25.1: Degradation factor - Source rock. It differs from this Australian Standard by minor alterations to the defined test portion and stock solution ingredients, by modifying the washing technique during preparation and after abrasion, and by directly calculating the degradation factor.
2 Scope
This method describes the procedure for the determination of the degradation factor of source rock, for example, from rock spalls or drill cores. The degradation factor indicates the aggregate quality by categorising the fines produced by the self-abrasion of the aggregate particles in the presence of water.
3 Apparatus
Where appropriate, the working tolerances of particular apparatus are contained in Table 1.
The following apparatus is required:
3.1 Shaker, a motorised shaker as illustrated in Figure 1.
3.2 Canister, a plastic canister fitted with a close fitting lid.
3.3 Test cylinder, a cylinder consisting of a transparent measuring tube and base with a rubber or plastic stopper. The tube shall be graduated from the base to a height of 380 mm in increments of 5 mm.
3.4 Measuring cylinders:
3.4.1 500 mL measuring cylinder graduated at 100 mL intervals with a rubber or plastic stopper.
3.4.2 10 mL measuring cylinder graduated at 1 mL intervals.
3.5 Sieves:
3.5.1 19.0 mm, 13.2 mm, 9.50 mm, 6.70 mm, 4.75 mm and 2.36 mm sieves complying with AS 1152.
3.5.2 Reinforced 2.36 mm and 0.075 mm sieves of 300 mm diameter and complying with AS 1152.
3.6 Funnel, a funnel having an internal diameter of approximately 325 mm.
3.7 Timer, a timer capable of measuring at least 20 minutes and reading in minutes and seconds.
3.8 Water sprayer, such as a vegetable sprayer connected to a mains pressure water supply.
3.9 Wash bottle with a fine jet.
3.10 Wash bowls, four metal bowls, approximately 180 mm diameter and 100 mm deep.
3.11 Drying oven of suitable capacity, having a temperature of 105-110°C and complying with AS 1141.2.
3.12 Balances:
3.12.1 Balance of suitable capacity, having a resolution of at least 0.1 g and with a limit of performance within the range of ± 0.5 g.

Test Method Q208A: Degradation factor of source rock
Materials Testing Manual - Part 6, Transport and Main Roads, November 2014 2 of 6
3.12.2 Balance of suitable capacity, having a resolution of at least 0.01 g and with a limit of performance within the range of ± 0.05 g (Note 10.1).
3.13 Crusher, a motorised crusher such as a jaw crusher suitable for reducing the sample of source rock to the required sizes.
3.14 Scalping screen, a scalping screen or other suitable equipment with an aperture size within the range of 12 mm to 19 mm.
3.15 Brush, a stiff wire brush.
4 Reagents
The following reagents are required:
4.1 Stock solution:
• Prepare by dissolving 21.9 ± 0.2 g of calcium chloride hexahydrate (AR grade) and 48.0 ± 0.5 g of glycerine (99% glycerol (LR grade)) in distilled water and making up to 100 mL (Notes 10.2, 10.3, 10.4 and 10.5).
5 Sample preparation
Prepare the sample as follows:
5.1 Thoroughly wash and dry the sample before using the wire brush to remove any adhering fines or soft weathered rock.
5.2 Crush the sample by gradually reducing the maximum particle size to 30-33 mm.
5.3 Sieve the crushed sample over an appropriately sized scalping screen to remove material that is not of a size corresponding to that of the quarried product.
5.4 If the material retained on the scalping screen is not homogenous, remove and discard any particles which are at variance with the bulk of the sample.
5.5 Further crush the retained material, gradually reducing its size until nearly all material passes the 19.0 mm sieve and a range of particle sizes in keeping with the requirements of Table 2 is produced.
5.6 Prepare a representative subsample to provide a test portion containing the required fractions as follows:
5.6.1 Screen the subsample through each of the sieves listed in Table 2, in turn. Discard the material retained on the largest sieve and the material passing the smallest sieve.
5.6.2 Place the fractions in separate wash bowls and wash each fraction using clean water until all coatings of fines have been removed from the surface of the particles. Use the procedure and observe the precautions detailed below.
a) Wash each fraction in turn as follows:
i. Hold the bowl at about a 45º angle in a sink and use the water sprayer to wash the particles, changing the orientation of the bowl to expose all particles to the water stream.
ii. Stop washing when the bowl is full and decant the wash water, ensuring only clay-sized particulates are run to waste.
iii. Repeat the washing and decanting until the surface of the particles first appear clean to the naked eye.

Test Method Q208A: Degradation factor of source rock
Materials Testing Manual - Part 6, Transport and Main Roads, November 2014 3 of 6
b) While the wash water is usually clean once all coatings of fines have been removed, some discrete rock particles will slowly break down when subjected to a stream of water. This is evidenced by discolouration of the wash water. In such cases, discontinue washing once the surface of the particles first appear clean to the naked eye (Note 10.6).
5.6.3 Place each washed fraction in the oven in its wash bowl and dry until a constant mass has been reached, recording the mass at each weighing (Note 10.7).
5.6.4 Reduce each dried fraction to the required mass as per Table 2, using appropriately sized sample splitters as detailed in Test Method Q101 Step 5.3. Ensure each resultant subsample is representative of the washed fraction and includes any rock fragments and fines. Combine the four fractions to produce the test portion.
6 Procedure
The procedure shall be as follows:
6.1 Rinse the canister lid, funnel, measuring cylinders, reinforced 2.36 mm and 0.075 mm sieves and the test cylinder with distilled water and allow the rinsed apparatus to drain.
6.2 Place the test portion in the canister, together with 200 mL of distilled water.
6.3 Place the lid on the canister and secure the assembly in the shaker.
6.4 Operate the shaker for 20 minutes.
6.5 After the 20 minutes shaking, empty the test portion into nested 2.36 mm and 0.075 mm sieves held in the funnel over the 500 mL measuring cylinder.
6.6 Wash out the canister with distilled water from the water sprayer and continue to wash the aggregate with the wash water from the canister and distilled water until the measuring cylinder is full to the 500 mL mark. In order that the maximum amount of fines is deposited into the measuring cylinder, use the procedure and observe the precautions detailed below.
6.6.1 Wash the canister and aggregate as follows:
a) Use a minimum amount of water to wash the canister, placing larger particles into the 2.36 mm sieve by hand. Direct the canister wash water over the material retained on the 2.36 mm sieve.
b) Separate and hold the 2.36 mm sieve just above the 0.075 mm sieve. Tilt the 2.36 mm sieve so that the wash water is directed over the retained 0.075 mm material. Remove fines by lightly tapping the 2.36 mm sieve and sparingly rinsing with water.
c) Clean the retained 0.075 mm material with water, tilting the sieve to allow drainage.
d) Tilt the 0.075 mm sieve and direct wash water over the back of the sieve. Remove fines by lightly tapping the back of the 0.075 mm sieve and sparingly rinsing with water.
6.6.2 Since some wash water will be held on and between the aggregate particles retained on the sieves and will drain slowly, the spray rate must be reduced as the level in the cylinder approaches 500 mL to prevent overfilling. The aggregate may drain 50-100 mL of wash water after the washing has ceased, thus allowance should be made for this extra wash water to drain.
6.6.3 With some soft discrete rock particles, the wash water will not be clear after washing.
6.7 Using the 10 mL measuring cylinder, transfer 7 mL of stock solution into the graduated test cylinder.

Test Method Q208A: Degradation factor of source rock
Materials Testing Manual - Part 6, Transport and Main Roads, November 2014 4 of 6
6.8 Stopper the 500 mL measuring cylinder and bring all solids in the wash water into suspension by inverting the cylinder end to end about ten times allowing the bubble to travel completely from one end to the other each time.
6.9 Immediately pour the suspension into the test cylinder to the 380 mm mark and insert the stopper.
6.10 Mix the contents of the test cylinder by inverting the cylinder end to end, allowing the bubble to travel completely from one end to the other. This alternating end to end mixing cycle shall be repeated 20 times in approximately 35 seconds.
6.11 At the conclusion of the mixing period, place the test cylinder on a bench free from vibration, remove the stopper and start the timer. Allow the test cylinder to stand undisturbed for a period of 20 minutes ± 10 seconds.
6.12 After the 20 minute period, estimate and record the height of the upper surface of the flocculate column (h) to the nearest 1 mm.
7 Calculations
7.1 Calculate the degradation factor (D) as follows:
( )100 380-hD=
380+1.75h
where D = degradation factor
h = height of flocculate column (mm)
8 Reporting
Report the degradation factor to the nearest whole number.
9 Precision
The following criteria should be used to judge the acceptability of results (95% probability).
9.1 Repeatability
Duplicate tests by the same operator are acceptable if their results do not differ by more than four units.
9.2 Reproducibility
Independent test results obtained by different operators working in different laboratories on identical samples are acceptable if the results do not differ by more than 16 units.
10 Notes on method
10.1 The balance used to weigh the reagents must have a readability which displays to one significant figure more than the required mass being weighed and a limit of performance commensurate with the readability.
10.2 Before handling the reagents, the operator must consult the relevant Safety Data Sheet (SDS).
10.3 Due to the very hygroscopic nature of calcium chloride hexahydrate, it will begin to dissolve in the water which it attracts, even in its original container once that has been opened. However,
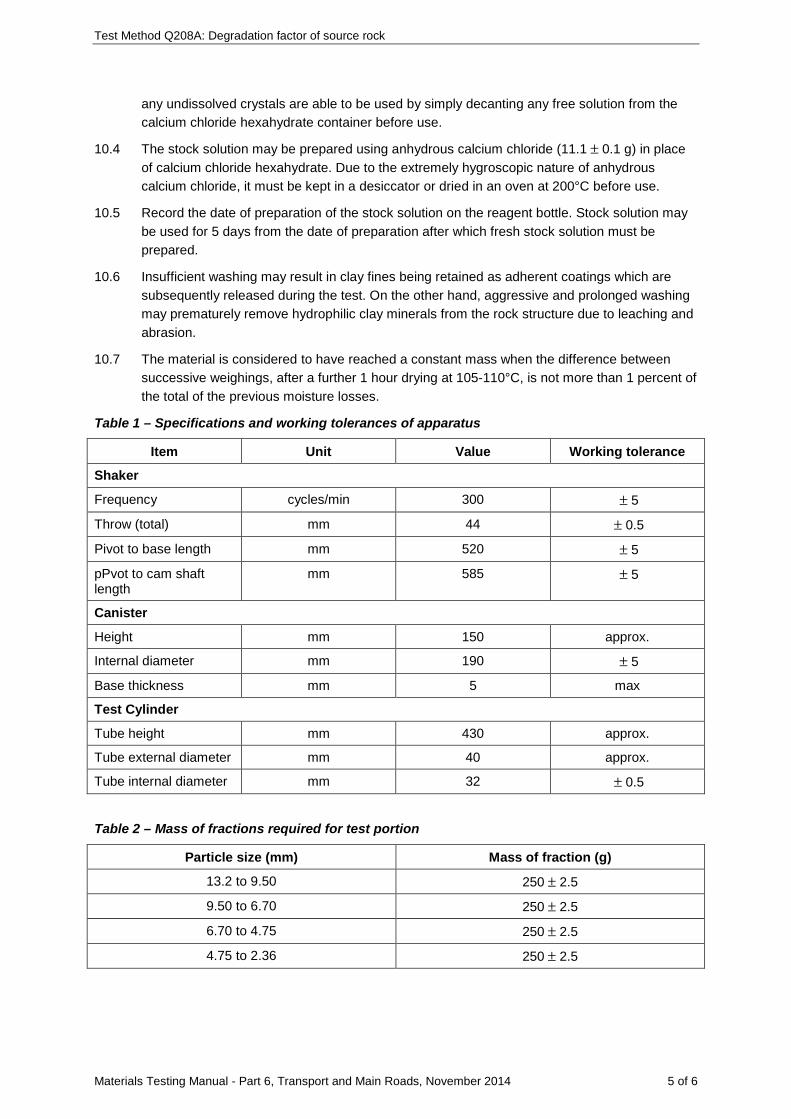
Test Method Q208A: Degradation factor of source rock
Materials Testing Manual - Part 6, Transport and Main Roads, November 2014 5 of 6
any undissolved crystals are able to be used by simply decanting any free solution from the calcium chloride hexahydrate container before use.
10.4 The stock solution may be prepared using anhydrous calcium chloride (11.1 ± 0.1 g) in place of calcium chloride hexahydrate. Due to the extremely hygroscopic nature of anhydrous calcium chloride, it must be kept in a desiccator or dried in an oven at 200°C before use.
10.5 Record the date of preparation of the stock solution on the reagent bottle. Stock solution may be used for 5 days from the date of preparation after which fresh stock solution must be prepared.
10.6 Insufficient washing may result in clay fines being retained as adherent coatings which are subsequently released during the test. On the other hand, aggressive and prolonged washing may prematurely remove hydrophilic clay minerals from the rock structure due to leaching and abrasion.
10.7 The material is considered to have reached a constant mass when the difference between successive weighings, after a further 1 hour drying at 105-110°C, is not more than 1 percent of the total of the previous moisture losses.
Table 1 – Specifications and working tolerances of apparatus
Item Unit Value Working tolerance
Shaker
Frequency cycles/min 300 ± 5
Throw (total) mm 44 ± 0.5
Pivot to base length mm 520 ± 5
pPvot to cam shaft length
mm 585 ± 5
Canister
Height mm 150 approx.
Internal diameter mm 190 ± 5
Base thickness mm 5 max
Test Cylinder
Tube height mm 430 approx.
Tube external diameter mm 40 approx.
Tube internal diameter mm 32 ± 0.5
Table 2 – Mass of fractions required for test portion
Particle size (mm) Mass of fraction (g)
13.2 to 9.50 250 ± 2.5
9.50 to 6.70 250 ± 2.5
6.70 to 4.75 250 ± 2.5
4.75 to 2.36 250 ± 2.5
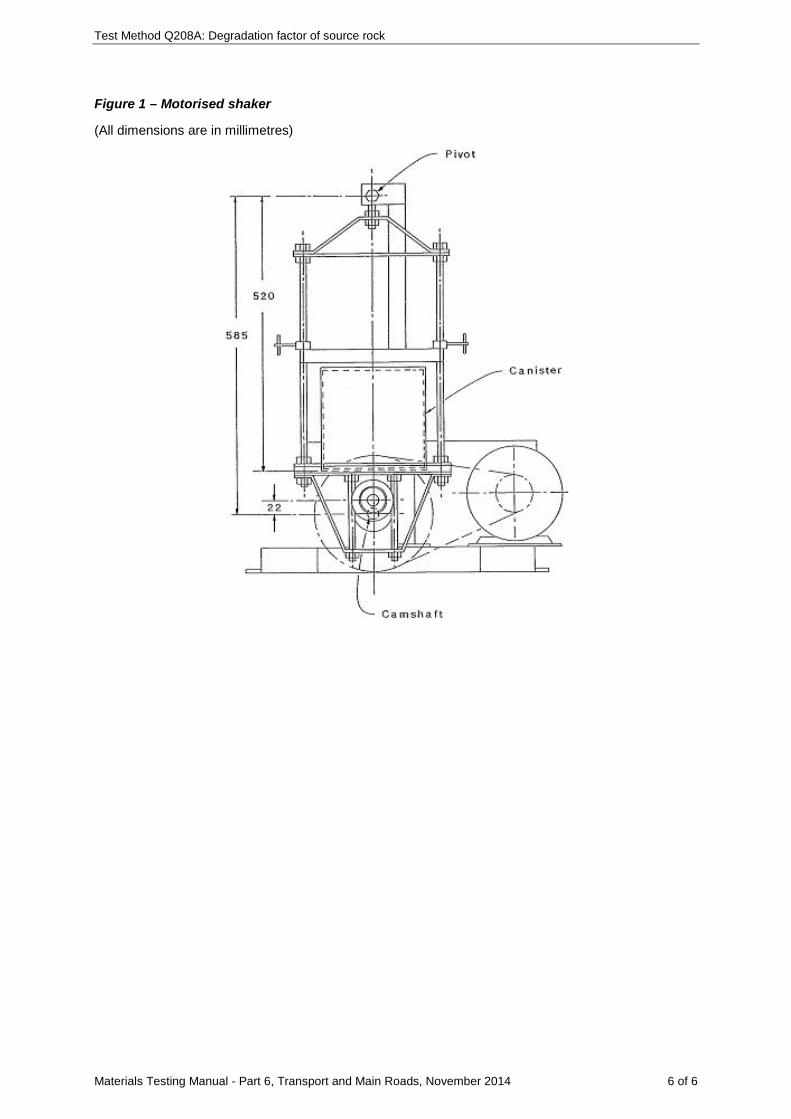
Test Method Q208A: Degradation factor of source rock
Materials Testing Manual - Part 6, Transport and Main Roads, November 2014 6 of 6
Figure 1 – Motorised shaker
(All dimensions are in millimetres)

Materials Testing Manual - Part 6, Transport and Main Roads, November 2014 1 of 6
Test Method Q208B: Degradation factor of coarse aggregate
1 Source
This method applies the principles of AS 1141.25.2: Degradation factor – Coarse aggregate. It differs from this Australian Standard by minor alterations to the defined test portion and stock solution ingredients, by modifying the washing technique during preparation and after abrasion, and by directly calculating the degradation factor.
2 Scope
This method describes the procedure for the determination of the degradation factor of coarse aggregate (retained 2.36 mm sieve). The degradation factor indicates the aggregate quality by categorising the fines produced by the self-abrasion of the aggregate particles in the presence of water.
3 Apparatus
Where appropriate, the working tolerances of particular apparatus are contained in Table 1.
The following apparatus is required:
3.1 Shaker, a motorised shaker as illustrated in Figure 1.
3.2 Canister, a plastic canister fitted with a close fitting lid.
3.3 Test cylinder, a cylinder consisting of a transparent measuring tube and base with a rubber or plastic stopper. The tube shall be graduated from the base to a height of 380 mm in increments of 5 mm.
3.4 Measuring cylinders:
3.4.1 500 mL measuring cylinder graduated at 100 mL intervals with a rubber or plastic stopper.
3.4.2 10 mL measuring cylinder graduated at 1 mL intervals.
3.5 Sieves:
3.5.1 19.0 mm, 13.2 mm, 9.50 mm, 6.70 mm, 4.75 mm and 2.36 mm sieves complying with AS 1152.
3.5.2 Reinforced 2.36 mm and 0.075 mm sieves of 300 mm diameter and complying with AS 1152.
3.6 Funnel, a funnel having an internal diameter of approximately 325 mm.
3.7 Timer, a timer capable of measuring at least 20 minutes and reading in minutes and seconds.
3.8 Water sprayer, such as a vegetable sprayer connected to a mains pressure water supply.
3.9 Wash bottle with a fine jet.
3.10 Wash bowls, four metal bowls, approximately 180 mm diameter and 100 mm deep.
3.11 Drying oven of suitable capacity, having a temperature of 105-110°C and complying with AS 1141.2.
3.12 Balances:
3.12.1 Balance of suitable capacity, having a resolution of at least 0.1 g and with a limit of performance within the range of ± 0.5 g.

Test Method Q208B: Degradation factor of coarse aggregate
Materials Testing Manual - Part 6, Transport and Main Roads, November 2014 2 of 6
3.12.2 Balance of suitable capacity, having a resolution of at least 0.01 g and with a limit of performance within the range of ± 0.05 g (Note 10.1).
4 Reagents
The following reagents are required:
4.1 Stock solution:
• Prepare by dissolving 21.9 ± 0.2 g of calcium chloride hexahydrate (AR grade) and 48.0 ± 0.5 g of glycerine (99% glycerol (LR grade)) in distilled water and making up to 100 mL (Notes 10.2, 10.3, 10.4 and 10.5).
5 Sample preparation
Prepare the sample as follows:
5.1 Prepare the bulk sample as detailed in Section 5 of Test Method Q101 to produce a representative subsample of appropriate size.
5.2 Prepare a representative subsample to provide a test portion containing the fractions in Table 2 as follows:
5.2.1 Screen the subsample through each of the sieves listed in Table 2 in turn, breaking up aggregations of fines either by hand or by using a rubber pestle and mortar such that discrete particles are not broken.
5.2.2 Where difficulty exists in ascertaining whether particles are discrete or, in fact, aggregations of fines, a small number of such particles should be placed in water and boiled. If disaggregation occurs, such particles shall be considered as aggregations of fines.
5.2.3 Discard the material retained on the largest sieve and the material passing the smallest sieve.
5.2.4 Place the fractions in separate wash bowls and wash each fraction using clean water until all coatings of fines have been removed from the surface of the particles. Use the procedure and observe the precautions detailed below.
a) Wash each fraction in turn as follows:
i. Hold the bowl at about a 45º angle in a sink and use the water sprayer to wash the particles, changing the orientation of the bowl to expose all particles to the water stream.
ii. Stop washing when the bowl is full and decant the wash water, ensuring only clay-sized particulates run to waste.
iii. Repeat the washing and decanting until the surface of the particles first appear clean to the naked eye.
b) While the wash water is usually clean once all coatings of fines have been removed, some discrete rock particles will slowly break down when subjected to a stream of water. This is evidenced by discolouration of the wash water. In such cases, discontinue washing once the surface of the particles first appear clean to the naked eye (Note 10.6).
5.2.5 Place each washed fraction in the oven in its wash bowl and dry until a constant mass has been reached, recording the mass at each weighing (Note 10.7).
5.2.6 Reduce each dried fraction to the required mass as per Table 2, using appropriately sized sample splitters as detailed in Test Method Q101 Step 5.3. Ensure each resultant subsample
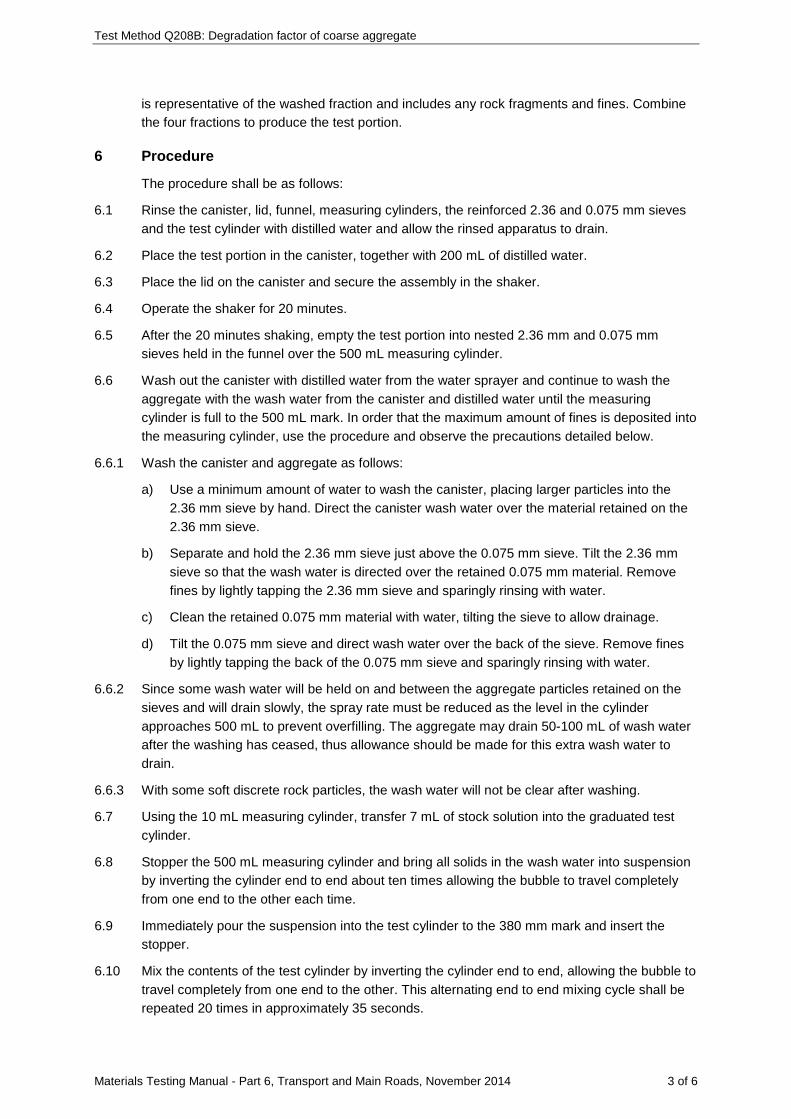
Test Method Q208B: Degradation factor of coarse aggregate
Materials Testing Manual - Part 6, Transport and Main Roads, November 2014 3 of 6
is representative of the washed fraction and includes any rock fragments and fines. Combine the four fractions to produce the test portion.
6 Procedure
The procedure shall be as follows:
6.1 Rinse the canister, lid, funnel, measuring cylinders, the reinforced 2.36 and 0.075 mm sieves and the test cylinder with distilled water and allow the rinsed apparatus to drain.
6.2 Place the test portion in the canister, together with 200 mL of distilled water.
6.3 Place the lid on the canister and secure the assembly in the shaker.
6.4 Operate the shaker for 20 minutes.
6.5 After the 20 minutes shaking, empty the test portion into nested 2.36 mm and 0.075 mm sieves held in the funnel over the 500 mL measuring cylinder.
6.6 Wash out the canister with distilled water from the water sprayer and continue to wash the aggregate with the wash water from the canister and distilled water until the measuring cylinder is full to the 500 mL mark. In order that the maximum amount of fines is deposited into the measuring cylinder, use the procedure and observe the precautions detailed below.
6.6.1 Wash the canister and aggregate as follows:
a) Use a minimum amount of water to wash the canister, placing larger particles into the 2.36 mm sieve by hand. Direct the canister wash water over the material retained on the 2.36 mm sieve.
b) Separate and hold the 2.36 mm sieve just above the 0.075 mm sieve. Tilt the 2.36 mm sieve so that the wash water is directed over the retained 0.075 mm material. Remove fines by lightly tapping the 2.36 mm sieve and sparingly rinsing with water.
c) Clean the retained 0.075 mm material with water, tilting the sieve to allow drainage.
d) Tilt the 0.075 mm sieve and direct wash water over the back of the sieve. Remove fines by lightly tapping the back of the 0.075 mm sieve and sparingly rinsing with water.
6.6.2 Since some wash water will be held on and between the aggregate particles retained on the sieves and will drain slowly, the spray rate must be reduced as the level in the cylinder approaches 500 mL to prevent overfilling. The aggregate may drain 50-100 mL of wash water after the washing has ceased, thus allowance should be made for this extra wash water to drain.
6.6.3 With some soft discrete rock particles, the wash water will not be clear after washing.
6.7 Using the 10 mL measuring cylinder, transfer 7 mL of stock solution into the graduated test cylinder.
6.8 Stopper the 500 mL measuring cylinder and bring all solids in the wash water into suspension by inverting the cylinder end to end about ten times allowing the bubble to travel completely from one end to the other each time.
6.9 Immediately pour the suspension into the test cylinder to the 380 mm mark and insert the stopper.
6.10 Mix the contents of the test cylinder by inverting the cylinder end to end, allowing the bubble to travel completely from one end to the other. This alternating end to end mixing cycle shall be repeated 20 times in approximately 35 seconds.

Test Method Q208B: Degradation factor of coarse aggregate
Materials Testing Manual - Part 6, Transport and Main Roads, November 2014 4 of 6
6.11 At the conclusion of the mixing period, place the test cylinder on a bench free from vibration, remove the stopper and start the timer. Allow the test cylinder to stand undisturbed for a period of 20 minutes ± 10 seconds.
6.12 After the 20 minute period, estimate and record the height of the upper surface of the flocculate column (h) to the nearest 1 mm.
7 Calculations
Calculate the degradation factor (D) as follows:
( )100 380-hD=
380+1.75h
where D = degradation factor
h = height of flocculate column (mm)
8 Reporting
Report the degradation factor to the nearest whole number.
9 Precision
The following criteria should be used to judge the acceptability of results (95% probability).
9.1 Repeatability
Duplicate tests by the same operator are acceptable if their results do not differ by more than four units.
9.2 Reproducibility
Independent test results obtained by different operators working in different laboratories on identical samples are acceptable if the results do not differ by more than 16 units.
10 Notes on method
10.1 The balance used to weigh the reagents must have a readability which displays to one significant figure more than the required mass being weighed and a limit of performance commensurate with the readability.
10.2 Before handling the reagents, the operator must consult the relevant Safety Data Sheet (SDS).
10.3 Due to the very hygroscopic nature of calcium chloride hexahydrate, it will begin to dissolve in the water which it attracts, even in its original container once that has been opened. However, any undissolved crystals are able to be used by simply decanting any free solution from the calcium chloride hexahydrate container before use.
10.4 The stock solution may be prepared using anhydrous calcium chloride (11.1 ± 0.1 g) in place of calcium chloride hexahydrate. Due to the extremely hygroscopic nature of anhydrous calcium chloride, it must be kept in a desiccator or dried in an oven at 200ºC before use.
10.5 Record the date of preparation of the stock solution on the reagent bottle. Stock solution may be used for 5 days from the date of preparation after which fresh stock solution must be prepared.

Test Method Q208B: Degradation factor of coarse aggregate
Materials Testing Manual - Part 6, Transport and Main Roads, November 2014 5 of 6
10.6 Insufficient washing may result in clay fines being retained as adherent coatings which are subsequently released during the test. On the other hand, aggressive and prolonged washing may prematurely remove hydrophilic clay minerals from the rock structure due to leaching and abrasion.
10.7 The material is considered to have reached a constant mass when the difference between successive weighings, after a further 1 hour drying at 105-110°C, is not more than 1 percent of the total of the previous moisture losses.
Table 1 – Specifications and working tolerances of apparatus
Item Unit Value Working tolerance
Shaker
Frequency cycles/min 300 ± 5
Throw (total) mm 44 ± 0.5
Pivot to base length mm 520 ± 5
Pivot to cam shaft length
mm 585 ± 5
Canister
Height mm 150 approx.
Internal diameter mm 190 ± 5
Base thickness mm 5 max.
Test cylinder
Tube height mm 430 approx.
Tube external diameter mm 40 approx.
Tube internal diameter mm 32 ± 0.5
Table 2 – Mass of fractions required for test portions
Particle size (mm) Mass of fraction (g)
13.2 to 9.50 250 ± 2.5
9.50 to 6.70 250 ± 2.5
6.70 to 4.75 250 ± 2.5
4.75 to 2.36 250 ± 2.5

Test Method Q208B: Degradation factor of coarse aggregate
Materials Testing Manual - Part 6, Transport and Main Roads, November 2014 6 of 6
Figure 1 – Motorised shaker

Materials Testing Manual - Part 6, Transport and Main Roads, November 2014 1 of 5
Test Method Q211: Binder absorption by aggregate
1 Source
This method was developed in-house using techniques evolved through internal departmental research investigations. It applies the principles of Test Method Q214B: Particle density and water absorption of aggregate - coarse fraction.
2 Scope
This method describes the procedure for determining the quantity of binder absorbed by an aggregate. Two determinations of aggregate volume are made, one being the volume related to the aggregate particle density on a dry basis, and the other being the volume of the binder free aggregate following immersion of the aggregate in hot binder. Binder absorption is then measured by volume difference and expressed as a percentage by mass. The method is applicable to aggregates used in asphalt mix.
3 Apparatus
The following apparatus is required:
3.1 Test oven, an oven of suitable capacity to hold two sample containers and capable of maintaining a temperature of 150 ± 5ºC for bitumen binders and 180 ± 5ºC for polymer modified binders.
3.2 Drying oven, of suitable capacity, having a temperature of 105-110ºC and complying with AS 1141.2.
3.3 Balance, a top pan balance of suitable capacity, with a resolution of at least 0.1 g and with a limit of performance within the range of ± 0.5 g, and capable of below balance weighing.
3.4 Balance bench, equipped with a hole for below balance weighing.
3.5 Basket, a wire basket of suitable mesh and capacity to contain the aggregate sample.
3.6 Attachment, a non-absorbent device to suspend the wire basket under the balance and inside the water container.
3.7 Water container, a container fitted with an overflow and filled with clean water to the overflow. The container shall be of suitable dimensions to allow the basket and sample container to be completely immersed without contacting any part of the container.
3.8 Sample containers, two containers of at least 4 L capacity fitted with wire handles.
3.9 Localised heating device, such as a heat and strip gun.
3.10 Thermometer, a partial or total immersion thermometer or other suitable temperature measuring device with a temperature range of at least 0-40ºC and graduated to 1ºC or less with an uncertainty of no more than 0.5ºC.
3.11 Stirrers, two suitable metal stirring rods or spatulas.
3.12 Sieve, 4.75 mm sieve complying with AS 1152.
4 Materials
The following materials are required:
4.1 Cloth, suitable absorbent lintless cloth.

Test Method Q211: Binder absorption by aggregate
Materials Testing Manual - Part 6, Transport and Main Roads, November 2014 2 of 5
5 Sample preparation
5.1 Prepare the bulk sample as detailed in Section 5 of Test Method Q101 to produce a representative sample of appropriate size.
5.2 Further prepare the sample to produce four representative subsamples of about 1500 g retained on the 4.75 mm sieve as detailed in Test Method Q101, Subsection 6.3 for coarse fraction subsamples.
6 Bulk particle density
Perform the following procedure on two aggregate subsamples.
6.1 Immerse the aggregate subsample in water for at least 24 hours.
6.2 Remove the aggregate from soaking and place the aggregate one particle deep on a dry cloth.
6.3 Roll and wipe the particles until all visible films of water have been removed but the surfaces of the aggregate still appear damp (Note 10.1).
6.4 Determine the mass of the saturated surface-dry test portion ( 2m ).
6.5 Place the container directly below the hole in the balance bench and fill it until water escapes from the overflow.
6.6 Attach the basket to the balance so that it is completely immersed in water and determine the mass of the immersed basket ( 3m ).
6.7 Transfer the test portion to the basket and agitate the aggregate particles to remove any entrapped air.
6.8 Determine the mass of the immersed aggregate and basket ( 4m ).
6.9 Measure the temperature of the water in the container to the nearest 1ºC.
6.10 Remove the aggregate from the basket and dry to a constant mass in the drying oven (Note 10.2).
6.11 Determine the dry mass of the aggregate ( 1m ).
7 Binder absorption
Perform the following procedure on two aggregate subsamples.
7.1 Place the aggregate subsample in the drying oven and dry to a constant mass (Note 10.2).
7.2 Heat the binder in the test oven until it is sufficiently fluid to pour, and pour approximately 1500 g binder into a sample container.
7.3 Place a stirring rod in the sample container and stir the binder to remove entrapped air. Remove any bubbles remaining on the surface of the binder using the localised heating device.
7.4 Allow the sample container to cool to room temperature in a dust free environment. Determine the mass of the sample container, binder and stirring rod ( 5m ).
7.5 Suspend the sample container from the balance and completely immerse it in the water container. Determine the mass of the immersed sample container, binder and stirring rod ( 6m ) (Note 10.3).
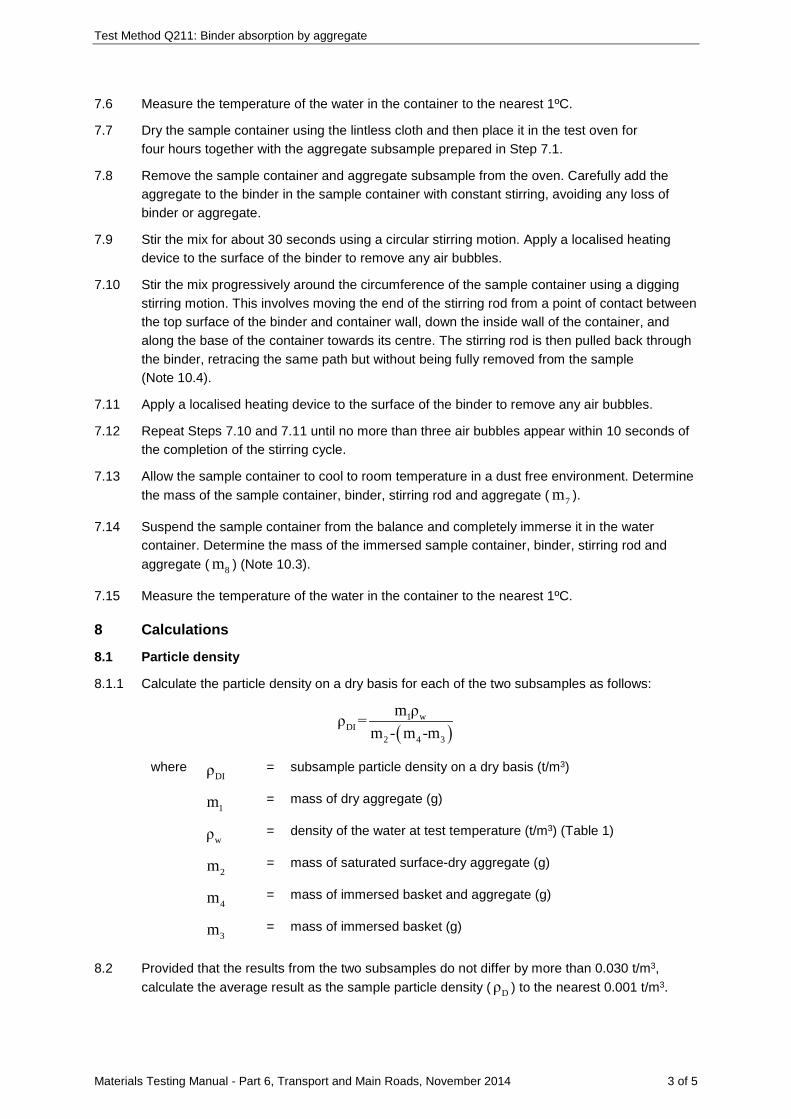
Test Method Q211: Binder absorption by aggregate
Materials Testing Manual - Part 6, Transport and Main Roads, November 2014 3 of 5
7.6 Measure the temperature of the water in the container to the nearest 1ºC.
7.7 Dry the sample container using the lintless cloth and then place it in the test oven for four hours together with the aggregate subsample prepared in Step 7.1.
7.8 Remove the sample container and aggregate subsample from the oven. Carefully add the aggregate to the binder in the sample container with constant stirring, avoiding any loss of binder or aggregate.
7.9 Stir the mix for about 30 seconds using a circular stirring motion. Apply a localised heating device to the surface of the binder to remove any air bubbles.
7.10 Stir the mix progressively around the circumference of the sample container using a digging stirring motion. This involves moving the end of the stirring rod from a point of contact between the top surface of the binder and container wall, down the inside wall of the container, and along the base of the container towards its centre. The stirring rod is then pulled back through the binder, retracing the same path but without being fully removed from the sample (Note 10.4).
7.11 Apply a localised heating device to the surface of the binder to remove any air bubbles.
7.12 Repeat Steps 7.10 and 7.11 until no more than three air bubbles appear within 10 seconds of the completion of the stirring cycle.
7.13 Allow the sample container to cool to room temperature in a dust free environment. Determine the mass of the sample container, binder, stirring rod and aggregate ( 7m ).
7.14 Suspend the sample container from the balance and completely immerse it in the water container. Determine the mass of the immersed sample container, binder, stirring rod and aggregate ( 8m ) (Note 10.3).
7.15 Measure the temperature of the water in the container to the nearest 1ºC.
8 Calculations
8.1 Particle density
8.1.1 Calculate the particle density on a dry basis for each of the two subsamples as follows:
( )1 w
DI2 4 3
m ρρ =m - m -m
where DIρ = subsample particle density on a dry basis (t/m3)
1m = mass of dry aggregate (g)
wρ = density of the water at test temperature (t/m3) (Table 1)
2m = mass of saturated surface-dry aggregate (g)
4m = mass of immersed basket and aggregate (g)
3m = mass of immersed basket (g)
8.2 Provided that the results from the two subsamples do not differ by more than 0.030 t/m3, calculate the average result as the sample particle density ( Dρ ) to the nearest 0.001 t/m3.

Test Method Q211: Binder absorption by aggregate
Materials Testing Manual - Part 6, Transport and Main Roads, November 2014 4 of 5
8.3 Binder absorption
8.3.1 Calculate the binder absorption for each of the two subsamples as follows:
( )( )
( )( )
5 6 7 8B
D 7 5 1 7 5 2
m -m m -m1b=100ρρ m -m ρ m -m ρ
+ −
where b = binder absorption (%)
Bρ = density of binder (t/m3) (Note)
Dρ = sample particle density on a dry basis (t/m3)
5m = mass of container, binder and stirring rod (g)
6m = mass of immersed container, binder and stirring rod (g)
7m = mass of container, binder, stirring rod and aggregate (g)
1ρ = density of the water at test temperature for 6m (t/m3) (Table 1)
8m = mass of immersed container, binder, stirring rod and aggregate (g)
2ρ = density of the water at test temperature for 8m (t/m3) (Table 1)
8.4 Provided that the results from the two subsamples do not differ by more than 0.15 %, calculate the average result as the sample binder absorption to the nearest 0.01 percentage units.
9 Reporting
Report the binder absorption of the sample to the nearest 0.05 %.
10 Notes on method
10.1 A gentle current of air may be used to accelerate drying but care must be taken to avoid over-drying.
10.2 The aggregate subsample is considered to have reached a constant mass when the difference between successive weighings, after a further 1 hour drying at 105-110°C, is not more than 1 percent of the total of the previous moisture losses.
10.3 Prior to weighing, check the water container to ensure that it is filled to the overflow.
10.4 As the binder cools, the viscosity of the mix will increase. To avoid entrapment of air, stirring of the mix will need to be slowed.
10.5 If unknown, the binder density may be determined using Test Method Q331.
Table 1 – Water density
Test temperature (ºC)
Water density (t/m3)
Test temperature (ºC)
Water density (t/m3)
1 1.000 21 0.998
2 1.000 22 0.998
3 1.000 23 0.998
4 1.000 24 0.997

Test Method Q211: Binder absorption by aggregate
Materials Testing Manual - Part 6, Transport and Main Roads, November 2014 5 of 5
Test temperature (ºC)
Water density (t/m3)
Test temperature (ºC)
Water density (t/m3)
5 1.000 25 0.997
6 1.000 26 0.997
7 1.000 27 0.997
8 1.000 28 0.996
9 1.000 29 0.996
10 1.000 30 0.996
11 1.000 31 0.995
12 1.000 32 0.995
13 0.999 33 0.995
14 0.999 34 0.994
15 0.999 35 0.994
16 0.999 36 0.994
17 0.999 37 0.993
18 0.999 38 0.993
19 0.998 39 0.993
20 0.998 40 0.992

Materials Testing Manual - Part 6, Transport and Main Roads, November 2014 1 of 1
Test Method Q212A: Bitumen stripping value - standard plate
This test shall be performed in accordance with AS 1141.50: Resistance to stripping of cover aggregates from binders.

Materials Testing Manual - Part 6, Transport and Main Roads, November 2014 1 of 3
Test Method Q212B: Binder stripping value - modified plate
1 Source
This method was developed in-house and applies the principles of AS 1141.50 -1998: Resistance to stripping of cover aggregates from binders.
2 Scope
This method determines the resistance to stripping of a bituminous binder from aggregate using a modified plate stripping test. It provides a more rapid estimate of binder stripping potential than that achieved using AS 1141.50. Exclusive use of either Test Method Q212B or AS 1141.50 should be made for any series of tests.
The test procedure may be varied to allow for testing with binder containing anti-stripping agents or precoated aggregates.
3 Apparatus
The following apparatus is required:
3.1 Test plates, metal plates of 150 mm diameter with raised edges (for example, press-on lids from 4 litre containers).
3.2 Balance of suitable capacity, having a resolution of at least 0.01 g and a limit of performance within the range of ± 0.05 g.
3.3 Drying oven of suitable capacity, having a temperature of 105-110°C and complying with AS 1289.0.
3.4 Oven of suitable capacity, capable of heating a sample of binder to a temperature of 135-140°C.
3.5 Oven of suitable capacity, thermostatically controlled at a temperature of 60°C.
3.6 Water bath, thermostatically controlled at a temperature of 50ºC.
3.7 Fan, an electric fan to assist in air drying aggregate samples.
3.8 Pliers, suitable for extracting aggregate pieces from a bituminous binder.
4 Materials
The following materials are required (Note 9.1):
4.1 Bituminous binder (Note 9.2).
4.2 Cloth, suitable for cleaning test plates.
4.3 Mineral turpentine.
4.4 Acetone.
5 Preparation of test materials
5.1 Aggregates
Aggregate may be tested as received and or air dried in either the precoated or uncoated condition.
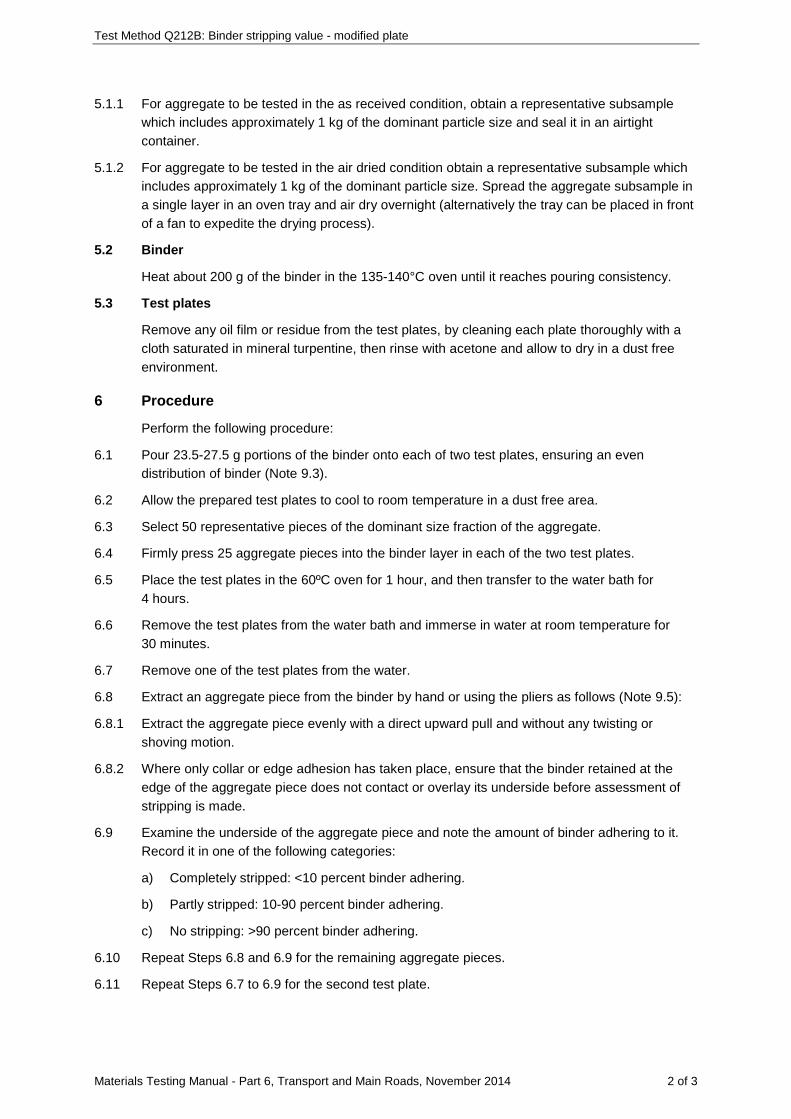
Test Method Q212B: Binder stripping value - modified plate
Materials Testing Manual - Part 6, Transport and Main Roads, November 2014 2 of 3
5.1.1 For aggregate to be tested in the as received condition, obtain a representative subsample which includes approximately 1 kg of the dominant particle size and seal it in an airtight container.
5.1.2 For aggregate to be tested in the air dried condition obtain a representative subsample which includes approximately 1 kg of the dominant particle size. Spread the aggregate subsample in a single layer in an oven tray and air dry overnight (alternatively the tray can be placed in front of a fan to expedite the drying process).
5.2 Binder
Heat about 200 g of the binder in the 135-140°C oven until it reaches pouring consistency.
5.3 Test plates
Remove any oil film or residue from the test plates, by cleaning each plate thoroughly with a cloth saturated in mineral turpentine, then rinse with acetone and allow to dry in a dust free environment.
6 Procedure
Perform the following procedure:
6.1 Pour 23.5-27.5 g portions of the binder onto each of two test plates, ensuring an even distribution of binder (Note 9.3).
6.2 Allow the prepared test plates to cool to room temperature in a dust free area.
6.3 Select 50 representative pieces of the dominant size fraction of the aggregate.
6.4 Firmly press 25 aggregate pieces into the binder layer in each of the two test plates.
6.5 Place the test plates in the 60ºC oven for 1 hour, and then transfer to the water bath for 4 hours.
6.6 Remove the test plates from the water bath and immerse in water at room temperature for 30 minutes.
6.7 Remove one of the test plates from the water.
6.8 Extract an aggregate piece from the binder by hand or using the pliers as follows (Note 9.5):
6.8.1 Extract the aggregate piece evenly with a direct upward pull and without any twisting or shoving motion.
6.8.2 Where only collar or edge adhesion has taken place, ensure that the binder retained at the edge of the aggregate piece does not contact or overlay its underside before assessment of stripping is made.
6.9 Examine the underside of the aggregate piece and note the amount of binder adhering to it. Record it in one of the following categories:
a) Completely stripped: <10 percent binder adhering.
b) Partly stripped: 10-90 percent binder adhering.
c) No stripping: >90 percent binder adhering.
6.10 Repeat Steps 6.8 and 6.9 for the remaining aggregate pieces.
6.11 Repeat Steps 6.7 to 6.9 for the second test plate.
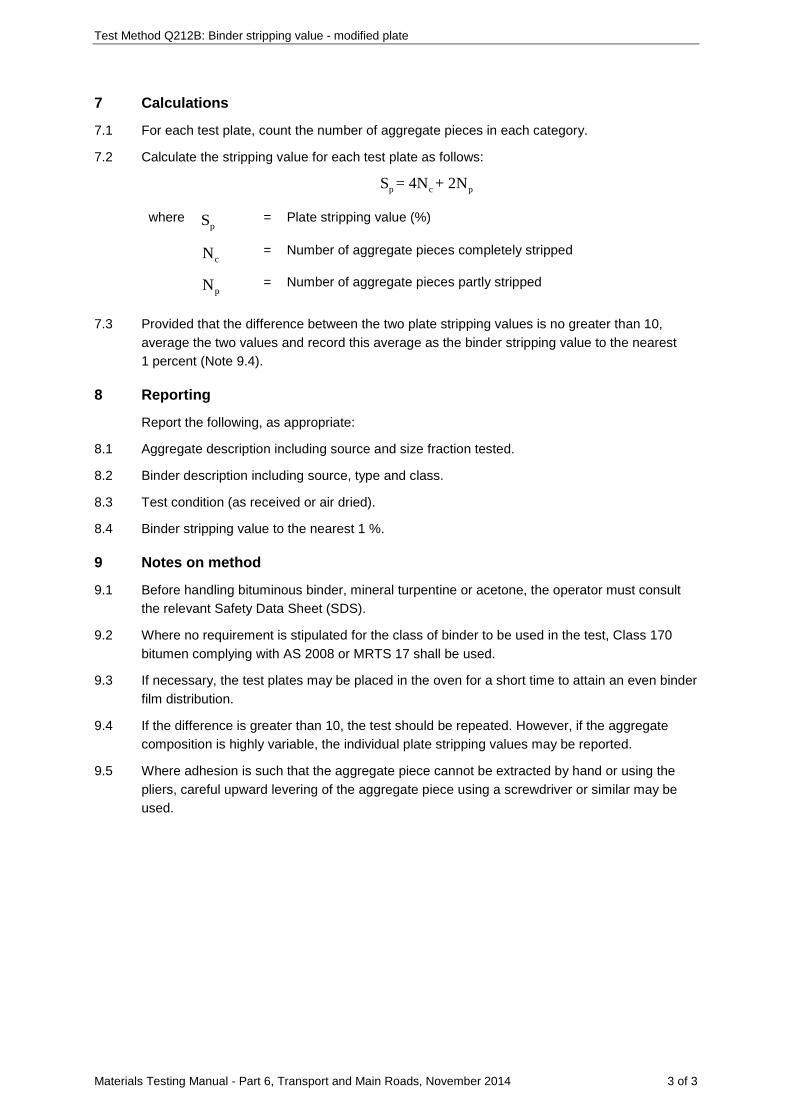
Test Method Q212B: Binder stripping value - modified plate
Materials Testing Manual - Part 6, Transport and Main Roads, November 2014 3 of 3
7 Calculations
7.1 For each test plate, count the number of aggregate pieces in each category.
7.2 Calculate the stripping value for each test plate as follows:
p c pS = 4N + 2N
where pS = Plate stripping value (%)
cN = Number of aggregate pieces completely stripped
pN = Number of aggregate pieces partly stripped
7.3 Provided that the difference between the two plate stripping values is no greater than 10, average the two values and record this average as the binder stripping value to the nearest 1 percent (Note 9.4).
8 Reporting
Report the following, as appropriate:
8.1 Aggregate description including source and size fraction tested.
8.2 Binder description including source, type and class.
8.3 Test condition (as received or air dried).
8.4 Binder stripping value to the nearest 1 %.
9 Notes on method
9.1 Before handling bituminous binder, mineral turpentine or acetone, the operator must consult the relevant Safety Data Sheet (SDS).
9.2 Where no requirement is stipulated for the class of binder to be used in the test, Class 170 bitumen complying with AS 2008 or MRTS 17 shall be used.
9.3 If necessary, the test plates may be placed in the oven for a short time to attain an even binder film distribution.
9.4 If the difference is greater than 10, the test should be repeated. However, if the aggregate composition is highly variable, the individual plate stripping values may be reported.
9.5 Where adhesion is such that the aggregate piece cannot be extracted by hand or using the pliers, careful upward levering of the aggregate piece using a screwdriver or similar may be used.

Materials Testing Manual - Part 6, Transport and Main Roads, November 2014 1 of 4
Test Method Q212C: Binder stripping value - immersion tray
1 Source
This method was developed in-house and applies the principles of AS 1141.50-1998: Resistance to stripping of cover aggregate from binders.
2 Scope
This method describes the procedure for determining the resistance to stripping of binder from aggregate using the immersion tray test. It is applicable to the assessment of the adhesion promoting properties of bitumen anti-stripping agents.
3 Apparatus
The following apparatus is required:
3.1 Test plates, metal plates of 150 mm diameter with raised edges (for example, press-on lids from 4 litre containers).
3.2 Balance, of suitable capacity, having a resolution of at least 0.01 g and a limit of performance within the range of ± 0.05 g.
3.3 Drying oven of suitable capacity, having a temperature of 105-110°C and complying with AS 1289.0.
3.4 Oven of suitable capacity, capable of heating a sample of binder to a temperature of 135-140°C.
3.5 Water bath, thermostatically controlled at a temperature of 40 ± 1ºC.
3.6 Sample container, a metal container of approximately 70 mm diameter and 250 mL volume.
3.7 Hotplate.
3.8 Pliers, suitable for extracting aggregate pieces from a bituminous binder.
4 Materials
The following materials are required (Note 9.1):
4.1 Aggregate, selected aggregate of 20 mm nominal size.
4.2 Bituminous binder, Class 170 bitumen complying with AS 2008 or MRTS 17, or other binder as specified.
4.3 Cutter, bitumen cutter oil complying with MRTS 19.
4.4 Cloth, suitable for cleaning test plates.
4.5 Mineral turpentine.
4.6 Acetone.
5 Preparation of test materials
5.1 Aggregates
Wash and dry 30 representative pieces of the dominant size fraction of the aggregate.
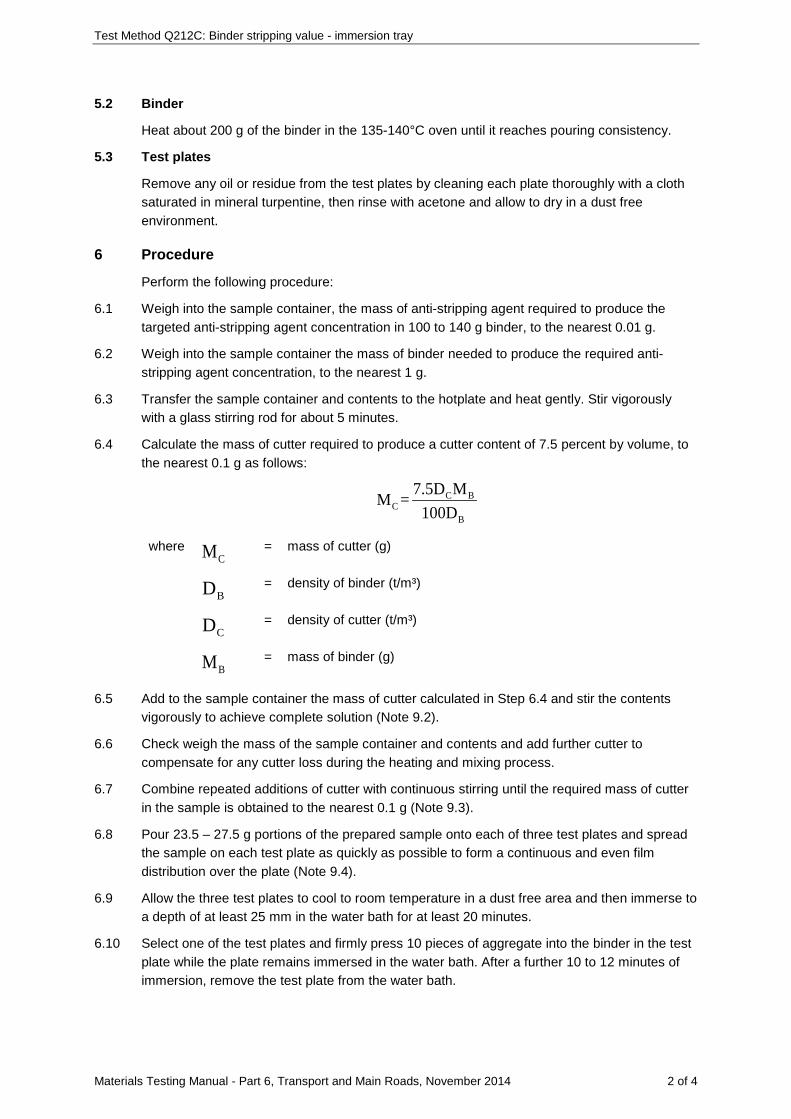
Test Method Q212C: Binder stripping value - immersion tray
Materials Testing Manual - Part 6, Transport and Main Roads, November 2014 2 of 4
5.2 Binder
Heat about 200 g of the binder in the 135-140°C oven until it reaches pouring consistency.
5.3 Test plates
Remove any oil or residue from the test plates by cleaning each plate thoroughly with a cloth saturated in mineral turpentine, then rinse with acetone and allow to dry in a dust free environment.
6 Procedure
Perform the following procedure:
6.1 Weigh into the sample container, the mass of anti-stripping agent required to produce the targeted anti-stripping agent concentration in 100 to 140 g binder, to the nearest 0.01 g.
6.2 Weigh into the sample container the mass of binder needed to produce the required anti-stripping agent concentration, to the nearest 1 g.
6.3 Transfer the sample container and contents to the hotplate and heat gently. Stir vigorously with a glass stirring rod for about 5 minutes.
6.4 Calculate the mass of cutter required to produce a cutter content of 7.5 percent by volume, to the nearest 0.1 g as follows:
C BC
B
7.5D MM =100D
where CM = mass of cutter (g)
BD = density of binder (t/m³)
CD = density of cutter (t/m³)
BM = mass of binder (g)
6.5 Add to the sample container the mass of cutter calculated in Step 6.4 and stir the contents vigorously to achieve complete solution (Note 9.2).
6.6 Check weigh the mass of the sample container and contents and add further cutter to compensate for any cutter loss during the heating and mixing process.
6.7 Combine repeated additions of cutter with continuous stirring until the required mass of cutter in the sample is obtained to the nearest 0.1 g (Note 9.3).
6.8 Pour 23.5 – 27.5 g portions of the prepared sample onto each of three test plates and spread the sample on each test plate as quickly as possible to form a continuous and even film distribution over the plate (Note 9.4).
6.9 Allow the three test plates to cool to room temperature in a dust free area and then immerse to a depth of at least 25 mm in the water bath for at least 20 minutes.
6.10 Select one of the test plates and firmly press 10 pieces of aggregate into the binder in the test plate while the plate remains immersed in the water bath. After a further 10 to 12 minutes of immersion, remove the test plate from the water bath.

Test Method Q212C: Binder stripping value - immersion tray
Materials Testing Manual - Part 6, Transport and Main Roads, November 2014 3 of 4
6.11 Extract an aggregate piece from the binder by hand or using the pliers as follows (Note 9.5):
6.11.1 Extract the aggregate piece evenly, with a direct upward pull without any twisting or shoving motion.
6.11.2 Where only collar or edge adhesion has taken place, ensure that the binder retained at the edge of the aggregate piece does not contact or overlay its underside before assessment of stripping is made.
6.12 Examine the underside of the aggregate piece and note the amount of binder adhering to it.
6.13 Rate the quantity of binder adhering on a scale of 0 to 10, with 10 being full cover.
6.14 Repeat Steps 6.11 to 6.13 for each of the remaining aggregate pieces.
6.15 Sum the ratings for all 10 aggregate pieces and record the total as the binder adhesion in percent.
6.16 Repeat Steps 6.10 to 6.15 for the remaining two test plates (Notes 9.6 and 9.7).
7 Calculations
7.1 Calculate the stripping result for each test plate to the nearest 1 % by subtracting the binder adhesion result from 100.
7.2 If the difference between the stripping results of the three test plates is less than 20 %, calculate the average of the three results to the nearest 1 % and record it as the stripping value.
7.3 If the difference between the stripping results of the three test plates exceeds 20 % but two of the results agree within 10 %, calculate the average of these two results to the nearest 1 % and record it as the stripping value.
7.4 If the difference between the stripping results of the three test plates exceeds 20 % and no two results agree within 10 %, repeat the test.
8 Reporting
Report the stripping value to the nearest 1 %.
9 Notes on method
9.1 Before handling bituminous binder, mineral turpentine, acetone or cutter, the operator must consult the relevant Safety Data Sheet (SDS).
9.2 If the contents have cooled so that thorough mixing is difficult, gentle warming of the contents is permitted.
9.3 It is important that the correct quantity of cutter is added to the binder. Varying quantities of cutter will lead to varying binder viscosities which have considerable influence on the stripping value obtained.
9.4 If the sample on the test plate has cooled so that spreading of the sample to form a continuous film over the test plate is difficult, minimal warming of the test plate in the oven is permitted. However, under no circumstances should a hotplate be used for this purpose.
9.5 Where adhesion is such that the aggregate piece cannot be extracted by hand or using the pliers, careful upward levering of the aggregate piece using a screwdriver or similar may be used.

Test Method Q212C: Binder stripping value - immersion tray
Materials Testing Manual - Part 6, Transport and Main Roads, November 2014 4 of 4
9.6 Alternatively, Steps 6.10 to 6.15 for the three test plates may be performed in parallel.
9.7 Where the stripping value for more than one aggregate type is required, the test plate may be returned to the water bath for 20 minutes and then reused for Steps 6.10 to 6.15. However, those areas on the binder surface which were previously occupied by aggregate pieces must be avoided. In this way, the test plate may be used for up to three aggregate types.

Materials Testing Manual - Part 6, Transport and Main Roads, September 2017 1 of 4
Test Method Q214: Particle density and water absorption of aggregate
1 Source
This method applies the principles of AS 1289.3.5.1: Determination of the soil particle density of a soil – Standard method to the determination of the density and water absorption of the total aggregate sample. There are also variations to the apparatus, procedures used and in the reporting intervals.
2 Scope
This method describes the procedure for the determination of the particle density and water absorption of an aggregate. The density and water absorption of the coarse fraction and the fine fraction are determined using separate procedures and a weighted average of these values is then used to determine the particle densities and water absorption of an aggregate. The method allows the proportions of the coarse and fine fractions to be determined by either weighing or particle size distribution.
3 Apparatus
The following apparatus is required:
3.1 Sieve, 4.75 mm complying with AS 1152.
3.2 Balance of suitable capacity, having a resolution of at least 1 g and with a limit of performance within the range of ± 5 g.
3.3 Containers of suitable size for drying the coarse and fine fraction subsamples prepared in Steps 4.1 and 4.2.
3.4 Drying oven of suitable capacity, having a temperature of 105-110°C and complying with AS 1141.2.
4 Procedure
The procedure shall be as follows:
4.1 Prepare the bulk sample as detailed in Section 5 of Test Method Q101 to produce two representative samples of appropriate size.
4.2 Prepare the first sample as detailed in Test Method Q101 Subsections 6.3 and 6.4 using a 4.75 mm sieve to produce an unwashed coarse fraction subsample and an unwashed fine fraction subsample. Ensure sufficient material is prepared to yield at least 10 kg retained 4.75 mm and 2000 g passing 4.75 mm.
4.3 Prepare the second sample to produce a particle size distribution subsample with a mass that complies with the minimum mass requirements of Test Method Q103B.
4.4 Thoroughly wash the coarse fraction, to remove any dust and other coatings.
4.5 Place the washed coarse fraction in a container and dry in the oven to a constant mass (Note 7.1).
4.6 Place the fine fraction in a container and dry in the oven to a constant mass (Note 7.1).
4.7 Using the subsample prepared in Step 4.3, determine the percent passing the 4.75 mm sieve ( 4.75P ) as detailed in Test Method Q103B.
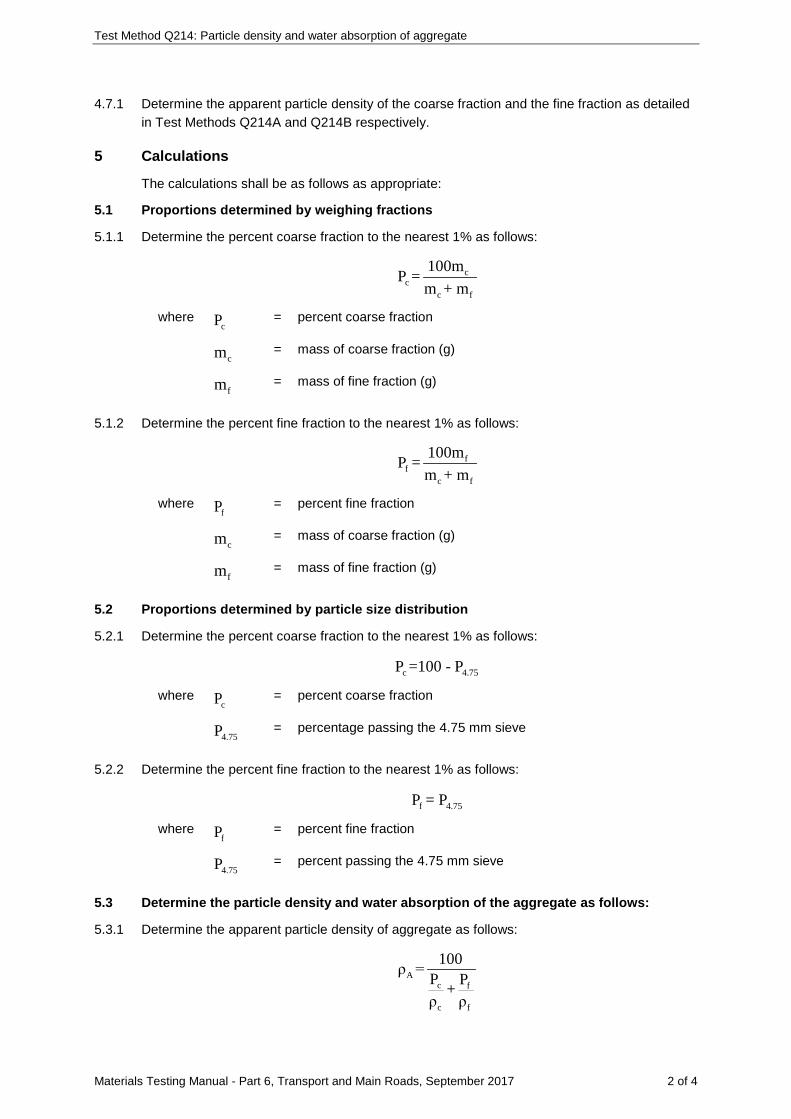
Test Method Q214: Particle density and water absorption of aggregate
Materials Testing Manual - Part 6, Transport and Main Roads, September 2017 2 of 4
4.7.1 Determine the apparent particle density of the coarse fraction and the fine fraction as detailed in Test Methods Q214A and Q214B respectively.
5 Calculations
The calculations shall be as follows as appropriate:
5.1 Proportions determined by weighing fractions
5.1.1 Determine the percent coarse fraction to the nearest 1% as follows:
cc
c f
100mP =m + m
where cP = percent coarse fraction
cm = mass of coarse fraction (g)
fm = mass of fine fraction (g)
5.1.2 Determine the percent fine fraction to the nearest 1% as follows:
ff
c f
100mP =m + m
where fP = percent fine fraction
cm = mass of coarse fraction (g)
fm = mass of fine fraction (g)
5.2 Proportions determined by particle size distribution
5.2.1 Determine the percent coarse fraction to the nearest 1% as follows:
c 4.75P =100 - P
where cP
= percent coarse fraction
4.75P = percentage passing the 4.75 mm sieve
5.2.2 Determine the percent fine fraction to the nearest 1% as follows:
f 4.75P = P
where fP
= percent fine fraction
4.75P = percent passing the 4.75 mm sieve
5.3 Determine the particle density and water absorption of the aggregate as follows:
5.3.1 Determine the apparent particle density of aggregate as follows:
Ac f
c f
100ρ = P P+ρ ρ
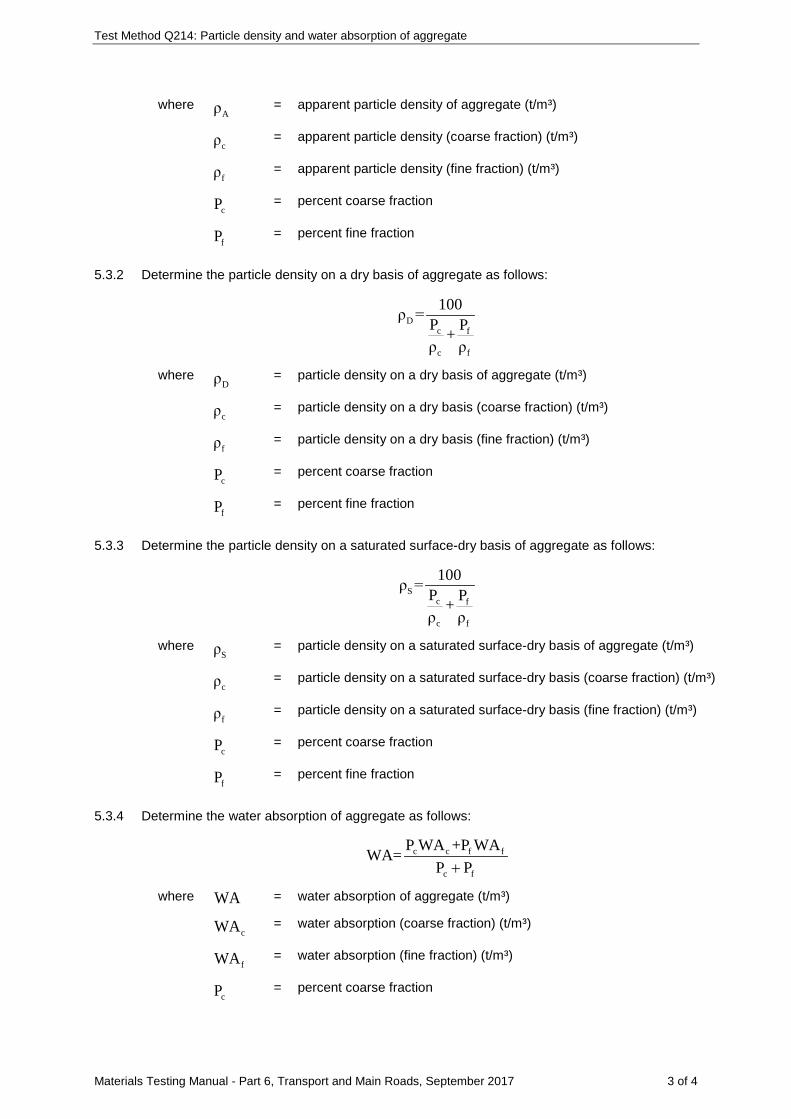
Test Method Q214: Particle density and water absorption of aggregate
Materials Testing Manual - Part 6, Transport and Main Roads, September 2017 3 of 4
where Aρ = apparent particle density of aggregate (t/m³)
cρ = apparent particle density (coarse fraction) (t/m³)
fρ = apparent particle density (fine fraction) (t/m³)
cP = percent coarse fraction
fP = percent fine fraction
5.3.2 Determine the particle density on a dry basis of aggregate as follows:
Dc f
c f
100ρ = P P+ρ ρ
where Dρ = particle density on a dry basis of aggregate (t/m³)
cρ = particle density on a dry basis (coarse fraction) (t/m³)
fρ = particle density on a dry basis (fine fraction) (t/m³)
cP = percent coarse fraction
fP = percent fine fraction
5.3.3 Determine the particle density on a saturated surface-dry basis of aggregate as follows:
Sc f
c f
100ρ = P P+ρ ρ
where Sρ = particle density on a saturated surface-dry basis of aggregate (t/m³)
cρ = particle density on a saturated surface-dry basis (coarse fraction) (t/m³)
fρ = particle density on a saturated surface-dry basis (fine fraction) (t/m³)
cP = percent coarse fraction
fP = percent fine fraction
5.3.4 Determine the water absorption of aggregate as follows:
c c f f
c f
P WA +P WAWA=P P+
where WA = water absorption of aggregate (t/m³)
cWA = water absorption (coarse fraction) (t/m³)
fWA = water absorption (fine fraction) (t/m³)
cP = percent coarse fraction

Test Method Q214: Particle density and water absorption of aggregate
Materials Testing Manual - Part 6, Transport and Main Roads, September 2017 4 of 4
fP = percent fine fraction
6 Reporting
Report the following as appropriate:
6.1 Apparent particle density to the nearest 0.01 t/m3.
6.2 Particle density on a dry basis to the nearest 0.01 t/m3.
6.3 Particle density on a saturated surface-dry basis to the nearest 0.01 t/m3.
6.4 Water absorption to the nearest 0.1%.
7 Notes on method
7.1 A fraction is considered to have reached a constant mass when the difference between successive weighings, after a further 1 hour drying at 105-110°C, is not more than 1 percent of the total of the previous moisture losses.
Materials Testing Manual - Part 6, Transport and Main Roads, September 2017 1 of 5
Test Method Q214A: Particle density and water absorption of aggregate - fine fraction
1 Source
This method applies the principles of AS 1141.5: Particle density and water absorption of fine aggregates. It differs from this Australian Standard in allowing the calculation of apparent particle density, requiring duplicate tests and in the reporting interval. Precision estimates are based on values reported in ASTM C128: Specific Gravity and Absorption of Fine Aggregate.
2 Scope
This method describes the procedure for the determination of the apparent particle density, particle density on a dry basis, particle density on a saturated surface-dry basis and water absorption of the fine fraction of an aggregate. The passing 4.75 mm material is tested in this procedure.
3 Apparatus
Where appropriate, the working tolerances of particular apparatus are contained in Table 1.
The following apparatus is required:
3.1 Sieve, 4.75 mm complying with AS 1152.
3.2 Balance of suitable capacity, with a resolution of 0.01 g and with a limit of performance within the range of ± 0.05 g.
3.3 Oven of suitable capacity having a temperature of 105-110ºC and complying with AS 1141.2.
3.4 Tray with a smooth flat surface.
3.5 Fan capable of producing a current of warm air.
3.6 Conical mould made of any suitable metal, having an internal diameter of 38 mm at the top and 90 mm at the bottom and a height of 73 mm.
3.7 Tamping rod with a mass of approximately 350 g having a flat circular tamping face of approximately 25 mm diameter.
3.8 Volumetric flask of 500 mL capacity.
3.9 Constant temperature environment such as a water bath or environmental chamber maintained at a constant temperature within the range of 20 - 30°C to within ± 1.0°C.
3.10 Wash bottle.
3.11 Thermometer, a partial or total immersion thermometer or other suitable temperature measuring device with a temperature range of 0-50ºC and graduated to 1ºC or less with an uncertainty of no more than 0.5ºC.
4 Materials
The following materials are required:
4.1 Distilled water.
4.2 Filter paper or other absorbent material.

Test Method Q214A: Particle density and water absorption of aggregate - fine fraction
Materials Testing Manual - Part 6, Transport and Main Roads, September 2017 2 of 5
5 Procedure
The procedure shall be as follows:
5.1 Prepare a representative subsample of at least 2000 g passing the 4.75 mm sieve as detailed in Test Method Q101, Subsection 6.4 for fine fraction subsamples.
5.2 Place the fine fraction subsample in the oven and dry to a constant mass (Note 9.1).
5.3 Obtain two representative test portions of approximately 1 kg from the fine fraction subsample.
5.4 Determine the mass of a volumetric flask ( 1m ).
5.5 Immerse a test portion in water and allow it to soak for at least 24 hours.
5.6 At the end of the soaking period carefully drain off the excess water and spread the test portion on the tray.
5.7 Dry the test portion using a gentle current of warm air, stirring frequently to achieve uniform drying. Continue drying until the aggregate is in a free-flowing condition.
5.8 Assess the aggregate for the saturated surface-dry condition by loosely filling the mould with aggregate and lightly tamping the top surface with 25 blows of the tamping rod.
5.9 Lift the mould vertically. If the cone of fine aggregate retains its shape, there is free moisture present and the saturated surface-dry condition has not been reached (Note 9.2).
5.10 Continue drying the test portion and test the aggregate at appropriate intervals as detailed in Steps 5.8 and 5.9, until the aggregate slumps on removal of the mould. Slumping of the aggregate indicates that the aggregate has reached a saturated surface-dry condition.
5.11 Immediately obtain a subsample of approximately 500 g of the surface-dry aggregate and place it in the volumetric flask.
5.12 Determine the mass of the flask and saturated surface-dry test portion ( 2m ).
5.13 Fill the flask to just below the 500 mL mark with distilled water and roll and shake the flask to eliminate all air bubbles.
5.14 Place the flask in the constant temperature environment for a minimum of one hour and allow it to reach an equilibrium temperature. During this time, add distilled water from the wash bottle to bring the water to the 500 mL mark (Notes 9.3 and 9.4).
5.15 When the flask and contents have reached an equilibrium temperature, measure and record the temperature of the constant temperature environment to the nearest 1ºC.
5.16 Add distilled from the wash bottle, to bring the water level to the 500 mL mark.
5.17 Dry the outside of the flask and determine the mass of the flask, test portion and water ( 3m ).
5.18 Remove all the aggregate from the flask and dry the aggregate in the oven to a constant mass (Note 9.1).
5.19 Determine the mass of the dry aggregate ( 4m ).
5.20 Clean the flask and fill it to just below the 500 mL mark with distilled water (Note 9.5).
5.21 Place the flask in the constant temperature environment for a minimum of one hour and allow it to reach equilibrium temperature. During this time, add distilled water from the wash bottle to bring the water level to the 500 mL mark.
5.22 Dry the outside of the flask then determine the mass of the flask and water ( 5m ).

Test Method Q214A: Particle density and water absorption of aggregate - fine fraction
Materials Testing Manual - Part 6, Transport and Main Roads, September 2017 3 of 5
5.23 Repeat Steps 5.4 to 5.22 for the second test portion.
6 Calculations
6.1 Calculate apparent particle density, particle density on a dry basis and particle density on a saturated surface-dry basis, as required for each test portion as follows:
6.1.1 Apparent particle density:
( ) ( )4
A w5 1 3 1 4
mρ = ρm -m - m -m -m
where Aρ = apparent particle density (t/m3)
wρ = density of water at the temperature of the constant temperature
environment (t/m3) (see Table 2)
1m = mass of flask (g)
3m = mass of flask, test portion and water (g)
4m = mass of dry test portion (g)
5m = mass of flask and water (g)
6.1.2 Particle density on a dry basis:
( ) ( )4
D w5 1 3 2
mρ = ρm -m - m -m
where Dρ
= particle density on a dry basis (t/m3)
wρ
= density of water at the temperature of the constant temperature environment (t/m3) (see Table 2)
1m = mass of flask (g)
2m = mass of flask and saturated surface-dry test portion (g)
3m
= mass of flask, test portion and water (g)
4m
= mass of dry test portion (g)
5m
= mass of flask and water (g)
6.1.3 Particle density on a saturated surface-dry basis:
( ) ( )2 1
S w5 1 3 2
m -mρ = ρm -m - m -m
where Sρ = particle density on a saturated surface-dry basis (t/m3)
wρ
= density of water at the temperature of the constant temperature environment (t/m3) (see Table 2)
1m = mass of flask (g)
2m = mass of flask and saturated surface-dry test portion (g)

Test Method Q214A: Particle density and water absorption of aggregate - fine fraction
Materials Testing Manual - Part 6, Transport and Main Roads, September 2017 4 of 5
3m
= mass of flask, test portion and water (g)
= mass of flask and water (g)
6.2 Compare corresponding density results from the two test portions and provided the difference does not exceed the relevant allowable difference in Table 3, average the results. Otherwise repeat the test.
6.3 Calculate the water absorption of each test portion as follows:
( )2 1 4
4
m -m -mWA = 100
m
where WA = water absorption (%)
1m
= mass of flask (g)
2m
= mass of flask and saturated surface-dry test portion (g)
4m
= mass of dry test portion (g)
6.4 Compare the water absorption results from the two test portions and provided the difference does not exceed the relevant allowable difference in Table 3, average the results (Note 9.6). Otherwise repeat the test.
7 Reporting
Report the average of the following as appropriate.
7.1 Apparent particle density (fine fraction) to the nearest 0.01 t/m3.
7.2 Particle density on a dry basis (fine fraction) to the nearest 0.01 t/m3.
7.3 Particle density on a saturated surface-dry basis (fine fraction) to the nearest 0.01 t/m3.
7.4 Water absorption to the nearest 0.1%.
8 Precision
The precision of the test is shown in Table 4. These values, in 95% of cases, should not be exceeded by the difference between any two results, expressed as a percentage of the average value.
9 Notes on method
9.1 The fraction is considered to have reached a constant mass when the difference between successive weighings, after a further 1 hour drying at 105-110°C, is not more than 1 percent of the total of the previous moisture losses.
9.2 If the cone of aggregate slumps at the first test, the aggregate has been dried past the saturated surface-dry condition. In this case, thoroughly mix a few millilitres of water into the fine aggregate and permit the sample to stand in a sealed container for 30 minutes prior to retesting.
9.3 Store the wash bottle in the constant temperature environment in order to minimise equilibration time.

Test Method Q214A: Particle density and water absorption of aggregate - fine fraction
Materials Testing Manual - Part 6, Transport and Main Roads, September 2017 5 of 5
9.4 Remove any froth from the flask using filter paper or other absorbent material.
9.5 The mass of the bottle filled with water may be determined at regular intervals in the constant temperature environment or it may be determined immediately after the volume of aggregate has been determined. For either determination the temperature of the constant temperature environment must be the same as the temperature in Step 5.15.
9.6 For highly absorptive materials (absorption > 5%), a wider range of results may be accepted.
Table 1 – Dimensions and tolerances for equipment
Apparatus Dimension Tolerance
Conical mould
Internal diameter – top (mm) 38 ± 3.0
Internal diameter – bottom (mm) 90 ± 3.0
Internal height (mm) 73 ± 3.0
Table 2 – Density of water
Temperature (ºC)
Density (t/m3)
Temperature (ºC)
Density (t/m3)
20 0.998 26 0.997
21 0.998 27 0.997
22 0.998 28 0.996
23 0.998 29 0.996
24 0.997 30 0.996
25 0.997 - -
Table 3 – Allowable difference between test portions
Property Allowable difference
Apparent particle density (t/m3) 0.027
Particle density on a dry basis (t/m3) 0.032
Particle density on a saturated surface-dry basis (t/m3) 0.027
Water absorption (%) 0.31
Table 4 – Acceptable range of two results expressed as a percentage of mean value
Property Repeatability Reproducibility
Apparent particle density (t/m3) 0.019 0.040
Particle density on a dry basis (t/m3) 0.023 0.047
Particle density on a saturated surface-dry basis (t/m3) 0.019 0.040
Water absorption (%) 0.22 0.47

Materials Testing Manual - Part 6, Transport and Main Roads, September 2017 1 of 6
Test Method Q214B: Particle density and water absorption of aggregate - coarse fraction
1 Source
This method applies the principles of AS 1141.6.1: Particle density and water absorption of coarse aggregates - Weighing-in-water method. It differs from this Australian Standard in allowing an additional weighing technique and in the reporting intervals. Precision estimates are based on values reported in ASTM C127: Specific Gravity and Absorption of Coarse Aggregate.
2 Scope
This method describes the procedure for the determination of the apparent particle density, particle density on a dry basis, particle density on a saturated surface-dry basis and water absorption of the coarse fraction of an aggregate. The retained 4.75 mm material is tested in this procedure with volume measurement being made using either below balance or above balance techniques.
3 Apparatus
The following apparatus is required:
3.1 Sieve, 4.75 mm complying with AS 1152.
3.2 Balance of suitable capacity, with a resolution of at least 0.1 g and with a limit of performance within the range of ± 0.5 g. For the below balance technique, a balance capable of below balance weighing is required (Subsection 4.6 only). For the above balance technique, a second balance is desirable.
3.3 Oven of suitable capacity having a temperature of 105-110ºC and complying with AS 1141.2.
3.4 Container of suitable capacity to contain the wire basket. An overflow is required (Subsection 4.6 only).
3.5 Balance bench, equipped with a hole for below balance weighing (Subsection 4.6 only).
3.6 Wire basket of suitable capacity to contain the test portion and a thin wire to suspend the basket.
3.7 Thermometer, a partial or total immersion thermometer or other suitable temperature measuring device with a temperature range of at least 0-50ºC and graduated to 1ºC or less with an uncertainty of no more than 0.5ºC.
3.8 Laboratory stand (Subsection 4.7 only).
3.9 Absorbent cloth and a fan (optional).
4 Procedure
The procedure shall be as follows:
4.1 Prepare a representative washed subsample of at least 10 kg retained on the 4.75 mm sieve as detailed in Test Method Q101, Subsection 6.3 for coarse fraction subsamples.
4.2 Place the coarse fraction subsample in the oven and dry to a constant mass (Note 8.1).
4.3 Obtain two representative test portions of approximately 5 kg from the coarse fraction subsample.
4.4 Determine the mass ( 1m ) of a test portion and immerse it in water for at least 24 hours.
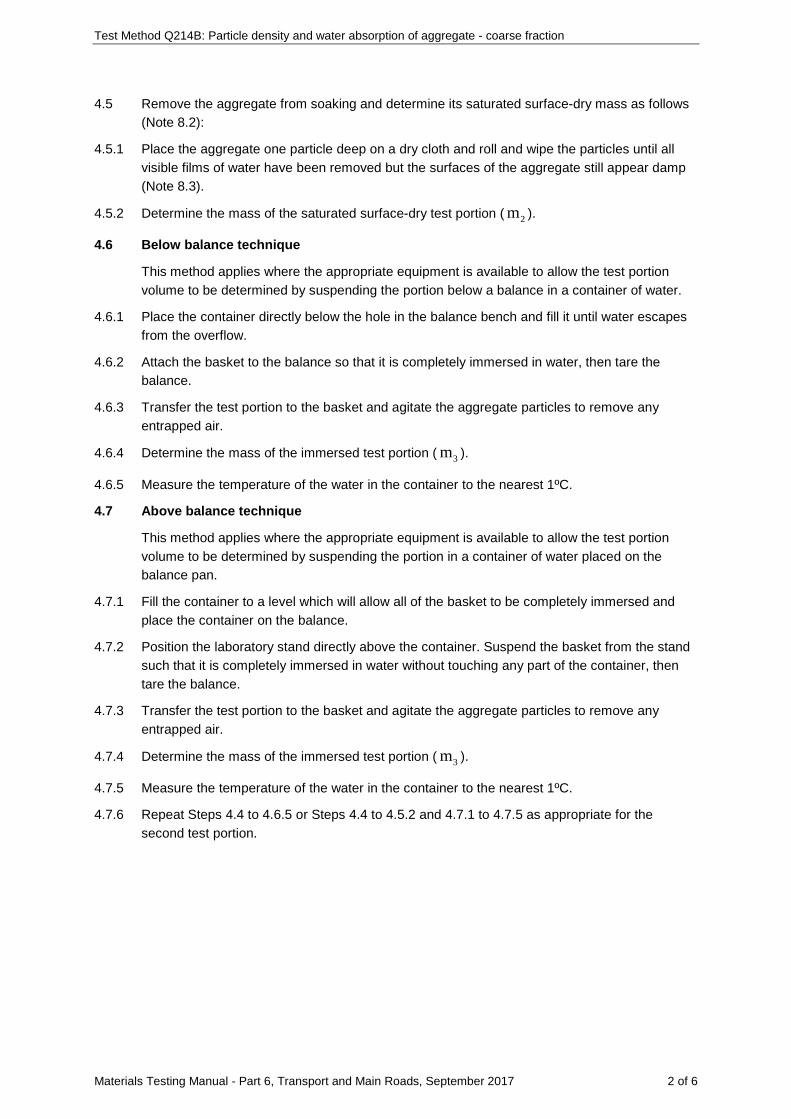
Test Method Q214B: Particle density and water absorption of aggregate - coarse fraction
Materials Testing Manual - Part 6, Transport and Main Roads, September 2017 2 of 6
4.5 Remove the aggregate from soaking and determine its saturated surface-dry mass as follows (Note 8.2):
4.5.1 Place the aggregate one particle deep on a dry cloth and roll and wipe the particles until all visible films of water have been removed but the surfaces of the aggregate still appear damp (Note 8.3).
4.5.2 Determine the mass of the saturated surface-dry test portion ( 2m ).
4.6 Below balance technique
This method applies where the appropriate equipment is available to allow the test portion volume to be determined by suspending the portion below a balance in a container of water.
4.6.1 Place the container directly below the hole in the balance bench and fill it until water escapes from the overflow.
4.6.2 Attach the basket to the balance so that it is completely immersed in water, then tare the balance.
4.6.3 Transfer the test portion to the basket and agitate the aggregate particles to remove any entrapped air.
4.6.4 Determine the mass of the immersed test portion ( 3m ).
4.6.5 Measure the temperature of the water in the container to the nearest 1ºC.
4.7 Above balance technique
This method applies where the appropriate equipment is available to allow the test portion volume to be determined by suspending the portion in a container of water placed on the balance pan.
4.7.1 Fill the container to a level which will allow all of the basket to be completely immersed and place the container on the balance.
4.7.2 Position the laboratory stand directly above the container. Suspend the basket from the stand such that it is completely immersed in water without touching any part of the container, then tare the balance.
4.7.3 Transfer the test portion to the basket and agitate the aggregate particles to remove any entrapped air.
4.7.4 Determine the mass of the immersed test portion ( 3m ).
4.7.5 Measure the temperature of the water in the container to the nearest 1ºC.
4.7.6 Repeat Steps 4.4 to 4.6.5 or Steps 4.4 to 4.5.2 and 4.7.1 to 4.7.5 as appropriate for the second test portion.

Test Method Q214B: Particle density and water absorption of aggregate - coarse fraction
Materials Testing Manual - Part 6, Transport and Main Roads, September 2017 3 of 6
5 Calculations
Calculate apparent particle density and particle densities as required for each test portion using the appropriate calculation as follows:
5.1 Below balance weighing
5.1.1 Apparent particle density:
1A w
1 3
mρ = ρm -m
where Aρ = apparent particle density (t/m3)
wρ = density of water at the test temperature (t/m3) (Table 1)
1m = mass of dry test portion (g)
3m = mass of fully immersed test portion (g)
5.1.2 Particle density on a dry basis:
1D w
2 3
mρ = ρm -m
where Dρ
= particle density on a dry basis (t/m3)
wρ = density of water at the test temperature (t/m3) (Table 1)
1m = mass of dry test portion (g)
2m = mass of saturated surface-dry test portion (g)
3m
= mass of fully immersed test portion (g)
5.1.3 Particle density on a saturated surface-dry basis:
2S w
2 3
mρ = ρm -m
where Sρ = particle density on a saturated surface-dry basis (t/m3)
wρ = density of water at the test temperature (t/m3) (Table 1)
2m
= mass of saturated surface-dry test portion (g)
3m
= mass of fully immersed test portion (g)
5.2 Above balance weighing
5.2.1 Apparent particle density:
( )1
A w3 2 1
mρ = ρm - m -m

Test Method Q214B: Particle density and water absorption of aggregate - coarse fraction
Materials Testing Manual - Part 6, Transport and Main Roads, September 2017 4 of 6
where Aρ
= apparent particle density (t/m3)
wρ = density of water at the test temperature (t/m3) (Table 1)
1m
= mass of dry test portion (g)
2m
= mass of saturated surface-dry test portion (g)
3m
= mass of fully immersed test portion (g)
5.2.2 Particle density on a dry basis:
1D w
3
mρ = ρm
where Dρ
= particle density on a dry basis (t/m3)
wρ = density of water at the test temperature (t/m3) (Table 1)
1m
= mass of dry test portion (g)
3m
= mass of fully immersed test portion (g)
5.2.3 Particle density on a saturated surface-dry basis:
2S w
3
mρ = ρm
where Sρ
= particle density on a saturated surface-dry basis (t/m3)
wρ = density of water at the test temperature (t/m3) (Table 1)
2m
= mass of saturated surface-dry test portion (g)
3m
= mass of fully immersed test portion (g)
5.3 Compare corresponding density results from the two test portions and provided the difference does not exceed the relevant allowable difference in Table 2, average the results. Otherwise repeat the test.
5.4 Calculate the water absorption of each test portion as follows:
( )2 1
1
m -mWA = 100
m
where WA = water absorption (%)
2m
= mass of saturated surface-dry test portion (g)
1m
= mass of dry test portion (g)
5.5 Compare the water absorption results from the two test portions and provided the difference does not exceed the relevant allowable difference in Table 2, average the results (Note 8.4). Otherwise repeat the test.

Test Method Q214B: Particle density and water absorption of aggregate - coarse fraction
Materials Testing Manual - Part 6, Transport and Main Roads, September 2017 5 of 6
6 Reporting
Report the average of the following as appropriate.
6.1 Apparent particle density (coarse fraction) to the nearest 0.01 t/m3.
6.2 Particle density on a dry basis (coarse fraction) to the nearest 0.01 t/m3.
6.3 Particle density on a saturated surface-dry basis (coarse fraction) to the nearest 0.01 t/m3.
6.4 Water absorption to the nearest 0.1%.
7 Precision
The precision of the test is shown in Table 3. These values, in 95% of cases, should not be exceeded by the difference between any two results, expressed as a percentage of the average value.
8 Notes on method
8.1 The fraction is considered to have reached a constant mass when the difference between successive weighings, after a further 1 hour drying at 105-110°C, is not more than 1 percent of the total of the previous moisture losses.
8.2 Where only the apparent particle density is required and below balance weighing is being used, it is not necessary to surface dry the aggregate particles.
8.3 A gentle current of air may be used to accelerate drying but care must be taken to avoid over-drying.
8.4 For highly absorptive materials (absorption > 5%), a wider range of results may be accepted.
Table 1 - Density of water
Temperature (°C)
Density (t/m³)
Temperature (°C)
Density (t/m³)
Temperature (°C)
Density (t/m³)
0 1.000 14 0.999 28 0.996
1 1.000 15 0.999 29 0.996
2 1.000 16 0.999 30 0.996
3 1.000 17 0.999 31 0.995
4 1.000 18 0.999 32 0.995
5 1.000 19 0.998 33 0.995
6 1.000 20 0.998 34 0.994
7 1.000 21 0.998 35 0.994
8 1.000 22 0.998 36 0.994
9 1.000 23 0.998 37 0.993
10 1.000 24 0.997 38 0.993
11 1.000 25 0.997 39 0.993
12 1.000 26 0.997 40 0.992
13 0.999 27 0.997
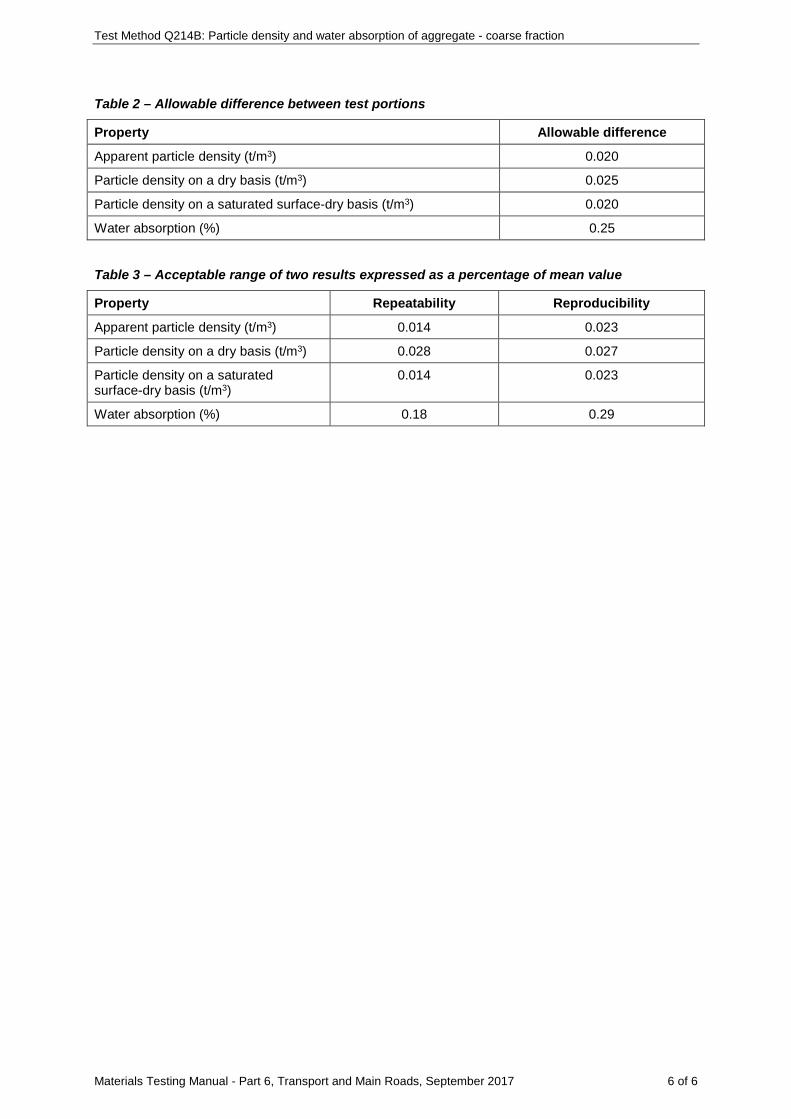
Test Method Q214B: Particle density and water absorption of aggregate - coarse fraction
Materials Testing Manual - Part 6, Transport and Main Roads, September 2017 6 of 6
Table 2 – Allowable difference between test portions
Property Allowable difference
Apparent particle density (t/m3) 0.020
Particle density on a dry basis (t/m3) 0.025
Particle density on a saturated surface-dry basis (t/m3) 0.020
Water absorption (%) 0.25
Table 3 – Acceptable range of two results expressed as a percentage of mean value
Property Repeatability Reproducibility
Apparent particle density (t/m3) 0.014 0.023
Particle density on a dry basis (t/m3) 0.028 0.027
Particle density on a saturated surface-dry basis (t/m3)
0.014 0.023
Water absorption (%) 0.18 0.29

Materials Testing Manual - Part 6, Transport and Main Roads, November 2014 1 of 3
Test Method Q215: Crushed particles of aggregate
1 Source
This method was developed in-house using techniques evolved through internal departmental research investigations.
2 Scope
This method describes a procedure for determining the percentage by mass of crushed particles in aggregate derived from rounded gravel. It involves the visual assessment of particles retained on the 4.75 mm sieve which have two or more crushed faces.
3 Definitions
3.1 Crushed face – a mechanically fractured face which is rough in texture with sharp edges.
3.2 Crushed particle – a particle having two or more crushed faces, the combined surface area of which is judged to be at least 50% of the total surface area of the particle.
4 Apparatus
The following apparatus is required:
4.1 Balance of suitable capacity, having a resolution of at least 1 g and with a limit of performance within the range of ± 5 g.
4.2 Sieves, 37.5 mm, 26.5 mm, 19.0 mm, 16.0 mm, 13.2 mm, 9.50 mm, 6.70 mm and 4.75 mm as required, complying with AS 1152.
4.3 Drying oven of suitable capacity, having a temperature of 105-110ºC and complying with AS 1141.2.
4.4 Sample dividers.
4.5 Sieve brushes.
4.6 Container of suitable size, for drying the test portion.
4.7 Dishes and trays.
5 Procedure
The procedure shall be as follows:
5.1 Particle size distribution
5.1.1 Prepare the bulk sample as detailed in Section 5 of Test Method Q101 to obtain a test portion which, when dry, will comply with the minimum mass requirement of Test Method Q103B Table 1.
5.1.2 Place the test portion in the container and dry in the oven to a constant mass (Note 8.1).
5.1.3 Determine the particle size distribution of the sample as detailed in Test Method Q103B (Note 8.2).
5.2 Crushed particles
5.2.1 Combine the size fractions retained on the sieves as necessary, into the fractions shown in Table 1.

Test Method Q215: Crushed particles of aggregate
Materials Testing Manual - Part 6, Transport and Main Roads, November 2014 2 of 3
5.2.2 Include all fractions which constitute five or more per cent of the sample mass and are larger than 4.75 mm.
5.2.3 Determine the mass of each test fraction ( 1m ).
5.2.4 Using either a sample divider or by cone and quartering, obtain a test portion from each fraction to be tested:
a) of at least 200 pieces of the predominant fraction (Note 8.3), and
b) of at least 100 pieces or the complete fraction for each of the remaining fractions, whichever provides the fewer pieces for testing.
5.2.5 Determine the mass of each test portion ( 2m ).
5.2.6 Test each test portion by:
a) spreading the test portion on a clean flat surface of sufficient area to permit easy inspection
b) examining each particle and setting aside those judged to be crushed particles from the rest of the test portion.
5.2.7 Retain the crushed particles from each test portion and determine the mass ( 3m ).
6 Calculations
6.1 Calculate the total mass of sample from the particle size distribution as follows:
T 1M = m∑
where TM = mass of sample from particle size distribution (g)
1m = mass of each test fraction (g)
6.2 Calculate the percentage of crushed particles in each test portion as follows:
3
2
mP= 100m
where P = percentage of crushed particles in the test fraction
3m = mass of crushed particles in the test portion (g)
2m = mass of the test portion (g)
6.3 Calculate the weighted percentage of crushed particles in each test fraction as follows:
1W
T
PmP =M
where WP = weighted percentage of crushed particles in the test fraction
P = percentage of crushed particles in the test fraction
1m = mass of the test fraction (g)
TM = mass of sample from particle size distribution (g)

Test Method Q215: Crushed particles of aggregate
Materials Testing Manual - Part 6, Transport and Main Roads, November 2014 3 of 3
6.4 Calculate the percentage of crushed particles as follows:
S WP = P∑
where SP = crushed particles (%)
WP = weighted percentage of crushed particles in each test fraction
7 Reporting
Report the crushed particles to the nearest 1%.
8 Notes on method
8.1 The material is considered to have reached a constant mass when the difference between successive weighings, after a further 1 hour drying at 105-110°C, is not more than 1 percent of the total of the previous moisture losses.
8.2 For ease in determining the percentage crushed particles, it is advisable to keep the fractions retained on each sieve separated during the performance of Test Method Q103B.
8.3 If insufficient sample has been prepared in Step 5.1.3 such that a test portion does not satisfy the requirements of Step 5.2.4, then a further representative sample of that fraction shall be prepared until satisfactory test portions of all fractions to be tested have been obtained.
Table 1 – Test fractions
Size fractions (mm)
Passing Retained
37.5 26.5
26.5 19.0
19.0 13.2
13.2 9.50
9.50 4.75

Materials Testing Manual - Part 6, Transport and Main Roads, November 2014 1 of 2
Test Method Q216: Degree of aggregate precoating
1 Source
This method was developed in-house using techniques evolved through internal departmental research investigations.
2 Scope
This method describes a procedure for the visual assessment of the percentage of aggregate surface covered by a precoating agent. It is applicable to aggregate retained on the 4.75 mm sieve.
3 Apparatus
The following apparatus is required:
3.1 Sieve, 4.75 mm, complying with AS 1152.
3.2 Drying oven of suitable capacity, having a temperature of 45-50ºC and complying with AS 1141.2.
3.3 Container of suitable size, for drying the test portion.
3.4 Suitable gloves, for handling the precoated aggregate (Note 7.1).
4 Procedure
The procedure shall be as follows:
4.1 Prepare the bulk sample as detailed in Section 5 of Test Method Q101 to produce a representative test portion of appropriate size.
4.2 Place the test portion in the container and dry in the oven.
4.3 Screen the test portion on a 4.75 mm sieve to produce an unwashed coarse fraction.
4.4 Using either a sample divider or by cone and quartering, obtain a test portion from the material retained on the 4.75 mm sieve, of at least 100 particles.
4.5 Spread the test portion on a clean flat surface of sufficient area to permit easy inspection.
4.6 Assess the proportion of the surface area of each particle covered by the precoating agent and record the value to the nearest 10 percentage units ( ia ).
4.7 Retain the particles and determine the number of particles in the test portion ( n ).
5 Calculations
5.1 Calculate the degree of aggregate precoating as follows:
iPC
aP =n∑
where PCP = degree of aggregate precoating (%)
ia = percentage of surface area of each particle covered by precoating
agent
n = number of particles in the test portion

Test Method Q216: Degree of aggregate precoating
Materials Testing Manual - Part 6, Transport and Main Roads, November 2014 2 of 2
6 Reporting
Report the degree of aggregate precoating to the nearest 1%.
7 Notes on method
7.1 Before handling the precoated aggregate, the operator must consult the relevant Safety Data Sheet (SDS) for the precoating agent used.

Materials Testing Manual - Part 6, Transport and Main Roads, November 2014 1 of 2
Test Method Q217: Weak particles in aggregate
1 Source
This method applies the principles of AS 1141.32: Weak particles (including clay lumps and soft and friable particles) in coarse aggregates. It differs from this standard in that testing is performed on material ≥ 4.75 mm, the measurement excludes any dust adhering to the aggregate or generated during the test, and the proportion of weak particles is expressed as a percentage by number.
2 Scope
This method describes the procedure for determining the number of weak particles in a coarse aggregate material, expressed as a percentage of the total number of aggregate particles. Weak particles include clay lumps and particles that are soft and friable.
3 Apparatus
The following apparatus is required:
3.1 Sieve, 4.75 mm complying with AS 1152.
3.2 Riffle, of suitable size.
3.3 Container, of suitable size.
4 Procedure
The procedure shall be as follows:
4.1 Prepare the bulk sample as detailed in Section 5 of Test Method Q101 to produce a representative sample of appropriate size.
4.2 Sieve the sample over a 4.75 mm sieve, taking care to minimise any breakdown of particles including clay lumps and soil aggregations.
4.3 Riffle the material retained on the 4.75 mm sieve to obtain a representative test portion of at least 300 particles, again taking care to minimise any breakdown of particles including clay lumps and soil aggregations.
4.4 Record the number of particles in the test portion ( 1N ).
4.5 Spread the test portion in a single layer on the bottom of the container, cover the particles with water and allow them to soak overnight.
4.6 Drain the water from the container and firmly press each particle against the bottom of the container using finger pressure. Record the number of particles that break or deform under finger pressure ( 2N ).
5 Calculations
Calculate the proportion of weak particles in the sample as follows:
2
1
100NW=N
where W = weak particles expressed as a proportion of the total number of aggregate particles (%)

Test Method Q217: Weak particles in aggregate
Materials Testing Manual - Part 6, Transport and Main Roads, November 2014 2 of 2
2N = number of weak particles in the test portion
1N = total number of particles in the test portion
6 Reporting
Report the proportion of weak particles to the nearest 0.1%.
Materials Testing Manual - Part 6, Transport and Main Roads, November 2014 1 of 2
Test Method Q221A: Loose unit mass of aggregate
1 Source
This method is based on AS 1141.4: Bulk density of aggregate. It differs from this Australian Standard in aggregate preparation details and in some minor procedural techniques.
2 Scope
This method describes the procedure for the determination of the loose unit mass of aggregate. The test shall normally be performed on aggregate dried to constant mass as described herein, but may be performed at other moisture conditions if specifically required.
3 Apparatus
The following apparatus is required:
3.1 Balance of suitable capacity, providing a resolution and a limit of performance as detailed in Table 1.
3.2 Cylindrical measure of appropriate volume, complying with the requirements of Table 1.
3.3 Oven of suitable capacity, having a temperature of 105-110ºC and complying with AS 1141.2.
3.4 Scoop, flat bottomed.
3.5 Container, of suitable size for drying aggregate.
3.6 Straightedge, about 500 mm long, 25 mm wide and 3 mm thick, preferably with a bevelled edge.
4 Procedure
The procedure shall be as follows:
4.1 Determine the nominal size of the aggregate by assessing the sieve size at which not more than 10 per cent of the particles are larger.
4.2 Prepare the sample as detailed in Section 5 of Test Method Q101 to obtain a test portion which, when dry, will slightly overfill the appropriate measure listed in Table 1.
4.3 Place the test portion in the container and dry in the oven until the test portion has reached a constant mass (Note 8.1).
4.4 Determine the loose mass of aggregate to fill the measure as follows:
4.4.1 Determine the mass of the measure ( 1m ).
4.4.2 Fill the measure in one layer by allowing the aggregate to fall freely from the scoop held at height approximately 50 mm above the top of the measure. As each scoopful is being placed, move the scoop around the perimeter of the measure to provide a roughly symmetrical distribution pattern and to avoid segregation of the aggregate.
4.4.3 When the measure is filled, level the surface with the straightedge so that the portions of aggregate projecting above the top of the measure are approximately balanced by voids of about the same volume below the top of the measure.
4.4.4 Determine the mass of aggregate and the measure ( 2m ).

Test Method Q221A: Loose unit mass of aggregate
Materials Testing Manual - Part 6, Transport and Main Roads, November 2014 2 of 2
5 Calculations
5.1 Calculate the loose unit mass of aggregate as follows:
2 1l
m -mρ =V
where lρ = loose unit mass (t/m3)
2m = mass of aggregate and measure (g)
1m = mass of measure (g)
V = volume of measure (cm3) (Note 8.2)
6 Reporting
Report the following values and general information:
6.1 Loose unit mass of the aggregate to the nearest 0.01 t/m3.
6.2 Moisture condition of the aggregate, if not oven dried.
7 Precision
7.1 Repeatability
The results of duplicate tests by the same operator are acceptable if they do not differ by more than 2% of the average value.
8 Notes on method
8.1 The material is considered to have reached a constant mass when the difference between successive weighings, after a further 1 hour drying at 105-110°C, is not more than 1 percent of the total of the previous moisture losses.
8.2 The volume of the measure is to be determined from the mass of water to fill the measure and the water density at the temperature of determination.
Table 1 – Measure and balance requirements
Aggregate nominal size
(mm)
Nominal measure capacity
(litre)
Minimum internal diameter
(mm)
Minimum internal depth
(mm)
Balance resolution
(g)
Limit of performance
range (g)
> 20 25 350 250 10 ± 50
5-20 10 250 220 10 ± 50
< 5 5 200 170 1 ± 5
Materials Testing Manual - Part 6, Transport and Main Roads, November 2014 1 of 3
Test Method Q221B: Compacted unit mass of aggregate
1 Source
This method is based on AS 1141.4: Bulk density of aggregate. It differs from this Australian Standard in aggregate preparation details and in some minor procedural techniques.
2 Scope
This method describes the procedure for the determination of the compacted unit mass of aggregate. The test shall normally be performed on aggregate dried to constant mass as described herein, but may be performed at other moisture conditions if specifically required.
3 Apparatus
The following apparatus is required:
3.1 Balance of suitable capacity, providing a resolution and a limit of performance as detailed in Table 1.
3.2 Cylindrical measure of appropriate volume, complying with the requirements of Table 1.
3.3 Oven of suitable capacity, having a temperature of 105-110ºC and complying with AS 1141.2.
3.4 Tamping rod, metal rod 16 ± 1 mm in diameter, approximately 600 mm long and having at least one end tapered for a distance of approximately 25 mm to a spherical shape having a diameter of approximately 10 mm.
3.5 Scoop, flat bottomed.
3.6 Container, of suitable size for drying aggregate.
3.7 Straightedge, about 500 mm long, 25 mm wide and 3 mm thick, preferably with a bevelled edge.
4 Procedure
The procedure shall be as follows:
4.1 Determine the nominal size of the aggregate by assessing the sieve size at which not more than 10 per cent of the particles are larger.
4.2 Prepare the sample as detailed in Section 5 of Test Method Q101 to obtain a test portion which, when dry, will slightly overfill the appropriate measure listed in Table 1.
4.3 Place the test portion in the container and dry in the oven until the test portion has reached a constant mass (Note 8.1).
4.4 Determine the compacted mass of aggregate to fill the measure as follows:
4.4.1 Determine the mass of the measure ( 1m ).
4.4.2 Fill the measure to about one-third of its capacity. Roughly level the surface of the aggregate and tamp with 25 strokes of the tamping rod, but avoiding striking the bottom of the measure with the rod.
4.4.3 Add a further quantity of aggregate to bring the measure to about two-thirds full. Roughly level the surface and tamp with 25 strokes of the tamping rod, endeavouring to just penetrate the underlying layer with the first few strokes.
Test Method Q221B: Compacted unit mass of aggregate
Materials Testing Manual - Part 6, Transport and Main Roads, November 2014 2 of 3
4.4.4 Fill the measure to overflowing and roughly level the surface of the aggregate. Tamp with 25 strokes of the tamping rod, endeavouring to just penetrate the underlying layer with the first few strokes.
4.4.5 Level the surface with the straightedge so that portions of aggregate projecting above the top of the measure are approximately balanced by voids of about the same volume below the top of the measure.
4.4.6 Determine the mass of aggregate and the measure ( 2m ).
5 Calculations
5.1 Calculate the compacted unit mass of aggregate as follows:
2 1c
m -mρ =V
where cρ = compacted unit mass (t/m3)
2m = mass of aggregate and measure (g)
1m = mass of measure (g)
V = volume of measure (cm3) (Note 8.2)
6 Reporting
Report the following values and general information:
6.1 Compacted unit mass of the aggregate to the nearest 0.01 t/m3.
6.2 Moisture condition of the aggregate, if not oven dried.
7 Precision
7.1 Repeatability
The results of duplicate tests by the same operator are acceptable if they do not differ by more than 1% of the average value.
8 Notes on method
8.1 The material is considered to have reached a constant mass when the difference between successive weighings, after a further 1 hour drying at 105-110°C, is not more than 1 percent of the total of the previous moisture losses.
8.2 The volume of the measure is to be determined from the mass of water to fill the measure and the water density at the temperature of determination.

Test Method Q221B: Compacted unit mass of aggregate
Materials Testing Manual - Part 6, Transport and Main Roads, November 2014 3 of 3
Table 1 – Measure and balance requirements
Aggregate nominal size
(mm)
Nominal measure capacity
(litre)
Minimum internal diameter
(mm)
Minimum internal depth
(mm)
Balance resolution
(g)
Limit of performance
range (g)
> 20 25 350 250 10 ± 50
5-20 10 250 220 10 ± 50
< 5 5 200 170 1 ± 5

Materials Testing Manual - Part 6, Transport and Main Roads, November 2014 1 of 3
Test Method Q224A: Sugar in aggregate - phenol-sulphuric acid
1 Source
This method was developed in-house and is based on a procedure described in the Laboratory Manual for Queensland Sugar Mills (5th Edition), pages 130 to 131.
2 Scope
This method sets out a procedure for the quantitative measurement of the sugar content of aggregate. It involves extraction of carbohydrate and any water-soluble matter from the aggregate using distilled water, filtering the sample solution and reacting the filtrate with concentrated sulphuric acid. The concentration of carbohydrate in the sample is determined quantitatively using a UV-Vis spectrophotometer. The test is sensitive to 1 ppm.
3 Apparatus
The following apparatus is required:
3.1 UV-Vis spectrophotometer.
3.2 Drying oven of suitable capacity, having a temperature of 105-110°C and complying with AS 1141.2.
3.3 Fume cupboard.
3.4 Balances:
3.4.1 Balance of suitable capacity, having a resolution of at least 0.01 g and with a limit of performance within the range of ± 0.05 g.
3.4.2 Balance of suitable capacity, having a resolution of at least 0.001 g and with a limit of performance within the range of ± 0.005 g.
3.5 Mechanical horizontal shaker.
3.6 Volumetric flasks, of 25 mL, 100 mL and 1000 mL capacity.
3.7 Auto-pipettes, 50 mL capacity with a resolution to 0.1 mL, 10 mL capacity with a resolution to 0.01 mL and 1 mL capacity with a resolution to 0.001 mL.
3.8 Glass weighing boats, of 10 mL capacity.
3.9 Conical flask, of 250 mL capacity fitted with a stopper.
3.10 Vials, of 25 mL capacity fitted with a screw cap.
3.11 Syringe filter, 30 mm diameter with pore size of 0.22 µm, acetate or equivalent.
3.12 Disposable syringe of 10 mL capacity with a leur lock.
3.13 Wash bottle.
4 Reagents
All reagents shall be analytical grade (Note 8.1).
4.1 Concentrated sulphuric acid (≥ 98%).
Test Method Q224A: Sugar in aggregate - phenol-sulphuric acid
Materials Testing Manual - Part 6, Transport and Main Roads, November 2014 2 of 3
4.2 1000 ppm standard sucrose solution:
• Weigh 1.000 g sucrose into a 10 mL glass weighing boat and transfer it into a 1000 mL volumetric flask using multiple rinsings with distilled water. Dilute to the mark and mix well.
4.3 5, 10, 25, 50, 100 and 250 ppm standard sucrose solutions:
• Pipette 0.50 mL, 1.00 mL, 2.50 mL, 5.00 mL, 10.00 mL and 25.00 mL of the 1000 ppm standard sucrose solution into separate 100 mL volumetric flasks. Dilute each to the mark with distilled water and mix well.
4.4 5% phenol solution:
• Weigh 1.250 g of phenol crystals into a 10 mL glass weighing boat and transfer it into a 25 mL volumetric flask using multiple rinsings with distilled water. Dilute to the mark and mix well (Note 8.2).
5 Procedure
5.1 Instrument calibration (Note 8.3)
5.1.1 Pipette 1.00 mL of a standard sucrose solution, for example 5 ppm, into a vial, add 1.00 mL of phenol solution and swirl to mix.
5.1.2 With the pipette discharge tip 2 to 3 cm above the centre of the surface of the liquid, carefully pipette (drop by drop) 5.00 mL of concentrated sulphuric acid into the vial with continuous swirling to assist mixing (Note 8.4).
5.1.3 Allow the solution to cool to room temperature.
5.1.4 Repeat Steps 5.1.1 to 5.1.3 for each of the remaining standard sucrose solutions, for example, 10 ppm, 25 ppm, 50 ppm, 100 ppm and 250 ppm, and for distilled water (0 ppm).
5.1.5 Using the UV-Vis spectrophotometer in accordance with the relevant operating instructions, determine the absorbance at 489 nm for each of the solutions prepared in Steps 5.1.1 to 5.1.4.
5.1.6 Using the data obtained from the 0 to 250 ppm solutions in Step 5.1.5, determine the linear relationship between absorbance and sugar content in the following form (Note 8.5):
A=kC
where A = absorbance at 489 nm
k = constant
C = sugar content (ppm)
5.2 Sample preparation and testing
5.2.1 Oven dry the sample. Normal overnight drying in a 105-110°C oven is sufficient.
5.2.2 Weigh 100.0 g of a representative test portion of the sample into a 250 mL conical flask and add 100.0 mL distilled water.
5.2.3 Insert the stopper and shake the contents on the horizontal shaker for 60 minutes.
5.2.4 Filter about 100.0 mL of the mixture through a 0.22 µm syringe filter into a vial (the filtered solution should be water clear).
5.2.5 Pipette 1.00 mL of the filtered solution and 1.00 mL of 5% phenol solution into another vial and swirl to mix.

Test Method Q224A: Sugar in aggregate - phenol-sulphuric acid
Materials Testing Manual - Part 6, Transport and Main Roads, November 2014 3 of 3
5.2.6 With the pipette discharge tip 2 to 3 cm above the centre of the surface of the liquid, carefully pipette (drop by drop) 5.00 mL of concentrated sulphuric acid into the vial with continuous swirling to assist mixing (Note 8.4).
5.2.7 Allow the solution to cool to room temperature.
5.2.8 Using the UV-Vis spectrophotometer in accordance with the relevant operating instructions, determine the absorbance of the solution at 489 nm (Note 8.6).
6 Calculations
Using the value of absorbance obtained for the sample solution in Step 5.2.8 and the instrument calibration determined in Step 5.1.6, calculate the sugar content to the nearest 0.1 ppm.
7 Reporting
Report the sugar content of the sample to the nearest 0.1 ppm.
8 Notes on method
8.1 Before handling reagents, the operator must consult the relevant Safety Data Sheet (SDS).
8.2 The 5% phenol solution has a shelf life of only one day.
8.3 As recommended by the instrument supplier, the instrument calibration described in Steps 5.1.1 to 5.1.6 needs only to be performed six monthly. However, an internal standard sample should always be tested as "unknown" for each batch of testing to ensure the accuracy of the test. Recalibration needs to be carried out when the internal standard test fails to deliver the "true" sugar content of the standard.
8.4 This reaction is highly exothermic and extreme caution needs to be exercised during addition of the acid. This step should be performed in a fume cupboard together with the use of other appropriate protective equipment.
8.5 Most UV-Vis spectrophotometers have built-in software to determine absorbance/ concentration relationships and sample concentrations derived from these relationships. In such cases, the calibration need not be calculated and the sugar content of the sample may be read directly from the instrument.
8.6 The brand of UV-Visible cells used can influence the UV-Visible test results, although the effect is generally very small. This factor should not be ignored, especially when the sugar content is less than 10 ppm. Attention needs to be given to ensure that the same cells (same brand quartz cells) are used for both reference and unknown samples. Plastic cells should never be used for sugar testing.
Materials Testing Manual - Part 6, Transport and Main Roads, November 2014 1 of 5
Test Method Q224B: Sugar in aggregate - alpha-napthol
1 Source
This method, sometimes referred to as the Molisch test, was developed in-house and is based on a procedure described in the Laboratory Manual for Queensland Sugar Mills (5th Edition), pages 92 to 93.
2 Scope
This method sets out a procedure for detecting sugar in aggregate. It involves extraction of carbohydrate and any water-soluble matter from the aggregate using distilled water, filtering the sample solution and reacting the filtrate with concentrated sulphuric acid in the presence of α-naphthol reagent. The concentration of carbohydrate in the sample is reflected by the intensity of a violet ring which appears at the junction of two layers of liquid.
The method provides for both a qualitative indication and a semi-quantitative measurement of sugar content. The sensitivity of the test is about 10-20 ppm for soil/sand filtrates and about 5 ppm for pure sucrose aqueous solutions. Where a quantitative determination of sugar content is required, Test Method Q224A should be used.
3 Apparatus
The following apparatus is required:
3.1 Drying oven of suitable capacity, having a temperature range of 60-100°C (semi-quantitative test only).
3.2 Fume cupboard.
3.3 Balances:
3.3.1 Balance of suitable capacity, having a resolution of at least 0.01 g and with a limit of performance within the range of ± 0.05 g.
3.3.2 Balance of suitable capacity, having a resolution of at least 0.001 g and with a limit of performance within the range of ± 0.005 g.
3.4 Mechanical horizontal shaker.
3.5 Volumetric flasks, of 25 mL, 100 mL and 1000 mL capacity.
3.6 Auto-pipettes, of 5 mL and 10 mL capacity, resolution to 0.01 mL (semi-quantitative test only).
3.7 Pipettes, of 5 mL capacity.
3.8 Glass weighing boats, of 10 mL capacity (semi-quantitative test only).
3.9 Conical flasks, of 250 mL capacity fitted with a stopper.
3.10 Pasteur pipettes.
3.11 Glass filter funnels, test tubes and test tube rack.
3.12 Wash bottle.
4 Materials
The following material is required:
4.1 Filter paper, Whatman No. 42 or equivalent.
Test Method Q224B: Sugar in aggregate - alpha-napthol
Materials Testing Manual - Part 6, Transport and Main Roads, November 2014 2 of 5
5 Reagents
All reagents shall be analytical grade and the distilled water shall have a resistivity greater than 200 ohm m (Note 9.1).
5.1 Concentrated sulphuric acid (≥ 98%) (Note 9.1).
5.2 1000 ppm standard sucrose solution (semi-quantitative test only).
• Weigh 1.000 g sucrose into a 10 mL glass weighing boat and transfer it into a 1000 mL volumetric flask using multiple rinsings with distilled water. Dilute to the mark and mix well.
5.3 25, 50, 100 and 250 ppm standard sucrose solutions (semi-quantitative test only) (Note 9.2).
• Pipette 0.50 mL, 1.00 mL, 2.50 mL, 5.00 mL, 10.00 mL and 25.00 mL of the 1000 ppm standard sucrose solution into separate 100 mL volumetric flasks. Dilute each to the mark with distilled water and mix well.
5.4 α-Naphthol solution.
• Weigh 5.0 g α-naphthol into a 10 mL glass weighing boat and transfer it into a 25 mL volumetric flask using multiple rinsings with ethyl alcohol. Dilute to the mark and mix well (Note 9.3).
6 Procedure: qualitative indication
6.1 Weigh 100.0 g of a representative sample into a 250 mL conical flask and add 100.0 g distilled water.
6.2 Insert the stopper and shake the contents on the horizontal shaker for 60 minutes.
6.3 Filter the mixture through a Whatman No. 42 filter paper (or equivalent) into a 250 mL conical flask and stopper the flask.
6.4 Pipette 5 mL of the filtrate into a test tube, add five drops of α-naphthol solution and swirl to mix.
6.5 Incline the test tube and carefully and slowly add 5 mL concentrated sulphuric acid so that two clearly defined liquid layers are formed (Note 9.4).
6.6 Allow five minutes to elapse after the addition of the sulphuric acid, then examine the interface between the two layers. Record the presence or otherwise of any violet colouration.
7 Procedure: semi-quantitative measurement
7.1 Oven dry the sample until it has reached constant mass (Note 9.5).
7.2 Weigh 100.0 g of a representative test portion of the sample into a 250 mL conical flask and add 100 g distilled water.
7.3 Insert the stopper and shake the contents on the horizontal shaker for 60 minutes.
7.4 Filter the mixture through a Whatman No. 42 filter paper (or equivalent) into a 250 mL conical flask and stopper the flask.
7.5 Pipette 5.00 mL of the filtrate into a test tube, add five drops of α-naphthol solution and swirl to mix.
7.6 Incline the test tube and carefully and slowly add 5.00 mL concentrated sulphuric acid so that two clearly defined liquid layers are formed (Note 9.4).

Test Method Q224B: Sugar in aggregate - alpha-napthol
Materials Testing Manual - Part 6, Transport and Main Roads, November 2014 3 of 5
7.7 Allow five minutes to elapse after the addition of the last drop of sulphuric acid, then compare the colour of the sample solution with that of the reference standards given in Figure 1. Record the concentration of the two reference standards spanning the nearest match (Note 9.6).
7.8 Prepare the two standard sucrose solutions at the concentrations noted in Step 7.7.
7.9 Pipette 5.00 mL from each of the sample solution (Step 7.4) and two standard sucrose solutions into separate test tubes, add five drops of α-naphthol solution to each test tube and swirl to mix.
7.10 Incline each test tube and carefully and slowly add 5.00 mL concentrated sulphuric acid so that two clearly defined liquid layers are formed (Note 9.4). Position each test tube in a test tube rack.
7.11 Allow five minutes to elapse after the addition of the last drop of sulphuric acid, then compare the colour of the sample solution with that of the standard sucrose solutions and record the concentration of the nearest match (Notes 9.7 and 9.8).
8 Reporting
8.1 Qualitative indication
Report the presence of sugar as positive if any violet colouration was observed in Step 6.6. Otherwise, report it as negative.
8.2 Semi-quantitative measurement
Report the sugar content corresponding to the nearest match in one of the following forms:
a) Sugar = 0 ppm (no violet colouration)
b) 0 ppm < Sugar < 10 ppm
c) ppm < Sugar < 25 ppm
d) 25 ppm < Sugar < 50 ppm
e) 50 ppm < Sugar < 100 ppm
f) 100 ppm < Sugar < 250 ppm
g) Sugar > 250 ppm.
9 Notes on method
9.1 Before handling reagents, the operator must consult the relevant Safety Data Sheet (SDS).
9.2 Only two of these solutions which most closely match the sample solution may be required.
9.3 The α-naphthol solution has a shelf life of about one week and should be stored in the dark when not in use.
9.4 This step should be carried out in a fume cupboard together with the use of other appropriate personal protective equipment (PPE).
9.5 The sample is considered to have reached a constant mass when the difference between successive weighings, after a further 1 hour drying at 105-110°C, is not more than 1 percent of the total of the previous moisture losses.
9.6 If the colour of the sample solution does not match the colours of the printed reference standards, the intensity of colour should be used to select the two concentrations providing the nearest match.

Test Method Q224B: Sugar in aggregate - alpha-napthol
Materials Testing Manual - Part 6, Transport and Main Roads, November 2014 4 of 5
9.7 Since it is not possible to directly compare all three solutions five minutes after the addition of the last drop of concentrated sulphuric acid, some subjective judgement will be required.
9.8 Any unusual variations in colour from the standard sucrose solutions generally indicate that the sample contains other water soluble salts, anions or cations. If the colour of the sample solution does not match the colours of the standard sucrose solutions, the intensity of colour should be used to select the concentration providing the nearest match.
Figure 1 – Reference standards
10 ppm
25 ppm
50 ppm
100 ppm
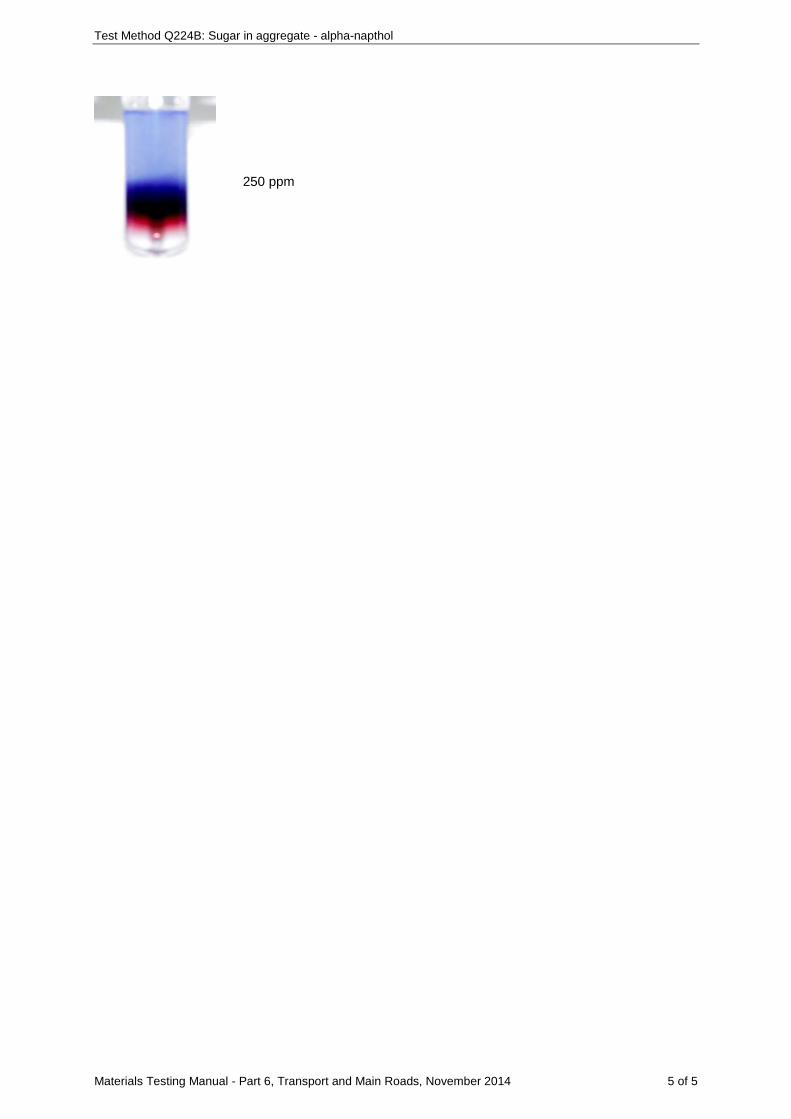
Test Method Q224B: Sugar in aggregate - alpha-napthol
Materials Testing Manual - Part 6, Transport and Main Roads, November 2014 5 of 5
250 ppm

Materials Testing Manual - Part 6, Transport and Main Roads, November 2014 1 of 4
Test Method Q225: Dustiness of cover aggregate
1 Source
This method applies the principles of AS 1141.11: Particle size distribution by sieving. It differs from this standard in that aggregates are always washed prior to dry sieving, techniques are limited to hand sieving only and a finer reporting interval is used.
2 Scope
This method describes the procedure for characterising the dust portion of unprecoated cover aggregate by determining the particle size distribution of the fine material following washing and dry sieving.
3 Apparatus
The following apparatus is required:
3.1 Balance of suitable capacity, having at least the resolution and a limit of performance within the range detailed in Table 1 (Note 8.1).
3.2 Sieves:
3.2.1 The range of sieves specified for the nominal aggregate size but also including 4.75 mm, 2.36 mm, 1.18 mm, 0.600 mm, 0.300 mm, 0.150 mm and 0.075 mm complying with AS 1152.
3.2.2 Reinforced 0.075 mm sieve complying with AS 1152 (Note 8.2).
3.3 Sieve brushes.
3.4 Drying oven of suitable capacity, having a temperature of 105-110°C and complying with AS 1141.2.
3.5 Container, of suitable size for washing and oven drying.
4 Materials
The following materials are required:
4.1 Dispersing agent:
• Prepare by dissolving 33 g of sodium hexametaphosphate (LR Grade) and 7 g of anhydrous sodium carbonate (LR Grade) or 18.9 g of sodium carbonate decahydrate (LR Grade) in one litre of water (Notes 8.3 and 8.4).
5 Procedure
The procedure shall be as follows:
5.1 Determine the nominal size of the aggregate by assessing the sieve size at which not more than 10 percent of the particles are larger. Prepare the sample as detailed in Section 5 of Test Method Q101 to obtain a test portion which, when dry, will comply with the minimum mass requirement of Table 1.
5.2 Weigh the container and record its mass ( 1m ).
5.3 Place the test portion in the container and dry in the oven to constant mass (Note 8.5). Record the mass of the container and test portion ( 2m ).

Test Method Q225: Dustiness of cover aggregate
Materials Testing Manual - Part 6, Transport and Main Roads, November 2014 2 of 4
5.4 Add sufficient clean potable water to cover the test portion. For materials which contain clay, dispersing agent which does not react with the test portion may be added to the water.
5.5 Vigorously agitate the contents without spilling the water to take the fine material into suspension and immediately pour the wash water through two sieves nested together, consisting of a guard sieve such as a 2.36 mm sieve at the top and the reinforced 0.075 mm sieve below. Avoid, as far as possible, decantation of the coarse particles of the test portion.
5.6 Continue agitation and washing until the water in the container is clean.
5.7 Wash the material retained on the 0.075 mm sieve until the wash water becomes clear. The passing 0.075 mm material is allowed to run to waste.
5.8 Return all the washed 0.075 mm sieve material to the container and decant excess water, ensuring no fines are lost.
5.9 Place the container and material in the oven and dry until the material has reached constant mass (Note 8.5).
5.10 Sieve the dried test portion by hand through the nominated sieves in order of decreasing aperture size down to and including the 0.075 mm. Ensure no sieve is overloaded by reference to Table 2.
5.11 Sieve the material using a lateral and vertical motion accompanied by a slight jarring action to keep the material moving over the sieves. It may be necessary to unblock the sieves from time to time using the hand or, in the case of fine sieves, a sieve brush (Note 8.6).
5.12 Continue this agitation until no more than a further 1 per cent by mass of residue on any individual sieve will pass that sieve during a further 1 minute of continuous hand sieving.
5.13 Weigh the aggregate retained on each sieve and record its mass ( rm ).
6 Calculations
6.1 Calculate the cumulative mass retained on each sieve as follows:
rM= m∑
where M = cumulative mass retained on each sieve (g)
rm = individual mass retained on each sieve with an aperture size larger
than or equal to the particular sieve (g)
6.2 Calculate the cumulative percent retained on each sieve to the nearest 0.1 as follows:
2 1
100MP=m -m
where P = cumulative per cent retained on each sieve
M = cumulative mass retained on each sieve (g)
2m = mass of container and dry aggregate (g)
1m = mass of container (g)
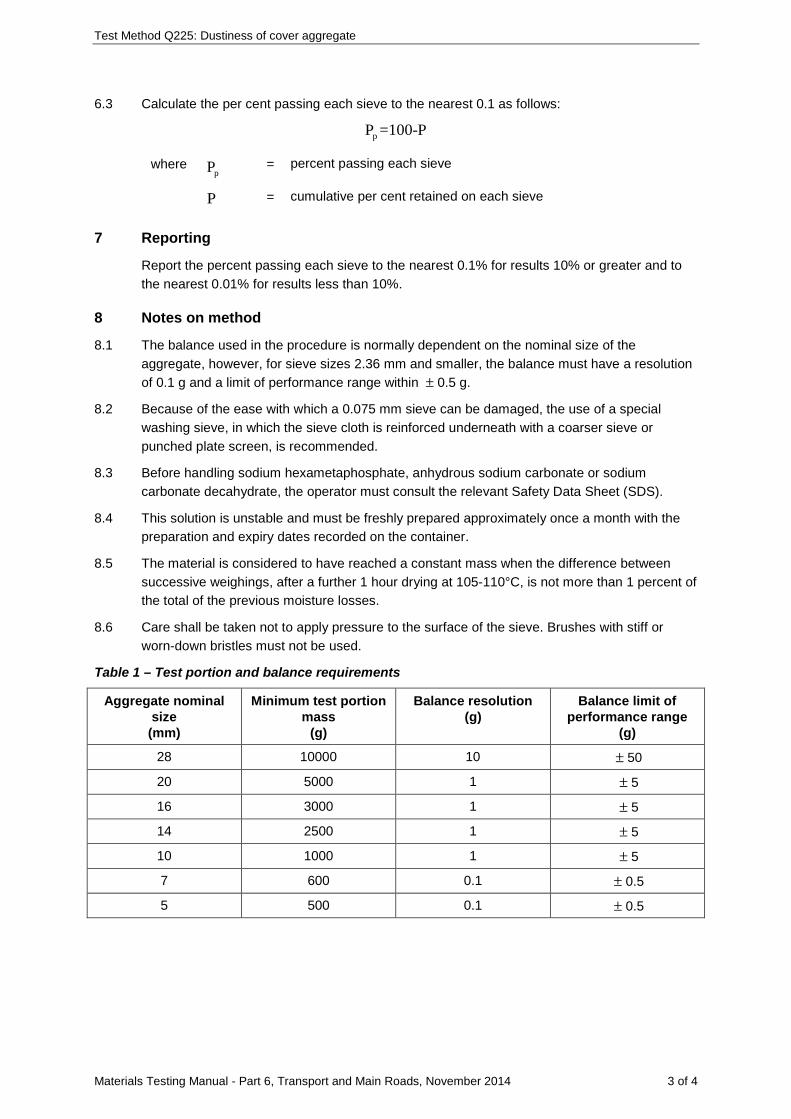
Test Method Q225: Dustiness of cover aggregate
Materials Testing Manual - Part 6, Transport and Main Roads, November 2014 3 of 4
6.3 Calculate the per cent passing each sieve to the nearest 0.1 as follows:
pP =100-P
where pP = percent passing each sieve
P = cumulative per cent retained on each sieve
7 Reporting
Report the percent passing each sieve to the nearest 0.1% for results 10% or greater and to the nearest 0.01% for results less than 10%.
8 Notes on method
8.1 The balance used in the procedure is normally dependent on the nominal size of the aggregate, however, for sieve sizes 2.36 mm and smaller, the balance must have a resolution of 0.1 g and a limit of performance range within ± 0.5 g.
8.2 Because of the ease with which a 0.075 mm sieve can be damaged, the use of a special washing sieve, in which the sieve cloth is reinforced underneath with a coarser sieve or punched plate screen, is recommended.
8.3 Before handling sodium hexametaphosphate, anhydrous sodium carbonate or sodium carbonate decahydrate, the operator must consult the relevant Safety Data Sheet (SDS).
8.4 This solution is unstable and must be freshly prepared approximately once a month with the preparation and expiry dates recorded on the container.
8.5 The material is considered to have reached a constant mass when the difference between successive weighings, after a further 1 hour drying at 105-110°C, is not more than 1 percent of the total of the previous moisture losses.
8.6 Care shall be taken not to apply pressure to the surface of the sieve. Brushes with stiff or worn-down bristles must not be used.
Table 1 – Test portion and balance requirements
Aggregate nominal size
(mm)
Minimum test portion mass
(g)
Balance resolution (g)
Balance limit of performance range
(g)
28 10000 10 ± 50
20 5000 1 ± 5
16 3000 1 ± 5
14 2500 1 ± 5
10 1000 1 ± 5
7 600 0.1 ± 0.5
5 500 0.1 ± 0.5

Test Method Q225: Dustiness of cover aggregate
Materials Testing Manual - Part 6, Transport and Main Roads, November 2014 4 of 4
Table 2 – Recommended maximum sieve loadings
Aperture Size (mm)
200 mm diameter (g)
300 mm diameter (g)
26.5 800 1800
19.0 600 1200
16.0 500 1050
13.2 400 900
9.50 250 600
6.70 230 500
4.75 200 400
2.36 150 300
1.18 100 200
0.600 75 -
0.300 50 -
0.150 40 -
0.075 25 -
Materials Testing Manual - Part 6, Transport and Main Roads, November 2014 1 of 4
Test Method Q226: Precoating agent absorption and adsorption of cover aggregate
1 Source
This method was developed in-house using techniques evolved through an internal departmental research investigation.
2 Scope
This method describes the procedure for the determination of precoating agent absorption and adsorption of cover aggregate. For 14 mm and larger nominal size aggregate, the retained 9.50 mm material is tested by this procedure while for 10 mm nominal size aggregate, the retained 6.70 mm material is tested.
3 Apparatus
Where appropriate, the working tolerances of particular apparatus are contained in Table 1.
The following apparatus is required:
3.1 Sieves:
3.1.1 9.50 mm or 6.70 mm depending on the nominal size of the aggregate and complying with AS 1152.
3.1.2 Reinforced 0.075 mm sieve complying with AS 1152 (Note 8.1).
3.2 Balances:
3.2.1 Balance of suitable capacity, with a resolution of at least 0.01 g and with a limit of performance within the range of ± 0.05 g.
3.2.2 Balance of suitable capacity, with a resolution of at least 0.1 g and with a limit of performance within the range of ± 0.5 g.
3.3 Drying oven of suitable capacity, having a temperature of 105-110°C and complying with AS 1141.2.
3.4 Thermometer, a partial or total immersion thermometer or other suitable temperature measuring device with a temperature range of at least 0-50°C and graduated to 1°C or less with an uncertainty of no more than 0.5°C.
3.5 Beakers, two of about 300 mL capacity.
3.6 Tumbling machine, capable of rotating the prescribed container end over end at 70 revolutions per minute.
3.7 Cylindrical plastic container, 100 mm diameter and 150 mm height (internal dimensions). It should include an airtight lid of sufficient strength to contain the aggregate sample during the precoating operation.
3.8 Pipette of suitable capacity, having a resolution of 0.01 mL
4 Materials
The following materials are required:
4.1 Lint free cloth.
4.2 Mineral turpentine (Note 8.2)
Test Method Q226: Precoating agent absorption and adsorption of cover aggregate
Materials Testing Manual - Part 6, Transport and Main Roads, November 2014 2 of 4
4.3 Acetone (Note 8.2)
5 Procedure
The procedure shall be as follows:
5.1 Preparing test portions
5.1.1 Prepare the bulk sample as detailed in Section 5 of Test Method Q101 to produce a representative sample of appropriate size.
5.1.2 Further prepare the sample to produce as follows:
a) subsample retained on either the 9.50 mm or 6.70 mm sieve as detailed in Test Method Q101, Subsection 6.3 for coarse fraction subsamples of at least 10 kg.
b) subsample retained of sufficient quantity for the determination of loose unit mass.
5.1.3 Place the subsample prepared in Step 5.1.2 b) in the oven and dry to a constant mass (Note 8.3).
5.1.4 Determine the loose unit mass of the subsample (ρ ) as detailed in Test Method Q221A.
5.2 Precoating of the test portions
5.2.1 Obtain two representative test portions of 100 ± 1 g from the coarse fraction subsample prepared in Step 5.1.2 a).
5.2.2 Determine the mass of the cylindrical plastic container ( 1m ).
5.2.3 Place one test portion into the cylindrical plastic container and determine the mass of the test portion and cylindrical plastic container ( 2m ).
5.2.4 Calculate the required volume of precoating agent to add to the container as follows:
0.1AV=ρ
where V = Volume of precoating agent (mL) (Note 8.4)
A
= Precoating application rate (L/m3), normally 20 L/m3 unless otherwise specified
ρ = Aggregate loose unit mass (t/m3) as determined in Step 5.1.4
5.2.5 Using the pipette, transfer the calculated volume of precoating agent ( V ) to the cylindrical plastic container and secure the lid.
5.2.6 Place the cylindrical plastic container into the tumbling machine and rotate for 175 revolutions.
5.3 Determination of absorption and adsorption
5.3.1 Determine the mass of the first beaker ( 3m ).
5.3.2 Place the precoated aggregate, one particle deep, onto a clean dry metal tray. Pick up each of the aggregate particles with a pair of tweezers, use a flicking motion to remove excess precoating agent from the particle and place it in the first beaker.
5.3.3 Determine the total mass of the first beaker, aggregate, adsorbed and absorbed precoating agent ( 4m ).

Test Method Q226: Precoating agent absorption and adsorption of cover aggregate
Materials Testing Manual - Part 6, Transport and Main Roads, November 2014 3 of 4
5.3.4 Determine the mass of a second beaker ( 5m ).
5.3.5 Place the precoated aggregate from the first beaker, one particle deep, onto a clean lint-free cloth and roll and wipe the precoated aggregate until all visible precoating agent has been removed from the surface of the particles.
5.3.6 Place the precoated aggregate into the second beaker and determine the mass of the second beaker, aggregate and absorbed precoating agent ( 6m ).
5.3.7 Fill the second beaker with mineral turpentine until the aggregate is covered. Agitate the contents of the beaker and pour the suspension over the reinforced 0.075 mm sieve.
5.3.8 Wash the material retained on the 0.075 mm sieve until the mineral turpentine shows no discolouration.
5.3.9 Add mineral turpentine to the second beaker and repeat Steps 5.3.7 to 5.3.8 until the aggregate retained in the beaker and that retained on the 0.075 mm sieve is clean.
5.3.10 Return all washed material on the 0.075 mm sieve to the second beaker and decant any excess mineral turpentine.
5.3.11 Rinse the contents of the second beaker with acetone. Decant any excess acetone.
5.3.12 Place the second beaker on a hotplate and dry the aggregate and cool to room temperature.
5.3.13 Determine the mass of the second beaker and aggregate ( 7m ).
5.4 Repeat Steps 5.2.2 to 5.3.13 using the second test portion.
6 Calculations
6.1 Calculate the precoating agent absorption for each test portion as follows:
( )6 7b
7 5
100 m - mA =
m - m
where bA = precoating agent absorption (%)
6m = mass of second beaker, aggregate and absorbed precoating agent (g)
7m = mass of second beaker and aggregate (g)
5m = mass of second beaker (g)
6.2 Calculate the precoating agent adsorption for each test portion as follows:
( )( )4 6 5 3
d7 5
100 m - m -m -mA =
m -m
where dA = precoating agent adsorption (%)
4m = mass of first beaker, aggregate, absorbed and adsorbed precoating
agent (g)
6m = mass of second beaker, aggregate and absorbed precoating agent (g)
5m = mass of second beaker (g)

Test Method Q226: Precoating agent absorption and adsorption of cover aggregate
Materials Testing Manual - Part 6, Transport and Main Roads, November 2014 4 of 4
3m = mass of first beaker (g)
7m = mass of second beaker and aggregate (g)
6.3 For both the absorption and adsorption results, compare the values from the two test portions and, if they do not differ by more than 0.25%, average the results. Otherwise repeat the test.
7 Reporting
Report the average of the following as appropriate:
7.1 Precoating agent absorption to the nearest 0.01%.
7.2 Precoating agent adsorption to the nearest 0.01%.
8 Notes on method
8.1 Because of the ease with which a 0.075 mm sieve can be damaged, the use of a special washing sieve, in which the sieve cloth is reinforced underneath with a coarser sieve or punched plate screen, is recommended.
8.2 Before handling mineral turpentine or acetone, the operator must consult the relevant Safety Data Sheet (SDS).
8.3 The material is considered to have reached a constant mass when the difference between successive weighings, after a further 1 hour drying at 105-110°C, is not more than 1 percent of the total of the previous moisture losses.
8.4 For the calculation it is assumed the mass of the test portion ( 2 1m -m ) is 100 ± 1 g.
Table 1 – Dimensions and tolerances for equipment
Apparatus Dimension Tolerance
Tumbling machine
Speed (revolutions/min) 70 ± 5
Cylindrical plastic container
Internal diameter (mm) 100 ± 5
Internal height (mm) 150 ± 10

Materials Testing Manual - Part 6, Transport and Main Roads, November 2014 1 of 2
Test Method Q227: Pull-out force for surfacing aggregate
1 Source
This method has been adapted from one of the techniques described from a similar test published in the 1994 South African Sabita Manual: Technical Guidelines for Seals using Homogeneous Modified Binders.
2 Scope
This method provides for the determination of an average pull-out force required to dislodge cover aggregate pieces from a bituminous binder on a sprayed seal to assess the level of bonding of the aggregate to the binder surface. Data on pull-out force could prove useful in general sealing work in indicating the degree of early trafficking control required on freshly laid seals.
3 Apparatus
The following apparatus is required:
3.1 Spring balance, having a capacity of 1000 g, with a resolution of at least 10 g, fitted with a zeroing adjustment (Notes 8.1 and 8.2).
3.2 Crocodile clip, 50 mm in length, with maximum stiffness in grip and with an attached wire or string line, approximately 0.5 m long.
3.3 Infrared thermometer, with a resolution of at least 0.2 ºC over the range from 10ºC to 80ºC.
3.4 Safety glasses.
4 Preparation for testing
4.1 Select at least twelve test positions of approximately equal spacing along a length of seal of essentially homogeneous condition (Note 8.3).
4.2 Connect the crocodile clip to the spring balance by the attached line.
4.3 Hold the spring balance such that the zero point of the spring balance scale is at about eye level (Note 8.4).
4.4 Attach the crocodile clip to an individual loose stone of a size representative of that to be tested, zero the spring balance and discard the stone.
5 Procedure
Perform the following at each test position:
5.1 Measure and record the surface temperature (T) to the nearest 0.2ºC using the infrared thermometer.
5.2 Select a typically bound stone from each test position and attach the crocodile clip to the stone. The stone selected should be of suitable shape to permit effective gripping of the clip.
5.3 Wearing the safety glasses, slowly raise the upper portion of the balance using a smooth action to apply a pull-out rate of about 20 g/second. Monitor the scale carefully and continue the load application until the stone becomes detached (Note 8.5).
5.4 Record the maximum force reading as the pull-out force ( 1f ).

Test Method Q227: Pull-out force for surfacing aggregate
Materials Testing Manual - Part 6, Transport and Main Roads, November 2014 2 of 2
5.5 Estimate the amount of embedment into the binder of the detached stone by the height of binder on the stone and record this value as a percentage of the height of the stone. For this purpose, record a value of 50% for a stone half embedded in the binder and a value of 10% if only the complete base of the stone is coated with binder (Note 8.6).
6 Calculations
6.1 Apply a temperature correction factor to the pull-out force recorded at each test position to correct the pull-out force to 40ºC as follows (Note 8.7):
( )2 1logf =logf -0.05 40-T
where 2f = pull-out force (g) corrected to 40ºC
1f = pull-out force (g)
T = surface temperature (ºC)
6.2 Examine the values of log pull-out force corrected to 40ºC for all test positions and eliminate any values which are extraordinarily high or low in comparison to the remaining values within the data set.
6.3 Average the remaining values of the log pull-out force and take the antilog of this average value to determine the typical pull-out force over the site.
6.4 Determine the average height of binder on the stones used to determine the typical pull-out force over the site.
7 Reporting
Report the following values and general information:
7.1 Typical pull-out force to the nearest 10 g.
7.2 Average height of binder to the nearest 1%.
8 Notes on method
8.1 A Kern Model No. 41000 is regarded as a suitable spring balance.
8.2 When field conditions provide pull-out forces generally above 1000 g, for example, cooler temperatures, large or strongly interlocked aggregate pieces, tough binders and so on, an alternative spring balance of higher force capacity will be required.
8.3 The general location of each test position may be determined by pacing the appropriate distance.
8.4 The tester will normally carry out testing in either a sitting or squatting position.
8.5 If the stone twists during the test to cause a significantly reduced pull-out force, the result should be discarded and another stone tested from the same general area of the test position.
8.6 In many instances, the stone is not embedded evenly within the binder and, for such cases, the recorded height is an estimated average around all sides of the stone.
8.7 The temperature correction factor of -0.05 used relates to conventional binders.

Materials Testing Manual - Part 6, Transport and Main Roads, November 2014 1 of 3
Test Method Q228: Mill abrasion of aggregate
1 Source
This method is based on a test procedure described in "CP Rail specification for evaluating processed rock, slag and gravel ballasts (Appendix A)", Canadian Pacific Ltd, Montreal, 1981. It differs from this procedure in only minor procedural variations.
2 Scope
This method describes the procedure for determining the mill abrasion value of coarse aggregates using a wet attrition technique. If required the method also allows the calculation of an abrasion number using the mill abrasion value and the Los Angeles value.
3 Apparatus
Where appropriate, the working tolerances of particular apparatus are contained in Table 1.
The following apparatus is required:
3.1 Drying oven of suitable capacity, having a temperature of 105-110°C and complying with AS 1141.2.
3.2 Wire brush.
3.3 Jaw crusher.
3.4 Scalping screen, a 9.50 mm sieve is suitable.
3.5 Sieves, 37.5 mm, 26.5 mm, 19.0 mm and 4.75 mm as required, complying with AS 1152.
3.6 Containers suitable for washing test fractions.
3.7 Balance of suitable capacity, having a resolution of at least of 1 g and a limit of performance within the range of ± 5 g.
3.8 Sample splitters.
3.9 Measuring cylinder of suitable capacity.
3.10 Mill abrasion tumbler capable of revolving a 5 litre porcelain jar about its longitudinal axis at 33 ± 2 revolutions per minute for a total of 10,000 revolutions. The jar shall be fitted with a lid to hold water and shall have an external diameter of 230 mm.
3.11 Reinforced 0.075 mm sieve of 300 mm diameter and complying with AS 1152.
3.12 Oven tray.
4 Materials
The following material is required:
4.1 Distilled water.
5 Sample preparation
Prepare the sample as follows:
5.1 Thoroughly wash and dry the sample before using the wire brush to remove any adhering fines or soft weathered rock.
5.2 Crush the sample by gradually reducing the maximum particle size to 50 mm.

Test Method Q228: Mill abrasion of aggregate
Materials Testing Manual - Part 6, Transport and Main Roads, November 2014 2 of 3
5.3 Sieve the crushed sample over an appropriately sized scalping screen and discard any material passing the screen.
5.4 If the material retained on the scalping screen is not homogenous, remove and discard any particles which are at variance with the bulk of the sample (Note 9.1).
5.5 Further crush the retained material, gradually reducing its size until nearly all material passes the 37.5 mm sieve and a range of particle sizes in keeping with the requirements of Table 2 is produced.
5.6 Prepare a representative subsample to provide a test portion containing the fractions as follows:
5.6.1 Screen the subsample through each of the sieves listed in Table 2, in turn. Discard the material retained on the largest sieve and the material passing the smallest sieve.
5.6.2 Place the fractions in separate wash containers and wash each fraction using clean water until all coatings of fines have been removed from the surface of the particles and the wash water is clear (Note 9.2).
5.7 Place each washed fraction in the oven and dry until a constant mass has been reached (Note 9.3).
5.8 Reduce each dried fraction to the required mass as per Table 2, using appropriately sized sample splitters as detailed in Test Method Q101. Combine the two fractions to produce the test portion and determine the mass of the test portion ( 1m ).
6 Procedure
The procedure shall be as follows:
6.1 Place the test portion in the porcelain jar, together with 3 litres of distilled water.
6.2 Place the lid on the porcelain jar and secure the assembly in the tumbler.
6.3 Operate the tumbler for 10,000 revolutions.
6.4 Decant the wash water from the porcelain jar into the nested 4.75 mm and 0.075 mm sieves.
6.5 Remove the larger particles from the jar by hand and place on the 4.75 mm sieve.
6.6 Wash out the jar with water and continue to wash the particles with the wash water from the jar until the water from the jar is clear.
6.7 Continue washing the particles on each sieve until the wash water passing the 0.075 mm sieve is clear.
6.8 Place the washed material into a drying tray and dry the material retained on the 0.075 mm sieve until a constant mass is reached and record the dry mass ( 2m ).
7 Calculations
7.1 Calculate the mill abrasion value as follows:
1 2
1
m - mMA= 100m
where MA = Mill Abrasion value
1m = original washed and dried test portion (g)

Test Method Q228: Mill abrasion of aggregate
Materials Testing Manual - Part 6, Transport and Main Roads, November 2014 3 of 3
2m = dried sample retained 0.075 mm (g)
7.2 If required, calculate the Abrasion Number using the results from the Los Angeles Test and the Mill Abrasion Test as follows:
AN = LAA+(5 MA)
where AN = Abrasion Number
LAA = Los Angeles Abrasion value (from test method AS 1141.23)
MA = Mill Abrasion value
8 Reporting
Report the following values:
8.1 Report the Mill Abrasion value to the nearest 0.1.
8.2 Report the Abrasion Number to the nearest whole number, if required.
9 Notes on method
9.1 The scalping process in intended to simulate the anticipated quarry practice by removing from the sample such material which would not be representative of the quarried product. The aperture of the scalping screen should be selected on this basis.
9.2 Some discrete rock particles will slowly break down when agitated in water. This is evidenced by discolouration of the wash water. In such cases, discontinue washing after all coatings of fines have been removed.
9.3 Each fraction is considered to have reached a constant mass when the difference between successive weighings, after a further 1 hour drying at 105-110°C, is not more than 1 percent of the total of the previous moisture losses.
Table 1 – Working tolerances for apparatus
Apparatus Value Tolerance
Mill abrasion tumbler
Speed (rpm) 33 ±2
Porcelain Jar
External diameter (mm) 230 ±10
Volume (L) 5 nominal
Table 2 – Mass of fractions required for test portion
Particle size (mm) Mass of fraction (g)
37.5 – 26.5 1500 ± 15
26.5 – 19.0 1500 ± 15
Materials Testing Manual - Part 6, Transport and Main Roads, March 2016 1 of 3
Test Method Q229A: Resistance to degradation by abrasion of fine aggregate
1 Source
This method is based on a test method ASTM D7428: Resistance of fine aggregate to degradation by abrasion in the Micro-Deval apparatus. It differs from this procedure in the sizing of test fraction, not using a reference aggregate, performing the test in duplicate and other minor procedural variations.
2 Scope
This method describes the procedure for determining the resistance to abrasion of fine aggregate using a wet attrition technique. The method uses a combination of abrasion and grinding with steel balls in the presence of water using a Micro-Deval apparatus.
3 Apparatus
Where appropriate, the working tolerances of particular apparatus are contained in Table 1.
The following apparatus is required:
3.1 Drying oven of suitable capacity, having a temperature of 105-110°C and complying with AS 1141.2.
3.2 Sieves:
3.2.1 4.75 mm, 2.36 mm, 1.18 mm, 0.600 mm, 0.300 mm, 0.150 and 0.075 mm as required, complying with AS 1152.
3.2.2 Reinforced 0.075 mm sieve complying with AS 1152 (Note 9.1).
3.3 Containers suitable for washing test fractions.
3.4 Balance of suitable capacity, having a resolution of at least of 0.1 g and a limit of performance within the range of ± 0.5 g.
3.5 Sample splitters.
3.6 Measuring cylinder of suitable capacity with graduations no larger than 50 mL.
3.7 Micro-Deval abrasion machine capable of revolving a 5 litre abrasion jar about its longitudinal axis at 100 ± 5 revolutions per minute for a total of 1,500 revolutions.
3.8 Abrasion jar, stainless steel of 5 litre capacity fitted with a lid to hold water. The jar shall have an external diameter of 198 mm and an internal height of 173.5 mm. The inside and outside surfaces shall be smooth and have no observable ridges or indentations.
3.9 Abrasion charge consisting of stainless steel ball of 9.5 mm diameter and sufficient number to provide a 1250 g charge for each jar.
3.10 Oven tray.
4 Materials
The following materials are required:
4.1 Distilled water.
4.2 Silica sand.

Test Method Q229A: Resistance to degradation by abrasion of fine aggregate
Materials Testing Manual - Part 6, Transport and Main Roads, March 2016 2 of 3
5 Sample preparation
Prepare the sample as follows:
5.1 Prepare the bulk sample as detailed in Section 5 of Test Method Q101 to produce a representative sample of appropriate size.
5.2 Further prepare the sample to produce sufficient washed materials to produce two subsamples of the size and quantity specified in Table 2 as detailed in Test Method Q101, Subsection 6.5 for specified fraction subsamples (Note 9.2).
5.3 Place the washed subsamples in the drying oven, dry to a constant mass (Note 9.3) and allow to cool to room temperature.
5.4 Combine the washed and dried subsamples to produce the test portions.
6 Procedure
The procedure shall be as follows:
6.1 Determine the mass of the test portion ( 1m ).
6.2 Place the test portion in the abrasion jar, together with 0.75 ± 0.05 litres of distilled water (Note 9.4).
6.3 Store the abrasion jar in an air-conditioned room at 23 ± 3°C for at least 1 hour.
6.4 Add the mass of charge specified in Table 2 to the abrasion jar. Place the lid on the abrasion jar and place the abrasion jar in the abrasion machine.
6.5 Operate the machine for the appropriate number of revolutions specified in Table 2.
6.6 Remove the abrasion jar from the machine.
6.7 Decant the wash water from the abrasion jar into the nested 1.18 mm and 0.075 mm sieves.
6.8 Carefully pour the sample and abrasion charge over the sieves. Wash out the jar with water until the water from the jar is clear. Take care to remove the entire sample from the jar.
6.9 Continue washing and agitation of the particles with the wash water from the jar until the water from the jar is clear and all material smaller than 0.075 mm passes that sieve.
6.10 Remove the abrasion charge from the washed sample.
6.11 Place washed material retained on the 1.18 mm and 0.075 mm sieves in a drying tray and dry the material until a constant mass is reached and record the dry mass ( 2m ).
6.12 Repeat Steps 6.1 to 6.11 for the second test portion.
7 Calculations
7.1 Calculate the percent loss as follows:
1 2
1
m - mPL= 100m
where PL = percent loss (%)
1m = original washed and dried test portion (g)
2m = dried sample retained 0.075 mm (g)

Test Method Q229A: Resistance to degradation by abrasion of fine aggregate
Materials Testing Manual - Part 6, Transport and Main Roads, March 2016 3 of 3
7.2 Calculate the percent loss from the two test portions.
8 Reporting
Report the percent loss to the nearest 0.1%.
9 Notes on method
9.1 Because of the ease with which a 0.075 mm sieve can be damaged, the use of a special washing sieve, in which the sieve cloth is reinforced underneath with a coarser sieve or punched plate screen, is recommended.
9.2 Some discrete rock particles will slowly break down when agitated in water. This is evidenced by discolouration of the wash water. In such cases, discontinue washing after all coatings of fines have been removed.
9.3 Each fraction is considered to have reached a constant mass when the difference between successive weighings, after a further 1 hour drying at 105-110°C, is not more than 1 percent of the total of the previous moisture losses.
9.4 Before using the abrasion jar and charge for the first time, condition the abrasion jar and charge by running the apparatus with 500 g of silica sand and 0.75 litres of distilled water for four hours. It may be necessary from time to time to re-condition the abrasion jar and charge. The conditioning process should give the abrasion jar and charge a “frosted” appearance.
Table 1 – Working tolerances for apparatus
Apparatus Value Tolerance
Micro-Deval abrasion machine
Speed (rpm) 100 ±5
Abrasion charge
Diameter (mm) 9.5 ±0.5
Abrasion Jars
External diameter (mm) 198 ±4
Internal height (mm) 173.5 ±3.5
Volume (L) 5 nominal
Table 2 – Mass of fractions, abrasion charge and revolutions required for test portion
Maximum size (mm)
Fraction size (mm)
Mass of fraction (g)
Mass of charge
(g)
Revolutions (rpm)
4.75 4.75 - 2.36 50 ± 0.5 1250 ± 5 1,500 ± 10
2.36 – 1.18 125 ± 1
1.18 – 0.600 125 ± 1
0.600 – 0.300 100 ± 1
0.300 – 0.150 75 ± 1
0.150 – 0.075 25 ± 0.5

Materials Testing Manual - Part 6, Transport and Main Roads, March 2016 1 of 3
Test Method Q229B: Resistance to degradation by abrasion of coarse aggregate
1 Source
This method is based on a test method AASHTO T327: Resistance of coarse aggregate to degradation by abrasion in the Micro-Deval apparatus. It differs from this procedure in the sizing of test fraction, not using a reference aggregate, performing the test in duplicate and other minor procedural variations.
2 Scope
This method describes the procedure for determining the resistance to abrasion of coarse aggregate using a wet attrition technique. The method uses a combination of abrasion and grinding with steel balls in the presence of water using a Micro-Deval apparatus.
3 Apparatus
Where appropriate, the working tolerances of particular apparatus are contained in Table 1.
The following apparatus is required:
3.1 Drying oven of suitable capacity, having a temperature of 105-110°C and complying with AS 1141.2.
3.2 Sieves, 19.0 mm, 16.0 mm, 13.2 mm, 9.50 mm, 6.70 mm, 4.75 mm and 1.18 mm as required, complying with AS 1152.
3.3 Containers suitable for washing test fractions.
3.4 Balance of suitable capacity, having a resolution of at least of 0.1 g and a limit of performance within the range of ± 0.5 g.
3.5 Sample splitters.
3.6 Measuring cylinder of suitable capacity with graduations no larger than 50 mL.
3.7 Micro-Deval abrasion machine capable of revolving a 5 litre abrasion jar about its longitudinal axis at 100 ± 5 revolutions per minute for a total of 9,500 to 12,000 revolutions.
3.8 Abrasion jar, stainless steel of 5 litre capacity fitted with a lid to hold water. The jar shall have an external diameter of 198 mm and an internal height of 173.5 mm. The inside and outside surfaces shall be smooth and have no observable ridges or indentations.
3.9 Abrasion charge consisting of stainless steel ball of 9.5 mm diameter and sufficient number to provide a 5000 g charge for each jar.
3.10 Oven tray.
4 Materials The following material is required:
4.1 Distilled water.
5 Sample preparation
Prepare the sample as follows:
Test Method Q229B: Resistance to degradation by abrasion of coarse aggregate
Materials Testing Manual - Part 6, Transport and Main Roads, March 2016 2 of 3
5.1 Prepare the bulk sample as detailed in Section 5 of Test Method Q101 to produce a representative sample of appropriate size.
5.2 Further prepare the sample to produce sufficient washed materials to produce two subsamples of the size and quantity specified in Table 2 as detailed in Test Method Q101, Subsection 6.5 for specified fraction subsamples (Note 9.1).
5.3 Place the washed subsamples in the drying oven, dry to a constant mass (Note 9.2) and allow to cool to room temperature.
5.4 Combine the washed and dried subsamples to produce the test portions.
6 Procedure
The procedure shall be as follows:
6.1 Determine the mass of the test portion ( 1m ).
6.2 Place the test portion in the abrasion jar, together with 2.00 ± 0.05 litres of distilled water.
6.3 Store the abrasion jar in an air-conditioned room at 23 ± 3°C for at least 1 hour.
6.4 Add the mass of charge specified in Table 2 to the abrasion jar. Place the lid on the abrasion jar and place the abrasion jar in the abrasion machine.
6.5 Operate the machine for the appropriate number of revolutions specified in Table 2.
6.6 Remove the abrasion jar from the machine.
6.7 Decant the wash water from the abrasion jar into the nested 4.75 mm and 1.18 mm sieves.
6.8 Carefully pour the sample and abrasion charge over the sieves. Wash out the jar with water until the water from the jar is clear. Take care to remove the entire sample from the jar.
6.9 Continue washing and agitation of the particles with the wash water from the jar until the water from the jar is clear and all material smaller than 1.18 mm passes that sieve.
6.10 Remove the abrasion charge from the washed sample.
6.11 Place washed material retained on the 4.75 mm and 1.18 mm sieves in a drying tray and dry the material until a constant mass is reached and record the dry mass ( 2m ).
6.12 Repeat Steps 6.1 to 6.11 for the second test portion.
7 Calculations
7.1 Calculate the abrasion loss as follows:
1 2
1
m - mAL= 100m
where AL = abrasion loss (%)
1m = original washed and dried test portion (g)
2m = dried sample retained 1.18 mm (g)

Test Method Q229B: Resistance to degradation by abrasion of coarse aggregate
Materials Testing Manual - Part 6, Transport and Main Roads, March 2016 3 of 3
7.2 Calculate the average abrasion loss from the two test portions.
8 Reporting
Report the following:
8.1 Abrasion loss to the nearest 0.1%.
8.2 Maximum size of aggregate tested (mm).
9 Notes on method
9.1 Some discrete rock particles will slowly break down when agitated in water. This is evidenced by discolouration of the wash water. In such cases, discontinue washing after all coatings of fines have been removed.
9.2 Each fraction is considered to have reached a constant mass when the difference between successive weighings, after a further 1 hour drying at 105-110°C, is not more than 1 percent of the total of the previous moisture losses.
Table 1 – Working tolerances for apparatus
Apparatus Value Tolerance
Micro-Deval abrasion machine
Speed (rpm) 100 ± 5
Abrasion charge
Diameter (mm) 9.5 ± 0.5
Abrasion Jars
External diameter (mm) 198 ± 4
Internal height (mm) 173.5 ± 3.5
Volume (L) 5 nominal
Table 2 – Mass of fractions, abrasion charge and revolutions required for test portion
Maximum size (mm)
Fraction size (mm) Mass of fraction (g)
Mass of charge (g)
Revolutions (rpm)
19.0 19.0 – 16.0 375 ± 1 5000 ± 5 12,000 ± 100
16.0 – 13.2 375 ± 1
13.2 – 9.5 750 ± 3
16.0 13.2 – 9.5 750 ± 3 5000 ± 5 10,500 ± 100
9.5 – 6.7 375 ± 1
6.7 – 4.75 375 ± 1
13.2 9.5 – 6.7 750 ± 3 5000 ± 5 9,500 ± 100
6.7 – 4.75 750 ± 3
Materials Testing Manual - Part 6, Transport and Main Roads, March 2016 1 of 8
Test Method Q230: Particle size distribution and shape – rock
1 Source
This method applies the principles of ASTM Test Method D5519: Standard Test Method for Particle Size Analysis of Natural and Man-Made Riprap Materials and AS 1141.14: Particle shape by proportional caliper.
2 Scope
This method describes the procedure for taking samples of rock to be used for products such as rock pitching, rip rap, gabion rock, mattress rock and spill through rock to determine, in the field, the particle size distribution and if required the shape of the rock.
3 Definitions
3.1 Elongated rock is one having a ratio of length to width greater than the calliper ratio adopted.
3.2 Flat rock is one having a ratio of width to thickness greater than the calliper ratio adopted.
3.3 Flat and elongated rock is one having a ratio of length to width and a ratio of width to thickness greater than the calliper ratio adopted.
3.4 Length, width and thickness are, respectively, the greatest, intermediate and least dimensions of any rock, as measured along mutually perpendicular directions, that is, they are the principal dimensions of the circumscribing rectangular prism.
3.5 Non-cubical rock is one having a ratio of length to thickness greater than the calliper ratio adopted.
4 Apparatus
Where appropriate, the working tolerances of particular apparatus are contained in Tables 1 and 2.
The following apparatus is required:
4.1 Weighing device:
4.1.1 Platform balance of suitable capacity, with a readability and limit of performance of not less than the requirements of Table 1, or
4.1.2 Registered weighbridge of suitable capacity, with a verified scale interval (e) of at least 20 kg and a maximum permissible error (MPE) within the range of ± 100 kg.
4.2 Sieves and/or templates:
4.3 Single opening templates made from steel rod or bar or similar rigid material, with square apertures of 500 mm, 300 mm, 250 mm, 200 mm and 150 mm. Hand grips or handle may be added for ease of use.
4.4 Sieves, perforated plate sieves, 120 mm, 100 mm and 75.0 mm complying with AS 1152.
4.5 Transport vehicle capable of conveying the individual or groups of the individual sorted rock from the sampling point to the test area and from the test area to the weighbridge.
4.6 Handling equipment such as forklift or loaders, or similar, for sampling, transporting, assisting in the sorting, loading for transport, weighing and other tasks associated with the test.
4.7 Tape measure for determining particle size dimensions to estimate mass.

Test Method Q230: Particle size distribution and shape – rock
Materials Testing Manual - Part 6, Transport and Main Roads, March 2016 2 of 8
4.8 Test area, sufficiently large to allow placement of the test sample, areas, bins or containers to place the sorted materials and adequate to allow the transport vehicle and handling equipment to operate safely. The test area should have a smooth surface, such as concrete, to prevent the loss of fines and provide a suitable working surface.
4.9 Proportional callipers, of suitable size with ratio’s of 2:1 and 3:1.
4.10 Containers suitable for holding and weighing finer fractions.
4.11 Spray paint for marking larger rock.
4.12 Tags and markers or small signs for identifying fractions.
4.13 Hand tools including crowbars, shovels and so on.
4.14 Gloves, glasses and dust masks.
5 Sampling
5.1 Taking into account the type of material to be sampled and the type and scope of testing, prepare a sampling plan to provide a representative sample of the material. The plan must be appropriate for existing conditions, available resources and requirements of the specification. The sampling process must provide a representative sample of the material.
5.2 Using a tape measure estimate the maximum particle size within the material. Determine the minimum mass of sample from Table 1 or by calculation (Note 10.1).
5.2.1 Determine the mass of the empty truck from a registered weighbridge ( 1m ) or the mass of
empty containers using a balance ( 1m ).
5.2.2 A single sample is taken for testing and placed in the transport vehicle or containers.
5.2.3 Determine the mass of the truck and sample ( 2m ) from a registered weighbridge or the mass
of containers and sample using a balance ( 2m ).
6 Procedure
6.1 Particle size distribution
6.1.1 In order to determine the sieves/templates required, it is necessary to consult any applicable specification for the material under test. The number of sieves/templates used should not be less than four.
6.1.2 Move the sample to the test location and for samples with rocks larger than 200 mm spread the sample in a thin layer.
6.1.3 Determine the mass of the truck/containers to be used for holding each fraction and record the mass ( cm )
6.1.4 Place each individual rock on a sieve or template to determine the sizes that the rock will pass and be retained on. Alternately the template may be placed over the rock to determine its size. If rock shape is being determined as detailed in Subsection 6.2, test each rock with the proportional calliper to determine if it is flat, elongated and flat and elongated.
6.1.5 Either place the rocks into separate piles or containers for each fraction. Tools or mechanical equipment may be used to move larger rocks, or alternatively, larger rocks may be marked using a colour code rather than sorting and moving them. This eliminates the need to move a rock before loading and weighing. If rock shape is being determined as detailed in Subsection
Test Method Q230: Particle size distribution and shape – rock
Materials Testing Manual - Part 6, Transport and Main Roads, March 2016 3 of 8
6.2, it may be necessary further separate each fraction into additional piles or containers for the flat, elongated and flat and elongated rocks.
6.1.6 As each container is filled, weigh on the balance and record the mass of the container and fraction ( am ).
6.1.7 For coarse fractions, load the material for a fraction onto the truck. Determine the mass of the truck and fraction from a registered weighbridge ( am ).
6.1.8 Continue size separation and weighing until the total gradation sample has been processed.
6.2 Particle shape
6.2.1 Include all fractions which constitute ten or more percent of the sample mass and are larger than 75.0 mm.
6.2.2 Select the proportional calliper with the required ratio (Note 10.2).
6.2.3 Test each of the rocks in each of the fractions prepared for measurement, using the proportional calliper as follows:
a) Set the largest opening equal to the width of the rock. If the thickness of the rock can be placed within the smaller opening, the particle is deemed to be flat.
b) Set the largest opening equal to the length of the rock. If the width of the rock can be placed within the smaller opening, the particle is deemed to be elongated.
c) Set the largest opening equal to the length of the rock. If the thickness of the rock can be placed within the smaller opening, the particle is deemed to be non-cubical.
d) Retain the rocks and sort the rocks in each fraction being measured into the following four types, flat, elongated, flat and elongated, non-cubical and neither flat nor elongated nor non-cubical.
6.2.4 Determine the masses of the flat ( 3m ), elongated ( 4m ), flat and elongated types ( 5m ) and
non-cubical ( 6m ).
7 Calculations
7.1 Particle size distribution
7.1.1 Calculate the mass retained for each fraction as follows:
( )r a cm = m -m∑
where rm = individual mass retained for each fraction (kg)
am = mass of truck/container and fraction (kg)
cm = mass of truck/container (kg)
7.1.2 Calculate the cumulative mass retained for each fraction as follows:
rM= m∑
where M = cumulative mass retained in each fraction (kg)
rm = individual mass retained for each fraction (kg)

Test Method Q230: Particle size distribution and shape – rock
Materials Testing Manual - Part 6, Transport and Main Roads, March 2016 4 of 8
7.1.3 Calculate the cumulative percent retained for each fraction as follows:
( )r2 1
100MP =m -m∑
where rP = cumulative percent retained for each fraction (%)
M = cumulative mass retained in each fraction (kg)
2m = mass of truck/container and sample (kg)
1m = mass of truck/container (kg)
7.1.4 Calculate the percent passing each fraction (to nearest 0.1%) as follows:
rP=100-P
where P = cumulative percent passing for each fraction (%)
rP = cumulative percent retained for each fraction (%)
7.2 Misshapen rocks
7.2.1 Calculate the total mass of sample to be from the particle size distribution from fractions which constitute ten or more percent of the sample mass and are larger than 75.0 mm as follows:
T rM = m∑
where TM = mass of sample from particle size distribution (kg)
rm = individual mass retained for each test fraction (kg)
7.2.2 For each test fraction calculate the percentage of flat rocks as follows:
3f
f
mP = 100m
where fP = percentage of flat rocks
3m = mass of flat rocks in each test fraction (kg)
rm = individual mass retained for each test fraction (kg)
7.2.3 For each test fraction calculate the percentage of elongated rocks as follows:
4e
f
mP = 100m
where eP = percentage of elongated rocks
4m = mass of elongated rocks in each test fraction (kg)
rm = individual mass retained for each test fraction (kg)

Test Method Q230: Particle size distribution and shape – rock
Materials Testing Manual - Part 6, Transport and Main Roads, March 2016 5 of 8
7.2.4 For each test fraction calculate the percentage of flat and elongated rocks as follows:
5fe
f
mP = 100m
where feP = percentage of flat and elongated rocks
5m = mass of flat and elongated rocks in each test fraction (kg)
rm = individual mass retained for each test fraction (kg)
7.2.5 For each test fraction calculate the percentage of non-cubical rocks as follows:
6nc
f
mP = 100m
where feP = percentage of non-cubical rocks
5m = mass of non-cubical rocks in each test fraction (kg)
rm = individual mass retained for each test fraction (kg)
7.2.6 For each test fraction calculate the weighted percentage of flat rocks as follows:
f rWf
T
P mP =M
where WfP = weighted percentage of flat rocks
fP = percentage of flat rocks
rm = individual mass retained for each test fraction (kg)
TM = mass of sample from particle size distribution (kg)
7.2.7 For each test fraction calculate the weighted percentage of elongated rocks as follows:
e rWe
T
P mP =M
where WeP = weighted percentage of elongated rocks
eP = percentage of elongated rocks
rm = individual mass retained for each test fraction (kg)
TM = mass of sample from particle size distribution (kg)

Test Method Q230: Particle size distribution and shape – rock
Materials Testing Manual - Part 6, Transport and Main Roads, March 2016 6 of 8
7.2.8 For each test fraction calculate the weighted percentage of flat and elongated as follows:
fe rWfe
T
P mP =M
where WfeP = weighted percentage of flat and elongated rocks
feP = percentage of flat and elongated rocks
rm = individual mass retained for each test fraction (kg)
TM = mass of sample from particle size distribution (kg)
7.2.9 For each test fraction calculate the weighted percentage of flat and elongated as follows:
nc rWnc
T
P mP =M
where WncP = weighted percentage of non-cubical rocks
feP = percentage of non-cubical rocks
rm = individual mass retained for each test fraction (kg)
TM = mass of sample from particle size distribution (kg)
7.3 Calculate the misshapen rocks as follows:
Wf We WfeMR= P P P+ +∑ ∑ ∑
where MR = misshapen rocks (%)
WfP = weighted percentage of flat rocks
WeP = weighted percentage of elongated rocks
WfeP = weighted percentage of flat and elongated rocks
7.4 Calculate the non-cubical rocks as follows:
WncNCR= P∑
where NCR = non-cubical rocks (%)
WfP = weighted percentage of flat rocks
WeP = weighted percentage of elongated rocks
WfeP = weighted percentage of flat and elongated rocks

Test Method Q230: Particle size distribution and shape – rock
Materials Testing Manual - Part 6, Transport and Main Roads, March 2016 7 of 8
8 Records
Record the following information for each sample.
8.1 Date of sampling.
8.2 Material type.
8.3 Source of material.
8.4 Nominal size (mm).
8.5 Sampling location including GPS reference if required.
8.6 Amount of material represented.
8.7 For material sampled in stockpile, the lot identification.
8.8 Name of sampler.
8.9 Reference to the sampling plan.
8.10 For material in a stockpile, a dimensioned plan of the lot showing sample location together with points of reference.
8.11 Any other relevant information.
9 Reporting
9.1 For sampling report the following:
9.1.1 Date of sampling.
9.1.2 Material type.
9.1.3 Source of material.
9.1.4 Sampling location.
9.1.5 Lot identification.
9.1.6 Reference to the sampling plan.
9.2 For testing report the following values and information:
9.2.1 The percent passing each fraction shall be reported to the nearest 1 percent.
9.2.2 The misshapen rocks in the sample to the nearest 1 percent (if required).
9.2.3 The weighted percentage of flat, elongated and flat and elongated rocks and non-cubical rocks to the nearest 0.1 percent (if required).
9.2.4 Calliper ratio’s used.
10 Notes on method
10.1 The mass of the test sample should be large enough to ensure a representative gradation is obtained with a desired level of accuracy. It should be large enough so that the addition or loss of the largest rock would not change the results by more than a specified percentage. For example if the largest expected rock is 400 mm, then to provide an effect on the test results of 1% or less the sample size should be greater than 13,164 kg while an effect of 2% or less would require a sample size of 6,582 kg. Sample size can be calculated as follows:
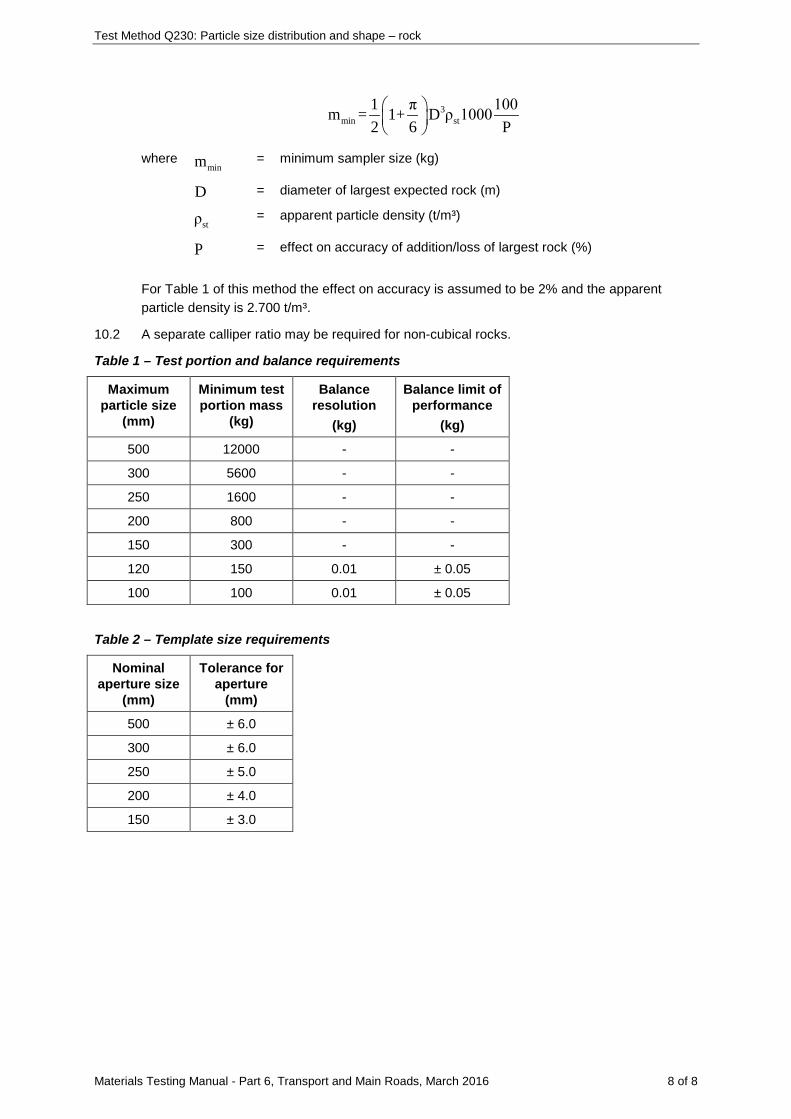
Test Method Q230: Particle size distribution and shape – rock
Materials Testing Manual - Part 6, Transport and Main Roads, March 2016 8 of 8
3min st
1 π 100m = 1+ D ρ 10002 6 P
where minm = minimum sampler size (kg)
D = diameter of largest expected rock (m)
stρ = apparent particle density (t/m³)
P = effect on accuracy of addition/loss of largest rock (%)
For Table 1 of this method the effect on accuracy is assumed to be 2% and the apparent particle density is 2.700 t/m³.
10.2 A separate calliper ratio may be required for non-cubical rocks.
Table 1 – Test portion and balance requirements
Maximum particle size
(mm)
Minimum test portion mass
(kg)
Balance resolution
(kg)
Balance limit of performance
(kg)
500 12000 - -
300 5600 - -
250 1600 - -
200 800 - -
150 300 - -
120 150 0.01 ± 0.05
100 100 0.01 ± 0.05
Table 2 – Template size requirements
Nominal aperture size
(mm)
Tolerance for aperture
(mm)
500 ± 6.0
300 ± 6.0
250 ± 5.0
200 ± 4.0
150 ± 3.0


![(RON) 14AUG 0.95 1.01 1.05 1.05 1.05 1.04 2.3% PSB Industries [FR] 11.6x 1.3x … · 2017-08-14 · APS (RON) 0.95 1.01 1.05 1.05 1.05 1.04 2.3% 11.6x 1.3x ROaE À 8.2% 0.7% 0.8%](https://static.fdocuments.net/doc/165x107/5f7f1b4bb4b94c6a071b1181/ron-14aug-095-101-105-105-105-104-23-psb-industries-fr-116x-13x-2017-08-14.jpg)


![1.05 Mb [Download]](https://static.fdocuments.net/doc/165x107/587f2c131a28abb43f8bc435/105-mb-download.jpg)