CHARACTERIZATION OF POULTRY PROCESSING WASTEWATER USING SURVEY AND

Part 3 Examples of Food Processing Wastewater Treatment

107
Part 3 Examples of Food Processing Wastewater Treatment
Chapter 1 Raw Food Material and Wastewater from Production Process
1.1. Products and Characteristics of Wastewater
The characteristics and volume of wastewater discharged from food processing
factories vary with the products and production procedures. In factories like accompanying
dishes makers and beverage makers, due to changes of products and/or production the
wastewater fluctuates in characteristics and volume. Starch making factories in Hokkaido and
sake breweries produce for a specified period of the year and only generate wastewater then.
Almost all the wastewater in food processing factories is treated using a biological treatment
process. The wastewater qualities and treatment methods are summarized in Table 3-1-1. The
characteristics of wastewater from food processing factories are characterized by high BOD, SS,
and oil concentrations as well as emitting smells from acidification. When aerobic or anaerobic
biological processes are applied to wastewater treatment in food processing factories, removing
oils and solids prior to the biological process is important for preventing them from disturbing
the treatment.
1.2 Treatment Process Selection
When construction of a wastewater treatment plant is planned in food processing
factories as well as in other industries, the wastewater properties, site conditions of the
wastewater treatment plant, and economical efficiency of the treatment shall be considered for
selecting the treatment process. The basic flow in food processing factories is the regulation,
aeration, and settling tanks. Although activated sludge and the lagoon were the most widely
used processes before the beginning of the 1990s, new processes offering improved capability,
lower cost performance, and better care for the environment have taken their places in recent
years. A representative type is anaerobic treatment, which has enabled economically stable
treatment, owing to the development of technology for drastically upgrading the anaerobic
microorganism holding density. As the result, direct discharge of effluent from the process to the
sewer has been permitted where sewerage systems are available. As wastewater from food
processing factories contains a high portion of organic matter, a hybrid system combining
anaerobic and aerobic processes with anaerobic pre-treatment can contribute to substantial

108
Table 3-1-1 Typical industrial wastewater characteristics and treatment methods
energy savings by producing methane gas. One defect in the activated sludge process is sludge
bulking. New technologies, however, such as the floating media biofilm activated sludge process
and the activated sludge process equipped with UF membrane instead of the settling tank,
have been developed to prevent bulking problems. The effluent standards have lately become
more stringent, and the nitrogen removal requirement is being specially strengthened.
Denitrification processes have been dramatically improved by developing the technology of the
single-phase sludge circulating denitrification process and equipment like floating medias
holding high-density anaerobic microorganisms. Advanced treatment including
coagulation-sedimentation, high-rate sand filtration, and dissolved air floatation is used for
removing BOD, COD, and SS. For removing color, coagulation-sedimentation, ozonation or
Typical treatment
pH BOD COD SS Oil N P Color Others methods
Brewery ○ ○ ○ AS, AD
Beverage ○ ○ AS, AD
Vegetable oil ○ ○ ◎ OS, AS, AD,
Milk/daily product ○ ○ AS
Starch ○ ○ ◎ AS
Daily dishes ○ ○ AS
Confectionary ○ ○ AS
Petroleum Refinery
refinery Deforming
Petrochemistry ○ ○ ○ N, FL, AS, AD
Chemical fertilizer ○ ○ ○ ○ ◎ ◎ N, AS, DN, PR
Polymer chemistry ○ ○ ○ N, AS, AD
Organic chemistry ○ ○ ○ ○ N, FL, AS, AD
Oil/fat ○ ○ ○ OS, FL, AS
Pharmaceuticals ○ ○ ○ AS
Blast furnace ○ ○ CS, FI
Steel, hot mill ○ ○ ○ OS, FI,CS, FI
Col mill ○ ○ N, FI
Cokes ○ ○ ○ ◎ ○ phenols N, OS, AS、FI
SKP ○ ○ ○ ○ smell IC, AS
KP ○ ○ ○ ○ smell CS, FL, BL
SCP, CGP ○ ○ ○ ○ smell CS, FL、AS, IC
Washing/screening ○ FL, AS
Desizing ◎ ○ ○ CS, FL, AS
Scouring ○ CS, FL, CH
Bleaching ○ CS, FL, CH
Dyeing ○ ○ N, CS, FL、O3
Semiconductor ○ ○ ○ fluoride N, AS, CS, FI, MF, O3
Automobile ○ FL, FI, MF
Plating ○ cyanide N, FL, CS, CH, O3
Wool ○ ○ ○ CS, AD、IC
Synthetic fiber ○ ○ ○ N, CS, FL, AS
Remarks: (1) treatment methods, N: neutralization, FI: Filtration, OS: oil separation, CS: coagulation-settling
FL: dissolved air floatation, AS: aerobic biological treatment,
AD: anaerobic biological treatment, MF: membrane separation,
CH: chemical treatment, O3: ozonation, chlorination, IC: incineration
DM: denitrification, PR: phosphorous removal, BL: black liquor recovery
(2) specifically heavily polluted items are marked by ◎
(3) in case of advanced treatment, filtration, activated carbon absorber and membrane separation are
provided in addition to above unit operations
Industries WastewaterMajor pollutants
OS, AS, AD,
Steel
Paper/pulp
Food
Chemistry
○ ◎
Dyeing
Machinery
Fiber
smell
109
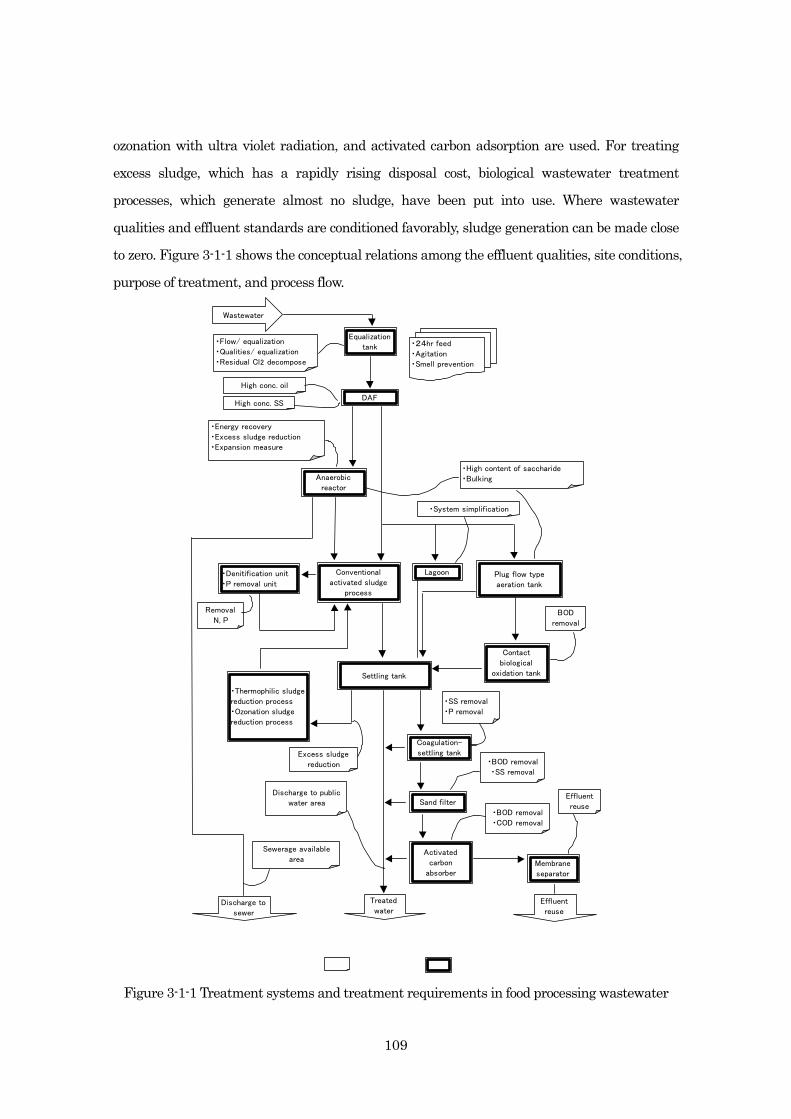
ozonation with ultra violet radiation, and activated carbon adsorption are used. For treating
excess sludge, which has a rapidly rising disposal cost, biological wastewater treatment
processes, which generate almost no sludge, have been put into use. Where wastewater
qualities and effluent standards are conditioned favorably, sludge generation can be made close
to zero. Figure 3-1-1 shows the conceptual relations among the effluent qualities, site conditions,
purpose of treatment, and process flow.
Figure 3-1-1 Treatment systems and treatment requirements in food processing wastewater
Equalization
tank・Flow/ equalization
・Qualities/ equalization
・Residual Cl2 decompose
・24hr feed
・Agitation
・Smell prevention
・Energy recovery
・Excess sludge reduction
・Expansion measure
・System simplification
Anaerobic
reactor
Conventional
activated sludge
process
Sewerage available
area
Lagoon
・High content of saccharide
・Bulking
Plug flow type
aeration tank
Contact
biological
oxidation tank
Discharge to public
water area
High conc. oil
DAFHigh conc. SS
Coagulation-
settling tank
・SS removal
・P removal
Removal
N, PBOD
removal
・BOD removal
・SS removal
Effluent
reuse
Membrane
separator
Sand filter
・Denitification unit
・P removal unit
Activated
carbon
absorber
Wastewater
Excess sludge
reduction
・Thermophilic sludge
reduction process
・Ozonation sludge
reduction process
Settling tank
・BOD removal
・COD removal
Discharge to
sewer
Effluent
reuse
Treated
water

110
Chapter 2 Beverages 2.1 Wastewater Volume and Qualities
As the raw water qualities used in beverage factories significantly affect the products,
better quality water than tap water is used as the raw material, after being treated by chemical
dosing coagulation, sand filtration, activated carbon filtration, degasification, and other
processes. As shown in Figure 3-2-1, carbon dioxide gas, sweeteners like sugar or syrup and
flavors are dissolved into the water. Much of the wastewater comes from washing and rinsing
cans, bottles, cleaning equipment, containers, floor, etc. Although wastewater volume varies
with the products and factories, water 10 times the product ingredients is generally needed and
has to be treated. As a standard1), the wastewater volume is about 50 m3 for producing 1,000
standard containers. Carbonated drink ingredients are shown in Table 3-2-12). Wastewater
qualities are shown in Table 3-2-22). As the table clearly shows, wastewater is alkaline because
alkaline detergents are used in washing. Since BOD and SS concentration are high, direct
discharge into public waters without treatment causes environmental pollution.
Figure 3-2-1 Carbonated beverage manufacturing process and wastewater
Table 3-2-1 Properties of carbonated drink
Table 3-2-2 Wastewater properties in carbonated drink factories
Water treatment
plant
(Activated carbon
absorber)
Refrigerator
CO2 injector
Bottle
washing
・Sirup filtration
・Bottle stopper
Labeling
Sirup tank
Sirup filtration
Sirup mixer
Packing
Equipment,
floor washing
ProductCO2 generator
Waste
Coke 67,400 114,900 1,526 2.4
Pepsi Cola 79,500 122,000 1,466 2.5
Canada Dry 64,500 101,300 3,150 2.4
Carbonated drink(mg/ ) (mg/ )
Total acidity
(mg/ )pH
BOD Total solids
A 10.6~11.4 390 380 170
B 10.0~11.2 250 660 160
C 10.4~11.2 220 250 340
Average 290 430 220
SS
(mg/ )
Total alkalinity BOD
(mg/ ) Factories pH
(mg/ )

111
2.2 Example of Actual Treatment3)
1. Design Condition
Main product Coke
Containers Glass bottles, plastic bottles, cans
Wastewater volume 4,000 m3/d, hourly peak flow 300 m3/h
Wastewater qualities BOD 400 mg/ℓ (daily average)
pH 5.8~11.0
SS 50~70 mg/ℓ
Effluent qualities BOD 30 mg/ℓ (daily average)
pH 7.0~8.0
SS 20~30 mg/ℓ
2. Process
As this factory was located in an area where the effluent standards were lenient and
sufficiently wide space was available for wastewater treatment plant, the lagoon process was
adopted due to the ease of operation and limited sludge generation. Figure 3-2-2 shows the
wastewater treatment scheme. After large floating solids are removed in the grid-oil separator
tank, the raw water flows into the lagoon, where it is oxidized and decomposed by the activated
sludge therein. As the lagoon is 20,000 m3 in total capacity and uses 5 days detention time, the
BOD-MLSS load is 1/5~1/10 of the conventional activated sludge process. The endogenous
respiration is accelerated and limited excess sludge is generated. The lagoon is divided into four
parts, and the aerator in each part is intermittently operated for supplying oxygen and
agitating the water. The last part of the lagoon plays a dual role, the final upgrading of the
quality by aeration and removing the sludge by settling. Aeration is given for 4~7 hours a day
and the supernatant, relieved of sludge, is discharged from a gate taking 12 hours during the
aeration halt, while part of the finally settled sludge is returned by pumping to the first part of
lagoon. As the wastewater tends to be short of nitrogen and phosphorous, nutrients for
activated sludge, urea, and phosphate ammonium are dosed as supplements.

112
Figure 3-2-2 Schematic flow of Carbonated beverage manufacturing wastewater treatment
3. Performance Results
Although this wastewater treatment facility is located in Sapporo where the outdoor
temperature goes down to nearly -15℃ in winter, the water in the lagoon is kept at 8℃ due to
the high raw water temperature. Good treatment is achieved throughout the year. Typical raw
wastewater quality is shown in Table 3-2-3. The average, maximum, and minimum effluent
qualities of the year are shown in Table 3-2-4. No sludge has been drained since 1974 when the
operation started.
Table 3-2-3 Raw wastewater properties (monthly average)
Table 3-2-4 Treated water quality in carbonated drink wastewater treatment
2.3 Considerations in Operation and Maintenance
Though the lagoon process is operated easily, sludge bulking tends to occur. It is
important to maintain a well-balanced ratio of BOD, N, and P control the bulking. As the
process is operated under low BOD-MLSS load conditions, the nitrogen in raw wastewater is
oxidized into nitrate and then reduced to nitrogen gas under anoxic condition in the final part of
the lagoon. Micro fine nitrogen bubbles adhering to sludge particles cause poor settling and
carry-over of the sludge. This sometimes results in effluent quality deterioration and
performance degradation due to MLSS reduction.
Raw wastewaterWastewater
tank
Effluent
Sand, oil
separator
Lagoon basin
No.1 No.2 No.3 No.4
1,2 10.1 320 162 3.8
3,4 10 175 151 16.6
pHLineCOD
(mg/ )
BOD
(mg/ )
SS
(mg/ )
Temp. Water pH COD BOD DO SS Trans- Coli
℃ temp. (mg/ ) (mg/ ) (mg/ ) (mg/ ) parent form
℃ (No./1m )
Yearly average 10.7 16.7 7.3 9 2.6 4.5 4.3 40 105
Maximum 33 25.4 7.6 11.3 5.4 9.2 11.3 50 279
Minimum -15 8.5 7.1 7.8 1.6 1.7 2.4 20 2
Items
113
REFFERENCES
1. Ide, T. Industrial Wastewater and Treatments, p 423 (Gihodo, 1978).
2. Sotoike, R. Water and Wastewater Handbook, p 781 (Maruzen, 1992).
3. Aihara, R. Current Situation of Wastewater Treatment in Beverage Factories, The Best
Treatment of Food Processing Wastewater Handbook, p 278 (Science Forum, 2002).
Chapter 3 Breweries 3.1 Beer
3.1.1 Wastewater Volume and Qualities
In the beer brewing process, malts, rice, and cornstarch are fed as supplemental raw
materials into the breeding tank and saccharized. The malt liquid, then dosed with hops, is
filtered. The filtrate, after heat-processed in a boiling caldron, cooling down to 7~10 ℃, and
being dosed with yeast, is fermented for 7~10 days before becoming the final product. The
quality and volume of wastewater vary with the brewing process and if there is a malt
producing process because some beer breweries now use dried malt mass-produced at
malt-producing factories elsewhere. Figure 3-3-1 shows all the production lines and wastewater
discharge points. A large volume of wastewater containing high BOD and SS is discharged from
the stage of screw-press-dewatering filtered residues after the breeding tank, and the
dewatered residue is fed to livestock because of high nutrient contents. Wastewater with high
BOD and SS comes out of the hop separation tank too. After fermentation in the main
fermentation tank, yeast is separated, washed, and reused. Part of it is also reused for food,
medicine, and other uses. These processes, consuming water for washing and rinsing, are a
main source of wastewater. Beer is aged in the after-fermentation tank washed after periodical
draining of settled yeast, discharging wastewater. In the final filtration process residual yeast,
insoluble proteins, tannins, and other items are removed from the brewed beer. Diatomite used
in the process is washed out into the washing water of filter equipment, separated at the inlet of
the wastewater treatment plant, and disposed of as solid waste. Heat sterilization is not applied
for draft beer production. Therefore, a large quantity of wastewater is generated from washing
filter equipment, as it is very important for microbial control of the product. The last production
stage is bottling. The recovered bottles and casks are washed with alkaline and acid detergents,
and residual beer and labels come out into the wastewater. The standard wastewater volume is
generally about 10~20 times the beer produced1).

114
Figure 3-3-1 Beer brewery and wastewater discharges
3.1.2 Example of Actual Treatment
1. Design Condition
Wastewater volume 7,000 m3/d (brewing=5,400 m3/d, bottling=1,600 m3/d)
Wastewater qualities BOD 1,500 mg/ℓ( brewing=1700 mg/ℓ, bottling=300 mg/ℓ)
SS 65 mg/ℓ( brewing=800 mg/ℓ, bottling=150~300 mg/ℓ)
Effluent qualities BOD <20 mg/ℓ(anaerobic effluent <200 mg/ℓ, activated sludge
effluent <20 mg/ℓ)
SS <20 mg/ℓ(anaerobic effluent <200 mg/ℓ, activated sludge
effluent <20 mg/ℓ)
2. Process
This factory had treated previously wastewater with the activated sludge process and,
when expanding production and after reviewing the performance, added an anaerobic
treatment process in order to cope with the increased production and reduce the wastewater
treatment cost. Figure 3-3-2 shows the schematic flow diagram. In the screening chamber,
floating solids are removed from the 7,000 m3/d wastewater, mixture of wastewater from the
brewing, bottling, and canning processes, and the wastewater flows into the equalization tank.
There it is divided into two parts, a part of 6,400 m3/d for the newly built anaerobic treatment
plant and another part of 600 m3/d for the old activated sludge plant. Wastewater for the
anaerobic treatment is removed of SS with the dissolved air floatation unit (DAF), neutralized
by sodium hydroxide or hydrochloric acid, and then fed into an anaerobic treatment reactor
Barley MaltSteeping・
germinatingMilling
Mashing
tank
FiltrationSedimentation
tank
Cooling Main
fermentation
Post
fermentationFiltration
Packing
Products
・bottle ・ cask
Drying
Draft beer
Sub raw material
・rice
・cornstarch
Boiling
Hop
Wastewater
Yeast
Wort
Bottle
washing
115
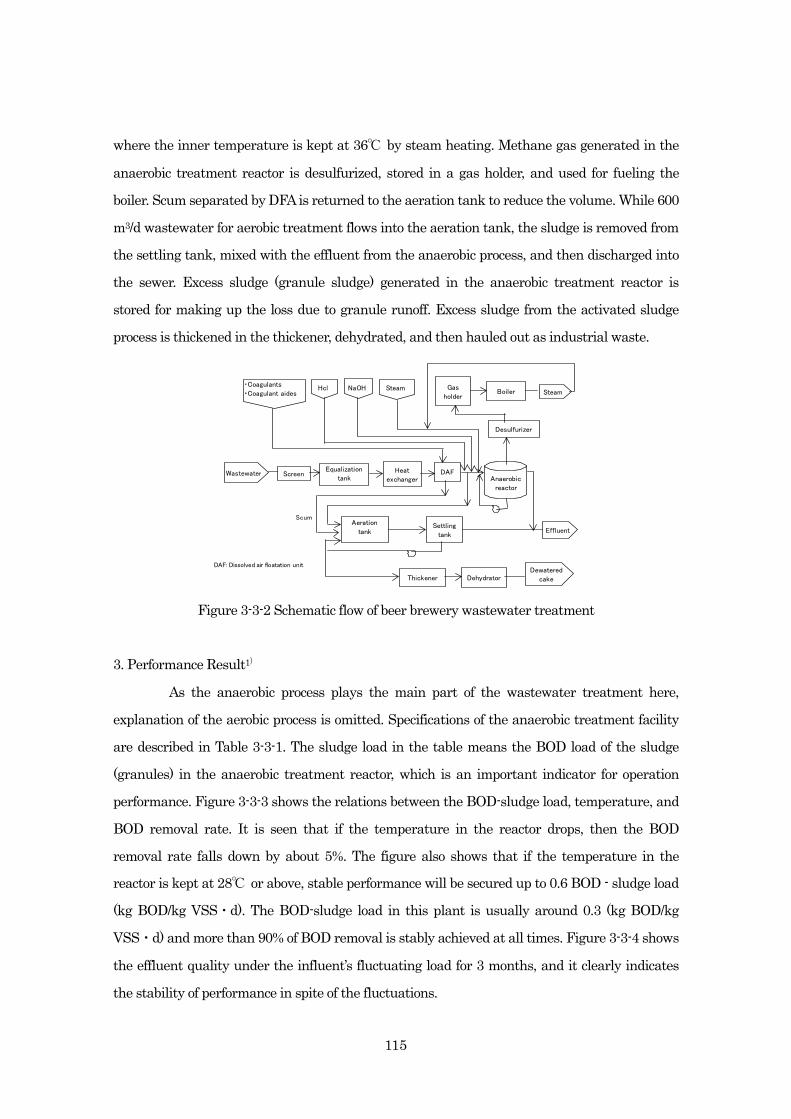
where the inner temperature is kept at 36℃ by steam heating. Methane gas generated in the
anaerobic treatment reactor is desulfurized, stored in a gas holder, and used for fueling the
boiler. Scum separated by DFA is returned to the aeration tank to reduce the volume. While 600
m3/d wastewater for aerobic treatment flows into the aeration tank, the sludge is removed from
the settling tank, mixed with the effluent from the anaerobic process, and then discharged into
the sewer. Excess sludge (granule sludge) generated in the anaerobic treatment reactor is
stored for making up the loss due to granule runoff. Excess sludge from the activated sludge
process is thickened in the thickener, dehydrated, and then hauled out as industrial waste.
Figure 3-3-2 Schematic flow of beer brewery wastewater treatment
3. Performance Result1)
As the anaerobic process plays the main part of the wastewater treatment here,
explanation of the aerobic process is omitted. Specifications of the anaerobic treatment facility
are described in Table 3-3-1. The sludge load in the table means the BOD load of the sludge
(granules) in the anaerobic treatment reactor, which is an important indicator for operation
performance. Figure 3-3-3 shows the relations between the BOD-sludge load, temperature, and
BOD removal rate. It is seen that if the temperature in the reactor drops, then the BOD
removal rate falls down by about 5%. The figure also shows that if the temperature in the
reactor is kept at 28℃ or above, stable performance will be secured up to 0.6 BOD - sludge load
(kg BOD/kg VSS・d). The BOD-sludge load in this plant is usually around 0.3 (kg BOD/kg
VSS・d) and more than 90% of BOD removal is stably achieved at all times. Figure 3-3-4 shows
the effluent quality under the influent’s fluctuating load for 3 months, and it clearly indicates
the stability of performance in spite of the fluctuations.
Wastewater ScreenEqualization
tankHeat
exchanger Anaerobic
reactor
Desulfurizer
Gas
holderBoiler Steam
DAF
Aeration
tankSettling
tankEffluent
SteamHcl NaOH・Coagulants
・Coagulant aides
Thickener DehydratorDewatered
cake
Scum
DAF: Dissolved air floatation unit

116
Table 3-3-1 Performance of anaerobic treatment in beer brewery wastewater
Figure 3-3-3 BOD-MLSS versus over BOD removal rate
Figure 3-3-4 BOD-MLSS load and BOD removal rate in beer brewery wastewater treatment
Temperature in reactor
pH in reactor
Sludge load
Influent BOD
Effluent BOD
Influent SS
Effluent SS
BOD removal rate
Items Specifications
117mg/
135mg/
35.5℃
7.2
0.31kg BOD/kg VSS/d
1,420mg/
104mg/
93%
0.00
0.20
0.40
0.60
5/23 5/29 6/4 6/10 6/16 6/22 6/28 7/4 7/10 7/16 7/22 7/28 8/3 8/9 8/15
0
500
1000
1500
2000
5/23 5/29 6/4 6/10 6/16 6/22 6/28 7/4 7/10 7/16 7/22 7/28 8/3 8/9 8/15
60
70
80
90
100
5/23 5/29 6/4 6/10 6/16 6/22 6/28 7/4 7/10 7/16 7/22 7/28 8/3 8/9 8/15'95-6/5 12 19 26 7/3 10 17 24 31 8/7 14 21 28
MLSS loa
d
(kgB
OD
/kg
VSS・d
)
BO
D
(mg/L
)B
OD
rem
ova
l
(%)
60
70
80
90
100
0 0.2 0.4 0.6 0.8 1 1.2
BOD-MLSS load 〔kgBOD/kgVSS・d〕
BO
D r
em
ova
l 〔%〕
● '94.9~10 33 ~ 37℃○ '94.11~'95.3 28 ~ 32℃● '95.6~8 34 ~ 37℃

117
3.1.3 Considerations in Operation and Maintenance
Two anaerobic methods are used in treating industrial wastewater. They are the
UASB (Up-flow Anaerobic Sludge Blanket) process using microbial granulation and the fixed
bed process using microbial biofilm on the surface of media. Though the UASB process can hold
more anaerobic microorganisms per volume than the fixed bed process and makes a higher
loading rate operation possible, it contains the risk of granule runoff. The major cause of
granule runoff is that adherence of SS in raw wastewater to the granules makes it difficult to
separate the gas bubbles from the granules. The relation between SS in influent raw
wastewater and granule runoff from the reactor is shown in Figure 3-3-5. The allowable SS
weight in influent raw wastewater shall be less than the weight of the multiplying granules in
the reactor, which is 400 mg/ℓ in this case.
Figure 3-3-5 Relations between influent SS and wash-out granule SS
3.2 Sake
3.2.1 Wastewater Volume and Qualities
The relation between the process of brewing sake and generating wastewater is
shown in Figure 3-3-6. Rice polisher washes rice bran off from polished rice, and starch flows
out from the operation. As the major pollutant portions in sake breweries are discharged here,
the pollutants for the wastewater treatment depend significantly on the volume of water used
in the washing operation. Efforts to remove rice bran from polished rice by rotary shifters or dry
rice polishers prior to washing have been made lately in order to reducing the wastewater
0
50
100
150
0 500 1000 1500
Influent SS (mg/ )
Was
h-out
gran
ule
SS (m
g/)

118
volume and concentration. Wastewater re-circulation, definitely contributing to reducing the
volume and load for the settling tank, makes operating wastewater treatment easier, although
it raises the concentration. Other wastewater comes from the bottling process and washing
equipment. As washing recycled bottles is outsourced now and the BOD of wastewater from
washing bottles is as low as a few mg/ℓ, it can usually be discharged after pH adjustment. The
wastewater volume is generally about 20~30 times the sake as a rough standard2).
Figure 3-3-6 Sake brewing process and wastewater
3.2.2 Example of Actual Treatment
1. Design Condition
Wastewater volume 250 m3/d (rice-wash-wastewater: miscellaneous wastewater= 120
m3/d: 130 m3/d)
Wastewater qualities BOD 750 mg/ℓ (rice-wash-wastewater 4,000 mg/ℓ)
SS 120 mg/ℓ (rice-wash-wastewater 5,000 mg/ℓ)
Effluent qualities BOD <20 mg/ℓ
SS <30 mg/ℓ
2. Process
The wastewater treatment plant is located in an area surrounded by a good natural
environment, and advanced treatment is incorporated into the plant. The schematic flow is
shown in Figure 3-3-7. Solid contents in the wastewater from rice washing are separated in the
coagulation-sedimentation tank and the supernatant is sent, together with miscellaneous
RiceRice
polisher,wetting
Ricesteaming
Fermentation
Sakeyeast
Mainmash
Maturingunrefined sake
Squeezing Sake Filtration
Heating Storage Bottling
Product
Yeast
Maltedrice
Bottlewashing Equipments,
floorwashing
wastewater
Polishedrice
Wastewater
Wastewater

119
wastewater, to the aeration tank. The effluent from the activated sludge process, after
separating SS in the coagulation-sedimentation and sand filtration tanks, is processed through
activated carbon and chlorinated before it is discharged into the river. As the sake brewing
wastewater tends to be short of nitrogen and phosphorous, urea and phosphate ammonium are
dosed as supplement nutrients. Sediment materials from rice-wash-wastewater are used for
livestock feed after being coagulated, thickened, and dehydrated by dosages of harmless
coagulants.
Figure 3-3-7 Schematic flow of rice washing wastewater
3. Performance Results
BOD and COD in the wastewater from washing rice can be substantially removed by
coagulation–sedimentation. The test results of the properties of sampled wastewater and
settlability are respectively shown in Table 3-3-2 and Table 3-3-3. The wastewater was sampled
just after washing the rice and the removal rates of BOD and COD by
coagulation-sedimentation were about 85% and 80%. The rates are lowered as time elapses,
due to fast putrefaction of the wastewater. When the same testing was made for samples
collected 48 hours after washing the rice, the removal rates of BOD and COD were down to 35%
and 56%. These changes were caused by the solid contents in the wastewater being solubilized,
and changing to soluble BOD and COD, and they made coagulation difficult. A test result of
coagulating the wastewater is shown in Figure 3-3-83). The results show that SS coagulated
with PAC 250 as a coagulant, and nonionic polyelectrolyte as a coagulant aid settles it very
speedily. In this factory, the effluent BOD of activated sludge process is around 10 mg/ℓ, and
then it is lowered down to a few mg/ℓ through the advanced treatment system.
Coagulation-
settling
Sand
filter
Equalization
tank
Aeration
tank
Activated
carbon filter
Dehydrator
Settling
tank
Effluent
Dewateredcake
Livestock
feed
Chlorination
tank
Rice washing
wastewater
Coagulation-
settling
Dehydrator

120
Table 3-3-2 Rice-wash-wastewater properties for experiment
Table 3-3-3 Coagulation-settling test result for rice-wash-wastewater
Figure 3-3-8 Settling test result of coagulated rice-washing-wastewater
3.2.3 Considerations in Operation and Maintenance
The important factor for securing continuous and stable performance in wastewater
treatment is pre-treatment by coagulation-sedimentation. As described above, SS shall be
coagulated, settled, thickened, and taken out of the treatment system before the wastewater
Condition: pH 7.0, PAC250A 390mg/ , Konan Floc 3000S 10mg/
0
50
100
150
200
250
300
350
1 2 3 4 5 6 7 8 9 10 11
Settling time (hr)
Slu
dge s
urf
ace h
eig
ht
(cm
)
Appearance
Cloudy 6.6 717 990 1,250
pH SS (mg/ ) COD (mg/ ) BOD (mg/ )
Alum PAC Noah Konan- Floc Settle- Floc pH SS COD BOD
250A Floc stability ability volume (mg/?) (mg/?) (mg/?)
1 200 ー 58 10 C C 10 6.8 <50 230 215
2 300 ー 105 10 C C 12 6.7 <50 209 216
3 400 ー 150 10 B2 B2 15 6.8 <30 196 215
4 500 ー 200 10 B1 B1 16 6.8 <30 191 208
5 1,000 ー 365 10 B3 B3 26 6.8 <30 179 185
6 ー 200 15 10 C C 10 7 <50 213 232
7 ー 300 25 10 C C 12 6.8 <30 219 232
8 ー 400 42 10 B B 15 6.9 <30 213 232
9 ー 500 58 10 B B 16 7 <30 213 221
10 ー 1,000 94 10 C C 23 6.8 <30 196 212
Remarks: coagulation states, settlability: B: good, B1: better than B, B3 best, C: normal
Run
Chemical dosage volume (mg/?) Coagulation states Effluent qualities

121
starts putrefying. Moreover, the settlability of activated sludge in sake brewing factories is
inherently poor. This is due to the dispersion, poor settlability, and poor compaction of sludge
caused by the viscosity from delayed polysaccharide decomposition, which originates from the
nitrogen shortage in the wastewater. This phenomenon is called sludge bulking. Sludge bulking
in sake brewing wastewater treatment is different from other bulking as the number of
filamentous bacteria is few and viscous froth forms in the aeration tank. Adding nitrogen and
bulking inhibitor effectively solves the problem. As most sake production is limited seasonally,
wastewater is not generated for many months. For ready re-starting of wastewater treatment,
molasses and rice bran are fed as nutrients during the off seasons to maintain the sludge
activity. If a sewage treatment plant or wastewater treatment plant using activated sludge is
located nearby, another method is importing live sludge a few days before start up, putting it in
the emptied aeration tank, and acclimatizing it by feeding nutrients like rice bran to prepare it
for receiving wastewater.
REFFERENCES
1. Ikemoto, H. Panbic-G Application to Beer Brewing Wastewater, Shinko Pantec Technical Rep.
Vol. 39, No. 2 (1996).
2. Sotoike, R. Water and Wastewater Handbook, p 774 (Maruzen, 1992).
3. Sono, K. Rice-Washed-Wastewater Treatment, Japan Brewing Association Journal, 67, 376
(1972).
Chapter 4 Oils and Fats 4.1 Wastewater Volume and Qualities1)
Vegetable oils are produced from rapeseed, corn, and soybean by the processes shown
in Figure 3-4-1. The production line consists of two processes, extracting oils from raw materials
and refining the extracted oils. The vegetable oil expression methods of industrial scale are
classified into the expression, extraction, and expression-extraction methods. The expression
method squeezes oils out of dried and heat-treated raw materials, leaving 4~7% oil content. The
extraction method extracts oils from heat-treated raw materials using normal hexane as
solvent. The expression-extraction method is a series of the expression and extraction methods.
In the refining process, dust, saccharides, proteins, gummy substances, fatty acids, pigments,
smelling substances, and other such items are removed. Phosphoric acid, sodium hydroxide,

122
and water are used in the process. Filtration aid is also dosed to improve filtration and refining.
Water consumption volume per unit of raw material varies with the production capacity level of
the vegetable oil manufacturing factory. Table 3-4-1 shows the annual production capacity level,
percentage of consumption classified by different water sources (drinking, industrial,
recirculated, sea, etc.), and the consumption volume per unit of raw material. The consumption
volume per raw material unit varies from 30~80 m3/ton. Table 3-4-2 shows the annual
production capacity level as well as the percentage of consumption classified by different
processes and usages (cooling, production process, bottle washing, boiler, sanitary, etc.).
Consumption in the production processes is relatively low percentage-wise except for cooling,
and most of the wastewater comes from deacidifying and deodorizing operations in the refining
process. Wastewater qualities generated by deacidifying and deodorizing operations are shown
in Tables 3-4-3 and 3-4-4.
Figure 3-4-1 Schematic flow of vegetable oil processing and wastewater
Table 3-4-1 Plant scales and water consumption in vegetable oil manufacturing
White earth: powder of silica or silica sand
DAF: Dissolved air floatation unit
・Rapeseed・Corn
Soybeans
Expression
Solventextraction
Solventremoval
Gummymaterialremoval
Gummyremoved
oil
GumAdjustment
tank
Deacidification
Washing
DecolorizationFiltrationDewaxingDeodorizing
Finalfiltration
Filling Product
Solventremoval
Phosphoricacid
Causticsoda
Whiteearth
Water
Filtrationaid
Oilcake
Effluent
Filtrationaid
Gummymaterial
Effluent
Raw materials
consumption Tap Industrial Recycle Sea Others
(1,000 ton/year) water water water water
<10 5 18.5 12.1 0 64.4 35.9
10~50 2.1 8.7 45.3 25.1 18.8 36.7
50~100 1 8.5 11 73.4 6.1 83.1
100~300 0.8 2.5 70.6 26 0.1 62.2
≧300 0.5 7.3 56 36.2 0 31
Average 0.8 6.1 53.9 36.2 3 41.9
Service water usage ratio (%) Water (m3)
raw material (ton)
per

123
Table 3-4-2 Water consumption rate at each process in vegetable oil manufacturing (%)
Table 3-4-3 Wastewater qualities of deacidification process
Table 3-4-4 Wastewater qualities of deodorizing process
4.2 Example of Actual Treatment
4.2.1 Example of Dissolved Air Floating Unit1)
When wastewater discharged from vegetable oil manufacturing is mixed with sea
water, coagulation takes place. In Japan, many factories are located in coastal areas because
imported raw materials are transported in bulk by sea, and the location facilitates using sea
water for wastewater treatment. Table 3-4-5 shows reducing COD in soybeans oil wastewater
by dosage with salt. When 30 g of salt is dosed for one liter of wastewater and agitated, floc is
formed by coagulation and settles. This removes 90% of COD in the supernatant.
Table 3-4-5 Salting-out test result for vegetable oil manufacturing
wastewater by dosing synthetic sea water
Raw materials Bottle Boiler
consumption washing feed
(1,000 ton/year) Cooling Process Cooling Process
<10 25.9 0 54.1 7.2 1.6 4.6 6.6
10~50 29.4 0.7 51 5.8 0.6 3.5 9
50~100 31.5 0.2 42.5 1.3 0.1 2.8 21.7
100~300 41.5 0.1 56.4 0.3 0.1 1.1 0.5
≧300 51.1 0 41.2 3.4 0.1 2.8 1.4
Expression, extraction
process
Refining
process
Sanitary,
others
pH 6~7
COD 400~7,400 mg/
N-hexane extract 1,000~10,000 mg/
pH neutral
COD 50~100 mg/
N-hexane extract 50~100 mg/
SS 30~400 mg/
1 100 200 574
2 100 300 193
3 100 400 133
4 100 100 447
5 100 100 275
6 100 200 247
COD in raw wastewater is 7,400 mg/
Run Wastewater(m )COD in treated
water (mg/ )
synthetic sea water
(m )

124
1. Process
The schematic flow of two-stage dissolved air floatation units (DFA) are shown in
Figure 3-4-2. Almost the same amount of sea water as wastewater is added in the first stage
DFA. The condensed scum is dewatered and carried out as industrial waste. The effluent from
the first-stage DAF is adjusted for pH and dosed coagulant, and then treated in the
second-stage DAF before being discharged. The second stage scum is dewatered similarly as the
first stage scum. The volume is about 20% wastewater and contains 5% solids.
Figure 3-4-2 Dissolved air floatation (DFA) treatment of vegetable oil processing factory
2. Performance Results
More than 90% of COD is removed at the first stage DAF and 80~90% of remaining
COD is further removed at the second stage DAF.
4.2.2. Example of Biological Treatment
1. Design Condition
Wastewater volume 600 m3/d
Wastewater qualities BOD 8,000 mg/ℓ
TOD 14,000 mg/ℓ
SS 1,700 mg/ℓ
N 400 mg/ℓ
Effluent qualities BOD <280 mg/ℓ
SS <280 mg/ℓ
Coagulation & pH
adjustment
tankWastewater DFA
Coagulation
tankDAF
Sea
water
Coagulants
Scum
Effluent

125
2. Process
This treatment plant can concurrently recover methane from organic materials in the
wastewater, reduce the load on the activated sludge process, save energy consumption, and
reduce excess sludge generation. The schematic flow of the treatment plant is shown in Figure
3-4-3. The raw wastewater is adjusted for the temperature by heat exchanger and fed to the
anaerobic treatment reactor, where the temperature is kept at around 36℃, and the floating
media are fully filled. Anaerobic microorganisms held on the surface of the media generate
methane by decomposing organic materials. Then the effluent is fed to the upstream
denitrification tank where nitric acid in the returned sludge water from the settling tank is
reduced to generate nitrogen gas. After denitrification, organic materials in the effluent from
the denitrification tank are oxidized and nitrified in the aeration tank. Then, the effluent is fed
to the downstream denitrification tank where nitrogen is removed again by reducing the nitric
acid. The effluent from the denitrification tank is separated from the sludge at the settling tank,
and finally discharged. Settled sludge in the settling tank is returned to the upstream
denitrification tank. Methane gas generated in the anaerobic treatment reactor has hydrogen
sulfide removed by the desulfurizer and is used for the fueling boiler. Generated steam is used
for heating the anaerobic treatment reactor.
Figure 3-4-3 Schematic flow of vegetable oil processing wastewater treatment
Excess sludge
Rawwastewater
tank
Heatexchanger
Anaerobictreatment
tank
Desulfurizer Boiler
Denitrificationtank
Aerationtank
Re-aerationtank
Settlingtank
Dehydrator
Steam
Effluent
Dewateredcake
Coolingwater
Rawwastewater
Steam
Coolingwater
Denitrificationtank
126
3. Performance Results
It took some time before the anaerobic microorganisms adhered, grew, and held on to
the media surface in this fixed bed type anaerobic treatment reactor. Since then, however, the
reactor has maintained stable operation, maintaining over a 70% removal BOD rate, despite
the unexpected and sudden substrate changes in the wastewater and load conditions. The
activated sludge process downstream keeps the BOD reduction stable at more than 90%. The
volume of generated gas varies affected by pH in the anaerobic treatment reactor. When the pH
goes on the alkaline side, the volume decreases due to the higher solubility of the carbon dioxide,
and when the pH inclines to the acid side, the volume increases. If pH is kept at 6~8, the
methane gas content in the generated gas is almost equal to the theoretical value. The volume
of generated excess sludge is 1/3~1/5 of the aerobic biological process. Energy savings and
sludge volume reduction, goals of introducing the processes, have been attained in this plant.
4.3 Considerations in Operation and Maintenance
Although the wastewater volume in vegetable oil factories is relatively small and
fluctuates less, removing oil sufficiently in the oil separator for pre-treatment is important
because of the high oil content. Especially in the case of anaerobic and activated sludge
treatment, much attention is paid to the oil removal. In the case of two stage dissolved air
floatation, the effects of coagulants in the second-stage coagulation are influenced by alkalinity
and salt concentrations in the wastewater. Therefore, coagulating conditions shall be optimized
by using jar testing. The coagulating conditions of wastewater differ for raw materials like
rapeseeds and soybeans and understanding them is important for sludge management.
REFFERENCES
1. Hori H. Oils and Fats Product, The Best Treatment of Food Processing Wastewater
Handbook, p 308 (Science Forum, 2002).
Chapter 5 Milk and Dairy Products 5.1 Wastewater Volume and Qualities1)
The production lines of milk and dairy products are shown in Figure 3-5-1. In the milk
and dairy product processing factories, water is used for washing, cooling, air conditioning,
boilers, sanitation, etc. The wastewater originates from washing equipment, machines, floor,

127
etc.; accidental leakage of raw materials and products; and dumping off-spec products and
contaminated raw materials and products. Figure 3-5-2 shows, in percentages, the water
consumption by various processes. About 60% of wastewater comes from washing. After
production works terminate, the equipment used is cleaned by chemicals and, before and after
the cleaning, washed and rinsed with water. Thus, the wastewater is generated. Table 3-5-1
shows the properties of wastewater and the generated volume per unit of product, classified by
the products. As production of milk and dairy products peaks in the summer, so does the
wastewater volume. Depending on the degree of production activities, the volume and pollutant
concentration of wastewater fluctuates within a 3 to 1 range by the hour and 2 to 1 by the day.
The pollution load is especially high on the weekends.
Figure 3-5-1 Schematic flow of milk and dairy products
Measuring
Storage
Ingredient
standardization
Centrifuging
Fermentation
Coagulation
Heating
Curds
Cheddaring
Milling and Cooking
Hooping and
pressing
Ripening
Whey
Cheese
Heating
Raw
milk
Filtration
Cooling
Milksugar
Cream
Sterilization
Cooling
Fermentation
Coloring
Mixing
Milk
fat
Washing
Heating
Pressurized
kneading
Butter
Butter
Milk
Skim
milk
Sugar
adding
Mixing
Filtration
Flavor
Calpis
Casein
Boiling
Vacuum
concentration
Cooling
Filling
Powdermilk
Filtration
Condensedmilk
Adjustment
Bottling
Milk
Sterilization
Fermentation
Sterilization
Sugar
adding
Vacuum
concentration
Cooling
Filling
Cooling
Sterilization

128
Figure 3-5-2 Water consumption rate by various processes
Table 3-5-1 Wastewater volume and qualities in milk and dairy product processing factory
5.2 Example of Actual Treatment
A conventional activated sludge process in milk and dairy product processing factories
is applied to this factory2).
1. Design Condition
Wastewater volume 540 m3/12 hr. /d (factory; 12 hours operation)
Wastewater qualities pH 8.4
BOD 200 mg/ℓ
Effluent qualities pH 6~8
BOD 20mg/ℓ
SS 20 mg/ℓ
COD 20 mg/ℓ
Coli No. <330/mℓ
61%
24%
5%
5%3% 2%
Washing
Cooling
For product
Boiler
Others
Daily life
pH BOD COD SS Oil※
mg/ mg/ mg/ mg/
Milk, milk drink 11 750 400 150 90 10
Dairy products 10 600 300 100 60 3
Desserts 11 750 350 250 130 13
Cold cakes 11 800 400 200 200 20※
N-hexane extract
ProductWater/product
m3/ton
129
2. Process
As the hourly and daily fluctuations of volume and pollutant loads of wastewater are
large, it is desirable for the conventional activated sludge process that the wastewater be sent to
the aeration tank after equalization of the fluctuating quantity and quality in the equalization
tank. Although an extended aeration process is sometimes adopted for stability against load
fluctuations and easy operations, it needs more space than the activated sludge process. In this
example, the activated sludge process was adopted. Nutrient supplements are not needed
because the wastewater contains BOD, nitrogen, and phosphorous in a well-balanced ratio.
Although excess sludge generation in the activated sludge process is generally higher than in
the extended aeration process, the excess sludge in this plant was reduced to the same volume
as in the extended aeration process by aerobic digestion of thickened sludge. The schematic flow
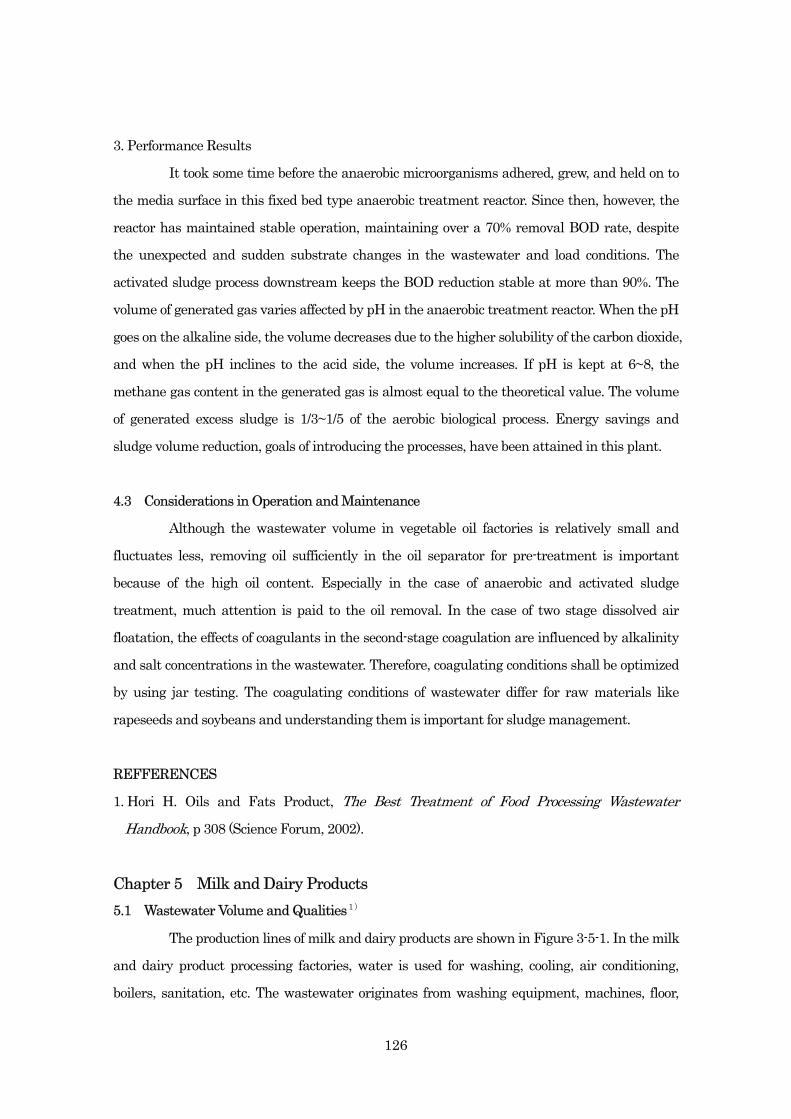
of this plant is shown in Figure 3-5-3. The raw wastewater is screened for floating solids,
equalized in the equalization tank, and fed to the aeration tank. After separating the sludge in
the settling tank, it is sterilized by chlorine, and then discharged. Excess sludge is oxidized, and
the volume is reduced in the aerobic digestion tank.
Figure 3-5-3 Schematic flow of wastewater treatment of milk and dairy product factory
3. Performance Results
The operation results in this plant are shown in Table 3-5-2. In spite of the pollutant
concentrations in the raw wastewater being lower than the design figure, the BOD in the
effluent sometimes exceeded 20 mg/ℓ of the design figure during the period just after start-off
when the MLSS concentration is low. BOD in the effluent, however, has decreased responding
to the increase of MLSS. Excess sludge is aerated for 10~20 days in the aerobic digestion tank,
oxidized, reduced in volume, and then returned to the aeration tank. By this operation, the
processed excess sludge balances, in weight, the SS carried out into the effluent, and eliminates
the need for sludge transportation to the outside.
Wastewater
Screen Equalization
tankAeration
tank
Settling
tank
Chlorination
tank
Aerobic
digestion
tank
Treated
water
Sludge
Excess sludge

130
Table 3-5-2 Milk and dairy wastewater treatment result by activated sludge process
5.3 Considerations in Operation and Maintenance
In wastewater treatment of milk and dairy products, sludge settlability sometimes
becomes poor and accordingly SS concentration in the effluent rises. It is caused by the
over-aeration of activated sludge. Over-aerated sludge floc becomes less coagulable, disperses in
water, and does not settle. Relations between the MLSS concentrations and SV30, an indicator
of sludge settlability (height of the settled sludge blanket after 30 minutes settling, %) for both
the activated sludge process and extended aeration process are shown in Figure 3-5-41). When
the MLSS concentration rises, the DO concentration falls, and the treatment performance
deteriorates. In this case, MLSS shall be lowered by extracting sludge to resume the DO level at
1~2 mg/ℓ.
Figure 3-5-4 Relations between MLSS concentration and SV30 in activated
sludge process and extended aeration process
BOD COD SS MLSS DO BOD COD SS
(mg/ ) (mg/ ) (mg/ ) (mg/ ) (mg/ ) (mg/ ) (mg/ ) (mg/ )
1-May 7.6 121 41 6 1,200 4.2 7.1 19 7 22
5-May 7.3 134 46 17 1,110 4.6 7.1 22 7.4 16
10-May 7.4 110 36 8 1,308 3.2 7.2 16 5.1 18
10-Jul 7.1 140 47 5 2,100 3.6 7 11 3.4 8
10-Sep 6.8 96 31 3 1,860 2.8 7 14 5.2 6
10-Oct 7.4 126 40 6 2,460 3.2 7.1 18 6.1 10
10-Nov 7.6 118 40 4 3,120 3.8 7.2 12 4.2 8
10-Dec 7.2 180 58 9 3,080 3.8 7 12 4.8 20
DatepH pH
Aeration tank Treated waterRaw wastewater
0
10
20
30
40
50
60
70
80
90
100
110
1000 2000 3000 4000 5000 6000 7000 8000MLSS (mg/ )
SV
30
Extended aeration process
Conventional activated sludge process

131
REFFERENCES
1. Yazaki, M. Milk and Dairy Products, The Best Treatment of Food Processing Wastewater
Handbook, p 298 (Science Forum, 2002).
2. Wastewater Treatment in Food Processing Factories, Shinko Pfaudler Technical Report, Vo.
13, No. 4 (1970).
Chapter 6 Agriculture Product Processing 6.1 Wastewater Volume and Qualities
The industries consuming a lot of water in agriculture product processing include
producers of wheat starch, potato starch, sweet potato starch, and sugar. Potato starch
processing factories are located in the main potato producing area in Hokkaido, while wheat
starch processing factories and sugar factories are located where sufficient water and
convenient sea transportation are available because they import their raw materials from
overseas. The wastewater treatment processes are, therefore, characterized by these
geographical locations. Water used in wheat starch processing is 7~15 times, by weight, of the
raw wheat, and the water consumption varies depending on the production methods. Main
pollutants in the wastewater are BOD and SS, and they become putrid easily. The wheat starch
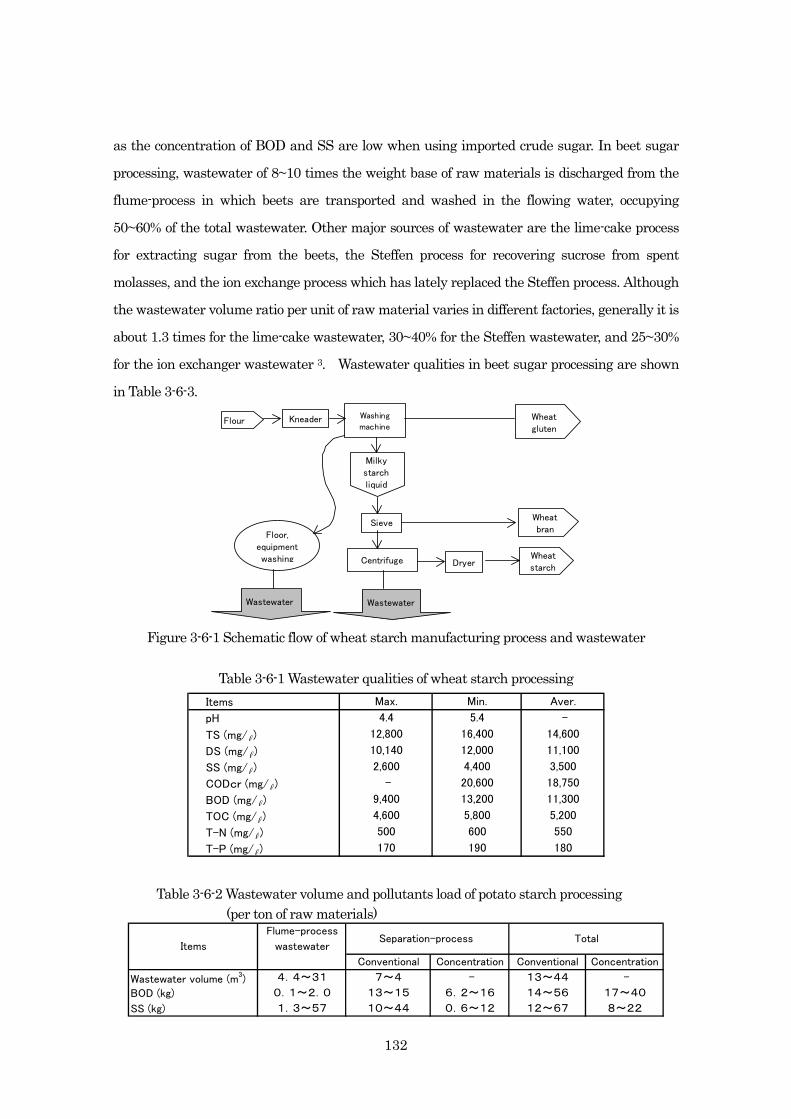
production process and the wastewater generation points are shown in Figure 3-6-11). The
typical wastewater qualities of wheat starch processing are shown in Table 3-6-1. Water used in
potato starch processing is 13~44 m3 per ton of potatoes2). The difference in water consumption
per raw material unit (unit water consumption) depends on the starch recovery rate in the
separation process, in which starch, milky liquid, and lees are separated from the smashed
potatoes and some ingredients are refined and condensed. This separation process is the major
source of wastewater. Potato starch processing factories are generally small scale and discharge
a large volume of wastewater with high BOD and SS concentration. These factories are mostly
operated in the seasons between the end of summer and early winter. The typical wastewater
qualities of potato starch processing are shown in Table 3-6-2. The unit water consumption in
sweet potato starch processing is about half of potato starch processing, but the amount of
generated BOD is nearly equal. In Japan, sugar industries previously used sugarcane and beet
as raw materials, but sugarcane has faded out, and they now focus production on refining
imported crude sugar. Cane sugar production consumes 15~20 times the water per ton of raw
material and discharges high concentrations of BOD and SS, while water consumption as well
132
as the concentration of BOD and SS are low when using imported crude sugar. In beet sugar
processing, wastewater of 8~10 times the weight base of raw materials is discharged from the
flume-process in which beets are transported and washed in the flowing water, occupying
50~60% of the total wastewater. Other major sources of wastewater are the lime-cake process
for extracting sugar from the beets, the Steffen process for recovering sucrose from spent
molasses, and the ion exchange process which has lately replaced the Steffen process. Although
the wastewater volume ratio per unit of raw material varies in different factories, generally it is
about 1.3 times for the lime-cake wastewater, 30~40% for the Steffen wastewater, and 25~30%
for the ion exchanger wastewater 3. Wastewater qualities in beet sugar processing are shown
in Table 3-6-3.
Figure 3-6-1 Schematic flow of wheat starch manufacturing process and wastewater
Table 3-6-1 Wastewater qualities of wheat starch processing
Table 3-6-2 Wastewater volume and pollutants load of potato starch processing
(per ton of raw materials)
Flour Kneader Washing
machineWheat
gluten
Milky
starch
liquid
SieveWheat
bran
Centrifuge DryerWheat
starch
Floor,
equipment
washing
WastewaterWastewater
Items
pH
TS (mg/ )
DS (mg/ )
SS (mg/ )
CODcr (mg/ )
BOD (mg/ )
TOC (mg/ )
T-N (mg/ )
T-P (mg/ )
Aver.
4.4
12,800
10,140
2,600
9,400
-
Max. Min.
4,600
500
-
14,600
11,100
3,500
18,750
11,300
170
5.4
16,400
4,400
5,800
12,000
20,600
13,200
5,200
600 550
190 180
Wastewater volume (m3)
BOD (kg)
SS (kg)
- -
wastewaterTotal
Conventional Concentration Conventional Concentration
Separation-process Items
Flume-process
13~44
14~56
12~67
4.4~31
0.1~2.0
1.3~57
7~4
13~15
10~44
17~40
8~22
6.2~16
0.6~12

133
Table 3-6-3 Wastewater qualities of beat sugar processing
6.2 Example of Actual Treatment (wheat starch)1), 4)
A wastewater treatment plant in factories manufacturing wheat starch and wheat
gluten from flour is described here. Being introduced for the pre-treatment of the existing
activated sludge process, this plant has contributed to energy savings, reducing excess sludge
generation, and stabilizing operation of the activated sludge treatment plant.
1. Design Condition
Wastewater volume maximum 550 m3/d, average 500 m3/d
Wastewater qualities CODcr maximum 20,000 mg/ℓ, average 16,000 mg/ℓ
Effluent qualities CODcr removal rate: >80 %, effluent of anaerobic
treatment reactor
2. Process
The schematic flow diagram is shown in Figure 3-6-2. The raw wastewater flows from
the equalization tank, through the heat exchanger, to the anaerobic treatment reactor. The
anaerobic treatment reactor is filled inside by floating plastic media, and 7 pH and 36℃
temperature are maintained. The pH is adjusted by sodium hydroxide dosages. Heating is done
by steam. The gas generated in the anaerobic treatment reactor is desulfurized, stored in a gas
holder, and used for drying products. The effluent from the anaerobic treatment reactor is
treated by the activated sludge process and then discharged.
Figure 3-6-2 Schematic flow of wastewater treatment in wheat starch factory
WastewaterEqualization
tank
Heat
exchanger
Anaerobicreactor
Aeration
tank
Settling
tank
Treated
water
DesulufurizerGas
holderFuel gas
DehydratorDewatered
cake
Steam
NaOH
pH
BOD ( mg/?)
SS (mg/?)
TDS (mg/?)
process process
6.7~7.4
1,420
12.5
7,0003,313
200~630
2,860
4,000
700~3,090 1,300
Flume Lime -cake SteffenItems
process
-
-

134
3. Performance Results
Start-up of the anaerobic treatment reactor took 3 months due to the slow growth rate
of anaerobic microorganisms. Operating data in the start-up period is shown in Figure 3-6-3.
During this period, the loads were increased, monitoring the relation between CODcr load
input and methane gas volume generation output as well as organic acid concentrations in the
effluent. When the load-increase exceeds the growth rate of methanogenic microorganisms, low
fatty acids such as acetic acid and propionic acid start to increase. Therefore the load-increase
was controlled so that the fatty acid concentrations did not exceed several hundreds mg/ℓ. The
treatment results from the anaerobic process are shown in Table 3-6-4. The effluent qualities in
the activated sludge process are shown in Table 3-6-5.
Figure 3-6-3 Operating results at start-up-period in anaerobic treatment process
0
5000
10000
15000
(mg/
L)
20
40
60
80
100
(%)
0
2
4
6
(kg/
m3・d)
1984 1985
Year end andnew year holidays
After filtration
COD load
(Weekly average)
Wastewate
Before filtrationEffluent of anaerobic treatment
Flow rate
COD concentration
COD removal rate
Before filtration
After filtration
Gas generation
Week
Nov. Dec. Jan. Feb. Mar.Oct.
0
100
200
300
400
(m3 /
d)
0
500
1000
1500
2000
2500
3000
0 5 10 15 20 25
(Nm
3 /d)
Flow rate
Gas volume

135
Table 3-6-4 Anaerobic treatment result of wheat starch processing
Table 3-6-5 Effluent qualities in anaerobic treatment in wheat starch processing wastewater (as post activated sludge treatment)
6.3 Considerations in Operation and Maintenance(wheat starch)
Though the fixed bed anaerobic treatment reactor is very stable in operation, the
media interspace tends to be clogged by microorganisms, and periodic purging with nitrogen
gas from the bottom of the reactor is essential. In this operation, peeled anaerobic sludge flows
into the aeration tank, and the load on the treatment process increases temporally. Therefore
this purging operation is carried out once or twice a year, during the off-period in summer
and/or the end-of-the-year in winter. By introducing the anaerobic treatment for pre-treatment,
the bulking problems of the activated sludge process ceased, and sludge settlement in the
settling tank was improved, but nitrogen in the effluent increased. The nitrogen, however, was
easily reduced by making part of the aeration tank anaerobic or by intermittently stopping
aeration.
6.4 Example of Actual Treatment (potato starch)
Potato starch processing factories in Hokkaido operate seasonally from the end of
summer to early winter. The lagoon process is often adopted because operation start-up is easy,
tolerance for load fluctuations is high, and large areas are available in Hokkaido. A typical
example is introduced below.
1. Design Condition
Wastewater volume 3,600 m3/d
Wastewater qualities BOD 1,800 mg/ℓ
Items Apr Jun Aug Oct Dec Feb
Wastewater (m3/d) 386 359 343 395 400 424
Influent TOC (mg/ ) 4,860 5,063 5,350 4,602 5,495 5,382
Effluent (mg/ ) 2,252 1,785 1,874 1,650 2,029 2,135
pH 7.1 7.2 7 7 7.1 7.1
Generated gas (m3/d) 1,569 1,781 1,810 1,615 2,012 1,688
Methane conc. (%) 67 71 72 71 71 71
COD (mg/ ) 15~56
BOD (mg/ ) 22~46
pH 7.0~8.0
T-N (mg/ ) 40~70
T-P (mg/ ) 60~80

136
Effluent qualities pH 5.8~8.6
BOD <120 mg/ℓ
SS <150 mg/ℓ
2. Process
Wastewater from this starch factory is fed directly into the aeration tank (lagoon)
without using an equalization tank. The aeration tank is a pond built by excavating earth with
a holding capacity of 30,000 cubic meters. It is equipped with 5 surface floating aerator units of
37 kilowatts, and the detention period is about 8 days. The liquid in the aeration tank is
pumped to the settling tank through a flow control device, separated from the sludge, and then
discharged as treated water. As the effluent standards for SS is generous, detention time in the
settling tank is designed at 6 hours. Settled sludge is returned to the aeration tank similarly as
in a usual activated sludge process.
3. Performance Results
The operation results for the month of October in the year following the startup are
shown in Table 3-6-6. Part of the settled sludge at the bottom of the lagoon is drawn out to use
as fertilizer after the suspension of production in early winter, and the lagoon is usually left as it
is until startup the next year. The leftover sludge is used for restarting treatment. The average
influent BOD and SS at the peak operation in October are 85% and 80% of the design basis.
The effluent BOD is always lower than the design limit, although SS exceeds the design limit
temporarily due to the carryover of inactive sludge just after restarting. Even when
temperature in the aeration tank drops to zero deterioration of the effluent water quality is not
recognized, because BOD-MLSS load is designed at the low rate of 0.05 (kg BOD/ kg MLSS・d).
Table 3-6-6 Treatment result of potato starch processing wastewater
Aver. Max. Min. Aver.. Max. Min.
Wastewater (m3/d) 3,040 3,360 2,760 - - -
pH - 6.8 5.7 - 7.5 7
SS (mg/ ) 602 3,730 176 119 188 54
CODMn (mg/ ) 939 2,440 409 85 116 60
BOD (mg/ ) 1,440 2,230 873 68 91 42
Water temp. (℃) - 17 2 - 17 2
ItemsWastewater Treated water

137
6.5 Considerations in Operation and Maintenance (potato starch)
When septicity of the sludge proceeds due to suspension of activated sludge treatment
for a long time, sludge bulking caused by filamentous bacteria tends to occur. This is especially
true for potato starch, which contains about 100 mg/ℓ of sulfides that abnormally accelerate the
growth of filamentous sulfur bacteria. Due to the abnormal change of the microorganic phase, it
takes a long time to restore operations to the original state for restarting operation. The
following will prevent this problem. First, provide a minimum level of aeration to control the
progress of the sludge septicity. Then store thickened wastewater in the equalization tank and
intermittently feed it during suspended operation. When restarting, dose coagulant to
coagulate dispersing activated sludge floc so that a minimal concentration of MLSS is
maintained by preventing the carryover of floc, and transport sludge from a sewage treatment
plant if necessary. Furthermore, it is desirable to start aeration and nutrient dosages, such as
remaining wastewater or spent molasses, a few days before restarting treatment in order to
acclimatize the activated sludge. If a big load is applied to immature sludge at the initial stage,
SS carryover from the settling tank will be heavy. In a lagoon where wastewater is treated by
activated sludge, sludge is digested aerobically. The aerobic digestion leads to sludge dispersion
and deterioration of sludge settlability, which cause carry-over of SS from the settling tank. If
the carry-over of SS is serious, continuous dosing of coagulants to the center well in the settling
tank will effectively correct it.
REFFERENCES
1. Murayama, R. Wheat Starch, The Best Treatment of Food Processing Wastewater Handbook,
p 318 (Science Forum, 2002).
2. Kurokawa, Y. Water and Wastewater Handbook, p 784 (Maruzen, 1992).
3. Saiga, K. Water and Wastewater Handbook, p 760 (Maruzen, 1992).
4. Higashino, H. Shinko Pantec Technical Rep. Vol. 29, No. 2 (1985).
Chapter 7 Takeout Dishes
7.1 Wastewater Volume and Qualities
The size of daily dish processing factories varies in a wide range from relatively small
factories that prepare specific dishes to large ones that manufacture 400 products including
cakes, breads, and noodles. This chapter introduces a wastewater treatment plant at a large

138
factory that manufactures various products with only one day off at New Year’s Day every
year1). The water consumption per unit of raw material varies widely depending on products, so
data for each raw material is not obtainable. This factory, for example, uses raw materials of
9,800 tons of flour, 3,600 tons soybeans, and 137 tons alimentary yam paste powder to produce
6,842 tons of noodles, 5,900 tons loaf bread, 4,600 tons sweet bun, 2,700 tons alimentary yam
paste, 8,500 tons soy bean curd, and 1,400 tons fried bean curd. The factory uses 350,000 m3 of
water a year, discharging 80% as wastewater. Calculations based on the above-mentioned
figures lead to average unit figures of about 20 m3 per ton of raw materials and about 9m3
per ton of products, indicating that this is definitely a water-oriented industry. The production
processes of boiling beans, natto, and tamago-tofu (egg-bean curd), which discharge high
concentration wastewater, are shown in Figure 3-7-1, and those wastewater qualities are
shown in Table 3-7-1.
Figure 3-7-1 Schematic flow of large scale daily dishes processing and wastewater
Table 3-7-1 Wastewater qualities in each process in daily dishes processing factory (mg/ℓ)
High Middle Low Boiling Subme- Pot Subme Vacuum Cleaning
conc. conc. conc. rged washing rged pot
BOD 6,260 486 82 814 100 117 2,370 358,000 2,220
TOC 3,340 272 29 572 96 90 1,360 222,000 1,470
S-TOC 1,450 175 22 499 93 102 1,290 196,000 780
SS 2,720 143 212 195 5 73 78 675 63
N-hexane extract 4,780 689 <5 <5 <2 <5 <5 6 <5
T-N 438 38 2 84 8 41 52 799 13
T-P 22 4 1 8 1 10 20 152 4
Boiling beans
Items
Tamago-tofu Natto
Soy
beans
Egg
Essence
Others
Dipping
tankPressure
boiling tank
Mixing
&
kneading
Vacuum
desecrator
Seasoning
tank
Filler
Seeding
Steamer Refrigerator PackerBoiled
beans
Fermenter
Heater Packer
Natto
Tamago
tofu
Wastewater
Dipping
tank
Pressure
boiling tankPacker Refrigerator
Floor, equipments washing
Refrigerator
Wastewater
Wastewater
Floor, equipments washing
Floor, equipments washing
139
7.2 Example of Actual Treatment
1. Design Condition
Wastewater volume 1,600 m3/d (high concentration wastewater: 1,505 m3/d, low
concentration wastewater: 650 m3/d)
high concentration low concentration
wastewater wastewater
Wastewater qualities pH 4.3 6.3
BOD (mg/ℓ) 2,310 760
SS (mg/ℓ) 550 130
n-hexane extract (mg/ℓ) 110 50
Effluent qualities pH 5~9
BOD <200 mg/ℓ
SS <200 mg/ℓ
n-hexane extract < 30 mg/ℓ
2. Process
As this factory is located in an area where a sewerage system is available, wastewater
is collected and treated separately according to high and low concentrations, before being
discharged to the sewer, as shown in Figure 3-7-2. The low concentration wastewater is
screened of floating large solids, treated through coagulation dissolved flotation process,
neutralized, and then discharged. The high concentration wastewater is also screened of
floating large solids and goes through the equalization tank and heat exchanger to the
anaerobic treatment reactor. The anaerobic treatment reactor is equipped with floating plastic
media inside and kept at 7 pH and about 36 ℃. The pH is adjusted by sodium hydroxide.
Heating is provided by steam. Methane gas generated in the anaerobic treatment reactor is
desulfurized, stored in a gas holder, and used for drying products. The effluent from the
anaerobic treatment reactor is treated by the aerobic biological treatment plant with floating
media. At the next step, in order to remove SS peeled off from the media surfaces and SS in
influent raw wastewater, the effluent is coagulated by ferric chloride and polyelectrolyte,
treated in a DAF unit and, after pH adjustment, discharged into the sewer.

140
Figure 3-7-2 Schematic flow of wastewater treatment in daily dishes processing
(discharge to sewer)
3. Performance Results
The raw wastewater quality data, averaged for every half month throughout a year,
are shown in Figures 3-7-3 and 3-7-4 for the high and low concentration wastewater. The
seasonal changes of quality, designated as the ratio of maximum to minimum, are 2 times for
BOD and 3 times for SS, concerning both high and low concentration wastewater. Figure 3-7-5
shows the performance of the high concentration treatment system incorporated with advanced
treatment process, indicated by one year’s average of BOD through the sequential steps. As
seen in the figure, 1,860 mg/ℓ in raw water is reduced to a stable 650 mg/ℓ by anaerobic
treatment, then to 250 mg/ℓ by latter bio-film aerobic treatment, and finally to 6 mg/ℓ by
coagulation-floatation. This effluent is mixed with treated water of low concentration
wastewater and discharged into the sewer. The quality is shown in Figure 3-7-6.
Figure 3-7-3 Yearly variations of wastewater in takeout dishes factory
(high concentration stream)
DAF: Dissolved air floatation unit
Low concentrationwastewater
High concentrationwastewater
Methanegas
Treatedwater
Dewateredcake
Desulfurizer
Aerobicbiologicaltreatment
Gasholder
DAF
Heatexchanger
Neutralizationtank
Anaerobictreatmentreactor
ScreenCoagulation-
settlingtank
Equalizationtank
DAF
Flow-ratemeasuring
tank
Dehydrator
Screen
Equalizationtank
Month
0
500
1000
1500
2000
2500
3000
3500
4 6 8 10 12 14 16
pH
Conc
entr
atio
n (m
g/)
BOD SS N-hexane pH
2
7
6
5
4
3
2
1
0

141
Figure 3-7-4 Yearly variations of wastewater in takeout dishes factory
Figure 3-7-5 Treatment result of high concentration wastewater
Figure 3-7-6 Wastewater treatment result in takeout dishes factory
Month
0
50
100
150
200
250
4 6 8 10 12 14 16
pH
Conc
entr
atio
n (m
g/L)
BOD SS N-hexane pH
2
10
8
6
4
2
0
0
500
1000
1500
2000
Raw wastewater Effluent ofanaerobictreatment
Effluent ofaerobic
treatment
Effluent ofcoagulation-
settling
BO
D(m
g/)
Month
0
500
1000
1500
2000
2500
3000
3500
4 6 8 10 12 14 16
pH
Concentr
atio
n (
mg/
)
BOD SS N-hexane pH
2
7
6
5
4
3
2
1
0
142
7.3 Considerations in Operation and Maintenance
Detergents and disinfectants are used for cleaning equipment in food processing
factories. If these chemicals are overused due to mistakes or leaks, it causes abnormal
foaming in the anaerobic and aerobic treatment plants. As disinfectant leakage temporally
decreases biological activity of the anaerobic and aerobic treatment plants and deteriorates the
effluent quality, serious attention must be paid to such leakage. As the deposited solids at the
bottoms of tanks go rotten and emit offensive smells, periodical cleaning of the wastewater pits,
equalization tank, DAF, and other items are desirable.
REFFERENCES
1. Soejima T. Daily Dishes, The Best Treatment of Food Processing Wastewater Handbook, p
318 (Science Forum, 2002).
Chapter 8 Confectionaries 8.1 Wastewater Volume and Qualities
The wastewater properties in confectionary factories vary widely depending on the
products and are also influenced by seasonally changing demands. This chapter introduces
wastewater treatment processes for jellied fruit and sponge cake (Castella) factories1). Jellied
fruit is jelly with pieces of fruit such as loquats, oranges, and peaches inside. To make it, liquid
sugar, syrup, flavor, and pigment are blended, and the mixture is filled into cups filled with
pieces of fresh fruit. The main streams of wastewater are from washing the equipment, syrup
spilling from opened cans, and overflows of blended liquor from sealing machines. Figure 3-8-1
shows the production process of jellied fruit and the wastewater sources. Sponge cake (Castella)
is made in a way that raw materials of egg, sugar, flour, and other ingredients are blended and
baked in a baker. Then, the baked cake is packed in a wooden box. The Castella production
process is in Figure 3-8-2. The main streams of wastewater are from washing the egg-crusher,
blender, filler, and wooden box.
8.2 Example of Actual Treatment
1. Design Condition
Wastewater volume 160 m3/d
Wastewater qualities BOD 4,000 mg/ℓ

143
CODMn 2,500 mg/ℓ
Effluent qualities BOD 10 mg/ℓ (daily average)
CODMn 20 mg/ℓ (daily average)
Figure 3-8-1 Schematic flow of Jerried fruit processing and wastewater
Figure 3-8-2 Schematic flow of Castella processing and wastewater
2. Process
As this factory is located in an area where the effluent standards are strict, the
wastewater is treated in two stages, which are a conventional activated sludge process and an
aerobic biofilm process. A coagulation-sedimentation tank is provided to cope with emergency
cases involving effluent quality deterioration. The schematic flow diagram is shown in Figure
3-8-3. The influent wastewater is adjusted to equalize the flow rate in the equalization tank
and dosed with nitrogen and phosphorus to cover shortage. Then, it is fed into the aeration tank
and separates the sludge in the settling tank. After further removal of BOD and CODMn in the
contact stabilization tank, the wastewater goes through the coagulation-sedimentation tank for
emergencies, and it finally flows out after chlorination. To prevent sludge bulking, a 10 stage
plug-flow is provided for the aeration tank. Excess sludge is thickened in the thickener, stored
in the sludge storage tank, periodically dewatered by a mobile dehydrator on a truck, and then
carried out.
Raw
materials
Fruit cans
Mixer Filler
Can
opening
SealerSterilization
RefrigeratorJerried fruit
Wastewater
Raw
materials Mixer FillerCalcination
furnace
Sizing &
packingCastella
WastewaterEgg

144
Figure 3-8-3 Schematic flow of confectionary factory wastewater treatment
3. Performance Results
This wastewater has major seasonal fluctuations in volume and concentration.
Although BOD in the outflow of the equalization tank fluctuates from 2,000 to 4,500 mg/ℓ, BOD
5~30 mg/ℓ and CODMn 20~40 mg/ℓ are maintained in the effluent from the settling tank.
There have not been any emergencies using the coagulation-sedimentation tank. The nutrient
balance in the wastewater is BOD: N: P=100: 0.4: 0.1 for the jellied fruit factory and BOD: N:
P=100: 0.2: 0.1 for the Castella (sponge cake) factory. As these figures show, nitrogen and
phosphorus are short in both cases. Instead of using chemical compounds, however, treated
water from the septic tank for domestic sewage in the factory is mixed into the wastewater, as it
contains both nitrogen and phosphorous. In addition, saving operation costs and preventing
eutrophication have been achieved by managing the dosages of nitrogen and phosphorous
based on the data of relations between the BOD-sludge converted ratio and the nutrient
requirements. For instance, if the BOD-sludge conversion rate decreases below 0.2 in normal
operation, no nutrients are dosed.
8.3 Considerations in Operation and Maintenance
Viscous sludge bulking generally tends to occur in wastewater containing much
saccharide, due to the accumulation of polysaccharide, and it makes separating the sludge
difficult in the settling tank. Measures to prevent bulking in the aerobic treatment of
wastewater from factories making cake, bread, fruit juice, and other products are conceivable in
Wastewater Equalization
tank
Aeration
tank
Settling
tank
Contact
stabilizationtank
Rapid
mixing
tank
Slowmixing
tank
NaOH
PAC
Polyelectrolytes
Coagulation-
settling
tank
Chlorination
tank
Treated
water
Sludge
storage
tank
Sludge
thickening
tank
Mobile
sludge
dehydrator
Dewatered
cakeN, P
NaOH

145
relation to two aspects. The first aspect related to the equipment is introducing the plug-flow to
the aeration tank which causes the gradient of BOD concentration and also introducing a
batch-wise activated sludge process involving partial anaerobic process. The second aspect
related to the operation is adjusting the MLSS concentration to maintain an appropriate
BOD-MLSS load (0.2~0.4 kg BOD/kg MLSS・d) to delay the growth rate of bulking-exciting
filamentous microorganisms and to adjust the DO concentration in the aeration tank within an
appropriate range. Actually, in this plant, bulking has been successfully prevented since it
adopted plug flow and tapered aeration for keeping a determined level of DO concentration at
each stage in the aeration tank. In the aerobic biofilm process in the second stage,
bulking-exciting filamentous microorganisms are attached, held by the media, and prevented
from flowing out to the settling tank. It is also considered effective.
REFFERENCES
1. Ohnishi M. Confectionary, The Best Treatment of Food Processing Wastewater
Handbook, p 351 (Science Forum, 2002).